Article

Evaluating the Performance of Winter Wheat Under Late Sowing Using UAV Multispectral Data

1
Jiangsu Key Laboratory of Crop Genetics and Physiology/Jiangsu Key Laboratory of Crop Cultivation and Physiology, Agricultural College of Yangzhou University, Yangzhou 225009, China
2
Jiangsu Co-Innovation Center for Modern Production Technology of Grain Crops, Yangzhou University, Yangzhou 225009, China
3
Lixiahe Institute of Agricultural Sciences of Jiangsu/Key Laboratory of Wheat Biology and Genetic Improvement for Low & Middle Yangtze Valley, Ministry of Agriculture and Rural Affairs, Yangzhou 225012, China
4
Key Laboratory of Agricultural Blockchain Application, Ministry of Agriculture and Rural Affairs, Agricultural Information Institute, Chinese Academy of Agricultural Sciences, Beijing 100081, China
5
Precision Agriculture Lab, School of Life Sciences, Technical University of Munich, 85354 Freising, Germany
6
UAV Research Center, Department of Plants and Crops, Ghent University, 9000 Ghent, Belgium
*
Authors to whom correspondence should be addressed.
These authors contributed equally to this work.
Agronomy 2025, 15(10), 2384; https://doi.org/10.3390/agronomy15102384
Submission received: 8 September 2025 / Revised: 5 October 2025 / Accepted: 11 October 2025 / Published: 13 October 2025
(This article belongs to the Special Issue Digital Twins in Precision Agriculture)

Abstract

In the lower and middle sections of the Yangtze River Basin Region (YRBR) in China, challenges posed by climate change and delayed harvesting of preceding crops have hindered the timely sowing of wheat, leading to an increasing prevalence of late-sown wheat fields. This trend has emerged as a significant impediment to achieving high and stable production of wheat in this area. During the growing seasons of 2022–2023 and 2023–2024, an unmanned aerial vehicle (UAV)-based multispectral camera was used to monitor different wheat materials at various growth stages under normal sowing treatment (M1) and late sowing with increased plant density (M2). By assessing yield loss, the wheat tolerance to late sowing was quantified and categorized. The correlation between the differential vegetation indices (D-VIs) and late sowing resistance was examined. The findings revealed that the J2-Logistic model demonstrated optimal classification performance. The precision values of stable type, intermediate type, and sensitive type were 0.92, 0.61, and 1.00, respectively. The recall values were 0.61, 0.92, and 1.00. The mean average precision (mAP) of the model was 0.92. This study proposes a high-throughput and low-cost evaluation method for wheat tolerance to late sowing, which can provide a rapid predictive tool for screening suitable varieties for late sowing and facilitating late-sown wheat breeding.

1. Introduction

In recent years, global warming, changing precipitation patterns, and extreme weather have posed serious threats to global agricultural production [1,2,3]. The YRBR is a main wheat-producing area in China. The rice–wheat rotation is the primary crop cultivation mode in this region. The planting area of wheat accounts for 24.34% of the total grain planting area [4,5]. However, the gradual increase in autumn rainfall in YRBR, attributed to climate change, delayed rice harvesting and subsequent wheat sowing [6]. On the one hand, the delayed sowing date of wheat limited the utilization of light and temperature resources and reduced the yield [7,8]; on the other hand, delayed flowering and higher temperature stress during grain filling were the main factors restricting wheat quality [9]. Late sowing has become a significant factor influencing the high and stable yield of winter wheat in this area, and the selection of germplasm and precise management of late sowing characteristics have also emerged as important directions in winter wheat breeding and cultivation research.
Increasing the sowing rate is a crucial means of enhancing the yield of late-sown wheat [10]. Some research showed that the decrease in wheat yield after a delayed sowing date was related to the inhibition of early growth and the shortening of the vegetative growth period, which resulted in the reduction of tillering ability, leaf area index, and panicle number [11,12]. The increase in the seeding rate could compensate for the decrease in germination percentage and tillering ability, thus increasing the leaf area index, biomass, and fertile panicle number of the population [13,14]. However, increasing the seeding rate has limited compensation for sowing delay, and the compensation effect decreases with further sowing delay [13,15]. To ensure a high and stable yield under late-sowing conditions, selecting wheat varieties suitable for late sowing may be the most effective strategy to mitigate the risks associated with the late sowing of wheat. Most existing studies have focused on the performance of specific phenotypic traits under late sowing, such as plant height, number of ears, 1000-grain weight, and number of tillers. Plant height reflects the plant stress caused by elevated temperatures during the growing season, while the other traits are yield components that are also likely to be affected due to higher temperatures under delayed sowing conditions. Although numerous studies have been conducted on wheat stress tolerance, including extensive research on heat tolerance, relatively few have specifically addressed how to evaluate late sown tolerance and how to rapidly screen wheat varieties adapted to delayed sowing.
Remote sensing data has emerged as a valuable tool for decision-making in agriculture due to its strong correlation with grain yields. UAV data, also referred to as ground truth in remote sensing, enables the acquisition of near-real-time measurements [16,17]. Utilizing multispectral imaging technology through UAV platforms allows for cost-effective high-throughput phenotyping in the field, facilitating the rapid and efficient evaluation of crop resistance and the screening of numerous varieties. Currently, UAV remote sensing is employed in assessing various aspects of crop resistance, such as cold tolerance in wheat [18], resistance to scab [19,20], salt tolerance in rice [21], rice blast resistance [22], late blight severity in potatoes [23], identification of pathogens and diseases in broccoli crops [24], as well as screening wheat varieties for drought tolerance, fungal resistance, and powdery mildew resistance [25,26,27]. Moreover, UAV remote sensing has been instrumental in selecting maize varieties resistant to corn stripe disease [17,28], as well as in evaluating resistance in strawberries [29] and other crops [30,31].
Despite significant advancements in UAV remote sensing for assessing crop resistance, late-sowing wheat exhibits a healthy plant state that differs from most stresses. Its tissue structure, physiological activity, and visible characteristics remain intact, posing challenges for monitoring and evaluating late-sowing tolerance compared to other stresses. Traditional agronomic index-based evaluation methods are inefficient, labor-intensive, and inadequate for the high-throughput demands of modern breeding. Therefore, this study aimed to develop a rapid evaluation method for assessing tolerance to late sowing under the increased planting density condition using multispectral UAV technology. The specific objectives included the following: (1) to investigate the variation characteristics of the differential vegetation indices (D-VIs) across different plant phenology under late sowing with increased plant density; (2) to identify suitable D-VIs for evaluating wheat late-sowing tolerance; (3) to develop classification models using multiple machine learning algorithms, including logistic regression, random forest, support vector machine, etc.; and (4) to propose a swift evaluation approach for wheat late-sowing tolerance utilizing multispectral UAV technology.

2. Materials and Methods

2.1. Field Experiments

This study was conducted at the Wantou experimental base (Figure 1) of the Institute of Lixiahe Institute of Agricultural Sciences of Jiangsu from 2022 to 2024. This area is situated in a subtropical monsoon climate zone, characterized by a mean temperature of 13.2–16.0 °C, an accumulated temperature above 0 °C of 2000–2200 °C, and an annual sunshine duration of 2000–2600 h. The region typically experiences a frost-free period of 220–240 days and receives 800–1200 mm of precipitation annually, with rainfall and thermal conditions occurring predominantly in the same season. Winter wheat is optimally sown between 25 October and 5 November. Two planting treatments, M1 and M2, were set up. In the first growing season, 26 wheat materials were cultivated, with five rows planted per variety. Each row measured 1.2 m in length. The seeds were sown on 28 October at a density of 180 × 104 plants ha−1 (M1) and on 22 November at a density of 300 × 104 plants ha−1 (M2). Subsequently, from 2023 to 2024, 161 wheat materials were used for plot experiments, with each plot measuring 6.67 m2 and two replications for each treatment. The seeds were sown on 29 October at a density of 180 × 104 plants ha−1 and on 16 November at a density of 300 × 104 plants ha−1 (M2). During two growing seasons, nitrogen was applied at a rate of 240 kg ha−1. Nitrogen fertilizer was applied in a split of 5:1:4 at stages of pre-sowing, four-leaf, and jointing.
Wheat was harvested and threshed using a plot combine at the maturity stage. The harvested grains were subsequently dried to a consistent weight and then weighed to determine the final yield (kg ha−1). A total of 124 wheat samples were collected over a two-year period, comprising 26 samples in the first year and 98 samples in the second year.

2.2. Quantification of the Tolerance to Late Sowing in Wheat

Yield change under late sowing is crucial for assessing a variety’s tolerance to delayed sowing. Wheat varieties with high tolerance to late sowing can achieve yields comparable to those of timely sowing. Based on preliminary experimental results, when the sowing date was delayed by approximately half a month, wheat yield at a planting density of M2 showed a decrease compared to M1. Hence, this research employed the yield loss (YL) to describe different tolerance levels to late sowing. Using K-means to classify the YL of all harvested samples (Table S2), a total of three tolerance levels were identified: stable type, intermediate type, and sensitive type. The YL’s specific classification criteria were (1) stable type: YL ≤ 5%, (2) intermediate type: 5% ≤ YL ≤ 10%, (3) sensitive type: YL > 10%. YL was calculated as follows:
Y L = Y M 1 Y M 2 Y M 1 × 100 %
where YL is the yield loss in %; YM1 and YM2 are the yields of the same wheat material harvested under M1 and M2, respectively, in kg ha−1.

2.3. Multispectral Data Acquisition

The multispectral orthographic images (Figure 2) were obtained by the DJI Mavic3 Multispectral (DJI, Shenzhen, China) across eight growth stages: Feekes growth stage 1 (E), Feekes growth stages 2–3 (W), Feekes growth stage 6 (J1), Feekes growth stage 8 (J2), Feekes growth stage 10.3 (H), Feekes growth stage 10.5.1 (F), Feekes growth stage 10.5.4 (G), and Feekes growth stage 11.4 (M). The drone was equipped with a 4/3 CMOS sensor for RGB images and four 1/2.8 inch CMOS monochrome sensors for multispectral images, each with 5 million effective pixels: green (G): 560 nm ± 16 nm, red (R): 650 nm ± 16 nm, red edge (RE): 730 nm ± 16 nm, and near-infrared (NIR): 860 nm ± 26 nm. Missions were conducted in clear, cloudless weather between 10:00 a.m. and 2:00 p.m. At the same time, three reflectance boards with predetermined reflectance values (25%, 50%, and 75%) were manually used to ensure radiometric correction. DJI Terra 5.0.1 (DJI, Shenzhen, China) was utilized for image stitching and multispectral preprocessing.

2.4. Feature Selection

To investigate the remote sensing differences between late-sown and normal-sown wheat populations while minimizing varietal influences, this study used the differential vegetation indices (D-VIs) as remote sensing features. In total, differences were calculated for 41 vegetation indices, and the formulas for all vegetation indices can be viewed in the attached Table S1. The random forest algorithm was employed to assess feature importance and select the features for model training and validation based on their contribution. The D-VI was calculated as follows:
D - V I = V I M 2 V I M 1
where D-VI is the difference in vegetation index, VIM2 is the canopy vegetation index value of wheat under M2, and VIM1 is the vegetation index value under M1.

2.5. Modeling and Validation

This study employed a suite of machine learning algorithms, including logistic regression (Logistic), support vector machines (SVMs), decision trees (DTs), random forests (RFs), and XGBoost, to construct classification models for assessing the tolerance to late sowing in wheat. By comparing the classification accuracy of each model at different growth stages and the performance differences between models at the same stage, the most appropriate combination of growth stage and model was identified. The dataset comprised observations from 124 wheat samples harvested over two years, with 70% of the data used for model training and the remaining 30% reserved for validation.

2.6. Evaluation Indices

The classification accuracy for each late-sowing resistance type was assessed using precision, recall, F1-score, and the confusion matrix. Overall model accuracy was evaluated using accuracy, mean average precision (mAP), and macro-average. The specific formulas for these evaluation metrics were as follows:
P r e c i s i o n i = T P i T P i + F P i
R e c a l l i = T P i T P i + F N i
F 1 s c o r e i = 2 × P r e c i s i o n i × R e c a l l i P r e c i s i o n i + R e c a l l i
A c c u r a c y = i = 1 n T P i i = 1 n T P i + i = 1 n T N i
M a c r o   P r e c i s i o n = 1 n i = 1 n P r e c i s i o n i
M a c r o   R e c a l l = 1 n i = 1 n R e c a l l i
M a c r o   F 1 S c o r e = 1 n i = 1 n F 1 S c o r e i
in which n is the total number of categories, P r e c i s i o n i is the precision value for class i, R e c a l l i is the recall value for class i, and F 1 s c o r e i is the F1-score value for class i. T P i is the number of samples in class i that are correctly predicted as class i, F P i is the number of samples in other classes that are predicted as class i, and F N i is the number of samples in class i that are predicted to be other classes.

3. Results

3.1. Remote Sensing Characteristics of Late-Sown Wheat

To investigate the temporal behavior of vegetation indices, the dynamic changes of 41 D-VIs were analyzed across eight growth stages. Further analyses were performed to examine whether these D-VIs could distinguish wheat varieties with different tolerance levels to late sowing and explore their relationship with yield loss. To preserve the directionality of changes and facilitate comparison among indices, all D-VIs were standardized using z-score normalization. As shown in Figure 3a, most D-VIs exhibited z-scores across several growth stages, suggesting that late-sown wheat generally displayed lower canopy spectral values than normally sown wheat. However, certain indices demonstrated significant fluctuations, particularly during the E and W stages. The most responsive indices are shown in Figure 3b. Notably, indices such as D-NAVI and D-MTCI exhibited pronounced negative deviations from the E stage to W stage, with values dropping to −2 × 10⁻¹⁵. This indicates that in the W stage, late sowing resulted in an obvious decrease in the chlorophyll content of the canopy. In contrast, indices like D-CRI and D-NDRE showed slight positive deviations in the G and M stages, suggesting potential compensatory growth in some varieties under late sowing conditions.
These observations reveal distinct temporal characteristics of D-VIs, showing that early stages are critical for identifying the sensitive type, whereas the later stages may capture compensatory responses in the stable type.
In order to discover the potential of D-VIs in distinguishing wheat varieties with different tolerance levels to late sowing, this research conducted an intergroup difference analysis of three types at eight growth stages. In this study, we analyzed the differences in 41 D-VIs among three types with different levels of resistance to late sowing at eight growth stages, and the results obtained are shown in Figure S1. The findings (Figure 4) indicate no significant D-VIs between L1 and L3 or between L2 and L3, except for D-CVI, D-GRVI, and D-Sr at the F stage. At the E, W, and J1 stages, almost all D-VIs between L1 and L3 and between L2 and L3 exhibited highly significant differences (p < 0.001). In contrast, L1 and L2 showed significant differences primarily in the late growth stages, particularly during the G stage, in indices such as D-CIgreen, D-GNDVI, D-LCI, D-MSR, D-MTCI, D-NAVI, D-NDREI, D-NDVI, D-NGI, D-REMSR, D-RESR, D-RVI, D-Sr, D-WDRVI, and D-tcari/osavi. Hence, the H, G, and M stages have the potential to distinguish wheat with different tolerance levels to late sowing.

3.2. Results of Feature Selection

The random forest algorithm was employed to screen features across eight growth stages, with each stage’s feature set comprising attributes exhibiting importance values exceeding 0.03 (Table 1). As evidenced in the table, indices D-CVI, D-MCARI, D-NAVI, D-NDREI, and D-Sr were consistently selected across multiple growth stages and demonstrated highly significant differences between L1 and L2 levels, suggesting that these indices likely represent the primary features for distinguishing wheat varieties with different tolerance levels to late sowing.

3.3. Results of Modeling

The overall classification accuracy of the models is presented in Figure 5. Overall, the logistic and RF models had high model accuracy for multiple growth stages. The F stage was not suitable for classification due to having the lowest classification accuracy. Specifically, the SVM model achieved an accuracy of 0.65, aligning with the feature difference analysis results for this period. In Section 3.1, significant differences in D-VIs were observed among different resistance populations during the G and M stages. The model’s average accuracy in the G stage surpassed that in the M stage by 30.08%, with logistic and SVM models reaching a peak accuracy of 0.76. In other stages, models utilizing jointing stage data also demonstrated high accuracy, with the average accuracy of J1 and J2 models exceeding 0.70. Notably, the accuracy of logistic, SVM, and DT models reached 0.78 in the J2 stage. The accuracy values for the E, W, and H stages were comparable, averaging around 0.66. The lowest accuracy, 0.54, was observed with the XGBoost model in the H stage, while the highest accuracy, 0.73, was achieved by the RF model in the E stage and the logistic model in the H stage.
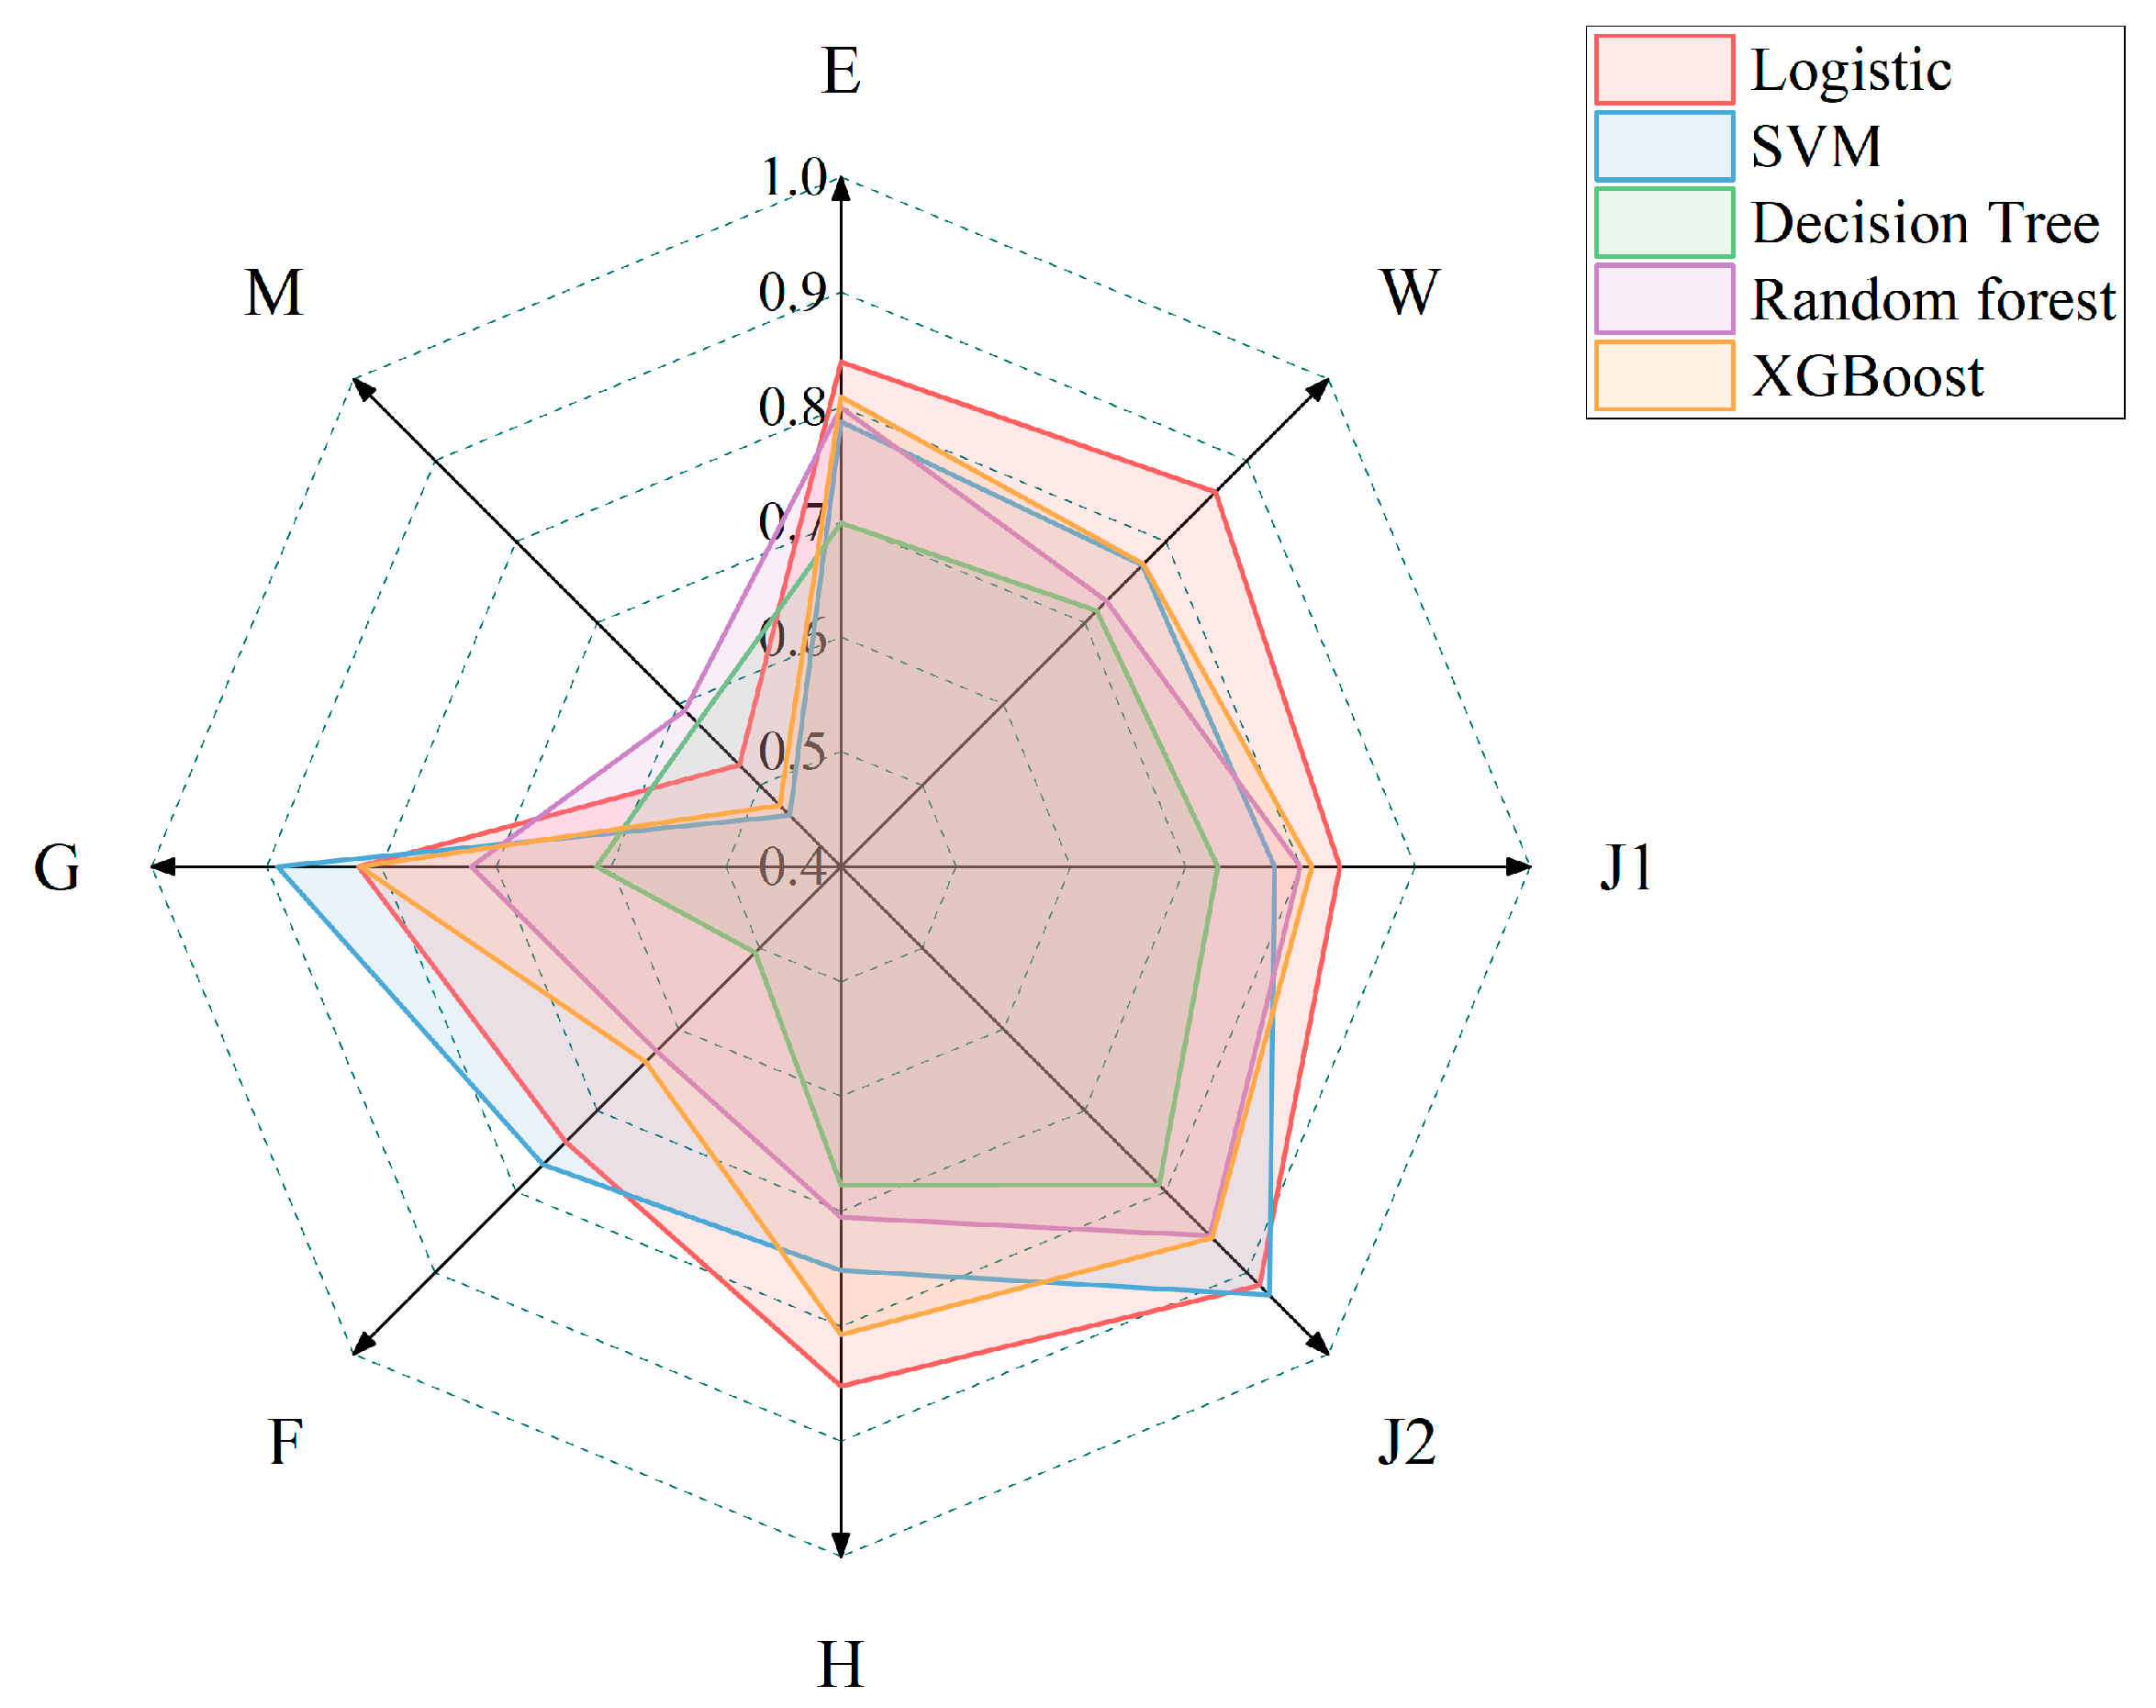
Given the potential impact of the sample size of three late-sowing resistance wheat varieties on the accuracy of the results (Figure 5), mAP was used to assess model performance comprehensively; all the models’ results are shown in Figure 6. The mAP results indicate that during the J2 and G, models had superior performance. At the J2 stage, the SVM model demonstrated the highest performance, achieving a mAP of 0.93, while the logistic model reached 0.92, and both RF and XGBoost attained 0.85. In the G stage, all models except DT and RF had mAP values exceeding 0.80. Among the five classification models, DT consistently underperformed across all stages, whereas the logistic model exhibited the best performance, with an average mAP across eight growth stages exceeding that of DT by 20.34%. Despite a minimum mAP of 0.53 during the M stage, the logistic model’s performance remained close to the average level of the five models for this period.

3.4. Classification Results of Wheat Levels with Different Tolerance Levels to Late Sowing

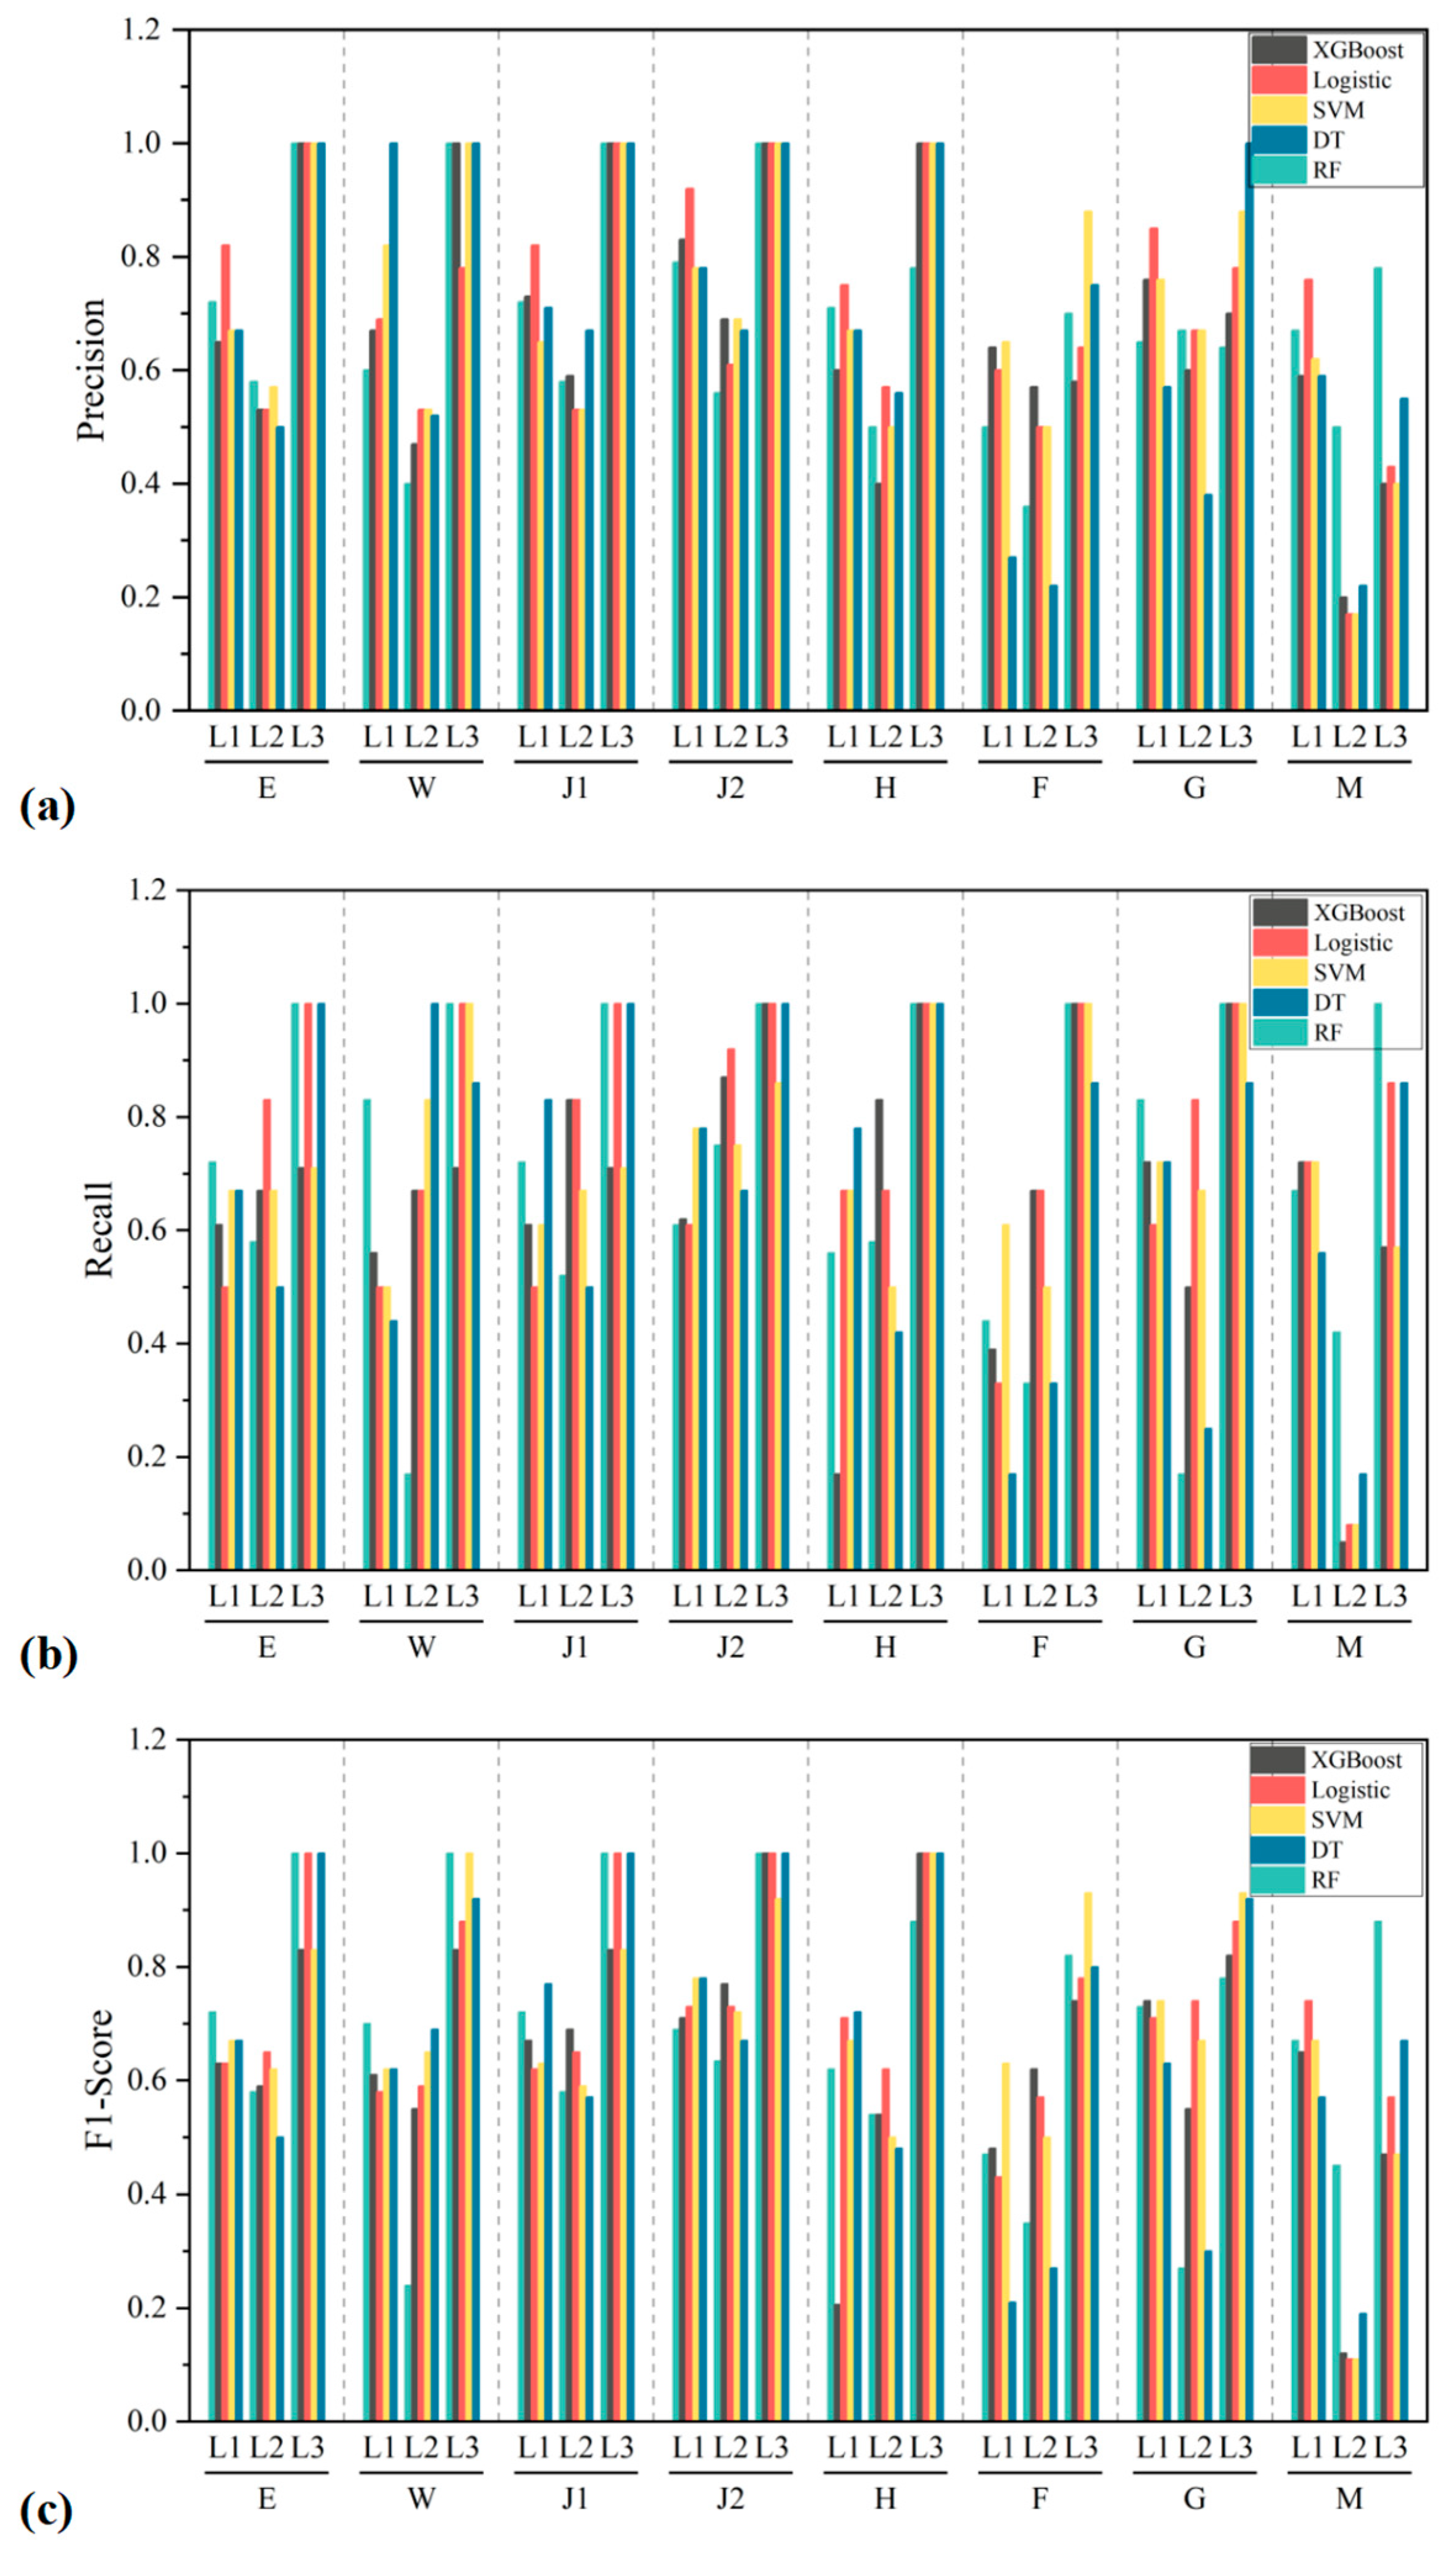
To assess the performance of models in identifying late sowing tolerance levels, five models were analyzed using precision, recall, and F1-score metrics. As shown in Figure 7, these models achieved the highest classification accuracy for sensitive type, particularly during the J2 and H stages, with mean precision, recall, and F1-score values of 1.00, 0.97, and 0.98, and 0.96, 1.00, and 0.98, respectively. In contrast, distinguishing the stable type from the intermediate type varied significantly across models and growth stages. Notably, the intermediate type’s result was better than the stable type, except during the G and M stages. The J2 stage emerged as optimal, where the logistic model achieved a recall of 0.92 for the intermediate type, compared to 0.61 for the stable type, with a precision of 0.92, indicating the model’s strong reliability despite its moderate ability to differentiate the stable type wheat. The highest recall for the five models on the stable wheat type was 0.83, with corresponding precision values of 0.71 for the DT model at the J1 stage and 0.65 for the RF model at the G stage. When comparing these models on the intermediate type wheat, recall values were 0.50 and 0.17, both with a precision of 0.67. These models exhibited differing abilities to distinguish these two types, and the reliability of their results was limited. Evaluating precision and recall together, the models’ performance averaged best for the three wheat types at the J2 stage, with F1-scores of 0.74, 0.70, and 0.98, respectively. The SVM and DT models performed well on the stable wheat type, achieving an F1-score of 0.78, while the XGBoost model showed the best results on intermediate wheat, with an F1-score of 0.77. The logistic model achieved an F1-score of 1.00 on sensitive wheat, with scores only 6.41% and 5.19% lower than the optimal model for the stable and intermediate types, respectively.
Further comparison of logistic, SVM, and DT models during the J2 period was carried out. The confusion matrix for model validation (Figure 8) revealed that the sensitive wheat was most accurately identified, with only one sample misclassified as the stable type by the SVM model. For the stable and intermediate types, their similar remote sensing characteristics increased the likelihood of misclassification. Both SVM and DT models demonstrated equivalent proficiency in identifying the stable type, slightly outperforming the logistic model. However, the logistic model excelled in identifying the intermediate wheat, with only one instance misclassified as stable. According to the macro-average metrics, the logistic model achieved scores of 0.84 for macro precision and macro recall and 0.82 for macro F1-score, surpassing the SVM model by 2.44%, 6.33%, and 1.23% and the DT model by 3.70%, 3.70%, and 1.23%, respectively. Thus, the logistic model is recommended for evaluating wheat tolerance to late sowing in M2 at the J2 stage based on its comprehensive performance.

3.5. Feature Contribution Ranking for the Best Model

Shapley value analysis was employed to evaluate the contribution of each remote sensing feature to the model’s predictions, thereby determining the importance of the individual features [32]. The above results indicate that the logistic J2 model achieved the best classification performance. The contributions of the 18 D-VIs, including D-MCARI, D-Sr, D-mcari/osavi, D-TCARI, etc., were analyzed, and the results are presented in Figure 9a,c. The contributions of different features to the discrimination of three wheat types varied. Generally, contributions to the discrimination of stable and intermediate types were relatively large. Among the features, D-MCARI demonstrated the most considerable contribution. Further depiction of the influence of different characteristics on the discrimination of each wheat type is shown in Figure 9b. The results indicate that D-MCARI, D-SCCCI, D-TCARI, and D-mcari/osavi were the primary contributors to the classification of the stable type. For the intermediate type, D-MCARI, D-mcari/osavi, D-Sr, and D-SCCCI were the primary discriminating features. D-TCARI, D-NGI, and D-NDREI had the greatest influence on the identification of the sensitive type.

3.6. Rapid Identification of Late Sowing Tolerance

We used the logistic J2 model to assess the late sowing tolerance in 161 wheat materials planted in 2023, with the results depicted in Figure 10. The figure on the left shows the prediction results of the wheat materials belonging to the validation set. There were a total of 30 materials, and 73.33% of them were successfully classified. Among the eight materials that were misclassified, four were L2 mistakenly classified as L1 and three were L1 mistakenly classified as L2. Figure 10b shows the classification results of all the materials. In total, 37.27% of the wheat materials exhibited a stable type, 55.90% displayed intermediate resistance, and 6.83% were categorized as sensitive to late sowing.

4. Discussion

This study introduced a rapid evaluation method for assessing the tolerance of wheat to late sowing using UAV multispectral data. It identified the optimal growth period, remote sensing characteristics, and classification model for this rapid evaluation. Late-sown wheat is more susceptible to unfavorable conditions, such as low temperatures and reduced solar radiation, during the early stage, resulting in delayed seedling emergence, a shorter fertility period, and increased susceptibility to “terminal heat” [13]. Although the present study achieved the classification and evaluation of late sowing resistance in wheat, further studies are needed to characterize the population structure and physiological characteristics of different resistance types of wheat, as well as the correlation between canopy remote sensing characteristics and agronomic indexes.

4.1. Difference in Growth Stages

Section 3.1 examined the remote sensing characteristics of three wheat populations with varying late sowing tolerance levels across different growth stages. The sensitive type exhibited the poorest tolerance to late sowing, characterized by a lower emergence rate and smaller population size, making it distinctly different from the other two types from the emergence stage onward. While the stable and intermediate types differed in their tolerance to late sowing, their remote sensing characteristics were not significantly different at the early growth stages. This suggests that these two types might share similar canopy structures, tiller numbers, leaf area indices, and biomass during the early stages. From the jointing stage, late-sown wheat enters a rapid growth phase characterized by accelerated root activity and growth rate, as well as increased biomass accumulation [7]. These accelerate the development of population differences among wheat varieties with different late sowing resistance levels. Distinctions between stable and intermediate types become apparent from the H stage, with remote sensing characteristics most pronounced at the G stage. This period is critical for wheat grain formation and is highly susceptible to environmental factors. Due to its delayed growth, late-sown wheat is particularly vulnerable to high temperatures during this period. Yield loss varies among wheat materials with different tolerance levels to late sowing, suggesting differential performance under high-temperature stress at the grain-filling stage. The stable type may exhibit superior physiological traits, such as chlorophyll content, net photosynthetic rate, and grain filling rate [6]. Future research should further analyze these indices to establish their relationship with remote sensing characteristics and identify unique phenotypes of late-sown wheat.
The modeling and validation results of this study indicate that the model performs better in the J2 stage compared to G, which has significant differences in characteristics. We hypothesize that there may be two reasons for this result. First, the use of YL as a criterion for late sowing tolerance may play a role. Yıldırım [33] noted that yield loss in late-sown wheat primarily stems from reduced panicle number, grain number per panicle, and plant grain number before flowering, with grain weight, filling rate, and duration having minimal impact during the grain filling stage. At the J2 stage, variations in D-VIs among different late-sown wheat materials arise due to differences in population size, leaf area, and tiller number. Second, from a modeling perspective, while the differences in D-VIs between stable and intermediate types at this stage are not statistically significant, these characteristics might exhibit greater inter-class discriminability. Figure 9c,d provide an overview of the key factors influencing the tolerance of wheat to late sowing using classification models for both stages. During the J2 stage, the primary contributing traits are D-MCARI, D-Sr, D-SCCCI, D-tcari/osavi, and D-TCARI. In contrast, during the G stage, the key traits are D-GNDVI, D-WDRVI, D-CVI, D-NAVI, and D-Sr. Furthermore, in the J2 stage, traits such as D-MCARI, D-SCCCI, D-TCARI, D-CRI, and D-REOSAVI significantly differentiate resistance types, especially for the stable and intermediate types. However, in the G stage, few traits effectively distinguish between these types. All these findings suggest that D-VIs during the J2 stage contribute more significantly to the model.

4.2. Application Potential of the Proposed Method in Selecting Wheat Varieties Suitable for Late Sowing

The evaluation method for late sowing tolerance introduced in this study enables the rapid classification of various wheat materials. However, for a variety to be considered suitable for late sowing in actual production, it must also exhibit high yield levels. Thiry [34] demonstrated that integrating resilience and productivity in wheat genotypes under stress provides researchers with clearer selection criteria and improved selection efficiency. Therefore, this study conducted a secondary division of the materials based on the evaluation of tolerance to late sowing and the yield level of the materials themselves in order to screen out the most suitable material for promotion under late sowing conditions.
The yield data obtained were subjected to the K-means clustering algorithm, which partitioned the materials into three categories. The clustering results are presented in Table 2. Figure 11 further depicts the secondary classification of each late sowing tolerance type. After combining tolerance level and yield, all materials were divided into nine groups, and the number of + represents the strength of the group suitable for promotion. The results demonstrated that the most suitable wheat materials to be promoted under late sowing conditions are those with high yield potential and high tolerance to late sowing. These materials, marked as +++++, exhibited a theoretical yield potential of up to 9500 kg ha−1 under late sowing and increased planting density conditions. The second-best options, marked as ++++, were the stable type materials with medium yield potential and the intermediate type with high yield potential, both of which could reach theoretical yields exceeding 8156 kg ha−1. The former group maintained good yield stability under late sowing, while the latter compensated for the yield loss caused by late sowing with their high yield potential. Conversely, wheat materials with either high late sowing tolerance but low yield potential or high yield potential but very poor late sowing tolerance were unable to achieve high yields under late sowing conditions and were classified as medium-level varieties that could be promoted. These varieties have three +s. Those wheat materials with average yield potential and substantial yield reductions were not recommended. They usually have a recommendation rating of + or ++. Therefore, when selecting wheat materials suitable for late sowing conditions, those belonging to the stable type with high yield potential are preferred, followed by those of the stable type with medium yield potential and the intermediate type with high yield potential.
In this research, all the wheat materials classified as the stable type had yield potentials at high and medium levels and, hence, all could be used as recommended wheat materials for planting in late sowing situations. Additionally, 55.00% of the intermediate type materials also belonged to the recommended varieties for planting. While 41.76% of the high-yield potential materials in the sensitive type are not ideal for recommendation, they remain valuable as high-yield potential parents in breeding late-sown wheat varieties.

4.3. Application Potential of the Proposed Method in Late-Sown Wheat Breeding

Yield is a multifaceted trait influenced by numerous factors. In rainfed systems, yield variability is primarily driven by genotype (G) × environment (E) interactions [6]. From an environmental point of view, late sowing reduces temperatures during seed germination, prolongs emergence time, shortens the growth period, and heightens the risk of high temperatures during seed development and maturation. Genotypes exhibit varying responses to late sowing, complicating the identification and evaluation of optimal wheat genotypes for late sowing. By analyzing changes in traits affecting yield, such as canopy temperature, grain growth duration, spike number, and spikelets per spike, the stability of these traits determines whether wheat varieties can serve as valuable genetic resources [35,36]. This approach is commonly employed in breeding late-sown wheat. Selected wheat materials belonging to the stable type exhibit high late sowing tolerance, making them ideal parental choices for breeding programs focused on this trait. The spectral characteristics of crops not only reveal traits such as tiller population, leaf area, and plant height but also provide insights into physiological traits that are typically challenging and destructive to measure, including chlorophyll content, water content, photosynthetic activity, and nutritional status. All of these traits are closely related to yield. Previous studies have suggested that remote sensing features can provide high-throughput phenotypic information with potential genetic relevance [37,38,39]. Although heritability was not analyzed in this study, these findings support the feasibility of using UAV spectral data for large-scale germplasm evaluation.

4.4. Influence of Different Types of Remote Sensing Data

While the current study utilized a multispectral sensor for evaluating late sowing tolerance, other sensors, such as hyperspectral, LiDAR, and thermal infrared sensors, could offer significant advantages. Hyperspectral sensors, with their high spectral resolution, can provide a broader range of spectral data, allowing for more detailed analysis of plant physiological traits. It may potentially detect late sowing tolerance at earlier growth stages by capturing subtle changes in plant health. LiDAR, on the other hand, can accurately measure canopy structure, providing valuable information about plant density and canopy architecture, which are crucial for assessing the impacts of late sowing. Thermal infrared sensors can monitor canopy temperature changes, which are particularly important during the grain-filling period [40,41]. Late-sown wheat is more susceptible to heat stress, and thermal infrared sensors can help detect these temperature fluctuations, offering insights into heat-induced stress responses.
By combining data from these advanced sensor technologies, the precision of late sowing tolerance assessments can be significantly improved, potentially enabling earlier evaluations of wheat genotypes during their growth stages. However, compared to these advanced technologies, multispectral sensors provide a more cost-effective solution [42], making them particularly suitable for large-scale field monitoring.

5. Conclusions

This study assessed the feasibility of using UAV multispectral data and machine learning to evaluate and identify the best wheat genotype performers under late sowing conditions. Compared with normal sowing, in late sowing and dense planting conditions, most of the VIs of the wheat canopy decreased, and this difference in VIs showed significant variations among different types of wheat with different tolerance levels to late sowing. The results indicated that J2 is the best growth stage to evaluate late sowing tolerance, and the indicators, including D-MCARI, D-Sr, D-SCCCI, D-mcari/osavi, and D-TCARI, played a crucial role. In this period, the logistic model performed best, with a mAP of 0.92. The precision values of three resistance types were 0.92, 0.61, and 1.00 and the recall values were 0.61, 0.92, and 1.00, respectively. With the proposed method, tolerance to the late sowing of wheat can be evaluated before harvest, which is conducive to the focused monitoring of stable varieties during the critical growth period. This shows strong potential as a rapid and non-destructive tool for screening wheat materials suitable for late sowing, with promising prospects for facilitating their adoption in production and supporting future wheat breeding.

Supplementary Materials

The following supporting information can be downloaded at https://www.mdpi.com/article/10.3390/agronomy15102384/s1: Figure S1: Differences of D-VIs among three populations with different tolerance to late sowing of eight growth stages; Table S1: The vegetation indices used in this research; Table S2: The yield loss values of all harvest materials.

Author Contributions

Conceptualization, Y.Z.; methodology, Y.Z.; formal analysis, W.W.; investigation, W.W. and C.L.; project administration, W.G.; data collection, Y.S., W.Z. and F.W.; data curation, Y.Z., W.H.M. and W.W; data analysis, Y.W. and F.W.; writing—original draft preparation, Y.Z.; writing—review and editing, H.W., Y.S., Y.W., W.Z., J.W., W.H.M., J.D., C.S., T.L. and W.G.; supervision, W.H.M., C.L., C.S. and T.L.; funding acquisition, Y.Z., J.D., C.L., C.S., T.L. and W.G. All authors have read and agreed to the published version of the manuscript.

Funding

This research was supported by the National Key Research and Development Program of China [2023YFD2300201]; the National Natural Science Foundation of China [32172110, 32172111]; the Postgraduate Research and Innovation Plan of Jiangsu Province [KYCX23_3576]; the Key Research and Development Program (Modern Agriculture) of Jiangsu Province [BE2020319]; the Special Funds for Scientific and Technological Innovation of Jiangsu Province, China [BE2022425]; and the Special Fund for Independent Innovation of Agriculture Science and Technology in Jiangsu, China [CX(22)3112].

Data Availability Statement

The original contributions presented in this study are included in the article. Further inquiries can be directed to the corresponding author.

Acknowledgments

ChatGPT 4.0 was used solely for English translation.

Conflicts of Interest

The authors declare that they have no known competing financial interests or personal relationships that could have appeared to influence the work reported in this paper.

References

  1. Ghazouani, H.; Jabnoun, R.; Harzallah, A.; Ibrahimi, K.; Amami, R.; Boughattas, I.; Milham, P.; Ghfar, A.A.; Provenzano, G.; Sher, F. Projected long-term climate change impacts on rainfed durum wheat production and sustainable adaptation strategies. J. Clean. Prod. 2025, 494, 144980. [Google Scholar] [CrossRef]
  2. Liu, Z.Y.; Cammarano, D.; Liu, X.J.; Tian, Y.C.; Zhu, Y.; Cao, W.X.; Cao, Q. Winter wheat yield responses to growing degree days: Long-term trends and adaptability in major producing areas of China. Ecol. Indic. 2025, 170, 113058. [Google Scholar] [CrossRef]
  3. Yousefi, A.; Koocheki, A.; Mahallati, M.N.; Khorramdel, S.; Trenz, J.; Malakshahi, K.A.; Ludewig, U.; Maywald, N.J. Adapting wheat production to global warming in West Asia: Facultative wheat outperforms winter and spring wheat at conventional nitrogen levels. Food Energy Secur. 2025, 14, e70072. [Google Scholar] [CrossRef]
  4. Ding, J.F.; Liang, P.; Wu, P.; Zhu, M.; Li, C.Y.; Zhu, X.K.; Gao, D.R.; Chen, Y.L.; Guo, W.S. Effects of waterlogging on grain yield and associated traits of historic wheat cultivars in the middle and lower reaches of the Yangtze River, China. Field Crops Res. 2020, 246, 107695. [Google Scholar] [CrossRef]
  5. Ma, Y.Z.; Qiao, Y.F.; Tang, Y.J.; Wu, Y.; Miao, S.J. Estimation of N2O and CH4 emissions in field study and DNDC model under optimal nitrogen level in rice-wheat rotation system. Sci. Total Environ. 2025, 974, 179168. [Google Scholar] [CrossRef]
  6. Liu, K.; Harrison, M.T.; Wang, B.; Yang, R.; Yan, H.L.; Zou, J.; Liu, D.L.; Meinke, H.; Tian, X.H.; Ma, S.Y.; et al. Designing high-yielding wheat crops under late sowing: A case study in southern China. Agron. Sustain. Dev. 2022, 42, 29. [Google Scholar] [CrossRef]
  7. Wang, S.; Niu, Y.X.; Shang, L.; Li, Z.Y.; Lin, X.; Wang, D. Supplemental irrigation at the jointing stage of late sown winter wheat for increased production and water use efficiency. Field Crops Res. 2023, 302, 109069. [Google Scholar] [CrossRef]
  8. Zhang, Z.Z.; Cheng, S.; Fan, P.; Zhou, N.B.; Xing, Z.P.; Hu, Y.J.; Xu, F.F.; Guo, B.W.; Wei, H.Y.; Zhang, H.C. Effects of sowing date and ecological points on yield and the temperature and radiation resources of semi-winter wheat. J. Integr. Agric. 2023, 22, 1366–1380. [Google Scholar] [CrossRef]
  9. Singh, S.; Gupta, A.K.; Gupta, S.K.; Kaur, N. Effect of sowing time on protein quality and starch pasting characteristics in wheat (Triticum aestivum L.) genotypes grown under irrigated and rain-fed conditions. Food Chem. 2010, 122, 559–565. [Google Scholar] [CrossRef]
  10. Baloch, M.; Shah, I.; Nadim, M.; Khan, I.; Abdul, A.K. Effect of seeding density and planting time on growth and yield attributes of wheat. J. Anim. Plant Sci. 2010, 20, 239–240. [Google Scholar]
  11. Dubey, R.; Pathak, H.; Singh, S.; Chakravarti, B.; Thakur, A.K.; Fagodia, R.K. Impact of sowing dates on terminal heat tolerance of different wheat (Triticum aestivum L.) Cultivars. Natl. Acad. Sci. Lett. 2019, 42, 445–449. [Google Scholar] [CrossRef]
  12. Duchemin, B.; Fieuzal, R.; Rivera, M.A.; Ezzahar, J.; Jarlan, L.; Rodriguez, J.C.; Hagolle, O.; Watts, C. Impact of sowing date on yield and water use efficiency of wheat analyzed through spatial modeling and FORMOSAT-2 images. Remote Sens. 2015, 7, 5951–5979. [Google Scholar] [CrossRef]
  13. Shah, F.; Coulter, J.A.; Ye, C.; Wu, W. Yield penalty due to delayed sowing of winter wheat and the mitigatory role of increased seeding rate. Eur. J. Agron. 2020, 119, 126120. [Google Scholar] [CrossRef]
  14. Tian, W.Q.; Chen, G.Z.; Zhang, Q.B.; Zhang, Z.L.; Zhang, J.; YU, S.; Shi, S.B.; Zhang, J.S. Can increased density compensate for extremely late-sown wheat yield? Agronomy 2025, 15, 607. [Google Scholar] [CrossRef]
  15. Spink, J.H.; Semere, T.; Sparkes, D.L.; Whaley, J.M.; Foulkes, M.J.; Clare, R.W.; Scott, R.K. Effect of sowing date on the optimum plant density of winter wheat. Ann. Appl. Biol. 2000, 137, 179–188. [Google Scholar] [CrossRef]
  16. Bock, C.H.; Barbedo, J.G.A.; Del Ponte, E.M.; Bohnenkamp, D.; Mahlein, A.K. From visual estimates to fully automated sensor-based measurements of plant disease severity: Status and challenges for improving accuracy. Phytopathol. Res. 2020, 2, 9. [Google Scholar] [CrossRef]
  17. Chivasa, W.; Mutanga, O.; Burgueño, J. UAV-based high-throughput phenotyping to increase prediction and selection accuracy in maize varieties under artificial MSV inoculation. Comput. Electron. Agric. 2021, 184, 106128. [Google Scholar] [CrossRef]
  18. Qin, W.L.; Wang, J.; Ma, L.F.; Wang, F.L.; Hu, N.Y.; Yang, X.Y.; Xiao, Y.Y.; Zhang, Y.H.; Sun, Z.C.; Wang, Z.M.; et al. 2 UAV-based multi-temporal thermal imaging to evaluate wheat drought resistance in different deficit irrigation regimes. Remote Sens. 2022, 14, 5608. [Google Scholar] [CrossRef]
  19. Ma, H.Q.; Huang, W.J.; Dong, Y.Y.; Liu, L.Y.; Guo, A.T. Using UAV-Based Hyperspectral Imagery to Detect Winter Wheat Fusarium Head Blight. Remote Sens. 2021, 13, 3024. [Google Scholar] [CrossRef]
  20. Morellos, A.; Pantazi, X.E.; Almoujahed, M.B.; Kriaučiūnienė, Z.; Kazlauskas, M.; Šarauskis, E.; Mouazen, A.M. Forecasting of Fusarium head blight spatial distribution in winter wheat using machine learning. Comput. Electron. Agric. 2025, 231, 109967. [Google Scholar] [CrossRef]
  21. Hairmansis, A.; Berger, B.; Tester, M.; Roy, S.J. Image-based phenotyping for non-destructive screening of different salinity tolerance traits in rice. Rice 2014, 7, 16. [Google Scholar] [CrossRef]
  22. Zhang, P.; Zhou, Z.B.; Huang, H.S.; Yang, Y.Z.; Hu, X.C.; Zhuang, J.J.; Tang, Y. Hybrid integrated feature fusion of handcrafted and deep features for rice blast resistance identification using UAV imagery. IEEE J. Sel. Top. Appl. Earth Obs. Remote Sens. 2025, 18, 7304–7317. [Google Scholar] [CrossRef]
  23. Duarte-Carvajalino, J.M.; Alzate, D.F.; Ramirez, A.A.; Santa-Sepulveda, J.D.; Fajardo-Rojas, A.E.; Soto-Suárez, M. Evaluating late blight severity in potato crops using unmanned aerial vehicles and machine learning algorithms. Remote Sens. 2018, 10, 1513. [Google Scholar] [CrossRef]
  24. Laura, D.; Urrutia, E.P.; Salazar, F.; Ureña, J.; Moreno, R.; Machado, G.; Cazorla-Logroño, M.; Altamirano, S. Aerial remote sensing system to control pathogens and diseases in broccoli crops with the use of artificial vision. Smart Agric. Technol. 2025, 10, 100739. [Google Scholar] [CrossRef]
  25. Bapela, T.; Shimelis, H.; Terefe, T.; Bourras, S.; Sánchez-Martín, J.; Douchkov, D.; Desiderio, F.; Tsilo, T.J. Breeding wheat for powdery mildew resistance: Genetic resources and methodologies—A review. Agronomy 2023, 13, 1173. [Google Scholar] [CrossRef]
  26. Hamdane, Y.; Segarra, J.; Buchaillot, M.L.; Rezzouk, F.Z.; Gracia-Romero, A.; Vatter, T.; Benfredj, N.; Hameed, R.A.; Gutiérrez, N.A.; Torró Torró, I.; et al. Using ground and UAV vegetation indexes for the selection of fungal-resistant bread wheat varieties. Drones 2023, 7, 454. [Google Scholar] [CrossRef]
  27. Kumar, V.U.; Hazra, S.; Gorai, S.; Maji, A.; Ali, N.; Pal, A.K. Screening of wheat genotypes with heat susceptibility indices for yield and it attributing characters under different sowing conditions. Int. J. Bio-Resour. Stress. Manag. 2025, 16, 1–13. [Google Scholar] [CrossRef]
  28. Loladze, A.; Rodrigues, F.A.; Petroli, C.D.; Muñoz-Zavala, C.; Naranjo, S.; San Vicente, F.; GerarD, B.; Montesinos-Lopez, O.A.; Crossa, J.; Martini, J.W.R. Use of remote sensing for linkage mapping and genomic prediction for common rust resistance in maize. Field Crops Res. 2024, 308, 109281. [Google Scholar] [CrossRef]
  29. Tapia, R.; Abd-Elrahman, A.; Osorio, L.; Whitaker, V.M.; Lee, S. Combining canopy reflectance spectrometry and genome-wide prediction to increase response to selection for powdery mildew resistance in cultivated strawberry. J. Exp. Bot. 2022, 73, 5322–5335. [Google Scholar] [CrossRef]
  30. Chapu, I.; Chandel, A.; Sie, E.K.; Okello, D.K.; Oteng-Frimpong, R.; Okello, R.C.O.; Hoisington, D.; Balota, M. Comparing regression and classification models to estimate leaf spot disease in peanut (Arachis hypogaea L.) for implementation in breeding selection. Agronomy 2024, 14, 947. [Google Scholar] [CrossRef]
  31. Yang, C.; Yang, G.J.; Wang, H.R.; Li, S.M.; Zhang, J.P.; Pan, D.; Ren, P.T.; Feng, H.K.; Li, H.L. Identifying key traits for screening high-yield soybean varieties by combining UAV-based and field phenotyping. Remote Sens. 2025, 17, 690. [Google Scholar] [CrossRef]
  32. Huang, J.H.; Wen, H.J.; Hu, J.W.; Liu, B.; Zhou, X.Z.; Liao, M.Y. Deciphering decision-making mechanisms for the susceptibility of different slope geohazards: A case study on a SMOTE-RF-SHAP hybrid model. J. Rock. Mech. Geotech. Eng. 2025, 17, 1612–1630. [Google Scholar] [CrossRef]
  33. Yildirim, M.; Koç, M.; Akinci, C.; Barutçular, C. Variations in morphological and physiological traits of bread wheat diallel crosses under timely and late sowing conditions. Field Crops Res. 2013, 140, 9–17. [Google Scholar] [CrossRef]
  34. Thiry, A.A.; Chavez Dulanto, P.N.; Reynolds, M.P.; Davies, W.J. How can we improve crop genotypes to increase stress resilience and productivity in a future climate? A new crop screening method based on productivity and resistance to abiotic stress. J. Exp. Bot. 2016, 67, 5593–5603. [Google Scholar] [CrossRef]
  35. Basheir, S.M.O.; Hong, Y.; Lv, C.; Xu, H.; Zhu, J.; Guo, B.; Wang, F.; Xu, R. Identification of wheat germplasm resistance to late sowing. Agronomy 2023, 13, 1010. [Google Scholar] [CrossRef]
  36. Singh, N.B.; Singh, Y.P.; Singh, V.P.N. Variation in physiological traits in promising wheat varieties under late sown condition. Indian J. Plant Physiol. 2005, 10, 171–175. [Google Scholar]
  37. Anche, M.T.; Kaczmar, N.S.; Morales, N.; Clohessy, J.W.; Ilut, D.C.; Gore, M.A.; Robbins, K.T. Temporal covariance structure of multispectral phenotypes and their predictive ability for end-of-season traits in maize. Theor. Appl. Genet. 2020, 133, 2853–2868. [Google Scholar] [CrossRef] [PubMed]
  38. El-Hendawy, S.; Al-Suhaibani, N.; Al-Ashkar, I.; Alotaibi, M.; Tahir, M.U.; Solieman, T.; Hassan, W.M. Combining genetic analysis and multivariate modeling to evaluate spectral reflectance indices as indirect selection tools in wheat breeding under water deficit stress conditions. Remote Sens. 2020, 12, 1480. [Google Scholar] [CrossRef]
  39. Tao, X.; Li, Y.; Yan, W.; Wang, M.; Tan, Z.; Jiang, J.; Luan, Q. Heritable variation in tree growth and needle vegetation indices of slash pine (pinus elliottii) using unmanned aerial vehicles (UAVs). Ind. Crops Prod. 2021, 173, 114073. [Google Scholar] [CrossRef]
  40. Cossani, C.M.; Reynolds, M.P. Physiological traits for improving heat tolerance in wheat. Plant Physiol. 2012, 160, 1710–1718. [Google Scholar] [CrossRef]
  41. Poudel, P.B.; Mukti, R.P. Heat stress effects and tolerance in wheat: A review. J. Biol. Todays World 2020, 9, 217. [Google Scholar]
  42. Lei, D.; Zhi, H.M.; Xiao, J.L.; Zhuo, W.H.; Fu, Z.D.; Ya, N.Y. UAV-Based Multispectral Remote Sensing for Precision Agriculture: A Comparison between Different Cameras. ISPRS J. Photogramm. Remote Sens. 2018, 146, 124–136. [Google Scholar] [CrossRef]
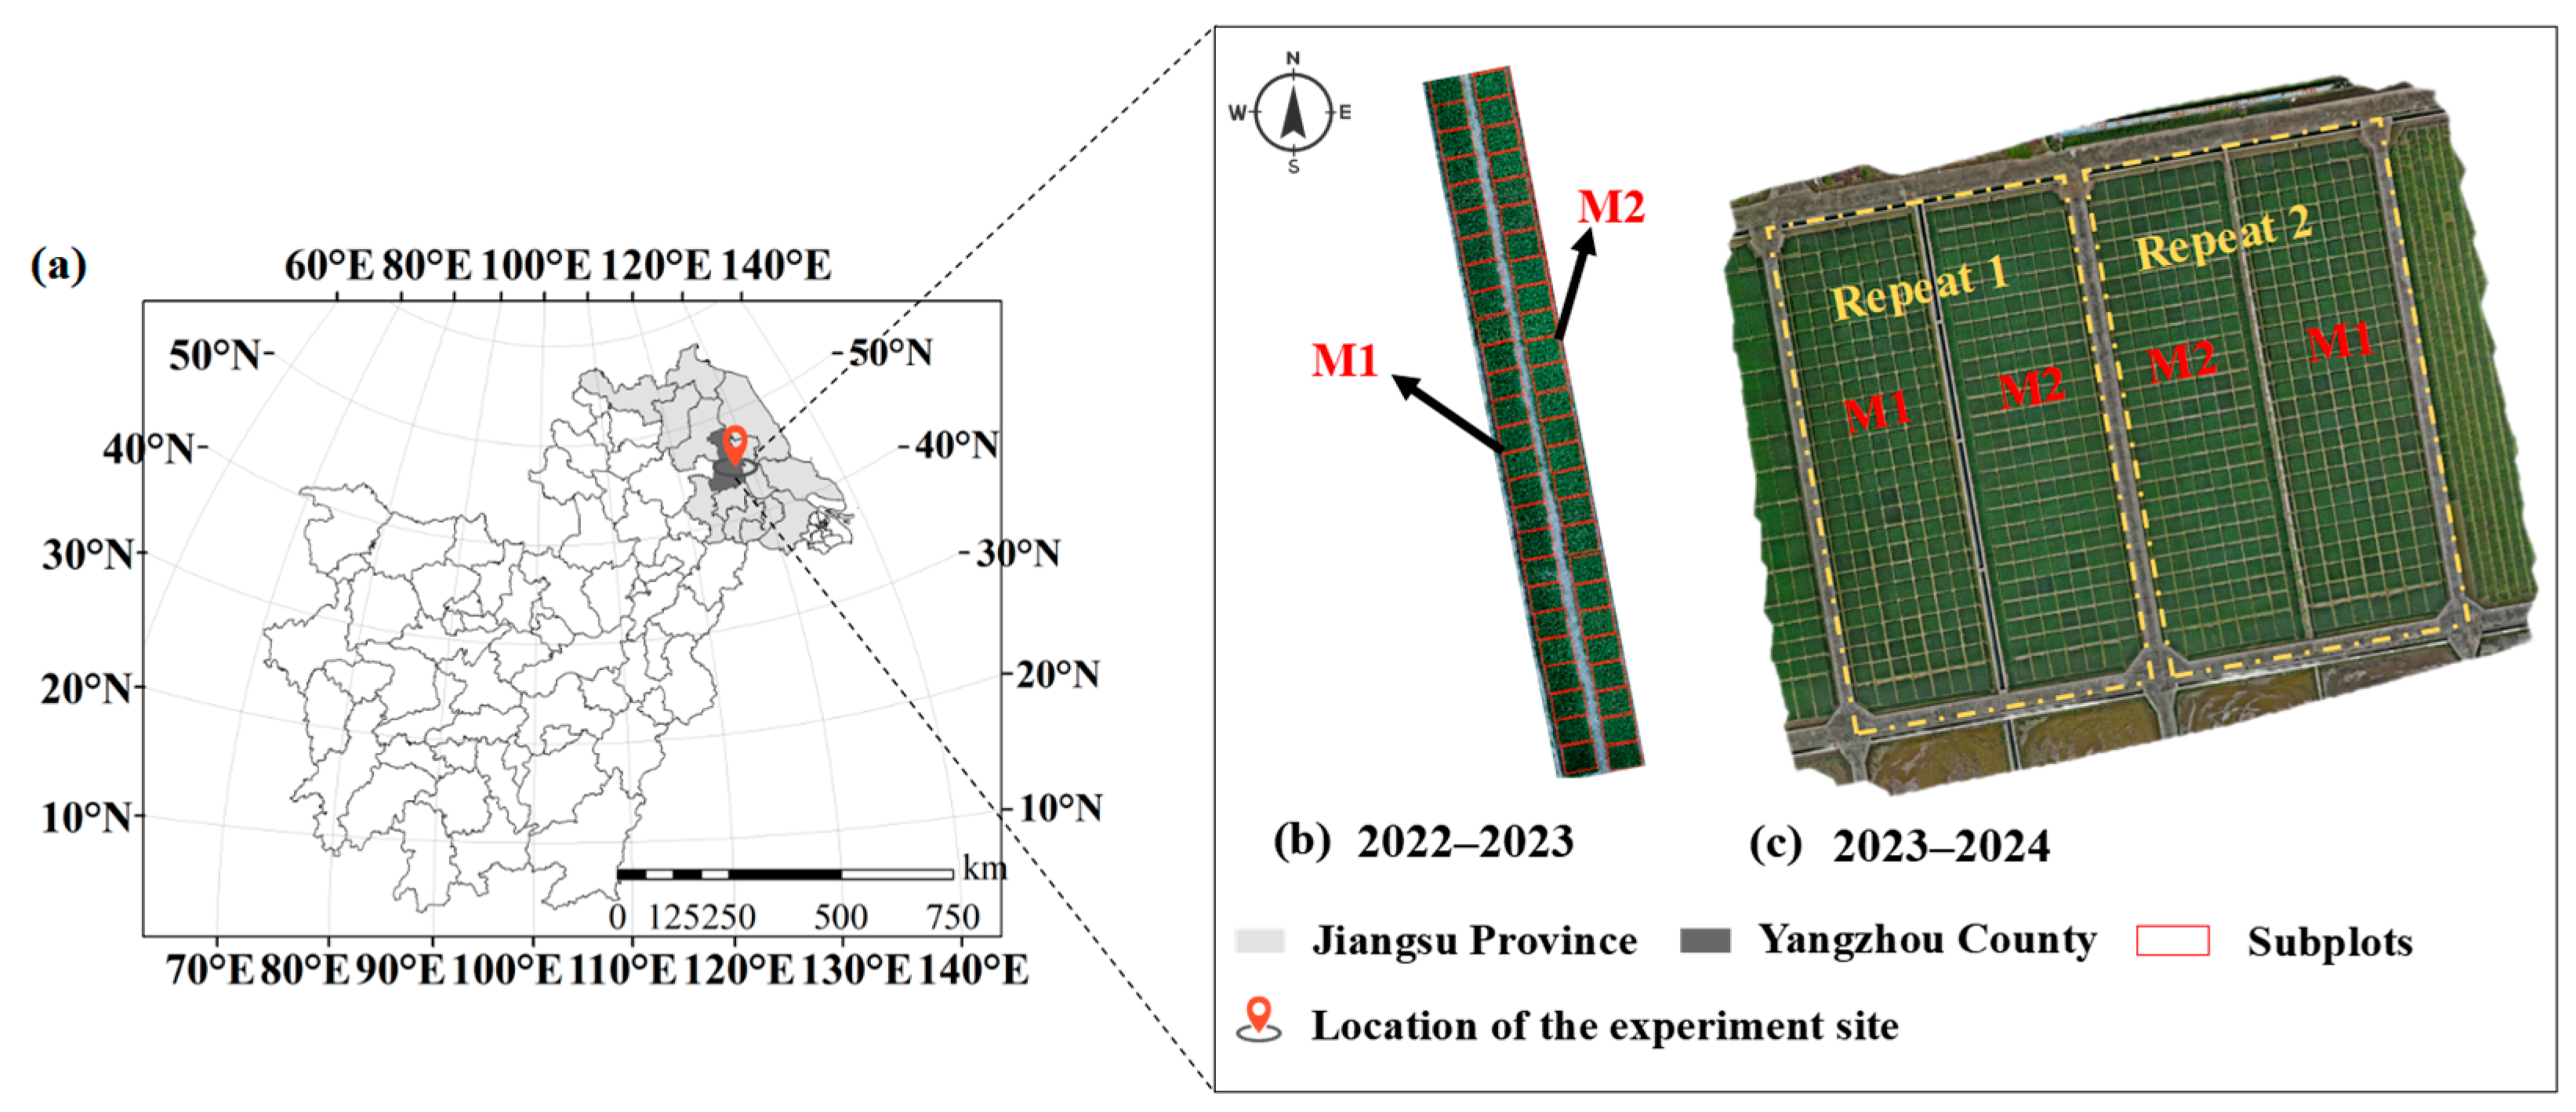
Figure 1. Study areas of 2022–2024. (a) is the map of the YRBR in China. (b) is the study area for 2022–2023 and (c) is the study area for 2023–2024.
Agronomy 15 02384 g001
Figure 2. Flowchart of this study.
Agronomy 15 02384 g002
Figure 3. Temporal dynamics of the standardized D-VIs (z-scores) across eight wheat growth stages. (a) includes the curves of all D-VIs, (b) shows the temporal dynamics of the top ten D-VIs.
Agronomy 15 02384 g003
Figure 4. Differences of D-VIs among three populations with different tolerance levels to late sowing. * means 0.01 < p < 0.05, ** means 0.001 < p < 0.01, *** means p < 0.001. The stable type is marked as L1, the intermediate type is marked as L2, and the sensitive type is marked as L3.
Agronomy 15 02384 g004
Figure 5. Accuracy results for different model validations. (ae) represent the average accuracy of the logistic, SVM, DT, RF, and XGBoost models over the eight growth stages, respectively.
Agronomy 15 02384 g005
Figure 6. Comparison of the mAP values of different models.
Agronomy 15 02384 g006
Figure 7. Validation results of wheat types with different late sowing tolerance levels of different models. (ac) are precision, recall, and F1-score of model validation, respectively. The stable type is marked as L1, the intermediate type is marked as L2, and the sensitive type is marked as L3.
Agronomy 15 02384 g007
Figure 8. Confusion matrix results for model validation of logistic, SVM, and DT in J2 stage. The stable type is marked as L1, the intermediate type is marked as L2, and the sensitive type is marked as L3.
Agronomy 15 02384 g008
Figure 9. Results of feature contribution analysis in different growth stages for the logistic model. (a,c) SHAP summary plot of three types for models in stages J2 and G. (b,d) Contribution ranking of features for models in stages J2 and G. The stable type is marked as L1, the intermediate type is marked as L2, and the sensitive type is marked as L3.
Agronomy 15 02384 g009
Figure 10. Predicted results of planting materials in 2023. (a) is part of the validation result, (b) is the predicted results of all the wheat varieties. The stable type is marked as L1, the intermediate type is marked as L2, and the sensitive type is marked as L3.
Agronomy 15 02384 g010
Figure 11. Secondary division results for wheat materials with different tolerance levels to late sowing. (a) is the result of the stable type, (b) is the result of the intermediate type, and (c) is the result of the sensitive type.
Agronomy 15 02384 g011
Table 1. The result of feature selection by using the random forest algorithm.
Growth StagesVIs
ED-CIgreen (0.0314), D-CVI (0.0425), D-MCARI (0.0303), D-MSR (0.0340), D-MTCI (0.0353), D-NAVI (0.0358), D-NDREI (0.0349), D-RESR (0.0302), D-Sr (0.0315)
WD-CRI (0.0473), D-GRVI (0.0309), D-LCI (0.0391), D-MCARI (0.0329), D-NAVI (0.0306), D-NDRE (0.0304), D-REDVI (0.0421), D-RTVI_CORE (0.0339), D-SCCCI (0.0422)
J1D-CIgreen (0.0314), D-CVI (0.0425), D-MCARI (0.0303), D-MSR (0.0340), D-MTCI (0.0353), D-NAVI (0.0358), D-NDREI (0.0349), D-REMSR (0.0302), D-Sr (0.0315)
J2D-CIgreen (0.0309), D-CRI (0.0324), D-CVI (0.0380), D-LCI (0.0314), D-MCARI (0.0347), D-NDRE (0.0351), D-NDREI (0.0326), D-NGI (0.0308), D-RECI (0.0314), D-REDVI (0.0304), D-REMSR (0.0340), D-REOSAVI (0.0305), D-RESR (0.0368), D-SCCCI (0.0404), D-Sr (0.0307), D-TCARI (0.0309), D-tcari/osavi (0.0304), D-mcari/osavi (0.0385)
HD-GOSAVI (0.0309), D-GRVI (0.0471), D-NAVI (0.0323), D-Sr (0.0358), D-tcari/osavi (0.054)
FD-GRVI (0.0446), D-NAVI (0.0383), D-NDREI (0.0483), D-RVI (0.0323), D-TCARI (0.0338), D-mcari/osavi (0.0352)
GD-CVI (0.0347), D-GNDVI (0.0317), D-NAVI (0.0474), D-NDREI (0.0403), D-NDVI (0.0538), D-NGI (0.0525), D-Sr (0.0335), D-WDRVI (0.0363)
MD-CVI (0.0337), D-GRVI (0.0443), D-MCARI (0.0305), D-MSR (0.0336), D-MTCI (0.0368), D-NAVI (0.0346), D-NDREI (0.0334), D-NDVI (0.0323), D-OSAVI (0.0346), D-REOSAVI (0.0309), D-Sr (0.0404), D-TCARI (0.0306), D-WDRVI (0.0319)
Table 2. Yield clustering results for wheat with different tolerance levels to late sowing.
Late Sowing ResistanceThe Range of Yield Under M1 (kg ha−1)Recommendation Rate
Stable type10,000.00–11,562.50+++++
9062.50–9975.00++++
8125.00–8750.00+++
Intermediate type10,000.00–11,562.50++++
9062.50–9975.00+++
8125.00–8750.00++
Sensitive type10,000.00–11,562.50+++
9062.50–9975.00++
8125.00–8750.00+
Note: the number of +s represents how strongly the category is recommended. The higher the number, the more it is recommended.
Disclaimer/Publisher’s Note: The statements, opinions and data contained in all publications are solely those of the individual author(s) and contributor(s) and not of MDPI and/or the editor(s). MDPI and/or the editor(s) disclaim responsibility for any injury to people or property resulting from any ideas, methods, instructions or products referred to in the content.