Article

Influence of Soil Temperature on Potential Evaporation over Saturated Surfaces—In Situ Lysimeter Study

1
School of Water and Environment, Chang’an University, Xi’an 710054, China
2
Key Laboratory of Subsurface Hydrology and Ecological Effects in Arid Region of the Ministry of Education, Chang’an University, Xi’an 710054, China
3
Key Laboratory of Eco-Hydrology and Water Security in Arid and Semi-Arid Regions of Ministry of Water resources, Chang’an University, Xi’an 710054, China
4
CCTEG Xi’an Research Institute (Group) Co., Ltd., Xi’an 710077, China
5
Coal Mine Hazard Prevention and Control National Key Laboratory, Xi’an 710077, China
*
Author to whom correspondence should be addressed.
Agronomy 2025, 15(10), 2381; https://doi.org/10.3390/agronomy15102381
Submission received: 18 August 2025 / Revised: 9 October 2025 / Accepted: 10 October 2025 / Published: 12 October 2025

Abstract

Potential evaporation (PE) from saturated bare surfaces is the basis for estimating actual evaporation (Es) in agricultural and related disciplines. Most models estimate PE using meteorological data. Thus, the dependence of soil temperature (T) on PE is often simplified in applications. To address this gap, we conducted an in situ lysimeter experiment in the Guanzhong Basin, China, continuously measuring PE, T, and soil heat flux (G) at high temporal resolution over three fully saturated sandy soils. Results show that annual PE over fine sand was 7.1% and 11.0% higher than that of coarse sand and gravel. The observed PE differences across textures can be quantitatively explained using the surface energy balance equation and a radiatively coupled Penman-Monteith equation, accounting for the dependence of T on net radiation (Rn) and G. In contrast, PE estimates diverged from observations when Rn and G were assumed to be independent of T. We further evaluated the influence of T and other influencing variables on PE. The random forest model identified that near-surface heat storage variations (∆S) contribute most significantly to PE estimation (relative importance = 0.37), followed by surface temperature (0.24) and sensible heat flux (0.23). These findings highlight the critical role of near-surface temperature in PE estimation.

1. Introduction

More than 40% of the Earth’s terrestrial surface devoted to agricultural purposes is bare over a substantial period of the year due to tillage practices [1]. In arid and semi-arid regions, bare soil evaporation (Es) is the dominant contribution to the total evapotranspiration (ET) owing to the relatively large fraction of exposed soil and sparse vegetation cover [2]. From the perspective of agricultural water management, accurately estimating Es is crucial for preventing irrigation mismanagement and for optimizing cropping patterns to support more adaptive planting strategies [3,4].
Directly measuring Es is challenging. A commonly used strategy is to estimate potential evaporation (PE) from a saturated bare surface first and then derive Es based on PE. This approach has been widely applied in agricultural hydraulics [5,6], hydrogeology [7], and related disciplines [8]. Previous research implies that the calculation of Es is strongly influenced by the choice of PE [9]. The mechanisms of how soil textures affect Es have been extensively investigated [10,11,12,13,14]. While the influence of soil texture on PE has received relatively little attention. Owing to the challenges associated with directly measuring evaporation and related variables under saturated soil conditions, most models estimate PE using meteorological data.
For example, the Penman–Monteith equation (PM) remains the most widely adopted method for estimating saturated bare soil evaporation [15,16]. The basis of the Penman-type equation is the surface energy balance equation (Equation (1)). Penman [17] removed the explicit dependence of Es on surface temperature (Ts) by linearizing the saturation vapor pressure curve (∆). Monteith [18] later derived the full-form PM (Equation (3)). Nevertheless, the PM model suffers from an issue concerning soil temperature (T). Rn and G are often unavailable as it is not common to observe Ts (which influence the net longwave radiation Rn,l in Rn) and G over wet surfaces. Thus, (RnG) in the energy term (Equation (3)) is often assumed not to vary with T and Ts. This assumption is applicable when direct measurements of Rn and G are accessible [19]. To address this issue, the methods introduced in the Food and Agriculture Organization 56 guidelines (FAO–56) are often adopted to estimate Rn and G, despite their original applicability being limited to grass reference evapotranspiration (ETo). In the FAO–56 guidelines, Rn,l (related to Ts4) is estimated using air temperature (Ta). As for G, which is determined by temperature gradients along the soil profile (∂T/∂z), it is neglected over one-day to ten-day periods and approximated as a fraction of Rn over sub-daily scales [20]. In other words, in applications, the influence of T on PE has long been overlooked in the commonly used FAO–56 standards and other state-of-the-art evaporation models that require RnG as inputs.
In arid and semi-arid regions, rapid variations in near-surface temperatures complicate the soil temperature dynamics. A comprehensive understanding of how soil temperature regulates surface energy partitioning, as well as its influence on PE over different saturated surfaces, has so far not been explored with high-resolution hourly PE measurements.
To address these issues, an in situ lysimeter experiment was conducted in a temperate, semi-arid continental monsoon climate to precisely measure PE over saturated fine sand, coarse sand, and gravel. Soil temperature and soil heat flux were simultaneously monitored at a very high temporal resolution. This study specifically addressed the following questions:
(1)
What are the differences in potential evaporation (PE) and soil temperature (T) across different fully saturated soil textures?
(2)
How do PE estimation methods, with and without considering T, perform relative to observations?
(3)
How does T affect PE rates through its influence on surface energy redistribution?

2. Materials and Methods

2.1. Study Site

This experiment site was conducted in a temperate, semi-arid, continental monsoon climate near Xi’an, located in Chang’an University, Shaanxi Province (Latitude:34°28′ N; Longitude:108°93′ E, Figure 1a).

2.2. Experimental Setup and Field Measurements

2.2.1. Lysimeter Device and Sensors

Lysimeter columns (area 1.0 m2, depth 70 cm, reservoirs are made of fiberglass) are located in the northwest corner of the experimental site (Figure 1b). This experiment employed a non-weighing, constant water–table type lysimeter device called the Automatic Water Replenishing Markov Bottle (Mariotte Bottle) System. As Figure 1d illustrates, columns are filled with three homogeneous sandy soils. Physical properties of the textures are introduced in Supplementary Material Table S1. Each lysimeter column (Figure 1(dA)) is connected to a Markov Bottle (installed in the basement, Figure 1(dC)) via the Balance Cup (Figure 1(dB)). The water table in the column is maintained at the soil surface by the Markov Bottle to keep the soil saturated during evaporation. Evaporated water is rapidly replenished by the Markov bottle. Thus, the PE rate in the lysimeter column was derived from the water level variation in the Markov Bottle measured by pressure sensors (MPM489, MICROSENSOR). Because the cross-sectional areas of the lysimeter column (radius 56.5 cm) and the Markov bottle (radius 5.8 cm) differ, the water level change in the Bottle was converted to the corresponding PE rate in the column based on the ratio of their radii squared [21]. In practice, a decline of 94 mm in the water level of the Markov bottle corresponds to a 1 mm PE rate in the lysimeter column of this study. This system was invented by Chang’an University. It achieved a Utility Model Patent in 2014 [22] and can provide reliable evaporation data with a high temporal resolution. In this research, the repetition tests were made to test the reliability of the measured PE data; please refer to Supplementary Material S1 (Figure A–Figure C).

2.2.2. Sensors and Meteorological Data

Soil temperature data (MPS 6, METER Group) are observed at 3, 5, 10, 20, 30, and 50 cm depths in the lysimeter column (i.e., T3, T5, T10, T20, T30, and T50). Soil heat flux (HFP01, Hukeflux Inc.) is observed at 5 cm depth in the soil. Data are automatically recorded by the data loggers EM50 and CR-1000 (Campbell Scientific Inc.), respectively, at 10 min intervals. A standard meteorological station is located in the southern part of the experiment site to collect meteorological elements (Figure 1b). The information on meteorological measurement devices is listed in Table 1. The daily meteorological variables during the study period were shown in Supplementary Material S2, Figure D.

2.2.3. Data Quality Assurance and Quality Control (QA/QC) Procedures

Data used in this research include the following: meteorological data, soil temperature, soil heat flux, and evaporation data. Quality assurance (QA) and quality control (QC) are both aspects of data quality management at the soil and water management research unit.
The QA/QC procedures for the meteorological and soil data are introduced in [23,24]. QA focuses on the long-term fulfillment of quality requirements by instituting policies for sensor choice, data logger choice, data acquisition and storage, and format [23]. With regard to QA procedures, the meteorological and soil observation sensors used in this study are internationally recognized equipment [23]. Their installation heights (Table 1) also conform to ASCE [24], ensuring continuous data collection throughout the experiment period. QC is focused on ensuring that data meet quality requirements; it includes both short-term (daily) procedures and longer-term (seasonal) procedures that include sensor cross-correlation and gap filling. QC begins with daily longitudinal plotting against time of all sensor data for visual identification of sensor failure and other abnormalities that require immediate intervention to repair, adjust, or replace sensors or data loggers. We verified data quality by plotting meteorological and temperature data at both short-term and long-term scales, confirming that the observations were continuous and free of outliers during the study period.
The QA/QC procedures for the weighing lysimeters are introduced in [25,26,27,28]. However, the QA/QC procedure for non–weighing lysimeters is rarely mentioned. Therefore, we adopted the QA/QC procedures of the weighing lysimeter as a reference to carry out QA/QC for the lysimeter device used in this experiment. First of all, the non–weighing, constant water–table type lysimeter device calculates evaporation over varying time steps by cumulatively summing changes in the Markov bottle water level. The pressure sensors in the Markov Bottle provided a liquid-level measurement precision of ±0.1 mm, corresponding to a PE precision of ±0.01 mm in the lysimeter column. This high resolution ensured that even minute variations in water level could be reliably detected, thereby allowing accurate calculation of PE rates in the lysimeter column. The water level was recorded every 10 min, and hourly evaporation rates were determined. Compared to traditional weighing lysimeters, the lysimeter device in this experiment is improved in providing continuous water supply and recording the PE rate automatically. This device minimizes evaporation rate errors caused by “smoothing” over different time scales that can occur in weighing lysimeters. Secondly, the lysimeter used in this study requires modest maintenance, thus reducing operational complexity while maintaining measurement reliability. Every three months, the pressure sensor mounted above the Markov bottle is calibrated. This calibration ensures that the reading of liquid level fluctuations remains accurate and stable over long-term deployment. Moreover, following each rainfall event, the balance cup is inspected and cleaned of debris to ensure unhindered hydraulic connection. Last but not least, PE results are adversely affected in two situations. Firstly, evaporation cannot be measured on rainy days; only rainfall infiltration will be observed. Secondly, evaporation cannot be measured when the saturated soil in the column freezes (generally starting from the middle of December to the beginning of February in the research area).

2.3. Methodology

2.3.1. Energy Balance Method

The energy balance equation at soil surface is shown in Equation (1).
R n G = H + L E
where Rn [W m−2] is the net radiation, G [W m−2] is the total ground heat flux, H [W m−2] is the sensible heat flux, and LE [W m−2] is the latent heat for evaporation. A step-by-step calculation of PE according to the energy balance equation (Equation (1)) is presented in Appendix A. Equation (1) is an implicit equation for soil temperature (T) and surface temperature (Ts) [19] as follows:
R n , s + ε R ld σ T s 4 R n , l R n T s λ T / z G 0 + c s 0 z T / t d z Δ S   G T = T s T a / f u   H T s + L f e s T s e a T a   L E T s
In this research, flux terms were calculated from hourly data. One complication of our experiment setup is that, due to experimental constraints, we were unable to utilize infrared sensors to measure soil surface temperature. Thus, soil temperatures measured at 3 cm and 5 cm depth are used to estimate Ts using linear extrapolation. We justify linear extrapolation given the saturated porous medium conditions.

2.3.2. The Radiatively Coupled and the Simplified Penman-Monteith Equations

In this research, the Penman–Monteith (PM) form of the combination equation is introduced by the FAO Irrigation and Drainage Paper [20], thus the full-form PM gives the “radiatively coupled” surface energy budget. A step-by-step calculation of PE according to the radiatively coupled PM (Equation (3)) over three saturated sandy textures is presented in Appendix B.
L E = Δ R n G enenrgy   term + ρ c p e s T a e / r a aerodynamic   term Δ + γ 1 + r s / r a
In Equation (3), Rn and G are calculated with the energy balance equation (Equations (A1)–(A4)), thus the dependence of T on the energy term (RnG) can be retained. In the absence of a direct measurement of T and G, another “radiatively uncoupled” simplified PM is obtained. In which Rn,l is simplified and calculated using the meteorological data according to the FAO–56 standards (Equations (A13) and (A15)). Variables needed as inputs in PM were available at a temporal resolution of 1 h. The detailed explanation regarding the computation of the radiatively coupled PM and the simplified PM can be found in Appendix B.

2.3.3. Random Forest Model

To complement the physics-based sensitivity analysis, a Random Forest (RF) regression model was applied to quantify the contributions of observed surface energy components and soil temperatures at different depths to hourly PE. Rather than replacing the analysis derived from the surface energy balance or the Penman–Monteith framework, RF exploits the joint distribution and nonlinear characteristics of observational data to provide independent empirical support for the underlying physical mechanisms.
Firstly, correlation between the concerned features was evaluated to ensure the necessity of inputting features. Then we use the Random Forest from the scikit-learn Python (3.11.9) package to build a regression model. The hyperparameters are set as follows: n_estimators = 100, min_samples_leaf = 2, max_depth = undefined, and random_state = 42. The remaining hyperparameters use their default values. The RF regression model was trained by minimizing the mean squared error (MSE), which was also known as the loss function, and the coefficient of determination (R2) between PE from observations and from the RF predictions. The dataset used to train and test the RF model was performed using 5-fold cross-validation. When constructing the decision tree, the impurity of the target variable was reduced by splitting the nodes, and by calculating the reduction in impurity before and after the splitting, the average importance (mean and its standard deviation) of each input feature to the predicted PE was obtained. It should be noted that the importance assessed by RF reflects the relative contribution of variables to the prediction within the observational dataset, rather than their absolute driving contribution.

3. Results

3.1. Potential Evaporation over Saturated Surfaces

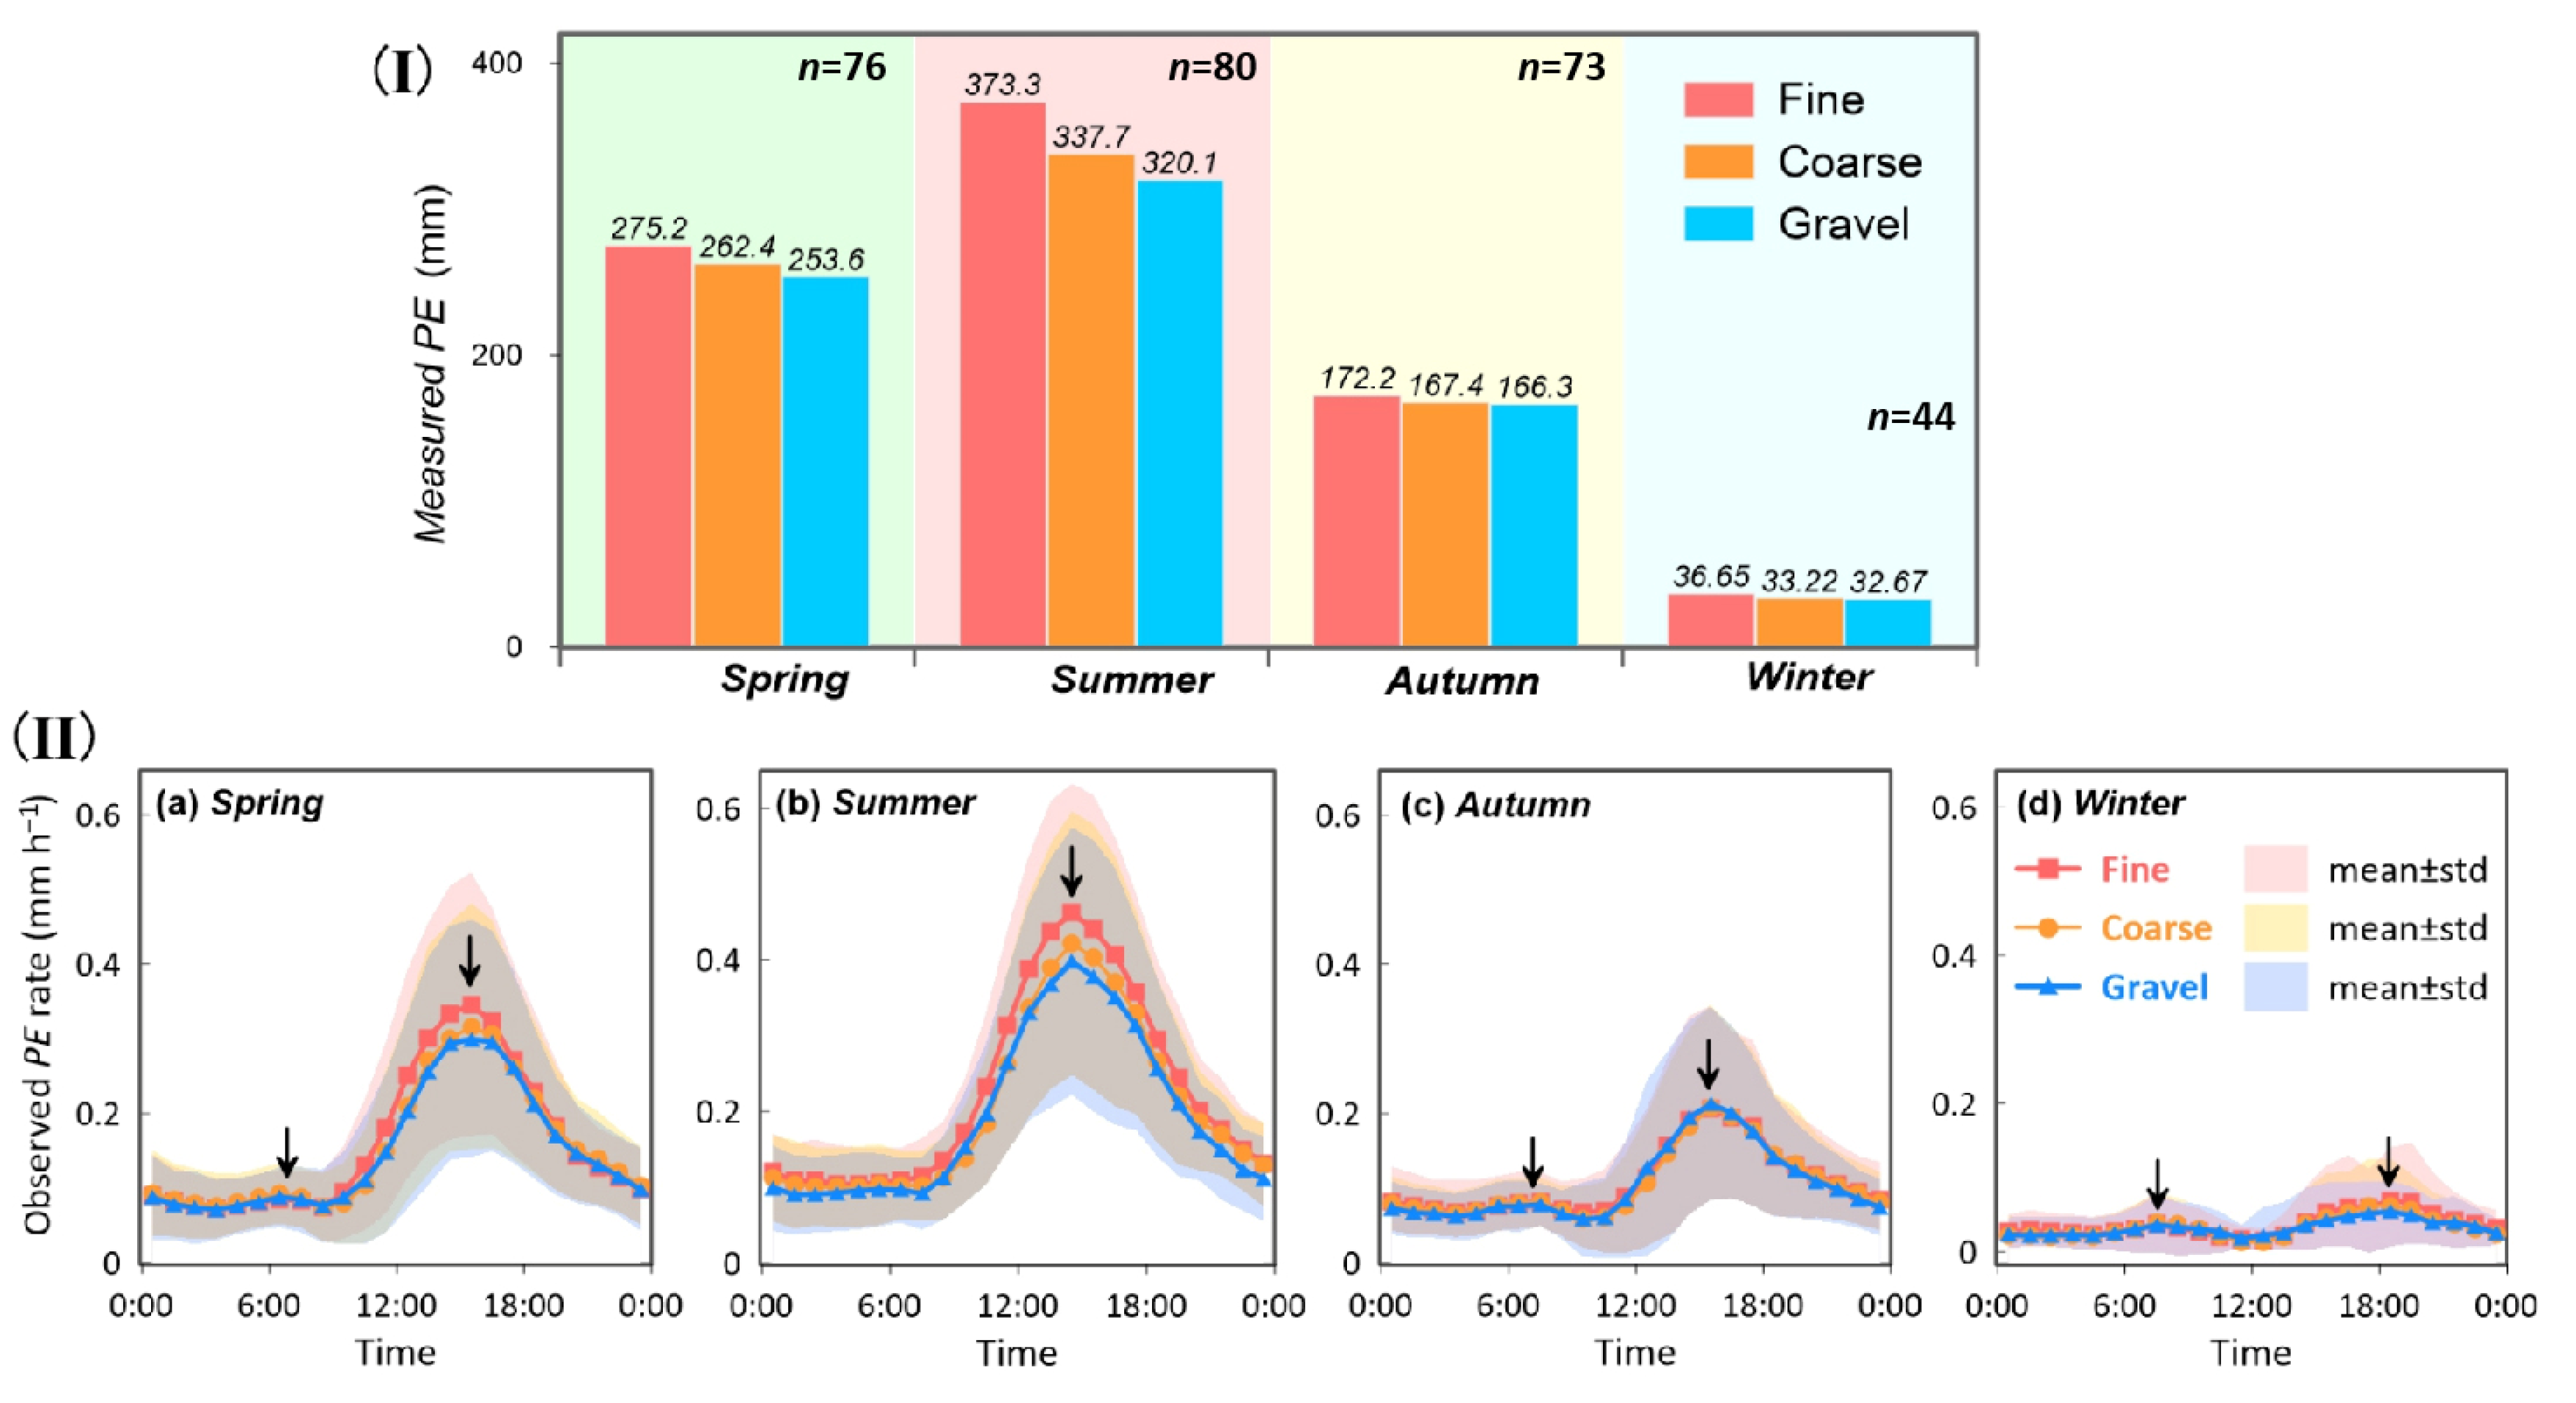
Seasonal sums of measured PE for the three saturated soil textures during the study period (September 2018 to August 2019) are presented in Figure 2I. There were clear PE differences among textures. During the measurement period, the PE values for fine sand (PEfine) are 7.1% and 11.0% higher than coarse sand (PEcoarse) and gravel (PEgravel), respectively. The highest evaporation occurred in summer (JJA). In August, for example, PEfine exceeded PEcoarse and PEgravel by 10.6% and 16.7%, respectively. In this research, the repetition test was made from May 2019 through August 2019 to test the reliability of the measured PE data (Supplementary Material S1, Figure B). The findings indicate that PE varies across the three textures in a consistent pattern for the two sets of three lysimeters.
Figure 2II illustrates the average diurnal PE cycles for the three saturated bare soils across the four seasons. The PE dynamics exhibit a clear diurnal pattern, with a daytime peak occurring approximately 2 h after noon. A secondary smaller peak appears shortly after sunrise in spring and autumn, during which PE reaches a minimum around 10:00 a.m. Measurements also revealed that nighttime PE rates are not only substantial but also exhibit a distinct diurnal pattern: they decrease post-dusk before stabilizing during the latter portion of the night. In winter (Figure 2(IId)), the PE curve displays a distinct bimodal distribution, primarily driven by freeze–thaw processes within the lysimeter columns.
Results indicated that the influence of soil texture on PE became more pronounced under high evaporation demand, particularly during daylight hours in spring and summer (Figure 2(IIa,b)). Please refer to the Supplementary Material S1 (Figure C) for the difference test results between the measured PE rates. March and August, representing spring and summer, respectively, were thus selected to conduct detailed analysis.

3.2. Soil Temperatures over Saturated Surfaces

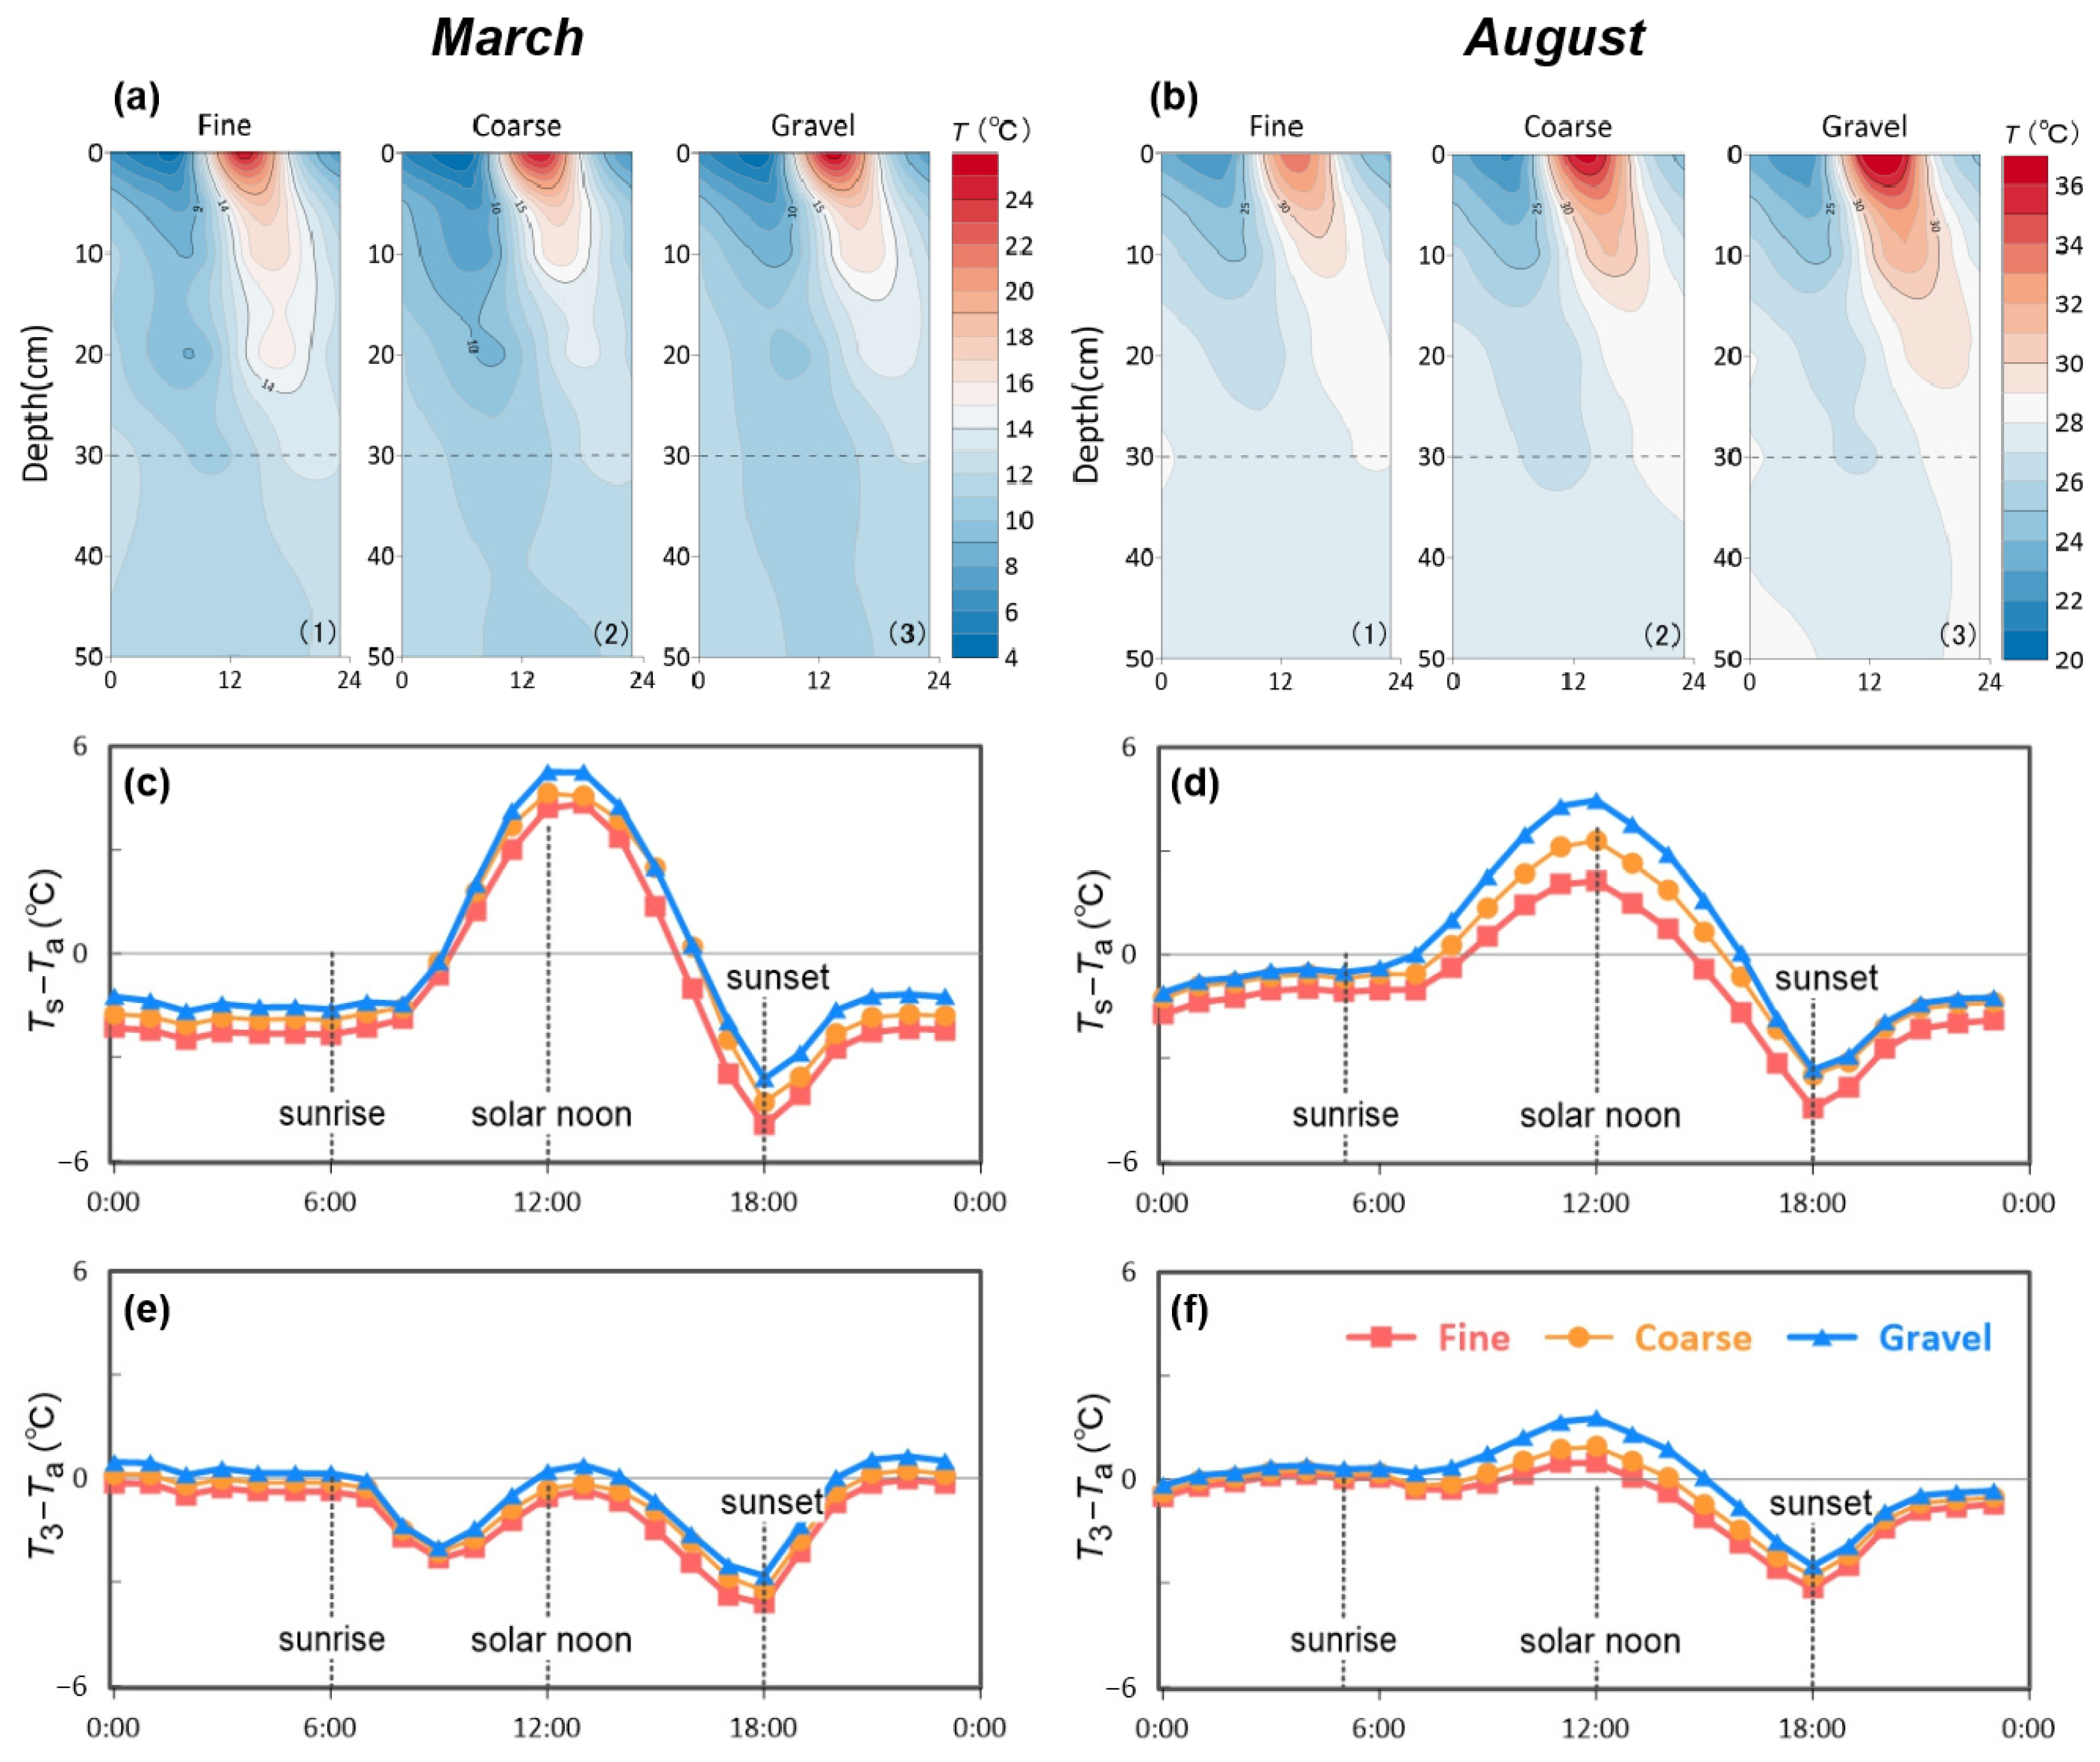
Figure 3a,b present the average diurnal variations in soil temperature along the profile for saturated fine sand, coarse sand, and gravel in March and August, respectively. Soil temperature profiles exhibited a downward time lag. The shallow soil temperatures were higher than those at greater depths at daytime. The horizontal dashed lines in Figure 3a,b represent the thermal penetration depth (δ), beyond which soil temperature fluctuations are substantially attenuated. Across all three saturated sandy soils, δ reached approximately 30 cm in both March and August.
Figure 3c–f shows the average diurnal cycles of the temperature differences between surface temperature and air temperature (TsTa) and between soil temperature at 3 cm depth and air (T3Ta) across the three saturated textures for March (Figure 3c,e) and August (Figure 3d,f), respectively. The amplitudes of |TsTa | and |T3Ta | for the three textures were smaller in August than in March. This is likely due to the higher thermal inertia of wet soils in summer, resulting from prior heat accumulation and leading to more gradual temperature fluctuations compared to early spring. Besides this, notable differences in surface temperature were observed among three textures. Gravel exhibited more pronounced fluctuations, particularly during sunrise and sunset. On a daily basis in August, (TsTa) for gravel was 0.4 °C and 1.2 °C higher than that for coarse sand and fine sand, respectively.

3.3. Surface Energy Balance Components

3.3.1. Energy Balance Components in the Surface Energy Balance Equation

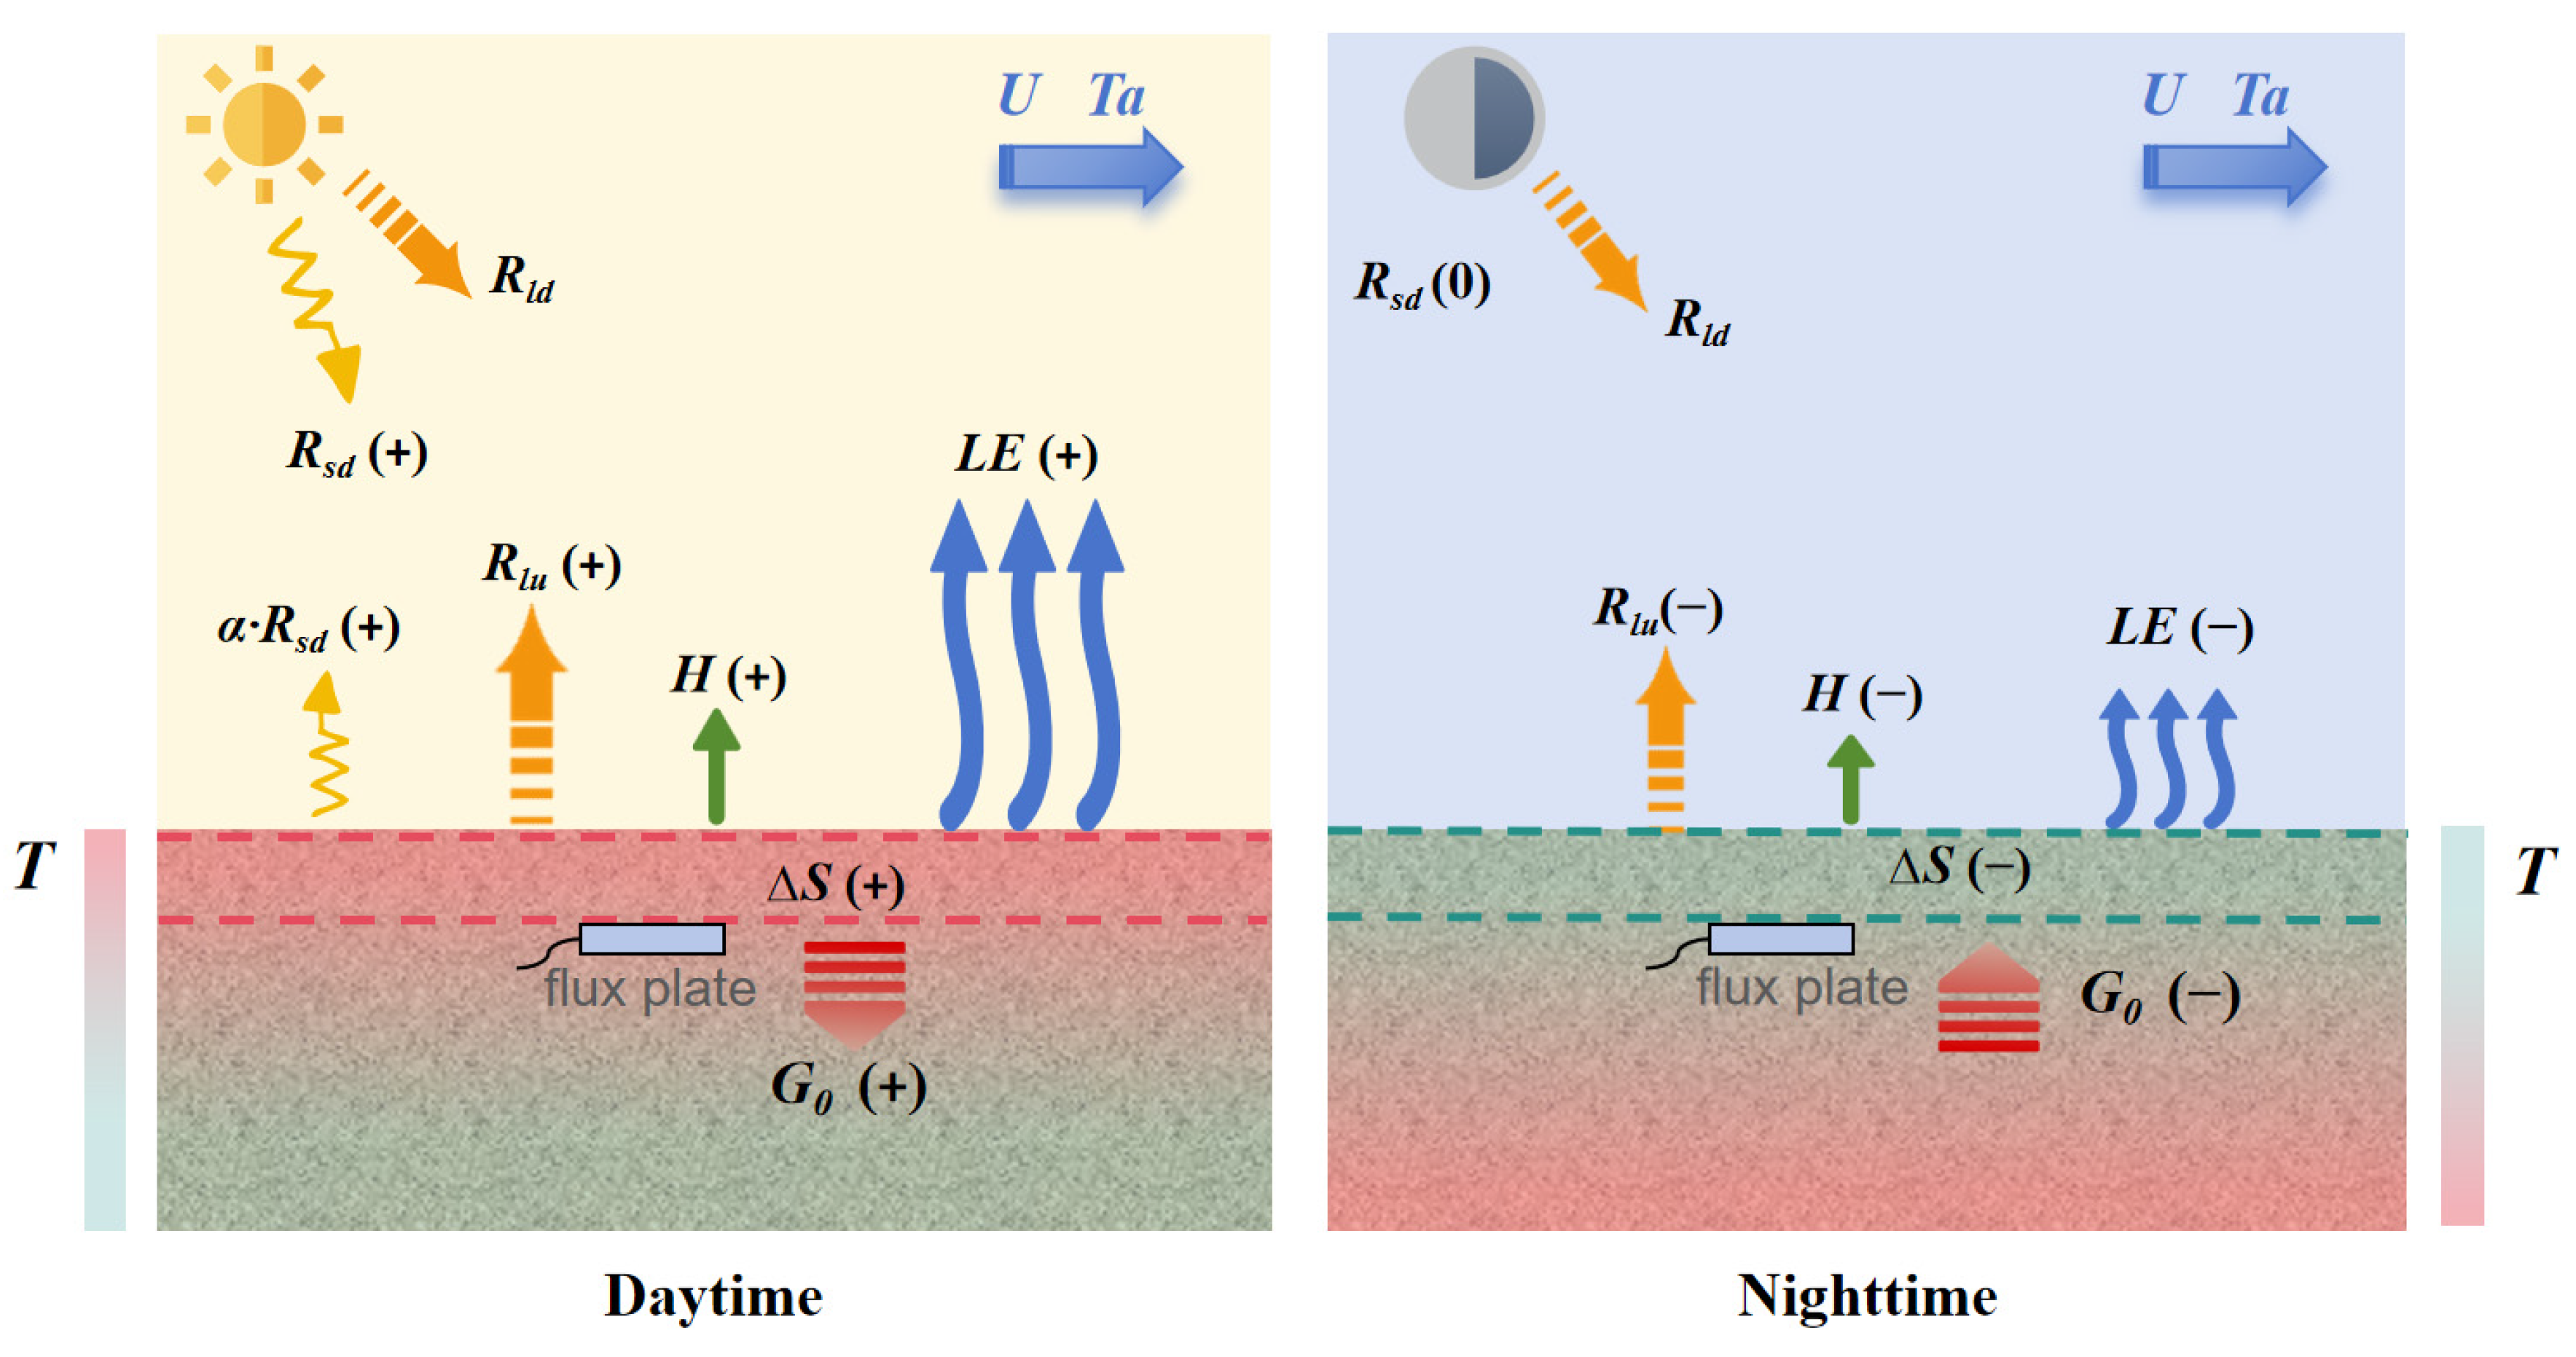
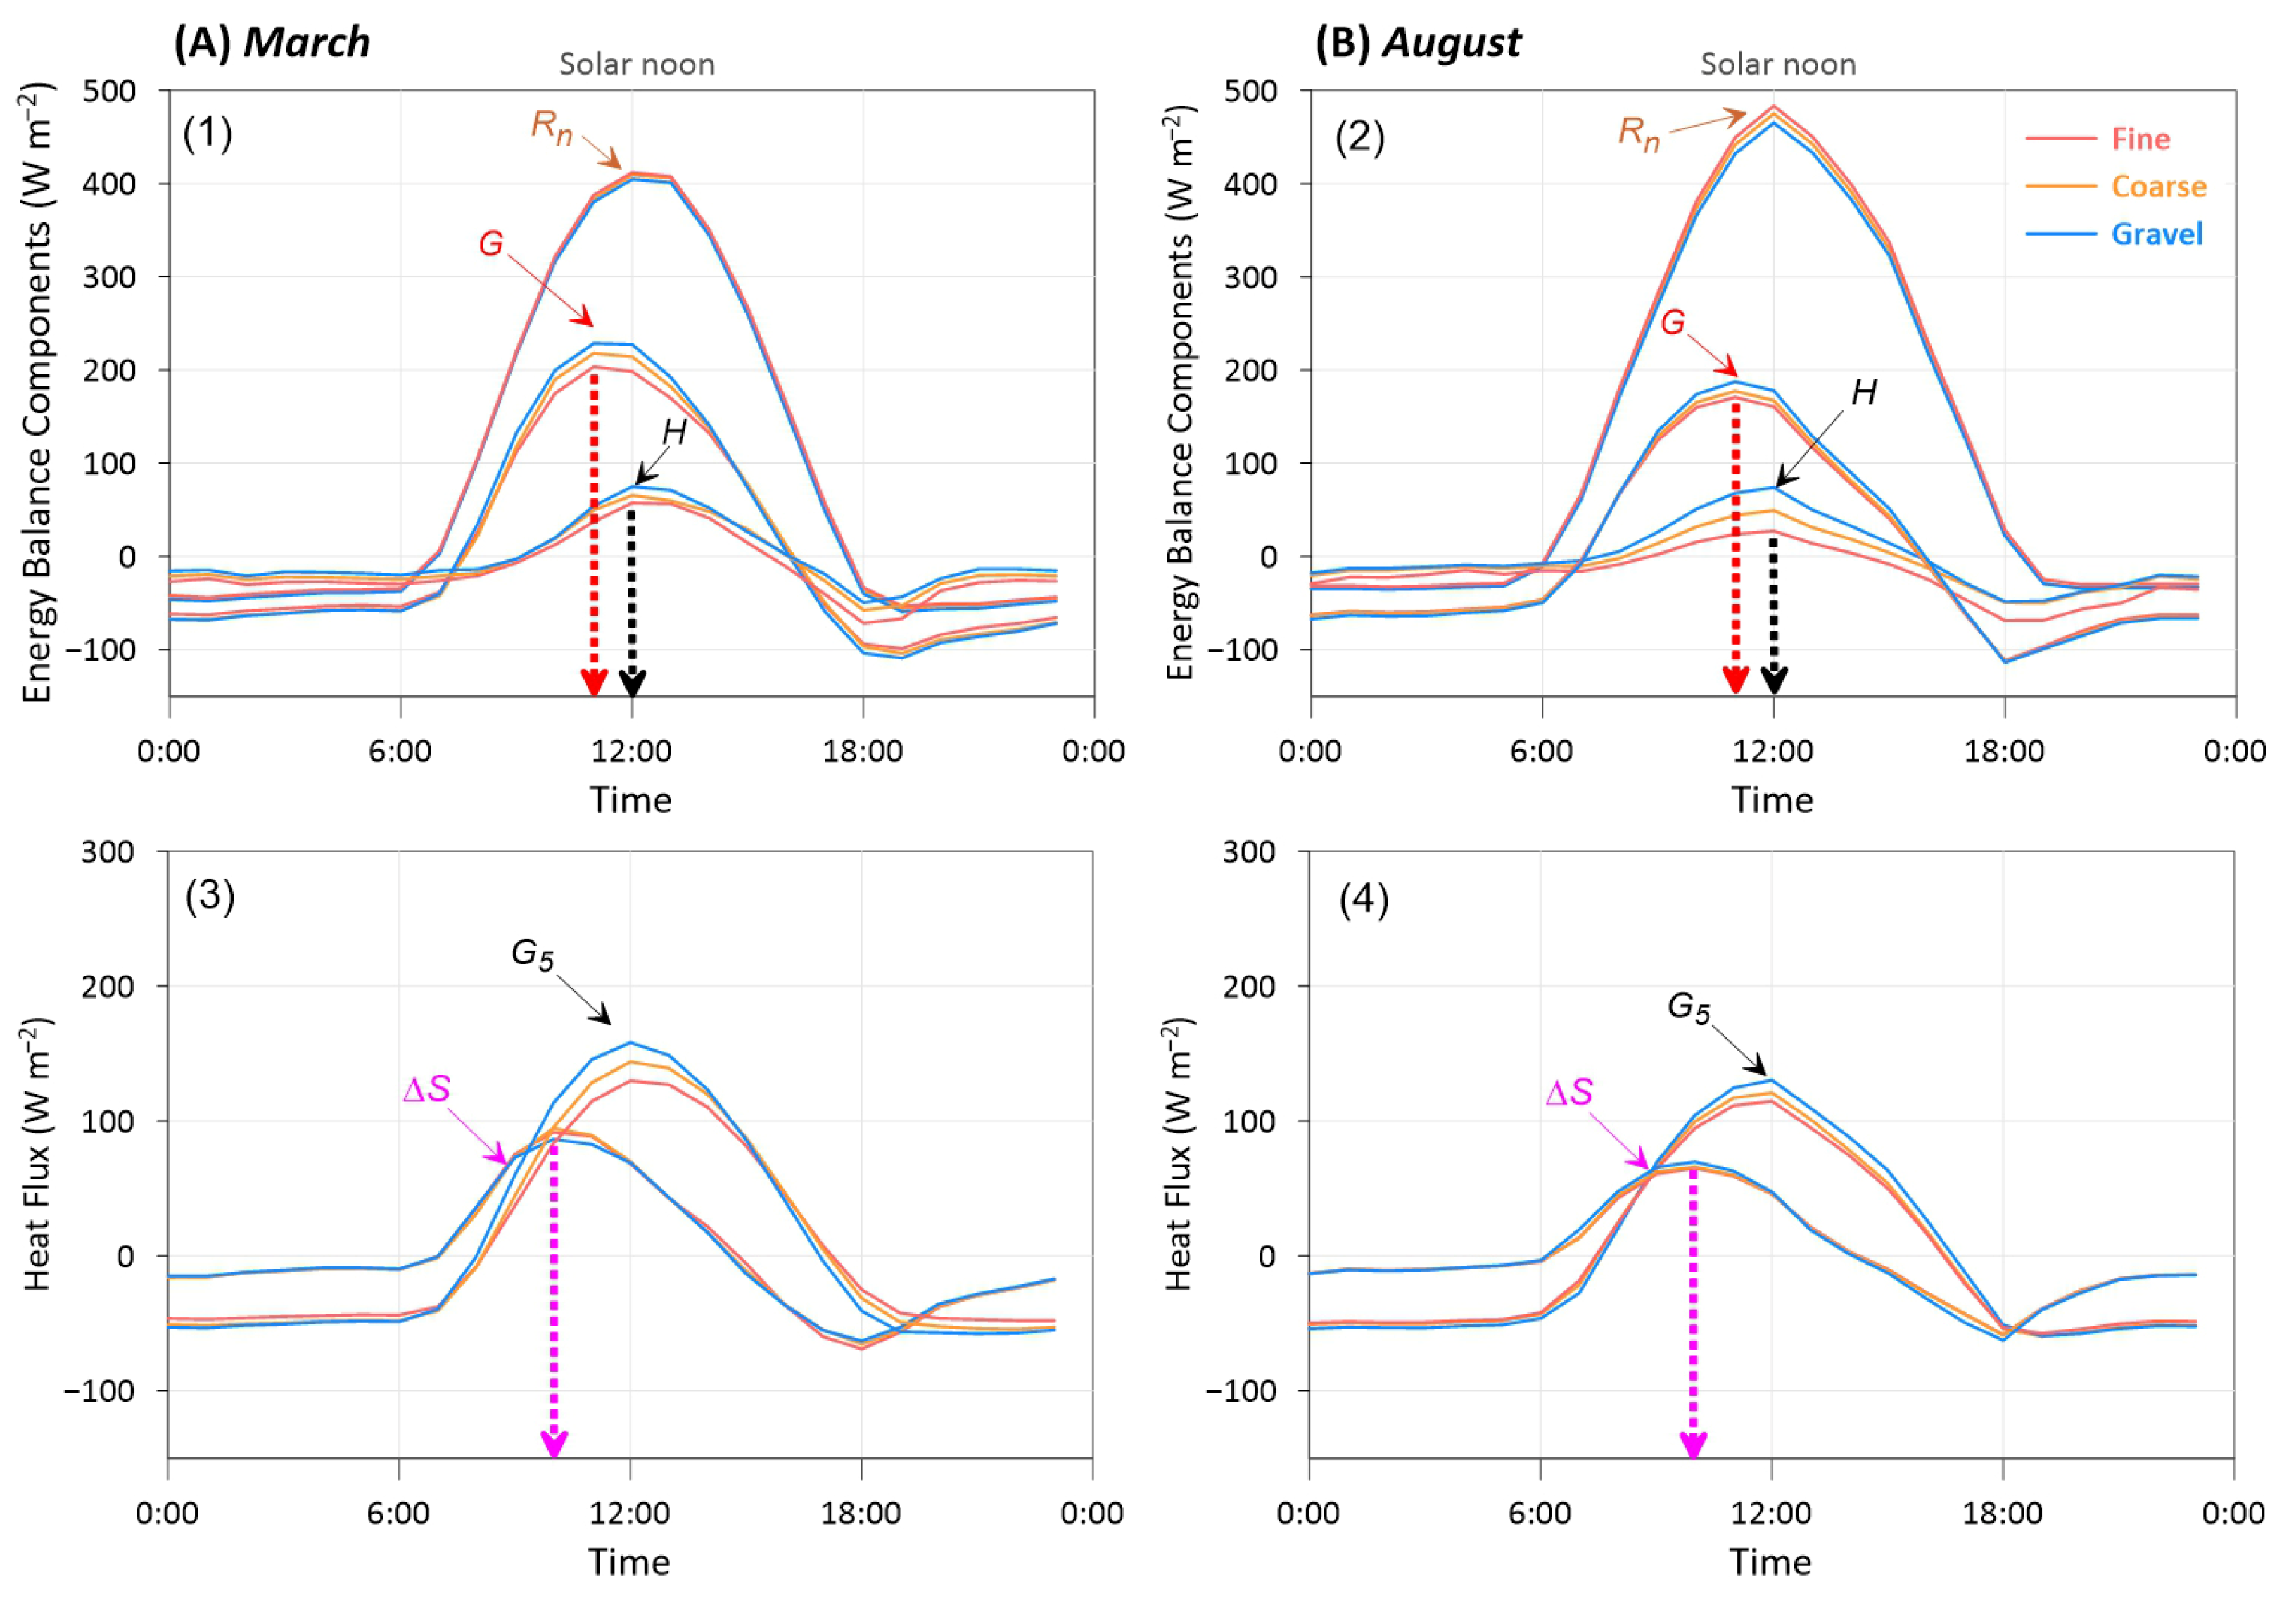
A conceptual diagram illustrating the energy balance components over a saturated bare surface during daytime and nighttime is presented in Figure 4. Figure 5 displays the average diurnal cycles of surface energy balance components, including net radiation (Rn), total ground heat flux (G), and sensible heat flux (H) over saturated fine sand, coarse sand, and gravel in March (Figure 5A) and August (Figure 5B).
A. 
Net radiation (Rn)
Net radiation (Rn) represents solar energy for evaporation. Therefore, its value exceeds that of the other energy flux components. As shown in Figure 5, the Rn curve exhibits a bell-shaped pattern, with its peak value occurring at 12:00. The curve was broader in August than in March, reflecting the longer duration of sunlight exposure in summer. Based on the measurements, gravel is higher in both albedo (which diminished its Rn,s) and Ts (which enhanced the Rlu), resulting in the lowest Rn compared to the other textures.
B. 
Total ground heat flux (G5 + ∆S)
Total ground heat flux G represents energy partitioning within the surface layer. G is composed of heat flux measured by the plates (G5) and heat storage variation above the plate (∆S). Figure 5(3,4) displays the average diurnal cycles of G5 and ∆S over saturated fine sand, coarse sand, and gravel in March and August.
G5 is influenced by soil thermal properties (including heat conductivity and thermal inertia) as well as temperature variations in the soil profile ∂T/∂z [29,30]. In March, the average temperature differences within the soil profile reached up to 14 °C (Figure 3a), whereas this value decreased to approximately 8 °C in August (Figure 3b). Consequently, the amplitude G5 is slightly higher in March than in August. ∆S is determined by soil heat capacity and shallow surface temperature variation (Equation (A3)). Due to more pronounced fluctuations in shallow surface temperature in March (Figure 3), the amplitude of ∆S curves is correspondingly higher in March compared to August.
The amplitude of G5 for gravel is larger than coarse sand and fine sand over a sub-daily scale (Figure 5). This is attributed to the higher heat conductivity of gravel (Table S1 in Supplementary Material) and its more pronounced surface temperature fluctuations (Figure 3). Besides this, G5 and ∆S exhibited distinct diurnal patterns. The G5 curve resembles more the Rn-curve. Whereas the ∆S curve displayed a centrosymmetric form. ∆S reached its peak approximately 2 h before G5 (Figure 5, indicated by the purple dotted arrow), and its diurnal integral approximates zero. The estimated variation in ∆S across different soil textures was minimal (Equation (A3)).
C. 
Sensible heat flux (H)
Sensible heat flux (H) represents the exchange of heat at the interface between the surface and atmosphere (i.e., TsTa). Figure 5(1,2) shows the average diurnal cycles of the calculated H for different soil textures in March and August. For all saturated textures, H was positive (TsTa > 0) during the daytime (9:00–15:00) because heat was transferred from soil to air. At night, H became negative as heat was transferred from the overlying air to the soil surface. Among the three textures, gravel exhibited the highest H value. This was attributed to its higher surface temperature variability.

3.3.2. Energy Balance Components in Two Variants of the Penman-Monteith Equations

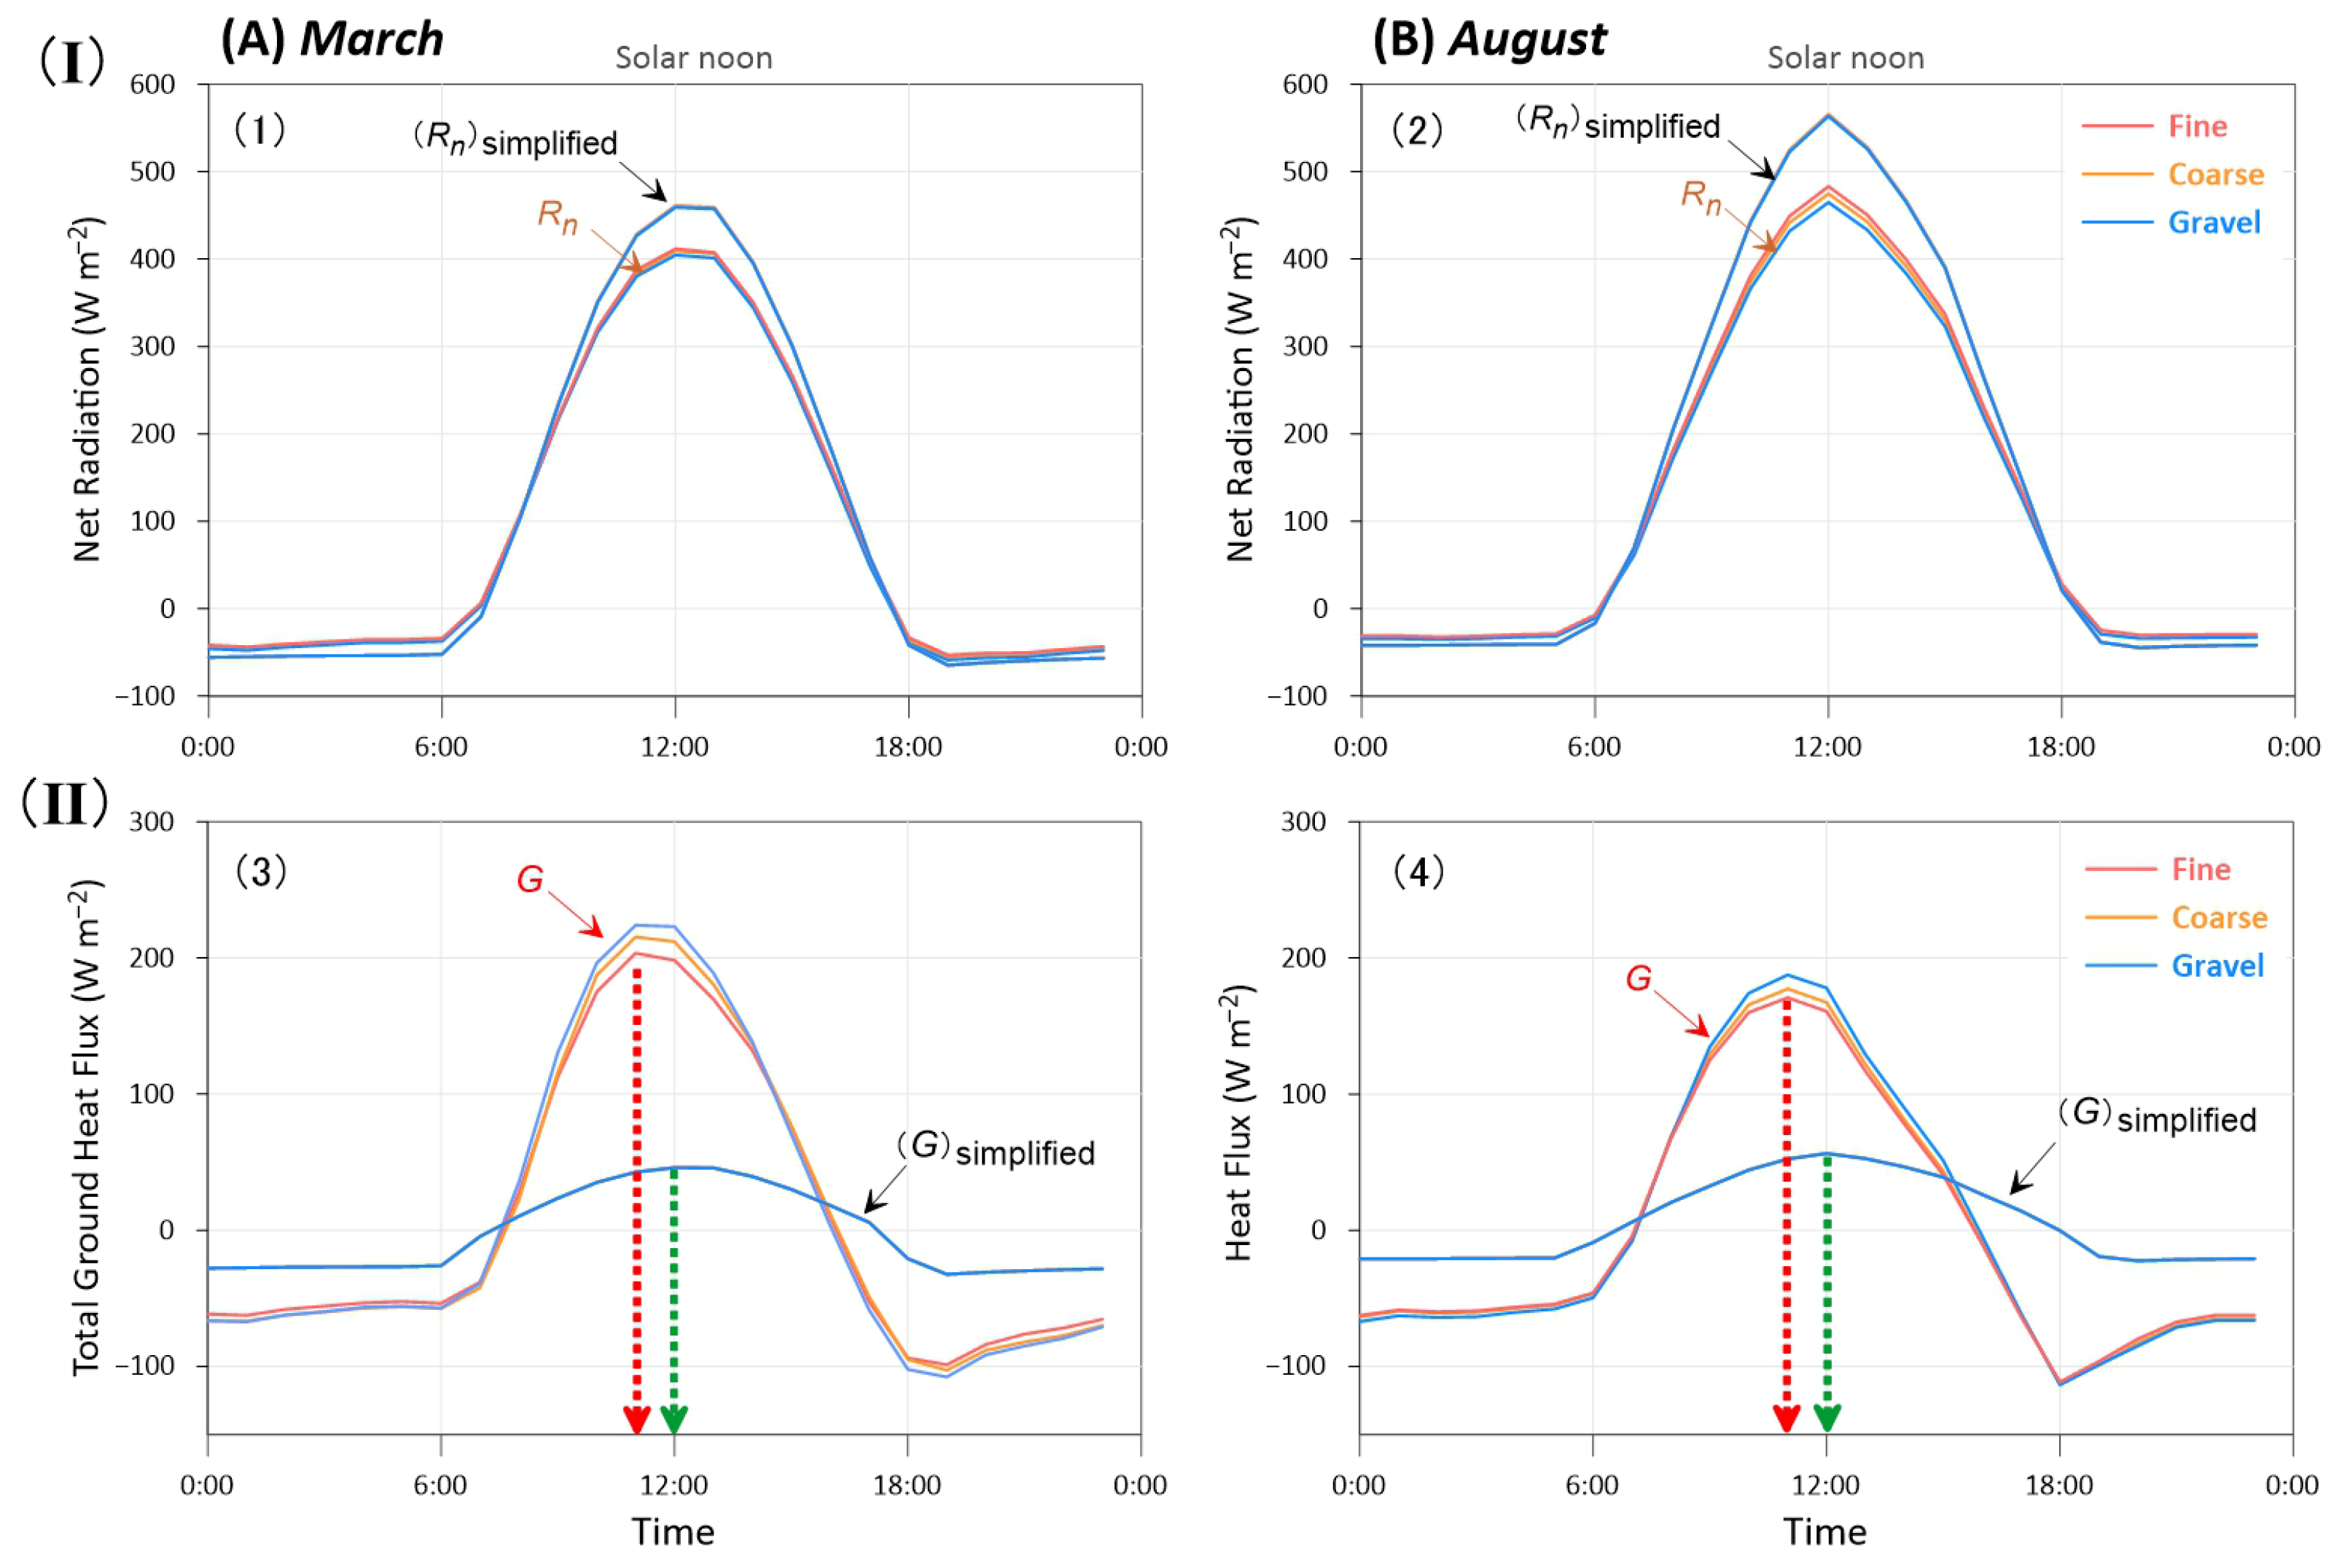
Figure 6 displays the average diurnal cycles of Rn and G for different textures as derived from radiatively coupled PM and from simplified PM, respectively, for March and August.
Following the FAO-56 guidelines, the simplified PM derives simplifie net longwave radiation (Rn,l)simplified and ground heat flux Gsimplified using meteorological data. Consequently, the differences between (Rn)simplified and Gsimplified across different textures were minimal (Figure 6). The amplitude of (Rn)simplified derived from the simplified PM is greater than that obtained from the energy balance method (Figure 6(1,2)). While the amplitude of Gsimplified, derived as the fraction of Rn, was notably lower than G obtained from the energy balance method. Besides this, Gsimplified and G differ in their temporal patterns. Gsimplified resembles the Rn-curve; it fails to capture the phase-advance feature exhibited by G (red dotted arrow).

3.4. Model Verification and Comparison

Potential evaporation was estimated using the surface energy balance equation (Equation (1)), the radiatively coupled PM (Equation (3), which considered the influence of T on Rn,l and G) as well as the simplified PM (in which Rn,l and G were determined by meteorological data, using Equation (A13)–(A15)). Model performance was evaluated by comparing estimated daily and hourly PE rates against lysimeter measurements.

3.4.1. Daily Scale Evaluation

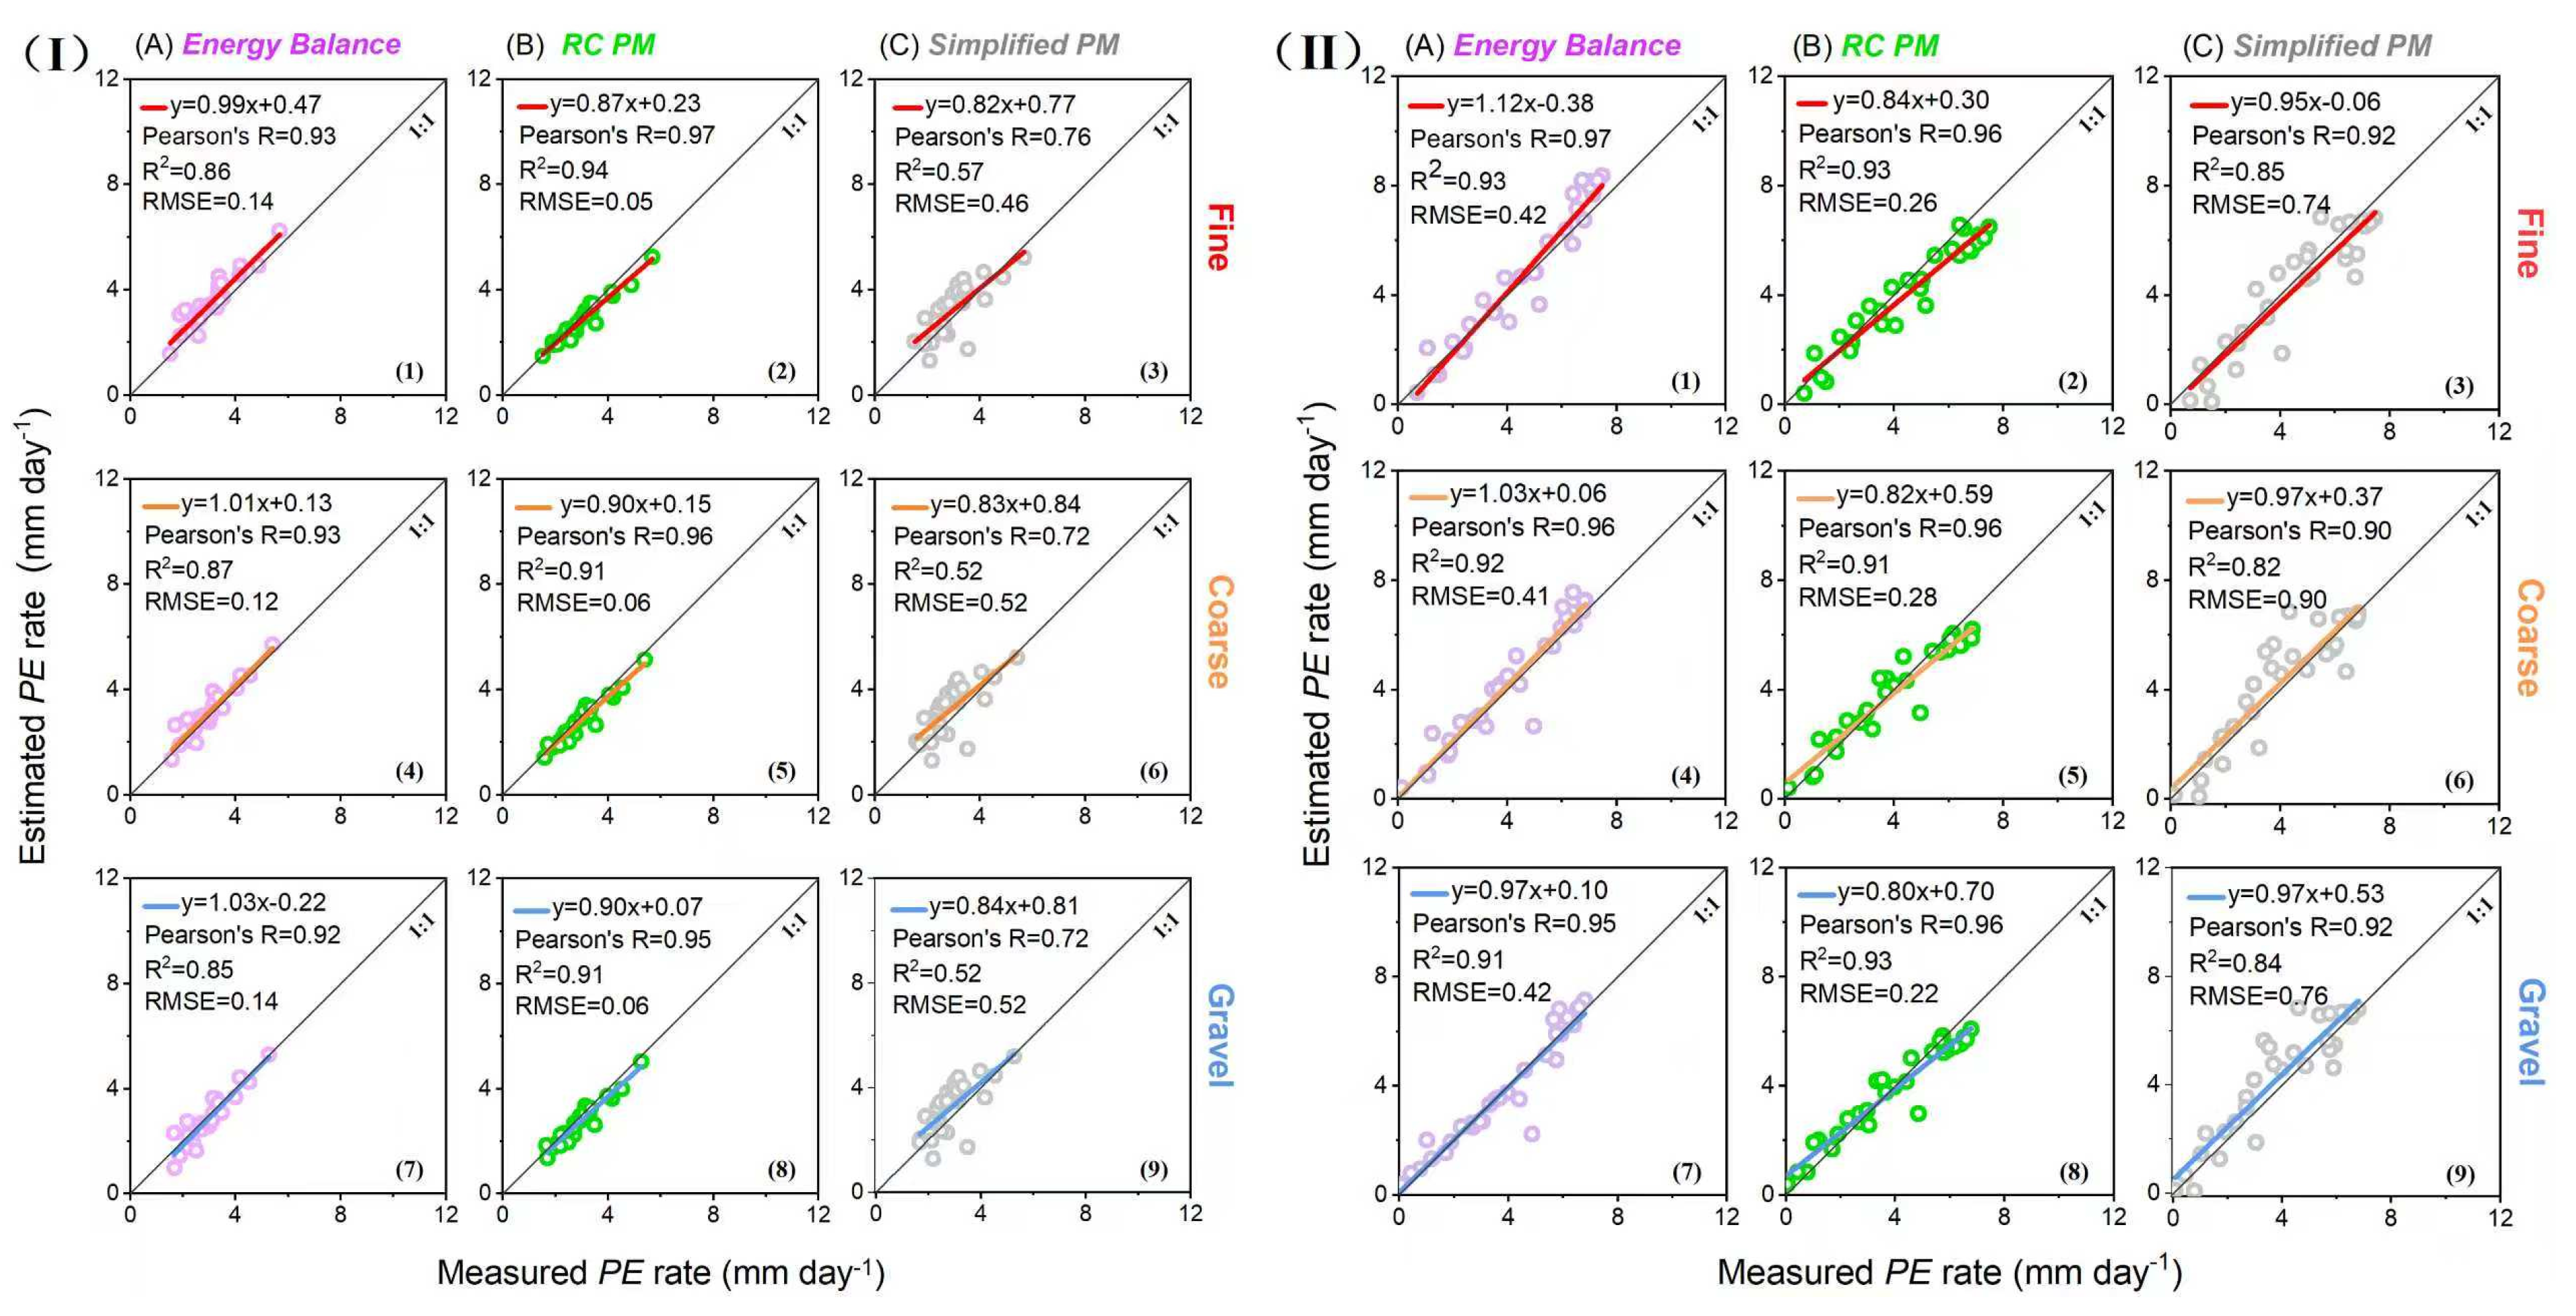
Scatter plots of the estimated and measured daily PE rates for fine sand, coarse sand, and gravel in March (Figure 7I) and August (Figure 7II) are shown in Figure 7. Both the energy balance method (Figure 7A) and the radiatively coupled PM (Figure 7B) demonstrate a strong capability in estimating daily PE. In contrast, the simplified PM produced the largest deviations from the measured values, as reflected by its lower R2 and Pearson’s R and a higher RMSE value compared to the other two methods (Figure 7C).
This study focused on investigating the differences in PE across textures. The measured and estimated PE differences between saturated textures (PEfine-PEcoarse and PEcoarse-PEgravel) were compared, as illustrated in Table 2. All three methods consistently indicated that PE is highest for fine sand, lower for coarse sand, and lowest for gravel. Among the methods, the energy balance approach most accurately reproduced PE differences in August. In March, the radiatively coupled PM method yielded more accurate PE difference estimates, with smaller deviations between observed and modeled values. In contrast, the simplified PM significantly underestimated PE differences between textures in both March and August.

3.4.2. Hourly Scale Evaluation

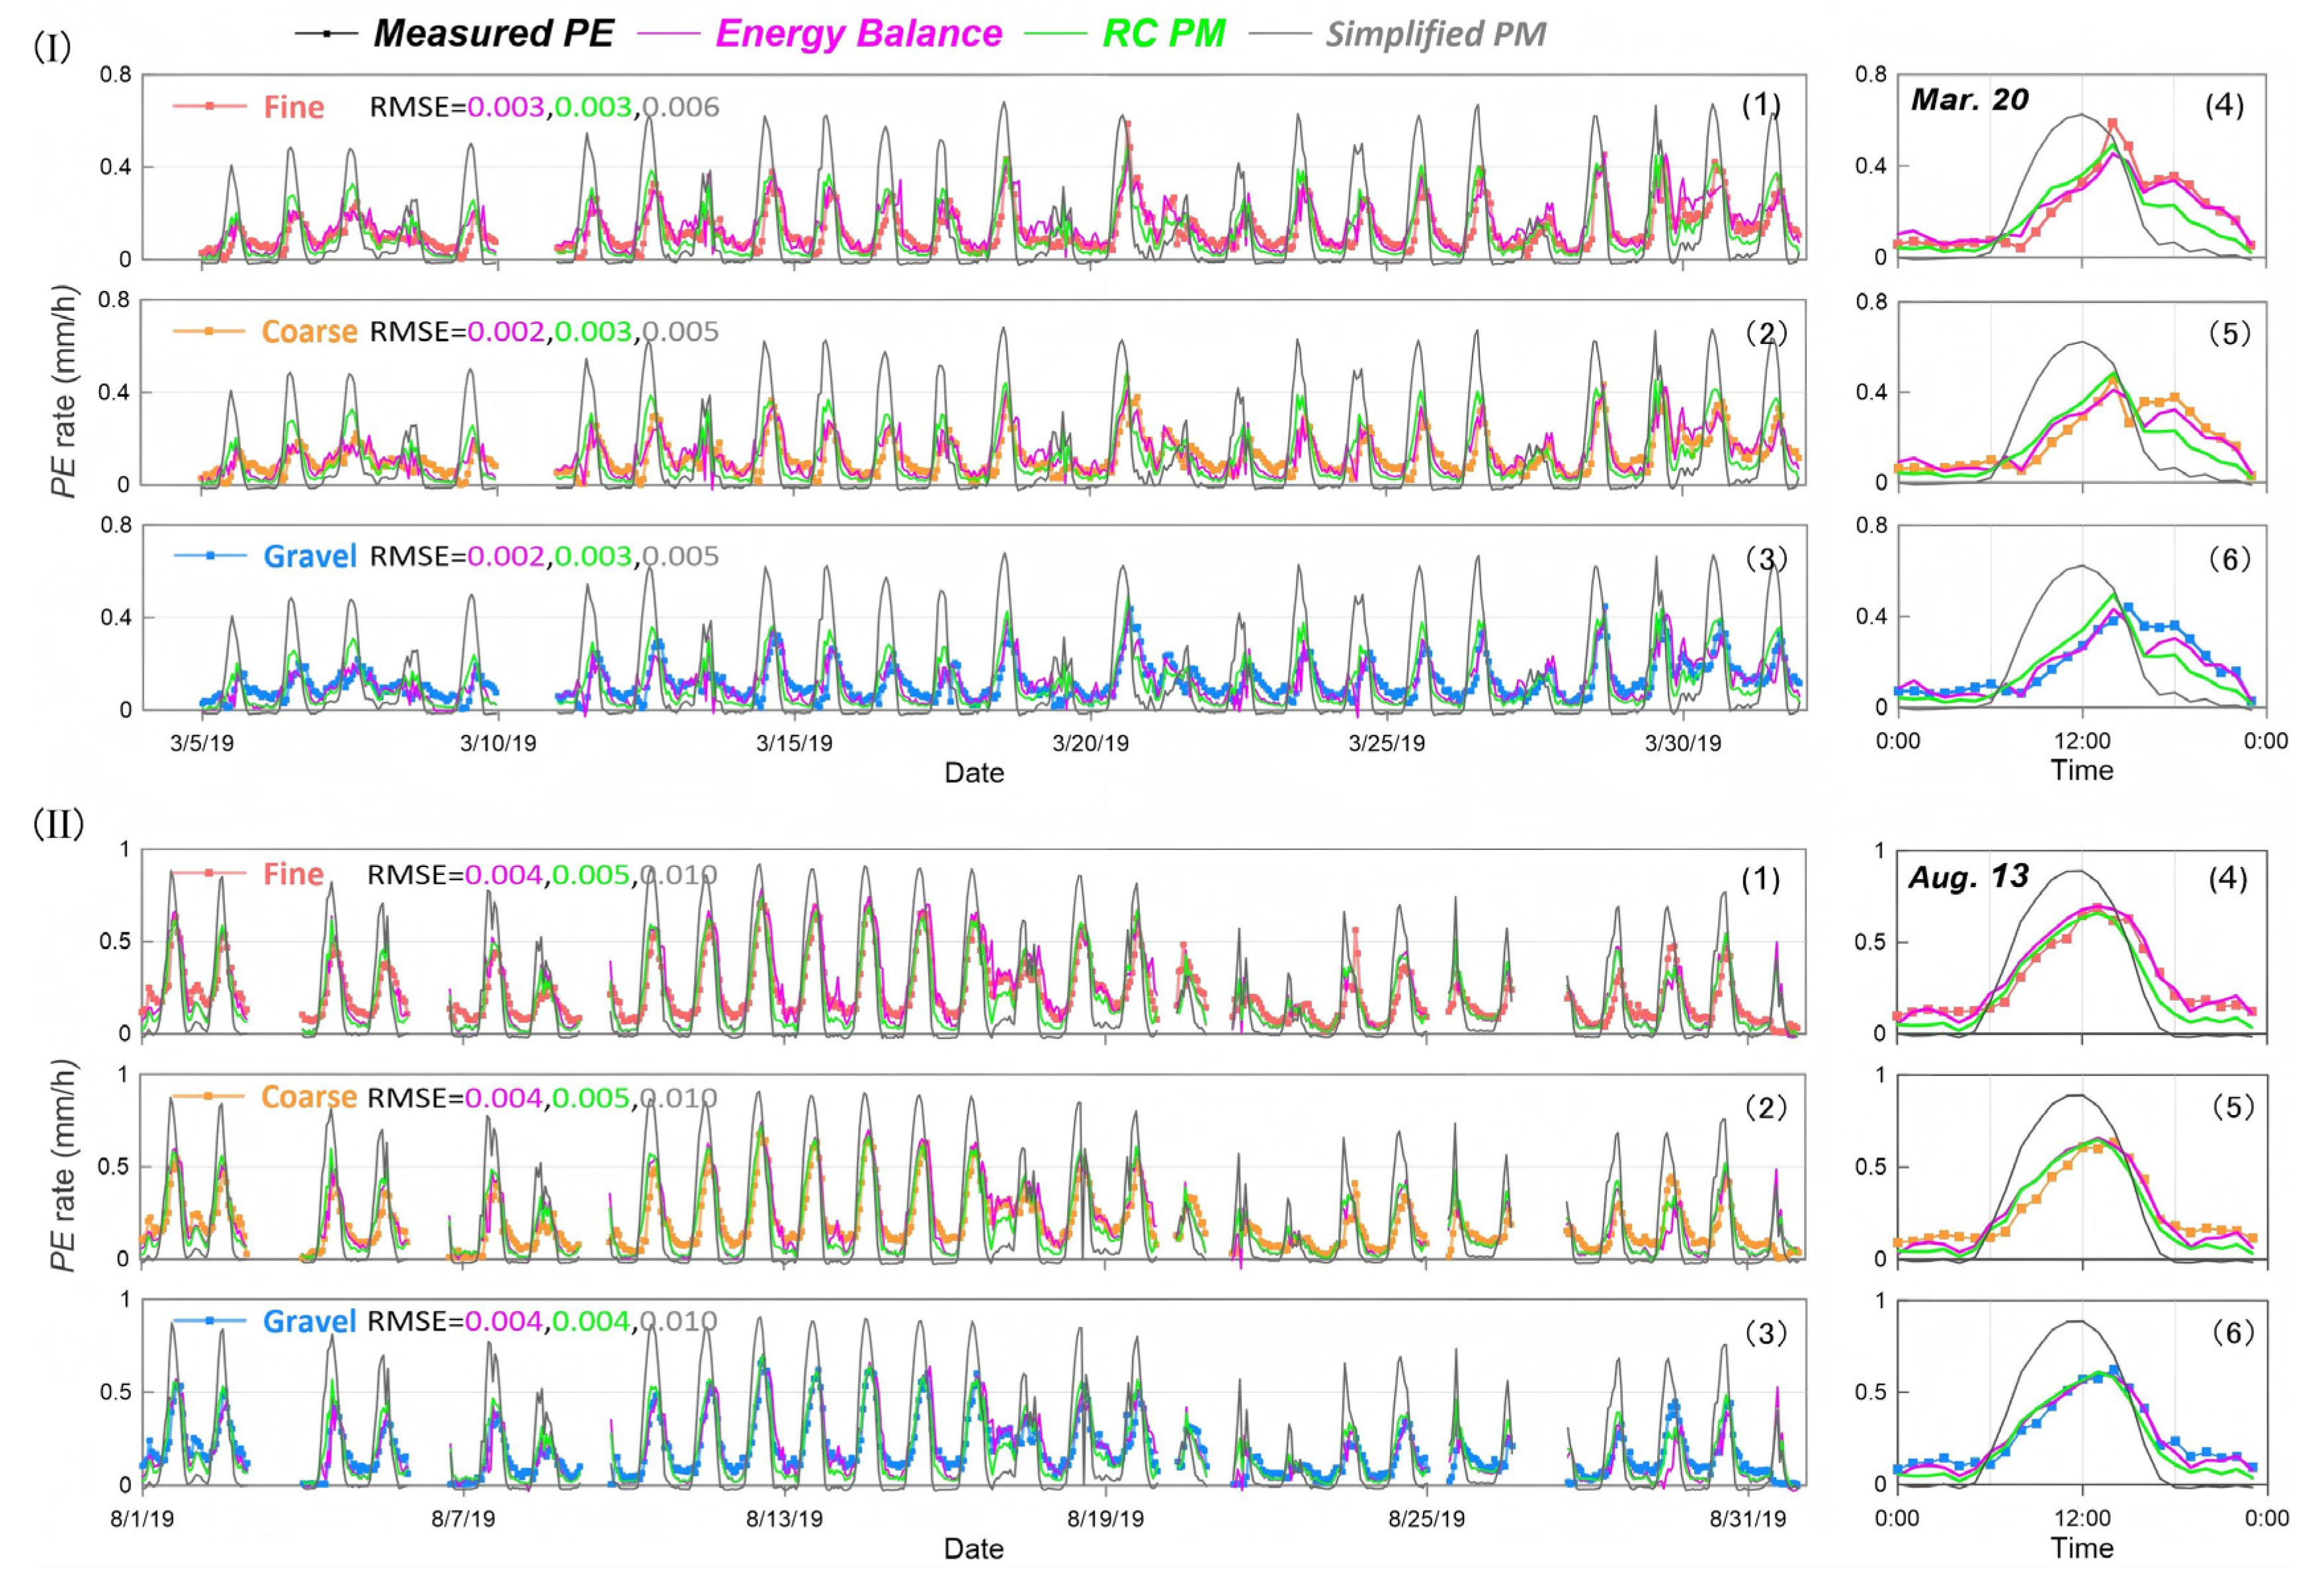
Figure 8 displays the measured and estimated hourly PE series for the three saturated soil textures in March (Figure 8I) and August (Figure 8II). The corresponding diurnal variations on the hottest days of each month are shown in the right column (Figure 8, panels 4–6).
The measured diurnal PE cycles can be well described by both the energy balance method (purple curve) and the radiatively coupled PM (green curve). These two methods have advantages in estimating PE dynamics. However, the simplified PM (black curves) performed poorly (higher RMSE) compared with the measurements. It tended to overestimate PE during the daytime and underestimate PE after sunset, with nighttime PE estimates even showing negative values. This is mainly caused by the fact that Gsimplified is underestimated during the daytime and overestimated (less negative value) at night (Figure 6). Moreover, the simplified PM model exhibited a phase shift in PE dynamics, with the estimated peak evaporation occurring significantly earlier than the observed PE peak.

3.4.3. Contribution of Soil Temperature to Changes in PE

Leveraging high-precision field measurements, we applied a data-driven random forest (RF) regression model to predict PE across three saturated soil textures to evaluate the contribution of each influencing factor to changes in PE. The model utilized energy balance components (i.e., Rn,s, Rn,l, G5, ∆S, and H) along with soil temperature profiles (T at 6 depths) as input features. Hourly data were collected during March and August. Prior to model training, a Pearson correlation analysis was conducted to identify and mitigate multicollinearity among the input variables; results are shown in Supplementary Material S3 (Figure E). Based on the correlation matrix, Rn,l, T3, T5, and T10 were excluded because of their strong collinearity with the other variables. Finally, 8 features were retained for the RF model inputs (i.e., Rn,s, G5, ∆S, H, Ts, T20, T30, and T50).
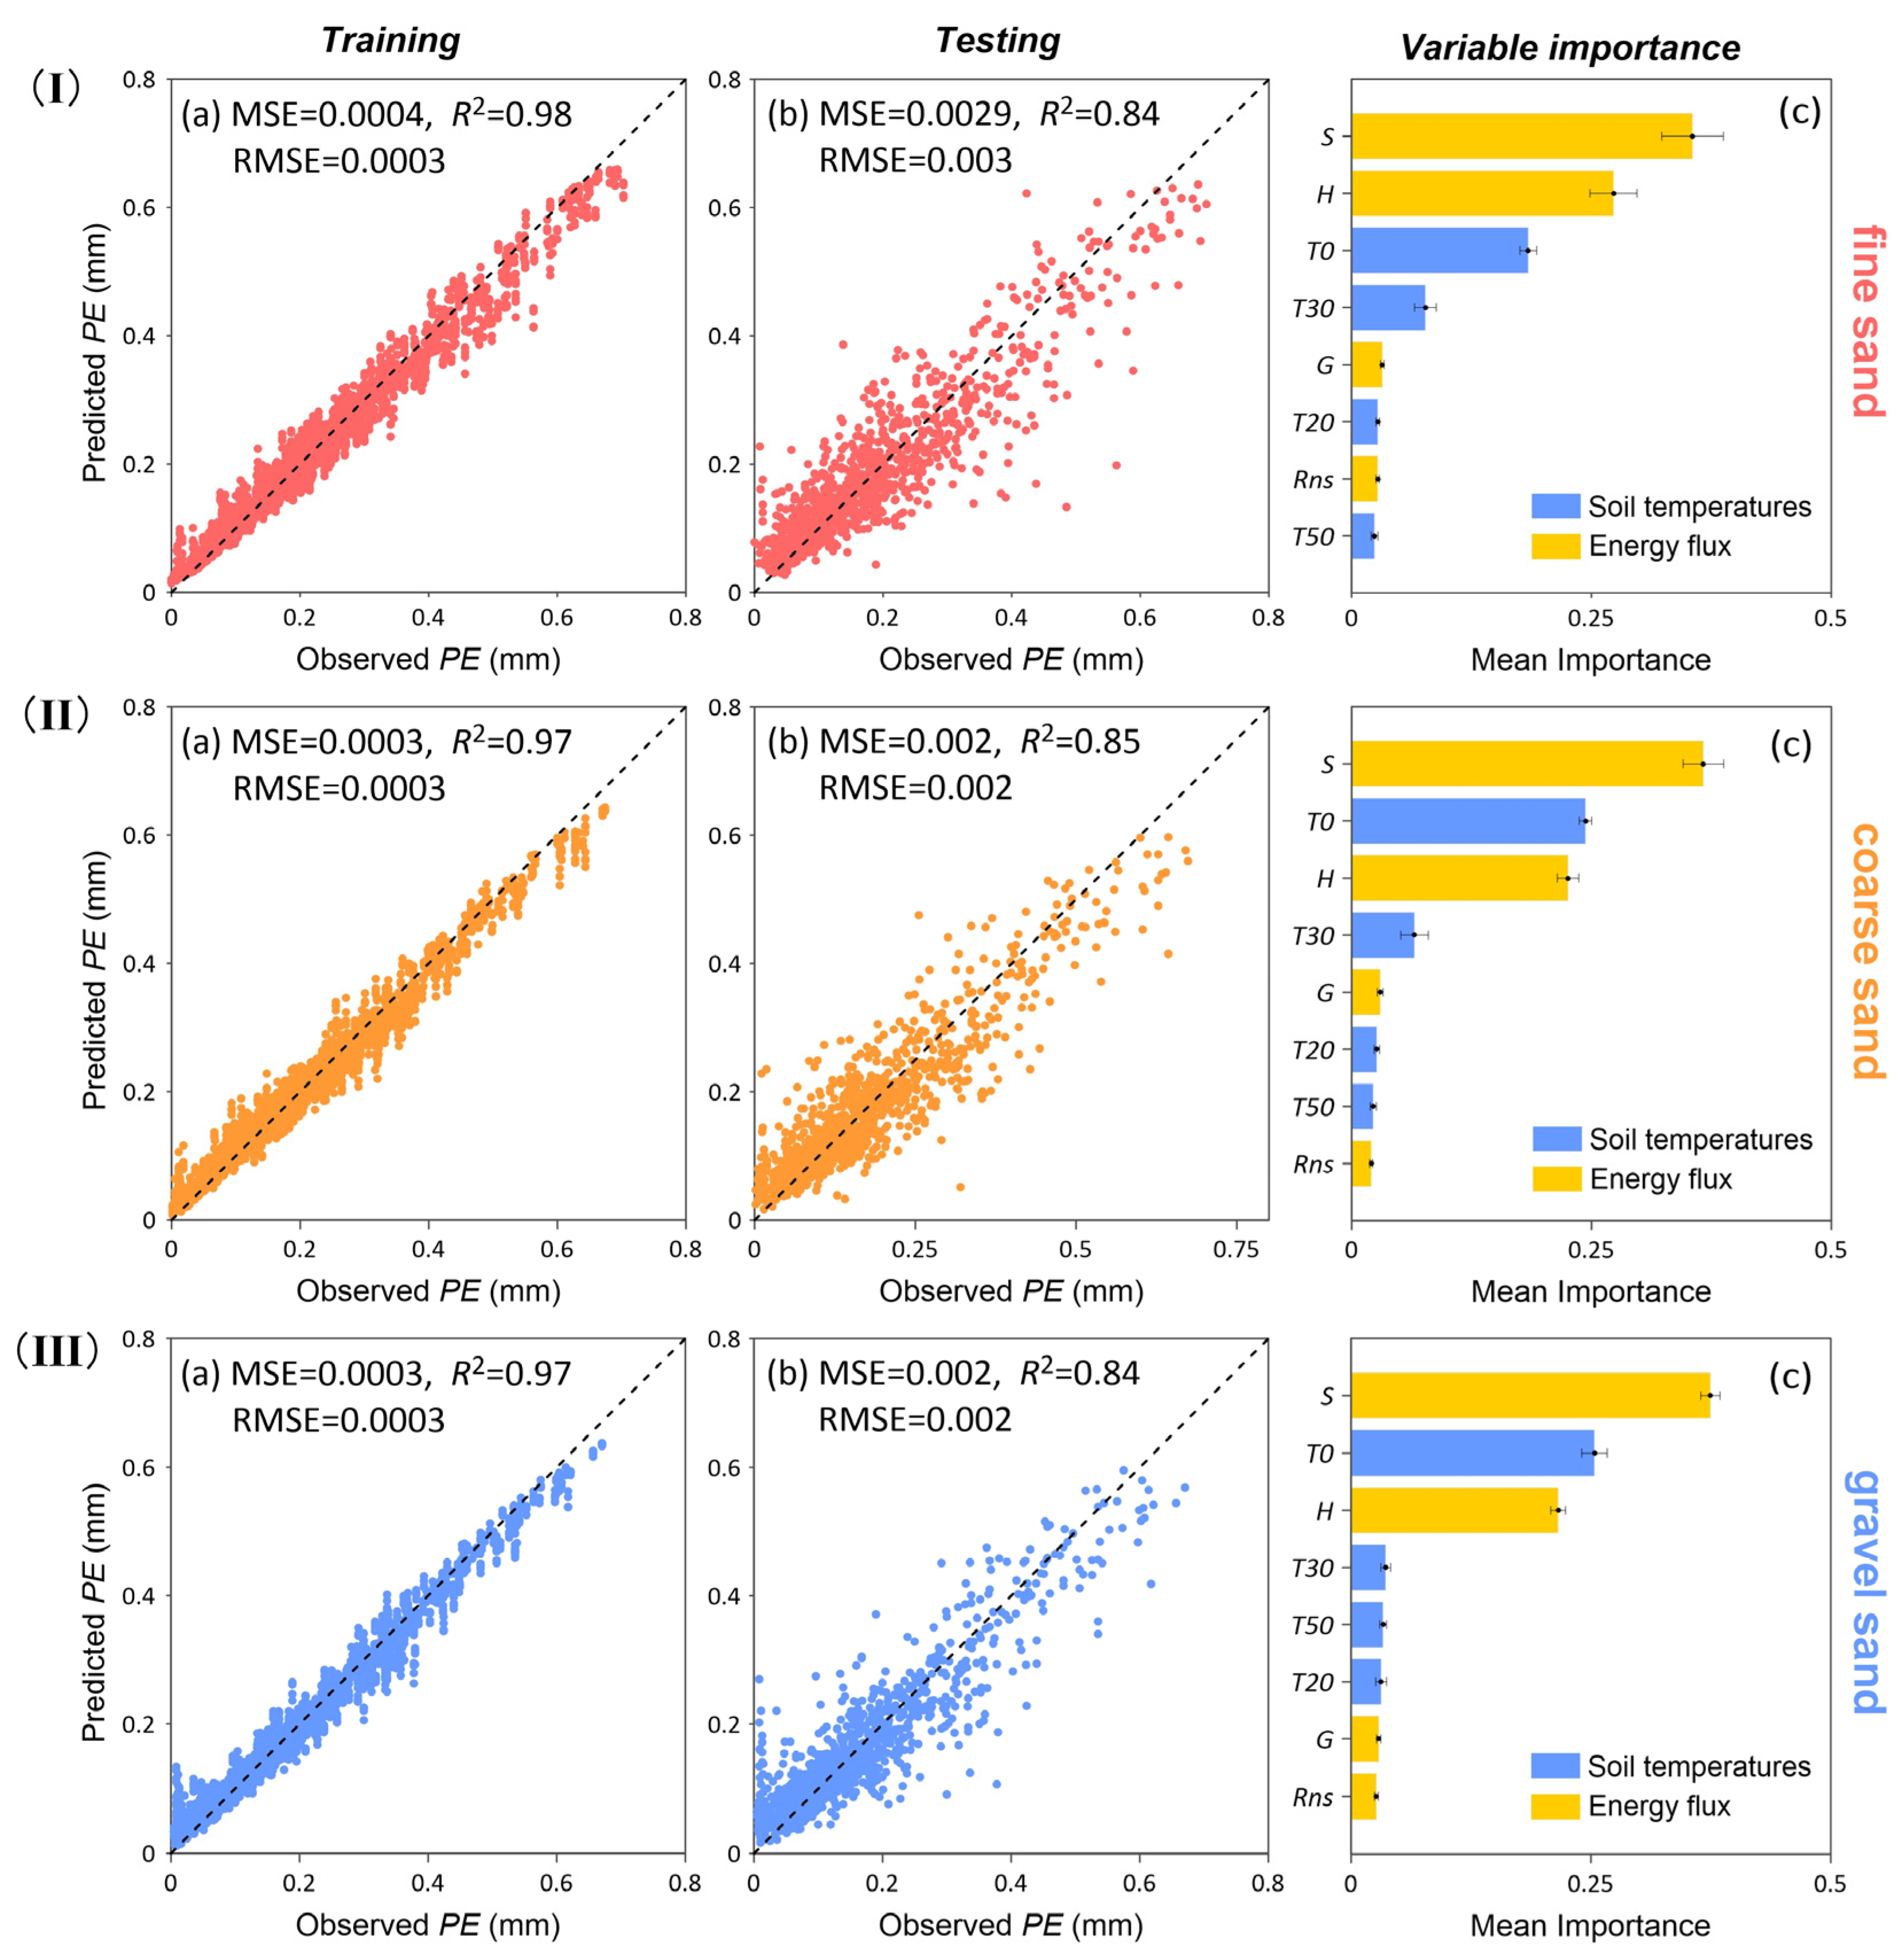
Figure 9 presents a comparison between the measured and predicted hourly PE. The random forest (RF) model achieved excellent performance during training, with a mean squared error (MSE) of 0.0004 and a coefficient of determination (R2) of 0.97 (Figure 9a). Validation analysis using independent test sets confirmed the model’s robustness, yielding an R2 of 0.84 (Figure 9b).
Based on a 5-fold cross-validation, the contribution of each input variable to the predicted PE was fully quantified for all sample sets in order of characteristic importance attributes (bar charts in Figure 9c). Among the 8 input variables, ΔS (heat storage variation above the heat flux plate, calculated from ∂T3/∂z and soil heat capacity cs) demonstrated the highest mean feature importance (0.37), followed by Ts (0.24) and H (0.23) (Figure 9c).

4. Discussion

4.1. Influence of Soil Temperature on Energy Partitioning in Evaporation Process over Saturated Surfaces

Our results revealed that T influences the PE rate by modulating the surface energy budget. As the conceptual diagram presented in Figure 4 illustrates, the differences in PE over different soil textures can be explained based on energy balance considerations.
During daytime, albedo (α) determines the net shortwave radiation (Rn,s) for evaporation. α is mainly influenced by soil surface color and moisture content. Fine sand, which had the lowest α (Table S1 in Supplementary Material), received the highest Rn,s for evaporation. Soil properties such as porosity, heat conductivity, and heat capacity affect vertical soil temperature gradients (∂T/∂z), which in turn determine the energy partitioning for evaporation (Rn-G-H). For example, gravel exhibited the highest amplitude of G owing to its greater heat conductivity and steeper ∂T/∂z. This enhances both outgoing longwave radiation Rlu (Equation (A1)) and H for gravel. As a result, over gravel, less residual energy is available for evaporation. In contrast, fine sand retains more energy for evaporation, resulting in the following order of energy availability: (Rn-G-H)fine > (Rn-G-H)coarse > (Rn-G-H)gravel.
During night, Rn,s is negligibly small. The amplitude of Ggravel is more negative than Gfine and Gcoarse, which is associated with a higher value of Ts for gravel (Figure 3). This further enhanced the higher values of both Rlu and H for gravel (Figure 5). Thus, both observed and estimated differences in PE between textures are small at night.

4.2. Driving Characteristics of Surface Temperature and Heat Flux on PE Estimation

The results underscore the crucial importance of Ts for accurately computing PE, because it affects the emitted upward longwave radiation Rlu (Equation (A1)), as well as the heat flux across the soil surface. Considering the interdependence among Ts, energy balance components (Rn,l and G), and PE rate. The energy balance method and the radiatively PM showed a satisfactory correlation with measured PE on both daily and hourly time scales. Whereas, in simplified PM, using a constant G/Rn ratio introduces significant differences between measured and estimated PE [31]. This can be attributed to two main reasons. On one hand, the G/Rn ratios (0.1 and 0.5 for daytime and nighttime, respectively) in the FAO-56 guidelines were originally derived for grass reference evapotranspiration ETo [32]. Thus, their direct application over saturated bare soil may introduce inaccuracies. On the other hand, calculating G as a fixed fraction of Rn failed to reproduce the phase-advance characteristics of G (green dotted arrow in Figure 6). As a result, the PE rate derived from simplified PM fails to capture the measured PE temporal dynamics.
Furthermore, the random forest model (RF) was employed to quantify the impact of soil temperatures at various depths and energy fluxes on the variation in PE. Results further identified that ∆S (determined by T3) contributes most significantly to PE variations (relative importance = 0.37), followed by Ts (0.24) and H (determined by TsTa, 0.23). The mean importance ranking indicated that the data-driven model successfully captured the dominant influence of near-surface temperature (Ts and T3) and surface heat storage variations on PE rates and PE dynamics. Notably, the mean importance of T30 (0.06) also revealed a non-negligible effect of the soil thermal penetration depth (δ) on PE estimation for saturated surfaces.
The RF results showed that near-surface heat storage change (ΔS) had the highest contribution to hourly PE prediction and revealed a clear nonlinear relationship with shallow soil temperature. This finding is highly consistent with the importance of the heat flux term (GS) and shallow temperature highlighted in the surface energy balance analysis, indicating that both data-driven and physical approaches, under different analytical frameworks, point to the key role of near-surface heat dynamics. Based on observational data, RF captured complex interactions under field conditions, thereby providing independent validation and refinement for the surface energy balance model. RF was used as a complementary data-driven tool to further support and interpret the physical analysis, rather than replacing the theory-driven sensitivity assessment.

4.3. Study Scope and Future Perspectives

The experimental setup developed in this study allows for a unique comparison between PE dynamics over different saturated sandy soils with a very high temporal resolution. The employed Markov-bottle approach proved suitable in this experimental setup. To the best of our knowledge, this is the first time such a detailed study on the dynamics of PE has been carried out for a warm temperate semi-arid continental monsoon climate region. The application of this lysimeter device provides valuable reference for day-to-day irrigation management and crop management practices, helping to fine-tune irrigation schedules and optimize crop water usage.
The findings of this research carry several practical implications in agricultural water management at sub-daily temporal scales. In precision agriculture, reliable time-resolved estimates of Es are essential for determining irrigation needs on an hourly basis. Variations in the absolute PE values and PE dynamics are therefore critical across all estimation methods.
Although energy components were carefully considered in this study, the energy closure is incomplete at present. The first imbalance in the morning may be attributed to an underestimation of ∆S, which was indirectly calculated using Equation (A3). Biases in G can introduce substantial errors that affect energy closure and other land processes in agriculture [33]. The second imbalance after sunset might be related to additional vapor diffusion at night, which can be enhanced by wind speed and contributes to evaporation, as reported by Groh et al. (2019) [34]. Moreover, the accurate application of the surface energy balance equation requires high-quality and high-resolution data, yet many relevant variables and parameters are subject to uncertainty and are difficult to measure directly in the field [35,36,37]. In this study, the focus was primarily on the influence of T on PE across different sandy soils. We assume that uncertainties introduced by unmeasured or simplified processes affect all three textures in a comparable manner.
In addition, this study selected three standard sandy soils based on the Hydrogeological Manual and the National Standard [38] for in situ observation. Future research will involve conducting in situ PE experiments on different soil types, considering the impact of field soil heterogeneity and structural effects on PE rates. Besides this, conducting observations under various climatic conditions is also essential. Furthermore, the current study does not explicitly incorporate the effects of hydraulic parameters on PE over different textures. In future works, coupling convection in saturated porous media (such as Darcy flow) with the heat conduction equation will enable us to elucidate how soil texture differences in saturated bare textures lead to variability in hydro-thermal parameters and soil temperature fields and, in turn, drive PE differences.

5. Conclusions

In this study, potential evaporation (PE) and soil temperature (T) dynamics over different saturated sandy soils were assessed using high temporal resolution data from an in situ lysimeter experiment conducted in the Guanzhong Basin, China. The main conclusions are as follows:
(1)
Significant differences in PE and T were observed among saturated fine sand, coarse sand, and gravel based on experiment results. The differences are particularly pronounced during daytime in spring and summer. As for T, gravel exhibited the most pronounced surface temperature variation among the three textures. On a daily basis in August, (TsTa) for gravel was 0.4 °C and 1.2 °C higher than that for coarse sand and fine sand, respectively.
(2)
A comparison of the methods revealed strong agreement of PE between the energy balance equation, radiatively coupled PM, and lysimeter measurements at daily and hourly timescales. In contrast, the simplified PM (which simplified the dependence of T on longwave radiation Rn,l and soil heat flux G) performed poorly in capturing PE dynamics, yielding inaccuracies in both the amplitude and phase of diurnal PE cycles, as well as the PE differences among the three saturated textures.
(3)
A combined analysis—employing surface energy balance equations and a data-driven Random Forest (RF) model—was conducted to quantify the influence of T on PE. Surface temperature (Ts and T3) and G (determined by ∂T/∂z) were shown to play non-negligible roles in PE estimation, roles that are often simplified or overlooked in sub-daily modeling applications.
These results are particularly important for precision agriculture and hydrological modeling in arid regions and at sub-daily and short-term temporal scales.

Supplementary Materials

The following supporting information can be downloaded at: https://www.mdpi.com/article/10.3390/agronomy15102381/s1, Figure A: The cumulative PE rates for saturated fine sand, coarse sand and gravel sand in original test (left) and in repetition test (right) from May 2019 to August 2019; Figure B: Average diurnal PE cycles for saturated fine sand, coarse sand and gravel sand in original test (left) and in repetition test (right) from May 2019 to August 2019; Figure C: Seasonal variations in potential evaporation (PE) rates across different soil textures (fine, coarse, and gravel) based on ANOVA results; Figure D: Daily meteorological variables during the study period: (a) rainfall, (b) evaporation from Class A Pan, (c) relative humidity, (d) wind speed at 2 m, (e) air temperature, (f) net radiation; Figure E: Correlation matrix for the 11 input parameters over saturated fine sand (a), coarse sand (b) and gravel (c). Values indicate the Pearson Correlation Coefficient; Figure F: Variation in solar zenith angle vs. measured albedo for the three soil textures; Table S1: Physical properties of soil textures.

Author Contributions

W.L.: Writing—original draft, writing—review and editing, calculating, data curation, and funding acquisition. Z.L.: Data curation, formal analysis, and investigation. J.C.: Data curation and investigation. Y.W.: Software and validation. F.W.: Data curation and investigation. J.W.: Data curation and investigation. W.W.: Supervision and funding acquisition. All authors have read and agreed to the published version of the manuscript.

Funding

This research is supported by the National Natural Science Foundation of China (42302282). China Postdoctoral Science Foundation (2023M740364). Fundamental Research Funds for the Central Universities, CHU (300102293102). Innovation and Entrepreneurship Training Program for College Students (S202510710447, S202510710343, 202410710083). National Natural Science Foundation of China (42130710). Research Funds for the Interdisciplinary Projects, CHU (300104240932).

Data Availability Statement

The data that support the findings of this study are available from the corresponding author upon reasonable request.

Acknowledgments

The authors are grateful to the editor and perspective reviewers for providing positive and constructive comments for this paper. During the preparation of this manuscript/study, the author(s) did not use any AI tools to edit text or figures. The authors have reviewed and edited the output and take full responsibility for the content of this publication.

Conflicts of Interest

Author Zhi Li was employed by the company CCTEG Xi’an Research Institute (Group) Co., Ltd., Xi’an 710077, China. The remaining authors declare that the research was conducted in the absence of any commercial or financial relationships that could be construed as a potential conflict of interest.

Abbreviations

Esbare soil evaporation [mm]
ETevapotranspiration [mm]
ETograss reference evapotranspiration [mm]
eaactual vapor pressure [kPa]
essaturated vapor pressure [kPa]
Gtotal ground heat flux [W m−2]
G5soil heat flux measured by the plate [W m−2]
Hsensible heat flux [W m−2]
LElatent heat for evaporation [W m−2]
PEpotential evaporation [mm]
RHrelative humidity [-]
raaerodynamic resistance [s m−1]
Rnnet radiation [W m−2]
Rn,snet shortwave radiation [W m−2]
Rn,lnet longwave radiation [W m−2]
Rsddownwards/incoming shortwave radiations [W m−2]
Rlddownwards/incoming longwave radiations [W m−2]
Rsuupwards/outgoing shortwave radiations [W m−2]
Rluupwards/outgoing longwave radiation [W m−2]
Rssolar radiation [W m−2]
Rsoclear sky solar radiation [W m−2]
RiRichardson number
rssoil/bulk resistance [s m−1]
Sheat storage variations between the heat flux plate and the surface [W m−2]
SIsensitivity indices
S1first order sensitivity indices
STtotal sensitivity indices
Tsoil temperature [°C or K]
Taair temperature [°C or K]
Tssurface temperature [°C or K]
uwind speed [m s−1]
αalbedo for shortwave radiation
εemissivity of longwave radiation
σStefan-Boltzman constant [W m−2 K−4]
ψstability correction parameter
γpsychrometric constant
δthermal penetration depth [cm]
saturation vapor pressure curve slope [kPa·°C−1]

Appendix A. Surface Energy Balance Equation

Rn can be expressed as:
R n = R s d R s u R n , s + R l d R l u R n , l = R s d 1 α + ε R l d σ T s 4
where Rn,s [W m−2] and Rn,l [W m−2] represent the net shortwave radiation and net longwave radiation. Rsd [W m−2] and Rld [W m−2] represent the downwards shortwave radiation and longwave radiation, which can be observed at meteorological stations. α is the surface albedo [39,40,41]; we utilized the four-component radiometer CNR4 to measure the upward and downward shortwave net radiation, thereby obtaining α for each texture (refers to Supplementary Material, Figure E). The emissivity of longwave net radiation ε is determined by [37]:
ε = min 0.9 + 0.18 θ s ; 1.0
where θs is the saturated water content. In Equation (A1), σ (=5.67 × 10⁻⁸ W m−2 K−4) refers to the Stefan-Boltzman constant. Ts [K] is the surface temperature.
The total ground heat flux G includes the soil heat flux G5 (measured by heat flux plates at 5 cm) and heat storage variation ∆S above the heat flux plate [42] as follows:
G = G 0 + Δ S Δ S = Δ z   · c s ·   T i - T i 1 Δ t
where Ti-Ti−1 [K] is the soil temperature variation via time i. The soil temperature at 3 cm is used to estimate ∆S, ∆z is the layer thickness (0.05 m in this work), ∆t is time step (3600 s in this study). cs [MJ m−3K−1] is the saturated soil volumetric heat capacity, which can be estimated based on saturated water content θs as follows:
c s = c w θ s + c s i 1 θ s
where cw (=4.19 MJ m−3K−1) is the volumetric heat capacity of water, measured csi [MJ m−3K−1] for the three textures are shown in Table S1.
H over saturated surface is parameterized according to the flux-gradient theory [15,43,44] as follows:
H = ρ · c p   T s T a r a h
where Ta is the air temperature, cp (=1012 J kg−1 K−1) is the air specific heat, and ρ [kg·m−3] is the air density. rah [s·m−1] is the aerodynamic resistance for heat transfer [36,37] as follows:
r a h = r a ψ = 1 k 2 u ln Z 1 d z o m ln Z 2 d z o v ψ
where k (=0.41) is the von Karman constant, u [m·s−1] is the wind speed, Z1 and Z2 are the measurement heights of wind speed and air temperature, surface roughness lengths for momentum flux and heat flux zom and zoh equal to 0.001 for bare soils. d [m] is the zero-plane displacement, equals to zero for bare soils. ψ is the correction parameter for stable and unstable conditions [37] as follows:
ψ = 1 10 R i 1 R i < 0 1 + 10 R i R i > 0
where Ri is the Richardson number by [18] as follows:
R i = T s T a Z r e f d g u 2 T a
where Zref [m] is the reference height of measurements (for both temperature and wind speed). g [m s−2] is the gravitational acceleration.
Latent heat for evaporation L is 2.43 MJ kg−1.

Appendix B. Penman-Monteith Equation According to the FAO-56 Standard

The full-form PM introduced by the FAO Irrigation and Drainage Paper for saturated bare soil (surface resistance rs = 0) is given as follows:
L E = Δ R n G enenrgy + ρ c p e s e a / r a aerodynamic Δ + γ
The linearized slope of saturation vapor pressure curve Δ [kPa °C−1] in the PM is calculated by air temperature Ta [20,45] as follows:
Δ = 4098 0.6108 exp 17.27 T a T a + 237.14 / T a + 237.14 2
where γ (=0.066 kPa °C−1) in Equation (A9) is the psychrometric constant. The saturation vapor pressure es (kPa) in PM is given by air temperature Ta as follows:
e s = 0.6108 exp 17.27 T a T a + 237.14
Actual vapor pressure ea [kPa] is represented by the product of es and relative humidity RH from meteorological station. The aerodynamic resistance ra [s m−1] can be expressed as [15] as follows:
r a = 1 k 2 u ln Z 1 d z o m ψ m ln Z 2 d z o v ψ v
where ψm and ψv are the atmospheric stability correlations for momentum flux and heat flux, which are generally not required for well-watered surface [20].
In the radiatively coupled PM, RnG is estimated from Equations (A1)–(A4). In the simplified PM, Rn,l (in Rn) and G are simplified according to the following FAO-56 standards. Hourly Rn,l according to the FAO-56 standard is given by the following:
R n , l = σ T a 4 0.34 0.14 e a 1.35 R s R s o 0.35
The ratio of solar Rs and clear sky solar radiation Rso is used to represent cloud cover as follows:
R s R s o = a s + b s n N 0.75 + 2 × 10 5 × z
The values as = 0.25 and bs = 0.50 are recommended in the FAO-56. z is the station elevation above sea level (405 m for the experiment site). n is the actual duration of sunshine (hour), which can be derived from meteorological station. N is the maximum possible duration of sunshine or daylight hours (hour). The ratio Rs/Rso during nighttime can be set equal to the Rs/Rso calculated for a period occurring 2–3 h before sunset. As a more approximate alternative, one can assume Rs/Rso = 0.4 to 0.6 during nighttime periods in humid and subhumid climates and Rs/Rso = 0.7 to 0.8 in arid and semiarid climates. The value of Rs/Rso = 0.3 presumes total cloud cover.
Hourly G according to the FAO-56 standard is given by the following:
G d a y t i m e = 0.1 R n G n i g h t t i m e = 0.5 R n

References

  1. Vanderborght, J.; Fetzer, T.; Mosthaf, K.; Smits, K.M.; Helmig, R. Heat and Water Transport in Soils and across the Soil-Atmosphere Interface: 1. Theory and Different Model Concepts. Water Resour. Res. 2017, 53, 1057–1079. [Google Scholar] [CrossRef]
  2. Coenders-Gerrits, A.M.J.; Van der Ent, R.J.; Bogaard, T.A.; Wang-Erlandsson, L.; Hrachowitz, M.; Savenije, H.H.G. Uncertainties in Transpiration Estimates. Nature 2014, 506, E1–E2. [Google Scholar] [CrossRef]
  3. Gong, X.; Zhang, H.; Ren, C.; Sun, D.; Yang, J. Optimization Allocation of Irrigation Water Resources Based on Crop Water Requirement under Considering Effective Precipitation and Uncertainty. Agric. Water Manag. 2020, 239, 106264. [Google Scholar] [CrossRef]
  4. Zhang, Y.; Shen, Y.; Wang, J.; Qi, Y. Estimation of Evaporation of Different Cover Types Using a Stable Isotope Method: Pan, Bare Soil, and Crop Fields in the North China Plain. J. Hydrol. 2022, 613, 128414. [Google Scholar] [CrossRef]
  5. Rosa, R.D.; Paredes, P.; Rodrigues, G.C.; Alves, I.; Fernando, R.M.; Pereira, L.S.; Allen, R.G. Implementing the Dual Crop Coefficient Approach in Interactive Software. 1. Background and Computational Strategy. Agric. Water Manag. 2012, 103, 8–24. [Google Scholar] [CrossRef]
  6. Xiang, K.; Li, Y.; Horton, R.; Feng, H. Similarity and Difference of Potential Evapotranspiration and Reference Crop Evapotranspiration—A Review. Agric. Water Manag. 2020, 232, 106043. [Google Scholar] [CrossRef]
  7. Therrien, R.; McLaren, R.G.; Sudicky, E.A.; Panday, S.M. A Three-Dimensional Numerical Model Describing Fully-Integrated Subsurface and Surface Flow and Solute Transport; University of Waterloo: Waterloo, ON, Canada, 2010; Draft 467p. [Google Scholar]
  8. Han, Z.; Zhang, H.; Fu, J.; Wang, Z.; Duan, L.; Zhang, W.; Li, Z. Dynamic Assessment of the Impact of Compound Dry-Hot Conditions on Global Terrestrial Water Storage. Remote Sens. Environ. 2024, 315, 114428. [Google Scholar] [CrossRef]
  9. Li, W.; Brunner, P.; Hendricks Franssen, H.-J.; Li, Z.; Wang, Z.; Zhang, Z.; Wang, W. Potential Evaporation Dynamics over Saturated Bare Soil and an Open Water Surface. J. Hydrol. 2020, 590, 125140. [Google Scholar] [CrossRef]
  10. Assouline, S.; Narkis, K.; Gherabli, R.; Lefort, P.; Prat, M. Analysis of the Impact of Surface Layer Properties on Evaporation from Porous Systems Using Column Experiments and Modified Definition of Characteristic Length. Water Resour. Res. 2014, 50, 3933–3955. [Google Scholar] [CrossRef]
  11. Lehmann, P.; Or, D. Effect of Wetness Patchiness on Evaporation Dynamics from Drying Porous Surfaces. Water Resour. Res. 2013, 49, 8250–8262. [Google Scholar] [CrossRef]
  12. Lehmann, P.; Or, D. Evaporation and Capillary Coupling across Vertical Textural Contrasts in Porous Media. Phys. Rev. E 2009, 80, 046318. [Google Scholar] [CrossRef]
  13. Or, D.; Lehmann, P. Surface Evaporative Capacitance: How Soil Type and Rainfall Characteristics Affect Global–Scale Surface Evaporation. Water Resour. Res. 2019, 55, 519–539. [Google Scholar] [CrossRef]
  14. Shahraeeni, E.; Or, D. Pore Scale Mechanisms for Enhanced Vapor Transport through Partially Saturated Porous Media. Water Resour. Res. 2012, 48. [Google Scholar] [CrossRef]
  15. Brutsaert, W. Evaporation into the Atmosphere: Theory, History and Applications; Springer Science & Business Media: Berlin/Heidelberg, Germany, 2013; Volume 1, ISBN 94-017-1497-5. [Google Scholar]
  16. Jensen, M.E.; Allen, R.G. (Eds.) Evaporation, Evapotranspiration, and Irrigation Water Requirements, 2nd ed.; American Society of Civil Engineers: Reston, VA, USA, 2016; ISBN 978-0-7844-1405-7. [Google Scholar]
  17. Penman, H.L. Natural Evaporation from Open Water, Bare Soil and Grass. Proc. R. Soc. Lond. 1948, 193, 120–145. [Google Scholar] [CrossRef]
  18. Monteith, J.; Unsworth, M. Principles of Environmental Physics, 4th ed.; Elsevier: Amsterdam, The Netherlands, 2013. [Google Scholar] [CrossRef]
  19. McColl, K.A. Practical and Theoretical Benefits of an Alternative to the Penman-Monteith Evapotranspiration Equation. Water Resour. Res. 2020, 56, e2020WR027106. [Google Scholar] [CrossRef]
  20. Allen, R.G.; Pereira, L.S.; Raes, D.; Smith, M. Crop Evapotranspiration-Guidelines for Computing Crop Water Requirements-FAO Irrigation and Drainage Paper 56; FAO Rome: Rome, Italy, 1998; Volume 300, p. D05109. [Google Scholar]
  21. Li, W.; Hendricks Franssen, H.-J.; Brunner, P.; Li, Z.; Wang, Z.; Wang, Y.; Wang, W. The Role of Soil Texture on Diurnal and Seasonal Cycles of Potential Evaporation over Saturated Bare Soils—Lysimeter Studies. J. Hydrol. 2022, 613, 128194. [Google Scholar] [CrossRef]
  22. Shen, Y.; Li, J.; Wang, W.; Deng, H.; Wang, Z. Data acquisition device for automatic evaporation and precipitation measurement. CN201410042751.X[P] 23 April 2014. [Google Scholar]
  23. Evett, S.R.; Marek, G.W.; Copeland, K.S.; Colaizzi, P.D. Quality Management for Research Weather Data: USDA-ARS, Bushland, TX. Agrosyst. Geosci. Environ. 2018, 1, 1–18. [Google Scholar] [CrossRef]
  24. Allen, R.G. ASCE Standardized Reference Evapotranspiration Equation; American Society of Civil Engineers: Reston, VA, USA, 2018; ISBN 978-0-7844-0805-6. [Google Scholar]
  25. Allen, R.G.; Pereira, L.S.; Howell, T.A.; Jensen, M.E. Evapotranspiration Information Reporting: I. Factors Governing Measurement Accuracy. Agric. Water Manag. 2011, 98, 899–920. [Google Scholar] [CrossRef]
  26. Evett, S.R.; Schwartz, R.C.; Howell, T.A.; Louis Baumhardt, R.; Copeland, K.S. Can Weighing Lysimeter ET Represent Surrounding Field ET Well Enough to Test Flux Station Measurements of Daily and Sub-Daily ET? Adv. Water Resour. 2012, 50, 79–90. [Google Scholar] [CrossRef]
  27. Marek, G.W.; Evett, S.R.; Gowda, P.H.; Howell, T.A.; Copeland, K.S.; Baumhardt, R.L. Post-Processing Techniques for Reducing Errors in Weighing Lysimeter Evapotranspiration (ET) Datasets. Trans. ASABE 2014, 57, 499–515. [Google Scholar] [CrossRef]
  28. Evett, S.R.; Howell, T.A.; Schneider, A.D.; Copeland, K.S.; Dusek, D.A.; Brauer, D.K.; Tolk, J.A.; Marek, G.W.; Marek, T.M.; Gowda, P.H. The Bushland Weighing Lysimeters: A Quarter Century of Crop ET Investigations to Advance Sustainable Irrigation. Trans. ASABE 2016, 59, 163–179. [Google Scholar] [CrossRef]
  29. An, K.; Wang, W.; Wang, Z.; Zhao, Y.; Yang, Z.; Chen, L.; Zhang, Z.; Duan, L. Estimation of Ground Heat Flux from Soil Temperature over a Bare Soil. Theor. Appl. Climatol. 2017, 129, 913–922. [Google Scholar] [CrossRef]
  30. Yang, Q.; Zhang, M.; Zhou, J. Ground Surface—Soil Thermal Inversion From In Situ Measurement. JGR Atmos. 2023, 128, e2023JD038502. [Google Scholar] [CrossRef]
  31. Gavilán, P.; Berengena, J.; Allen, R.G. Measuring versus estimating net radiation and soil heat flux: Impact on Penman–Monteith reference ET estimates in semiarid regions. Agric. Water Manag. 2007, 89, 275–286. [Google Scholar] [CrossRef]
  32. Fernández, E. Editorial Note on Terms for Crop Evapotranspiration, Water Use Efficiency and Water Productivity. Agric. Water Manag. 2023, 289, 108548. [Google Scholar] [CrossRef]
  33. Purdy, A.J.; Fisher, J.B.; Goulden, M.L.; Famiglietti, J.S. Ground Heat Flux: An Analytical Review of 6 Models Evaluated at 88 Sites and Globally. J. Geophys. Res. Biogeosci. 2016, 121, 3045–3059. [Google Scholar] [CrossRef]
  34. Groh, J.; Pütz, T.; Gerke, H.H.; Vanderborght, J.; Vereecken, H. Quantification and Prediction of Nighttime Evapotranspiration for Two Distinct Grassland Ecosystems. Water Resour. Res. 2019, 55, 2961–2975. [Google Scholar] [CrossRef]
  35. Lim, W.H.; Roderick, M.L.; Hobbins, M.T.; Wong, S.C.; Groeneveld, P.J.; Sun, F.; Farquhar, G.D. The Aerodynamics of Pan Evaporation. Agric. For. Meteorol. 2012, 152, 31–43. [Google Scholar] [CrossRef]
  36. Liu, S.; Lu, L.; Mao, D.; Jia, L. Evaluating Parameterizations of Aerodynamic Resistance to Heat Transfer Using Field Measurements. Hydrol. Earth Syst. Sci. 2007, 11, 769–783. [Google Scholar] [CrossRef]
  37. Saito, H.; Šimůnek, J. Effects of Meteorological Models on the Solution of the Surface Energy Balance and Soil Temperature Variations in Bare Soils. J. Hydrol. 2009, 373, 545–561. [Google Scholar] [CrossRef]
  38. GB/T 50123-1999; Standard for Soil Test Method. Ministry of Housing and Urban-Rural Development: Beijing, China, 2017.
  39. Lawrence, P.J.; Chase, T.N. Representing a MODIS Consistent Land Surface in the Community Land Model (CLM 3.0): Part 1 Generating MODIS Consistent Land Surface Parameters. J. Geophys. Res. Biogeosci. 2007, 112, 862–880. [Google Scholar] [CrossRef]
  40. Liu, H.; Wang, B.; Fu, C. Relationships between Surface Albedo, Soil Thermal Parameters and Soil Moisture in the Semi-Arid Area of Tongyu, Northeastern China. Adv. Atmos. Sci. 2008, 25, 757–764. [Google Scholar] [CrossRef]
  41. Zheng, Z.; Wei, Z.; Wen, Z.; Dong, W.; Li, Z.; Wen, X.; Zhu, X.; Ji, D.; Chen, C.; Yan, D. Inclusion of Solar Elevation Angle in Land Surface Albedo Parameterization over Bare Soil Surface. J. Adv. Model. Earth Syst. 2017, 9, 3069–3081. [Google Scholar] [CrossRef] [PubMed]
  42. Roxy, M.S.; Sumithranand, V.B.; Renuka, G. Soil Heat Flux and Day Time Surface Energy Balance Closure at Astronomical Observatory, Thiruvananthapuram, South Kerala. J. Earth Syst. Sci. 2014, 123, 741–750. [Google Scholar] [CrossRef]
  43. Cellier, P.; Richard, G.; Robin, P. Partition of Sensible Heat Fluxes into Bare Soil and the Atmosphere. Agric. For. Meteorol. 1996, 82, 245–265. [Google Scholar] [CrossRef]
  44. Stewart, J.B.; Kustas, W.P.; Humes, K.S.; Nichols, W.D.; Moran, M.S.; de Bruin, H.A. Sensible Heat Flux-Radiometric Surface Temperature Relationship for Eight Semiarid Areas. J. Appl. Meteorol. 1994, 33, 1110–1117. [Google Scholar] [CrossRef]
  45. Zotarelli, L.; Dukes, M.D.; Romero, C.C.; Migliaccio, K.W.; Morgan, K.T. Step by Step Calculation of the Penman-Monteith Evapotranspiration (FAO-56 Method); Institute of Food and Agricultural Sciences, University of Florida: Gainesville, FL, USA, 2010. [Google Scholar]
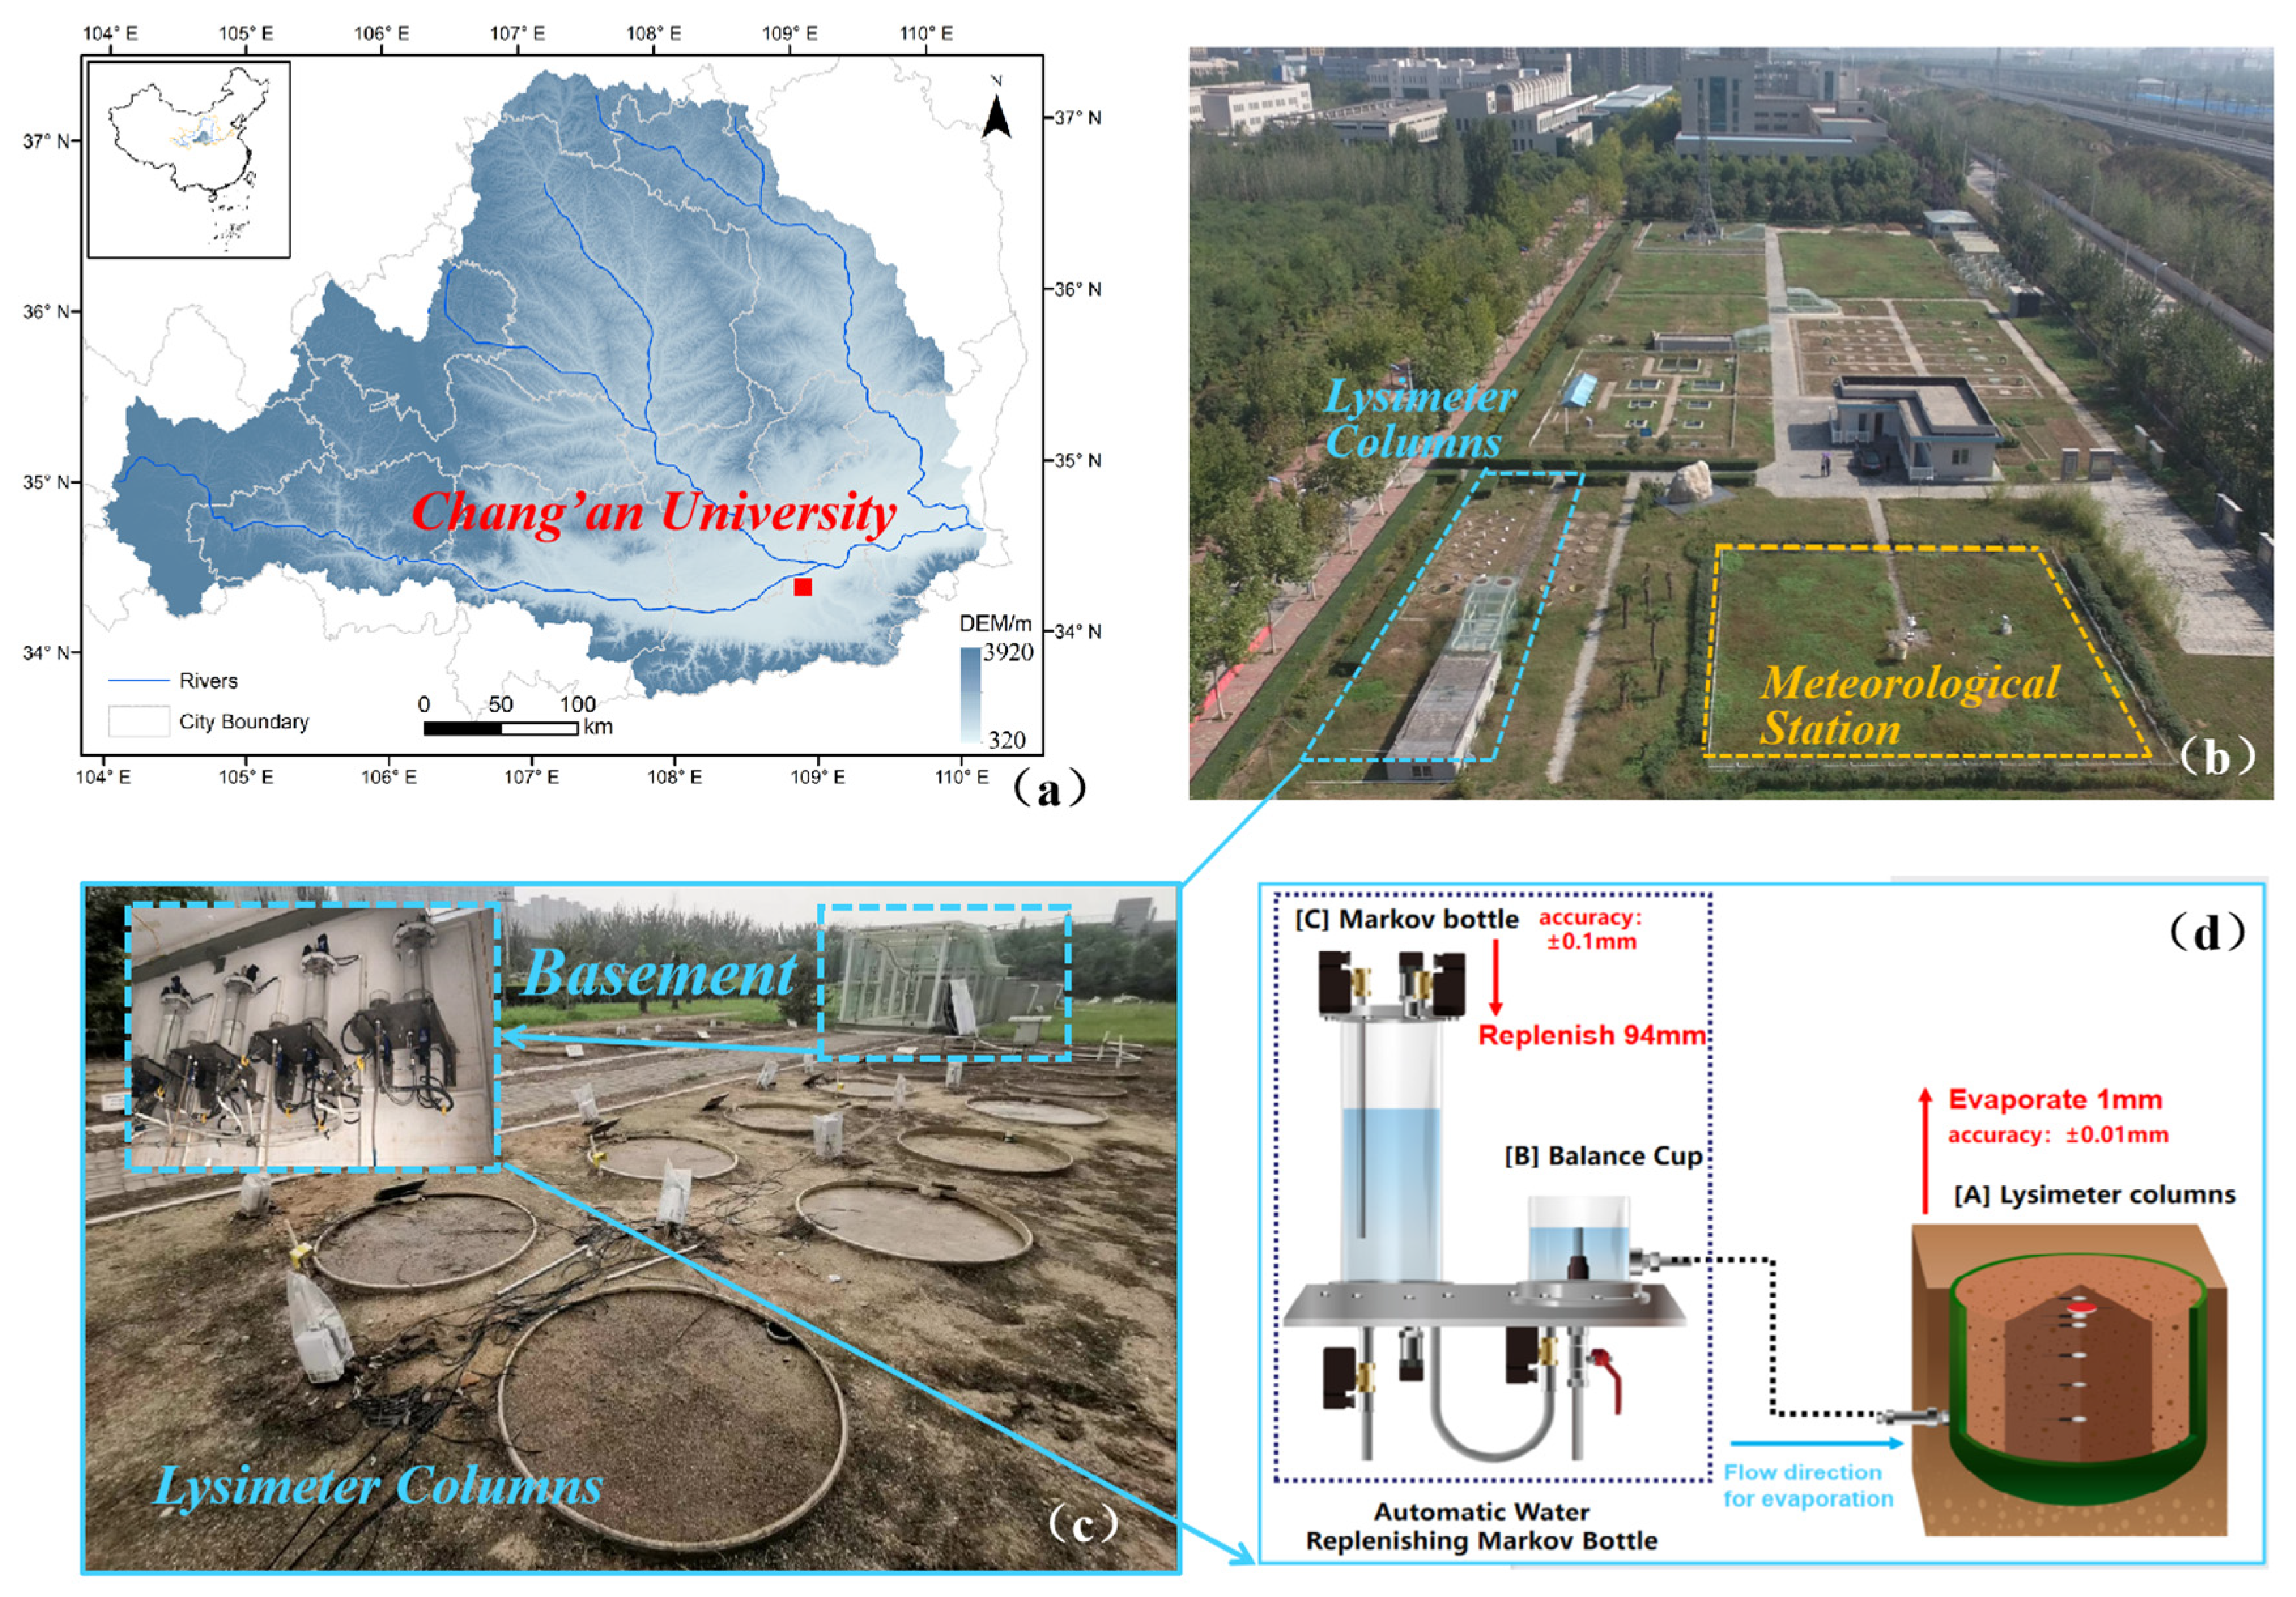
Figure 1. Location of the study site (a), experiment site (b), lysimeter columns (c), setup of the PE measurement device (d).
Agronomy 15 02381 g001
Figure 2. (I) Seasonal sums of measured PE for fine sand, coarse sand, and gravel, where n represents the number of days with measured PE for each season; (II) measured average diurnal PE cycles for fine sand, coarse sand, and gravel in spring (a), summer (b), autumn (c), and winter (d). The shaded areas in the figure represent error bars, indicating the mean PE rates ± standard deviation (std).
Agronomy 15 02381 g002
Figure 3. Average diurnal soil temperature T (°C) variations along depth for saturated fine sand, coarse sand, and gravel in March (a) and August (b). Average diurnal cycles of differences between shallow surface temperature and air temperature (Ts–Ta and T3–Ta) for saturated fine sand, coarse sand, and gravel in March (c,e) and August (d,f).
Agronomy 15 02381 g003
Figure 4. Conceptual diagram of the energy balance components above the saturated bare surface at daytime (left) and at nighttime (right).
Agronomy 15 02381 g004
Figure 5. Average diurnal cycles of energy balance components for saturated fine sand, coarse sand, and gravel in March (1) and August (2). Average diurnal cycles of soil heat flux measured by heat flux plate (G5) and heat storage variations (∆S) for saturated fine sand, coarse sand, and gravel in March (3) and August (4). The dotted arrows indicate the peak times of the flux curves. The results are shown for March (A) and August (B).
Agronomy 15 02381 g005
Figure 6. Average diurnal cycles of net radiation Rn (I) and total ground heat flux G (II) in the radiatively coupled PM and in the simplified PM for saturated fine sand, coarse sand, and gravel in March (A) and August (B). The dotted arrows indicate the peak times of the respective flux curves.
Agronomy 15 02381 g006
Figure 7. Comparison of estimated and measured daily PE rates for fine sand (red), coarse sand (orange), and gravel (blue) in March (I) and August (II). Estimates were generated using the energy balance method (A), the radiatively coupled PM-RC PM (B), and the simplified PM (C).
Agronomy 15 02381 g007
Figure 8. Time series of measured and calculated hourly PE for fine sand (1,4), coarse sand (2,5), and gravel (3,6). Panels (13) show the full-month data, and panels (46) display diurnal variations on a representative hot day. Calculated PE curves were derived using the energy balance method (purple), the radiatively coupled PM (green), and the simplified PM (black). The results are shown for March (I) and August (II).
Agronomy 15 02381 g008
Figure 9. Scatter plots of observed and predicted PE for the 8-variable model across saturated fine sand (I), coarse sand (II), and gravel (III). Results for training set (a) and testing results (b). Mean importance for each input variable based on 5-fold cross-validation (c), with the bars representing the mean importance of each variable and the black lines indicating the standard deviation.
Agronomy 15 02381 g009
Table 1. Meteorological measurements devices.
Meteorological ElementsInstrumentsCompanyInstallation Height (m)
precipitationTE525Campbell Scientific Inc. Logan, UT, USA0.7m
air temperature and relative humidity083E-1–6Met One Instrument. Grants Pass, OR, USA1.5m
wind speedRM Young Wind MonitorCampbell Scientific Inc. Logan, UT, USA2m
radiationsCNR4Kipp&Zonen. Logan, UT, USA1.5m
data loggerCR-3000Campbell Scientific Inc. Logan, UT, USA1m
Table 2. Measured and estimated PE, as well as their differences (PEfine-PEcoarse and PEcoarse-PEgravel) between saturated textures for March and August, using three methods (energy balance method, radiatively coupled PM, and simplified PM).
MethodsPEfinePEcoarsePEgravel PEfine-PEcoarse PEcoarse-PEgravel
MarAugMarAugMarAugMarAugMarAug
Measurements79.80 137.59 76.66 121.21 75.86 115.92 3.14 16.38 0.79 5.29
Energy balance91.34 143.23 80.50 126.62 72.63 115.14 10.84 16.76 7.87 11.34
Radiatively coupled PM75.38 123.92 72.77 117.58 70.77 113.59 2.61 6.65 1.99 3.87
Simplified PM85.75 128.48 85.66 128.34 85.48 128.05 0.09 0.14 0.18 0.28
Disclaimer/Publisher’s Note: The statements, opinions and data contained in all publications are solely those of the individual author(s) and contributor(s) and not of MDPI and/or the editor(s). MDPI and/or the editor(s) disclaim responsibility for any injury to people or property resulting from any ideas, methods, instructions or products referred to in the content.