Article

Three-Dimensional Spectral Index-Driven Nondestructive Quantification of Chlorophyll in Winter Wheat: Cross-Phenology Extrapolation and Independent Validation

Key Laboratory of Agricultural Soil and Water Engineering in Arid and Semiarid Areas of Ministry of Education, Northwest A&F University, Yangling 712100, China
*
Author to whom correspondence should be addressed.
Agronomy 2025, 15(10), 2376; https://doi.org/10.3390/agronomy15102376 (registering DOI)
Submission received: 15 September 2025 / Revised: 5 October 2025 / Accepted: 10 October 2025 / Published: 11 October 2025

Abstract

As a staple cereal worldwide, winter wheat plays a pivotal role in food security. Leaf chlorophyll serves as a direct indicator of photosynthetic performance and nitrogen nutrition, making it critical for precision management and yield gains. Consequently, rapid, nondestructive, and high-accuracy remote-sensing retrievals are urgently needed to underpin field operations and precision fertilization. In this study, canopy hyperspectral reflectance together with destructive chlorophyll assays were systematically acquired from Yangling field trials conducted during 2018–2020. Three families of spectral indices were devised: classical empirical indices; two-dimensional optimal spectral indices (2D OSI) selected by correlation-matrix screening; and novel three-dimensional optimal spectral indices (3D OSI). The main contribution lies in devising novel 3D OSIs that combine three spectral bands and demonstrating how their fusion with classic two-band indices can improve chlorophyll quantification. Correlation analysis showed that most empirical vegetation indices were significantly associated with chlorophyll (p < 0.05), with the new double difference index (NDDI) giving the strongest relationship (R = 0.637). Within the optimal-index sets, the difference three-dimensional spectral index (DTSI; 680, 807, and 1822 nm) achieved a correlation coefficient of 0.703 (p < 0.05). Among all multi-input fusion schemes, fusing empirical indices with 3D OSI and training with RF delivered the best validation performance (R2 = 0.816, RMSE = 0.307 mg g−1, MRE = 11.472%), and external data further corroborated its feasibility. Altogether, integrating 3D spectral indices with classical vegetation indices and deploying RF enabled accurate, nondestructive estimation of winter wheat chlorophyll, offering a new hyperspectral pathway for monitoring crop physiological status and advancing precision agricultural management and fertilization, can guide in-season fertilization to optimize nitrogen use, thereby advancing precision agriculture.

1. Introduction

Nearly three quarters of the world’s wheat output derives from winter wheat (Triticum aestivum L.), which constitutes a staple for billions [1]. In addition to direct use in bread, noodles, and other foods, winter wheat is an important fodder crop; its well-developed root system promotes soil and water conservation and improves nutrient cycling, thereby comprehensively supporting food security and sustainable agricultural production [2,3]. As the dominant pigment for photosynthesis, chlorophyll regulates light-harvesting efficiency, and its level has long been recognized as a key metric of plant photosynthetic capability and N nutritional condition [4]. Studies have shown that the spatiotemporal dynamics of chlorophyll content reflect plant growth and health; chlorophyll deficiency directly suppresses photosynthesis and reduces yield [5]. However, traditional chlorophyll determination methods generally rely on destructive chemical analysis or handheld instruments (e.g., SPAD), which require destructive sampling, involve complex operations, and are time-consuming and labor-intensive, making it difficult to meet the needs of real-time, continuous monitoring [6]. Therefore, there is a need to develop rapid, nondestructive monitoring approaches to obtain chlorophyll information in crops.
Previous studies have pointed out that while fluorescence and RGB imaging are useful, they have limitations compared to hyperspectral [7]. The reason for this is that hyperspectral imaging provides richer spectral information (covering visible, near-infrared, and short-wave infrared bands) than simple RGB cameras [8]. RGB imaging is easier to acquire, but can only capture wide color bands, while hyperspectral sensors can resolve narrow-band features related to pigments, leaf structure, and water absorption [9]. Similarly, we note that fluorescence sensors (such as chlorophyll fluorometers) can measure photosynthesis, but require special conditions (dark adaptation) and capture different signals [10]. Hyperspectral reflectance inherently covers the key absorption and scattering bands that are most directly related to chlorophyll content (visible light for pigments, near-infrared for leaf structure, and short-wave infrared for water), which is why hyperspectral methods are able to achieve higher accuracy [11]. Specifically, hyperspectral remote sensing acquires canopy reflectance in continuous narrow bands and is highly sensitive to spectral features induced by biochemical constituents such as chlorophyll [12]. For example, chlorophyll exhibits pronounced absorption troughs near 450 nm and 650 nm and a characteristic red-edge reflectance peak at 700–760 nm, features that are closely related to chlorophyll content [13,14]. Leveraging these spectral characteristics together with machine-learning algorithms enables precise retrieval models for chlorophyll estimation [15]. Existing studies have demonstrated the effectiveness of hyperspectral data and machine learning in chlorophyll retrieval; for instance, high accuracy was achieved for soybean chlorophyll prediction when optimal spectral indices were applied by Shi et al. [6], with validation R2 = 0.854, RMSE = 2.627, and MRE = 4.669%. In wheat, evaluation of 12 vegetation indices by Cui et al. showed the best performance for the red-edge chlorophyll absorption index (RECAI/TVI) [16]. With the progressive elucidation of crop spectral characteristics, the red-edge band (680–760 nm) has been extensively utilized for chlorophyll retrieval [17]. Moreover, support vector machine (SVM), back-propagation neural network (BPNN), random forest (RF), eXtreme gradient boosting (XGBoost), convolutional neural network (CNN), long short-term memory (LSTM) and extreme learning machine (ELM) have been widely employed to estimate crop parameters because they can accommodate high dimensionality and nonlinearity in spectral data [18,19]. For example, Ju et al. (2024) [20] identified the optimal combination for predicting chlorophyll content in rice leaves based on fluorescence spectral data: the CNN+LSTM+IVSO−IVISSA method. Compared with other studies using machine learning methods for chlorophyll prediction (most of which involved standard methods such as XGBoost, SVM, and random forests), machine learning was able to effectively predict chlorophyll content. However, the limitations of the input variables in the above studies combined with machine learning models cannot be ignored, by comparison, although previous studies have constructed optimized two-dimensional spectral indices via correlation-matrix approaches to effectively extract inter-band information and improve estimation accuracy, most of these efforts have focused on dual-band combinations [21]. Using two-dimensional optimal spectral indices integrated with a random forest (RF) model, Tang et al. (2023) estimated the nitrogen nutrition index of winter oilseed rape, obtaining high accuracy on the validation set (R2 = 0.823, RMSE = 0.079, MRE = 7.513%) [18]; Zhang et al. (2023) built a leaf area index model for winter oilseed rape by combining integer-order differentiation with two-dimensional optimal spectral indices, significantly improving estimation accuracy compared with traditional inputs [19]. Although optimal spectral indices integrating full-spectrum information have been constructed through correlation-matrix methods—thereby fully mining inter-band interactions and filtering redundancy—these studies have mostly concentrated on the application of two-dimensional indices to crop physiological parameter estimation. Motivated by the dominance of dual-band indices in prior work, we propose three-dimensional optimal spectral indices that integrate three bands concurrently to capture more intricate spectral interactions and, in principle, yield higher estimation accuracy and greater model robustness [22]. However, despite their notable algorithmic and computational potential, applications of such indices to real-world crop growth monitoring remain scarce. As a critical phase in the winter wheat growth cycle, jointing is marked by rapid internode elongation and initiation of floral primordia; concomitantly, the need for water, nutrients, and light surges, making slight chlorophyll fluctuations reflective of plant physiology and nutritional level [23], by monitoring chlorophyll at elongation, farmers can adjust fertilization [24]. Therefore, accurate and timely acquisition of chlorophyll content during jointing is essential for growth status assessment and provides a scientific basis for refined field management and precision fertilization.
We hypothesize that integrating spectral information from three wavelengths into a three-dimensional index can capture physiologically relevant features that two-dimensional indices miss, thereby improving predictive accuracy. Accordingly, during 2018–2020 we conducted two consecutive growing-season experiments in typical winter wheat fields on the Loess Plateau, systematically collecting canopy hyperspectral reflectance at the jointing stage together with destructive chlorophyll measurements. We first computed classical empirical vegetation indices, then used a correlation-matrix approach to construct two- and three-dimensional spectral indices and quantify the sensitivity of all spectral parameters to chlorophyll. Next, we combined these spectral parameters (with the three-dimensional indices as the primary predictors) to build chlorophyll retrieval models—RF, BPNN, and SVM—and identified the optimal monitoring scheme. Finally, we evaluated feasibility using observations from the grain-filling stage in 2020. This study aims to provide an innovative, efficient, and non-destructive method for monitoring winter wheat chlorophyll.

2. Materials and Methods

2.1. Study Area and Experimental Design

Field trials were conducted over two consecutive seasons (2018–2019; 2019–2020) in typical winter wheat fields on the Loess Plateau [25,26], following the same site and management protocol as [23], full details are provided therein. Briefly, the design comprised five nitrogen rates combined with four fertilization/covering modes, yielding 17 treatments and 34 plots overall. The factorial design (five N levels by four application methods) was chosen to create broad chlorophyll variation. We verified that treatments produced significantly different chlorophyll means (ANOVA, SPSS 23 software, SPSS Inc., Chicago, IL, USA) but did not focus on comparing treatment means; instead, all data were pooled for model development.

2.2. Data Acquisition and Preprocessing

2.2.1. Spectral Data Acquisition

At the jointing stage (31 March 2019 and 3 April 2020), canopy hyperspectral reflectance was measured between 11:00 and 13:00 under clear-sky conditions and stable, high solar elevation. An ASD FieldSpec™ 3 (Analytical Spectral Devices, Boulder, CO, USA) provided measurements over 350–1830 nm. Although the instrument spans 350–2500 nm, the 1830–2500 nm region was excluded due to pronounced atmospheric water absorption and reduced signal-to-noise, Strong water-vapor absorption peaks between ~1800–1900 nm produce noisy, unreliable reflectance, so the SWIR data beyond 1830 nm were discarded to improve data quality [27]. White-reference calibration with a 99% Spectralon panel was performed initially and at ~10-min intervals. The foreoptic (25°) was positioned ~1.2 m above the canopy (footprint ~0.5 m), with integration time set automatically. The ASD FieldSpec 3 has ~3 nm spectral resolution (full-width at half-maximum) in the VNIR region and ~10 nm resolution in the SWIR range [28]. Parameterization and calibration followed [19]. In each plot, three 1 m × 1 m quadrats were randomly selected; nine sequential spectra were recorded per quadrat, spectra exceeding ±3 SD were removed, and the remaining scans were averaged to obtain quadrat reflectance.

2.2.2. Chlorophyll Determination

Leaf material was destructively sampled from every plot coincident with spectral acquisition, and six plants exhibiting uniform growth were selected per plot. Because the flag leaf had not fully differentiated at jointing, the uppermost expanded functional leaf (typically the third leaf from the top) was sampled to ensure consistency and representativeness. Chlorophyll content (mg g−1 fresh weight) was determined by solvent extraction: A 0.1 g portion of fresh leaf tissue was weighed, 25 mL of 96% ethanol was added, and the samples were kept in darkness overnight; absorbance was subsequently read at 665, 649, and 470 nm [26]. Each chlorophyll measurement was performed in triplicate for each canopy sample, and the average was used, the spectrophotometric absorbance readings were taken three times per extract and averaged to reduce analytical error.

2.2.3. Conversion and Optimization of Spectral Data

On each sampling day, the reflectance spectra were calibrated against a white reference (Spectralon panel, Labsphere, Inc., 231 Shaker Street, North Sutton, NH 03260, USA), which effectively corrected for illumination variations. The raw reflectance spectra underwent SG smoothing to control background noise and instrument drift. We used a 2 nd-order polynomial across a 9-band sliding window, which maintained important spectral structure and reduced high-frequency fluctuations, yielding higher SNR for parameter extraction. The raw radiance was converted to reflectance via a Spectralon reference before smoothing. No further normalization (such as continuum removal or SNV) was applied; however, future work may explore additional preprocessing [29].

2.3. Selection and Construction of Spectral Indices

Three categories of spectral indices were constructed to extract chlorophyll-related information:
Traditional spectral indices (SIs). Ten classical spectral indices (e.g., DDI, MNDVI) were selected as baselines, as these indices have been shown to correlate significantly with crop growth indicators in the literature (Table 1).
Two-dimensional optimal spectral indices (2D OSI). Based on correlation-matrix analysis, band pairs with the highest association with chlorophyll content were screened from all bi-band combinations, and optimized dual-band indices were constructed on the basis of previous studies [19]:
    S A V I = 1 + 0.16 R i R j R i + R j + 0.16
  N D V I =   R i R j / R i + R j
T V I = 0.5 × 120 × R i R 550 200 × R j R 550
m S R = R i R 455 / R j R 455
m N D I   =   R i R j / R i + R j 2 R 455
  R I   =   R i / R j
DI = RiRj
Three-dimensional optimal spectral indices (3D OSI). A tri-band interaction optimization algorithm was employed to mine more complex inter-band interactions. From all tri-band combinations within 350–1830 nm, the optimal combinations were selected by correlation with chlorophyll content to construct new 3D indices. To address the heavy computational demand, a parallel computing strategy was used to accelerate the 3D OSI search. The following five indices were innovatively constructed. The discrete wavelength set spans 350–1830 nm with 1481 points, so an exhaustive scan of all three-band combinations has a size of 14813. For each candidate triplet, we computed its Pearson correlation coefficient with chlorophyll and used parallel computing for acceleration. This step is a univariate sensitivity enumeration and does not involve model parameter fitting; selection bias was subsequently controlled via independent validation and cross-validation.
R T S I = R i / R j / R k
D T S I = R i R j R k
N D T S I = ( R i R j R k ) / ( R i + R j + R k )
R D T S I = 1 / R i 1 / R j 1 / R k
R A T S I = 1 / R i + 1 / R j + 1 / R k

2.4. Modeling Methods

A three-tier modeling design was adopted to estimate winter wheat chlorophyll with high accuracy. The first tier comprised univariate correlation screening, retaining indices significantly linked to chlorophyll (p < 0.05) as the candidate inputs. Screening was performed on all 66 samples to select generally sensitive band combinations as candidate predictors; due to the limited sample size, nested cross-validation stratified screening was not used. Second, three machine-learning models—PLSR, SVM [36], BPNN [37], and RF [21]—were constructed to comprehensively evaluate algorithmic performance in complex nonlinear fitting. The third step leveraged cross-validation–guided grid search to refine architectures and hyperparameters, resulting in gains in accuracy and stability.
Parameter settings were as follows:
The number of latent variables (LVs) in PLSR was selected via 10-fold cross-validation using the minimum RMSECV criterion. A search over 1–10 components yielded three LVs, which explained 87% of the spectral variance and alleviated multicollinearity. In each fold, predictive R2 and bias were monitored to ensure a stable fit without over-simplifying [38]. RF used the Gini index as the split criterion, with 200 trees and max_features = auto; out-of-bag (OOB) error was used to assess stability, and multi-round iterations were used to verify convergence [6]. An RBF kernel was used for the SVM; hyperparameter selection relied on a grid search with five-fold cross-validation, yielding C = 32 and γ = 0.125 (i.e., C = 25, γ = 2−3), which provided high fitting accuracy and stability on the validation set [39]. BPNN used a single hidden layer with TANSIG activation and the Levenberg–Marquardt (TrainLM) algorithm; the number of hidden neurons was increased stepwise (increment of 5, from 10 to 100), and validation-set performance curves indicated an optimal configuration at 45 neurons [18].

2.5. Description of Sample Size and Model Building Process

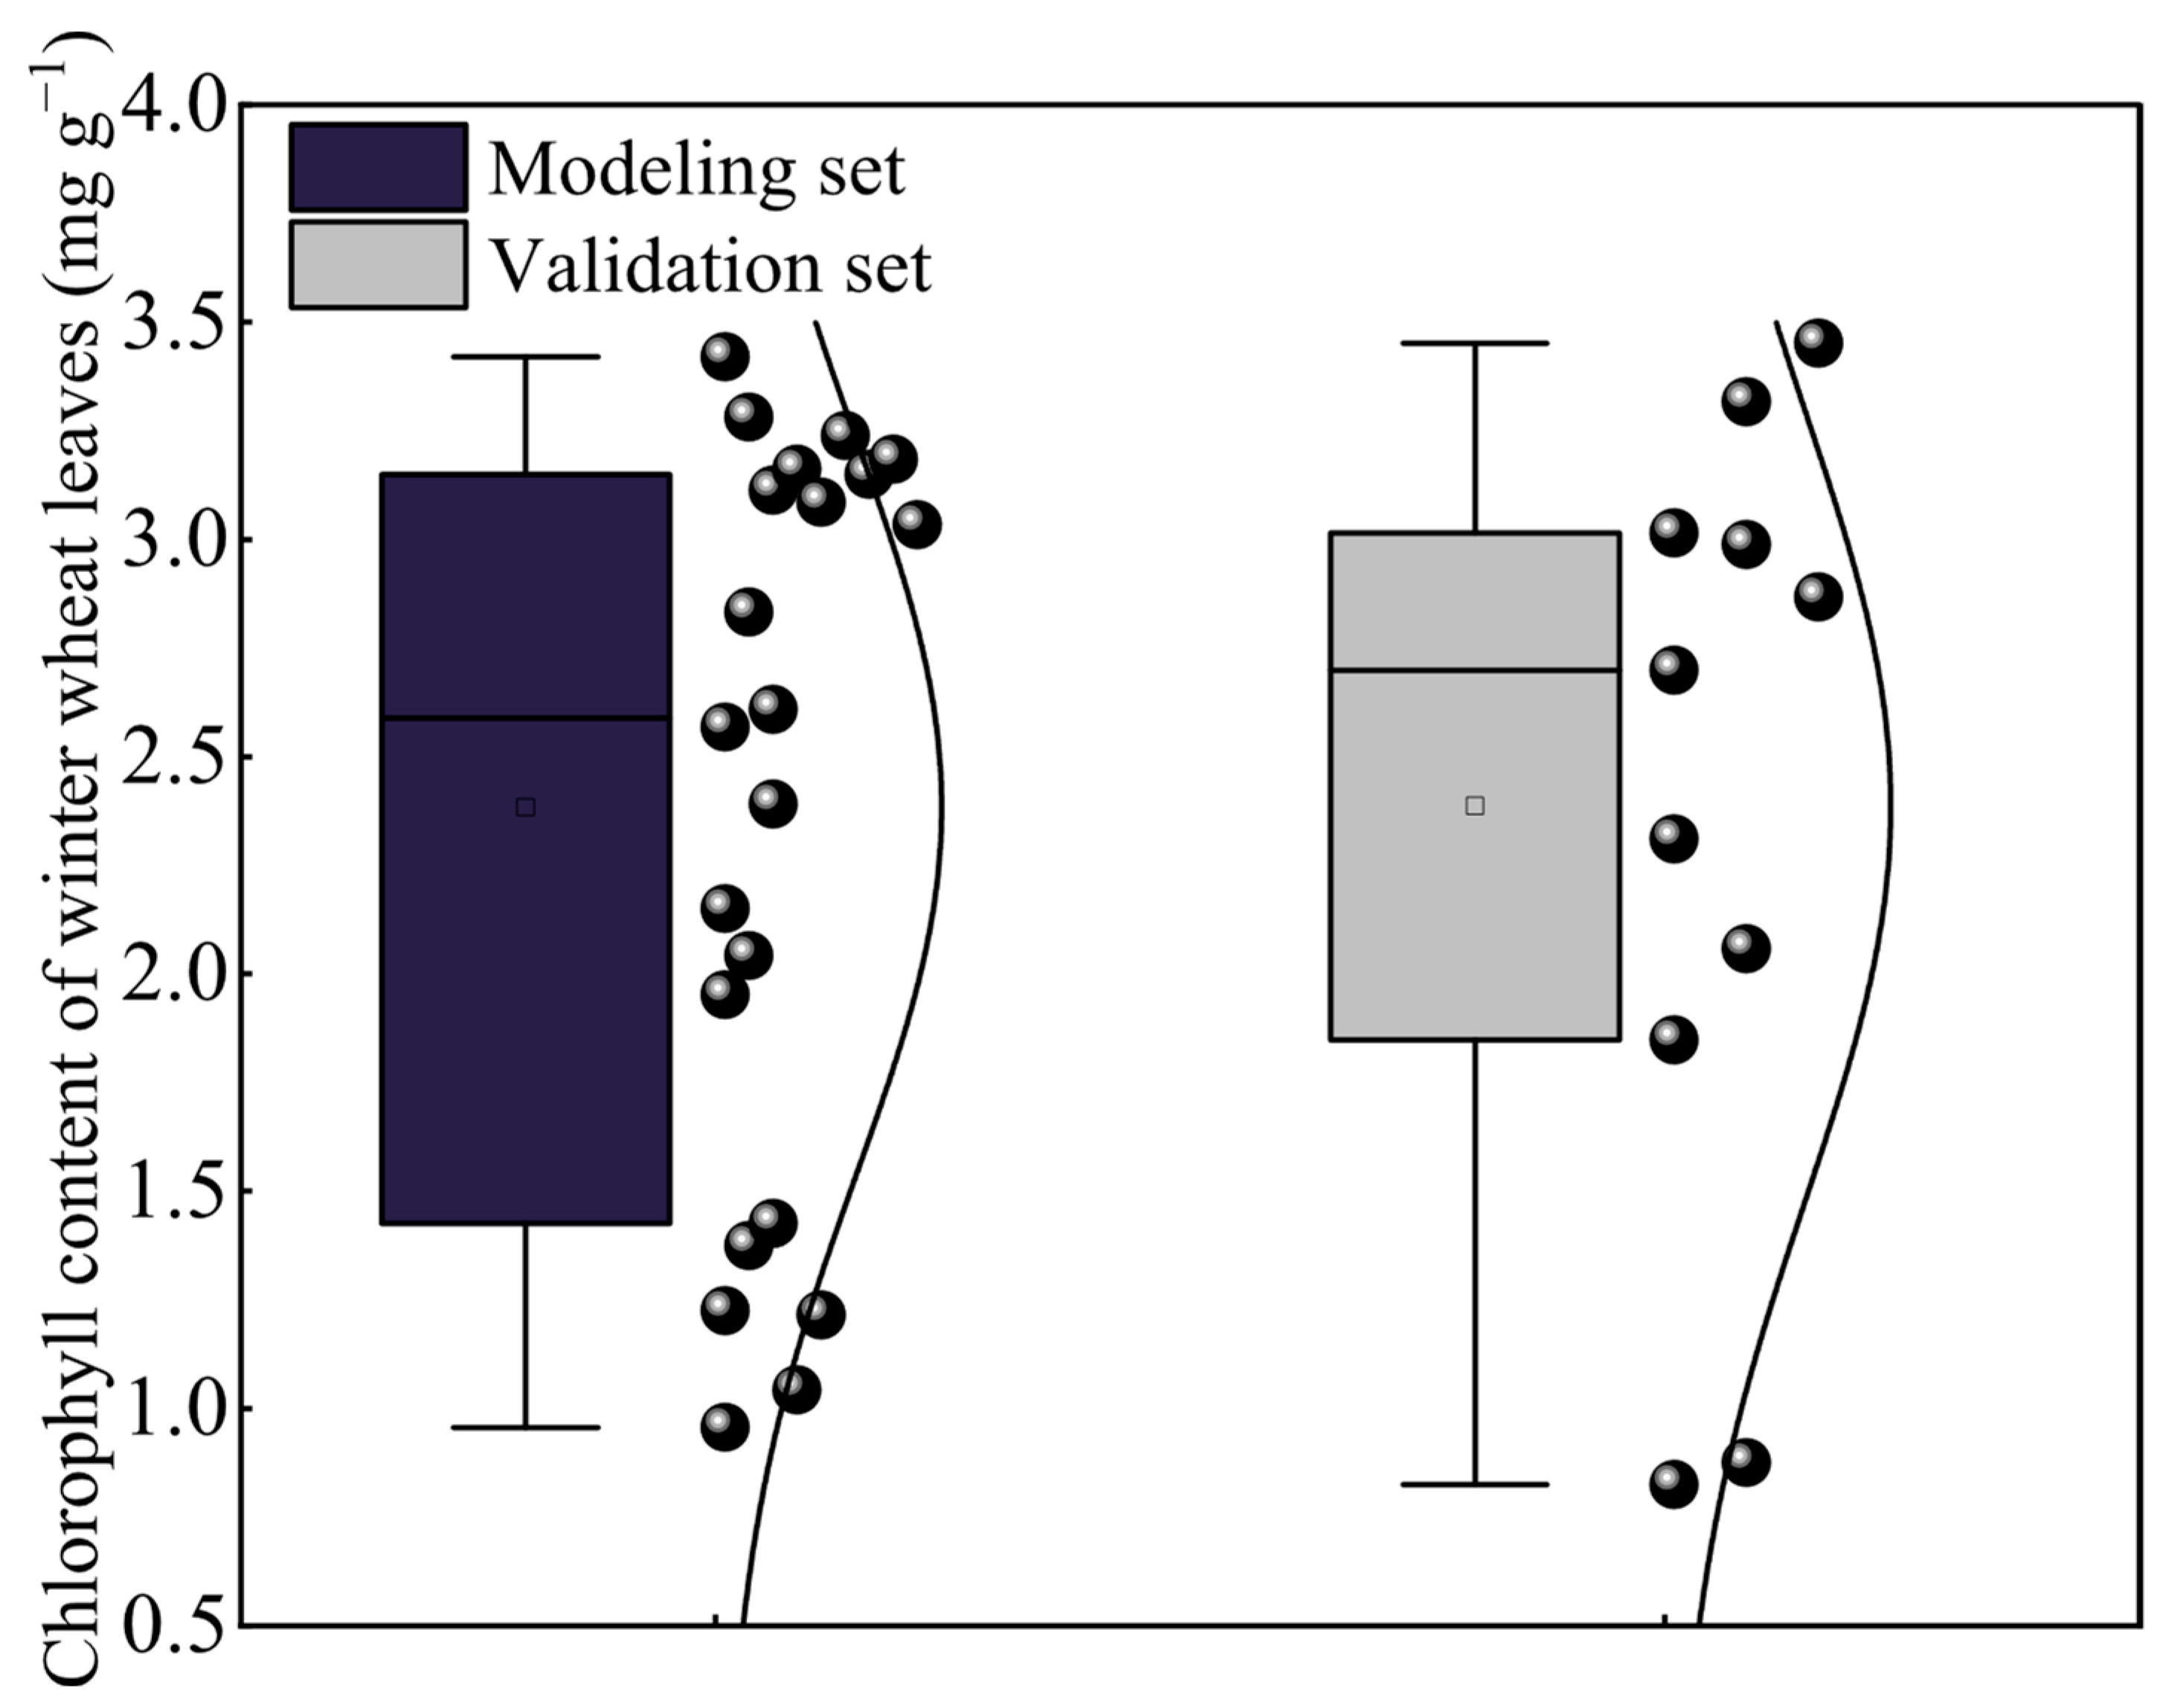
We collected 68 jointing-stage specimens and retained 66 after Grubbs-based outlier removal (α = 0.05). The retained data were stratified and randomly divided into a calibration cohort (n = 44; two-thirds) and a hold-out validation cohort (n = 22; one-third). Descriptive chlorophyll statistics for both cohorts are shown in Figure 1. Model performance metrics included R2, RMSE, and MRE [23,40].
Because the preceding modeling was primarily based on jointing samples, this section uses independent observations from the grain-filling stage of the 2019–2020 growing season in Yangling (representative sampling date: 15 May 2020) to verify cross-phenology applicability and robustness. These external data comprised synchronous canopy hyperspectral reflectance and destructive chlorophyll measurements, strictly following the same acquisition and preprocessing procedures described above and without participating in any additional processes. The optimal fused index inputs and best machine-learning model determined in the previous section were then directly applied to this external dataset. Metrics including R2, RMSE, and MRE were used to quantitatively assess model generalization under a different phenological stage, providing a basis for promoting the model in real production scenarios.

3. Results

3.1. Correlation Between Spectral Indices and Winter Wheat Chlorophyll Content

The correlation analysis between empirical spectral indices and winter wheat chlorophyll content is shown in Table 2.
The results indicate that most spectral indices exhibit significant correlations with winter wheat chlorophyll content (p < 0.05). Among them, the highest correlation was observed for the new double difference index (NDDI), with a value of 0.637. Therefore, in this section, DDI, MNDVI, NDDI, RDVI, CI, MTCI, and Gitelson2 are selected as Input Set 1 for modeling.

3.2. Correlation Between Optimal Spectral Indices and Winter Wheat Chlorophyll Content

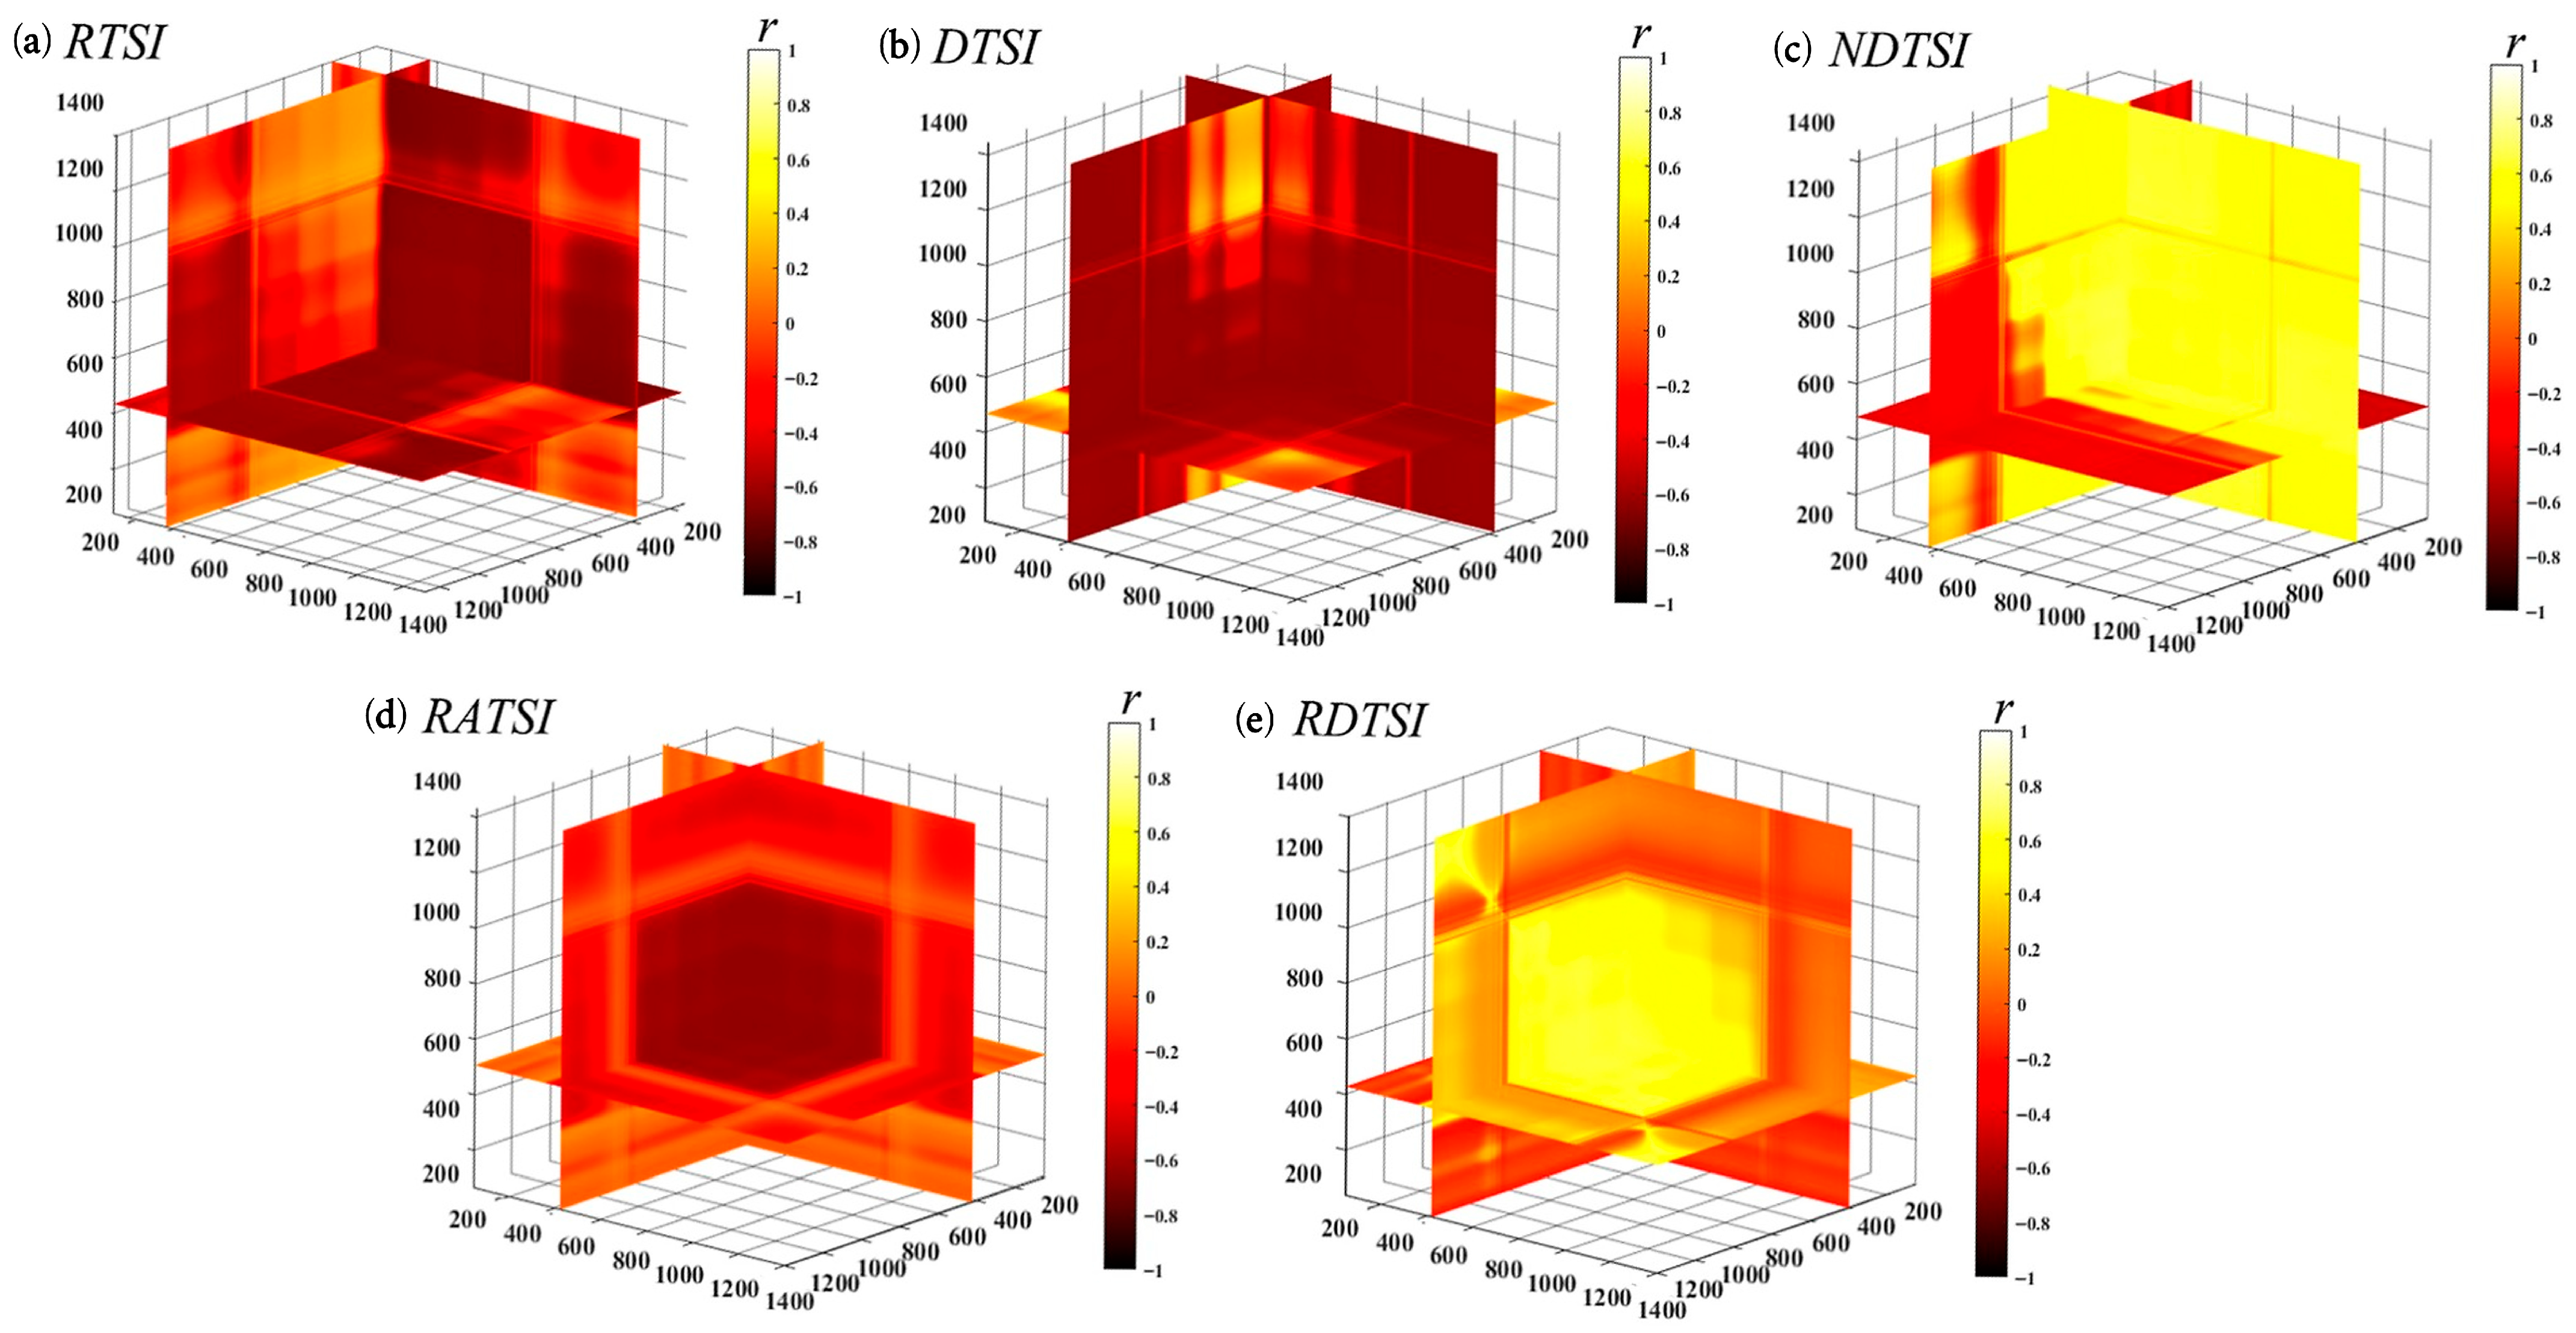
The correlation analysis results between the optimal spectral indices (2D/3D) constructed using the correlation-matrix approach and leaf chlorophyll content are summarized in Figure 2 and Figure 3 and Table 3. All selected optimal indices showed significant correlations with chlorophyll content (p < 0.05). Notably, most three-dimensional optimal spectral indices (3D OSI) displayed stronger correlations than their two-dimensional counterparts (2D OSI). Among the 3D OSI, the DTSI (band positions: 680, 807, and 1822 nm) achieved the highest Pearson correlation (r = 0.703). Among the 2D OSI, DI (band positions: 360 and 742 nm) had the highest correlation (r = 0.686).
Accordingly, SAVI, NDVI, TVI, mSR, mNDI, RI, and DI are selected as Input Set 2; RTSI, DSTI, NDTSI, RDTSI, and RATSI are selected as Input Set 3 for modeling.

3.3. Construction of Chlorophyll Estimation Models for Winter Wheat

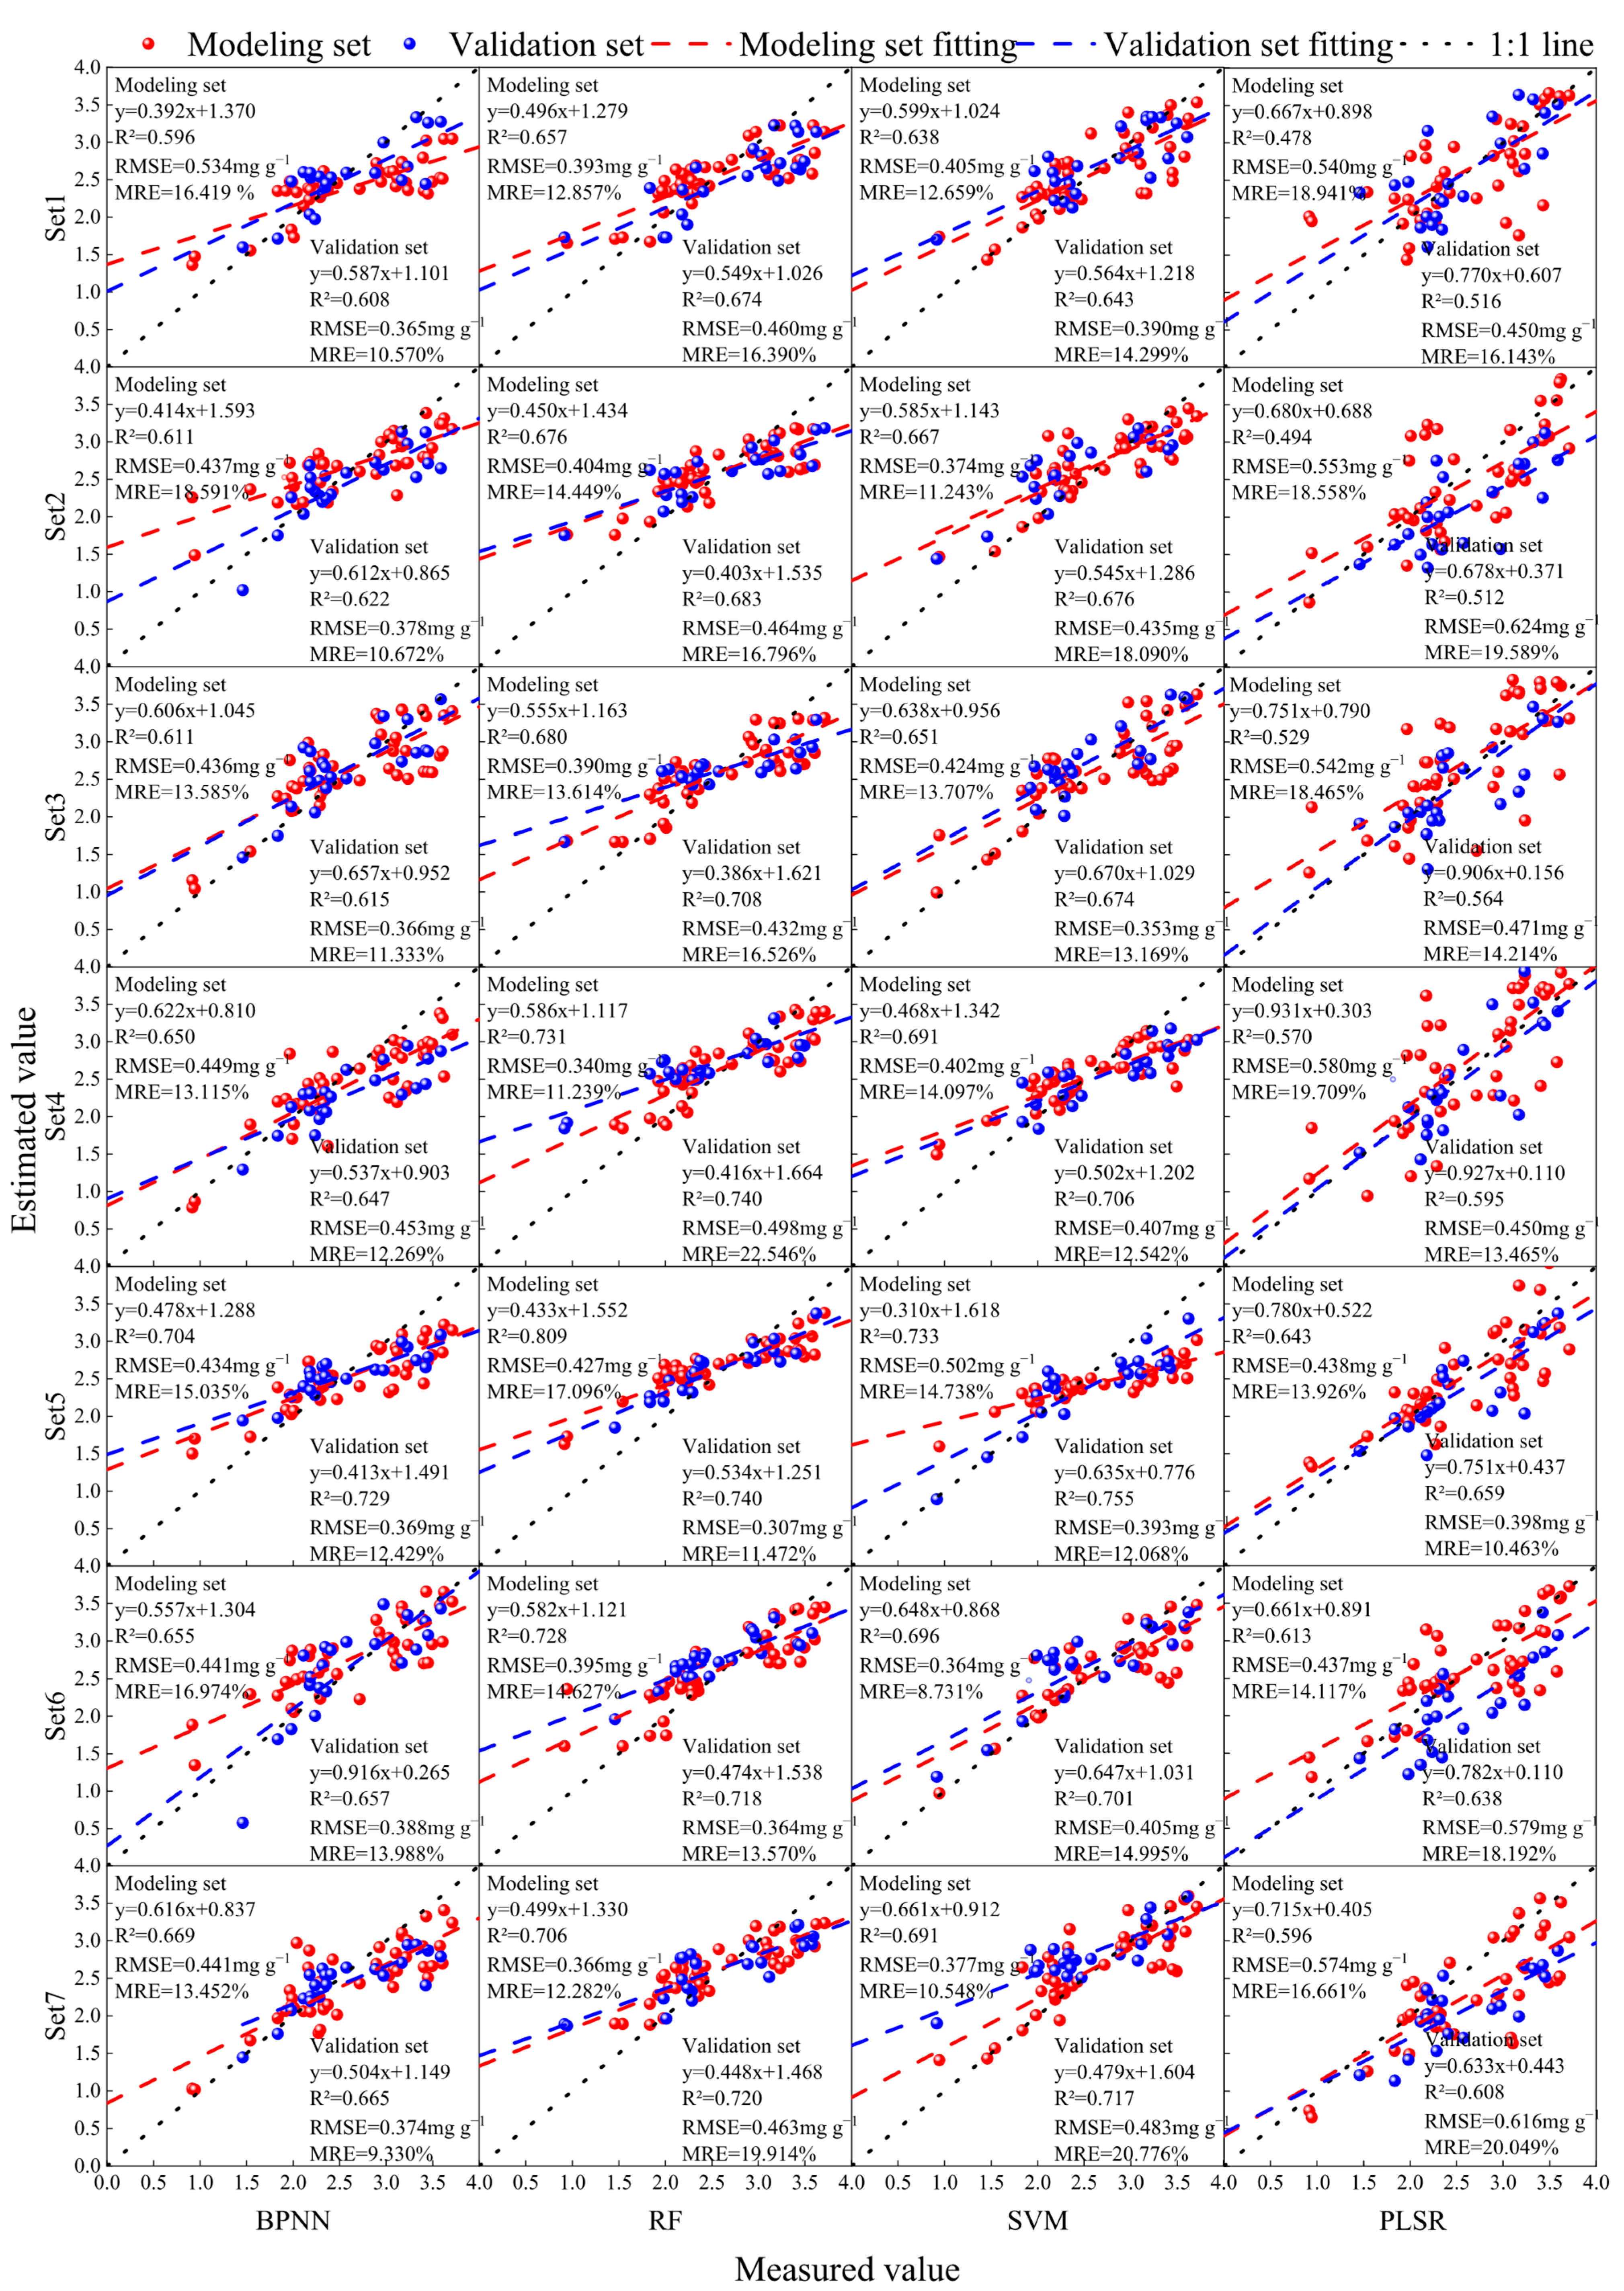
The input sets established in Section 2.1 and Section 2.2 were combined with four classical machine-learning models to construct leaf chlorophyll estimation models. Building on the original inputs (Input Sets 1–3), four additional fused input sets were defined: Input Set 4 (Set 1 + Set 2), Input Set 5 (Set 1 + Set 3), Input Set 6 (Set 2 + Set 3), and Input Set 7 (Set 1 + Set 2 + Set 3). Comparative modeling performance is shown in Figure 4. Under single-input conditions (Sets 1–3), models based on the 3D OSI (Input Set 3) achieved the best fit. For multi-input fusions, Input Set 5 (empirical indices + 3D OSI) yielded higher estimation accuracy. Specifically, Input Set 5 + RF achieved the best results, with R2 = 0.809, RMSE = 0.427 mg g−1, and MRE = 17.096% on the modeling set, and R2 = 0.816, RMSE = 0.307 mg g−1, and MRE = 11.472% on the validation set. The model R2 was significantly higher than other combinations (p < 0.05) (Table 4).

3.4. External Validation and Model Evaluation for Winter Wheat Chlorophyll Content

Given that the preceding models were primarily developed and optimized using jointing-stage data, an independent dataset from the grain-filling stage of the 2019–2020 season (Figure 5) was introduced for external validation to assess the cross-phenology applicability of the Input Set 5 + RF configuration. First, correlations of empirical indices and 3D OSI with chlorophyll content were evaluated (Figure 6; Table 5 and Table 6): chlorophyll content was significantly correlated with most empirical indices (p < 0.05) and with all three-dimensional optimal indices (p < 0.05). Among empirical indices, NDDI had the highest correlation (r = 0.543); among three-dimensional indices, RTSI performed best (r = 0.686; corresponding to 699, 716, and 783 nm). Without altering any parameters or screening procedures, directly applying Input Set 5 + RF to the grain-filling dataset yielded R2 = 0.897, RMSE = 0.422 mg g−1, and MRE = 21.847% (Figure 7). These results are comparable to the modeling performance at jointing, indicating that the proposed input-fusion strategy and model possess cross-stage transferability and can provide consistent accuracy for chlorophyll monitoring across phenological phases.

4. Discussion

Leaf chlorophyll content in winter wheat directly reflects crop growth status [41]. Hyperspectral remote sensing, leveraging the combined advantages of imaging and spectroscopy, simultaneously records crop reflectance across multiple bands; changes in chlorophyll content induce pronounced reflectance differences in absorption bands such as the red region [42]. By exploiting wide spectral coverage and high spectral resolution, chlorophyll distributions over large areas can be obtained rapidly and nondestructively, thereby supporting crop-growth monitoring, nutritional diagnosis, and precision fertilization [43]. Compared with traditional methods, hyperspectral techniques infer plant physiological and nutritional status from spectral features and thus can guide agricultural management more effectively [44].
The greater sensitivity of three-dimensional spectral indices (e.g., the DTSI using 680, 807, and 1822 nm) to chlorophyll arises because they simultaneously encompass chlorophyll absorption and information on canopy structure and water status. The 680 nm band coincides with the strong absorption peak of chlorophyll a; as chlorophyll content increases, reflectance at this band declines markedly [45]. The 807 nm band lies on the near-infrared reflectance plateau, where signals are primarily driven by internal leaf structure and air spaces; reflectance varies substantially with changes in leaf biomass or internal structure and can compensate for saturation of red-band indices at high chlorophyll [46]. The 1822 nm band is near a shortwave-infrared water absorption feature and is sensitive to leaf water content and dry matter (e.g., colloidal structure); because water content and chlorophyll content are typically positively correlated, reflectance changes at this band also indirectly reflect plant physiological status [47,48]. By contrast, the 2D index DI uses 360 nm in the ultraviolet region [49], which is mainly influenced by epidermal absorption and non-chlorophyll pigments (e.g., flavonoids, anthocyanins) and does not directly respond to chlorophyll absorption; 742 nm is close to the red-edge region, which is chlorophyll-sensitive but prone to saturation at higher concentrations [50]. Therefore, the three-band composition of DTSI jointly captures the chlorophyll absorption peak, leaf structural information, and water status, yielding higher correlations.
In fused models, combining empirical spectral indices with 3D optimal spectral indices exploits the complementarity of their spectral information to improve chlorophyll estimation accuracy. Empirical indices typically emphasize chlorophyll absorption features and reflect greenness changes [51], whereas 3D indices introduce additional bands to capture canopy structural and water-content information, compensating for the limitations of dual-band indices. However, when they rely on identical or highly correlated bands, redundancy and multicollinearity can arise. For example, chlorophyll content and leaf area index exhibit similar spectral responses near 550 nm and 750 nm [52]; consequently, single dual-band indices may fail to disentangle their joint effects on spectra, thereby reducing model accuracy. Although a standalone 3D index provides only a limited improvement in correlation over 2D indices, fusing it with empirical indices within machine-learning models yields a much more pronounced gain in generalization, indicating that the benefits of the 3D OSI are realized primarily at the model level via complementary information.
Random forest outperformed support vector machines and BP neural networks in this study primarily because of its robust handling of high-dimensional, nonlinear features [53]. As an ensemble of multiple decision trees, RF is resilient to datasets containing numerous redundant or correlated variables, reduces overfitting via majority voting, and provides automatic variable-importance assessment [54]. Prior studies indicate that RF effectively addresses high dimensionality and multicollinearity in remote-sensing data while maintaining fast computation [55]. By comparison, SVM requires meticulous kernel and hyperparameter tuning and imposes a heavier computational burden for large spectral datasets [21]; BP neural networks require large training samples, are prone to local minima, and are sensitive to parameter choices [37]. Overall, RF captures complex nonlinear relationships in spectral data with fewer tuning requirements and stable convergence [56], and therefore often achieves higher accuracy than SVM and BP in chlorophyll estimation. Due to its linearity assumption and the construction of latent variables by maximizing covariance, PLSR struggles to capture the nonlinear/saturating behavior and higher-order interactions in the chlorophyll–spectral relationship; under strong collinearity and noise it is sensitive to the number of components and prone to underfitting, thereby yielding lower overall fitting accuracy [4].
Using robust, comparable generic empirical indices as a baseline, this study aims to evaluate the incremental value of 3D OSI under limited-sample conditions. At the current scale, indiscriminately expanding the index library risks multiple comparisons and redundant collinearity; therefore, not all chlorophyll indices were included. In subsequent work with larger samples and multiple sites, we will systematically add extended indices such as MCARI, OSAVI, and PRI, and assess their relative contributions using feature-selection methods with FDR correction [57,58]. Enumeration and screening of 3D indices will be confined to the training folds within a nested cross-validation framework, with multiple-comparison control to mitigate selection bias arising from “picking winners” out of a vast combination space. Regarding sample size and external validation, the present n is small, and same-site cross-phenology external tests only suggest transferability over certain periods, which is insufficient to demonstrate spatial robustness [59,60]. Constrained by the training-set size, we did not adopt LOYO validation; to maintain training stability, we used stratified random splits, the out-of-bag (OOB) evaluation of RF, and phenology-specific external validation to jointly curb overfitting [61,62]. Going forward, we will expand years and plots, cover multiple cultivars/soils/climates, and conduct cross-year/cross-site external validation to systematically assess spatiotemporal generalization. To alleviate spectral redundancy, we will explore LASSO/Elastic Net, RFE/Boruta, mutual-information screening, and automated feature-selection approaches such as SPA, CARS, and MC-UVE [63,64]. On the sensing and application side, the sensitivity advantage of 3D OSI entails certain computational and spectral bandwidth/precision costs; large-area deployment must account for observation geometry, soil background, and atmospheric conditions [65]. Future work will primarily leverage UAV hyperspectral data, with satellite multispectral imagery providing spatiotemporal supplementation. We will produce spatiotemporal chlorophyll maps during the critical jointing–booting window and integrate them with field crop models to support experiments and variable-rate nitrogen application. In addition, we will explore automated index generation or moderately deep feature extraction and couple these with physical models (e.g., PROSPECT/PROSAIL) to reduce reliance on manual screening and improve transferability [66,67].

5. Conclusions

Using canopy hyperspectral reflectance acquired from winter wheat plot experiments at the jointing stage during 2019–2020, together with two-/three-dimensional optimal spectral indices constructed via a correlation-matrix method and classical empirical vegetation indices, this study estimated winter wheat chlorophyll content with three machine-learning models. Significant relationships with chlorophyll (p < 0.05) were observed for over half of the empirical indices, among which the new double difference index (NDDI) ranked highest (r = 0.637). Within the constructed 3D OSI set, DTSI (680, 807, 1822 nm) reached r = 0.703 (p < 0.05). Comparative modeling showed that, under the fused Input Set 5 (empirical indices + 3D OSI), the RF model performed best, with validation R2 = 0.816, RMSE = 0.307 mg g−1, and MRE = 11.472%. By contrast, models using only 3D OSI (Set 3) fit well but were slightly inferior in overall accuracy. In summary, this study, for the first time, combines three-dimensional spectral indices with classical empirical vegetation indices and employs RF to achieve high-accuracy, nondestructive estimation of winter wheat chlorophyll content, providing a reliable technical pathway and theoretical basis for future hyperspectral remote sensing of crop physiological status and precision agricultural management. The proposed “empirical indices + 3D OSI + RF” scheme is highly feasible and well suited for integration into routine UAV field-scouting workflows to generate chlorophyll maps and support in-season nitrogen optimization and precision management. Future work should conduct systematic external validation across multiple regions, years, cultivars, and management scenarios to comprehensively assess spatiotemporal generalization and robustness. At the sensor level, UAV hyperspectral platforms can implement the 3D indices directly; on the satellite multispectral side, progressive operationalization can be achieved via approximate bandwidth combinations or customized narrow bands.

Author Contributions

Z.L., Conceptualization, Data curation, Methodology, Investigation, Roles, Writing—original draft. W.Z. and Z.T., Data curation, Formal analysis, Investigation, Methodology. Y.X. and F.Z., Conceptualization, Writing-review & editing, Supervision, Formal analysis, Funding support. All authors have read and agreed to the published version of the manuscript.

Funding

This study was supported by Key R&D Program of Shaanxi Province, Undergraduate experimental teaching reform research project (SY202402001), the National Natural Science Foundation of China (No. 52179045), Innovative Experimental Project for College Students (202400860A9).

Data Availability Statement

The original contributions presented in this study are included in the article. Further inquiries can be directed to the corresponding authors.

Conflicts of Interest

The authors declare no conflicts of interest.

References

  1. Adil, M.; Wang, Z.C.; Chen, Y.; Lu, H.; Lu, S.Q.; Bashir, S.; Gul, I.; Li, H.; Han, Z.R.; Feng, W.F. Long-term impacts of agronomic practices on winter wheat yield, water use efficiency, and nitrogen use efficiency in global dryland regions: A meta-analysis. Soil Tillage Res. 2025, 253, 106653. [Google Scholar] [CrossRef]
  2. Yang, J.; Zhang, S.J.; Zhang, J.H.; Zhao, S.; Lu, H.T.; Li, L.W.; Liu, L.T.; Wang, G.Y. Incorporating crop rotation into the winter wheat–summer maize system to enhance soil multifunctionality and sustainable grain production in the North China Plain. Field Crops Res. 2025, 325, 109834. [Google Scholar] [CrossRef]
  3. Li, R.; Chen, Y.Z.; Chai, Y.W.; Li, Y.W.; Ma, J.T.; Cheng, H.B.; Chang, L.; Chai, S.X. Optimizing straw strip-mulching to enhance winter wheat productivity in semi-arid drylands. Field Crops Res. 2025, 329, 109957. [Google Scholar] [CrossRef]
  4. Tang, Z.J.; Lu, J.S.; Xiang, Y.Z.; Shi, H.Z.; Sun, T.; Zhang, W.; Wang, H.; Zhang, X.Y.; Li, Z.J.; Zhang, F.C. Farmland mulching and optimized irrigation increase water productivity and seed yield by regulating functional parameters of soybean (Glycine max L.) leaves. Agric. Water Manag. 2024, 298, 108875. [Google Scholar] [CrossRef]
  5. Tang, Z.J.; Wang, X.; Xiang, Y.Z.; Liang, J.P.; Guo, J.J.; Li, W.Y.; Lu, J.S.; Du, R.Q.; Li, Z.J.; Zhang, F.C. Application of hyperspectral technology for leaf function monitoring and nitrogen nutrient diagnosis in soybean (Glycine max L.) production systems on the Loess Plateau of China. Eur. J. Agron. 2024, 154, 127098. [Google Scholar] [CrossRef]
  6. Shi, H.Z.; Guo, J.; An, J.Q.; Tang, Z.J.; Wang, X.; Li, W.Y.; Zhao, X.; Jin, L.; Xiang, Y.Z.; Li, Z.J.; et al. Estimation of chlorophyll content in soybean crop at different growth stages based on optimal spectral index. Agronomy 2023, 13, 663. [Google Scholar] [CrossRef]
  7. Zhang, N.; Pan, Y.; Feng, H.; Zhao, X.; Yang, X.; Ding, C.; Yang, G. Development of fusarium head blight classification index using hyperspectral microscopy images of winter wheat spikelets. Biosyst. Eng. 2019, 186, 83–99. [Google Scholar] [CrossRef]
  8. Filchev, L.; Pashova, L.; Kolev, V.; Frye, S. Surveys, Catalogues, Databases/Archives, and State-of-the-Art Methods for Geoscience Data Processing. In Knowledge Discovery in Big Data from Astronomy and Earth Observation; Elsevier: Amsterdam, The Netherlands, 2020. [Google Scholar] [CrossRef]
  9. Small, C.; Okujeni, A.; van der Linden, S.; Waske, B. 6.08-remote sensing of urban environments. In Comprehensive Remote Sensing, 2nd ed.; Liang, S., Ed.; Elsevier: Oxford, UK, 2026; pp. 117–148. ISBN 978-0-443-23949-6. [Google Scholar]
  10. Montanaro, G.; Carlomagno, A.; Giorio, P.; Petrozza, A.; Cellini, F.; Nuzzo, V. Are leaf chlorophyll fluorescence and dark green stressor-specific fingerprints in grapevine under drought or salt stress? A reanalysis study. Plant Stress 2025, 17, 100948. [Google Scholar] [CrossRef]
  11. Peng, S.; Bao, N.; Gu, N.; Qian, H.; Han, Z.; Zhou, B.; Chang, L. Enhanced assessment of chlorophyll-a and total nitrogen dynamics using unmanned aerial vehicle-based model and hyperspectral imagery in coastal wetland water. Environ. Technol. Innov. 2025, 40, 104521. [Google Scholar] [CrossRef]
  12. Li, P.Y.; Poblete, T.; Hornero, A.; Aryal, G.; Zarco-Tejada, P.J. Distinct contribution of the blue spectral region and far-red solar-induced fluorescence to needle nitrogen and phosphorus assessment in coniferous nutrient trials with hyperspectral imagery. Remote Sens. Environ. 2025, 328, 114915. [Google Scholar] [CrossRef]
  13. Niu, T.; Hou, Z.Z.; Yu, J.X.; Lu, J.; Yu, Q.; Yang, L.Z.; Ma, J.; Liu, Y.F.; Shi, H.; Jin, X.Y. Construction of prediction model for water retention of forest ecosystem in alpine region based on vegetation spectral features. Ecol. Indic. 2024, 169, 112889. [Google Scholar] [CrossRef]
  14. Zhang, J.; Zhang, D.F.; Cai, Z.J.; Wang, L.B.; Wang, J.; Sun, L.; Fan, X.F.; Shen, S.X.; Zhao, J.J. Spectral technology and multispectral imaging for estimating the photosynthetic pigments and SPAD of the Chinese cabbage based on machine learning. Comput. Electron. Agr. 2022, 195, 106814. [Google Scholar] [CrossRef]
  15. Li, Y.; Zhao, B.; Zhou, L.; Wei, L.G.; Dong, X.; Yuan, Y.W. Estimation of SPAD value of winter wheat at jointing stage based on multi-type parameters. Trans. Chin. Soc. Agric. Mach. 2025, 56, 513–521. (In Chinese) [Google Scholar]
  16. Cui, B.; Zhao, Q.J.; Huang, W.J.; Song, X.Y.; Ye, H.C.; Zhou, X.F. A new integrated vegetation index for the estimation of winter wheat leaf chlorophyll content. Remote Sens. 2019, 11, 974. [Google Scholar] [CrossRef]
  17. Liu, S.; Yu, H.Y.; Zhang, J.H.; Zhou, H.G.; Kong, L.J.; Zhang, L.; Dang, J.M.; Sui, Y.Y. Study on inversion model of chlorophyll content in soybean leaf based on optimal spectral indices. Spectrosc. Spectr. Anal. 2021, 41, 1912–1919. (In Chinese) [Google Scholar] [CrossRef]
  18. Tang, Z.J.; Xiang, Y.Z.; Wang, X.; Zhang, W.; Li, Z.J.; Zhang, F.C.; Chen, J.Y. Nitrogen nutrition diagnosis of winter oilseed rape using spectral indexes optimized by correlation matrix method. Trans. Chin. Soc. Agric. Eng. 2023, 39, 97–106. (In Chinese) [Google Scholar]
  19. Zhang, W.; Li, Z.J.; Pu, Y.; Zhang, Y.T.; Tamh, Z.J.; Fu, J.Y.; Xu, W.J.; Xiang, Y.Z.; Zhang, F.C. Estimation of the leaf area index of winter rapeseed based on hyperspectral and machine learning. Sustainability 2023, 15, 12930. [Google Scholar] [CrossRef]
  20. Zhou, J.; Li, F.; Wang, X.; Yin, H.; Zhang, W.; Du, J.; Pu, H. Hyperspectral and fluorescence imaging approaches for nondestructive detection of rice chlorophyll. Plants 2024, 13, 1270. [Google Scholar] [CrossRef]
  21. Xiang, Y.Z.; Wang, X.; An, J.Q.; Tang, Z.J.; Li, W.Y.; Shi, H.Z. Estimation of leaf area index of soybean based on fractional-order differentiation and optimal spectral index. Trans. Chin. Soc. Agric. Mach. 2023, 54, 329–342. (In Chinese) [Google Scholar]
  22. Geng, J.; Lv, J.W.; Pei, J.; Liao, C.H.; Tan, Q.Y.; Wang, T.X.; Fang, H.J.; Wang, L. Prediction of soil organic carbon in black soil based on a synergistic scheme from hyperspectral data: Combining fractional-order derivatives and three-dimensional spectral indices. Comput. Electron. Agr. 2024, 220, 108905. [Google Scholar] [CrossRef]
  23. Tang, Z.J.; Guo, J.J.; Xiang, Y.Z.; Lu, X.H.; Wang, Q.; Wang, H.D.; Cheng, M.H.; Wang, H.; Wang, X.; An, J.Q. Estimation of leaf area index and above-ground biomass of winter wheat based on optimal spectral index. Agronomy 2022, 12, 1729. [Google Scholar] [CrossRef]
  24. Cui, S.; Li, Z.; Tang, Z.; Zhang, W.; Sun, T.; Wu, Y.; Yang, W.; Chen, G.; Xiang, Y.; Zhang, F. Estimation of nitrogen concentration in winter wheat leaves based on a novel spectral index and machine learning model. Plants 2025, 14, 2772. [Google Scholar] [CrossRef] [PubMed]
  25. Wang, X.; Li, W.Y.; An, J.Q.; Shi, H.Z.; Tang, Z.J.; Guo, J.J.; Jin, L.; Xiang, Y.Z.; Li, Z.J.; Zhang, F.C. Effects of nitrogen supply on dry matter accumulation, water–nitrogen use efficiency and grain yield of soybean (Glycine max L.) under different mulching methods. Agronomy 2023, 13, 606. [Google Scholar] [CrossRef]
  26. Guo, J. Effects of Water and Nitrogen Regulation and Slow-Release Nitrogen Fertilizer Combined with Urea on Growth, Water and Nitrogen Utilization of Winter Wheat/Summer Maize. Ph.D. Thesis, Northwest A&F University, Yangling, China, 2022. (In Chinese). [Google Scholar]
  27. Bouslihim, Y.; Bouasria, A.; Minasny, B.; Castaldi, F.; Nenkam, A.M.; El Battay, A.; Chehbouni, A. Soil organic carbon prediction and mapping in morocco using PRISMA hyperspectral imagery and meta-learner model. Remote Sens. 2025, 17, 1363. [Google Scholar] [CrossRef]
  28. Laamrani, A.; Berg, A.A.; Voroney, P.; Feilhauer, H.; Blackburn, L.; March, M.; Dao, P.D.; He, Y.; Martin, R.C. Ensemble identification of spectral bands related to soil organic carbon levels over an agricultural field in southern Ontario, Canada. Remote Sens. 2019, 11, 1298. [Google Scholar] [CrossRef]
  29. Ma, P.; Zhuo, Y.; Chen, G.; Burken, J.G. Natural gas induced vegetation stress identification and discrimination from hyperspectral imaging for pipeline leakage detection. Remote Sens. 2024, 16, 1029. [Google Scholar] [CrossRef]
  30. Main, R.; Cho, M.A.; Mathieu, R.; O’Kennedy, M.M.; Ramoelo, A.; Koch, S. An investigation into robust spectral indices for leaf chlorophyll estimation. ISPRS J. Photogramm. Remote Sens. 2011, 66, 751–761. [Google Scholar] [CrossRef]
  31. Huete, A.R.; Liu, H.Q.; Batchily, K.; van Leeuwen, W. A comparison of vegetation indices over a global set of TM images for EOS-MODIS. Remote Sens. Environ. 1997, 59, 440–451. [Google Scholar] [CrossRef]
  32. Le Maire, G.; François, C.; Soudani, K.; Berveiller, D.; Pontailler, J.Y.; Bréda, N.; Genet, H.; Davi, H.; Dufrěne, E. Calibration and validation of hyperspectral indices for the estimation of broadleaved forest leaf chlorophyll content, leaf mass per area, leaf area index and leaf canopy biomass. Remote Sens. Environ. 2008, 112, 3846–3864. [Google Scholar] [CrossRef]
  33. Haboudane, D.; Miller, J.R.; Pattey, E.; Zarco-Tejada, P.J.; Strachan, I.B. Hyperspectral vegetation indices and novel algorithms for predicting green LAI of crop canopies: Modeling and validation in the context of precision agriculture. Remote Sens. Environ. 2004, 90, 337–352. [Google Scholar] [CrossRef]
  34. Hunt, E.R., Jr.; Daughtry, C.S.T.; Eitel, J.U.H.; Long, D.S. Remote Sensing Leaf Chlorophyll Content Using a Visible Band Index. Agron. J. 2011, 103, 1090–1099. [Google Scholar] [CrossRef]
  35. Apan, A.; Held, A.; Phinn, S.; Markley, J. Formulation and assessment of narrow-band vegetation indices from EO-1 Hyperion imagery for discriminating sugarcane disease. In Proceedings of the Spatial Sciences Conference 2003, Canberra, Australia, 17–23 September 2003. [Google Scholar]
  36. Zhang, D.; Zhao, Y.; Qin, K.; Zhao, N.B.; Yang, Y.C. Influence of spectral transformation methods on nutrient content inversion accuracy by hyperspectral remote sensing in black soil. Trans. Chin. Soc. Agric. Eng. 2018, 34, 141–147. (In Chinese) [Google Scholar] [CrossRef]
  37. Lu, X.H.; Gong, R.; Zhang, H.; Wang, Q.; Zhang, J.; Xie, R.X. Estimation of Photosynthetic Parameters of Cinnamomum camphora in Dwarf Forest Based on UAV Multi-spectral Remote Sensing. Trans. Chin. Soc. Agric. Mach. 2023, 54, 179–187. (In Chinese) [Google Scholar]
  38. Murai, T.; Tobari, T.; Kudo, S.; Saito, Y. Time-series characterization of various honey types under different storage conditions based on total polyphenol content and fluorescence properties. Appl. Food Res. 2025, 5, 101150. [Google Scholar] [CrossRef]
  39. Tang, Z.J.; Cai, Y.; Xiang, Y.; Lu, J.S.; Sun, T.; Shi, H.Z.; Liu, X.C.; Zhang, X.Y.; Li, Z.J.; Zhang, F.C. Nitrogen nutritional diagnosis of summer maize (Zea mays L.) based on a hyperspectral data collaborative approach—Evaluation of the estimation potential of three-dimensional spectral indices. Comput. Electron. Agric. 2025, 229, 109713. [Google Scholar] [CrossRef]
  40. Tang, Z.J.; Zhang, W.; Xiang, Y.; Li, Z.J.; Zhang, F.C.; Chen, J.Y. Monitoring of Soil Moisture Content of Winter Wheat Based on Hyperspectral and Machine Learning Models. Trans. Chin. Soc. Agric. Mach. 2023, 54, 350–358. (In Chinese) [Google Scholar]
  41. Liu, X.C.; Li, Z.J.; Xiang, Y.Z.; Tang, Z.J. Estimation of Winter Wheat Chlorophyll Content Based on Wavelet Transform and the Optimal Spectral Index. Agronomy 2024, 14, 1309. [Google Scholar] [CrossRef]
  42. Xu, H.F.; Yu, C.; Bai, Y.; Zuo, A.W.; Ye, Y.T.; Liu, Y.R.; Li, Z.K.; Dai, G.Z.; Chen, M.; Qiu, B.S. Red-light-dependent chlorophyll synthesis kindles photosynthetic recovery of chlorotic dormant cyanobacteria using a dark-operative enzyme. Curr. Biol. 2024, 34, 4424–4435.e3. [Google Scholar] [CrossRef]
  43. Hassan, M.A.; Chang, C.Y. PhenoGazer: A high-throughput phenotyping system to track plant stress responses using hyperspectral reflectance, nighttime chlorophyll fluorescence and RGB imaging in controlled environments. Plant Phenomics 2025, 7, 100047. [Google Scholar] [CrossRef]
  44. Poblete, T.; Watt, M.S.; Buddenbaum, H.; Zarco-Tejada, P.J. Chlorophyll content estimation in radiata pine using hyperspectral imagery: A comparison between empirical models, scaling-up algorithms, and radiative transfer inversions. Agric. For. Meteorol. 2025, 362, 110402. [Google Scholar] [CrossRef]
  45. Yao, H.X.; Li, J.S.; Zhou, Y.M.; Liu, Y.; Jiang, D.L.; Yin, S.J.; Jiang, X.Z.; Zhang, F.F.; Wang, S.L.; Zhang, B. A novel hyperspectral index for quantifying chlorophyll-a concentration in productive waters. Remote Sens. Environ. 2025, 328, 114847. [Google Scholar] [CrossRef]
  46. Gao, D.; Qiao, L.; Song, D.; Li, M.Z.; Sun, H.; An, L.L.; Zhao, R.M.; Tang, W.J.; Qiao, J.B. In-field chlorophyll estimation based on hyperspectral images segmentation and pixel-wise spectra clustering of wheat canopy. Biosyst. Eng. 2022, 217, 41–55. [Google Scholar] [CrossRef]
  47. Corrado, F.; Putzolu, F.; Armstrong, R.N.; Mondillo, M.; Chirico, R.; Massironi, M.; Fuller, D.; Ball, R.; Herrington, R.J. Application of satellite and proximal hyperspectral sensing to target lithium mineralization in volcano-sedimentary deposits: A case study from the McDermitt caldera, USA. Remote Sens. Environ. 2025, 323, 114724. [Google Scholar] [CrossRef]
  48. Prabhakar, M.; Padmavathi, C.; Thirupathi, M.; Golla, S.K.; Sravan, U.S.; Rao, G.R.; Kalpana, M.; Sailaja, V.; Chandana, P.; Prasad, Y. Remote sensing of rice leaf folder damage using ground-based hyperspectral radiometry. Smart Agric. Technol. 2025, 10, 100757. [Google Scholar] [CrossRef]
  49. Abukassem, I.; Bero, M.A. Spectral response of radiochromic gel detector in the near-ultraviolet region (200–400 nm). Radiat. Meas. 2016, 87, 43–48. [Google Scholar] [CrossRef]
  50. Gitelson, A.A.; Merzlyak, M.N.; Lichtenthaler, H.K. Detection of red edge position and chlorophyll content by reflectance measurements near 700 nm. J. Plant Physiol. 1996, 148, 501–508. [Google Scholar] [CrossRef]
  51. Hu, S.; Bao, Y.; Tubuxinbayaer; Tao, J.F.; Guo, E.L. Chlorophyll Content Inversion of Spring Wheat Based on Unmanned Aerial Vehicle Hyperspectral and Integrated Learning. J. Agric. Sci. Technol. 2025, 27, 93–103. (In Chinese) [Google Scholar] [CrossRef]
  52. Zahir, S.A.D.M.; Jamlos, M.F.; Omar, A.F.; Nordin, M.A.H.; Raypah, M.E.A.; Mamat, R.B.; Jamlos, M.A.; Muncan, J. Quantifying the impact of varied NPK fertilizer levels on oil palm plants during the nursery stage: A Vis–NIR spectral reflectance analysis. Smart Agric. Technol. 2025, 11, 100864. [Google Scholar] [CrossRef]
  53. Fu, X.; Luo, Z.; Yang, Y.; Zheng, Z.Q. Research on word memory retrieval difficulty prediction based on DBSCAN and random forest. Mod. Electron. Tech. 2023, 46, 105–110. (In Chinese) [Google Scholar]
  54. Zhao, Z.; Feng, Z.; Wang, Y.; Shao, Y.F.; Ren, J.J. Non-intrusive industrial load identification and robustness research based on wavelet transform random forests. Water Resour. Hydropower Eng. 2022, 53, 265–270. (In Chinese) [Google Scholar]
  55. Yi, H.; Niu, Z.; Li, X.; Li, B.; Jing, R. Robust recommendation algorithm combining random forest and target item identification. J. Shandong Univ. (Nat. Sci.) 2022, 57, 46–56. (In Chinese) [Google Scholar]
  56. Tang, Z.; Lu, J.; Sun, T.; Xiang, Y.Z.; Zhang, X.Y.; Li, Z.J.; Zhang, F.C. Nitrogen nutritional diagnosis of winter oilseed rape (Brassica napus L.) using fractional-order derivative hyperspectral indices: Field evaluation of dual nitrogen nutritional indices. Ind. Crops Prod. 2025, 235, 121660. [Google Scholar] [CrossRef]
  57. Feng, Y.; Wang, J.; Tang, Y. Estimation and inversion of soil heavy metal arsenic (as) based on UAV hyperspectral platform. Microchem J. 2024, 207, 112027. [Google Scholar] [CrossRef]
  58. Eshkabilov, S.; Lee, A.; Sun, X.; Lee, C.W.; Simsek, H. Hyperspectral imaging techniques for rapid detection of nutrient content of hydroponically grown lettuce cultivars. Comput. Electron. Agric. 2021, 181, 105968. [Google Scholar] [CrossRef]
  59. Cai, C.; Zhao, H.; Zhang, H.; Wang, C.; Wang, Z.; Liu, M.; Chen, J.; Zhang, H. Timely assessment of maize lodging severity with limited samples using multi-temporal sentinel-1 and sentinel-2 data across large spatial extents. Comput. Electron. Agric. 2025, 237, 110671. [Google Scholar] [CrossRef]
  60. Chen, C.; Zhang, C.; Zhao, L.; Yang, C.; Yao, X.; Fu, B. Soybean cultivation and crop rotation monitoring based on multi-source remote sensing data and bi-LSTM enhanced model. Comput. Electron. Agric. 2025, 239, 110959. [Google Scholar] [CrossRef]
  61. Bai, J.; Chen, W.; Yu, X. Real-time lithology identification based on dynamic felling strategy and differential evolutionary random forest algorithm. Geoenergy Sci. Eng. 2026, 256, 214172. [Google Scholar] [CrossRef]
  62. Hong, S.M.; Yoon, I.; Cho, K.H. Predicting the distribution coefficient of cesium in solid phase groups using machine learning. Chemosphere 2024, 352, 141462. [Google Scholar] [CrossRef]
  63. Qiu, T.; Song, C.H.; Clark, J.S.; Seyednasrollah, B.; Rathnayaka, N.; Li, J.X. Understanding the continuous phenological development at daily time step with a Bayesian hierarchical space-time model: Impacts of climate change and extreme weather events. Remote Sens. Environ. 2020, 247, 111956. [Google Scholar] [CrossRef]
  64. Li, L.; Wang, M.; Jiang, X.; Lin, Y. Universal multi-factor feature selection method for radiomics-based brain tumor classification. Comput. Biol. Med. 2023, 164, 107122. [Google Scholar] [CrossRef]
  65. Zhou, Y.; Marathe, S.; Zeman, M.; Isabella, O.; Ziar, H. Assessing the dual radiative consequences of urban PV integration: Albedo change and radiative forcing dynamics. Appl. Energy 2025, 401, 126544. [Google Scholar] [CrossRef]
  66. Sun, J.; Shi, S.; Yang, J.; Gong, W.; Qiu, F.; Wang, L.; Du, L.; Chen, B. Wavelength selection of the multispectral lidar system for estimating leaf chlorophyll and water contents through the PROSPECT model. Agric. For. Meteorol. 2019, 266–267, 43–52. [Google Scholar] [CrossRef]
  67. Li, D.; Wu, Y.; Berger, K.; Kuang, Q.; Feng, W.; Chen, J.M.; Wang, W.; Zheng, H.; Yao, X.; Zhu, Y. Estimating canopy nitrogen content by coupling PROSAIL-PRO with a nitrogen allocation model. Int. J. Appl. Earth Obs. Geoinf. 2024, 135, 104280. [Google Scholar] [CrossRef]
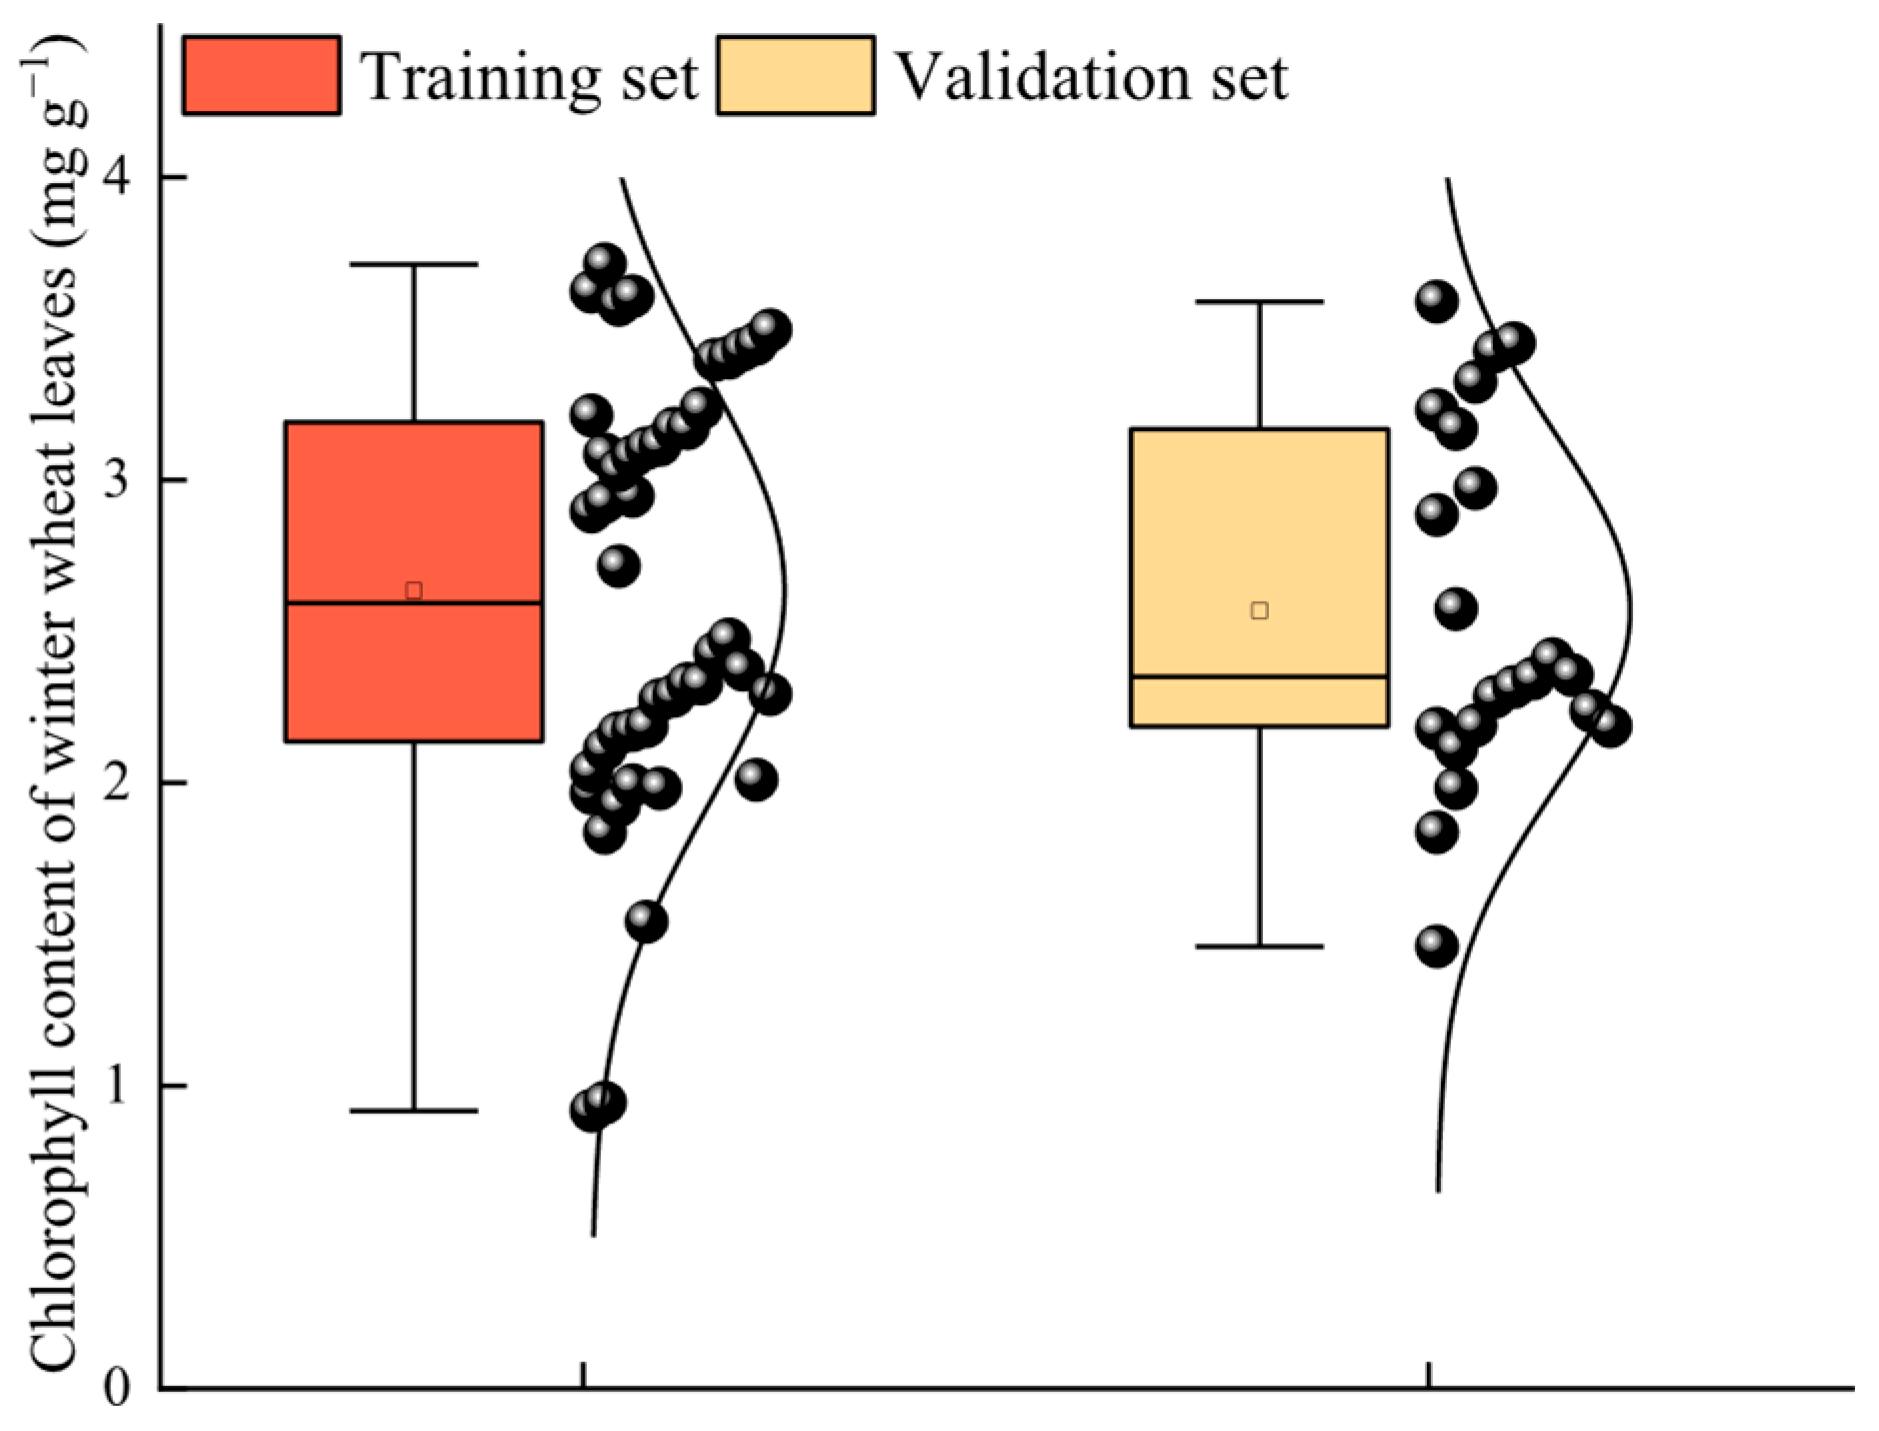
Figure 1. Statistical characteristics of chlorophyll content in winter wheat.
Agronomy 15 02376 g001
Figure 2. Correlation coefficient between chlorophyll content in winter wheat leaves and 2D OSI. (a): SAVI; (b): NDVI; (c): TVI; (d): mSR; (e): mNDI (f): RI (g): DI.
Agronomy 15 02376 g002
Figure 3. Correlation coefficient between chlorophyll content in winter wheat leaves and 3D OSI. (a): RTSI; (b): DTSI; (c): NDTSI; (d): RDTSI; (e): RATSI.
Agronomy 15 02376 g003
Figure 4. Results of chlorophyll content estimation models for winter wheat based on RF, BPNN, SVM and PLSR.
Agronomy 15 02376 g004
Figure 5. Statistical characteristics of chlorophyll content in winter wheat modeling set and validation set (Grain-filling period).
Agronomy 15 02376 g005
Figure 6. Correlation coefficient between chlorophyll content in winter wheat leaves and 3D OSI (Grain-filling period). (a): RTSI; (b): DTSI; (c): NDTSI; (d): RATSI; (e): RDTSI.
Agronomy 15 02376 g006
Figure 7. Chlorophyll content estimation model results of winter wheat at the grain filling stage based on RF and combination 5 (empirical spectral index + three-dimensional optimal spectral index).
Agronomy 15 02376 g007
Table 1. Calculating formula of classical spectral indices.
Spectral IndexFormulaReferences
DDI ( 749   n m 720   n m ) ( 701   n m 672   n m ) [30]
MNDVI 800   n m 680   n m 800   n m + 680   n m 2 445   n m [31]
NDDI 2 ( 710   n m 760   n m 760   n m ) [32]
RDVI 800   n m 670   n m ( 800   n m + 670   n m ) 0.5 [33]
CI         675   n m 690   n m 683   n m 2 [30]
MTCI 754   n m 709   n m 709   n m 681   n m [34]
Gitelson2 687   n m 500   n m 750   n m [35]
Table 2. Correlation results between empirical index and chlorophyll content of winter wheat (* Significant at p < 0.05).
Empirical Spectral IndexCorrelation
DDI0.574 *
MNDVI0.464 *
NDDI0.637 *
RDVI0.561 *
CI0.320 *
MTCI0.459 *
Gitelson20.238
Table 3. Correlation result between the optimal spectral index and chlorophyll content of winter wheat leaves (* Significant at p < 0.05).
Optimal Spectral IndexCorrelationPosition of Wavelength (i, j)/(nm)
SAVI0.619 *(720, 536)
NDVI0.585 *(1207, 1304)
TVI0.699 *(360, 747)
mSR0.585 *(1304, 1206)
mNDI0.585 *(1304, 1206)
RI0.585 *(1304, 1207)
DI0.686 *(360, 742)
RTSI0.682 *(1207, 750, 1318)
DTSI0.703 *(680, 807, 1822)
NDTSI0.644 *(1207, 1272, 1318)
RDTSI0.697 *(742, 742, 747)
RATSI0.698 *(738, 749, 881)
Table 4. Comparison table of R2 of various input combinations and machine learning models.
Machine Learning ModelModeling Set R2Validation Set R2
Set 1BPNN0.60l0.61kl
RF0.66hijk0.67g
SVM0.64k0.64hi
PLSR0.48o0.52n
Set 2BPNN0.61l0.62ijk
RF0.68fghi0.68efg
SVM0.67ghij0.68fg
PLSR0.49o0.51n
Set 3BPNN0.61l0.62jkl
RF0.68efgh0.71cde
SVM0.65ijk0.67g
PLSR0.53n0.56m
Set 4BPNN0.65ijk0.65hi
RF0.73b0.74ab
SVM0.69defg0.71cde
PLSR0.57m0.59l
Set 5BPNN0.70cde0.73bc
RF0.81a0.74ab
SVM0.73b0.76a
PLSR0.64jk0.66gh
Set 6BPNN0.66hijk0.66gh
RF0.73bc0.72bcd
SVM0.70def0.70def
PLSR0.61l0.64hij
Set 7BPNN0.67ghij0.67gh
RF0.71cd0.72bcd
SVM0.69defg0.72bcd
PLSR0.60l0.61kl
Significant level
Set ***
Machine learning model**
Set * Machine learning model**
Note: *, Significant at p < 0.05; **, Significant at p < 0.01. Different lower cases indicate significant differences among treatments.
Table 5. Correlation results between empirical index and chlorophyll content of winter wheat (Grain-filling period verification data, * Significant at p < 0.05).
Empirical IndexCorrelation
DDI0.448 *
MNDVI0.359 *
NDDI0.543 *
RDVI0.350 *
CI0.184
MTCI0.473 *
Gitelson20.447 *
Table 6. Correlation result between the optimal spectral index and chlorophyll content of winter wheat leaves (Grain-filling period verification data, * Significant at p < 0.05).
Empirical IndexCorrelationPosition of Wavelength (i, j)/(nm)
RTSI0.686(699, 716, 783)
DTSI0.640(719, 750, 816)
NDTSI0.642(758, 709, 829)
RDTSI0.651(749, 770, 777)
RATSI0.641(775, 773, 855)
Disclaimer/Publisher’s Note: The statements, opinions and data contained in all publications are solely those of the individual author(s) and contributor(s) and not of MDPI and/or the editor(s). MDPI and/or the editor(s) disclaim responsibility for any injury to people or property resulting from any ideas, methods, instructions or products referred to in the content.