1. Introduction
Considered a Western model derived from the Toyota Production System (TPS), Lean Production is a management philosophy that seeks to maximize product or service value by eliminating waste. In Lean, waste is considered anything that does not add value to the final product or the customer: unnecessary transportation, excessive inventory, unnecessary movement, waiting, overproduction, overprocessing, and defects. Initially applied in industry, it has been adopted by several sectors, including the manufacture of prefabricated steel structures for buildings, resulting in a 34% reduction in time and a 16% reduction in costs [
1,
2,
3].
Case studies and surveys have demonstrated that Lean tools, such as 5S, standard operating procedures, control charts, and value stream mapping, enhance operational efficiency, reduce waste, and foster safer and more organized farm environments. A survey of 132 fruit growers in South Africa found that larger farms implemented Lean concepts more easily, yielding consistent sustainability benefits. At a fruit distributor for short-shelf-life products, adopting Lean reduced losses, increased process efficiency, shortened cycle times, and optimized lead time. On dairy farms, the use of these concepts increased production and benefited animal health, and the application of 5S and standard operating procedures promoted a safer and more organized environment, improving process efficiency. Process stabilization is an essential requirement for reducing waste and increasing operational efficiency [
4,
5,
6]. The integration of Lean and Green Production approaches allows agricultural systems to simultaneously pursue economic and environmental benefits, as demonstrated in studies that applied sustainable value stream mapping and process optimization on rural properties. In this case, Green Production is a concept related to practices that emphasize environmental sustainability in agribusiness through the rational use of inputs, improved resource utilization, and waste reduction [
7].
In agriculture, one of the most important operations is spraying pesticides. It plays a vital role in crop protection, directly affecting productivity, quality, and economic outcomes, while also impacting the environment. The efficiency of this process depends not only on the sprayer design but also on operational parameters such as travel speed, nozzle type, working width, and control system precision. Variations in spray speed and control influence deposition, droplet size distribution, and drift potential, with significant effects on application quality and the environment. Technologies like application rate controllers and automatic sectioning systems have been introduced to reduce overlap, minimize application errors, and ensure more consistent deposition under varying field conditions. Localized spraying prevents unnecessary application of products, promoting less volume application, reduced costs, and less environmental impact [
8,
9,
10,
11].
In this context, variable rate spreading (VRT) emerges as a promising alternative to reduce waste and mitigate environmental impacts. By adjusting the application rate according to crop and field conditions, VRT minimizes excessive input use, improves application accuracy, and reduces the risks of drift and environmental hazards [
12,
13]. Although it involves higher investment costs and greater operational complexity, studies demonstrate its potential to increase pesticide use efficiency and make pollution practices more sustainable, reconciling economic and environmental benefits [
14,
15].
In spraying operations, only the time actually spent applying the pesticide, at the correct dose and location, adds value to the process. All other associated activities, such as machine maneuvers, refueling operations, and idle time, represent forms of waste. Most research focuses on isolated aspects, whether in the development of application technologies or in the ad hoc evaluation of operational indicators, without considering the combined application of management and sustainability tools. Given the importance of reducing inefficiencies and the need for real-time decision-making, and the fact that few studies have addressed the application of waste reduction concepts in real time and under field conditions, this study aims to analyze critical variables of the spraying process from the perspective of operational efficiency and waste reduction in soybean and corn crops.
2. Material and Methods
The study was conducted during the 2021/2022 harvest in commercial areas located in the state of Mato Grosso, Brazil (10°03′ S, 54°55′ W; altitude: 280 m), characterized by an average annual rainfall of 1721 mm and an average temperature of 24.1 °C. The total area covered approximately 6100 hectares, divided into 48 plots for soybean and corn cultivation.
Two self-propelled sprayers equipped with 183 kW (245 hp) engines and 36.0 m wide spray booms were used. Operational data—including equipment-related variables, fuel consumption, engine speed, operating pressure, and ground speed—were obtained from the Controller Area Network (CAN) and integrated with GNSS (Global Navigation Satellite System) receivers. The data was captured at a frequency of 0.2 Hz and made available by an agricultural machinery company. The classification of operational events was obtained from the sprayers’ on-board computer, which automatically recorded the allocation of time between different field activities, made available via commercial software. Manual records of 39 previously defined operational events were also integrated to ensure consistency. The 36.0 m boom enabled coverage of large areas per pass but required careful management of section overlap, particularly in irregularly shaped fields [
16]. An average overlap of 4.0% was considered, resulting in an effective working width of 34.6 m, which was incorporated into the calculation of operational field capacity (ha h
−1). This study was structured in five main stages: (i) data collection and transmission; (ii) data processing; (iii) grouping; (iv) analysis; and (v) determination of operational costs.
In the first stage, data captured by two sprayers were transmitted via the internet to a cloud server and subsequently accessed through the company’s management system. Data were collected during the 2021/2022 harvest for 168 days. Administrative work shifts (AWs) consisted of two daily shifts of 10 h each. Operational data include: timestamps (with millisecond resolution); machine status (operating or stopped); displacement speed (km h−1); fuel consumption per time (L h−1) and per area (L ha−1). Specifically for spraying operations, the following data were recorded: dosage applied (L ha−1), sprayer operating pressure (psi—pounds per square inch), overlap area (ha), and overlap percentage (%). The system also allows operators to enter up to 39 reasons for downtime, previously defined by company management. Additionally, it is mandatory to enter information such as the operator’s identification, the field area (ha), product specifications, and the respective work order opening.
During the data processing stage, records were organized chronologically based on timestamps (tn). The time differences between consecutive records (tn + 1 − tn), expressed in seconds, were determined to define the intervals corresponding to each event identified by a specific code. The times associated with the events were classified based on the methodology proposed by [
17] as: operation (TOp), active equipment performing its productive function; maneuver (TMn), active equipment, in motion, performing maneuvers necessary for the operation; supply (TSu), inactive equipment, stopped, supplying inputs; displacement for supply (TDs), active equipment, in motion, moving to the supply points; displacement (TDi): active equipment moving between plots or different areas; administrative (TAd), the equipment is available to operate but is not used due to administrative or managerial issues; maintenance (TMt): the equipment is unavailable due to corrective or preventive maintenance; climate (TCl): the equipment can operate but is not used due to unfavorable climate, soil or crop conditions; unreported (TUr): absence of record due to operator omission or system failure.
After classification, an analysis was performed to identify patterns of inconsistencies associated with processing errors, failures in event coding, incorrect nomenclature, or inaccuracies in sensor data capture. This analysis followed the methodology proposed by [
18] for processing data with temporal constraints, considering three main criteria: (i) identification of interruptions in the temporal sequence of records; (ii) verification of the occurrence of unrecorded periods between two consecutive active times; and (iii) assessment of coherence between successive records by analyzing their temporal correlation.
Using the same logic applied to time classification, the amount of time (hours) was categorized according to the following events: operation (HOp); maneuver (HMn); supply (HSu); displacement for supply (HDs); displacement (HDi); administrative (HAd); maintenance (HMt); climate (HCl); unreported (HUr).
The determination of hours for each event was obtained by converting the sum of the times, recorded in seconds, using Equation (1):
where
Hj = Total time of event j (h);
3600 = Conversion factor (s/h);
Tij = Time of break i associated with event j (s);
nj = Total number of breaks associated with event j.
To reconcile the total number of recorded hours with the administrative work shifts (AWs), two categories of hours were defined: unrecorded hours (HNr), which represent the difference between the administrative workday and the sum of the hours recorded in all events; and unscheduled hours (HUs), which indicate the difference between the sum of the hours actually recorded and the administrative workday (Equations (2) and (3)).
where
HNr = Unrecorded time (h);
AWs = Administrative work shifts (h);
HOp = Operating time (h);
HMn = Maneuvering time (h);
HSu = Supply time (h);
HDs = Displacement for supply time (h);
HDi = Displacement time (h);
HAd = Administrative time (h);
HMt = Maintenance time (h);
HCl = Climate-related downtime (h);
HUr = Time for unreported activities (h).
where
HUs = Unscheduled time (h).
To align the terminology with daily operations, the term administrative work shifts (AWs) was used when the work shift was equal to or less than the 10 h scheduled by the company. When it exceeded this value, the term was actual working hours (AcWh), indicating that the number of actual operating hours exceeded the number scheduled by management (10 h). This occurs to address unforeseen situations such as finishing an area or taking advantage of favorable operating conditions. To evaluate equipment performance, the hours were grouped into operational classes.
The hours and efficiencies classifications related to spraying operations followed standard procedures in studies of agricultural machinery. In this study, however, these well-established indicators were collected from the CAN bus at a rate of 0.2 Hz, allowing a methodological approach to identify non-value-added activities and support real-time management decisions. The definitions of hours and efficiency classifications are presented in
Appendix A.
The processed speed (km·h
−1) and fuel consumption (L·h
−1) data, obtained through the sprayers’ on-board systems, were analyzed to understand the behavior of these variables during work shifts. For this analysis, control charts with standard deviation and variable sampling were used, as presented by [
19].
The determination of the operational cost of spraying was performed using a model developed in a spreadsheet, whose input data included the area to be sprayed, the work shift, the hours associated with the events, and the sprayer and operation characteristics. The operational cost was determined by Equation (4):
where
OCs = Operational cost of the self-propelled sprayer (US$ ha−1);
CHp = Hourly cost of the self-propelled sprayer (US$ h−1);
OFc = Operational field capacity (ha h−1).
To determine the hourly cost of the self-propelled sprayer, the methodology proposed by the American Society of Agricultural and Biological Engineers (ASABE) [
20] was adopted, which includes the determination of fixed and variable costs. It should be noted that, in this study, only the cost related to the equipment was considered, without including labor costs. The hourly fixed cost was calculated according to Equation (5):
where
FCs = Fixed cost per hour (US$ h−1);
P = Purchase price of the sprayer (US$);
S = Scrap price of the sprayer (decimal);
L = Useful life (years);
i = Interest rate (decimal);
FAST = Safe housing factor and fees (US$);
TWi = Time worked in a year (h year−1).
The initial cost of the sprayer was obtained from the manufacturer, with reference to July 2024. The parameters for useful life, residual value, housing factor, insurance, and fees were adopted as per [
20]. The hourly variable cost was calculated using Equation (6):
where
VCs = Variable cost of the sprayer (US$ h−1);
FC = Fuel consumption (L h−1);
PF = Price per liter of fuel (US$ L−1);
FRM = Repair and maintenance factor, decimal;
L = Useful life of the sprayer (h).
Thus, the hourly cost of the self-propelled sprayer is given by Equation (7):
The analysis of the sprayer’s operational and economic performance was based on its working capacity (ha h
−1) and operational cost (US
$ ha
−1). For this purpose, a model in a spreadsheet was created based on the algorithm proposed by [
21]. The model’s input data allows for the calculation of the available hours for equipment operation throughout the harvest, based on the records. Based on the available hours and the total area to be sprayed, the work rate required to complete the spraying within the expected period is calculated. The amount of equipment is determined by the ratio between the work rate and the operational field capacity. A rounding coefficient allows for an integer adjustment of the number of equipment, either upward or downward. The model allows, through simulations, for the analysis of operational and economic performance and the possibilities for reducing waste in the spraying operation.
4. Discussion
4.1. Distribution of Hours
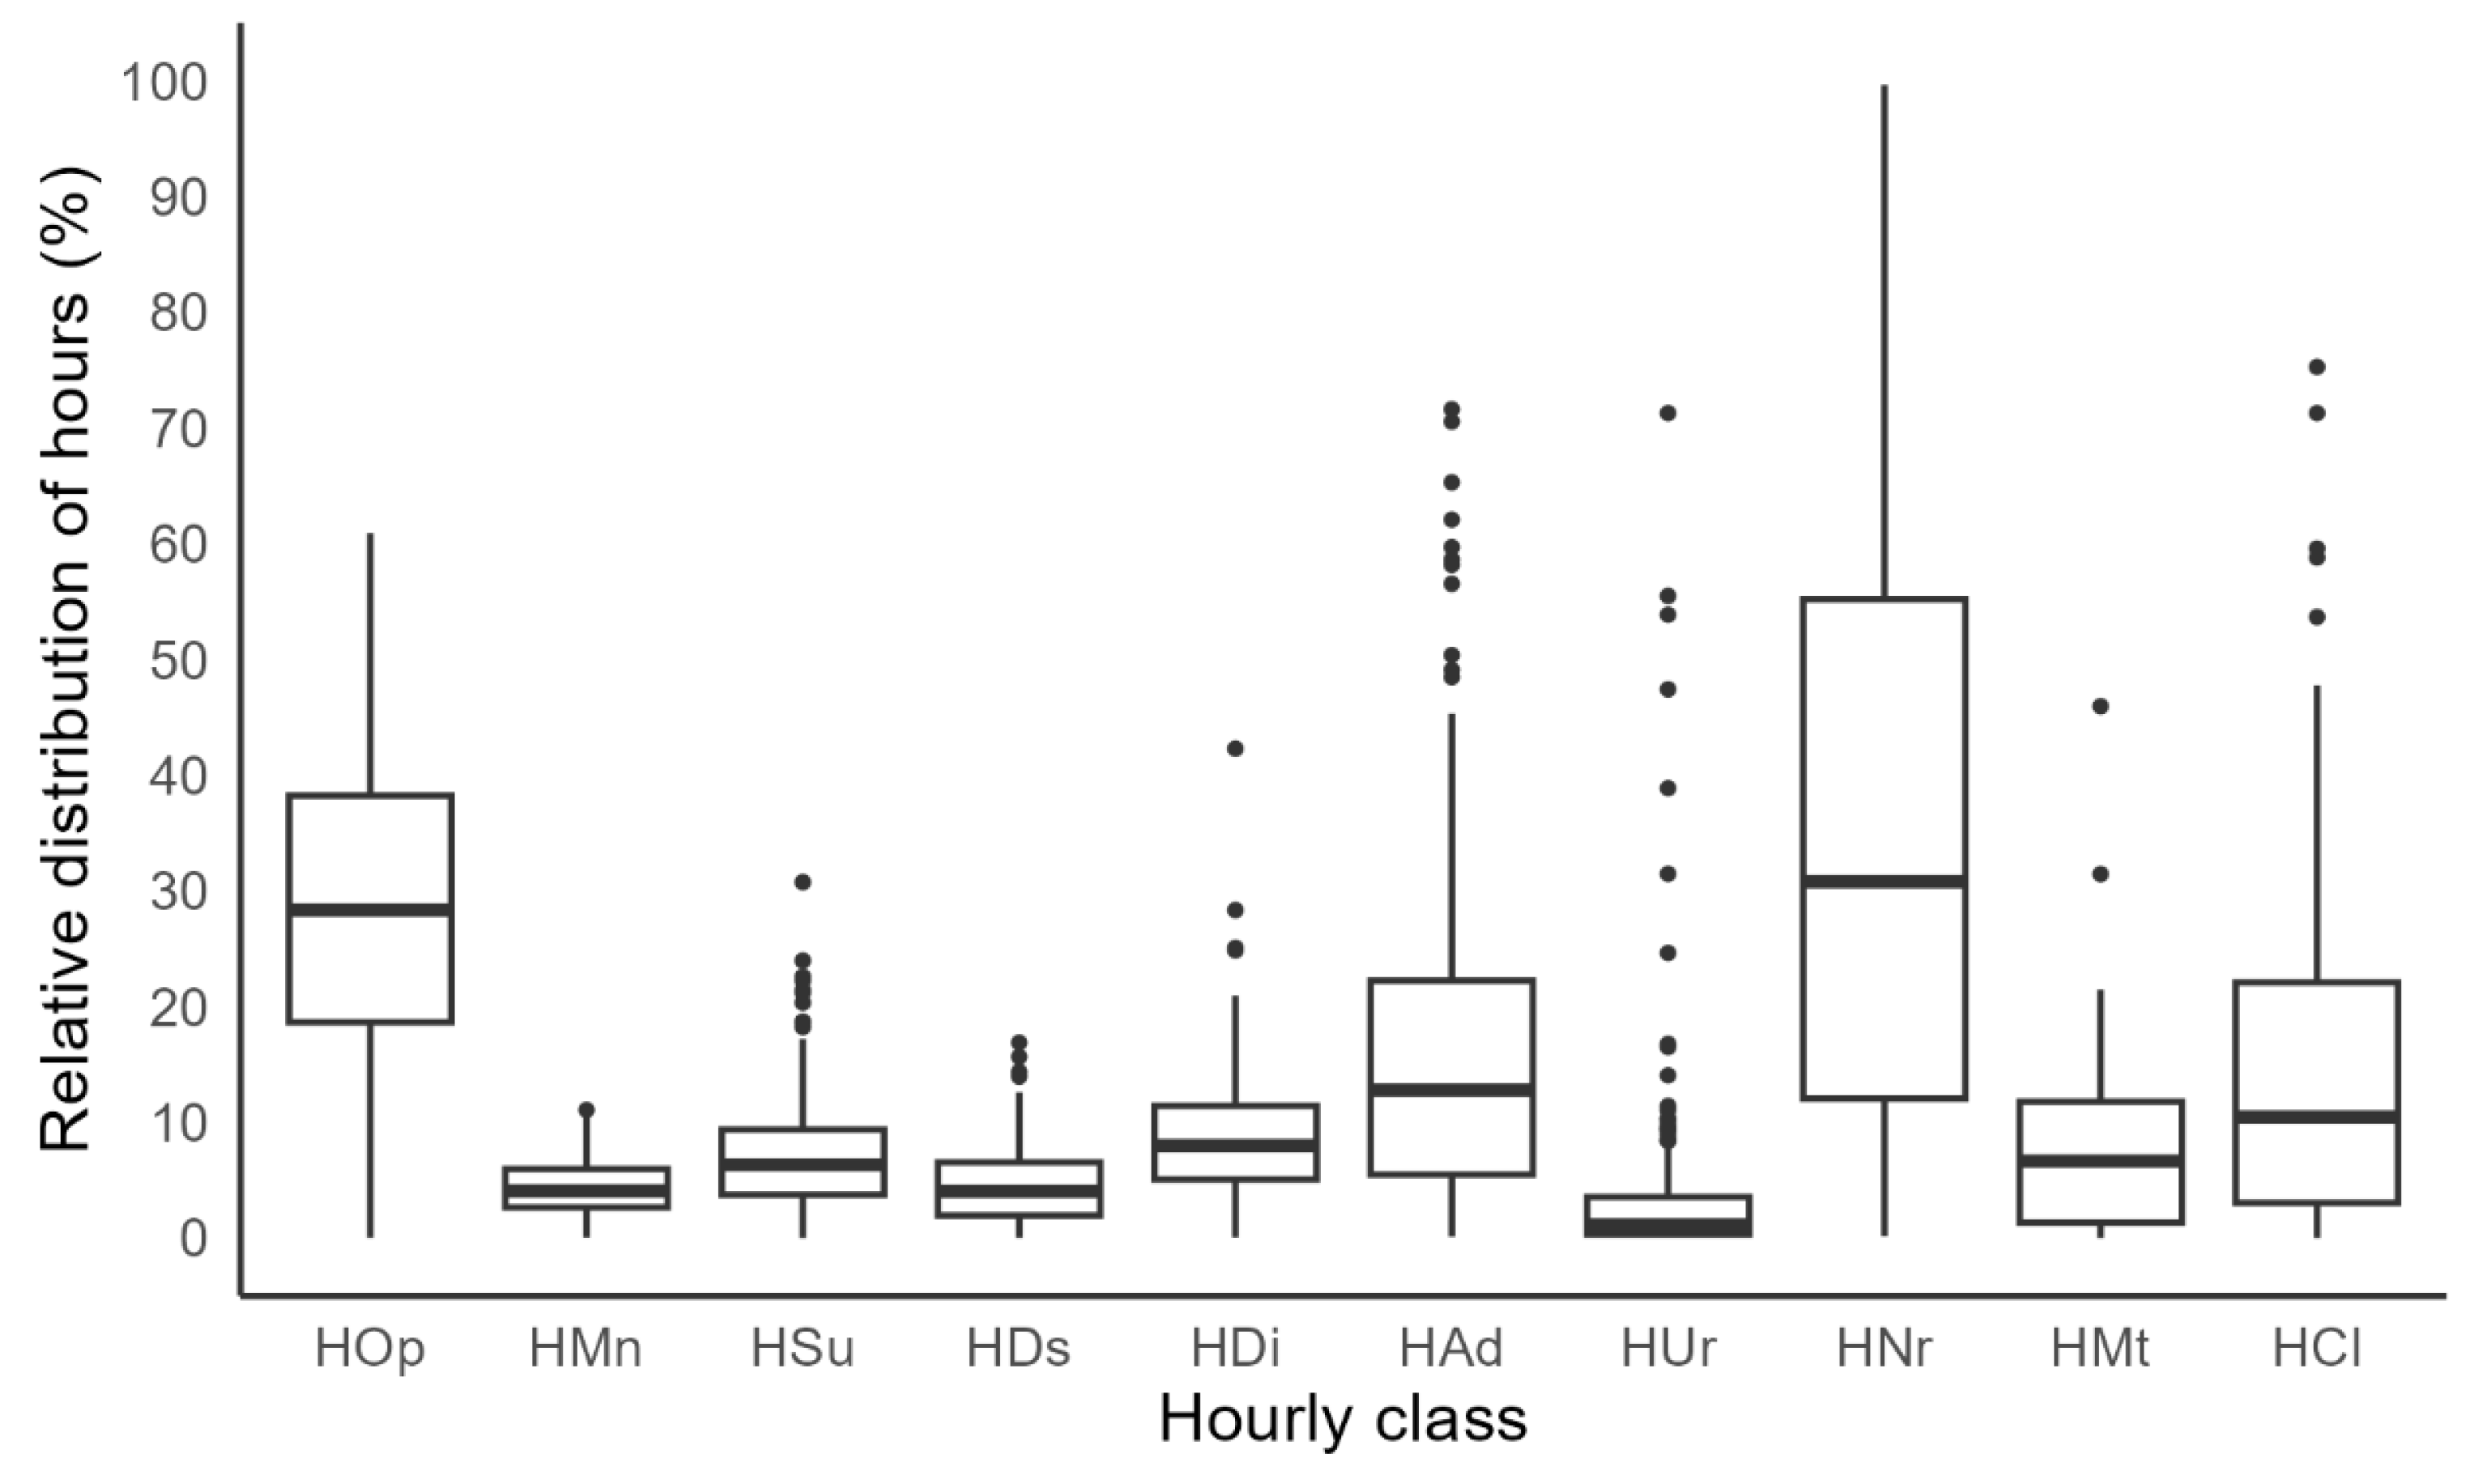
Operational hours (HOp),
Figure 1, which directly correspond to spraying activities and add value to the process, had a median of 28.3%, representing less than a third of the available workday period dedicated to the main operation.
Auxiliary hours, which include maneuvering (HMn), supply (HSu), and displacement for supply (HDs), had relatively low medians and a concentrated distribution. However, the presence of outliers for HSu and HDs suggests the occurrence of abnormally high times, possibly associated with longer trips to supply points or long waiting times at these points.
Lost hours (HLt) refer to periods during which equipment was unavailable for operation, usually for managerial reasons. This category includes displacement (HDi), administrative activities (HAd), unreported records (HUr), and unrecorded records (HNr). Because they are not directly linked to the production process, these hours should be minimized whenever possible. Compared to auxiliary hours, reducing lost hours typically requires less effort and investment.
In the administrative category (HAd), the presence of outliers indicates idle time caused by managerial decisions, waiting periods, or organizational failures, such as the absence of work orders. These factors highlight the potential for operational improvements to increase the time dedicated to spraying.
The HNr (unrecorded) category had a median of 30.8% and high variability, highlighting serious problems in data collection and, consequently, in monitoring work hours. The high dispersion in the HNr and HUr categories may be related to data recording errors, interruptions in the temporal sequence of events, coding issues, or operational inconsistencies. Identifying the root causes of these errors is essential for improving data reliability and, consequently, operational management.
4.2. Equipment Efficiency
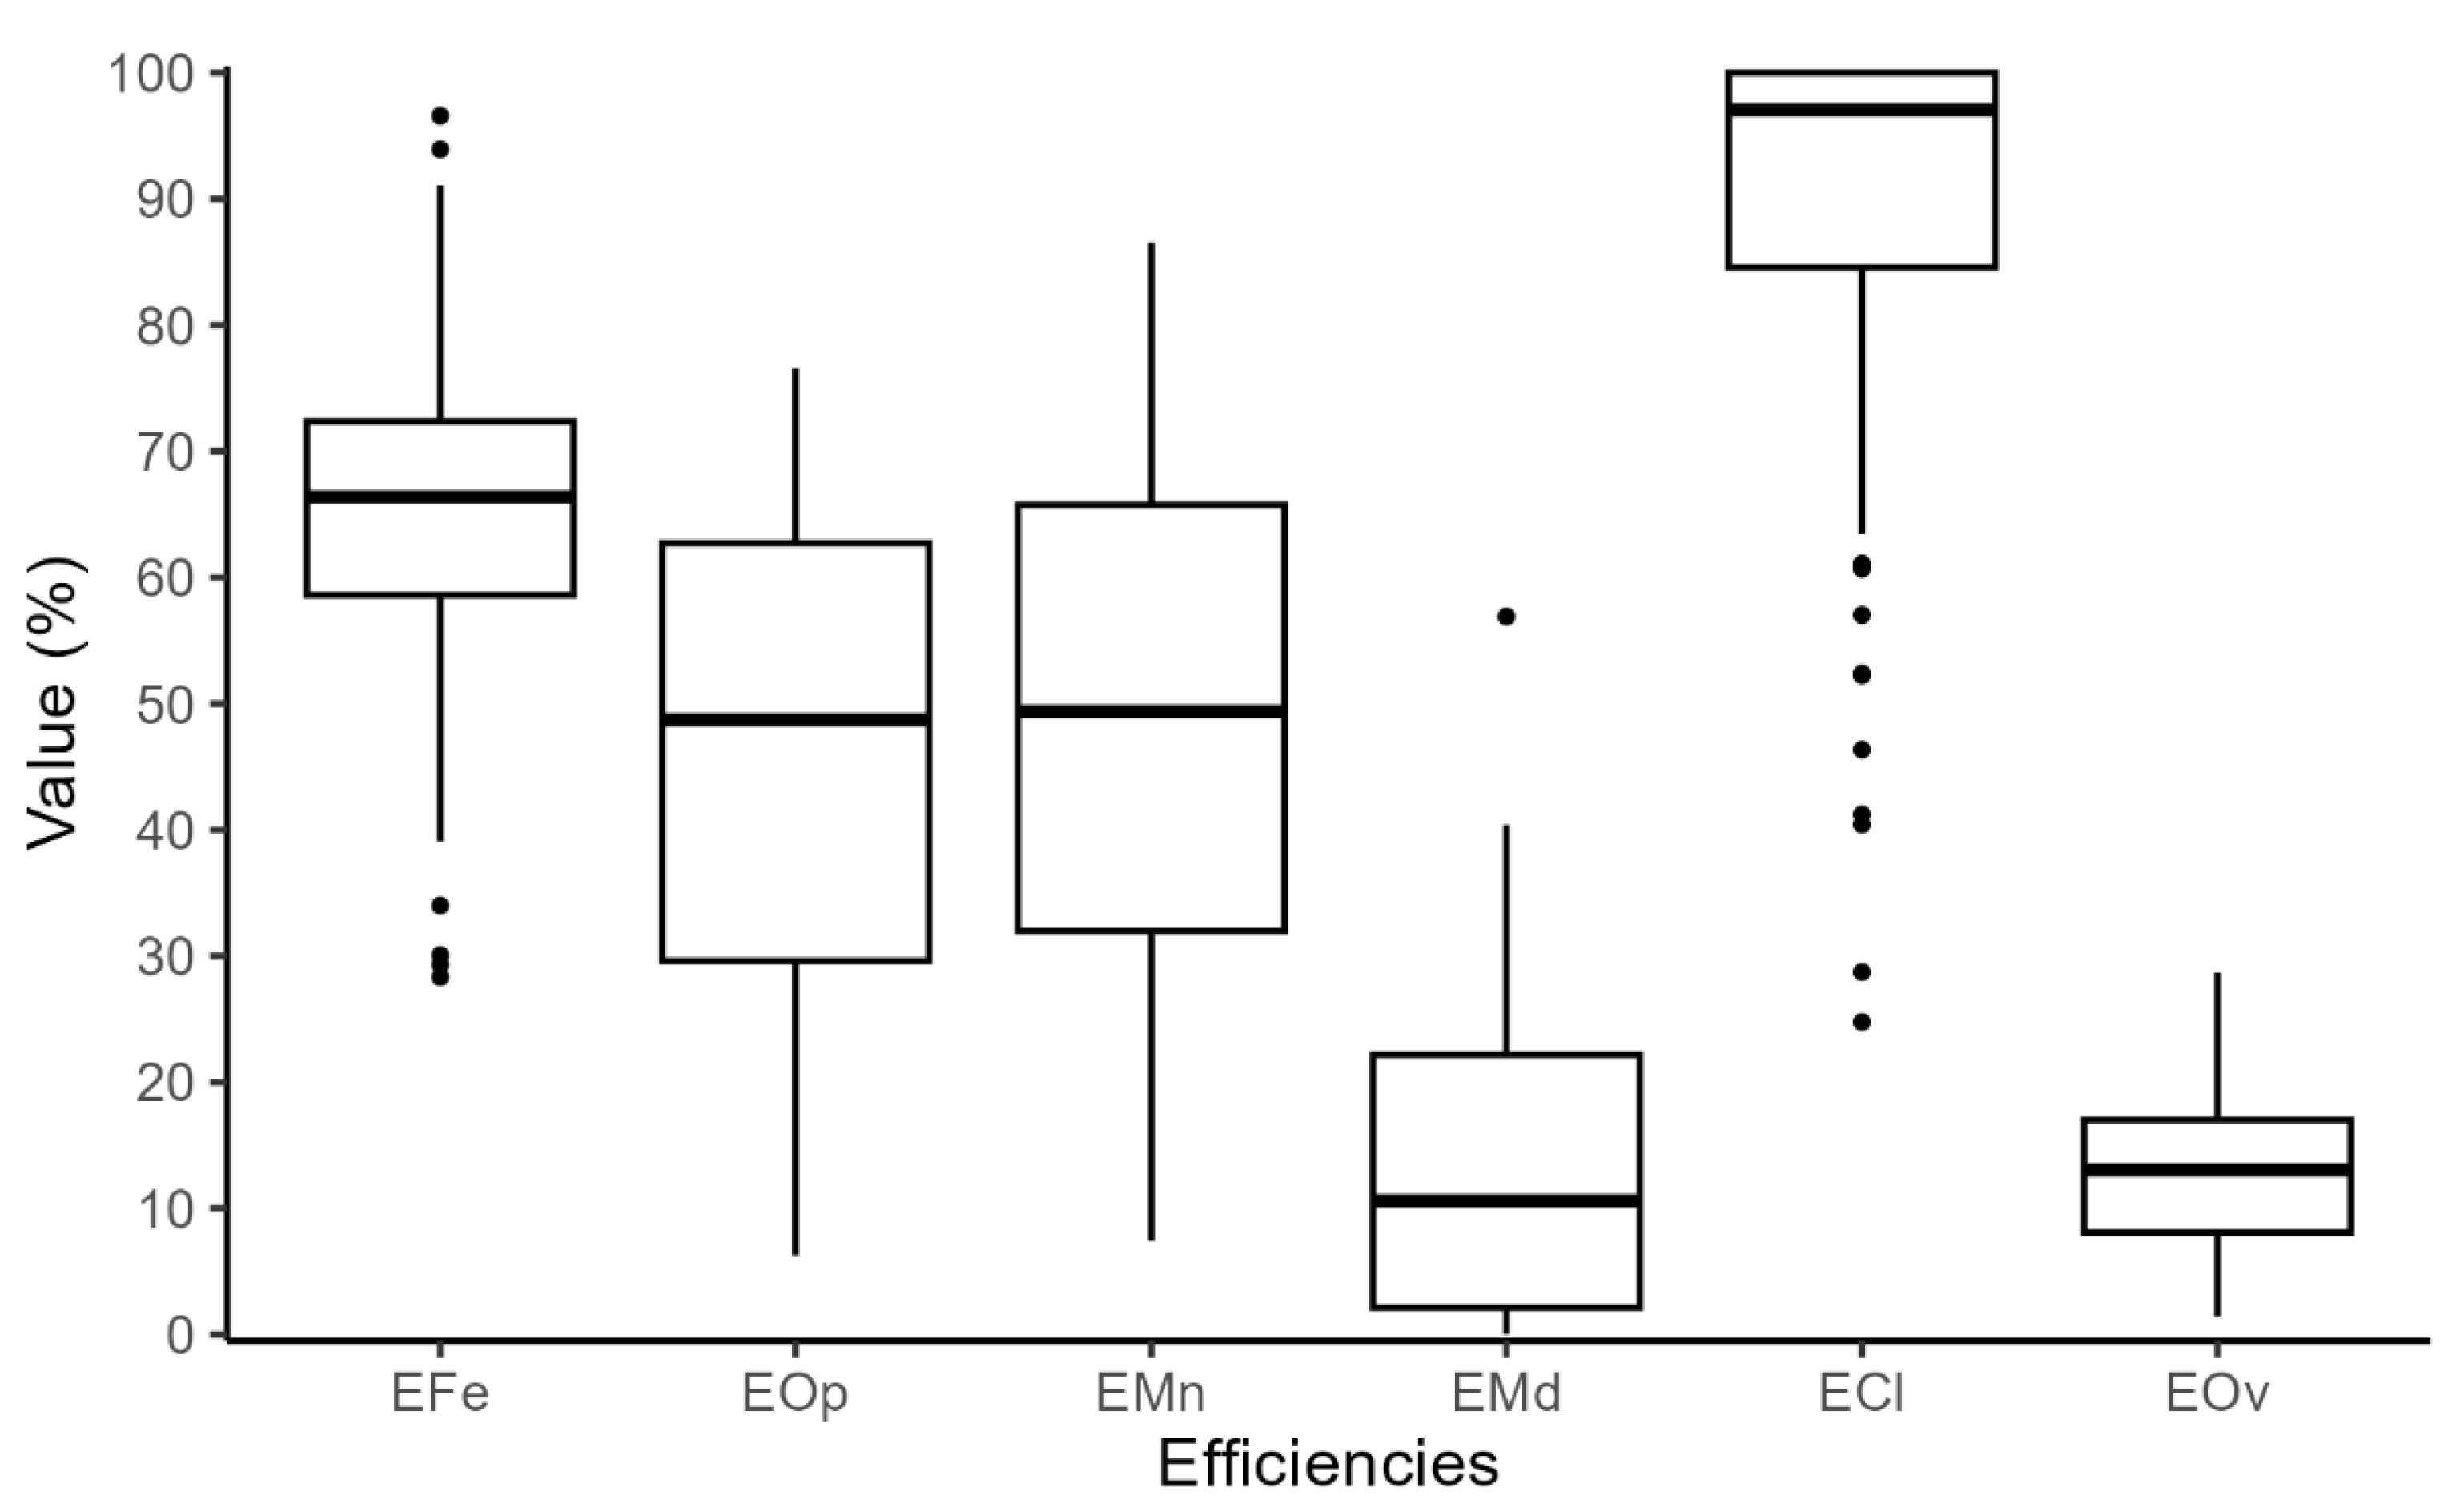
The median field efficiency (EFe) value of 65.6% indicates that approximately two-thirds of the time allocated to operation was spent on spraying, while the remainder corresponds to auxiliary operations such as maneuvering and supply (
Figure 2). This value is in line with the parameters proposed by [
20], which recommends a range between 50.0% and 80.0%, with an average of 65.0%. The presence of outliers may be related to variability in maneuvering and displacement times for supply, influenced, for example, by the shape of the fields [
22] and the distance to supply points. Previous studies have reported that the field efficiency for full area spraying in cotton cultivation was approximately 61% [
23], whereas site-specific spraying in soybean and corn fields reached up to 75% efficiency [
11]. This improvement is associated with the targeted application of crop protection products only in necessary areas, which reduces the total volume used, the frequency of refills, and both the displacement for supply hours (HDs) and displacement hours (HDi). This practice directly contributes to the reduction in operational waste, unnecessary movement, and waiting time, while enhancing overall efficiency and sustainability in the spraying process.
Operational (EOp) and managerial (EMn) efficiencies assess the utilization of hours available for spraying. EOp considers exclusively the time dedicated to the operation, while EMn also incorporates the auxiliary hours essential for its completion. Both showed high variability. The averages of 44.8% for EOp and 46.4% for EMn indicate room for improvement, especially regarding the reduction in unproductive time associated with EMn. It is important to note that operations can present contrasts between different types of efficiency. For example, a sprayer may maintain high field efficiency (EFe) during the day, but if operational efficiency (EOp) is low due to long periods of inactivity or logistical delays, the area sprayed at the end of the day will be reduced.
Variations in efficiency values are common in agricultural environments, reflecting soil conditions, management practices, seasonal demands, and other factors. The efficiency of agricultural equipment use is directly related to logistical organization and operational planning. This behavior can be explained by improved input utilization and reduced losses associated with equipment idleness or underutilization. The adoption of precision agriculture technologies that monitor operational efficiency in real time can significantly contribute to reducing Operational costs [
24,
25,
26]. The low mechanical downtime efficiency (EMd) value of 11.5% indicates that, over the 162 days analyzed, the sprayers operated almost without mechanical failures. On the other hand, the high suitability efficiency value reflects favorable climate conditions throughout the period. The overall efficiency, calculated based on 24 h equipment availability, showed a low value (12.9%) due to the assumed 10 h daily workday, even though the equipment is technically available for 24 h operation.
4.3. Spraying Speed
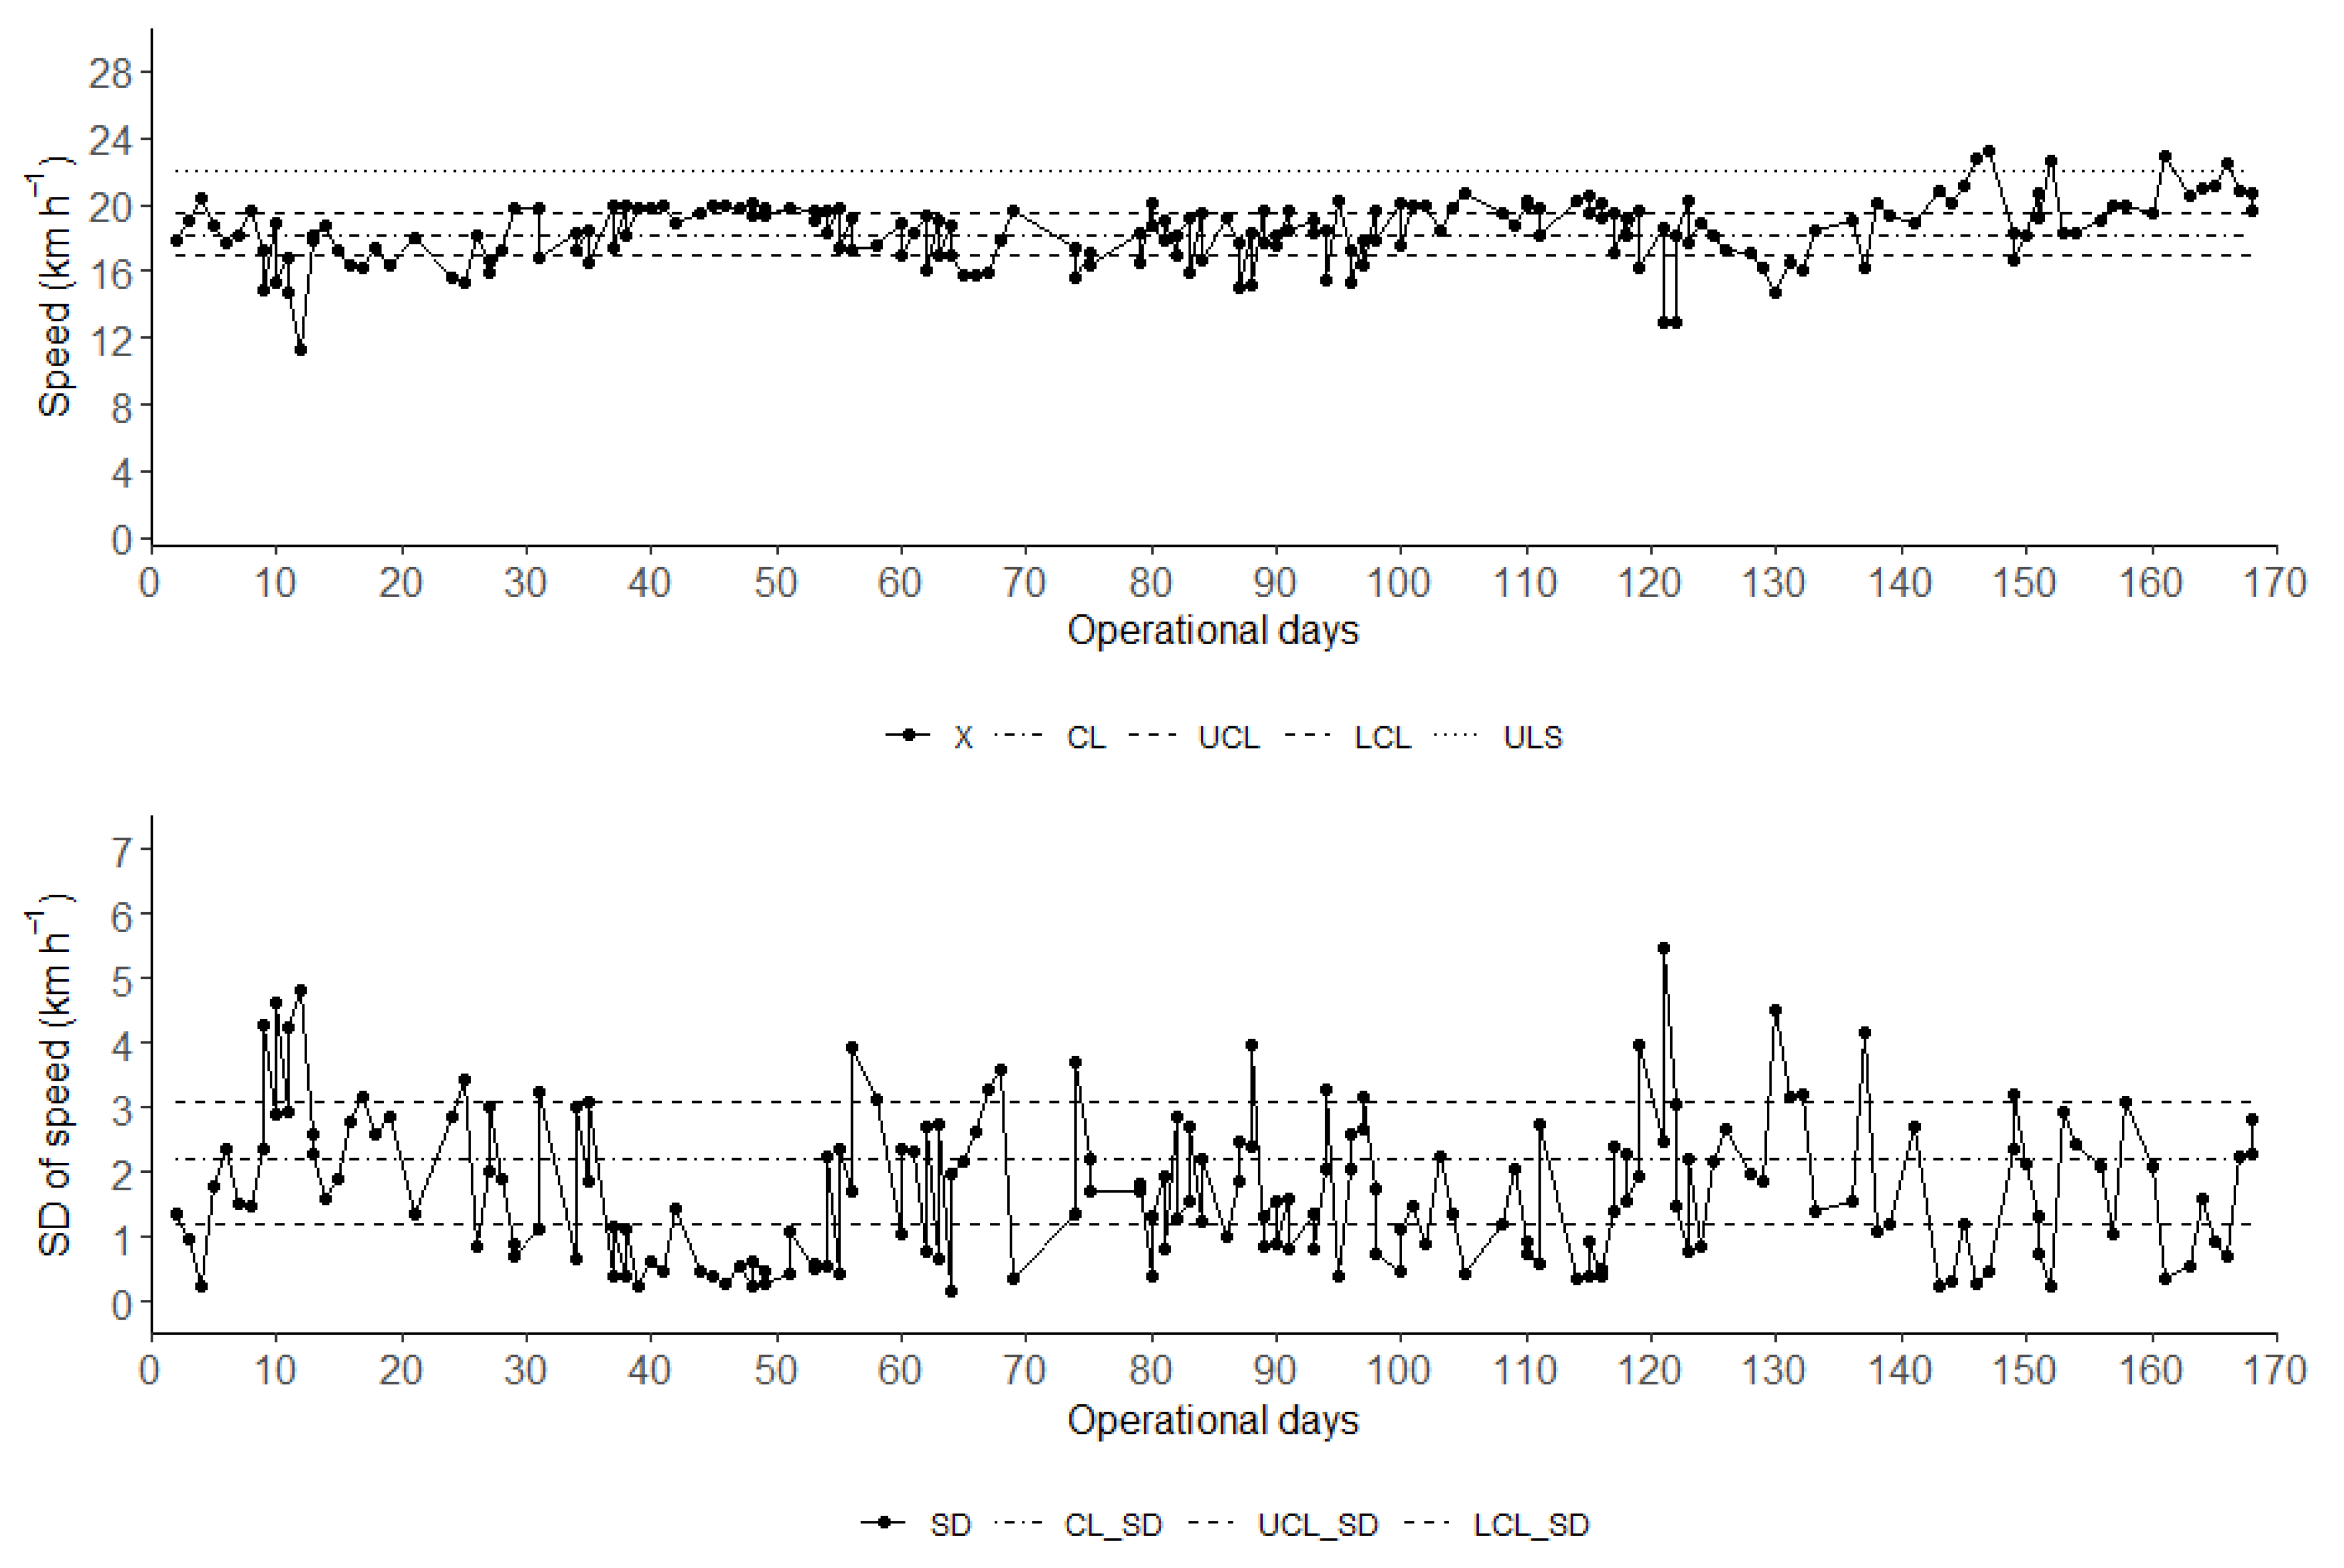
Regarding the speed variable (
Figure 3), the process could not be considered stable, as several points fell outside the control limits, between the upper limit (UCL) and the lower limit (UCL). The company adopts 22.0 km h
−1 as the upper specification limit (USL). It was observed that, for most of the analyzed period, the speed remained below this value, averaging 18.2 km h
−1. However, in the last days of operation, this limit was exceeded.
Based on a simulation of process improvements, the special causes identified in
Figure 4, represented by points outside the control limits, were removed. After this intervention, the average speed increased from 18.2 km h
−1 to 19.1 km h
−1, representing a gain of 0.9 km h
−1 and a reduction in the variation range. The speed increase represents a 2.16 ha h
−1 increase in the sprayer’s working capacity, based on an effective width of 34.6 m and a field efficiency of 63.3%.
Keeping the speed variable within control limits is essential to ensure correct dosage and uniform foliar coverage, reducing product waste and environmental risks. Values above the upper control limit UCL can result in underdosing, uneven coverage, and increased drift, while values below the UCL can lead to overdosing, product runoff, and longer operating time [
10,
27]. These variations compromise both agronomic effectiveness and operational efficiency, generating waste that, according to Lean production principles, can be categorized as defects, rework, and overprocessing. Maintaining speed within statistically controlled limits supports process standardization, reduces variability, and promotes more efficient use of resources in pesticide application.
4.4. Fuel Consumption
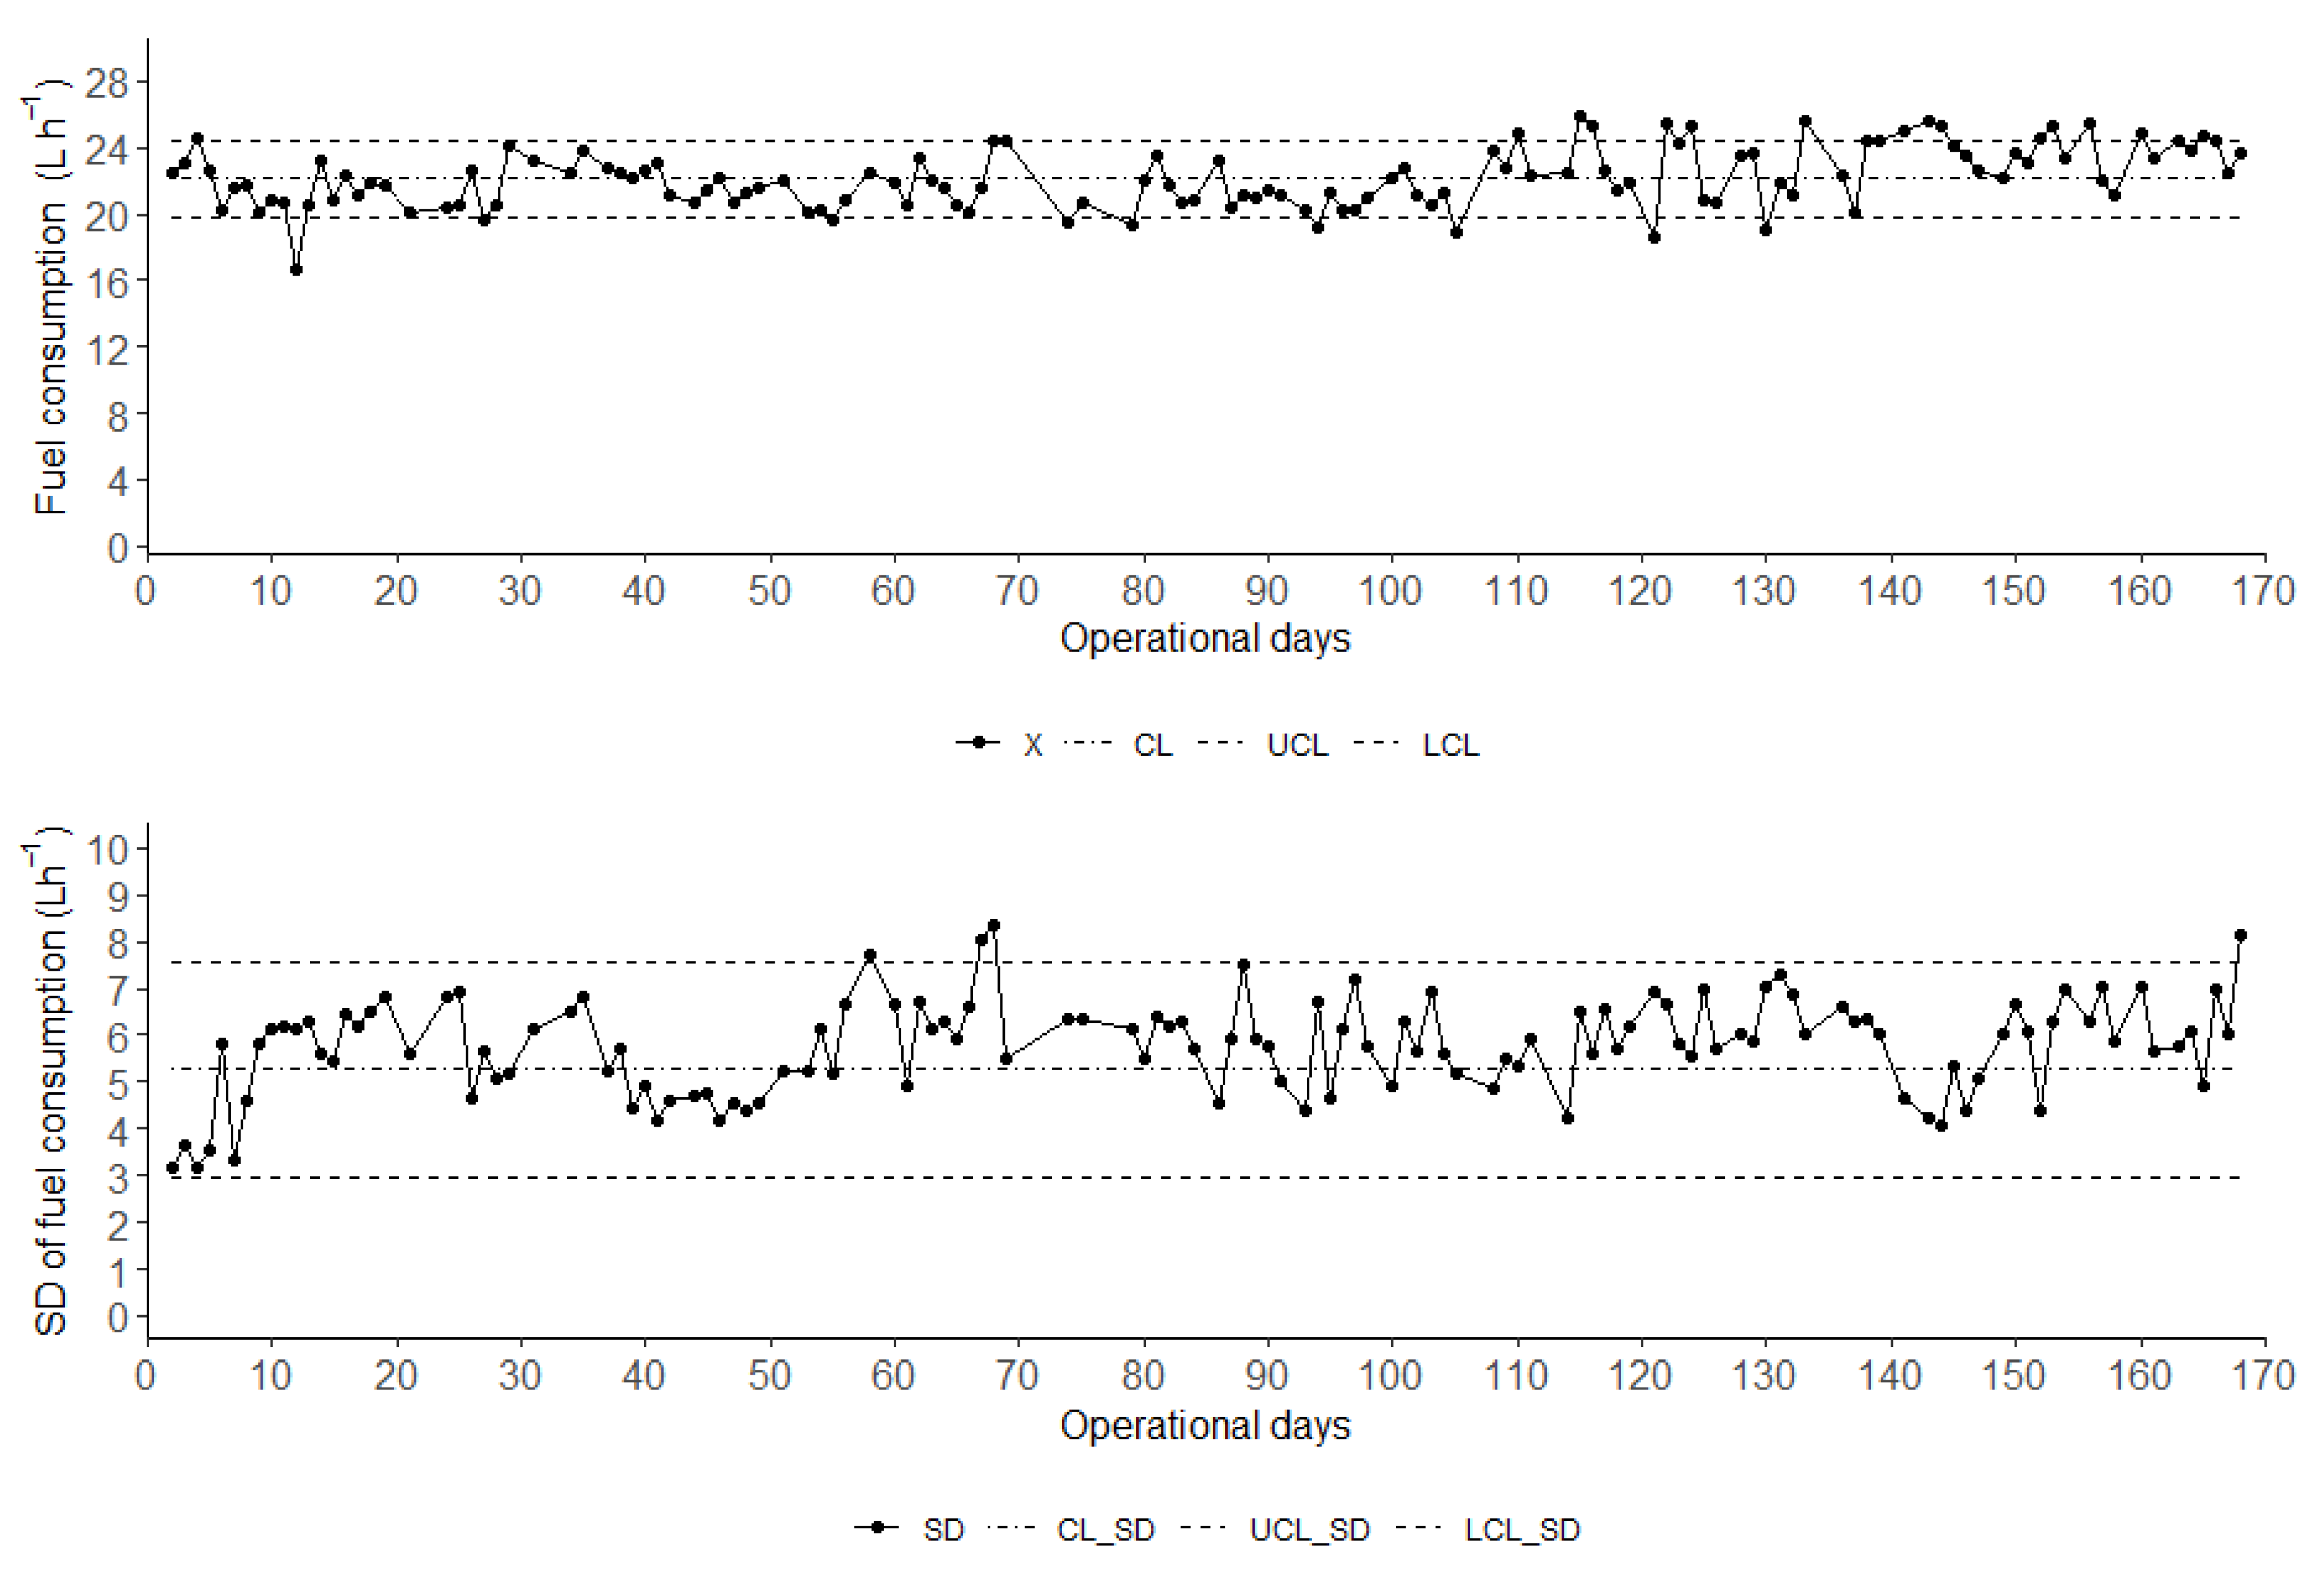
Similar to the speed, fuel consumption (
Figure 4) presented 34 points corresponding to special causes that were removed from the consumption control chart. As a result, the average consumption decreased to 21.9 L h
−1, a reduction of 0.2 L h
−1. With the removal of the points, the analysis indicated that the values in the control chart by the mean remained within the limits, but the standard deviation showed some points out of control, which prevents the process from being classified as stable. Although consumption reduction cannot be considered significant, 0.90%, the elimination of special causes and instabilities tends to reduce losses and waste, aligning with the principles of lean production [
28], which advocates the systematic elimination of any factor that does not add value to the process.
Keeping fuel consumption within control limits is crucial, as this indicator (verification indicator) is directly related to operational costs and the sustainability of agricultural spraying. Values above the UCL (Upper Control Limit) indicate special causes that increase consumption and should be investigated, such as speed above the operating standard, inadequate engine speed, incorrect gear usage, and more rugged terrain conditions, among others. Values below the LCL (Lower Control Limit) also require analysis. Although they may indicate lower consumption, it is necessary to assess whether they compromise application quality, as factors such as substandard speed or engine operating at inadequate speeds can impair performance. In these cases, if viability is confirmed, they can be treated as an opportunity for improvement to reduce costs without losing operational efficiency.
4.5. Operational Cost
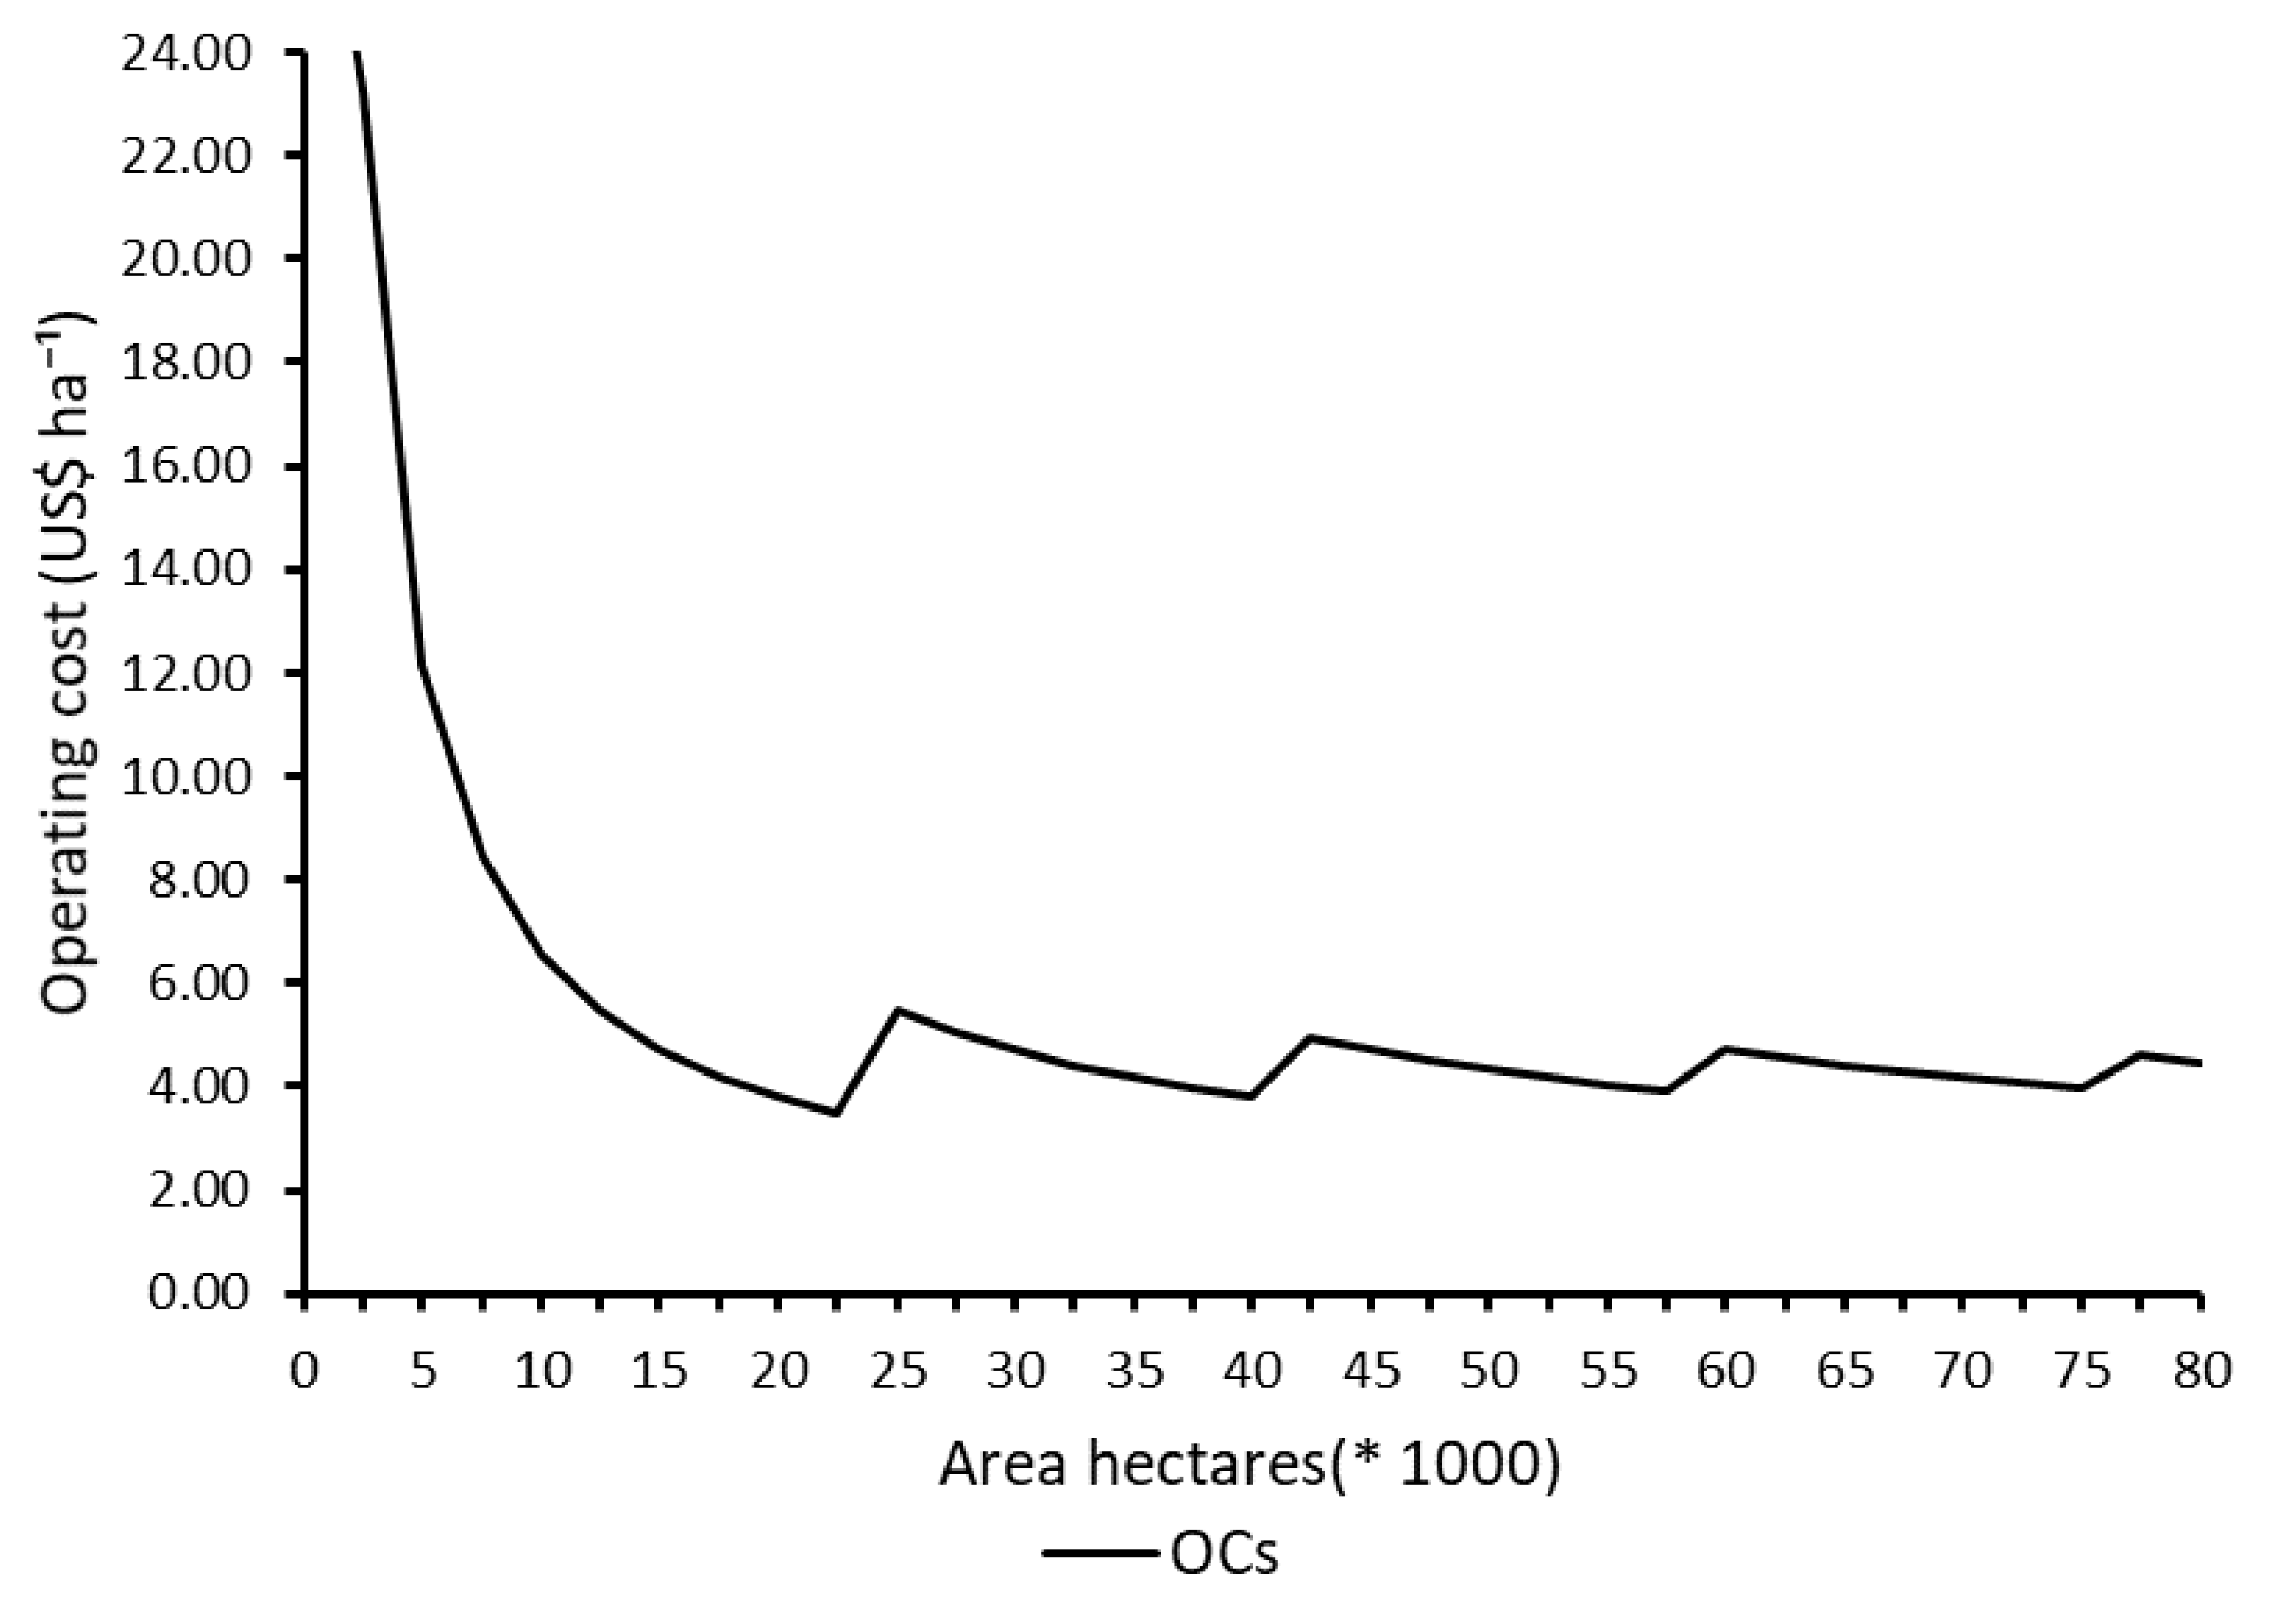
Regarding the operational and economic performance of the spraying operation (
Figure 5), the evaluation was performed through computer simulation in a spreadsheet, based on operational data obtained in the field, such as fuel consumption, average displacement speed, working width, pass overlap, and effective operating time. The scenario analyzed corresponded to an agricultural area of 6100 hectares, sprayed six times during the 2022 harvest, totaling 36,600 hectares treated. The administrative work shifts (AWs) adopted were 10 h per day, while the actual working hours (AcWh) observed were 10.3 h, of which 4.9 h were considered productive (HPr). The operating period covered 168 days, excluding Sundays and holidays.
The spraying-bar width was 36.0 m, but considering an average overlap of 4.0%, an effective width of 34.6 m was obtained. The average displacement speed during operations was 18.2 km h−1. Based on these parameters, an operational efficiency (EOp) of 35.6% and a field efficiency of 63.3% were calculated, indicating the need for two sprayers to cover the total area within the stipulated timeframe. Each sprayer covered an average area of 18,300 hectares, accumulating a total of 919.8 productive hours. The estimated operational cost was 4.14 US$ ha−1, considering exclusively the direct costs associated with the use of the equipment, excluding labor and inputs.
As the area increases, the cost per hectare tends to stabilize in the range of 3.65 to 4.57 US
$ ha
−1. However, periodic fluctuations are observed at the transition points between area ranges, resulting from the addition of new mechanized equipment. This staggered behavior results from a temporary increase in fixed costs when new equipment is added, followed by a further reduction in the OCs (operational costs) as the total area is diluted [
29].
The theoretical minimum area for full utilization of a sprayer, according to the simulated parameters, was estimated at 18,255.7 hectares. However, when the area size is approximately 22,500 ha, the operational cost increases due to the rounding criterion used to calculate the number of equipment required. Starting at a value of 0.30, the need to add another sprayer to meet demand was considered; if it is below, the calculated value is maintained. This threshold region is critical, as it marks the point where the addition of new sprayers becomes necessary and increases the fixed costs.
This pattern reinforces that expanding operational scale, combined with efficient use of installed capacity, is crucial for reducing costs per hectare and consequently eliminating waste, in line with Lean principles. Careful management of the number of machines, field efficiency, and fixed costs is essential to maximize operational efficiency and minimize unnecessary expenses [
30,
31].
