Article

Genome-Wide Association Studies of Fiber Content in Sugarcane

1
National Key Laboratory for Tropical Crop Breeding, Institute of Nanfan & Seed Industry, Guangdong Academy of Science, Guangzhou 510316, China
2
Rice Research Institute, Guangdong Academy of Agricultural Sciences, Guangzhou 510640, China
*
Author to whom correspondence should be addressed.
These authors contributed equally to this work.
Agronomy 2025, 15(10), 2249; https://doi.org/10.3390/agronomy15102249
Submission received: 15 August 2025 / Revised: 17 September 2025 / Accepted: 19 September 2025 / Published: 23 September 2025
(This article belongs to the Section Crop Breeding and Genetics)

Abstract

Lignocellulosic biomass may play a major role in the production of biofuels, bioplastics, sugar, paper, and various other industrial products. In addition, it is a key trait in plants due to its contribution to lodging resistance. Fiber also shows a significant negative correlation with most yield traits and all sugar traits. As the most harvested crop globally by tonnage, sugarcane is an important resource for both sugar and bioenergy production. In this study, a panel of sugarcane clones was utilized to investigate the fiber content. This panel included 17 core parental lines derived from 11 countries involved in sugarcane cultivation and breeding. It represented the genetic base of commercial sugarcane breeding programs in China and other countries. The objective of this research was to identify molecular markers and candidate genes associated with fiber content in sugarcane using genome-wide association studies (GWASs). By integrating 5,964,084 high-quality single-nucleotide polymorphisms (SNPs) with phenotypic data collected across five different environments, a total of 69 SNPs spanning 41 quantitative trait loci (QTLs) were identified. Based on functional annotations and genomic positions, these QTLs contained 52 candidate genes. These candidate genes encoded the ultraviolet-B receptor (UVR8), leucine-rich repeat receptor-like kinases (LRR-RLKs), serine/threonine kinases (STKs), cellulose synthase (CESA), vegetative cell wall protein glycoproteins1 (gp1), F-box protein, MYB transcription factor, and so on. These genes could directly or indirectly influence the fiber content in sugarcane. Furthermore, according to previous studies, among these candidate genes, five located in four QTL regions were proposed to be the most critical. They included Sspon.02G0041160-2C, encoding CESA; Sspon.03G0039010-1C and Sspon.03G0039030-1C, both encoding gp1; Sspon.06G0023090-1B, encoding an F-box protein; and Sspon.07G0019440-2C, encoding a MYB transcription factor. The genetic basis of the fiber content was explored using elite breeding lines and their derivatives from the Chinese sugarcane breeding program. These candidate genes represent promising targets for future functional studies and may contribute to the development of different types of sugarcane varieties with correspondingly suitable fiber content through marker-assisted selection.

1. Introduction

Currently, biofuels derived from lignocellulosic plant biomass play a vital role as renewable and environmentally friendly energy source [1,2,3]. Beyond energy, lignocellulosic biomass is a key raw material for the production of bio-based chemicals, bioplastics [4], sugar, paper, and a variety of other industrial products [5]. Structurally, the plant cell wall—primarily composed of cellulose, hemicellulose, and lignin—plays a crucial role not only in biomass production but also in agronomic traits such as lodging resistance [6,7] and nutritional quality [8].
Lignocellulosic feedstocks encompass a wide range of sources, including perennial prairie grasses, tropical grasses, hardwoods, and agricultural residues such as wheat straw [9], sorghum [4], corn stover, and sugarcane bagasse [1,3,10]. Recent research [2] highlights ongoing advancements and prospects in optimizing the use of lignocellulosic biomass for bioenergy and bioproducts, with a particular emphasis on improving conversion efficiency and scalability.
Genetic analysis of cell wall components (CWCs) has been previously conducted using traditional quantitative trait loci (QTL) mapping approaches, leading to the identification of QTLs associated with cellulose and lignin biosynthesis in several major crops, including rice [11,12], maize [13,14], sorghum [15], and Panicum hallii [1]. More recently, genome-wide association studies (GWASs) have emerged as a powerful and widely adopted method for dissecting complex agronomic traits in crops [4,16,17,18,19,20,21,22,23,24,25]. GWASs have also provided new insights into the genetic regulation of cellulose biosynthesis in crops such as wheat [6,9] and sorghum [4].
Sugarcane (Saccharum spp.), the world’s most harvested crop by tonnage [26], is a globally important crop for both sugar and bioenergy production [27,28]. Sugarcane varieties with high fiber content are valuable for pulp and paper production [29], while those with moderate fiber content always perform well in both cane and sugar yield [30]. In addition, fruit-type sugarcane has a more suitable taste, with a lower fiber content. In sugarcane, fiber is made up of cell wall components, mainly including cellulose (measured as total glucan, which primarily derives from cellulose, with a small contribution from glucose residues in hemicellulose), hemicellulose (xylan and arabinan), potential saccharification and fermentation inhibitors (total lignin, acid soluble lignin, acid insoluble lignin, acetyl groups, non-structural ash, structural ash, and structural protein), and extractives (ethanol-soluble substances and extractable nitrogen) [3]. It has been observed that erect sugarcane plants tend to have higher fiber content in their stems compared to lodged plants [31,32,33,34]. In sugar production, varieties that show excellent performance in yield and quality traits always have moderate fiber content (11.00–12.00%) due to its significant negative correlation with most yield traits and all sugar traits [29,30]. In sugar processing, fiber content shows no significant correlation with sugar content but displays strong negative correlations with juice extraction efficiency and bagasse moisture content [29]. Moreover, the negative effects of high fiber content on sugar milling include slower milling and increased sugar loss [35].
Previous GWASs have identified markers associated with fiber composition in sugarcane. For instance, 106 putative DNA markers and 107 genes associated with 10 fiber traits were identified using an association panel of 299 germplasm accessions and nine breeding lines from Florida [3]. SNPs and insertion–deletion (Indel) markers were used to detect marker–trait associations (MTAs) for 11 yield and quality traits—including fiber—in a core collection of 97 sugarcane clones in Louisiana, which led to the identification of four SNPs significantly associated with fiber content (p < 0.01) [36]. More recently, a GWAS based on 237 self-pollinated progenies of the Louisiana cultivar ‘LCP 85-384’ identified 13 markers linked to fiber content [37]. The cultivar LCP 85-384, known for its high sugar yield, has been extensively used as a parent in Louisiana breeding efforts [37,38]. These studies predominantly utilized sugarcane germplasm from the United States [3,39,40,41].
Despite its agronomic importance, the genetic diversity of fiber content in sugarcane remains poorly understood, with very limited studies focusing on Chinese sugarcane core parents [42,43]. In contrast to previous research, the present study constructed sugarcane genetic resources using core parent clones and their derivatives. This panel consisted of 219 clones derived from 11 countries involved in sugarcane breeding and cultivation, and it broadly represents the genetic backgrounds of modern Chinese sugarcane germplasm. Among them were 17 core parents, including CP28-11-Sanya-Yacheng, CP49-50, CP67-412, CP72-1210, Co1001, Co419, F108-Sanya-Yacheng, F134, Hua_nan-56-12, Hua_nan-56-21-Sanya-Yacheng, KeWu, NCo310, R0C1-Sanya-Yacheng, Yacheng-71-374, Yun-65-225, gui11, and yuenong-73-204 [42,43]. Notably, approximately 87% of Chinese sugarcane commercial cultivars are derived from these core lines [44].
Beginning in 2019, genome resequencing and phenotypic evaluation of this panel were initiated. Previous GWASs using these materials successfully identified numerous markers linked to key agronomic traits such as sucrose content, stalk number, plant height, stalk diameter, cane yield, sugar yield, and leaf angle [42,43]. The present study aims to extend this work by identifying markers and candidate genes associated specifically with fiber content, providing valuable insights for future genetic studies and breeding programs targeting improved sugarcane fiber traits.

2. Materials and Methods

2.1. Plant Materials and Growth Conditions

The sugarcane population used in this study consisted of 219 clones selected to represent a broad and significant genetic background within Chinese sugarcane breeding programs [42,43]. Field experiments were conducted in 2019 and 2020 at two experimental sites of the Institute of Nanfan & Seed Industry, Guangdong Academy of Sciences: the Wengyuan base (24.36° N, 114.13° E; altitude: 120 m) and the Zhanjiang base (21.39° N, 110.24° E; altitude: 25 m). All 219 clones were planted using a completely random design, with two replicates at each site. Planting materials were prepared by disinfecting and cutting stalks into single-bud segments, which were then transplanted to the field once the buds had grown to approximately 20 cm in height. The planting dates were 26 February, 2019, at the Wengyuan base and 18 February, 2020, at the Zhanjiang base. In each plot, the clones were planted in three rows spaced 110 cm apart. Each row contained 16 plants, spaced 25 cm apart within the row. According to the local conventional field management, field management practices at the two locations followed standard agronomic procedures for sugarcane cultivation with local and normal fertilization, irrigation, and control of diseases, pests, and weeds.

2.2. Phenotypic Data Collection and Statistical Analysis

During the last 10 days of December each year, fiber content was measured at the maturity stage for all 219 sugarcane clones following the guidelines outlined in the Descriptors and Data Standard for Sugarcane [45]. Phenotypic data were collected at the Zhanjiang base across three growing seasons (2020–2022), designated as environments ZJ20, ZJ21, and ZJ22, and at the Wengyuan base across two seasons (2021–2022), designated as environments WY21 and WY22.
Since the phenotypic data did not conform to a normal distribution, Wilcoxon rank-sum tests were used to assess differences in fiber content between pairs of environments. Pearson correlation analysis was performed to evaluate the relationships among fiber content across environments using R statistical software (version 4.3.2; https://www.r-project.org, accessed on 31 December 2023). All graphical visualizations were also generated using R (version 4.3.2).

2.3. SNP-Based GWAS

Whole-genome resequencing and genotyping data for the 219 sugarcane clones used in this study were previously published [42,43]. A GWAS was conducted using GEMMA software (version 0.98.5) [46], employing univariate linear mixed models to account for population structure and relatedness. The relatedness matrix was estimated using the command ./gemma -bfile [prefix] -gk2 -o [prefix]. Subsequent association testing was performed with the command ./gemma -bfile [prefix] -k [filename] -lmm 1 -o [prefix]. Manhattan and quantile-quantile (Q-Q) plots were generated using the “CMplot” package in R (version 4.3.2, www.r-project.org). To control for false positives, the independent SNPs were identified by PLINK software (version 1.9) with the parameter “--indep -pairwise 100 50 0.2”. A total of 670,149 independent SNPs were retained with r2 ≥ 0.2, and a significant SNP cutoff of p ≤ 1/670,149 = 1.5 × 10⁻⁶ was used to avoid false negatives.

2.4. Identification of Potential Candidate Genes

Resequencing data were aligned to the Saccharum spontaneum L. reference genome (AP85-441) [47] to identify SNPs located within genes or intergenic regions. Linkage disequilibrium (LD) analysis showed that the decay rate was rapid, with an LD distance of approximately 20 kb when r2 decreased to 0.1. Thus, genomic regions extending 20 kb upstream and downstream of each associated SNP were defined as candidate gene regions [43].

3. Results

3.1. Phenotypic Variation Analysis

Fiber content data were collected from 219 sugarcane clones grown across two experimental sites—Zhanjiang (over three years) and Wengyuan (over two years). Normality tests indicated that the phenotypic data did not follow a normal distribution (Figure 1). Substantial variation in fiber content was observed among clones, and significant to highly significant differences were detected between environments based on Wilcoxon rank-sum tests (Figure 1, fiber content refer to Supplementary Table S1).
The measurement of sugarcane fiber content was influenced by environmental conditions, with average fiber content values across the five environments being 13.60% (ZJ20), 11.69% (WY21), 11.34% (ZJ21), 10.50% (WY22), and 12.00% (ZJ22) (Table 1).
In 2020, the average fiber content in sugarcane was highest at the Zhanjiang site, reaching 13.60%. In 2021, the fiber content decreased overall, with no notable difference observed between Zhanjiang (11.34%) and Wengyuan (11.69%). However, in 2022, the fiber content at Zhanjiang increased to 12.00% and was significantly higher than that at Wengyuan, which declined to 10.50%.
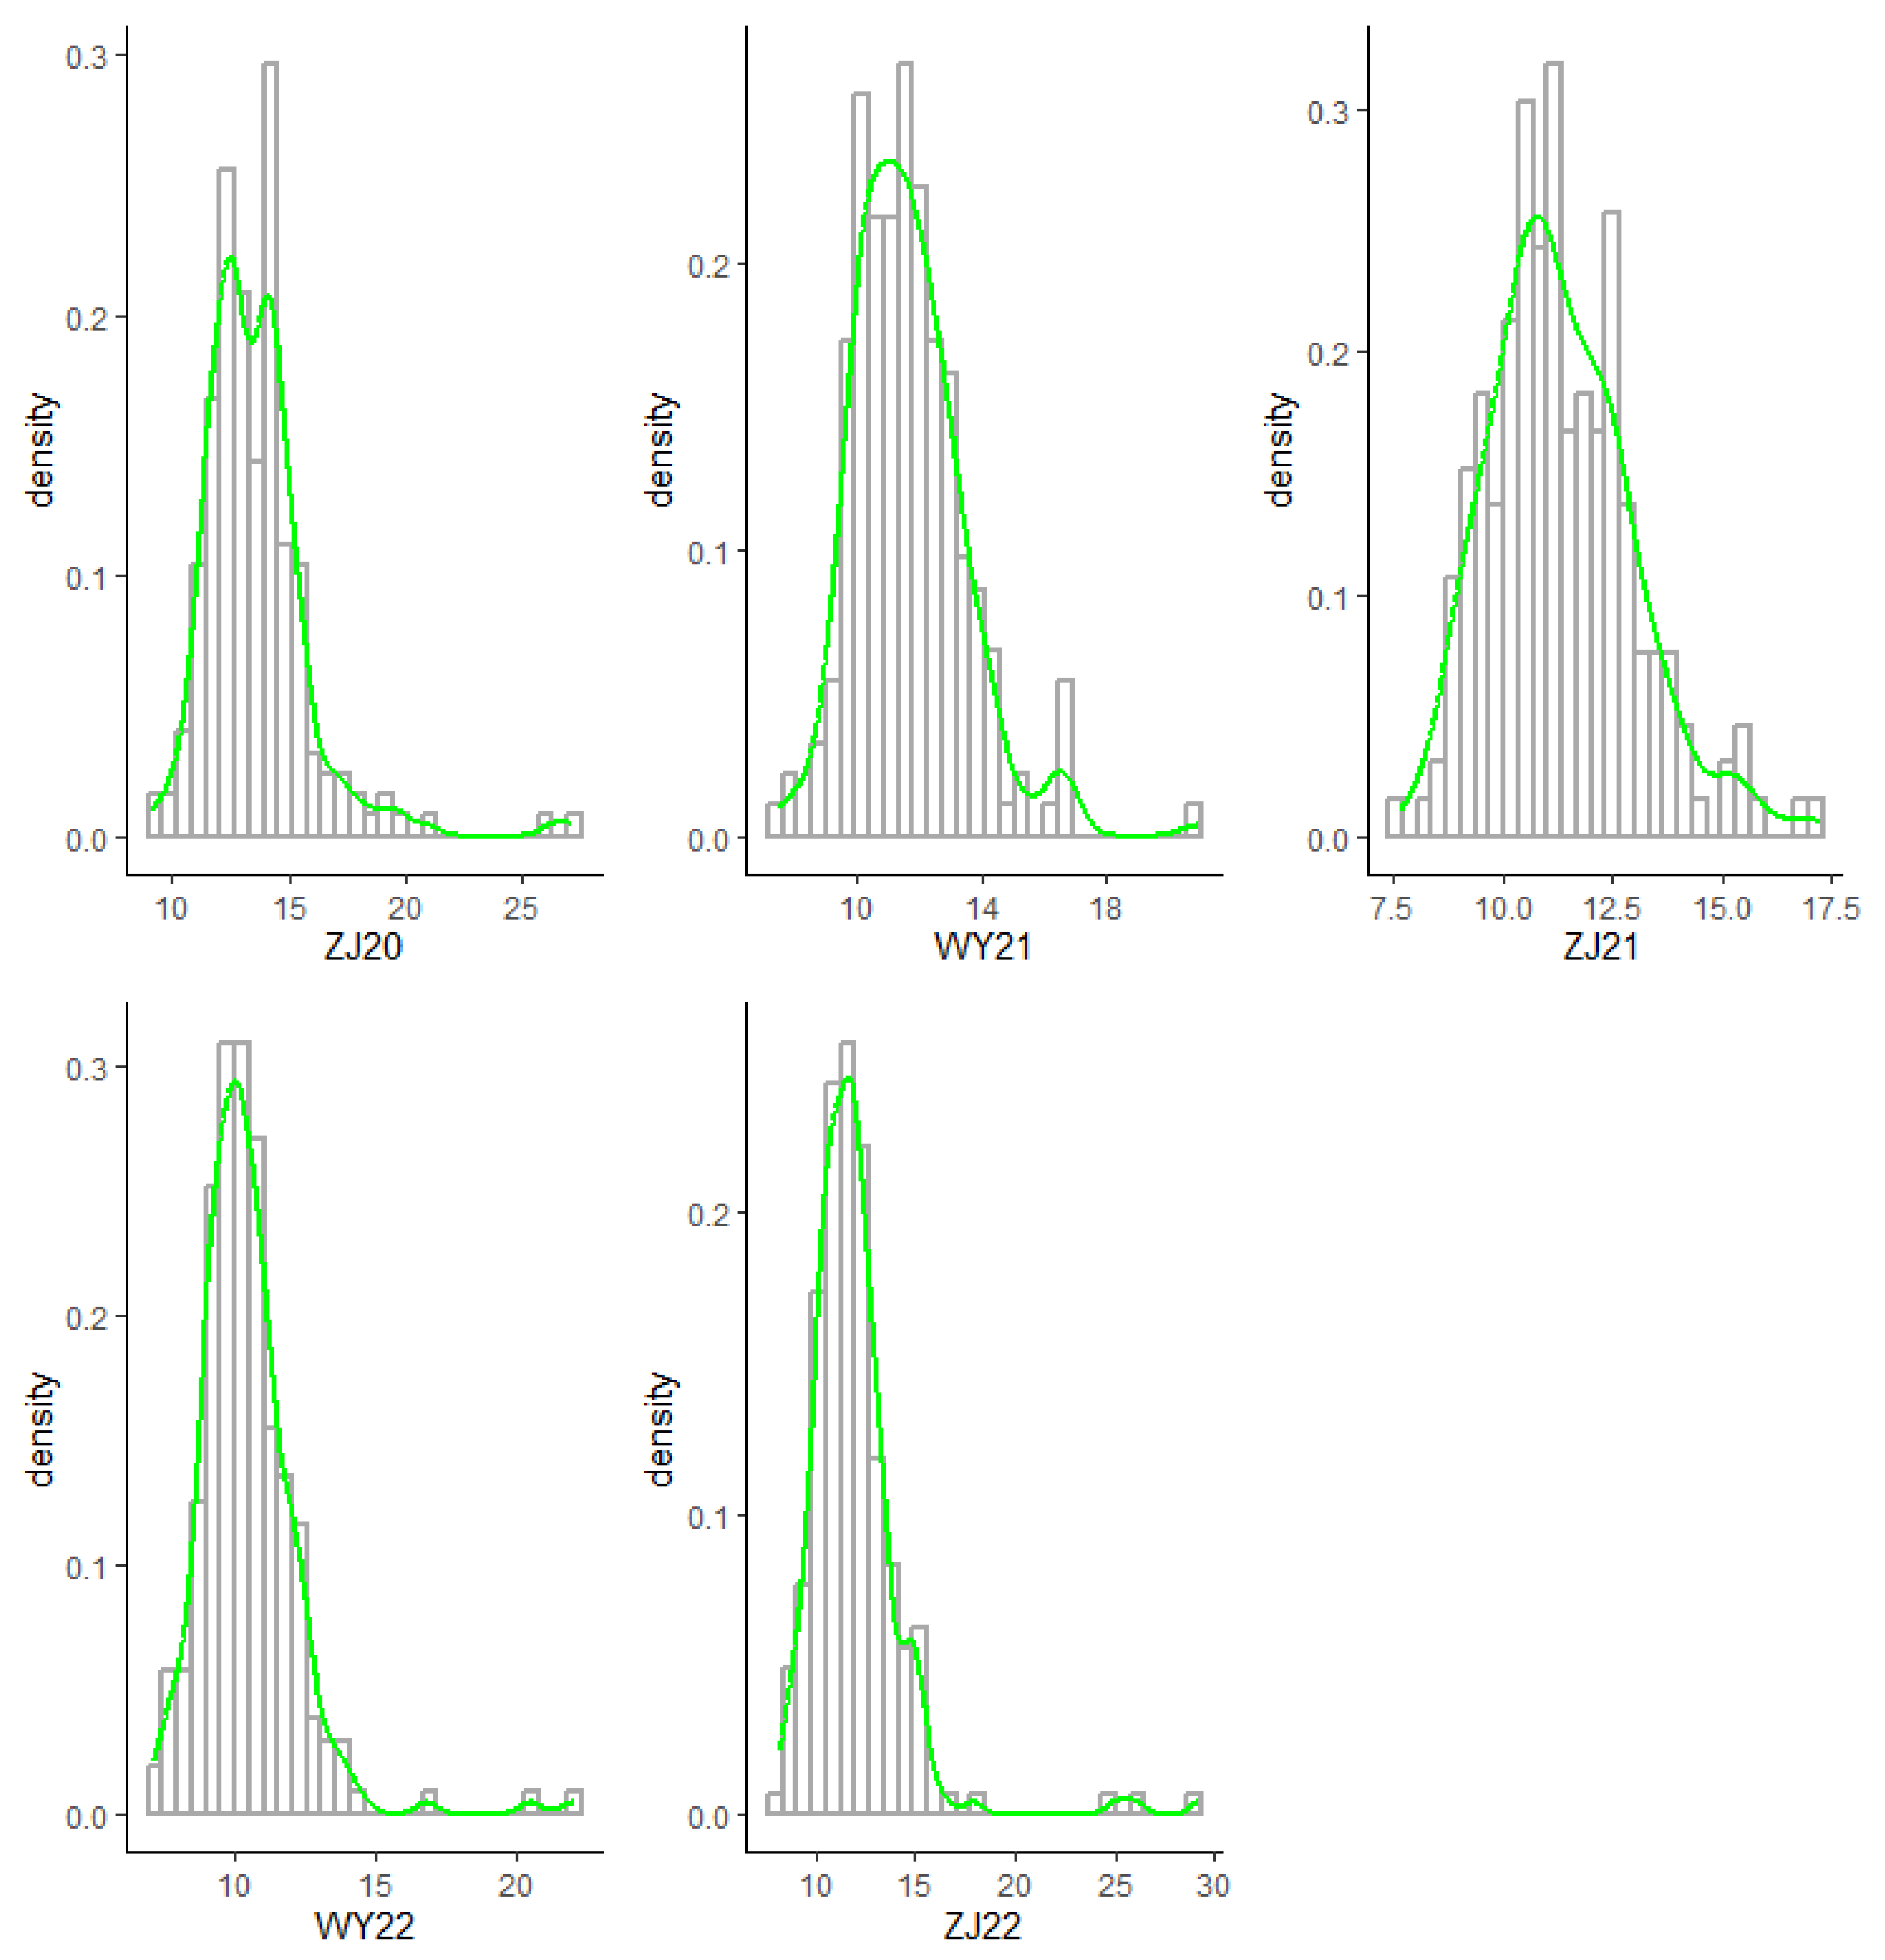
The density distribution of sugarcane fiber content in each environment followed either a continuous normal or skewed pattern, indicating that fiber content was a quantitative trait controlled by multiple genes and is suitable for subsequent association analysis (Figure 2).

3.2. Correlation Analysis of Phenotypic Data

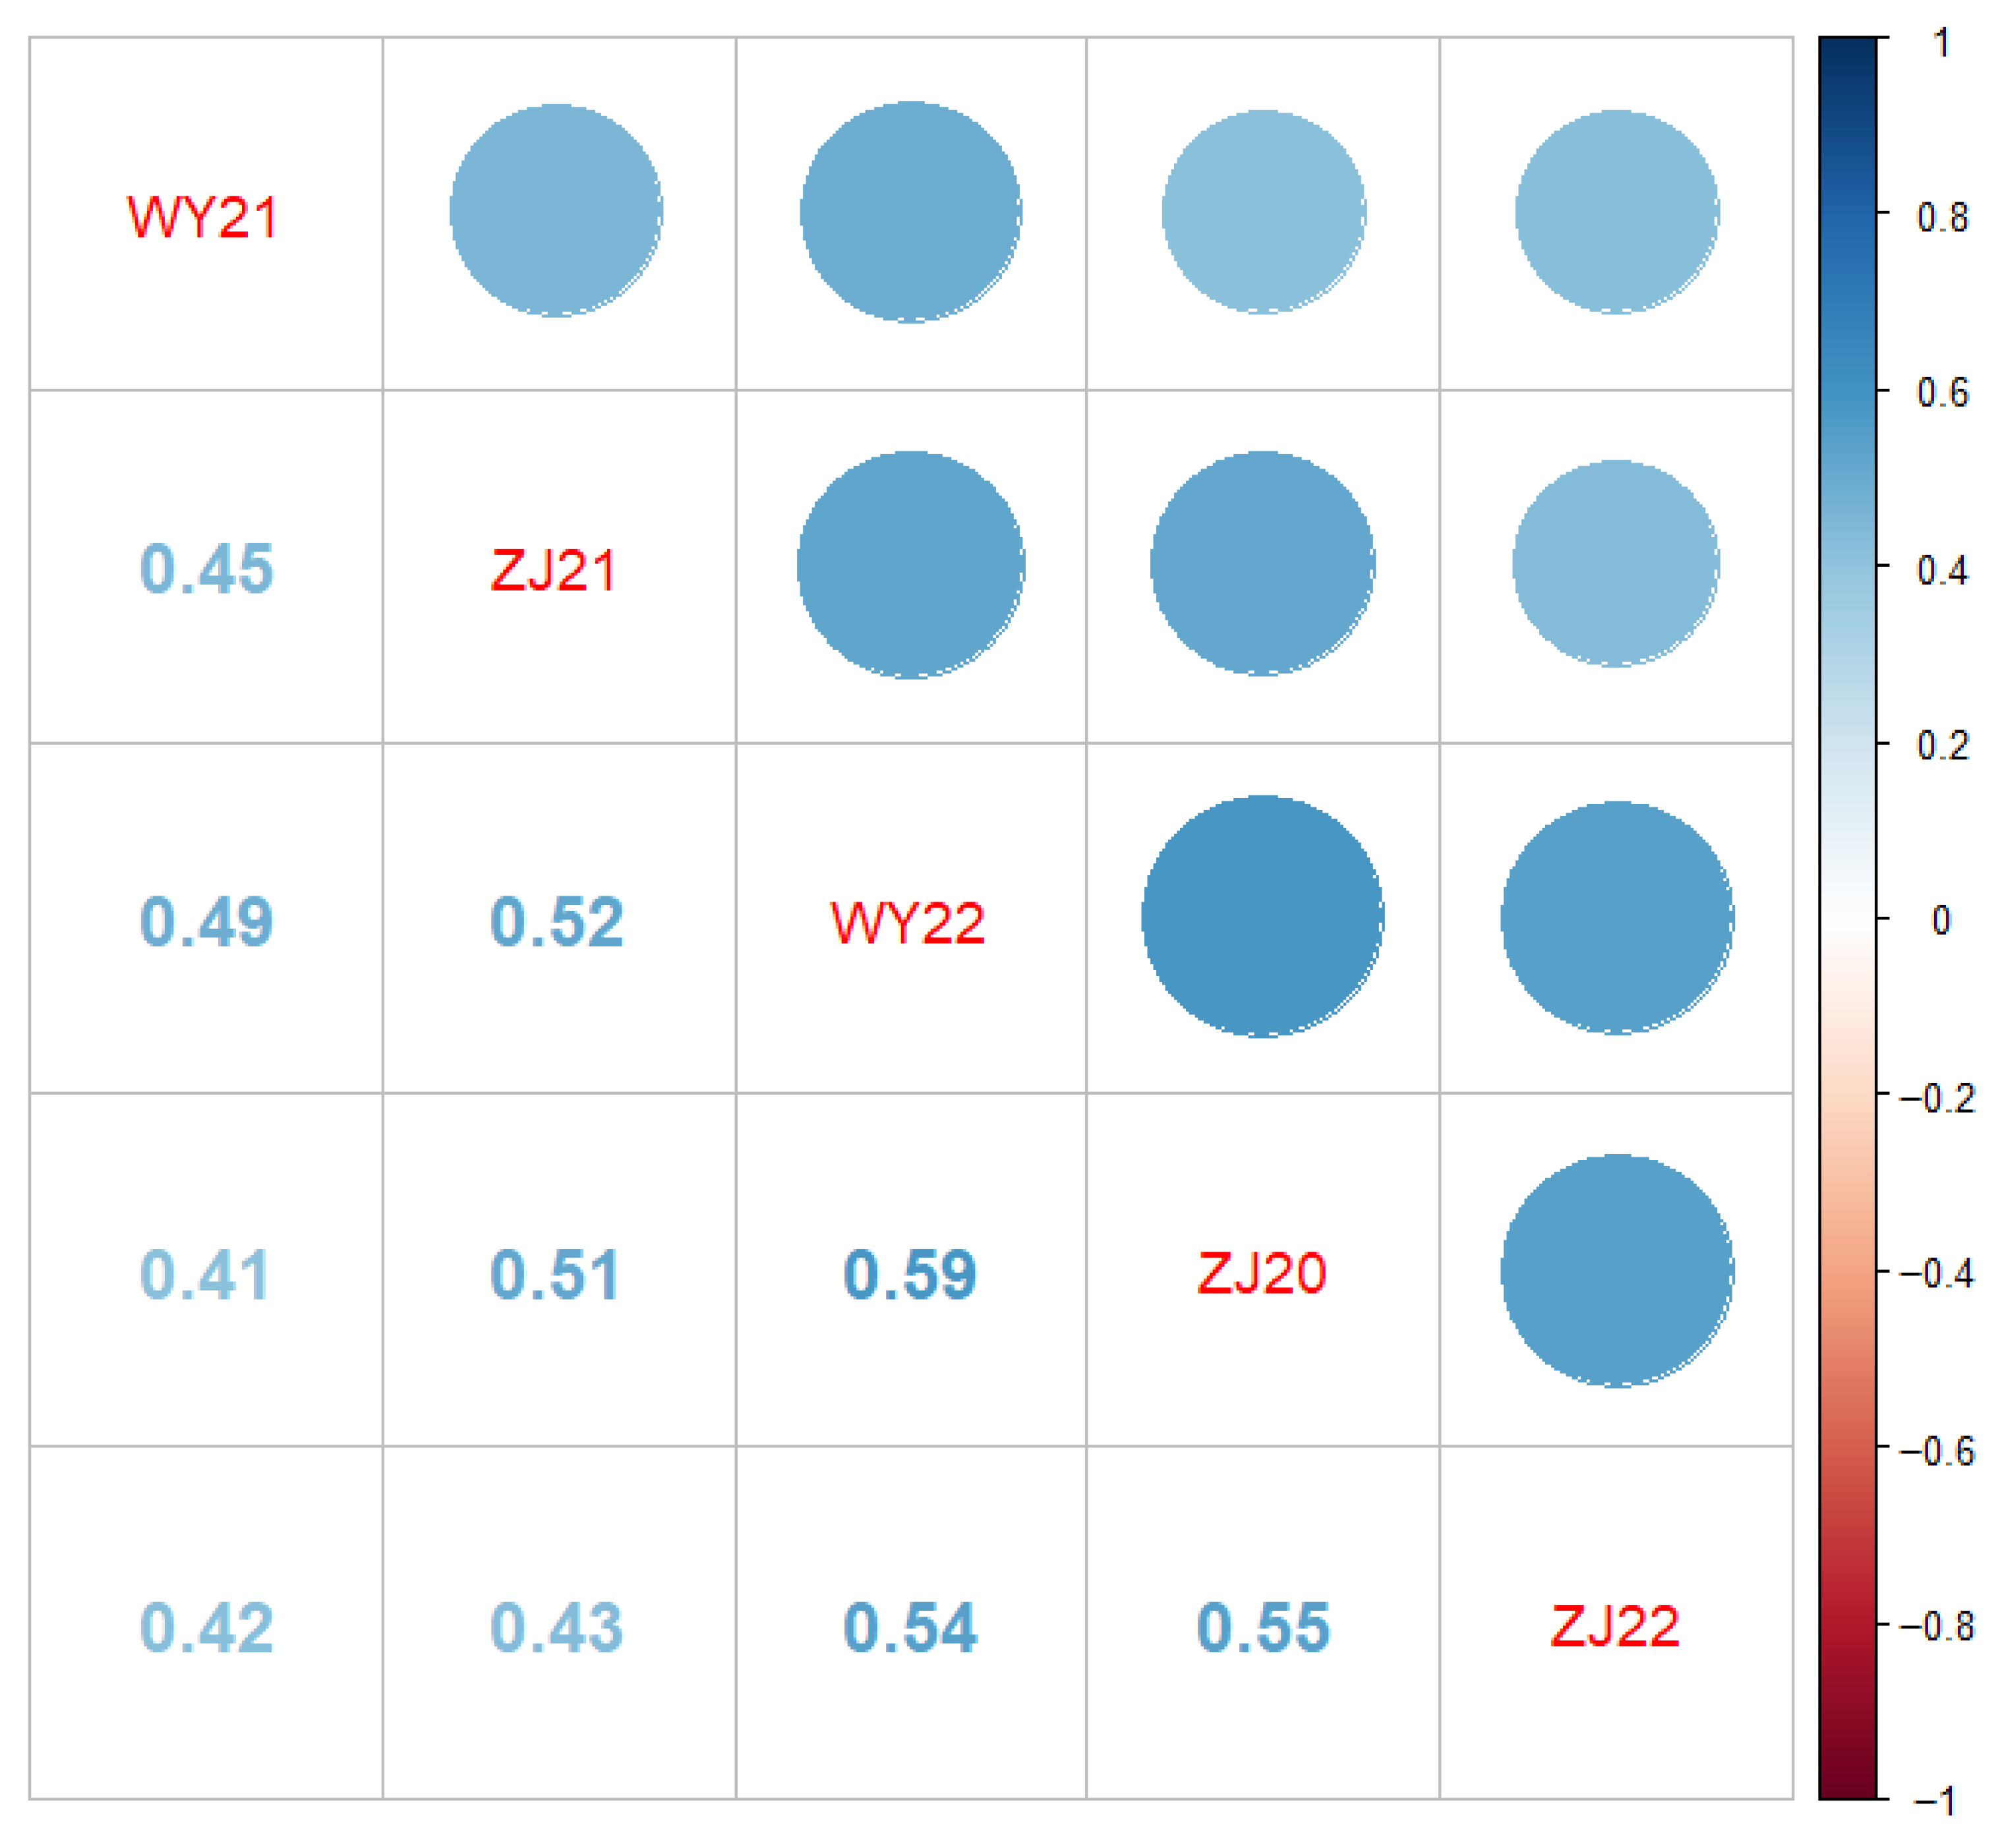
Pearson correlation analysis revealed significant positive correlations for sugarcane fiber content between all pairs of environments, with correlation coefficients ranging from 0.41 to 0.59 (Figure 3).
The correlation coefficient between Zhanjiang and Wengyuan in 2022 was 0.54, and that observed in 2021 was 0.45. Within the Wengyuan base, the correlation between 2021 and 2022 was 0.49. For the Zhanjiang base, the correlation coefficients were 0.55 between 2020 and 2022, 0.51 between 2020 and 2021, and 0.43 between 2021 and 2022. These correlations were fairly similar.

3.3. Genome-Wide Association Analysis

The association analysis was performed using GEMMA software (v.0.98.5) [46] with a univariate linear mixed model. This analysis combined 5,964,084 high-quality SNPs as molecular markers with sugarcane fiber content from 219 sugarcane clones evaluated across five environments.
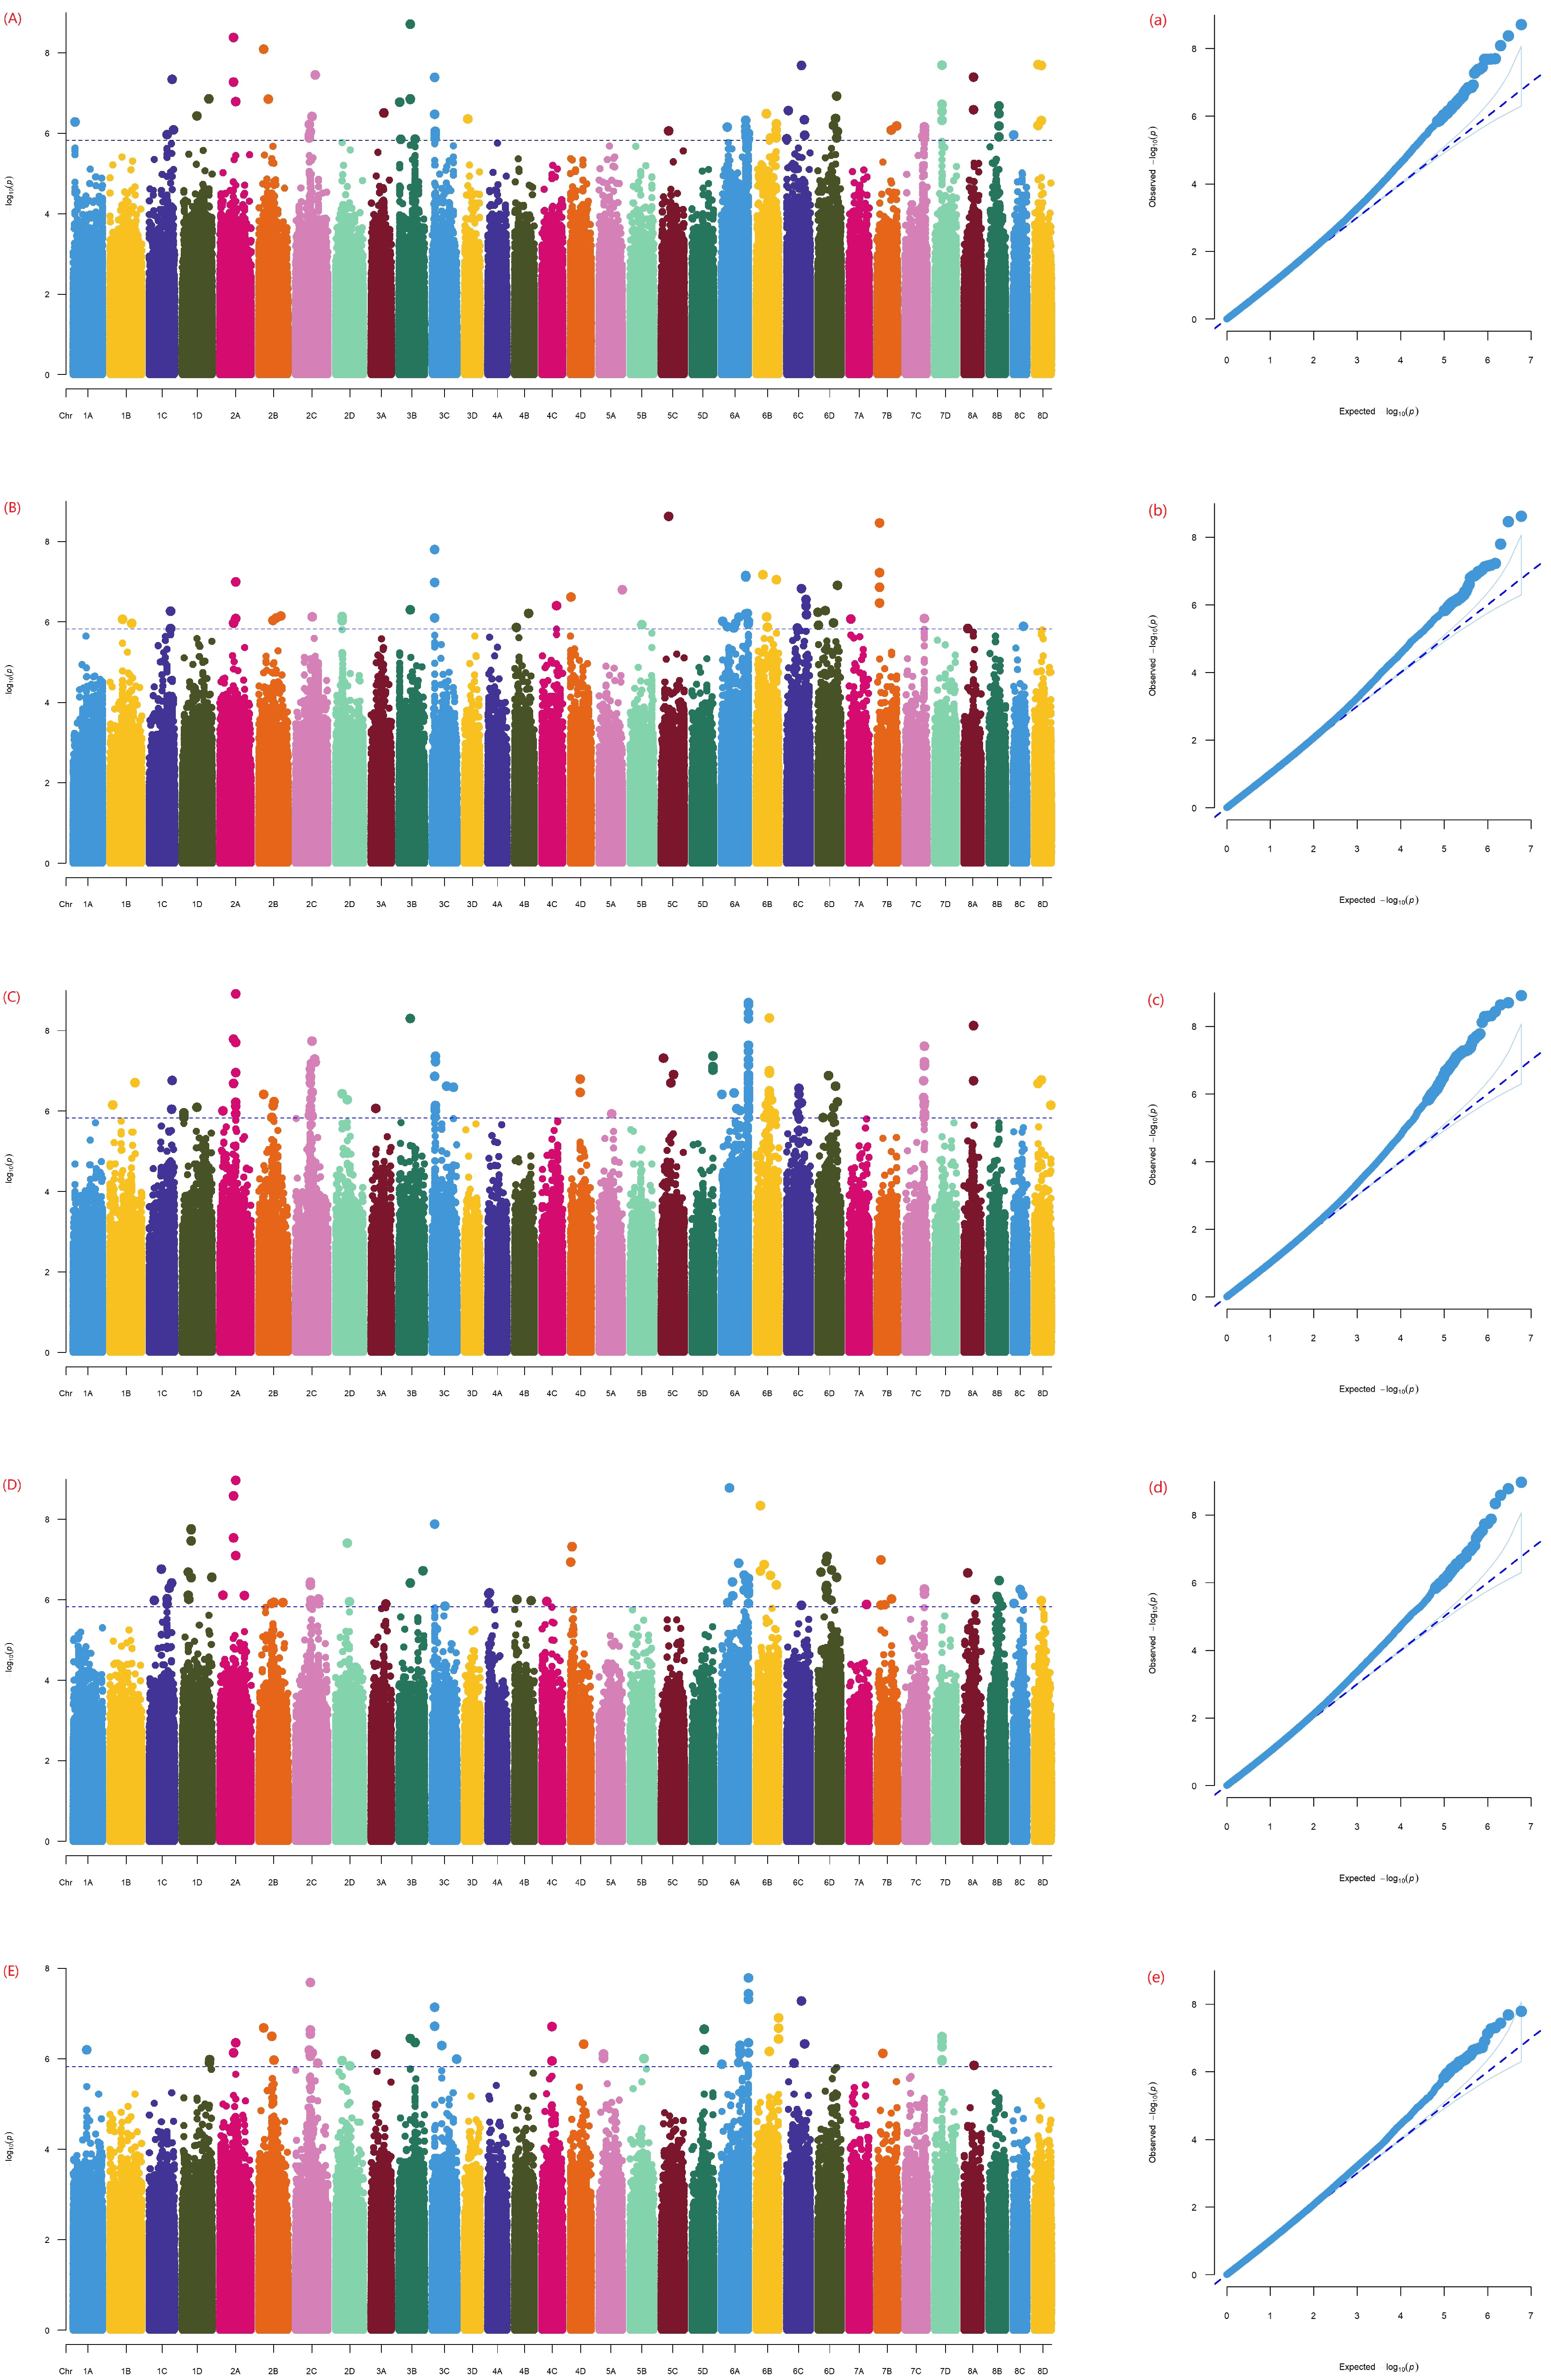
A total of 69 significant SNPs associated with sugarcane fiber content were identified across at least two environments, all with p-values below 1.5 × 10⁻⁶. These SNPs were distributed across 18 chromosomes, including 1C, 1D, 2A, 2B, 2C, 2D, 3A, 3B, 3C, 5C, 6A, 6B, 6C, 6D, 7C, 7D, 8A, and 8D (Figure 4). Of these 69 SNPs, 16 were consistently detected in all five environments, 1 in four environments, and 5 in three environments (Table S2).
In total, six loci were detected in all five environments: 1 in four environments, 5 in three environments, and 29 in two environments. The six loci consistently detected in all environments—qXW2A_2, qXW2A_3, qXW3B_1, qXW3C_1, qXW6A_4, and qXW6C_1—explained 14.99, 15.65, 15.20, 13.75, 15.18, and 13.40% of the phenotypic variation (R2), respectively. Across all 41 loci, the R2 values ranged from 10.42 to 15.65% (Table S2).

3.4. Identification of Candidate Genes

According to the LD analysis, the LD distance was approximately 20 kb when r2 decreased to 0.1. Therefore, candidate genes were identified within a 20 kb window upstream and downstream of each significant SNP. Functional annotations and expression profiles in the reference genome were used to determine the most probable gene at each locus. Of the 41 regions defined by merged SNPs within this 20 kb range, 22 were located within genes, while the remaining were found in intergenic regions. Twelve of these regions were consistently identified across more than two environments. Based on functional annotation, a total of 52 candidate genes were predicted within these intervals (Table S3), with only 1 gene of unknown function. These genes encode many proteins related to plant growth and development, such as ultraviolet-B receptor (UVR8), leucine-rich repeat receptor-like kinases (LRR-RLKs), serine/threonine kinases (STKs), cellulose synthase (CESA), vegetative cell wall protein glycoproteins1 (gp1), F-box protein, and so on. A few transcription factors, including MYB transcription factor, were also among the candidates. These genes could play a role directly or indirectly in fiber content in sugarcane.
Furthermore, according to the previous research, among these candidate genes, five key candidate ones located in four intervals were predicted to be more important in potentially influencing fiber content in sugarcane (Table S3). Among them, Sspon.02G0041160-2 C, located on chromosome 2C, encoded CESA, a key enzyme in the cellulose biosynthesis pathway [48,49,50,51,52]; Sspon.03G0039010-1C and Sspon.03G0039030-1C, both located on chromosome 3C, encoded gp1; Sspon.06G0023090-1B, on chromosome 6B, encoded an F-box protein, which has been known to be involved in regulating plant growth [19,53,54]; Sspon.07G0019440-2C, located on chromosome 7C, encoded an MYB transcription factor, with the members of this family playing central roles in developmental regulatory networks and exhibiting extensive functional diversity [19,55,56].

4. Discussion

4.1. Phenotypic Variation of Sugarcane Fiber Content Across Different Environments

This study utilized a diverse natural sugarcane population comprising 219 clones—including 17 core parental lines—that represent a broad genetic background in China. These clones originated from 11 different countries involved in sugarcane cultivation or breeding, and approximately 87% of all Chinese sugarcane varieties have been developed from the 17 core parents. Phenotypic data collected from five environments revealed coefficients of variation ranging from 14.42 to 20.55% (Table 1), indicating substantial genetic diversity for fiber content within this panel. In contrast, earlier studies reported lower variation; for instance, Xiong et al. (2023) [37] found coefficients of variation of only 9.75 and 10.22% in 2006 and 2007, respectively, among 237 self-pollinated progenies of the Louisiana sugarcane cultivar ‘LCP 85-384’.
In this study, the average fiber content across the five environments ranged from 10.50 to 12.00%. By comparison, fiber content averaged 19.42 and 19.38% in the ‘LCP 85-384’ progenies during 2006 and 2007, respectively [37], and it was 12.35% in a Louisiana core collection of 97 clones evaluated between 2016 and 2017 [36].
Differences in phenotypic values between this and previous studies—as well as among the earlier studies themselves—can be attributed to both genetic variation among the plant materials and the strong influence of environmental factors on fiber content. On environmental factors in this study, since one or two ratoon growing seasons were in succession after planting one in both bases, the fields at the two locations were fixed. According to the local conventional field management, field management practices at the two locations also followed standard agronomic procedures for sugarcane cultivation, and there was little variation in soil among those years. Therefore, fiber content could probably be influenced by rainfall and temperature. There was big variation in both rainfall and temperature among those years in both bases. For example, according to historical records, the average rainfall was 1350.7, 1292.7, and 1929.1 mm, respectively, and the average temperature was 24.4, 24.3, and 23.5 °C, respectively, in Zhanjiang base from 2020 to 2022. These findings underscore the complexity and environmental sensitivity of this trait.
It has been taken for granted that phenotypic values would be more accurate and more reliable if they were obtained from more environments. We began the genome resequencing and phenotypic evaluation of this panel in 2019, and many agronomic traits such as sucrose content, stalk number, plant height, stalk diameter, cane yield, sugar yield, leaf angle, fiber content, and others, were measured simultaneously at the two locations from 2020 to 2022. We spent a lot of time doing the investigation and analysis of phenotypic data of all these traits. It would need more professional and technical persons and more time if the field experiments in this study were conducted in more environments. To a certain degree, the phenotypic values from these five environments were representative.
On the other hand, the fiber in sugarcane is just bagasse, mainly including cellulose, hemicellulose, lignin, and so on. For breeding sugarcane cultivars with desirable fiber composition for bioethanol and paper production, it is important to conduct further studies about how each of these components engages in different pathways and roles. However, as has been said above, when the fiber content of this panel was measured, many other agronomic traits such as sucrose content, stalk number, plant height, stalk diameter, cane yield, sugar yield, and leaf angle were also investigated. Markers linked to sucrose content, stalk number, plant height, stalk diameter, cane yield, sugar yield, and leaf angle were been identified using GWASs and have already been reported [42,43]. This study was just based on our former research work. The objective was to identify markers and candidate genes associated specifically with fiber content, providing valuable insights for future genetic studies and corresponding breeding programs. The selection of good sugarcane varieties with moderate fiber content for both the high cane and sugar yield is also our objective. Since fiber always shows a significant negative correlation with most yield traits and all sugar traits, the varieties with high cane and sugar yield perform moderately in terms of fiber content (11.00–12.00%) [29,30]. Besides, as far as fruit-type sugarcane is concerned, lower fiber content and more juice would make it have a more suitable taste.

4.2. QTLs Identified for Sugarcane Fiber Content

In this study, 41 stable loci associated with fiber content in sugarcane were identified through a GWAS. Among them, six loci—qXW2A_2, qXW2A_3, qXW3B_1, qXW3C_1, qXW6A_4, and qXW6C_1—were consistently detected across all five environments (Table S2), indicating strong and stable genetic control of fiber content in these regions.
QTLs and candidate genes related to cellulose and lignin biosynthesis have previously been identified in other crops using GWASs. For example, Lee et al. (2023) [4] identified two SNPs significantly associated with dry yield in sorghum, linking one of them to the gene SbRio.06G211400 (MAFB). In another study, Esposito et al. (2022) [9] applied six multi-locus GWAS (ML-GWAS) models in 185 tetraploid wheat accessions and identified 72 reliable quantitative trait nucleotides (QTNs) for biomass traits, including genes involved in cellulose synthesis and regulatory pathways—such as CESA, Anaphase promoting complex (APC/C), Glucoronoxylan 4-O Methyltransferase (GXM), and HYPONASTIC LEAVES1 (HYL1), which may be responsible for an increase in cellulose, neutral detergent fiber (NDF), and acid detergent fiber (ADF). Similarly, Li et al. (2024) [6] detected 14 SNPs and 13 QTLs for cellulose crystallinity in 326 wheat accessions and identified two candidate genes (TraesCS4B03G0029800 and TraesCS5B03G1085500).
In sugarcane, earlier QTL mapping studies also identified loci related to fiber content using segregating populations derived from biparental crosses [57,58,59,60,61,62]. For example, Ming et al. (2002) [59] detected 20 QTLs across two populations generated from S. offinarum × S. spontaneum crosses involving 264 and 239 individuals. Anusonpornpurm et al. (2008) [57] used 180 amplified fragment length polymorphism (AFLP) markers to analyze QTLs for stalk diameter, tillering, and fiber content in a progeny population of 168 individuals. Pinto et al. (2010) [61] reported 15 marker–trait associations using restriction fragment length polymorphism (RFLP) markers in a biparental sugarcane population. Wenworn et al. (2013) [62] identified 11 QTLs for fiber, cellulose, hemicellulose, and lignin contents using 107 simplex AFLP markers in a population of 171 hybrids (derived from a K 84-200 × Kps 94-13 cross).
Since 2019, a few GWASs on fiber content in sugarcane have emerged [3,36,37]. However, these studies used the Sorghum bicolor genome as the reference to detect SNPs and InDels from genotyping-by-sequencing (GBS) data, and gene annotations were also based on the sorghum genome. To date, no GWASs on fiber content in sugarcane have used a sugarcane genome for SNP and QTL identification. Moreover, the sugarcane accessions used in these earlier studies were all derived from Louisiana or Florida breeding programs, with no inclusion of core parental lines from Chinese breeding programs.
The complex, highly heterozygous genome of sugarcane and its susceptibility to inbreeding depression pose challenges for genetic studies using F1 or selfed progeny from heterozygous parents [37]. LD-based mapping approaches can enhance the efficiency of gene discovery within breeding programs by leveraging phenotypic data collected during selection [63]. In contrast to previous work, this study applied a GWAS to a natural sugarcane population. This population included cultivars or clones derived from 11 countries involved in sugarcane cultivation and breeding and core parental lines from Chinese breeding programs, representing a wide and relevant genetic base. Additionally, all sequencing reads were aligned to the S. spontaneum reference genome (AP85-441), ensuring higher accuracy in SNP detection and candidate gene identification. Compared with earlier studies that were constrained by reference genome selection or limited population diversity, the present findings offer more reliable and practical insights for advancing sugarcane breeding efforts in China.

4.3. Key Candidate Genes Associated with Fiber Content in Sugarcane

Based on functional annotations and genomic positions, 52 candidate genes were predicted. These genes encode UVR8, LRR-RLKs, STKs, CESA, gp1, F-box protein, MYB transcription factor, and so on. They might influence the fiber content in sugarcane directly or indirectly. Furthermore, according to previous literature, five key candidate genes located within four identified QTL regions were considered to be potential contributors. These genes were Sspon.02G0041160-2C, Sspon.03G0039010-1C, Sspon.03G0039030-1C, Sspon.06G0023090-1B, and Sspon.07G0019440-2C (Table S3).
The gene Sspon.02G0041160-2C encodes CESA, a critical enzyme in the cellulose synthesis pathway [48,49,50,51,52]. The functions of CESA gene family members have been studied in various species, including Dimocarpus longan Lour. [64], Populus trichocarpa [48], Miscanthus lutarioriparius [65], peach (Prunus persica) [66], and cucumber (Cucumis sativus) [67]. In sugarcane, CESA genes have been identified via comparative genomics and functionally analyzed in transgenic Arabidopsis systems [68]. Comparative genomics and transgenic studies in model plants have been employed to investigate the functions of sugarcane genes involved in primary and secondary cell wall synthesis, including SsCesA3, SsCesA9, SsCesA11 [69], and CesA7 [33]. Prior research showed that ScCesA3 is expressed in the leaf, leaf sheath, and stem, with significantly higher expression observed in the stem—particularly in the fifth internode, identified based on the position relative to the +5 leaf [70]. In rice, OsCesA7 plays a key role in cellulose biosynthesis and plant development, with strong expression in the culm at maturity, especially in structural tissues like vascular bundles and sclerenchyma cells, aligning with the brittle culm phenotype [71]. The promoter region of sugarcane CesA7 contains numerous light-responsive elements and methyl jasmonate elements, suggesting its involvement in photomorphogenesis and stress responses. Protein interaction predictions and promoter analyses further indicate that CesA7 interacts with MYB transcription factors, implying a broader role in regulating plant growth, development, and environmental response [33].
The candidate genes Sspon.03G0039010-1C and Sspon.03G0039030-1C both encode the vegetative cell wall protein gp1. In rice, the OsGP1 gene was cloned and found to localize in both the cell membrane and the cell wall, where it plays a role in plant growth and cell wall synthesis. Notably, overexpression of OsGP1 has been shown to enhance plant height and increase fresh biomass [72].
The candidate gene Sspon.06G0023090-1B encodes an F-box protein, a class of regulatory proteins known to be crucial in plant growth [19,53,54]. F-box proteins form one of the largest protein families involved in targeted protein degradation. Although many F-box proteins remain functionally uncharacterized, some, such as AtFBX92, have been identified as regulators of vegetative growth. AtFBX92 negatively regulates plant growth, not by directly influencing cell cycle genes, but by modulating hormone signaling pathways [19,53].
The candidate gene Sspon.07G0019440-2C encodes a MYB transcription factor. The MYB family is among the largest and most functionally diverse transcription factor families in plants and plays central roles in developmental regulatory networks [19,55,56]. In Arabidopsis thaliana, MYB46 and MYB83 are functionally redundant transcription factors that serve as master regulators of secondary cell wall biosynthesis. This regulation is governed by a multilevel feed-forward loop in which MYB46/MYB83, along with secondary wall NACs (SWNs) and their direct downstream targets, activate the gene network responsible for secondary wall formation [73]. Other MYB transcription factors, such as MYB58 and MYB63 in Arabidopsis and their poplar ortholog, PtrMYB28, act as transcriptional activators of the lignin biosynthetic. Similarly, eucalyptus EgMYB2 and pine PtMYB4 are considered orthologs of MYB46 and are involved in the broader regulation of the secondary wall biosynthetic pathway [74].
In sugarcane, co-expression network analysis revealed several transcription factors involved in cell wall metabolism, with ScMYB52 identified as a promising candidate for further study [33]. In rice, transcription factors NAC29/31 have been shown to directly regulate MYB61, which subsequently activates CESA gene expression, indicating a regulatory cascade in cellulose biosynthesis [75]. In moso bamboo (Phyllostachys edulis), PeMYB35 binds to the GAMYB (Gibberellin-induced MYB transcription factor) element in the PeCesA1 promoter, suggesting that it may modulate PeCesA1 gene expression [76].
It is worth noting that Yang et al. (2019) [3] evaluated 12 fiber composition-related traits, and the GWAS was performed in the full set of the panel and four sub-populations separately, combining every trait phenotyping in only one environment with the DNA markers, and conducted by GWASpoly considering six different models, which included both additive and simplex models. The associated markers and candidate genes were identified using the Sorghum bicolor genome as the reference, with the rigorous cutoff of P a little lower than 1.0 × 10⁻⁶. While in this study, a GWAS on “total fiber” in sugarcane was carried out using a full set of the panel with phenotypic data collected across five different environments, and conducted by GEMMA software, employing the univariate linear mixed model, which did not require a covariate matrix, and the significant SNP cutoff of p ≤ 1.5 × 10⁻⁶ was used with a sugarcane genome for SNP and QTL identification. The panel used in this study included several parental materials, such as CP89-2143, CP72-2086, R 570, and Bamboo Cane, which were also included in the previous study [3]. However, the sugarcane accessions used in the earlier studies were all derived from Louisiana or Florida breeding programs [3,36,37], with no inclusion of core parental lines such as CP28-11-Sanya-Yacheng, CP49-50, CP67-412, CP72-1210, Co1001, Co419, F108-Sanya-Yacheng, F134, Hua_nan-56-12, Hua_nan-56-21-Sanya-Yacheng, KeWu, NCo310, R0C1-Sanya-Yacheng, Yacheng-71-374, Yun-65-225, gui11, and yuenong-73-204, which were from Chinese breeding programs [42,43,44] and used in the panel of current study.
On the other hand, in a previous study [3], 51 markers associated with 54 sorghum genes were significantly linked with glucan, and 6 markers and 7 genes and 40 markers and 39 genes were associated with xylan and arabinan, respectively; 1 marker was identified to be associated with total lignin, and five markers with acid-insoluble lignin; 1 marker and 1 gene was associated with nonstructural ash, structure ash, and structural protein, respectively; 2 markers and 2 genes were identified to be associated with ethanol extractives; and 22 markers and 23 genes were associated with extractable nitrogen, but no marker was associated with both acid soluble lignin and acetyl groups. In summary, 106 putative DNA markers and 107 genes associated with 10 fiber traits were identified. Among these candidate genes, three genes (Sobic.009G088700, Sobic.005G032000, and Sobic.009G233200) contained domains of cellulase, UDP-glucosyl transferase, and sucrose synthase, respectively, which might participate in carbon flux to cellulose, and determine glucan content in sugarcane cell walls. Another gene (Sobic.001G214800) associated with structure ash was annotated as a transcription factor. In the current study, a total of 69 SNPs across 41 QTLs and 52 candidate genes associated with “total fiber” were identified, and among these candidate genes, Sspon.02G0041160-2C encodes CESA, Sspon.07G0019440-2C encodes a MYB transcription factor, and the function of these two genes might be similar to that of the corresponding ones identified in the previous study. The candidate genes identified in the current study encoded UVR8, LRR-RLKs, STKs, gp1, and F-box protein, which were not identified in the previous study. Conversely, some important genes annotated as glycosyltransferase family, kdotransferase, oxidoreductase, and ionotropic glutamate receptor were identified in the previous study, which could not be identified in this study.
Furthermore, in this study, candidate genes were identified with the genomic regions extending 20 kb upstream and downstream of each associated peak SNP, according to LD analysis. However, compared to many other field crops, sugarcane is highly unusual for its polyploid interspecific hybrid and singularly complex genomes. There was a methodological limitation in applying a 20 kb window in the context of this highly polyploid genome. In this study, among the fifty-two candidate genes, only one was harboring GWAS-associated SNP (Chr6D_69027294 in Sspon.06G0027120-1P annotated as NBS-LRR-like resistance protein), and others were all flanked at GWAS SNPs (the max distance from the gene to GWAS SNP was 24 Kb). In fact, with the genomic regions extending 50 kb upstream and downstream of each associated peak SNP, the number of newly identified candidate genes was small, lower than 20, and none of them was reported in earlier studies. Only when the genomic regions extended to no less than 300 kb upstream and downstream of each associated peak SNP, could the total number of identified candidate genes be double.
Besides, in experiments on these candidate genes using available expression data, genes with different expression data were all worth noting and studying, because different types of sugarcane varieties have correspondingly different fiber contents, as already mentioned above.

5. Conclusions

In this study, a total of 69 SNPs associated with fiber content were identified across 41 QTLs, encompassing 52 genes. These genes encode UVR8, LRR-RLKs, STKs, CESA, gp1, F-box protein, MYB transcription factor, and so on. They might influence the fiber content in sugarcane directly or indirectly. Furthermore, according to previous studies, five genes located in four QTL regions were proposed as more critical candidates. These included Sspon.02G0041160-2C, which encodes CESA; Sspon.03G0039010-1C and Sspon.03G0039030-1C, both encoding vegetative cell wall protein gp1; Sspon.06G0023090-1B, encoding an F-box protein; and Sspon.07G0019440-2C, encoding an MYB transcription factor. These genes are promising candidates for future functional studies and may serve as important genetic resources for breeding different types of sugarcane varieties with correspondingly suitable fiber content.

Supplementary Materials

The following supporting information can be downloaded at https://www.mdpi.com/article/10.3390/agronomy15102249/s1: Table S1: Phenotypic data of the sugarcane fiber content (%) of the 219 clones; Table S2: GWAS location of the sugarcane fiber content of the 219 clones; Table S3: Prediction of candidate genes related to sugarcane fiber content and functional annotation.

Author Contributions

Conceptualization, N.Z. and J.W.; methodology, X.F. and N.Z.; software, Y.C.; validation, Y.C., Y.L. and Z.W.; formal analysis, Y.L.; investigation, X.F. and Z.W.; resources, X.F., N.Z. and J.W.; data curation, X.F. and N.Z.; writing—original draft preparation, Y.C.; writing—review and editing, Y.C., N.Z. and Y.L.; visualization, Y.L. and Z.W.; supervision, N.Z. and J.W.; project administration, N.Z. and J.W.; funding acquisition, N.Z. and J.W. All authors have read and agreed to the published version of the manuscript.

Funding

This research was funded by GDAS’ Project of Science and Technology Development (2022GDASZH-2022010201-05), the National Natural Science Foundation of China (32372510), CARS (CARS-17), the Natural Science Foundation of Guangdong Province (2022A1515011829), the Open Funds of National Key Laboratory for Tropical Crop Breeding (NO. NKLTCB202401) and the Special Project for Rural Revitalization Strategy in Guangdong Province (2024-NPY-00–019). The funding bodies had no role in the study design, data collection and analysis, decision to publish, or preparation of the manuscript.

Data Availability Statement

Data are available in the manuscript and in the Supplementary Materials.

Conflicts of Interest

The authors declare no conflicts of interest.

References

  1. Milano, E.R.; Payne, C.E.; Wolfrum, E.; Lovell, J.; Jenkins, J.; Schmutz, J.; Juenger, T.E. Quantitative trait loci for cell wall composition traits measured using near-infrared spectroscopy in the model c4 perennial grass Panicum hallii. Biotechnol. Biofuels 2018, 11, 25–35. [Google Scholar] [CrossRef] [PubMed]
  2. Sulis, D.B.; Lavoine, N.; Sederoff, H.; Jiang, X.; Marques, B.M.; Lan, K.; Cofre-Vega, C.; Barrangou, R.; Wang, J.P. Advances in lignocellulosic feedstocks for bioenergy and bioproducts. Nat. Commun. 2025, 16, 1244–1256. [Google Scholar] [CrossRef]
  3. Yang, X.P.; Todd, J.; Arundale, R.; Binder, J.B.; Luo, Z.L.; Islam, M.S.; Sood, S.; Wang, J.P. Identifying loci controlling fiber composition in polyploid sugarcane (saccharum spp.) Through genome-wide association study. Ind. Crops Prod. 2019, 130, 598–605. [Google Scholar] [CrossRef]
  4. Lee, Y.; Yang, B.; Kim, W.J.; Kim, J.; Kwon, S.; Kim, J.H.; Ahn, J.; Kim, S.H.; Rha, E.; Ha, B.; et al. Genome-wide association study (GWAS) of the agronomic traits and phenolic content in sorghum (sorghum bicolor l.) Genotypes. Agronomy 2023, 13, 1449. [Google Scholar] [CrossRef]
  5. Tang, R.H.; Li, X.H.; Lu, X.G.; Zhang, M.Q.; Yao, W. Transmittance vis-NIR spectroscopy for detecting fibre content of living sugarcane. Spectrosc. Spectr. Anal. 2023, 43, 2419–2425. [Google Scholar]
  6. Li, J.G.; Zhao, P.M.; Zhao, L.Y.; Chen, Q.; Nong, S.K.; Li, Q.; Wang, L.Q. Integrated VIS/NIR spectrum and genome-wide association study for genetic dissection of cellulose crystallinity in wheat stems. Int. J. Mol. Sci. 2024, 25, 3028. [Google Scholar] [CrossRef]
  7. Shah, L.; Yahya, M.; Shah, S.M.A.; Nadeem, M.; Ali, A.; Ali, A.; Wang, J.; Riaz, M.W.; Rehman, S.; Wu, W.X.; et al. Improving lodging resistance: Using wheat and rice as classical examples. Int. J. Mol. Sci. 2019, 20, 4211. [Google Scholar] [CrossRef]
  8. Wu, X. QTL Mapping and GWAS for Soluble Solids and Cellulose Components in Brassica Napus. Master”s Thesis, Jiangsu University, Zhenjiang, China, 2022. [Google Scholar]
  9. Esposito, S.; Taranto, F.; Vitale, P.; Ficco, D.B.M.; Colecchia, S.A.; Stevanato, P.; De Vita, P. Unlocking the molecular basis of wheat straw composition and morphological traits through multi-locus GWAS. BMC Plant Biol. 2022, 22, 519. [Google Scholar] [CrossRef]
  10. Wang, F.Q.; Ouyang, D.H.; Zhou, Z.Y.; Page, S.J.; Liu, D.H.; Zhao, X.B. Lignocellulosic biomass as sustainable feedstock and materials for power generation and energy storage. J. Energy Chem. 2021, 57, 247–280. [Google Scholar] [CrossRef]
  11. Bao, J.S.; Jin, L.; Shen, Y.; Xie, J.K. Genetic mapping of quantitative trait loci associated with fiber and lignin content in rice. Cereal Res. Commun. 2007, 35, 23–30. [Google Scholar] [CrossRef]
  12. Xie, J.K.; Kong, X.L.; Chen, J.; Hu, B.L.; Wen, P.; Zhuang, J.Y.; Bao, J.S. Mapping of quantitative trait loci for fiber and lignin contents from an interspecific cross oryza sativa × oryza rufipogon. J. Zhejiang Univ. Sci. B (Biomed. Biotechnol.) 2011, 12, 518–526. [Google Scholar] [CrossRef][Green Version]
  13. Cardinal, A.; Lee, M.; Moore, K. Genetic mapping and analysis of quantitative trait loci affecting fiber and lignin content in maize. Theor. Appl. Genet. 2003, 106, 866–874. [Google Scholar] [CrossRef]
  14. Lorenzana, R.E.; Lewis, M.F.; Jung, H.J.G.; Bernardo, R. Quantitative trait loci and trait correlations for maize stover cell wall composition and glucose release for cellulosic ethanol. Crops Sci. 2010, 50, 541–555. [Google Scholar] [CrossRef]
  15. Shiringani, A.L.; Friedt, W. QTL for fibre-related traits in grain × sweet sorghum as a tool for the enhancement of sorghum as a biomass crop. Theor. Appl. Genet. 2011, 123, 999–1011. [Google Scholar] [CrossRef] [PubMed]
  16. Devate, N.B.; Krishna, H.; Parmeshwarappa, S.K.V.; Manjunath, K.K.; Chauhan, D.; Singh, S.; Singh, J.B.; Kumar, M.; Patil, R.; Khan, H.; et al. Genome-wide association mapping for component traits of drought and heat tolerance in wheat. Front. Plant Sci. 2022, 13, 943033–943052. [Google Scholar] [CrossRef] [PubMed]
  17. Jin, H.; Yang, X.; Zhao, H.B.; Song, X.Z.; Tsvetkov, Y.D.; Wu, Y.E.; Gao, Q.; Zhang, R.; Zhang, J.M. Genetic analysis of protein content and oil content in soybean by genome-wide association study. Front. Plant Sci. 2023, 14, 1182771–1182782. [Google Scholar] [CrossRef] [PubMed]
  18. Tian, X.K.; Qu, J.Z.; Lao, Y.H.; Li, T.; Xue, J.Q.; Xu, S.T.; Zhang, X.H. Genome wide association analysis for chlorophyll index at silking stages in maize. Mol. Plant Breed. 2020, 18, 7613–7624. [Google Scholar] [CrossRef]
  19. Wang, R.; Ren, Y.; Cheng, Y.K.; Wang, W.; Zhang, Z.H.; Geng, H.W. Genome-wide association analysis of morphological traits of flag leaf in wheat. Acta Agron. Sin. 2023, 49, 2886–2901. [Google Scholar] [CrossRef]
  20. Wang, N.S.; Wang, X.M.; Qian, Y.Z.; Bai, D.; Bao, Y.L.; Zhao, X.Y.; Xu, P.; Li, K.Y.; Li, J.F.; Li, K.; et al. Genome-wide association analysis of rice leaf traits. Agronomy 2023, 13, 2687. [Google Scholar] [CrossRef]
  21. Wang, Z.B.; Yu, D.J.; Morota, G.; Dhakal, K.; Singer, W.; Lord, N.; Huang, H.B.; Chen, P.Y.; Mozzoni, L.; Li, S.; et al. Genome-wide association analysis of sucrose and alanine contents in edamame beans. Front. Plant Sci. 2023, 13, 1086007–1086018. [Google Scholar] [CrossRef]
  22. Wang, Q.; Zhu, Y.X.; Zhou, M.M.; Zhang, W.; Zhang, H.M.; Chen, X.; Chen, H.T.; Cui, X.Y. Genome-wide association analysis and candidate genes predication of leaf characteristics traits in soybean (glycine max l.). Acta Agron. Sin. 2024, 50, 623–632. [Google Scholar]
  23. Zhang, D.Y.; Wang, X.R.; Wu, Y.H.; He, C.Y.; Yang, L.; Jia, L.; Zhuang, J.E. Genome wide association analysis of chlorophyll content in some main spring soybean cultivars. J. Northeast. Agric. Univ. 2022, 53, 1–9. [Google Scholar] [CrossRef]
  24. Zhang, B.Q.; Huang, Y.X.; Zhang, L.J.; Zhou, Z.F.; Zhou, S.; Duan, W.X.; Yang, C.F.; Gao, Y.J.; Li, S.C.; Chen, M.Y.; et al. Genome-wide association study unravels quantitative trait loci and genes associated with yield-related traits in sugarcane. J. Agric. Food. Chem. 2023, 71, 16815–16826. [Google Scholar] [CrossRef]
  25. Zou, K.; Kim, K.; Kang, D.; Kim, M.; Ha, J.; Moon, J.; Jun, T. Genome-wide association study of leaf chlorophyll content using high-density SNP array in peanuts (arachis hypogaea l.). Agronomy 2022, 12, 152. [Google Scholar] [CrossRef]
  26. Healey, A.L.; Garsmeur, O.; Lovell, J.T.; Shengquiang, S.; Sreedasyam, A.; Jenkins, J.; Plott, C.B.; Piperidis, N.; Pompidor, N.; Llaca, V.; et al. The complex polyploid genome architecture of sugarcane. Nature 2024, 628, 804–810. [Google Scholar] [CrossRef]
  27. Dinesh Babu, K.S.; Janakiraman, V.; Palaniswamy, H.; Kasirajan, L.; Gomathi, R.; Ramkumar, T.R. A short review on sugarcane: Its domestication, molecular manipulations and future perspectives. Genet. Resour. Crop Evol. 2022, 69, 2623–2643. [Google Scholar] [CrossRef] [PubMed]
  28. Wei, Y.B.; Xu, Y.Z.; Khan, A.; Jiang, C.X.; Li, H.J.; Wu, Y.L.; Zhang, C.; Wang, M.Y.; Chen, J.; Zeng, L.F.; et al. Analysis of photosynthetic characteristics and screening high light-efficiency germplasm in sugarcane. Plants 2024, 13, 587. [Google Scholar] [CrossRef]
  29. Li, H.G.; Tan, Y.M.; Tan, F.; Wang, L.W. Correlation analysis of fiber content and agronomic process characteristics of sugarcane. J. Anhui Agric. Sci. 2010, 38, 15528–15530. [Google Scholar]
  30. Li, X.J.; Zi, Q.Y.; Xu, C.H.; Li, C.J.; Liu, H.B.; Lin, X.Q.; Mao, J.; Qin, W.; Zhao, L.P.; Liu, X.L. Evaluation and cluster analysis on yield and quality traits of commonly used sugarcane parental clones in China. Sugar Crops China 2022, 44, 1–8. [Google Scholar]
  31. Amjed, M.; Jung, H.G.; Donker, J.D. Effect of alkaline hydrogen peroxide treatment on cell wall composition and digestion kinetics of sugarcane residues and wheat straw. J. Anim. Sci. 1992, 70, 2877–2884. [Google Scholar] [CrossRef]
  32. Ferreira, S.S.; Hotta, C.T.; Poelking, V.G.D.C.; Leite, D.C.C.; Buckeridge, M.S.; Loureiro, M.E.; Barbosa, M.H.P.; Carneiro, M.S.; Souza, G.M. Co-expression network analysis reveals transcription factors associated to cell wall biosynthesis in sugarcane. Plant Mol. Biol. 2016, 91, 15–35. [Google Scholar] [CrossRef]
  33. Kuang, B.W.; Zhao, J.H.; Li, S.C.; Wei, N.; Feng, M.F.; Yang, X.P. Bioinformatics analysis and function prediction of CesA7 gene in sugarcane. Chin. J. Trop. Crops 2023, 44, 1337–1347. [Google Scholar]
  34. Li, X. Evaluation on Lodging Resistance and Mechanism of Lodging Resistance in Sugarcane; Guangxi University: Nanning, China, 2019. [Google Scholar]
  35. Lin, Q.S.; Li, T.Y.; Li, X.L.; Zhang, Z.T. Reconsider the effecting of the fiber on milling capacity. Sugarcane Canesugar 1995, 36–39. [Google Scholar]
  36. Fickett, N.; Gutierrez, A.; Verma, M.; Pontif, M.; Hale, A.; Kimbeng, C.; Baisakh, N. Genome-wide association mapping identifies markers associated with cane yield components and sucrose traits in the louisiana sugarcane core collection. Genomics 2019, 111, 1794–1801. [Google Scholar] [CrossRef] [PubMed]
  37. Xiong, H.Z.; Chen, Y.L.; Pan, Y.B.; Shi, A.N. A genome-wide association study and genomic prediction for fiber and sucrose contents in a mapping population of LCP 85-384 sugarcane. Plants 2023, 12, 1041. [Google Scholar] [CrossRef] [PubMed]
  38. Andru, S.; Pan, Y.B.; Thongthawee, S.; Burner, D.M.; Kimbeng, C.A. Genetic analysis of the sugarcane (saccharum spp.) Cultivar ‘LCP 85-384’. I. Linkage mapping using AFLP, SSR, and TRAP markers. Theor. Appl. Genet. 2011, 123, 77–93. [Google Scholar] [CrossRef]
  39. Nayak, S.N.; Song, J.; Villa, A.; Pathak, B.; Ayala-Silva, T.; Yang, X.P.; Todd, J.; Glynn, N.C.; Kuhn, D.N.; Glaz, B.; et al. Promoting utilization of saccharum spp. Genetic resources through genetic diversity analysis and core collection construction. PLoS ONE 2014, 9, e110856. [Google Scholar] [CrossRef]
  40. Todd, J.R.; Sandhu, H.; Binder, J.; Arundale, R.; Gordon, V.; Song, J.; Glaz, B.; Wang, J.P. Fiber composition of a diversity panel of the world collection of sugarcane (saccharum spp.) And related grasses. Bragantia 2018, 77, 48–61. [Google Scholar] [CrossRef]
  41. Yang, X.P.; Song, J.; Todd, J.; Peng, Z.; Paudel, D.; Luo, Z.L.; Ma, X.K.; You, Q.; Hanson, E.; Zhao, Z.F.; et al. Target enrichment sequencing of 307 germplasm accessions identified ancestry of ancient and modern hybrids and signatures of adaptation and selection in sugarcane (saccharum spp.), A ‘sweet’ crop with ‘bitter’ genomes. Plant Biotechnol. J. 2019, 17, 488–498. [Google Scholar] [CrossRef]
  42. Chen, X.L.; Huang, Z.H.; Fu, D.W.; Fang, J.T.; Zhang, X.B.; Feng, X.M.; Xie, J.F.; Wu, B.; Luo, Y.J.; Zhu, M.F.; et al. Identification of genetic loci for sugarcane leaf angle at different developmental stages by genome-wide association study. Front. Plant Sci. 2022, 13, 841693–841705. [Google Scholar] [CrossRef] [PubMed]
  43. Li, X.H.; Chen, X.L.; Fang, J.T.; Feng, X.M.; Zhang, X.B.; Lin, H.Z.; Chen, W.W.; Zhang, N.N.; He, H.Y.; Huang, Z.H.; et al. Whole-genome sequencing of a worldwide collection of sugarcane cultivars (saccharum spp.) Reveals the genetic basis of cultivar improvement. Plant J. 2024, 119, 2151–2167. [Google Scholar] [CrossRef]
  44. Zhang, Q.; Qi, Y.W.; Zhang, C.M.; Chen, Y.S.; Deng, H.H. Pedigree analysis of genetic relationship among core parents of sugarcane in mainland China. Guangdong Agric. Sci. 2009, 13, 44–48. (In Chinese) [Google Scholar] [CrossRef]
  45. Cai, Q.; Fuan, Y.H. Descriptors and Data Standard for Sugarcane; China Agriculture Press: Beijing, China, 2006. [Google Scholar]
  46. Zhou, X.; Stephens, M. Genome-wide efficient mixed-model analysis for association studies. Nat. Genet. 2012, 44, 821–824. [Google Scholar] [CrossRef] [PubMed]
  47. Zhang, J.; Zhang, X.; Tang, H.; Zhang, Q.; Hua, X.; Ma, X.; Zhu, F.; Jones, T.; Zhu, X.; Bowers, J.; et al. Allele-defined genome of the autopolyploid sugarcane saccharum spontaneum L. Nat. Genet. 2018, 50, 1565–1573. [Google Scholar] [CrossRef]
  48. Abbas, M. Functional Characterization of Cellulose Synthase Genes in Secondary Cell Wall Thickening of Xylem Cells during Wood Formation in Populus Trichocarpa; Beijing Forestry University: Beijing, China, 2020. [Google Scholar]
  49. Du, J.; Vandavasi, V.G.; Molloy, K.R.; Yang, H.; Massenburg, L.N.; Singh, A.; Kwansa, A.L.; Yingling, Y.G.; Neill, H.O.; Chait, B.T.; et al. Evidence for plant-conserved region mediated trimeric CESAs in plant cellulose synthase complexes. Biomacromolecules 2022, 23, 3663–3677. [Google Scholar] [CrossRef]
  50. Kumar, M.; Mishra, L.; Carr, P.; Pilling, M.; Gardner, P.; Mansfield, S.D.; Turner, S. Exploiting cellulose synthase (CESA) class specificity to probe cellulose microfibril biosynthesis. Plant Physiol. 2018, 177, 151–167. [Google Scholar] [CrossRef] [PubMed]
  51. Que, F.; Zha, R.F.; Qiang, W. Advances in research of cellulose synthase genes in plants. J. Nanjing For. Univ. (Nat. Sci. Ed.) 2022, 46, 207–214. [Google Scholar]
  52. Su, J.; He, J.X.; Fu, C.M.; Xian, K.H.; Huang, N.Z. Cloning and preliminary expression analysis of cellulose synthase PfCesA2 and PfCesA8 from paulownia fortunei. Mol. Plant Breed. 2020, 18, 2512–2519. [Google Scholar]
  53. Baute, J.; Polyn, S.; De Block, J.; Blomme, J.; Van Lijsebettens, M.; Inzï, D. F-box protein FBX92 affects leaf size in Arabidopsis thaliana. Plant Cell Physiol. 2017, 58, 962–975. [Google Scholar] [CrossRef]
  54. Huo, D.Y.; Zheng, W.J.; Li, P.S.; Xu, Z.S.; Zhou, Y.B.; Chen, M.; Ma, Y.Z.; Min, D.H.; Zhang, X.H. Identification, classification, and drought response of f-box gene family in foxtail millet. Acta Agron. Sin. 2014, 40, 1585–1594. [Google Scholar] [CrossRef]
  55. Dubos, C.; Stracke, R.; Grotewold, E.; Weisshaar, B.; Martin, C.; Lepiniec, L. MYB transcription factors in arabidopsis. Trends Plant Sci. 2010, 15, 573–581. [Google Scholar] [CrossRef] [PubMed]
  56. Zhao, Q.R.; Xiong, H.H.; Yu, H.Y.; Wang, C.; Zhang, S.F.; Hao, J.F.; Wang, J.H.; Zhang, H.G.; Zhang, L. Function of MYB8 in larch under PEG simulated drought stress. Sci. Rep. 2024, 14, 11290–11306. [Google Scholar] [CrossRef]
  57. Anusonpornpurm, S.; Lersrutaiyotin, R.; Rattanakreetakul, C.; Thamchaipenet, A.; Weerathaworn, P. Identifying QTLs for fiber content and agronomic characters in sugarcane using AFLP markers. Kasetsart J. Nat. Sci. 2008, 42, 668–675. [Google Scholar]
  58. Margarido, G.R.A.; Pastina, M.M.; Souza, A.P.; Garcia, A.A.F. Multi-trait multi-environment quantitative trait loci mapping for a sugarcane commercial cross provides insights on the inheritance of important traits. Mol. Breed. 2015, 35, 175–190. [Google Scholar] [CrossRef] [PubMed]
  59. Ming, R.; Wang, Y.; Draye, X.; Moore, P.; Irvine, J.; Paterson, A. Molecular dissection of complex traits in autopolyploids: Mapping QTLs affecting sugar yield and related traits in sugarcane. Theor. Appl. Genet. 2002, 105, 332–345. [Google Scholar] [CrossRef]
  60. Pastina, M.M.; Malosetti, M.; Gazaffi, R.; Mollinari, M.; Margarido, G.R.A.; Oliveira, K.M.; Pinto, L.R.; Souza, A.P.; van Eeuwijk, F.A.; Garcia, A.A.F. A mixed model QTL analysis for sugarcane multiple-harvest-location trial data. Theor. Appl. Genet. 2012, 124, 835–849. [Google Scholar] [CrossRef]
  61. Pinto, L.R.; Garcia, A.A.F.; Pastina, M.M.; Teixeira, L.H.M.; Bressiani, J.A.; Ulian, E.C.; Bidoia, M.A.P.; Souza, A.P. Analysis of genomic and functional RFLP derived markers associated with sucrose content, fiber and yield QTLs in a sugarcane (saccharum spp.) Commercial cross. Euphytica 2010, 172, 313–327. [Google Scholar] [CrossRef]
  62. Wenworn, W.; Lersrutaiyotin, R.; Rattanakreetakul, C.; Sreewongchai, T. Identifying quantitative trait loci for fiber content and fiber components in sugarcane using amplified fragment length polymorphism markers. Kasetsart J. Nat. Sci. 2013, 47, 416–423. [Google Scholar]
  63. Raboin, L.; Pauquet, J.; Butterfield, M.; Hont, A.D.; Glaszmann, J. Analysis of genome-wide linkage disequilibrium in the highly polyploid sugarcane. Theor. Appl. Genet. 2008, 116, 701–714. [Google Scholar] [CrossRef]
  64. Zhu, Y.J.; Lu, B.S.; Zhang, S.T.; Liu, P.D.; Li, X.F.; Lai, Z.X.; Lin, Y.L. Identification and expression patterns of the cellulose synthase gene family in dimocarpus longan lour. Chin. J. Appl. Environ. Biol. 2020, 26, 1235–1243. [Google Scholar]
  65. Li, Y.; He, Y.C.; Lin, Y.H.; Wan, T.; Li, M.; Chen, Z.Y. Bioinformatics analysis of cellulose synthase CesA gene from miscanthus lutarioriparius. Fenzi Zhiwu Yuzhong (Mol. Plant Breed.) 2021, 19, 4378–4385. [Google Scholar] [CrossRef]
  66. Zhang, X.Z.; Yang, K.T.; Bao, R.; Liu, X.L.; Qin, R.L.; Zhao, C.P. Identification and expression analysis of cellulose synthase (CesA csl) gene superfamily members in peach (prunus persica). J. Agric. Biotechnol. 2022, 30, 1096–1111. [Google Scholar]
  67. Kang, C.; Zhao, X.F.; Wang, P.; Li, Y.D.; Tian, Z.J.; Wu, Z.M. Identification and abiotic stress response analysis of CESA family genes in cucumber (cucumis sativus l.). China Veg. 2022, 29–41. [Google Scholar] [CrossRef]
  68. Chi, F.L. The Evolution of CesA/csl Superfamily and Gene Function of CesA in Saccharum; Fujian Normal University: Fuzhou, China, 2015. [Google Scholar]
  69. Hou, J.X. Function Analysis of Three Key CesAs in Sugarcane; Fujian Agriculture and Forestry University: Fuzhou, China, 2018. [Google Scholar]
  70. Huang, C.M.; Wu, K.C.; Wei, Y.W.; Deng, Z.N.; Lu, Z.; Cao, H.Q.; Luo, H.B.; Jiang, S.L.; Xu, L. Full-length cloning and expression analysis of ScCes3 in sugarcane (saccharum officinarum). J. Agric. Biotechnol. 2018, 26, 2047–2056. [Google Scholar]
  71. Wang, D.F.; Qin, Y.L.; Fang, J.J.; Yuan, S.J.; Peng, L.X.; Zhao, J.F.; Li, X.Y. A missense mutation in the zinc finger domain of OsCESA7 deleteriously affects cellulose biosynthesis and plant growth in rice. PLoS ONE 2016, 11, e0153993. [Google Scholar] [CrossRef]
  72. Zhu, F.J.; Cheng, H.H.; Guo, J.N.; Bai, S.M.; Liu, Z.A.; Huang, C.X.; Shen, J.Y.; Wang, K.; Yang, C.J.; Guan, Q.J. Vegetative cell wall protein OsGP1 regulates cell wall mediated soda saline-alkali stress in rice. PeerJ 2024, 12, e16790. [Google Scholar] [CrossRef]
  73. Zhong, R.Q.; Ye, Z.H. MYB46 and MYB83 bind to the SMRE sites and directly activate a suite of transcription factors and secondary wall biosynthetic genes. Plant Cell Physiol. 2012, 53, 368–380. [Google Scholar] [CrossRef]
  74. Zhong, R.Q.; Ye, Z.H. Transcriptional regulation of lignin biosynthesis. Plant Signal. Behav. 2009, 4, 1028–1034. [Google Scholar] [CrossRef]
  75. Huang, D.B.; Wang, S.G.; Zhang, B.C.; Shang-Guan, K.K.; Shi, Y.Y.; Zhang, D.M.; Liu, X.L.; Wu, K.; Xu, Z.P.; Fu, X.D.; et al. A gibberellin-mediated DELLA-NAC signaling cascade regulates cellulose synthesis in rice. Plant Cell 2015, 27, 1681–1696. [Google Scholar] [CrossRef]
  76. Wang, X.Y.; Zhu, C.L.; Yang, K.B.; Li, G.Z.; Li, Z.; Yuan, T.T.; Gao, Z.M. Identification and expression regulation of CesA genes in moso bamboo. J. Nucl. Agric. 2022, 36, 706–715. [Google Scholar]
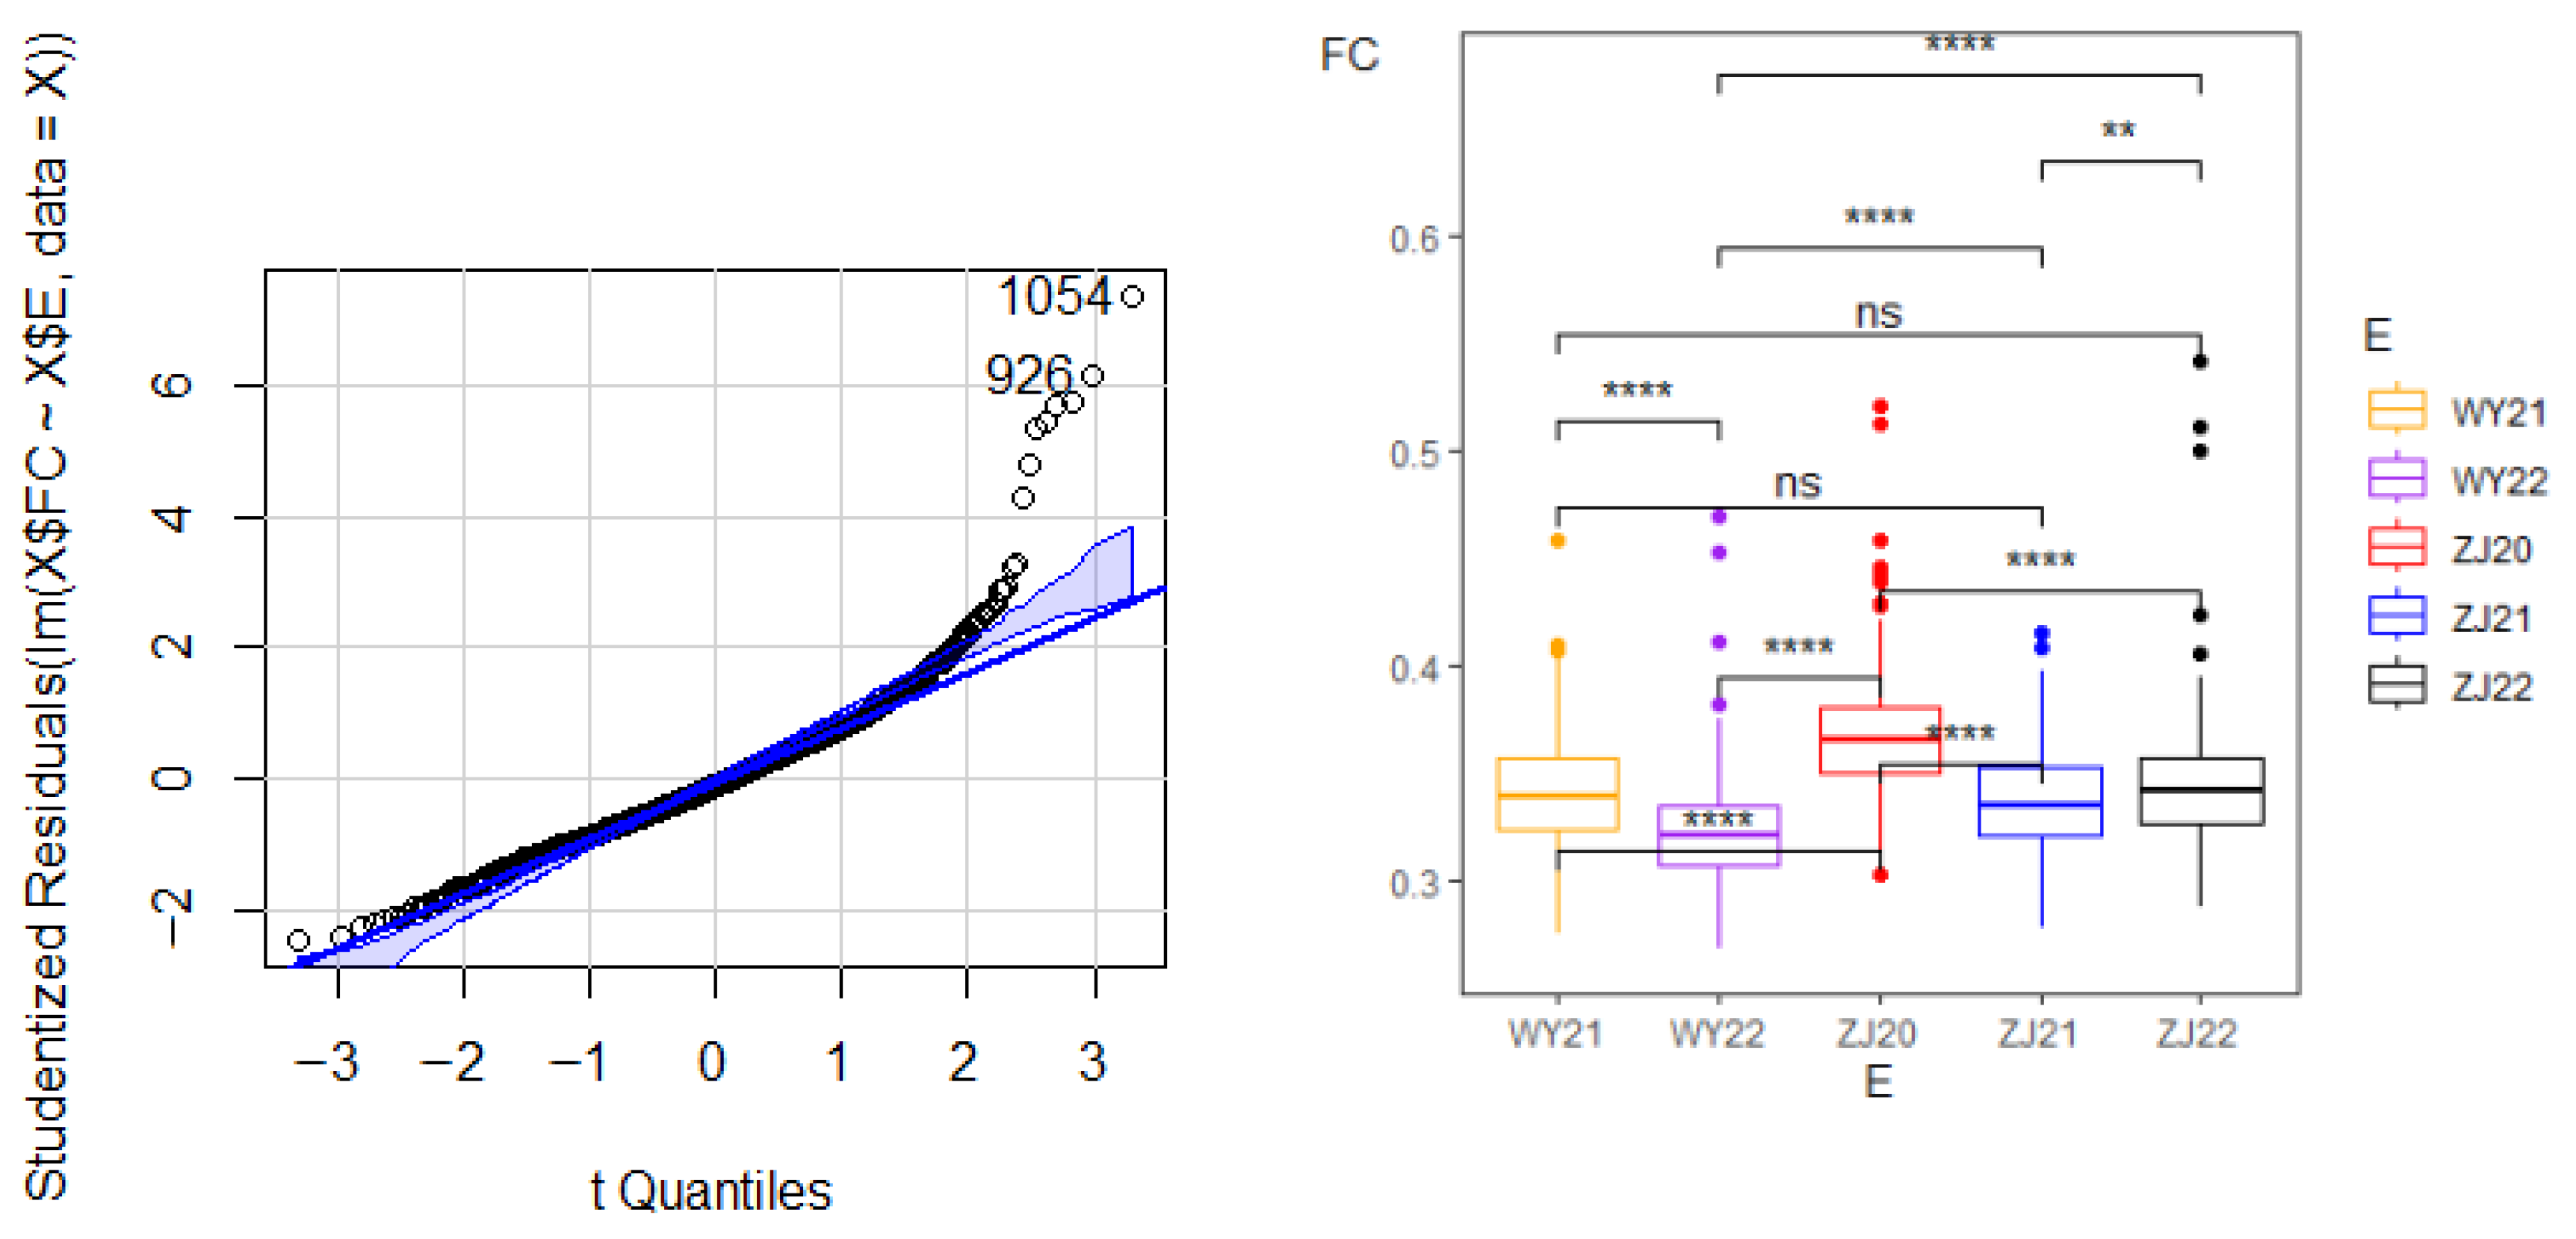
Figure 1. Quantile–quantile (Q-Q) plot of normality test for fiber content data (left) and boxplot showing the distribution of sugarcane fiber content across environments with pairwise comparisons (right). WY21, fiber content measured at the Wengyuan base in 2021; WY22, fiber content measured at the Wengyuan base in 2022; ZJ20, fiber content measured at the Zhanjiang base in 2020; ZJ21, fiber content measured at the Zhanjiang base in 2021; ZJ22, fiber content measured at the Zhanjiang base in 2022. ** p < 0.01, **** p < 0.0001; ns, no significance (Wilcoxon rank-sum tests).
Agronomy 15 02249 g001
Figure 2. Density distribution of sugarcane fiber content for 219 clones across five different environments. WY21, fiber content measured at the Wengyuan base in 2021; WY22, fiber content measured at the Wengyuan base in 2022; ZJ20, fiber content measured at the Zhanjiang base in 2020; ZJ21, fiber content measured at the Zhanjiang base in 2021; ZJ22, fiber content measured at the Zhanjiang base in 2022. The green lines all represented the smooth distribution of fiber content in the corresponding environment, which followed either a continuous normal or skewed pattern.
Agronomy 15 02249 g002
Figure 3. Visualization of Pearson correlation results for sugarcane fiber content between pairs of environments. WY21, fiber content measured at the Wengyuan base in 2021; WY22, fiber content measured at the Wengyuan base in 2022; ZJ20, fiber content measured at the Zhanjiang base in 2020; ZJ21, fiber content measured at the Zhanjiang base in 2021; ZJ22, fiber content measured at the Zhanjiang base in 2022.
Agronomy 15 02249 g003
Figure 4. Manhattan and quantile–quantile (Q-Q) plots from the GWAS analysis of sugarcane fiber content across five environments. (A) Manhattan plot for fiber content in ZJ20; (a) corresponding Q-Q plot; (B) Manhattan plot for fiber content in WY21; (b) corresponding Q-Q plot; (C) Manhattan plot for fiber content in ZJ21; (c) corresponding Q-Q plot; (D) Manhattan plot for fiber content in WY22; (d) corresponding Q-Q plot; (E) Manhattan plot for fiber content in ZJ22; (e) corresponding Q-Q plot. WY21, fiber content measured at the Wengyuan base in 2021; WY22, fiber content measured at the Wengyuan base in 2022; ZJ20, fiber content measured at the Zhanjiang base in 2020; ZJ21, fiber content measured at the Zhanjiang base in 2021; ZJ22, fiber content measured at the Zhanjiang base in 2022. Each color represented SNPs located on different chromosomes of sugarcane. The dashed lines all represented the significance threshold of p = 1.5 × 10⁻⁶. The dots above the dashed line corresponded to SNPs that were significantly associated with fiber content in each environment.
Agronomy 15 02249 g004
Table 1. Descriptive statistics of sugarcane fiber content for 219 clones across different environments.
Environment 1Min 2
(%)
Max 3
(%)
Mean
(%)
SD 4
(%)
CV 5
(%)
Skew 6Kurt 7
ZJ209.1627.0913.602.2916.812.229.61
WY217.5220.9411.691.8115.481.133.16
ZJ217.6917.2411.341.6414.420.670.71
WY227.1522.010.501.8017.112.4212.04
ZJ228.2429.26 12.002.4620.553.4418.89
1 WY21, fiber content measured at the Wengyuan base in 2021; WY22, fiber content measured at the Wengyuan base in 2022; ZJ20, fiber content measured at the Zhanjiang base in 2020; ZJ21, fiber content measured at the Zhanjiang base in 2021; ZJ22, fiber content measured at the Zhanjiang base in 2022; 2 Min, minimum; 3 Max, maximum; 4 SD, standard deviation; 5 CV, coefficient of variation; 6 Skew, skewness; 7 Kurt, kurtosis. The list of values for each clone is shown in Table S1.
Disclaimer/Publisher’s Note: The statements, opinions and data contained in all publications are solely those of the individual author(s) and contributor(s) and not of MDPI and/or the editor(s). MDPI and/or the editor(s) disclaim responsibility for any injury to people or property resulting from any ideas, methods, instructions or products referred to in the content.