Article

Strategic Selenium Application Methods and Timing Enhance Grain Yield, Minimize Cadmium Bioaccumulation, and Optimize Selenium Fortification in Triticum aestivum L.

School of Agriculture, Henan Institute of Science and Technology, Xinxiang 453003, China
*
Author to whom correspondence should be addressed.
Agronomy 2025, 15(1), 199; https://doi.org/10.3390/agronomy15010199
Submission received: 29 November 2024 / Revised: 3 January 2025 / Accepted: 14 January 2025 / Published: 15 January 2025
(This article belongs to the Section Plant-Crop Biology and Biochemistry)

Abstract

:
Based on previous research, we hypothesized that an SeVI and SeMet combined application at different growth stages could increase the yield and Se concentration and decrease Cd concentration in wheat grains. To verify this hypothesis, we designed a pot experiment throughout the wheat growth period and investigated the effects of SeIV, SeVI, and SeMet applied individually or in combination at different growth stages on yield traits; Cd absorption and transport; and Se content under Cd stress. The results indicated that grain yield was the highest under the SeVI individual application treatment and the SeVI (at the seedling, jointing, and heading stages) and SeMet (at the filling stage) combined application treatment (3 + 1 treatment), showing a more than 42% increase compared with the Cd-only control treatment (CK). Under the 5 mg/kg Cd stress, the grain Cd content in the 3 + 1 treatment was 34.1% lower than that in CK and over 14.1% lower than those in Se individual treatments. Furthermore, grain Se content was the highest under the 3 + 1 treatment, being 160.8%, 99.7%, and 39.5% higher than those in the SeIV, SeVI, and SeMet individual treatments under 5 mg/kg Cd stress. This may be attributed to early SeVI application in the 3 + 1 treatment, which enhanced yield traits and effectively promoted the retention of Cd in the middle and lower organs, reducing its transport to the grains. Furthermore, the SeMet application enhanced Se translocation to the grains, further reducing Cd content and increasing the Se concentration. In conclusion, the combined application of SeVI (at the seedling, jointing, and heading stages) and SeMet (at the filling stage) helped achieve the desired outcomes of high grain yield, low Cd content, and Se enrichment under Cd stress.

1. Introduction

Cadmium (Cd) is a highly hazardous heavy metal that accumulates in the soil mainly through the use of phosphate fertilizers, fungicides, insecticides, and sewage discharge. Cd pollution is widespread in the world, and the pollution in developing countries is more serious than that in developed countries [1,2]. Cd contamination in the soil negatively affects both crop yield and quality [3,4]. Moreover, Cd can enter the human body through the food chain, posing substantial health risks [5]. In Asia, wheat (Triticum aestivum) has a higher Cd content than rice (Oryza sativa) and corn (Zea mays), making wheat consumption one of the primary sources of human Cd intake globally [6,7]. Thus, reducing Cd toxicity and its accumulation in wheat grains is crucial for ensuring both food security and public health [8].
Various agronomic measures have been explored to reduce heavy metal toxicity in crops and limit their accumulation in grains. These measures include managing irrigation, applying fertilizers and soil amendments, planting remediating crops, and selecting crop varieties [9]. However, soil amendments can result in permanent and irreversible changes in soil chemistry. For example, liming application can reduce soil porosity, enzyme activity, organic matter content, and soil microbial abundance [10]. The low efficiency of phytoremediation makes it unsuitable for large-scale application in moderately or lightly polluted farmland [11]. Currently, practical techniques for breeding low-Cd wheat varieties remain limited [12] Thus, increasing attention has been directed toward the use of environmentally friendly materials to manage Cd pollution in agricultural soils. These materials include nutrient elements, such as silicon (Si), selenium (Se), and zinc (Zn) [13,14], and plant hormones, such as brassinolide and jasmonic acid [15,16]. These materials can reduce the Cd absorption, accumulation, and toxicity by improving the antioxidant enzyme activities, improving the plasma membrane stability, enhancing Cd binding to cell wall and chelating substances, and regulating the expression of transporter genes, among which Se has a more economical and efficient control effect [14,17]. Se effectively reduces Cd toxicity and accumulation in crops while also enhancing the Se content in grains to meet human nutritional needs. Moreover, an antagonistic relationship exists between Se and Cd in the human body [18], further supporting the use of Se in mitigating Cd-related health risks.
Se is a beneficial element for plants and helps alleviate various abiotic stresses, including heavy metal toxicity [14]. In wheat, Se enhances tolerance to heavy metals by improving the absorption and use of nutrients such as nitrogen and calcium [19]. In addition, Se inhibits Cd absorption and transport by regulating root morphology and microstructure, promoting endodermal and extracellular barrier development, increasing pectin and hemicellulose 2 contents in cell walls, and regulating Cd transporter gene expression [3,8,20]. Se reduces Cd toxicity by increasing the sequestration of Cd in vacuoles through the regulation of thiol compound synthesis, as observed in Amaranthus hypochondriacus [21]. In both rice [3] and wheat [8], Se application can reduce Cd content in grains and increase crop yield. Se has a dose effect in alleviating Cd toxicity in plants. In rape, 0.1 μM and 1 μM SeIV treatments reduced Cd absorption, but 10 μM SeIV treatment increased Cd toxicity and accumulation [22]. The degree of soil Cd pollution affects the mitigation effect of seleniu; for example, Se application can increase Cd accumulation in rice [23], wheat [24], and Brassica chinensis [25] under a high Cd pollution condition. The chemical form of Se also affects Se accumulation and Cd toxicity mitigation in plants. Compared with SeVI, SeIV can more effectively reduce Cd accumulation in rice [26] and convert it into organic Se [27]. Compared with soil application, leaf spraying Se could better improve grain yield, increase Se content, and reduce Cd content in rice [28]. Therefore, the effectiveness of Se in mitigating Cd toxicity depends on various factors, such as Se and Cd treatment doses, Se chemical forms, and application methods [29]. Foliar spraying is an effective strategy to reduce heavy metal contamination in farmland and promote Se accumulation in grains [30].
Numerous studies have explored the role of Se in alleviating Cd toxicity in crops [3,20,31]. However, considering the characteristics of different forms of Se on alleviating Cd toxicity in wheat, research on the combined application of different chemical forms of Se is limited. Our previous studies have demonstrated that SeVI has high mobility, allowing it to move more effectively from leaves to the stems and roots in wheat. This mobility helps alleviate Cd toxicity in wheat, promotes the formation of effective tillers in the early growth stage, and increases yield. However, the ability of SeVI to reduce grain Cd content was weak. By contrast, selenomethionine (SeMet) has a fast assimilation rate and can better reduce Cd transport to the grains by promoting its retention in the upper plant organs (the important source of Cd in grains [8,32]), thus SeMet treatment resulted in the lowest Cd content and highest Se content in wheat grains. However, SeMet’s poor mobility has a weak ability to alleviate Cd toxicity in the lower organs and cannot improve the yield effectively [8]. The SeVI and SeMet on alleviating Cd toxicity in wheat have a complementary effect. Based on these findings, we speculate that applying SeVI during the early growth stages (key periods for yield formation, such as the seedling, jointing, and heading stages) and SeMet during the later growth stages (key periods for Cd and Se accumulation in grains, such as the filling stage) would lead to a low Cd content, high yield, and enhanced Se biofortification in wheat grains under Cd stress. To test this hypothesis, we implemented treatments involving separate applications of SeIV, SeVI, and SeMet as well as a combined SeVI and SeMet application at different wheat growth stages. We analyzed the effects on yield traits, Cd absorption and transport characteristics, subcellular distribution, chemical forms, transporter gene expression levels, and root and grain Se contents, as well as the correlations between these variables under each treatment. The results of the present study provide valuable insights into the mechanisms through which Se alleviates Cd toxicity and reduces Cd accumulation in grains, offering new approaches for controlling heavy metal pollution in farmland and enhancing Se levels in wheat.

2. Materials and Methods

2.1. Materials and Experimental Design

The soil used in the pot experiment was collected from the topsoil layer (0–20 cm) of an experimental field at Northwest A&F University (Latitude 34.25° N and Longitude 108.08° E, meteorological conditions: average annual temperature of 12.9 °C, sunshine duration of 2164 h, annual precipitation of 635.1–663.9 mm). After collection, the soil was air-dried and sieved through a 2 mm sieve. The soil’s physical and chemical properties were as follows: pH, 7.4; available nitrogen, 105.3 mg·kg−1; available phosphorus, 37.6 mg·kg−1; available potassium, 96.7 mg·kg−1; and Cd, 0.11 mg·kg−1. The soil Cd stress levels were set at 0, 5, 50, and 100 mg·kg−1 (with Cd added in the form of CdCl2·2.5 H2O) [8]. Each pot (21 cm in height and 33 cm in diameter) was filled with 8 kg of air-dried soil and then watered to age for 1 month. Seeds of the wheat variety “Luomai23” were sown on 10 October 2021. Four wheat plants were left in each pot after seedling thinning. The plants were grown in a greenhouse where temperature and light conditions were set to mimic the natural environment of the area. Our previous study indicated that SeVI improves wheat yield under Cd stress by enhancing effective tillering and exerts an intermediate effect and that SeMet effectively reduces the Cd content in grains [8]. Thus, we used SeVI and SeMet in combination in this study. The Se spraying concentration was 0.2 mM, which was obtained from the previous experiments: spraying SeIV and SeVI with a 0.2 mM concentration significantly increased grain yield, decreased grain Cd content, and obtained the appropriate grain Se content in wheat under Cd stress [8]. The original solution of SeIV (Na2SeO3), SeVI (Na2SeO4) and SeMet (selenomethionine) was prepared at a concentration of 10 mM, and then diluted to an application concentration of 0.2 mM respectively for spraying. At different growth stages, namely the seedling stage (SS), jointing stage (JS), heading stage (HS), and filling stage (FS), SeIV, SeVI, and SeMet were sprayed either individually or in combination (Table 1). SeVI was applied early to improve yield traits, whereas SeMet was applied later to reduce Cd accumulation in grains. A total of 28 treatments (4 Cd levels × 7 Se treatments) were established, with three replicates for each treatment (two pots per replicate). Mimicking field application, Se were sprayed from above the wheat plant, evenly to make the upper leaves wet without dripping. The plants were cultured until maturity.

2.2. Determination of Cd Subcellular Distribution and Chemical Forms in Leaves

Flag leaves from each treatment were collected 15 days after the last Se application. Subcellular Cd distribution within the leaves was determined using the method described by Yang et al. [21]. The cells were separated into three fractions: cell wall fraction (Fcw), soluble fraction (Fs), and organellar fraction (Fco). Cd chemical forms were analyzed using the method described by Zhu et al. [33]. Six chemical forms of Cd were extracted using the following specific solutions in the following order: (FI) 80% ethanol to extract inorganic Cd, including nitrate/nitrite, chlorine, and aminophenol forms of Cd; (FII) deionized water to extract water-soluble organic acid complexes of Cd and Cd(H2PO4)2; (FIII) 1 M NaCl solution to extract pectin- and protein-integrated Cd; (FIV) 2% acetic acid for extraction of insoluble Cd phosphate, including CdHPO4 and Cd3(PO4)2; (FV) 0.6 M HCl for extraction of oxalate forms of Cd; (FVI) residue. The extracted solutions were digested using a graphite digestion apparatus (Hanon SH220F; Hanon, Jinan, China) with a mixture of nitric acid (HNO3) and hydrogen peroxide (H2O2) (3:1, v:v). Then, Cd concentrations in each fraction and form were determined using an ICP-MS (ELAN DRC-e; Thermo Fisher Scientific, Waltham, MA, USA).

2.3. Determination of Cd Transporter Gene Expression Levels

The expression levels of Cd transporter genes were measured from the flag leaves collected 15 days after the final Se treatment. The target genes that had Cd transport function included the Cd influx transporter gene (TaNarmp5 and TaIRT1), the Cd vacuolar sequestration transporter gene (TaHMA3 and TaVP1), the Cd efflux transporter gene (TaTM20), and the gene loading Cd into xylem (TaHMA2) [34]. TraesCS6B02G243700 (corresponding to Actin) was used as the control gene. Gene expression was analyzed using methods described by Liu et al. [34]. QuantStudio™ RealTime PCR was used to perform qRT-PCR. The 2(−ΔΔCt) analysis method was used to determine the relative expression levels of genes. The primer sequences used for the assays are listed in Table S1.

2.4. Determination of Phenotypic and Yield-Related Traits

At maturity, plant height (PH), flag leaf area (LA), spike number per plant (SNP), and grain number per spike (GNS) were measured. After harvest, the plants under each treatment were decomposed into various parts: grains, glumes, upper leaves (flag leaves), upper stems (top first stem), middle leaves (second and third leaves from the top), middle stems (second and third stems from the top), lower leaves (remaining leaves), lower stems (remaining stems), and roots. In addition, the yield per plant (YP) and 1000-grain weight (GW) were determined after harvest.

2.5. Determination of Cd Content, Se Content, and Cd Translocation Factor

The grains, glumes, upper leaves, upper stems, middle leaves, middle stems, lower leaves, lower stems, and cleaned roots were dried and ground. Then, these samples were digested and the Cd and Se contents were determined following the method described in Section 2.2. The Cd translocation factor (TF) between different wheat organs (from organ A to organ B) was calculated using the following formula:
TF = C d   c o n c e n t r a t i o n i n   o r g a n B ( m g / k g ) C d   c o n c e n t r a t i o n i n   o r g a n A ( m g / k g )

2.6. Statistical Analysis

Statistical analysis was performed using SPSS 20.0 (IBM Corp., Armonk, NY, USA). One-way analysis of variance (ANOVA) and Duncan’s multiple range tests were conducted to assess significant effects and differences among the treatments, respectively, with the significance threshold set at p < 0.05. Two-way ANOVA was used to determine the significant effects of Cd treatment (Cd), Se treatment (Se), and their interaction (Cd × Se) on the data, with the significance levels set at p < 0.05 and p < 0.01. Graphs were created using Microsoft Office Excel 2019 (Microsoft Corp., Redmond, WA, USA) or OriginPro 2022 (OriginLab, Northampton, MA, USA) and combined using Power Point 2019 (Microsoft Corp.).

3. Results

3.1. Agronomic Traits

SNP, GW, and YP decreased significantly with the increase in Cd concentrations. Compared with the control, Cd stress at 5, 50, and 100 mg/kg concentrations reduced SNP by 11.1%, 22.2%, and 36.1%, respectively; GW by 6.7%, 14.5% and 24.1%, respectively; and YP by 16.1%, 37.5% and 53.6%, respectively (Table 2). Compared with Cd treatment alone, the SeVI, 3 + 1, and 2 + 2 treatments significantly increased SNP by 28.1%, 31.3%, and 37.5%, respectively, under 5 mg/kg Cd stress. Similarly, all Se treatments significantly increased the YP under 5 mg/kg Cd stress, with SeIV, SeVI, 3 + 1, 2 + 2, 1 + 3, and SeMet treatments resulting in significant increases in the YP by 29.8%, 46.8%, 42.6%, 38.3%, 23.4%, and 25.5%, respectively, compared with the Cd treatment alone. Moreover, Se treatments (except SeIV) significantly increased the YP under the 50 mg/kg Cd concentration, and SeVI, 3 + 1 and 1 + 3 treatments significantly increased the YP under the 100 mg/kg Cd concentration. Overall, SeVI and 3 + 1 treatments increased the YP by more than 42% under the 5 mg/kg Cd concentration and by more than 25% under the 50 and 100 mg/kg Cd concentrations, which underscore the effectiveness of these treatments in improving YP under Cd stress. The results of two-way ANOVA revealed that Cd, Se, and their interactions significantly affected LA, SNP, GNS, GW, and YP (Table 2). In addition, the correlation analysis indicated that YP was significantly positively correlated with these agronomic traits and exhibited the strongest correlation (0.92) with SNP (Figure 1).

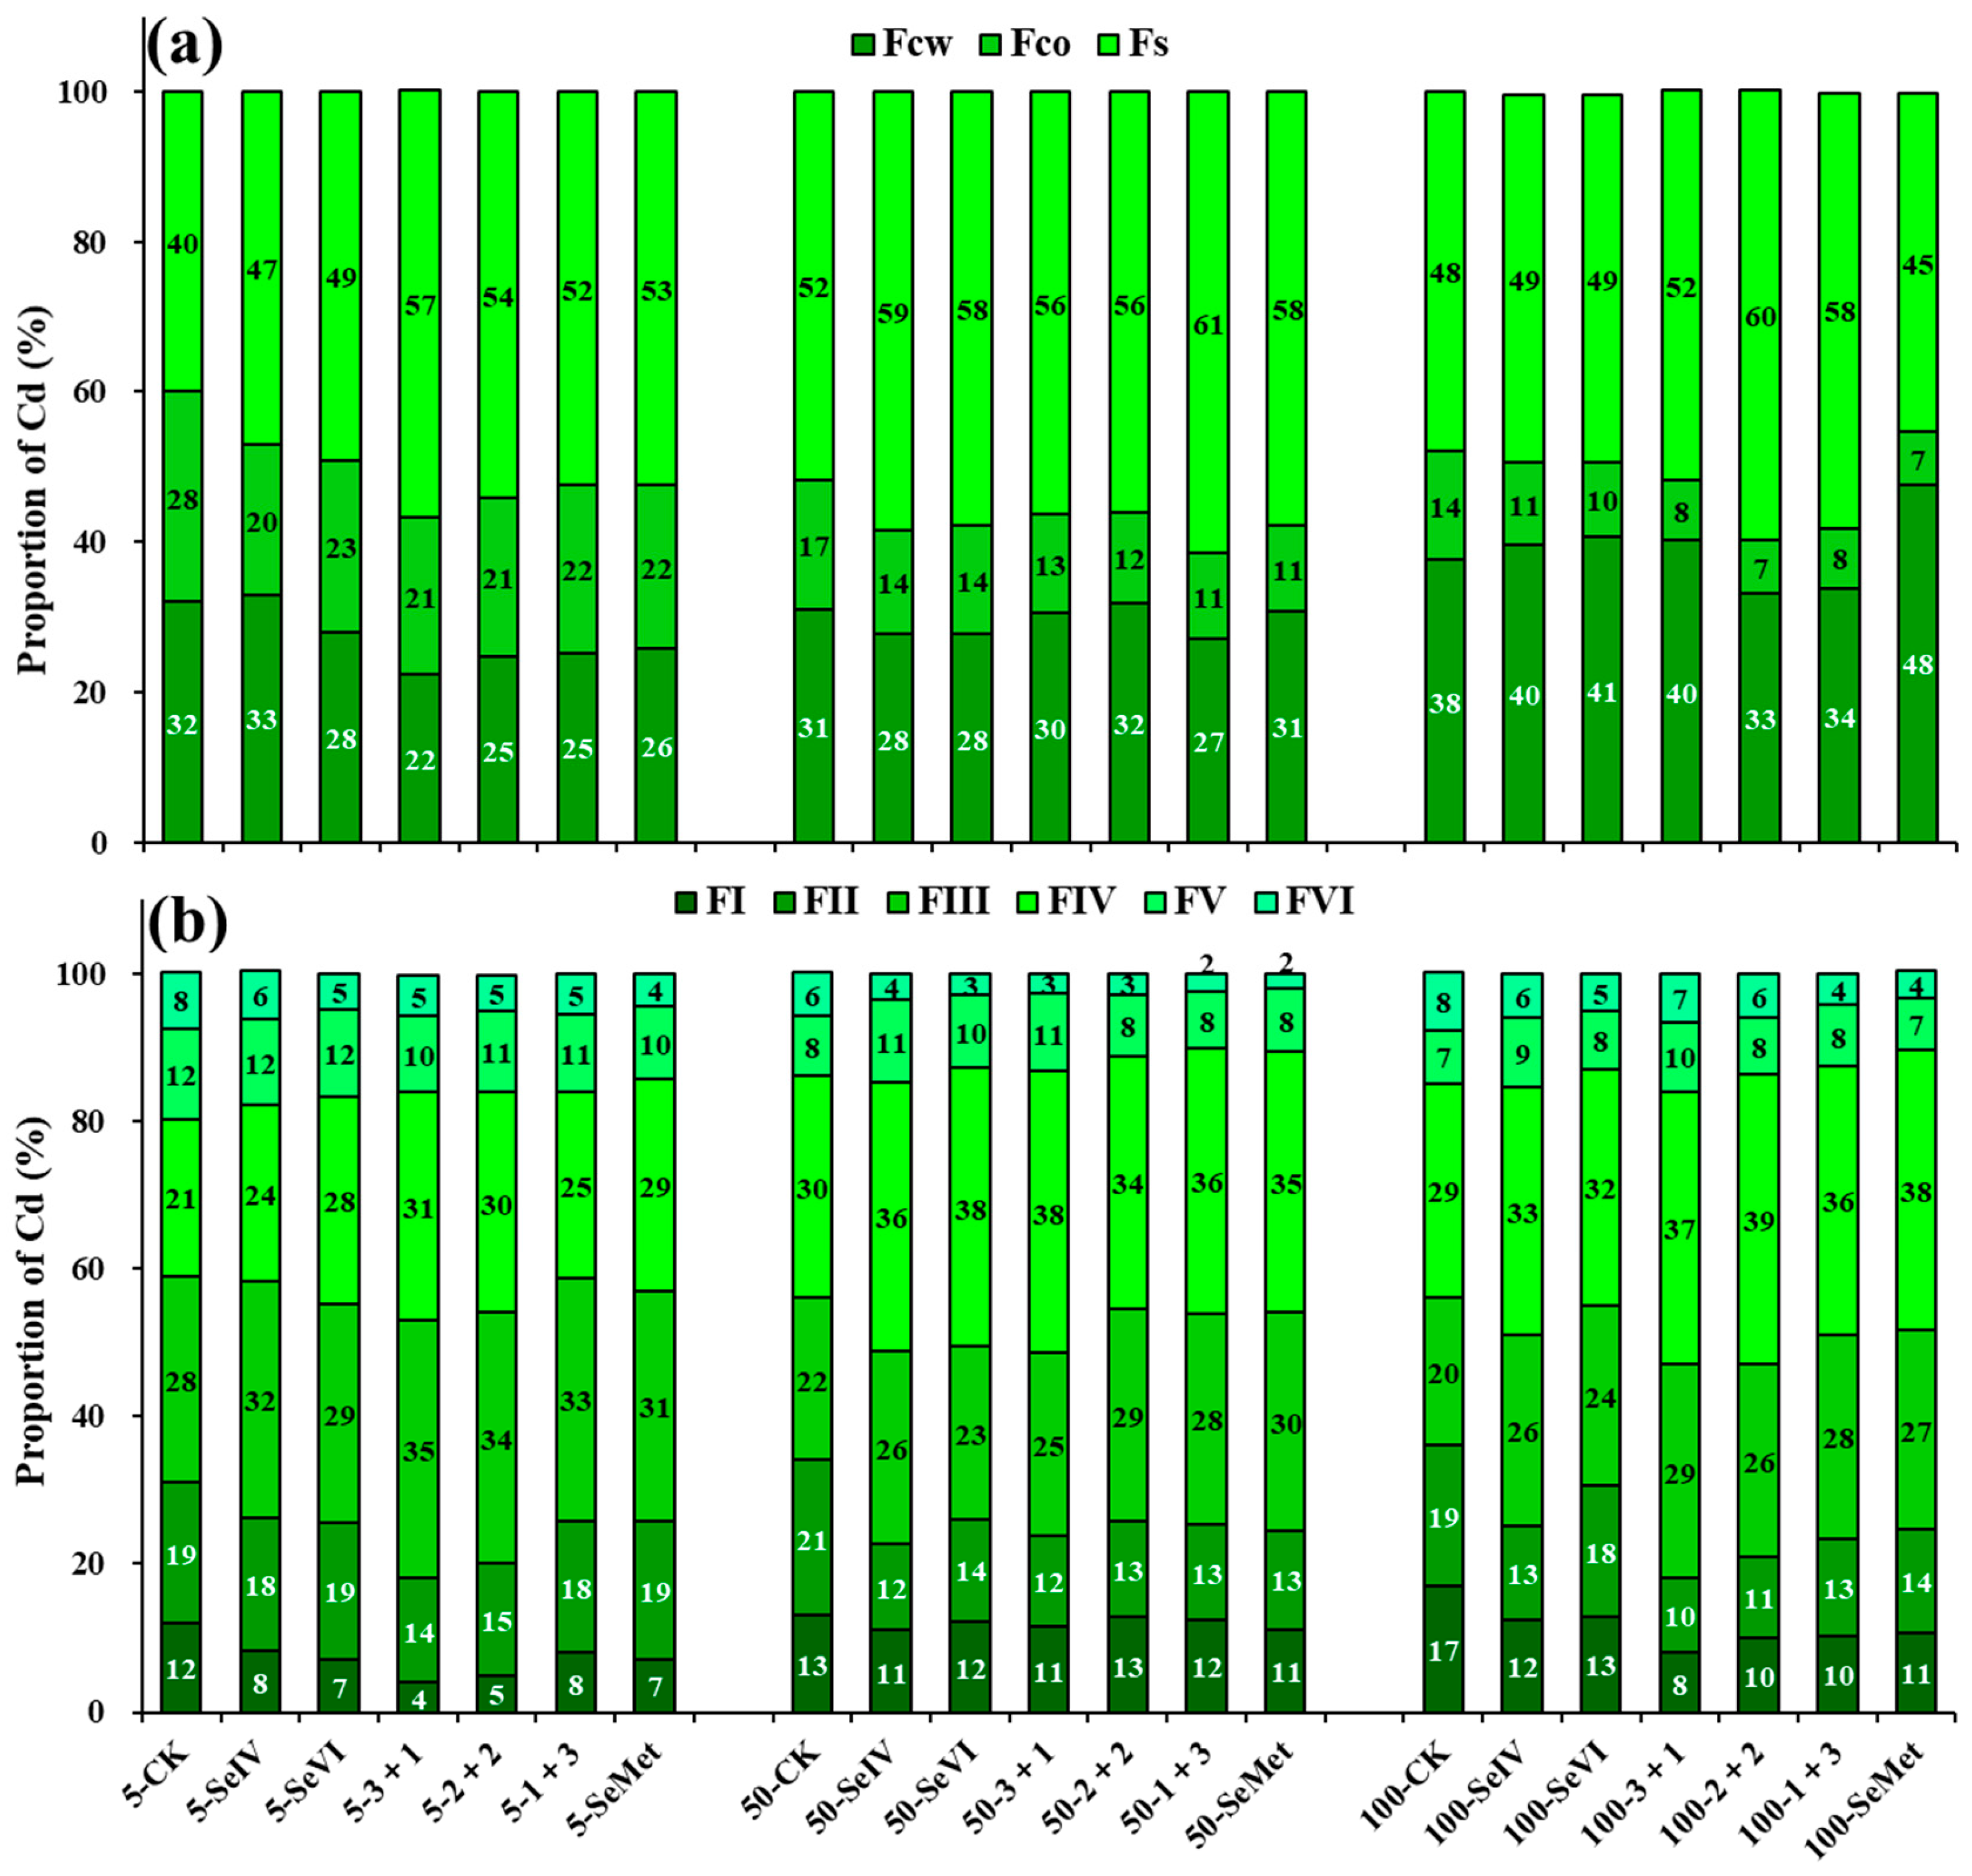
3.2. Se Treatment at Different Stages Increased the Proportion of Cd in Insoluble and Bound Forms Under Cd Stress

The distribution of Cd in wheat leaf subcellular components followed the order: Fs > Fcw > Fco. With the increasing Cd stress levels, the Cd proportion increased in Fs and Fcw but decreased in Fco (Figure 2a). Se treatments reduced the Cd proportion in Fco compared with Cd treatment alone. Moreover, SeMet treatment reduced the Cd proportion in Fco by 21.4–50.0% compared with the Cd treatment alone. Under the same Cd stress conditions, the Cd proportion in Fs was higher following SeMet treatment than following individual SeIV or SeVI treatment. Cd in the leaves existed mainly in the FII, FIII, and FIV forms (Figure 2b). Se treatment increased the proportion of Cd present in FIII and FIV forms but reduced the proportion of its active forms FI and FII. Under the 5 mg/kg Cd concentration, Se treatment reduced the proportion of Cd in FI form by more than one-third compared with Cd treatment alone. Se treatments, particularly those with SeMet, increased the proportion of Cd in FIII form. Under both the 5 and 100 mg/kg Cd concentrations, the proportion of Cd in the FIV form increased the most in the 3 + 1 (47.6% and 27.6%, respectively) and 2 + 2 (42.9% and 34.5%, respectively) treatments.

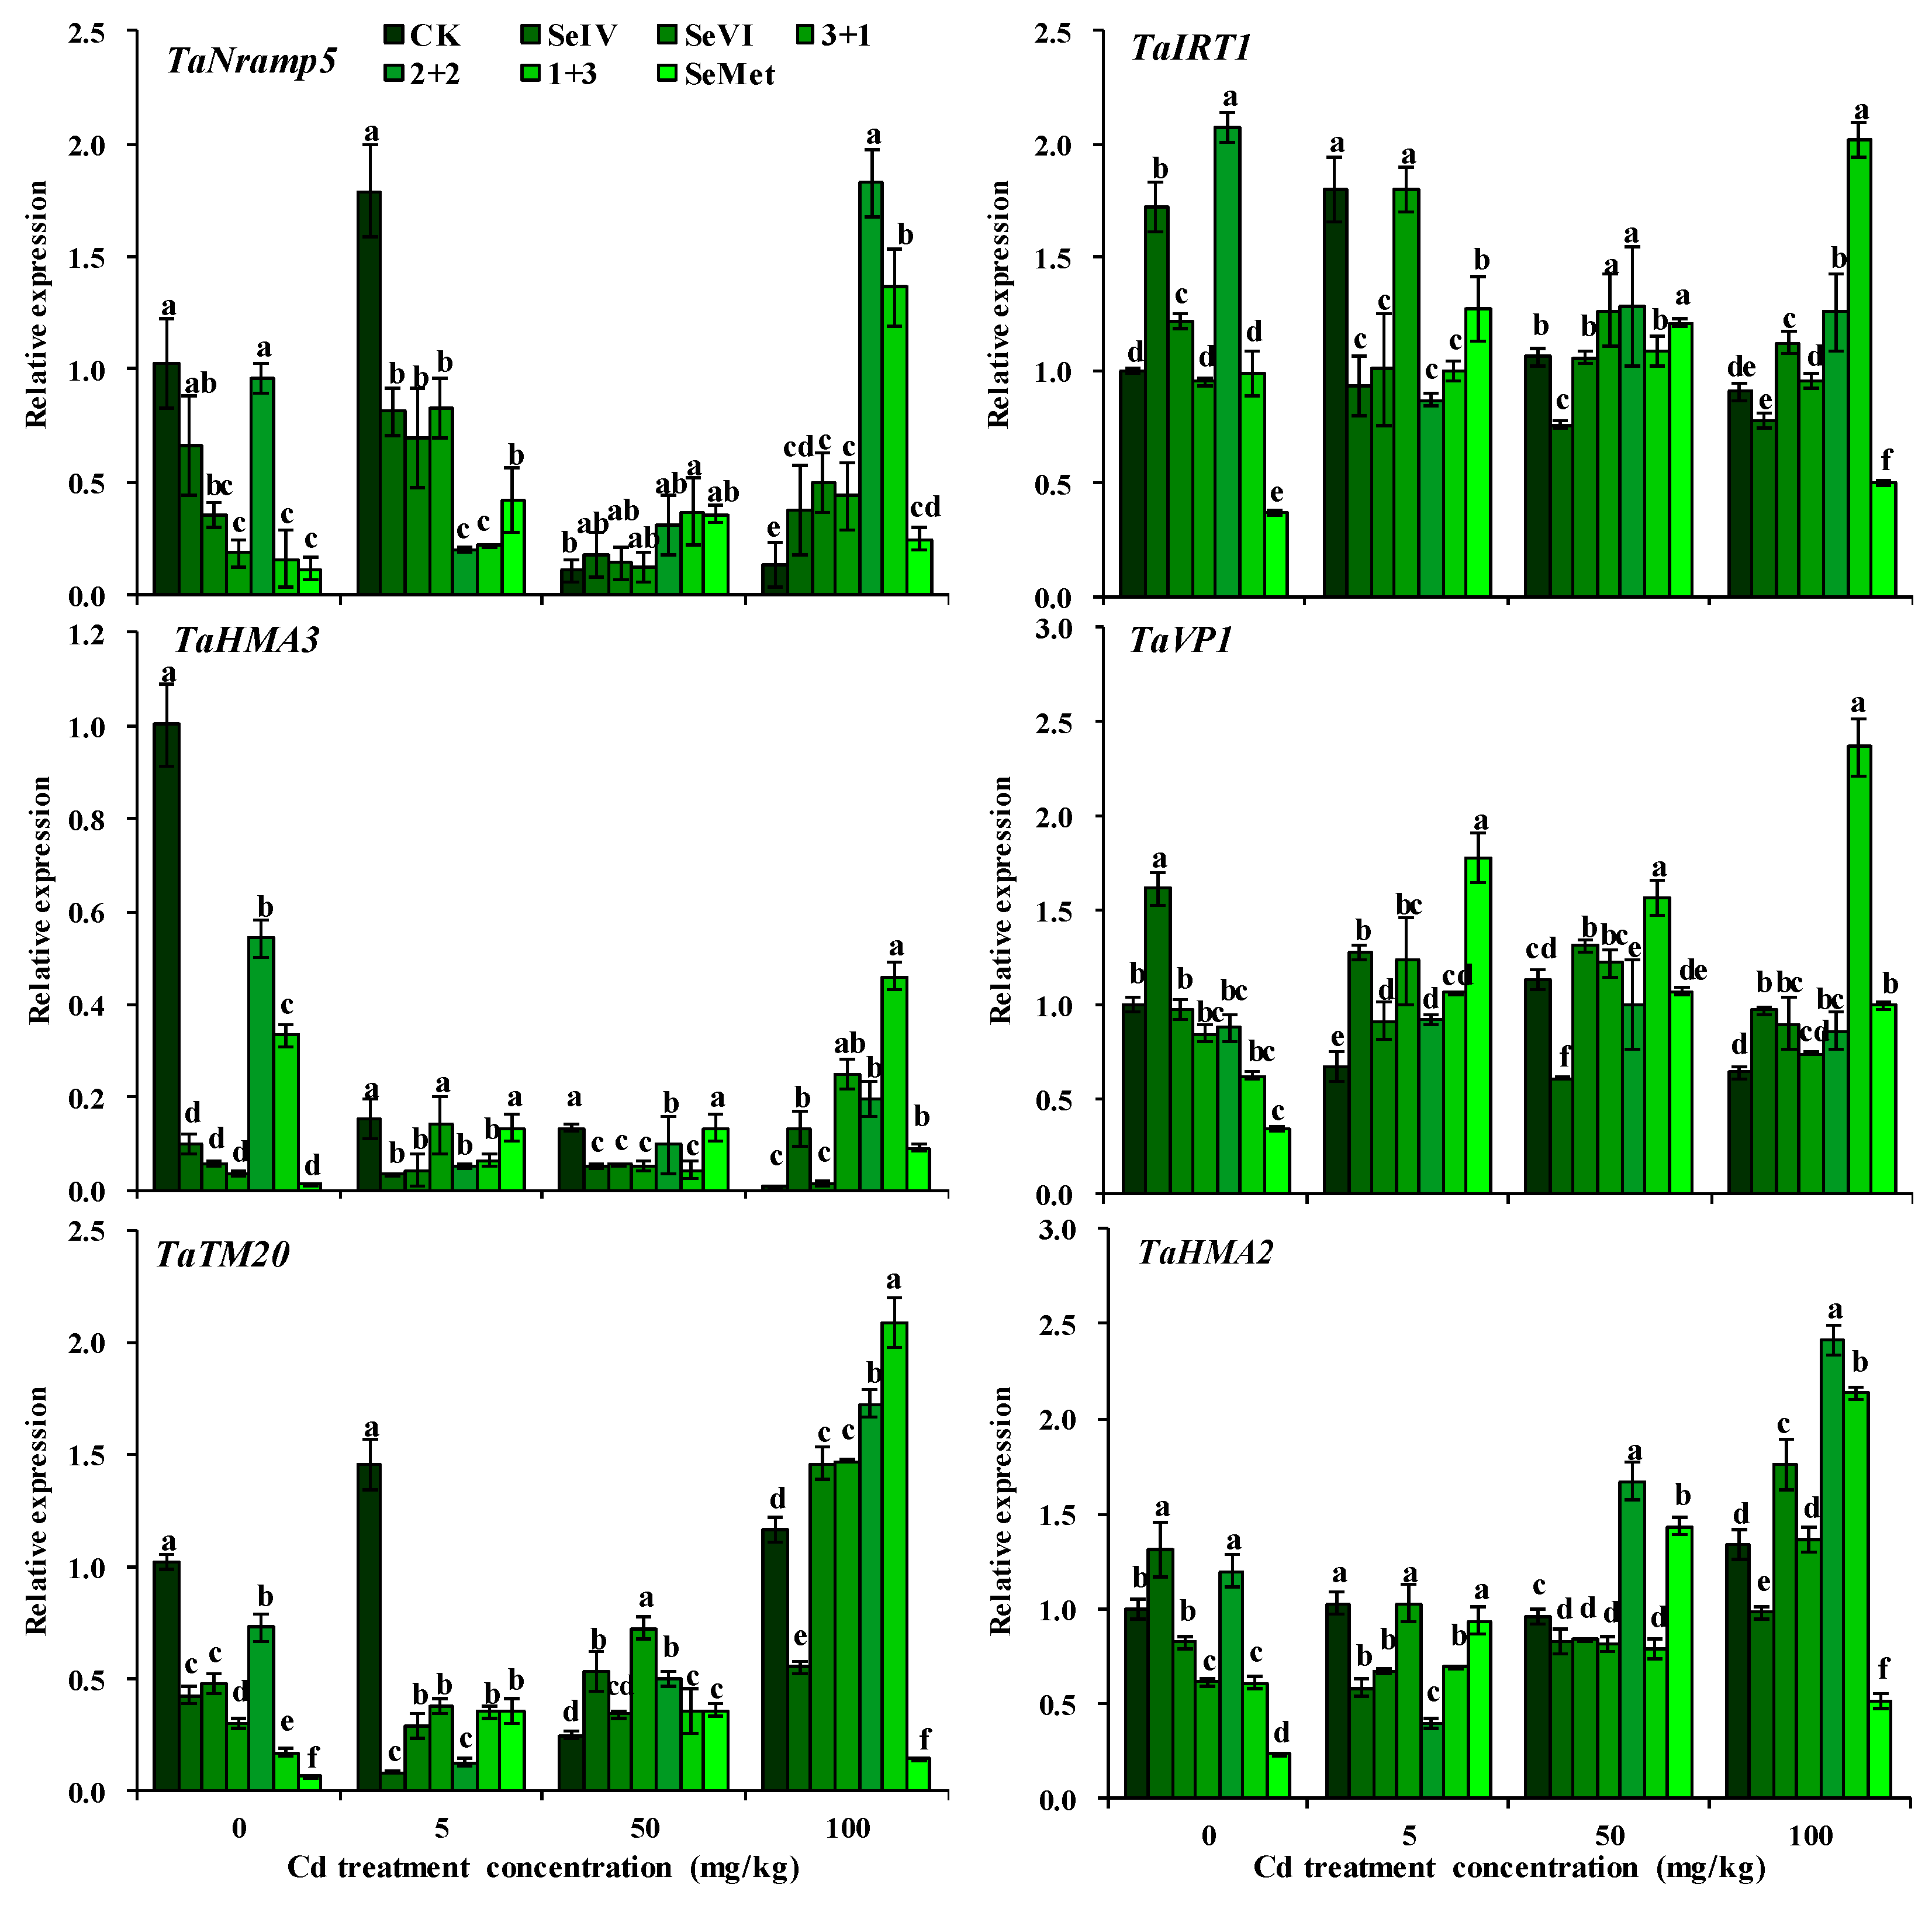
3.3. Expression Level of Cd Transporter Genes

Compared with Cd treatment alone, Se treatment significantly downregulated the expression of TaNramp5 and TaIRT1, reducing Cd influx under the 5 mg/kg Cd concentration and significantly upregulated its expression under the 100 mg/kg Cd concentration. Cd stress suppressed the expression of TaHMA3 in a dose-dependent manner; however, Se treatment significantly alleviated this inhibition, and the expression level of TaHMA3 was higher after SeMet treatment than after individual SeIV or SeVI treatment. Furthermore, Se treatment significantly increased the expression level of TaVP1, enhancing Cd transportation into vacuolar under Cd stress. Se treatments, especially 3 + 1, 2 + 2, and 1 + 3, significantly increased the expression level of TaTM20, thus promoted the Cd efflux. The expression pattern of TaHMA2 (the transporter gene loading Cd into xylem) was consistent with that of TaTM20 (Figure 3).

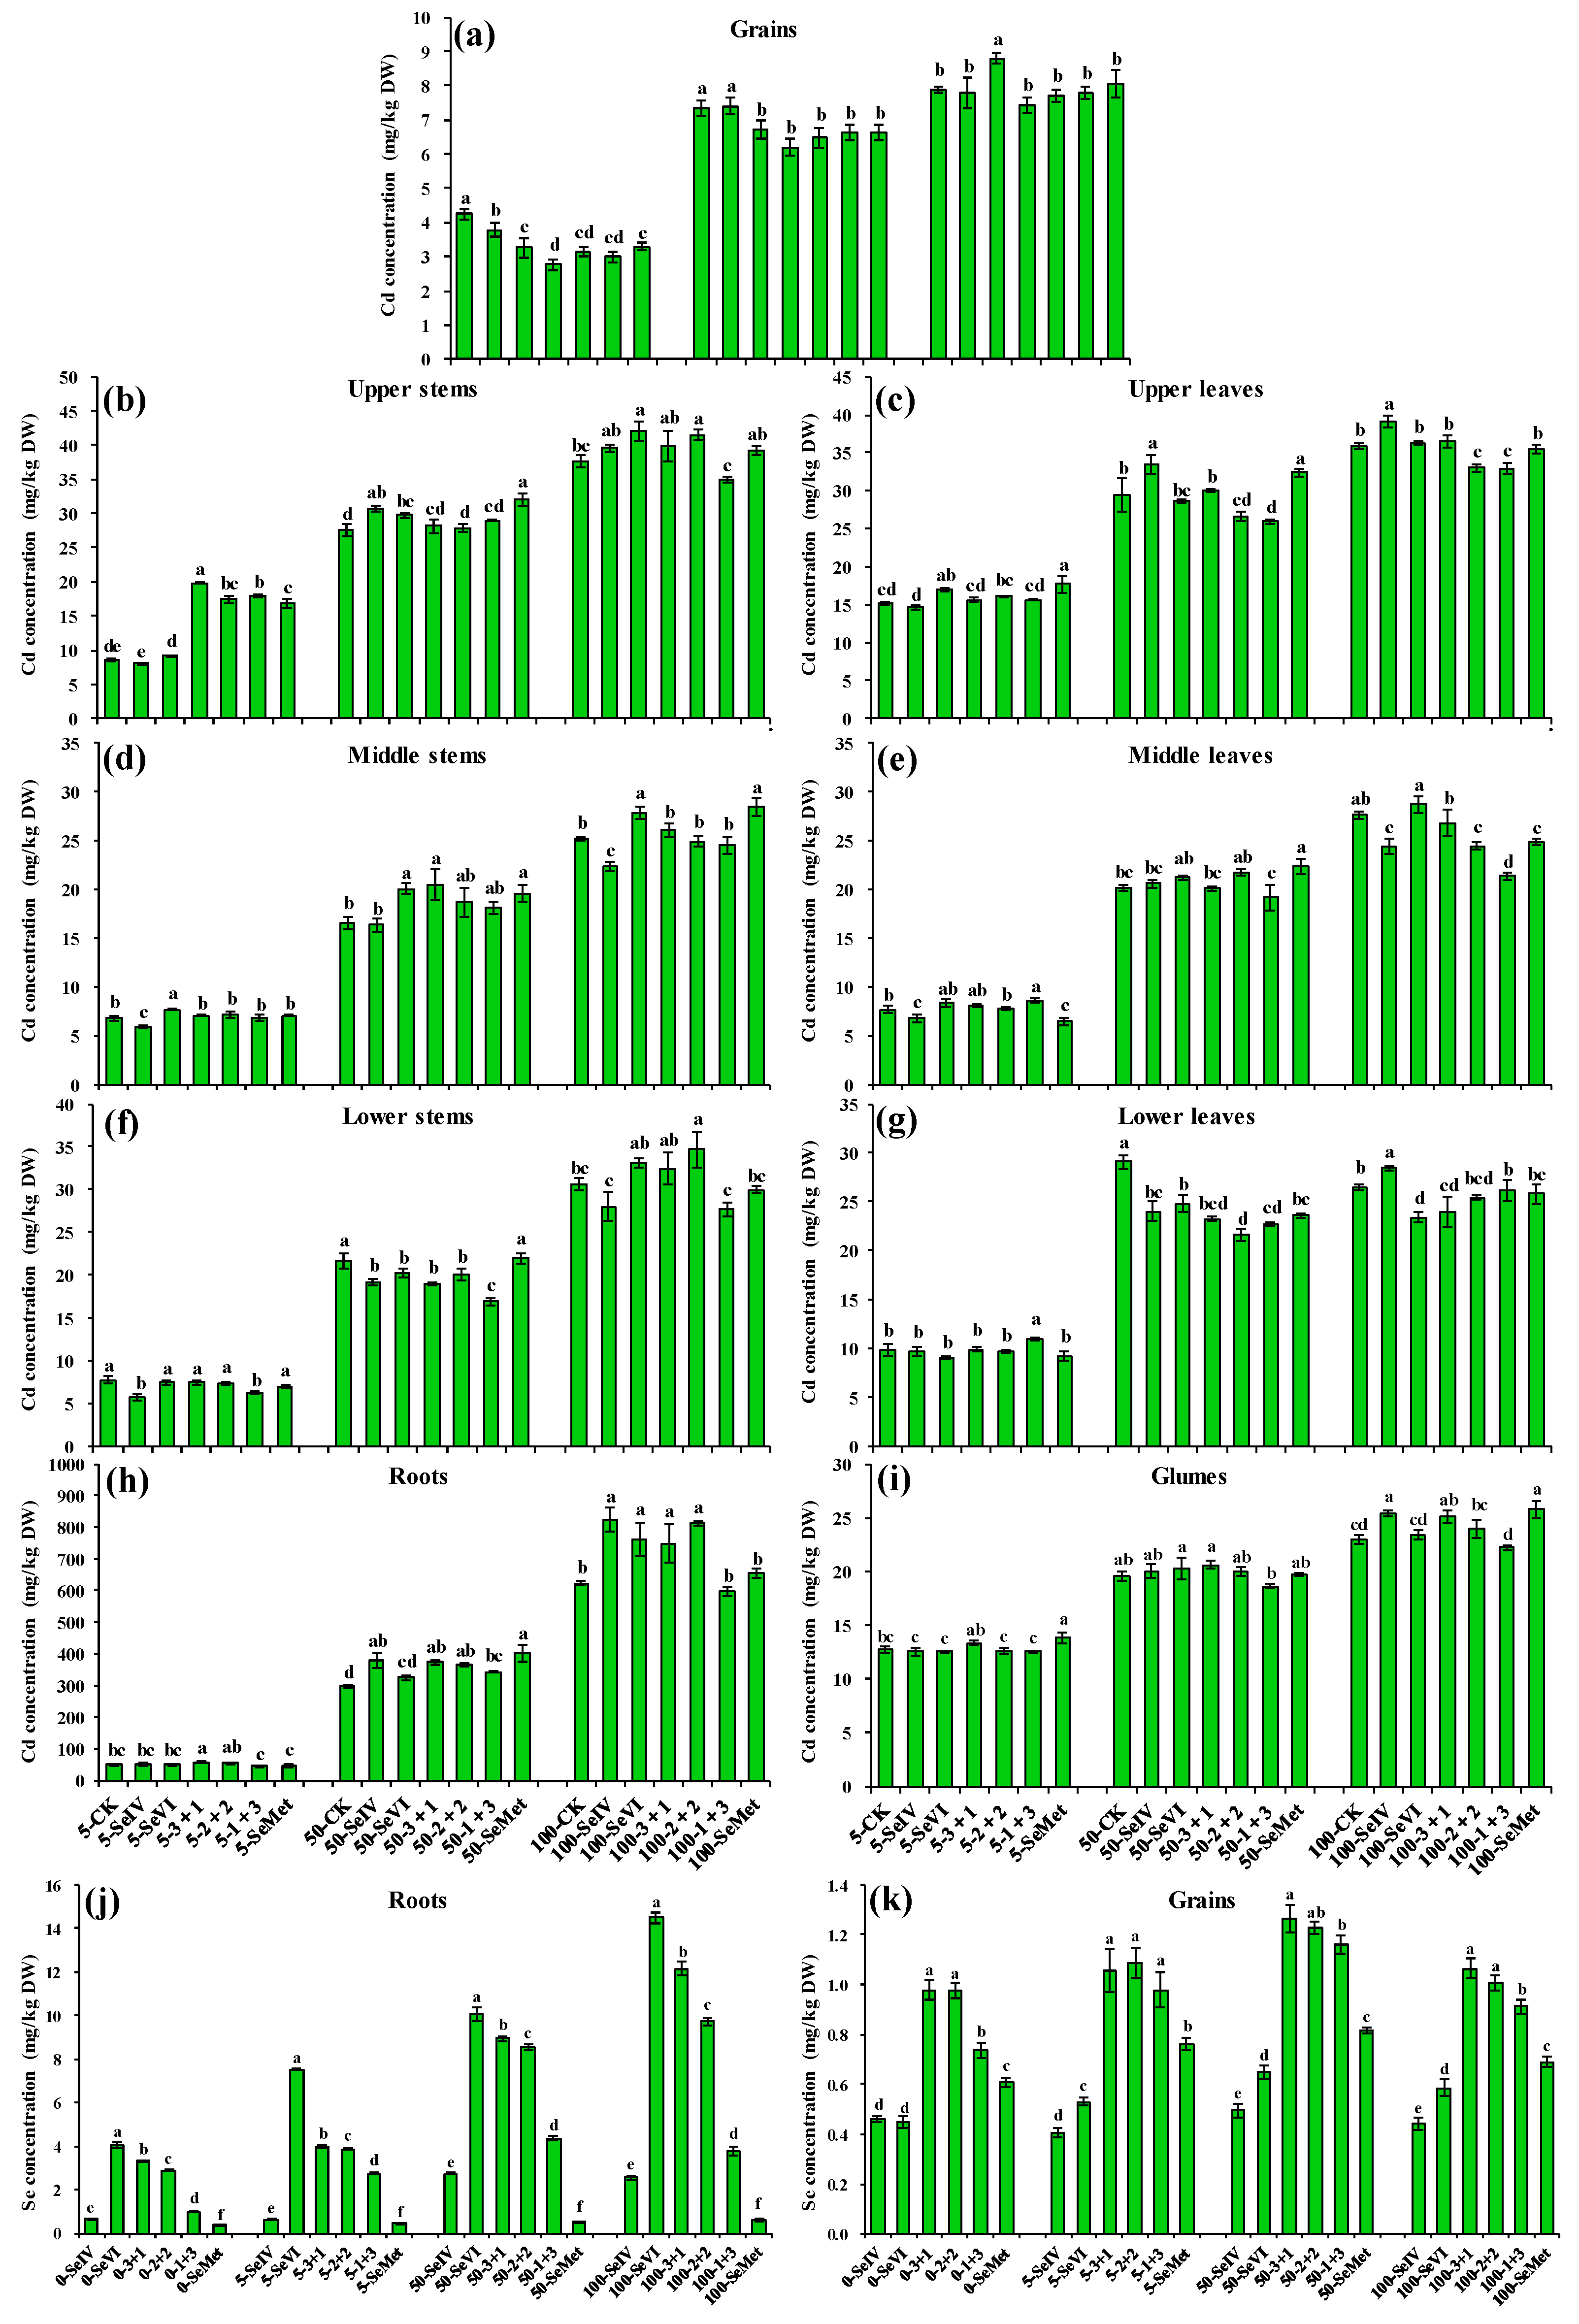
3.4. 3 + 1 Treatment Effectively Reduced Cd Accumulation and Increased Se Content in the Grains

As the Cd concentration increased, Cd content in all organs also increased significantly. The highest Cd content was found in the roots, followed by the stems, leaves, and glumes, with the grains exhibiting the lowest Cd content (Figure 4). Under the 5 mg/kg Cd concentration, the 3 + 1 treatment significantly increased the Cd content in the roots by 13.9% compared with the control (CK) (Figure 4h). Se treatments at the 5 and 50 mg/kg Cd concentrations increased Cd content in the middle stems and leaves (Figure 4d,e). Under 5 mg/kg Cd stress, the 3 + 1, 2 + 2, 1 + 3, and SeMet treatments increased upper stem Cd content by 129.9%, 102.7%, 108.3%, and 95.7%, respectively, compared with the CK (Figure 4b). Additionally, SeIV, SeVI, 3 + 1, 2 + 2, 1 + 3, and SeMet treatments reduced the grain Cd content by 11.0%, 23.3%, 34.6%, 26.2%, 29.7%, and 22.8%, respectively. Across all Cd stress concentrations, the 3 + 1 treatment was the most effective in reducing grain Cd accumulation, decreasing grain Cd content by 34.6%, 16.2%, and 6.3% under the 5, 50, and 100 mg/kg Cd concentrations, respectively (Figure 4a). Se content in roots was the highest under the SeVI treatment and decreased progressively with the decrease in SeVI application frequency (Figure 4j). When SeMet was applied at the filling stage, grain Se content increased with the increasing SeVI application frequency, and the highest Se content was observed in the 3 + 1 and 2 + 2 treatments (Figure 4k).

3.5. Se Treatment Reduced the Translocation of Se from Nutrient Organs to the Grains

Under the 5 mg/kg Cd concentration, compared with CK, the SeIV, SeVI, 3 + 1, and 2 + 2 treatments decreased the Cd TFs from the roots to the aboveground organs, whereas the 1 + 3 and SeMet treatments increased the Cd TFs (Figure 5a). At the 50 mg/kg Cd concentration, all Se treatments reduced the Cd TFs from the roots to the aboveground organs. In addition, compared with CK, Se treatments reduced the Cd TFs from each organ to the grains, with SeMet treatments resulting in a greater reduction than individual SeIV and SeVI treatments. Among them, the 3 + 1 treatment resulted in the lowest Cd TFs from different organs to the grains under 5 mg/kg Cd stress. As the frequency of SeVI application decreased, the Cd TFs from the middle and lower organs to grains increased (Figure 5b). At the 50 and 100 mg/kg Cd concentrations, the inhibitory effect of Se on Cd TFs from the nutrient organs to the grains weakened, but the overall trend remained consistent with that observed under the 5 mg/kg Cd concentration.

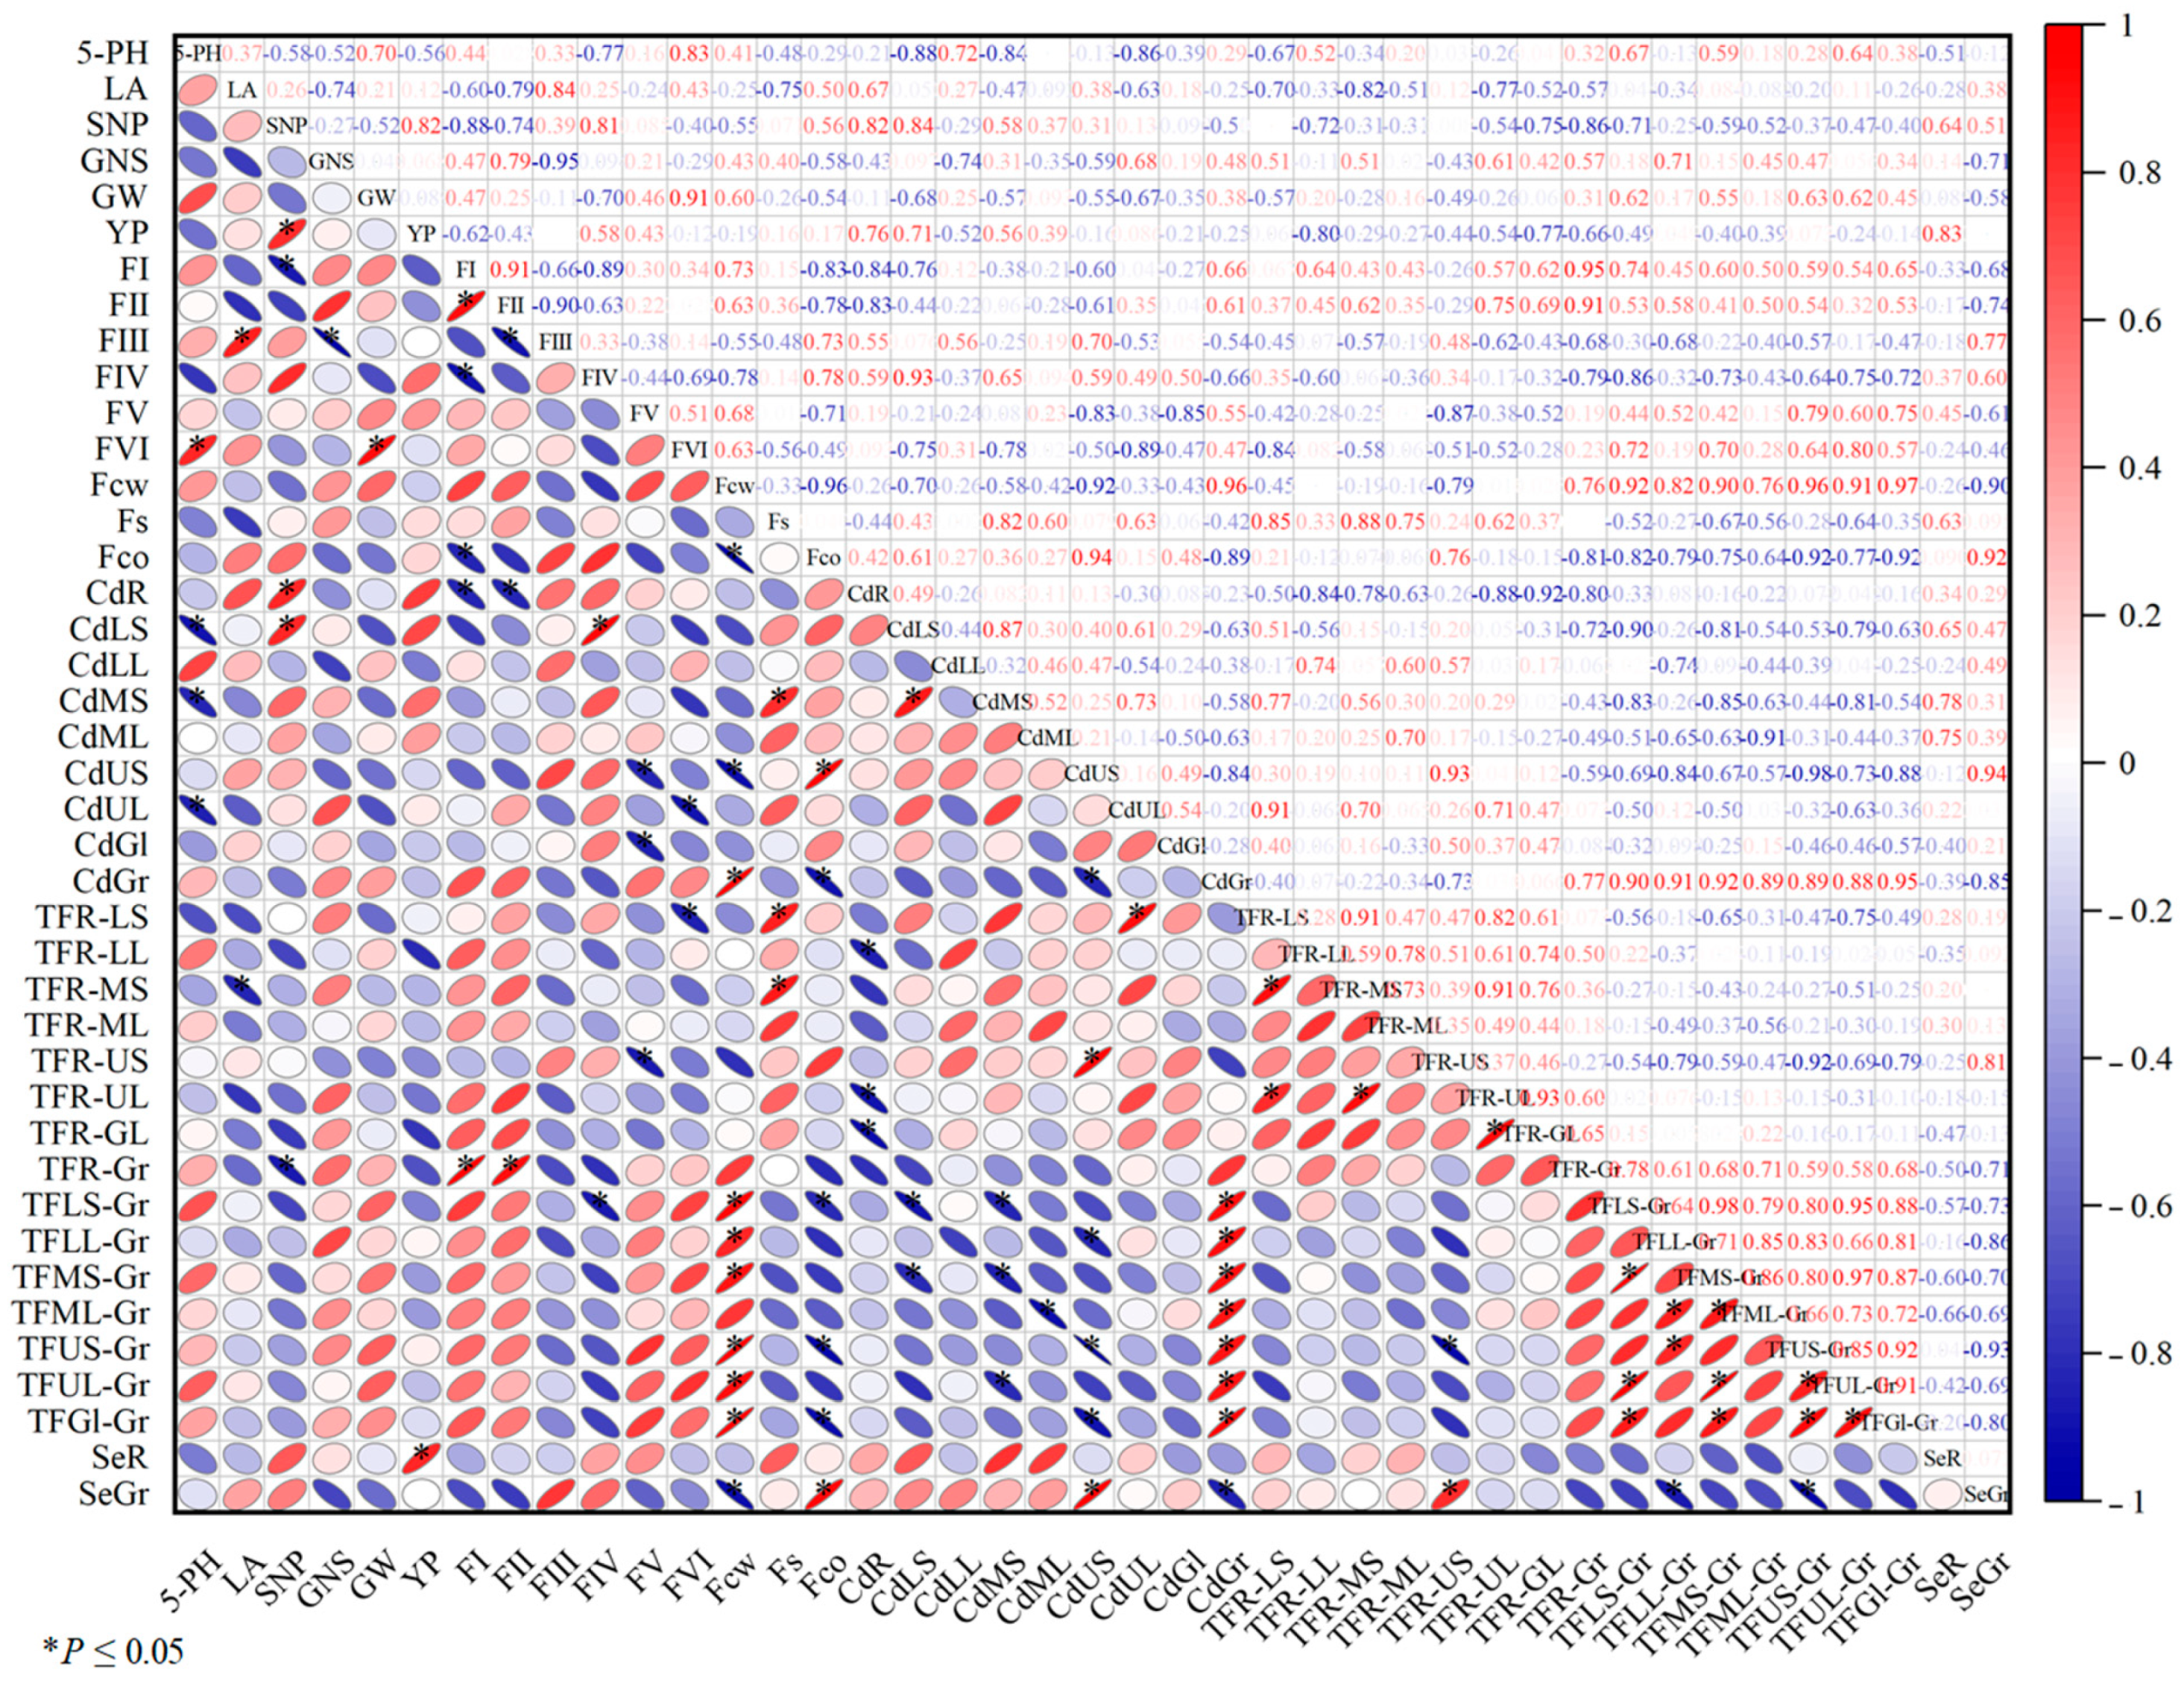
3.6. Trends of Correlation Among Different Indices

Under the 5 mg/kg Cd concentration, SNP was found to be significantly negatively correlated with the FI Cd proportion (−0.88) and the Cd TF from the roots to the grains (−0.86) but significantly positively correlated with Cd content in the roots (0.82) and lower stems (0.84). YP showed a positive correlation with SNP (0.82) and Se content in the roots (0.83). Grain Cd content correlated strongly and positively with Cd TFs from each organ to the grains but significantly negatively with the Cd proportion in Fco (−0.89), Cd content in the upper stems (−0.84), and Se content in the grains (−0.85). However, grain Cd content showed no significant correlation with Cd content in the upper leaves and glumes (Figure 6). At the 50 and 100 mg/kg Cd concentrations, the correlation trends for each index were consistent with those observed under the 5 mg/kg Cd concentration (Figure S1).

4. Discussion

4.1. Se Treatment Relieves the Inhibitory Effect of Cd Stress on Wheat Yield Traits

In the present study, Cd stress significantly reduced the SNP, GW, and YP, and the decreased SNP mainly contributed to the decrease in YP. Consistent with this result, Zhang et al. [35] indicated that late onset and weak tillering led to more than 50% reduction in SNP, whereas GNS and GW were less affected under Cd stress. Furthermore, under Cd stress, Se treatment significantly increased SNP and YP and also enhanced GW and GNS to varying degrees; this finding is consistent with that of our previous study [8]. The ability of Se to increase GNS may be explained by the findings of previous studies reporting that Se treatment reduces the reactive oxygen species levels in the reproductive organs in rice under Cd and As stress, thereby improving pollen viability and increasing GNS [3,36]. In addition, Saifullah et al. [37] found that spraying Zn had little effect on GW under Cd stress, and yield improvement was mainly due to an increase in effective tillering in wheat. The present study revealed that under Cd stress, wheat yield was higher following SeVI treatment than after SeIV or SeMet treatment alone, and the yield increased with the increasing frequency of SeVI applications. SeVI has strong mobility in plants [26,31], allowing it to move efficiently from the leaves to the roots, stems, and other organs (Figure 4j), thereby effectively alleviating Cd toxicity. This enhanced mobility may be a key factor promoting the formation of effective tillers and significantly increasing yield [8]. The significant positive correlation between yield and root Se content (Figure 6) further supports this hypothesis.

4.2. Se Treatment Alleviates Cd Toxicity by Reducing the Cd Proportion in the Organelles and Active Forms

Cell wall fixation is a key mechanism for reducing Cd toxicity in crops, such as rice [17] and wheat [8]. In rice [20] and Brassica juncea [38], SeIV application significantly increased the contents of pectin, hemicellulose, and corpus callosum in the cell wall, promoting the demethylesterification of pectin under Cd stress. This enhances the Cd fixation ability of the cell wall and reduces the toxicity of Cd entering the symplast. However, in the present study, Se application did not increase the proportion of Cd in Fcw and even reduced it under 5 mg/kg Cd stress. Unlike in roots, where the cell wall acts as the primary barrier to prevent Cd entry, Cd in leaves is mainly transported through the symplast. Thus, the proportion of Cd in the leaf Fcw was less affected by cell wall fixation and more dependent on the ability of Cd to be excreted from the symplast to the cell wall. The TaTM20 is a transporter gene responsible for efflux Cd [8,34]. In the present study, the expression level of TaTM20 was consistent with the trend of Cd proportion in the Fcw under different treatments (Figure 3), supporting the above speculation.
Vacuole compartmentalization is another key mechanism for alleviating Cd toxicity in crops [8,17]. Once stored in vacuoles, Cd transport is hindered, which alleviates Cd toxicity [39]. SeIV application promoted the synthesis of phytochelatins (PCs) and TaSBP-A proteins, which chelate Cd in Amaranthus hypochondriacus [21] and wheat [40]. In addition, SeIV enhanced the vacuolar compartmentation of chelated Cd by upregulating the expression of ABCC6, CAX7, and HMA3 [31]. In the present study, Se treatment increased Cd proportion in the Fs, pectin- and protein-bound forms (FIII), and phosphate-bound forms (FIV) but reduced its proportion in the Fco and active forms (FI and FII) in wheat leaves. This may be due to the promoting effect of Se on the synthesis of chelators, such as PCs [8], phosphate content [41], and the expression of TaVP1, which facilitates Cd transport into the vacuoles (Figure 3).

4.3. Combined Application of SeVI and SeMet Enhances Cd Retention in Nutrient Organs and Reduces Cd Accumulation in the Grains

Compared with Cd treatment alone, Se treatment did not significantly reduce the Cd content in nutrient organs, and in some cases, it even increased the Cd content (Figure 4). This finding indicated that foliar Se application did not inhibit Cd absorption in wheat, which is consistent with the findings of a previous study [8]. However, under the 5 and 50 mg/kg Cd concentrations, Se treatment reduced Cd content in the grains (Figure 4a). Thus, Se treatment likely reduces grain Cd accumulation by limiting Cd transport from various nutrient organs to grains, instead of reducing Cd absorption. This finding is consistent with those reported in rice [9,32]. In the present study, the significant positive correlation between grain Cd content and Cd TFs from each organ to grains (Figure 6), along with the reduction in Cd TFs by Se treatments (Figure 5), supports this hypothesis.
Compared with the CK and individual SeIV and SeVI treatments, the SeMet treatment significantly reduced the grain Cd content. Under the 5 mg/kg Cd concentration, the level of Cd translocation from the upper leaves or stems to the grains was similar under all SeMet treatments, with the levels of TFs being much lower than those under SeIV and SeVI treatments (Figure 5b). Furthermore, Cd content in the upper organs was higher after SeMet treatments than after individual SeIV or SeVI treatment (Figure 4b,c). Moreover, a significant positive correlation was observed between Cd content in the upper leaves and grain Cd content following SeMet treatment (Figure S2). These results support the hypothesis that SeMet is more effective than SeIV and SeVI in retaining Cd in upper organs and reducing Cd translocation to grains. The effectiveness of SeMet treatment during the filling stage in retaining Cd in the upper organs and significantly reducing grain Cd content may be due to two factors: (1) Cd accumulation in grains primarily results from transport in the upper organs [32] and (2) both Cd and SeMet are predominantly located in the phloem of the upper organs, where SeMet can be rapidly assimilated to form chelates [26,42].
After the treatment containing SeMet, grain Cd content decreased more significantly with the increase in SeVI application frequency. The 3 + 1 treatment resulted in the lowest grain Cd content, which was 65.9%, 74.0%, and 85.3% of the levels observed in individual SeIV, SeVI, and SeMet treatments under the 5 mg/kg Cd concentration. However, no differences were found in Cd TFs from the upper organs to the grains following all SeMet treatments (Figure 5b). Thus, the significant differences in grain Cd content among SeMet treatments are likely due to Cd transport from the middle and lower organs to the grains. Moreover, Cd TFs from the lower organs to the grains decreased with the increase in SeVI applicating frequency. This may be because SeMet has poor mobility and is rapidly assimilated, which account for its weaker ability to retain newly absorbed Cd when applied in early stages. When SeMet is applied during the filling stage, it mainly accumulates in the upper organs, limiting its ability to retain Cd in the roots and middle and lower organs. By contrast, SeVI has high mobility and a slower assimilation rate, allowing it to reach the middle and lower organs more effectively, where it continues to chelate newly absorbed Cd, which reduces its translocation to grains.

4.4. Combined SeVI and SeMet Application Had the Best Effect on Grain Se Biofortification in Wheat

Se deficiency can lead to various diseases in humans [43]. In China, the Se content in wheat grains (0.065 mg/kg) is far below the nutritional requirements for people who rely on wheat as a staple food [44]. Enhancing Se content in food crops is considered a safe and efficient method to improve the human Se nutritional status [45,46,47]. In the present study, the wheat grain Se content ranged from 0.41 to 1.27 mg/kg under Se application conditions, exceeding the recommended standard for Se-rich wheat (0.15 to 0.30 mg/kg), but remained well below the toxigenic level (2 mg/kg) [44]. Grain Se content was significantly higher under SeVI treatment than under SeIV treatment, consistent with the findings in other crops, such as rice [45], wheat [46,48,49], and lupine [50]. This may be due to the higher absorption capacity of leaves for selenate than selenite as well as the higher mobility of selenate, which facilitate its transport through the leaf phloem to the grains [45]. Among all Se treatments, SeMet had the strongest Se biofortification effect, significantly surpassing both SeIV and SeVI treatments. Previous studies in wheat [51] and rice [47] have also reported significantly higher absorption rates for SeMet than for selenite and selenate, which is believed to result from differences in the activities of their respective transporters. Another study suggested that SeMet is not easily absorbed by flag leaves but can be rapidly transported to grains through the phloem, whereas SeIV and SeVI are more readily absorbed and transported simultaneously through the phloem and xylem, leading to their accumulation in the leaves and other organs [42].
In all treatments involving SeMet, grain Se content was found to increase significantly with an increase in the frequency of early-stage SeVI application. Under 5 mg/kg Cd stress, grain Se content in the 3 + 1 treatment was 261%, 200%, and 140% of the levels observed in the individual SeIV, SeVI, or SeMet treatment, respectively. This may be due to the high mobility of SeVI and its slow conversion to organic Se [26]. SeVI applied before the grain-filling stage was not fully assimilated and fixed in nutrient organs, allowing its translocation to the grains during the grain-filling stage. By contrast, SeMet applied in the early stage was more likely to be fixed in nutrient organs [45]. A previous study reported that the bioavailability of organic Se was 90% and that of inorganic Se was only 50% [52]. However, the organic Se content in mature wheat grains accounted for over 90% of the total Se, and this was largely unaffected by the form in which Se was applied before the filling stage because the time for the conversion of SeIV and SeVI to organic Se in the grains is sufficient at this stage [45,53]. Thus, the level of Se enhancement in wheat grains was less affected by Se bioavailability and more dependent on the Se content. In this study, Se content in wheat grains was high under Se application. Adjusting the spraying frequency and concentration of Se to an appropriate level can reduce costs and ensure food safety, necessitating further investigations in this direction.

5. Conclusions

Se effectively alleviates Cd toxicity and reduces grain Cd accumulation in wheat by regulating the expression of Cd transporter genes, promoting Cd fixation in the cell wall, and facilitating vacuolar compartmentalization. These effects are strongly influenced by the chemical forms of applied Se and the timing of application. SeVI, with its high mobility, can quickly move from the leaves to the roots and other organs, thereby effectively mitigating Cd toxicity. Applying SeVI during critical periods for yield formation promotes the development of effective tillers, which improves wheat yield. SeMet, with its high assimilation rate, is efficiently translocated to the grains, retaining Cd in the upper organs and reducing Cd accumulation in the grains while promoting Se enrichment. Therefore, applying SeMet during the grain-filling stage is crucial for reducing Cd levels and enhancing Se content in the grains. Applying SeVI before the grain-filling stage can ensure the fixation of Cd in the middle and lower organs while promoting Se transport to the grains, thereby effectively reducing Cd content and increasing Se content in the grains. Notably, the 3 + 1 treatment resulted in yields comparable to those in the SeMet treatment alone, while reducing grain Cd content (−14.7%) and increasing Se content (+39.5%). Thus, the combined application of SeVI (at the seedling, jointing, and heading stages) and SeMet (at the filling stage) offers practical value in managing Cd pollution, enhancing wheat yield, and ensuring Se biofortification.

Supplementary Materials

The following supporting information can be downloaded at: https://www.mdpi.com/article/10.3390/agronomy15010199/s1, Figure S1: Correlation coefficients between various indicators under 50 and 100 mg/kg Cd concentration; Figure S2: Correlation coefficients of Cd content between upper leaves and grains of partially treatment under 5 mg/kg Cd stress; Table S1: Sequences of specific-primers used for qRT-PCR.

Author Contributions

Data curation, D.Z.; funding acquisition, D.Z., J.L. and T.H.; investigation, T.C., H.W., Y.Z. and Z.G.; methodology, D.Z. and J.L.; supervision, T.H.; writing—original draft, D.Z.; writing—review and editing, D.Z. and J.L. All authors have read and agreed to the published version of the manuscript.

Funding

This research was funded by the Key Scientific and Technological Research Projects in Henan Province (grant numbers 242102320126 and 242102110321), the Henan Province Project of Wheat Industry Technology System (grant number HARS-22–01-G1), and the Innovative Training Program for College Students (grant number 2024CX107).

Data Availability Statement

The original contributions presented in this study are included in the article/Supplementary Materials. Further inquiries can be directed to the corresponding author.

Conflicts of Interest

The authors declare no conflicts of interest.

References

  1. Zhou, Q.; Yang, N.; Li, Y.; Ren, B.; Ding, X.; Bian, H.; Yao, X. Total concentrations and sources of heavy metal pollution in global river and lake water bodies from 1972 to 2017. Glob. Ecol. Conserv. 2020, 22, e00925. [Google Scholar] [CrossRef]
  2. Cui, X.; Mao, P.; Sun, S.; Huang, R.; Fan, Y.; Li, Y.; Li, Y.; Zhuang, P.; Li, Z. Phytoremediation of cadmium contaminated soils by Amaranthus Hypochondriacus L.: The effects of soil properties highlighting cation exchange capacity. Chemosphere 2021, 283, 131067. [Google Scholar] [CrossRef] [PubMed]
  3. Barman, F.; Kundu, R. Foliar application of selenium affecting pollen viability, grain chalkiness, and transporter genes in cadmium accumulating rice cultivar: A pot study. Chemosphere 2023, 313, 137538. [Google Scholar] [CrossRef] [PubMed]
  4. Kaya, C.; Ashraf, M.; Alyemeni, M.N.; Ahmad, P. Responses of nitric oxide and hydrogen sulfide in regulating oxidative defence system in wheat plants grown under cadmium stress. Physiol. Plant. 2020, 168, 345–360. [Google Scholar] [CrossRef]
  5. Darwish, W.S.; Chiba, H.; Elhelaly, A.E.; Hui, S.-P. Estimation of cadmium content in Egyptian foodstuffs: Health risk assessment, biological responses of human HepG2 cells to food-relevant concentrations of cadmium, and protection trials using rosmarinic and ascorbic acids. Environ. Sci. Pollut. Res. Int. 2019, 26, 15443–15457. [Google Scholar] [CrossRef]
  6. Kerketta, A.; Kumar, H.; Powell, M.A.; Sahoo, P.K.; Kapoor, H.S.; Mittal, S. Trace element occurrence in vegetable and cereal crops from parts of Asia: A meta-data analysis of crop-wise differences. Curr. Pollut. Rep. 2023, 9, 1–21. [Google Scholar] [CrossRef]
  7. Shi, G.; Lu, H.; Liu, H.; Lou, L.; Zhang, P.; Song, G.; Zhou, H.; Ma, H. Sulfate application decreases translocation of arsenic and cadmium within wheat (Triticum aestivum L.) plant. Sci. Total Environ. 2020, 713, 136665. [Google Scholar] [CrossRef]
  8. Zhang, D.; Zhang, Y.; Zhou, H.; Wang, H.; Gao, Y.; Shao, L.; Ding, Q.; Ma, L. Chalcogens reduce grain Cd accumulation by enhancing Cd root efflux and upper organ retention in wheat (Triticum aestivum L.). Environ. Exp. Bot. 2022, 201, 104975. [Google Scholar] [CrossRef]
  9. Yang, X.; Wang, C.; Huang, Y.; Liu, B.; Liu, Z.; Huang, Y.; Cheng, L.; Huang, Y.; Zhang, C. Foliar application of the sulfhydryl compound 2,3-dimercaptosuccinic acid inhibits cadmium, lead, and arsenic accumulation in rice grains by promoting heavy metal immobilization in flag leaves. Environ. Pollut. 2021, 285, 117355. [Google Scholar] [CrossRef]
  10. Liu, X.; Yin, Z.; Sheng, H.; Xiao, H.; Zhang, L.; Zhou, P. Response of microbial community, enzyme activity, and physicochemical property in paddy soil to continuous organic fertilizer and lime amendments. J. Plant Nutr. Fertil. 2024, 30, 63–73. (In Chinese) [Google Scholar]
  11. Qin, G.; Niu, Z.; Yu, J.; Li, Z.; Ma, J.; Xiang, P. Soil heavy metal pollution and food safety in China: Effects, sources and removing technology. Chemosphere 2021, 267, 129205. [Google Scholar] [CrossRef] [PubMed]
  12. Rizwan, M.; Ali, S.; Abbas, T.; Zia-ur-Rehman, M.; Hannan, F.; Keller, C.; Al-Wabel, M.I.; Ok, Y.S. Cadmium minimization in wheat: A critical review. Ecotoxicol. Environ. Saf. 2016, 130, 43–53. [Google Scholar] [CrossRef] [PubMed]
  13. Li, D.; Liu, H.; Gao, M.; Zhou, J.; Zhou, J. Effects of soil amendments, foliar sprayings of silicon and selenium and their combinations on the reduction of cadmium accumulation in rice. Pedosphere 2022, 32, 649–659. [Google Scholar] [CrossRef]
  14. Wu, C.; Dun, Y.; Zhang, Z.; Li, M.; Wu, G. Foliar application of selenium and zinc to alleviate wheat (Triticum aestivum L.) cadmium toxicity and uptake from cadmium-contaminated soil. Ecotoxicol. Environ. Saf. 2020, 190, 110091. [Google Scholar] [CrossRef] [PubMed]
  15. Zhang, M.; Lu, X.; Ren, T.; Marowa, P.; Meng, C.; Wang, J.; Yang, H.; Li, C.; Zhang, L.; Xu, Z. Heterologous overexpression of Apocynum venetum flavonoids synthetase genes improves Arabidopsis thaliana salt tolerance by activating the IAA and JA biosynthesis pathways. Front. Plant Sci. 2023, 14, 1123856. [Google Scholar] [CrossRef]
  16. Zhong, W.; Xie, C.; Hu, D.; Pu, S.; Xiong, X.; Ma, J.; Sun, L.; Huang, Z.; Jiang, M.; Li, X. Effect of 24-epibrassinolide on reactive oxygen species and antioxidative defense systems in tall fescue plants under lead stress. Ecotoxicol. Environ. Saf. 2020, 187, 109831. [Google Scholar] [CrossRef]
  17. Huang, H.; Li, M.; Rizwan, M.; Dai, Z.; Yuan, Y.; Hossain, M.; Cao, M.; Xiong, S.; Tu, S. Synergistic effect of silicon and selenium on the alleviation of cadmium toxicity in rice plants. J. Hazard. Mater. 2021, 401, 123393. [Google Scholar] [CrossRef]
  18. Zhao, B.; Zhao, J.; Zhou, S.; Wu, X.; Xu, X.; Yang, R.; Yuan, Z. Selenium and toxic metals in human hair of the Dashan Region, China: Concentrations, sources, and antagonism effect. Ecotoxicol. Environ. Saf. 2023, 250, 114479. [Google Scholar] [CrossRef]
  19. Asgher, M.; Rehaman, A.; Islam, S.N.; Arshad, M.; Khan, N.A. Appraisal of functions and role of selenium in heavy metal stress adaptation in plants. Agriculture 2023, 13, 1083. [Google Scholar] [CrossRef]
  20. Wang, L.; Wu, K.; Liu, Z.; Li, Z.; Shen, J.; Wu, Z.; Liu, H.; You, L.; Yang, G.; Rensing, C.; et al. Selenite reduced uptake/translocation of cadmium via regulation of assembles and interactions of pectins, hemicelluloses, lignins, callose and Casparian strips in rice roots. J. Hazard. Mater. 2023, 448, 130812. [Google Scholar] [CrossRef]
  21. Yang, L.; Li, N.; Kang, Y.; Liu, J.; Wang, Y.; Sun, H.; Ao, T.; Chen, W. Selenium alleviates toxicity in Amaranthus hypochondriacus by modulating the synthesis of thiol compounds and the subcellular distribution of cadmium. Chemosphere 2022, 291 Pt 3, 133108. [Google Scholar] [CrossRef] [PubMed]
  22. Zhao, Y. Selenium Regulated Plant Growth and Cadmium Response in Root of Rape Under Cadmium Stress. Ph.D. Thesis, Huazhong Agricultural University, Wuhan, China, 2019. [Google Scholar]
  23. Ding, Y.; Feng, R.; Wang, R.; Guo, J.; Zheng, X. A dual effect of Se on Cd toxicity: Evidence from plant growth, root morphology and responses of the antioxidative systems of paddy rice. Plant Soil 2014, 375, 289–301. [Google Scholar] [CrossRef]
  24. Qin, X.; Nie, Z.; Liu, H.; Zhao, P.; Qin, S.; Shi, Z. Influence of selenium on root morphology and photosynthetic characteristics of winter wheat under cadmium stress. Environ. Exp. Bot. 2018, 150, 232–239. [Google Scholar] [CrossRef]
  25. Yu, Y.; Yuan, S.; Zhuang, J.; Wan, Y.; Wang, Q.; Zhang, J.; Li, H. Effect of selenium on the uptake kinetics and accumulation of and oxidative stress induced by cadmium in Brassica chinensis. Ecotoxicol. Environ. Saf. 2018, 162, 571–580. [Google Scholar] [CrossRef]
  26. Wan, Y.; Yu, Y.; Wang, Q.; Qiao, Y.; Li, H. Cadmium uptake dynamics and translocation in rice seedling: Influence of different forms of selenium. Ecotoxicol. Environ. Saf. 2016, 133, 127–134. [Google Scholar] [CrossRef]
  27. Zhang, H.; Zhao, Z.; Zhang, X.; Zhang, W.; Huang, L.; Zhang, Z.; Yuan, L.; Liu, X. Effects of foliar application of selenate and selenite at different growth stages on Selenium accumulation and speciation in potato (Solanum tuberosum L.). Food Chem. 2019, 286, 550–556. [Google Scholar] [CrossRef]
  28. Zheng, J.; Bao, G.; Tao, R.; Wu, C.; Ma, Y.; Ye, W. Effects of basal and foliar selenium fertilizers in reducing cadmium and increasing selenium in selenium enriched, cadmium-polluted rice fields. J. Agro-Environ. Sci. 2024, 43, 974. [Google Scholar]
  29. Huang, B.; Xin, J.; Dai, H.; Zhou, W. Effects of Interaction between Cadmium (Cd) and Selenium (Se) on Grain Yield and Cd and Se Accumulation in a Hybrid Rice (Oryza sativa) System. J. Agric. Food Chem. 2017, 65, 9537–9546. [Google Scholar] [CrossRef]
  30. Li, X. Technical solutions for the safe utilization of heavy metal-contaminated farmland in China: A critical review. Land Degrad. Dev. 2019, 30, 1773–1784. [Google Scholar] [CrossRef]
  31. Yu, Y.; Wang, Q.; Wan, Y.; Huang, Q.; Li, H. Transcriptome analysis reveals different mechanisms of selenite and selenate regulation of cadmium translocation in Brassica rapa. J. Hazard. Mater. 2023, 452, 131218. [Google Scholar] [CrossRef]
  32. Rodda, M.S.; Li, G.; Reid, R.J. The timing of grain Cd accumulation in rice plants: The relative importance of remobilisation within the plant and root Cd uptake post-flowering. Plant Soil 2011, 347, 105–114. [Google Scholar] [CrossRef]
  33. Zhu, J.; Zhao, P.; Nie, Z.; Shi, H.; Li, C.; Wang, Y.; Qin, S.; Qin, X.; Liu, H. Selenium supply alters the subcellular distribution and chemical forms of cadmium and the expression of transporter genes involved in cadmium uptake and translocation in winter wheat (Triticum aestivum). BMC Plant Biol. 2020, 20, 550. [Google Scholar] [CrossRef] [PubMed]
  34. Liu, Y.; Lu, M.; Tao, Q.; Luo, J.; Li, J.; Guo, X.; Liang, Y.; Yang, X.; Li, T. A comparative study of root cadmium radial transport in seedlings of two wheat (Triticum aestivum L.) genotypes differing in grain cadmium accumulation. Environ. Pollut. 2020, 266 Pt 3, 115235. [Google Scholar] [CrossRef]
  35. Zhang, G.; Fukami, M.; Sekimoto, H. Influence of cadmium on mineral concentrations and yield components in wheat genotypes differing in Cd tolerance at seedling stage. Field Crops Res. 2002, 77, 93–98. [Google Scholar] [CrossRef]
  36. Paniz, F.P.; Pedron, T.; Procópio, V.A.; Lange, C.N.; Freire, B.M.; Batista, B.L. Selenium biofortification enhanced grain yield and alleviated the risk of arsenic and cadmium toxicity in rice for human consumption. Toxics 2023, 11, 362. [Google Scholar] [CrossRef]
  37. Saifullah; Javed, H.; Naeem, A.; Rengel, Z.; Dahlawi, S. Timing of foliar Zn application plays a vital role in minimizing Cd accumulation in wheat. Environ. Sci. Pollut. Res. Int. 2016, 23, 16432–16439. [Google Scholar] [CrossRef]
  38. Li, L.; Wang, S.; Wu, S.; Rao, S.; Li, L.; Cheng, S.; Cheng, H. Morphological and physiological indicators and transcriptome analyses reveal the mechanism of selenium multilevel mitigation of cadmium damage in Brassica juncea. Plants 2023, 12, 1583. [Google Scholar] [CrossRef]
  39. Lux, A.; Martinka, M.; Vaculík, M.; White, P.J. Root responses to cadmium in the rhizosphere: A review. J. Exp. Bot. 2011, 62, 21–37. [Google Scholar] [CrossRef]
  40. Luo, F.; Zhu, D.; Sun, H.; Zou, R.; Duan, W.; Liu, J.; Yan, Y. Wheat Selenium-binding protein TaSBP-A enhances cadmium tolerance by decreasing free Cd(2+) and alleviating the oxidative damage and photosynthesis impairment. Front. Plant Sci. 2023, 14, 1103241. [Google Scholar]
  41. Nawaz, F.; Ashraf, M.Y.; Ahmad, R.; Waraich, E.A.; Shabbir, R.N.; Bukhari, M.A. Supplemental selenium improves wheat grain yield and quality through alterations in biochemical processes under normal and water deficit conditions. Food Chem. 2015, 175, 350–357. [Google Scholar] [CrossRef]
  42. Zhou, X.; Lai, F.; Zhang, C.; Gao, A.; Xu, W. Pathways of selenium to grain relative to form of selenium and variety of rice (Oryza sativa L.). Acta Pedol. Sin. 2017, 54, 1251–1258. (In Chinese) [Google Scholar]
  43. Rayman, M.P. The importance of selenium to human health. Lancet 2000, 356, 233–241. [Google Scholar] [CrossRef] [PubMed]
  44. Liu, H.; Yang, Y.E.; Wang, Z.H.; Li, F.C.; Li, K.Y.; Yang, N.; Wang, S.; Wang, H.; He, G.; Dai, J. Selenium content of wheat grain and its regulation in different wheat production regions of China. Sci. Agric. Sin. 2016, 49, 1715–1728. [Google Scholar]
  45. Deng, X.; Liu, K.; Li, M.; Zhang, W.; Zhao, X.; Zhao, Z.; Liu, X. Difference of selenium uptake and distribution in the plant and selenium form in the grains of rice with foliar spray of selenite or selenate at different stages. Field Crops Res. 2017, 211, 165–171. [Google Scholar] [CrossRef]
  46. Wang, M.; Ali, F.; Wang, M.; Dinh, Q.T.; Zhou, F.; Bañuelos, G.S.; Liang, D. Understanding boosting selenium accumulation in wheat (Triticum aestivum L.) following foliar selenium application at different stages, forms, and doses. Environ. Sci. Pollut. Res. Int. 2020, 27, 717–728. [Google Scholar] [CrossRef]
  47. Wang, Q.; Kong, L.; Huang, Q.; Li, H.; Wan, Y. Uptake and translocation mechanisms of different forms of organic selenium in rice (Oryza sativa L.). Front. Plant Sci. 2022, 13, 970480. [Google Scholar] [CrossRef]
  48. Zhang, D.; Zhang, N.; Hou, Z.; Lou, D.; Ye, J. Effects of different application methods of selenite and selenate on selenium distribution within wheat. J. Plant Nutr. 2018, 41, 2729–2740. [Google Scholar] [CrossRef]
  49. Ducsay, L.; Ložek, O.; Marček, M.; Varényiová, M.; Hozlár, P.; Lošák, T. Possibility of selenium biofortification of winter wheat grain. Plant Soil Environ. 2016, 62, 379–383. [Google Scholar] [CrossRef]
  50. Ximénez-Embún, P.; Alonso, I.; Madrid-Albarrán, Y.; Cámara, C. Establishment of selenium uptake and species distribution in lupine, Indian mustard, and sunflower plants. J. Agric. Food Chem. 2004, 52, 832–838. [Google Scholar] [CrossRef]
  51. Kikkert, J.; Berkelaar, E. Plant uptake and translocation of inorganic and organic forms of selenium. Arch. Environ. Contam. Toxicol. 2013, 65, 458–465. [Google Scholar] [CrossRef]
  52. Thomson, C.D. Assessment of requirements for selenium and adequacy of selenium status: A review. Eur. J. Clin. Nutr. 2004, 58, 391–402. [Google Scholar] [CrossRef]
  53. Cubadda, F.; Aureli, F.; Ciardullo, S.; D’Amato, M.; Raggi, A.; Acharya, R.; Reddy, R.A.; Prakash, N.T. Changes in selenium speciation associated with increasing tissue concentrations of selenium in wheat grain. J. Agric. Food Chem. 2010, 58, 2295–2301. [Google Scholar] [CrossRef]
Figure 1. Correlation analysis between agronomic traits. PH, LA, SNP, GNS, GW, YP represent the plant height, flag leaf area, spike number per plant, grain number per spike, 1000-grain weight, and yield per plant, respectively. * represents significant correlations at p ≤ 0.05.
Agronomy 15 00199 g001
Figure 2. Effects of Se treatment on Cd subcellular distribution (a) and chemical forms (b) in leaves under Cd stress. FCW, FCO, and FS indicate cell wall, organellar fraction, and soluble Cd, respectively. FI, FII, FIII, FIV, FV, and FVI represent the Cd proportions in inorganic form, water-soluble organic acid complexes and Cd(H2PO4)2, pectin- and protein-bound forms, insoluble Cd phosphate, oxalate forms, and residue forms, respectively. Numbers on the bars represent the percentage of each Cd fraction.
Agronomy 15 00199 g002
Figure 3. Effects of Se treatment on the relative expression levels of TaNramp5, TaIRT1, TaHMA3, TaVP1, TaTM20, and TaHMA2 in wheat leaves under Cd stress. Data are presented as the mean ± SD (n = 3). Different lowercase letters represent significant differences (p < 0.05) among the Se treatments under the same Cd stress condition.
Agronomy 15 00199 g003
Figure 4. Cd concentration in the grains (a), upper stems (b), upper leaves (c), middle stems (d), middle leaves (e), lower stems (f), lower leaves (g), roots (h), and glumes (i). Se concentration in the roots (j) and grains (k). Data are presented as the mean ± SD (n = 3). Different lowercase letters represent significant differences (p < 0.05) between different Se treatments under the same Cd concentration.
Agronomy 15 00199 g004
Figure 5. Effects of Se treatment on Cd translocation factors (TFs) from the roots to the aboveground organs (a) and from each organ to the grains (b) under Cd stress. The numbers represent Cd TFs, with red representing higher transport rates and blue representing lower transport rates (in comparison between Se treatments in the same organ at the same Cd concentration).
Agronomy 15 00199 g005
Figure 6. Correlation coefficients between various indicators under the 5 mg/kg Cd concentration. PH, LA, SNP, GNS, GW, and YP represent plant height, leaf area, spike number per plant, grain number per spike, yield per plant, and 1000-grain weight, respectively, FI, FII, FIII, FIV, FV, and FVI represent the proportion of the corresponding chemical form Cd, respectively. Fcw, Fs, and Fco represent the proportion of Cd in the cell wall, soluble fraction, and organellar fraction, respectively. CdR, CdLS, CdLL, CdMS, CdML, CdUS, CdUL, CdGl, and CdGr represent Cd contents in the roots, lower stems, lower leaves, middle stems, middle leaves, upper stems, upper leaves, glumes, and grains, respectively. TFR-LS, TFR-LL, TFR-MS, TFR-ML, TFR-US, TFR-UL, TFR-Gl, and TFR-Gr represent Cd translocation factors from the roots to lower stems, lower leaves, middle stems, middle leaves, upper stems, upper leaves, glumes, and grains, respectively. TFR-Gr, TFLS-Gr, TFLL-Gr, TFMS-Gr, TFML-Gr, TFUS-Gr, TFUL-Gr, and TFGl-Gr represent Cd translocation factors from the root, lower stems, lower leaves, middle stems, middle leaves, upper stems, upper leaves, and glumes to the grains, respectively, SeR and SeGr represent Se contents in the roots and the grains, respectively. “*” indicates significant correlations at p ≤ 0.05.
Agronomy 15 00199 g006
Table 1. Experimental design.
AbbreviationSoil Cd
Concentration
Se Spraying Concentration (0.2 mM)
SSJSHSFS
0-CK0 mg/kgDWDWDWDW
0-SeIVSeIVSeIVSeIVSeIV
0-SeVISeVISeVISeVISeVI
0-3 + 1SeVISeVISeVISeMet
0-2 + 2SeVISeVISeMetSeMet
0-1 + 3SeVISeMetSeMetSeMet
0-SeMetSeMetSeMetSeMetSeMet
5-CK5 mg/kgDWDWDWDW
5-SeIVSeIVSeIVSeIVSeIV
5-SeVISeVISeVISeVISeVI
5-3 + 1SeVISeVISeVISeMet
5-2 + 2SeVISeVISeMetSeMet
5-1 + 3SeVISeMetSeMetSeMet
5-SeMetSeMetSeMetSeMetSeMet
50-CK50 mg/kgDWDWDWDW
50-SeIVSeIVSeIVSeIVSeIV
50-SeVISeVISeVISeVISeVI
50-3 + 1SeVISeVISeVISeMet
50-2 + 2SeVISeVISeMetSeMet
50-1 + 3SeVISeMetSeMetSeMet
50-SeMetSeMetSeMetSeMetSeMet
100-CK100 mg/kgDWDWDWDW
100-SeIVSeIVSeIVSeIVSeIV
100-SeVISeVISeVISeVISeVI
100-3 + 1SeVISeVISeVISeMet
100-2 + 2SeVISeVISeMetSeMet
100-1 + 3SeVISeMetSeMetSeMet
100-SeMetSeMetSeMetSeMetSeMet
Notes: DW: distilled water, SeIV: Na2SeO3, SeVI: Na2SeO4, and SeMet: Selenomethionine.
Table 2. Effects of Se treatment on wheat growth and yield under Cd stress.
TreatmentPH (cm)LA (cm2)SNPGNSGW (g)YP (g)
0-CK67.6 ± 1.5 Aa27.4 ± 1.1 Aa3.6 ± 0.1 Ac38.0 ± 1.7 Aab40.6 ± 0.9 Ab5.6 ± 0.4 Aa
0-SeIV65.6 ± 1.7 Aa23.3 ± 2.9 Bc4.4 ± 0.3 Aa33.3 ± 1.2 Bc42.3 ± 0.3 Aa6.2 ± 0.5 Aa
0-SeVI65.2 ± 2.6 Aa28.6 ± 1.2 Aa4.1 ± 0.1 Aab33.3 ± 1.5 Bc41.0 ± 0.5 Ab5.6 ± 0.4 Ba
0-3 + 166.4 ± 0.6 ABa27.8 ± 0.9 Aa3.8 ± 0.1 Bbc36.0 ± 1.0 Bbc41.4 ±0.4 Ab5.7 ± 0.2 Ba
0-2 + 268.8 ± 1.7 Aa24.3 ± 1.5 Bbc3.8 ± 0.2 ABbc40.3 ± 0.6 Aa39.7 ± 0.7 Ac6.1 ± 0.2 Aa
0-1 + 370.0 ± 2.5 Aa27.0 ± 0.5 Aab4.1 ± 0.1 Aabc40.0 ± 2.6 Aa36.2 ± 0.4 Be5.9 ± 0.3 Aa
0-SeMet68.4 ± 3.6 Aa26.9 ± 0.1 Aab3.7 ± 0.2 Ac38.7 ± 0.6 Bab37.2 ± 0.3 Ad5.3 ± 0.2 Ba
5-CK66.2 ± 2.1 Aa27.1 ± 2.9 Aa3.2 ± 0.2 Bc39.3 ± 1.2 Ab37.9 ± 0.3 Bbc4.7 ± 0.3 Be
5-SeIV69.2 ± 1.5 Aa27.0 ± 2.3 ABa3.5 ± 0.2 Bc42.3 ± 1.5 Aab40.8 ± 0.7 Ba6.1 ± 0.1 Abcd
5-SeVI67.2 ± 2.0 Aa25.6 ± 0.3 ABa4.1 ± 0.1 Aab44.0 ± 1.0 Aa38.8 ± 0.3 Cb6.9 ± 0.2 Aa
5-3 + 168.0 ± 1.5 Aa27.8 ± 1.4 Aa4.2 ± 0.1 Aa41.0 ± 1.0 Aab38.9 ± 0.4 Bb6.7 ± 0.2 Aab
5-2 + 267.7 ± 1.3 Aa26.7 ± 0.6 Aa4.4 ± 0.4 Aa41.3 ± 1.5 Aab36.2 ± 1.9 Bd6.5 ± 0.4 Aabc
5-1 + 369.0 ± 1.0 Aa26.3 ± 0.5 Aa3.6 ± 0.1 Bc41.3 ± 2.1 Aab39.2 ± 0.4 Ab5.8 ± 0.4 Ad
5-SeMet67.4 ± 1.5 Aa26.2 ± 0.6 Aa3.6 ± 0.2 Abc43.7 ± 1.2 Aa37.0 ± 0.4 Acd5.9 ± 0.3 Acd
50-CK65.2 ± 2.5 Aa23.9 ± 1.9 Aa2.8 ± 0.1 Cd36.7 ± 2.5 Aab34.7 ± 0.2 Ce3.5 ± 0.3 Cb
50-SeIV69.6 ± 2.1 Aa26.6 ± 1.4 ABa3.0 ± 0.2 Ccd32.7 ± 2.1 Bb36.5 ± 0.4 Cc3.6 ± 0.1 Bb
50-SeVI67.4 ± 3.6 Aa24.3 ± 2.4 Ba2.9 ± 0.1 Bd39.3 ± 4.2 Aab40.0 ± 0.5 Ba4.5 ± 0.4 Ca
50-3 + 165.2 ± 1.2 Ba23.3 ± 0.6 Ba3.2 ± 0.2 Cbcd37.3 ± 3.1 ABab37.6 ± 0.3 Cb4.4 ± 0.4 Ca
50-2 + 267.8 ± 0.6 Aa24.3 ± 0.5 Ba3.7 ± 0.2 Ba40.3 ± 0.6 Aa33.8 ± 0.2 Bf5.0 ± 0.2 Ba
50-1 + 367.4 ± 1.2 Aa23.6 ± 0.9 Ba3.5 ± 0.2 Bab37.3 ± 0.6 Aab33.9 ± 0.4 Cf4.4 ± 0.2 Ba
50-SeMet68.2 ± 0.6 Aa26.2 ± 1.4 Aa3.3 ± 0.2 Aabc38.3 ± 2.5 Bab35.6 ± 0.3 Bd4.5 ± 0.3 Ca
100-CK65.2 ± 2.5 Aa24.8 ± 1.9 Ab2.3 ± 0.2 Da36.3 ± 0.6 Aa30.8 ± 0.5 Dc2.6 ± 0.2 Db
100-SeIV55.6 ± 1.7 Bb29.6 ± 0.8 Aa2.7 ± 0.2 Ca33.3 ± 1.5 Bb33.8 ± 0.2 Da3.0 ± 0.1 Bab
100-SeVI63.2 ± 1.5 Aa19.7 ± 2.7 Cc2.5 ± 0.2 Ca39.0 ± 1.0 Aa34.2 ± 0.4 Da3.3 ± 0.3 Da
100-3 + 164.4 ± 1.2 Ba19.1 ± 3.0 Cc2.4 ± 0.3 Da39.7 ± 1.2 ABa34.1 ± 0.4 Da3.3 ± 0.3 Da
100-2 + 262.6 ± 2.1 Ba19.1 ± 0.9 Cc2.4 ± 0.3 Ca37.3 ± 1.5 Ba34.3 ± 0.3 Ba3.1 ± 0.3 Cab
100-1 + 356.8 ± 2.1 Bb17.9 ± 2.4 Cc2.6 ± 0.1 Ca39.0 ± 1.0 Aa31.7 ± 0.3 Db3.3 ± 0.1 Ca
100-SeMet54.8 ± 1.0 Bb20.5 ± 1.9 Bc2.4 ± 0.1 Ba36.7 ± 1.5 Ba31.7 ± 0.3 Cb2.8 ± 0.0 Dab
Source of variation
Cd72.9 **57.5 **304.1 **36.7 **662.4 **1097.5 **
Se1.2 6.8 **13.5 **9.2 **88.0 **34.4 **
Cd×Se6.6 **9.0 **8.2 **4.3 **22.0 **19.3 **
Notes: PH, LA, SNP, GNS, GW, YP represent the plant height, flag leaf area, spike number per plant, grain number per spike, 1000-grain weight, and yield per plant, respectively. The values are presented as the mean ± SD (n = 3). Different uppercase letters represent significant differences (p < 0.05) in the same trait among the treatments with different Cd concentrations and the same Se concentration. Different lowercase letters represent significant differences (p < 0.05) in the same trait among different Se treatments at the same Cd concentration; ** represents the significance of the effects of Se, Cd, and their interaction on agronomic traits (p < 0.01).
Disclaimer/Publisher’s Note: The statements, opinions and data contained in all publications are solely those of the individual author(s) and contributor(s) and not of MDPI and/or the editor(s). MDPI and/or the editor(s) disclaim responsibility for any injury to people or property resulting from any ideas, methods, instructions or products referred to in the content.

