1. Introduction
Corn is a vital cereal crop and economic resource, recognized as one of the most important grains globally. It is extensively utilized in food, industrial, and pharmaceutical applications [
1,
2]. To meet the demands of cultivation and production, hybrid breeding technologies have been widely applied in recent years, resulting in an increasing number of corn varieties [
3]. However, during production processes such as planting, harvesting, and transportation, it is difficult to completely avoid the mixing of seeds from different varieties [
4]. Seed purity is a key factor determining corn yield, as different varieties have distinct requirements for environmental conditions such as weather, soil, and temperature. Mixed seeds can lead to uneven growth and reduced resistance, significantly impacting the final yield of corn [
5]. This issue is particularly pronounced in cases where production workflows are poorly regulated, or supply chain management is inadequate. Therefore, developing a rapid and accurate method for seed variety detection is essential to ensure seed purity before planting, thereby improving the growth quality and yield of corn, which is critical for agricultural production.
Due to the highly similar appearance of different corn seed varieties, simple visual inspection is insufficient for differentiation, necessitating the design of specialized detection methods. Traditional corn seed variety detection methods include manual inspection, protein electrophoresis, morphological analysis, and DNA molecular markers. However, these methods rely on expensive specialized equipment, are time-consuming, and often cause irreversible damage to the seeds [
6,
7,
8]. Hence, there is a pressing need for low-cost, rapid, and non-destructive classification methods.
The integration of machine vision technology with spectral imaging offers a promising approach for seed classification, with near-infrared spectral imaging being particularly prevalent [
9,
10]. Machine vision can capture image features such as texture, size, and appearance, while near-infrared cameras provide spectral information. By combining image and spectral data, seed categories can be effectively distinguished. However, as the number of seed categories increases, distinguishing visually similar seeds becomes challenging, and spectral data often overlap. Researchers have combined machine vision and hyperspectral techniques to enhance classification capability. For example, Liu et al. [
11] proposed a hyperspectral rice seed purity identification method using a LASSO logistic regression model (LLRM), selecting specific spectral bands and performing classification with LLRM. Ge et al. [
12] introduced an instance difficulty-weighted k-nearest neighbor algorithm (IDKNN) for hyperspectral rice seed classification, improving accuracy by focusing on variety-specific recognition performance. Jin et al. [
13] combined spatial and spectral features of wheat seeds, extracted features via PCA, and classified the seeds using SVM. Similarly, Guo et al. [
14] employed a least-squares support vector machine (LS-SVM) classifier to build a corn seed classification model, optimizing it using Pearson correlation coefficients for better performance. Huang et al. [
15] used a successive projection algorithm to select the optimal wavelengths for corn seeds, simplifying classification features with PCA and multidimensional scaling before employing LS-SVM, achieving superior performance compared to raw data. Liu et al. [
16] developed an MCARS-GA-SVM model based on Raman spectroscopy data for corn seed classification and proposed an MCARS-SPA-GA-SVM model with only three variables, demonstrating the feasibility of a real-time coated corn seed detection system. Xia et al. [
17] integrated spectral features, imaging features, and their combinations using multilinear discriminant analysis to select the optimal wavelengths, classifying corn seeds with a least-squares support vector machine. This approach achieved higher classification accuracy compared to models using full-spectrum average spectra.
The above studies primarily relied on machine learning algorithms to classify hyperspectral data. However, machine learning models such as SVM, PCA, and random forest face difficulties in handling complex data and are highly dependent on data quality [
18].
In recent years, with the rapid development of deep learning, its applications have become increasingly widespread. Deep learning has demonstrated superior capabilities in feature extraction and handling complex data. Many researchers have used deep learning techniques combined with hyperspectral technology for seed classification, achieving better results. Víctor et al. [
19] classified rice seed varieties using a combination of hyperspectral imaging and deep learning, achieving classification accuracies of 91.33% and 89.5% for seeds exposed to different high-temperature durations using 3D-CNN. Li et al. [
20] proposed PA-3DCNN for classifying hyperspectral images of pumpkin seeds. By introducing a positional attention mechanism, they successfully classified 75 pumpkin seed varieties with improved accuracy and efficiency. Zhang et al. [
21] established classification models using logistic regression, support vector machines, convolutional neural networks, recurrent neural networks, and long short-term memory networks. They used fused features as model inputs and classified coated
corn seeds based on these fused feature models. Xu et al. [
22] proposed a convolutional neural network architecture based on feature selection (CNN-FES) to select important information from spectral data and used a CNN–ATM network to classify one-dimensional spectral data of defective
corn seeds. Zhang et al. [
23] used a deep convolutional neural network to classify spectral information from the endosperm side of corn seeds in the 450–979 nm wavelength range, outperforming the KNN and SVM models in most cases. Wang et al. [
24] applied a CNN-LSTM framework for hyperspectral sweet corn seed classification and compared it with various machine learning and deep learning models. CNN-LSTM exhibited superior performance, with a significantly higher accuracy than that of machine learning models.
This study focused on the classification of corn seed varieties, aiming to achieve accurate, rapid, and non-destructive classification. Traditional classification methods, although reasonably accurate, often rely on expensive equipment and are time-consuming, making them unsuitable for practical applications. To overcome these limitations, researchers have attempted to integrate hyperspectral imaging technology with machine learning and deep learning approaches. However, these methods still face several critical challenges. First, image-based classification methods rely on the texture and appearance of seeds, but the subtle differences in the appearance of most seeds make it difficult to effectively distinguish between different categories. Second, while classification methods based on hyperspectral feature extraction provide richer spectral information, spectral overlap among varieties often results in interference, significantly affecting classification performance. Additionally, hyperspectral data are characterized by high dimensionality, which increases the complexity of dimensionality reduction and feature extraction. Improper wavelength selection or the lack of effective band information can substantially impair classification accuracy [
25]. Therefore, existing algorithms exhibit significant limitations in feature extraction, data balance, and multi-class classification. A more efficient classification method that integrates image and spectral information is needed to enhance classification accuracy and robustness.
To address the aforementioned challenges, this study combined spatial domain image and hyperspectral information, leveraging deep learning techniques to propose a corn seed classification scheme. This scheme aims to address problems such as the confusion of image features and the lack of usable wavelengths after spectral dimensionality reduction. By extracting image features and multidimensional spectral information of corn seeds, the method captures multimodal features of the target, avoiding the problem of insufficient diversity of single features and improving classification performance. Furthermore, by extracting spectral and spatial features from hyperspectral images, this scheme achieves the fusion of local and global features, enabling fast and accurate classification of corn seeds. The main contributions of this study are as follows.
- (1)
High-resolution hyperspectral images of multiple corn seed varieties were collected, and an image data preprocessing method was designed. Through sliding window sampling of the raw images, the images and corresponding labels required for training were extracted, completing the construction of a corn seed dataset.
- (2)
A classification network, DualTransAttNet, based on a dual attention mechanism, is proposed. Through the extraction of local and global features, combined with spectral and image feature information, the network achieves fast and effective classification of corn seeds.
2. Materials and Methods
2.1. Overall Flowchart of the Corn Seed Classification System
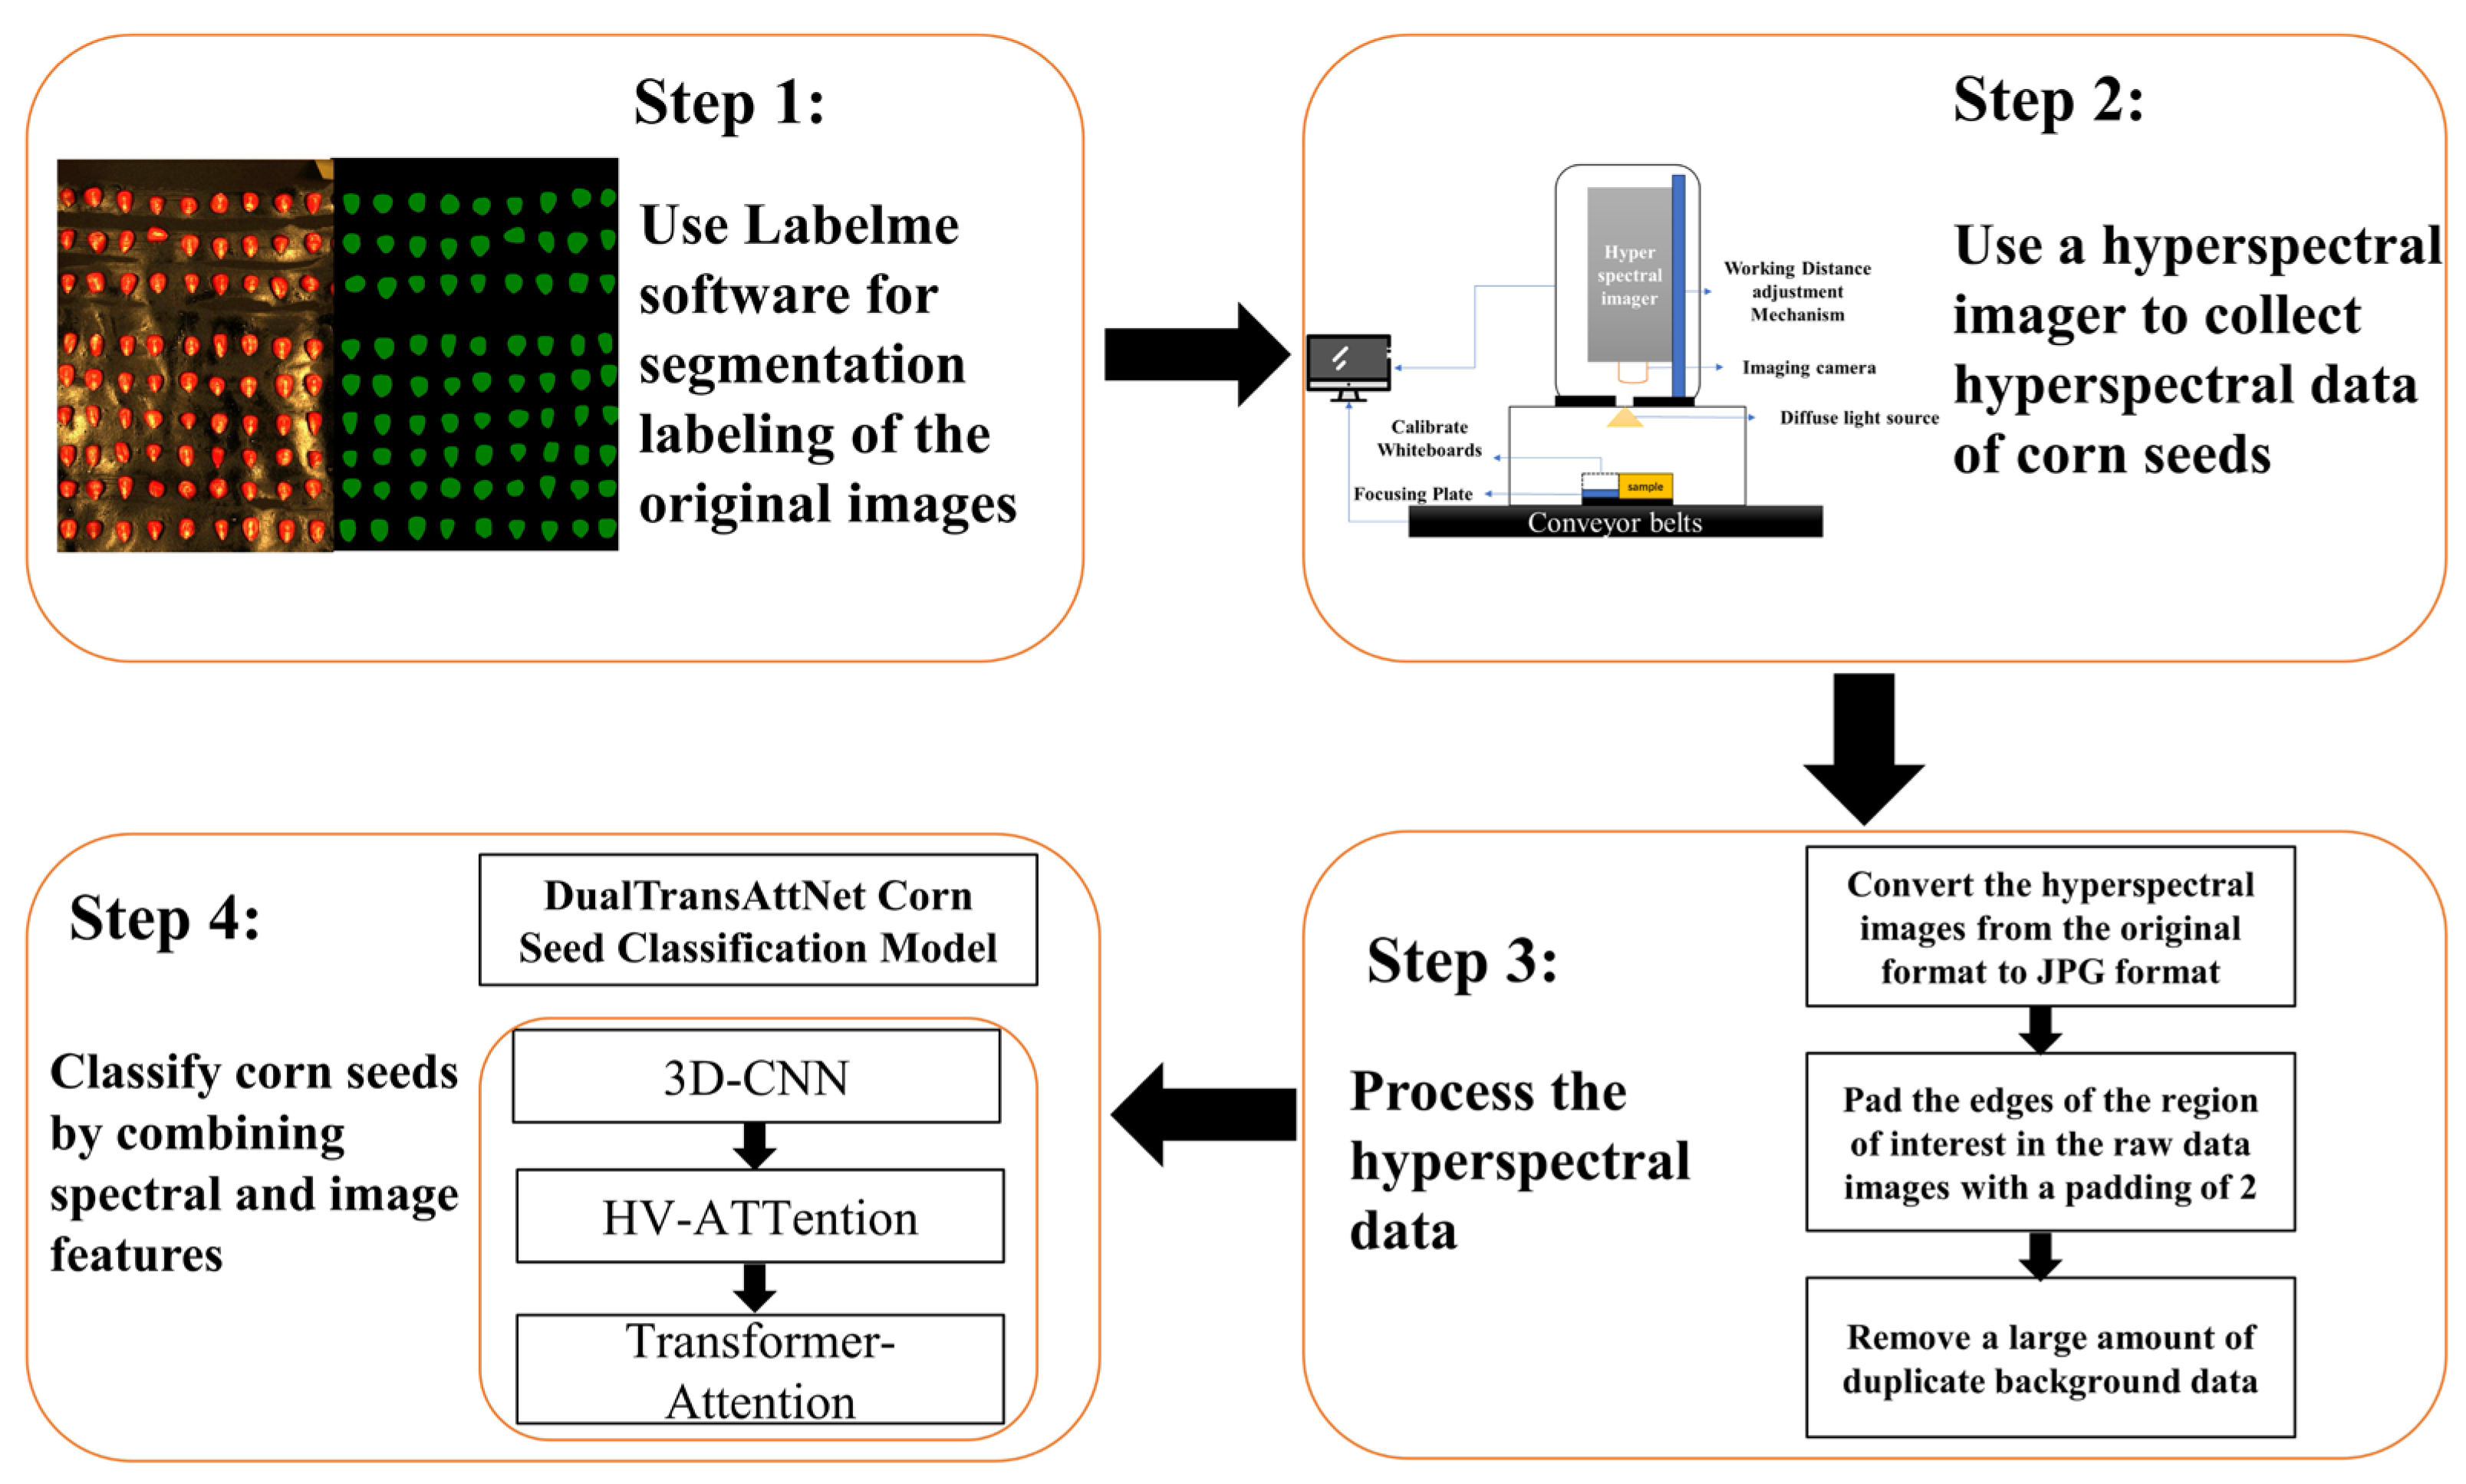
The corn seed classification system proposed in this study is outlined in
Figure 1 and consists of four main stages. First, the raw corn seed images are segmented and annotated using Labelme software (5.1.1) to extract the seed regions. Next, a hyperspectral imaging device is used to acquire hyperspectral data of the corn seeds, ensuring that the data encompass the target features. The hyperspectral data are then converted from their original format to JPG format, with the edges of the region of interest (ROI) padded (padding size of 2) to remove extensive redundant background data. Finally, by combining spectral and image features, the DualTransAttNet model—integrating 3D-CNN, HV-Attention, and Transformer-Attention modules—is employed to classify the corn seeds.
2.2. Experimental Samples
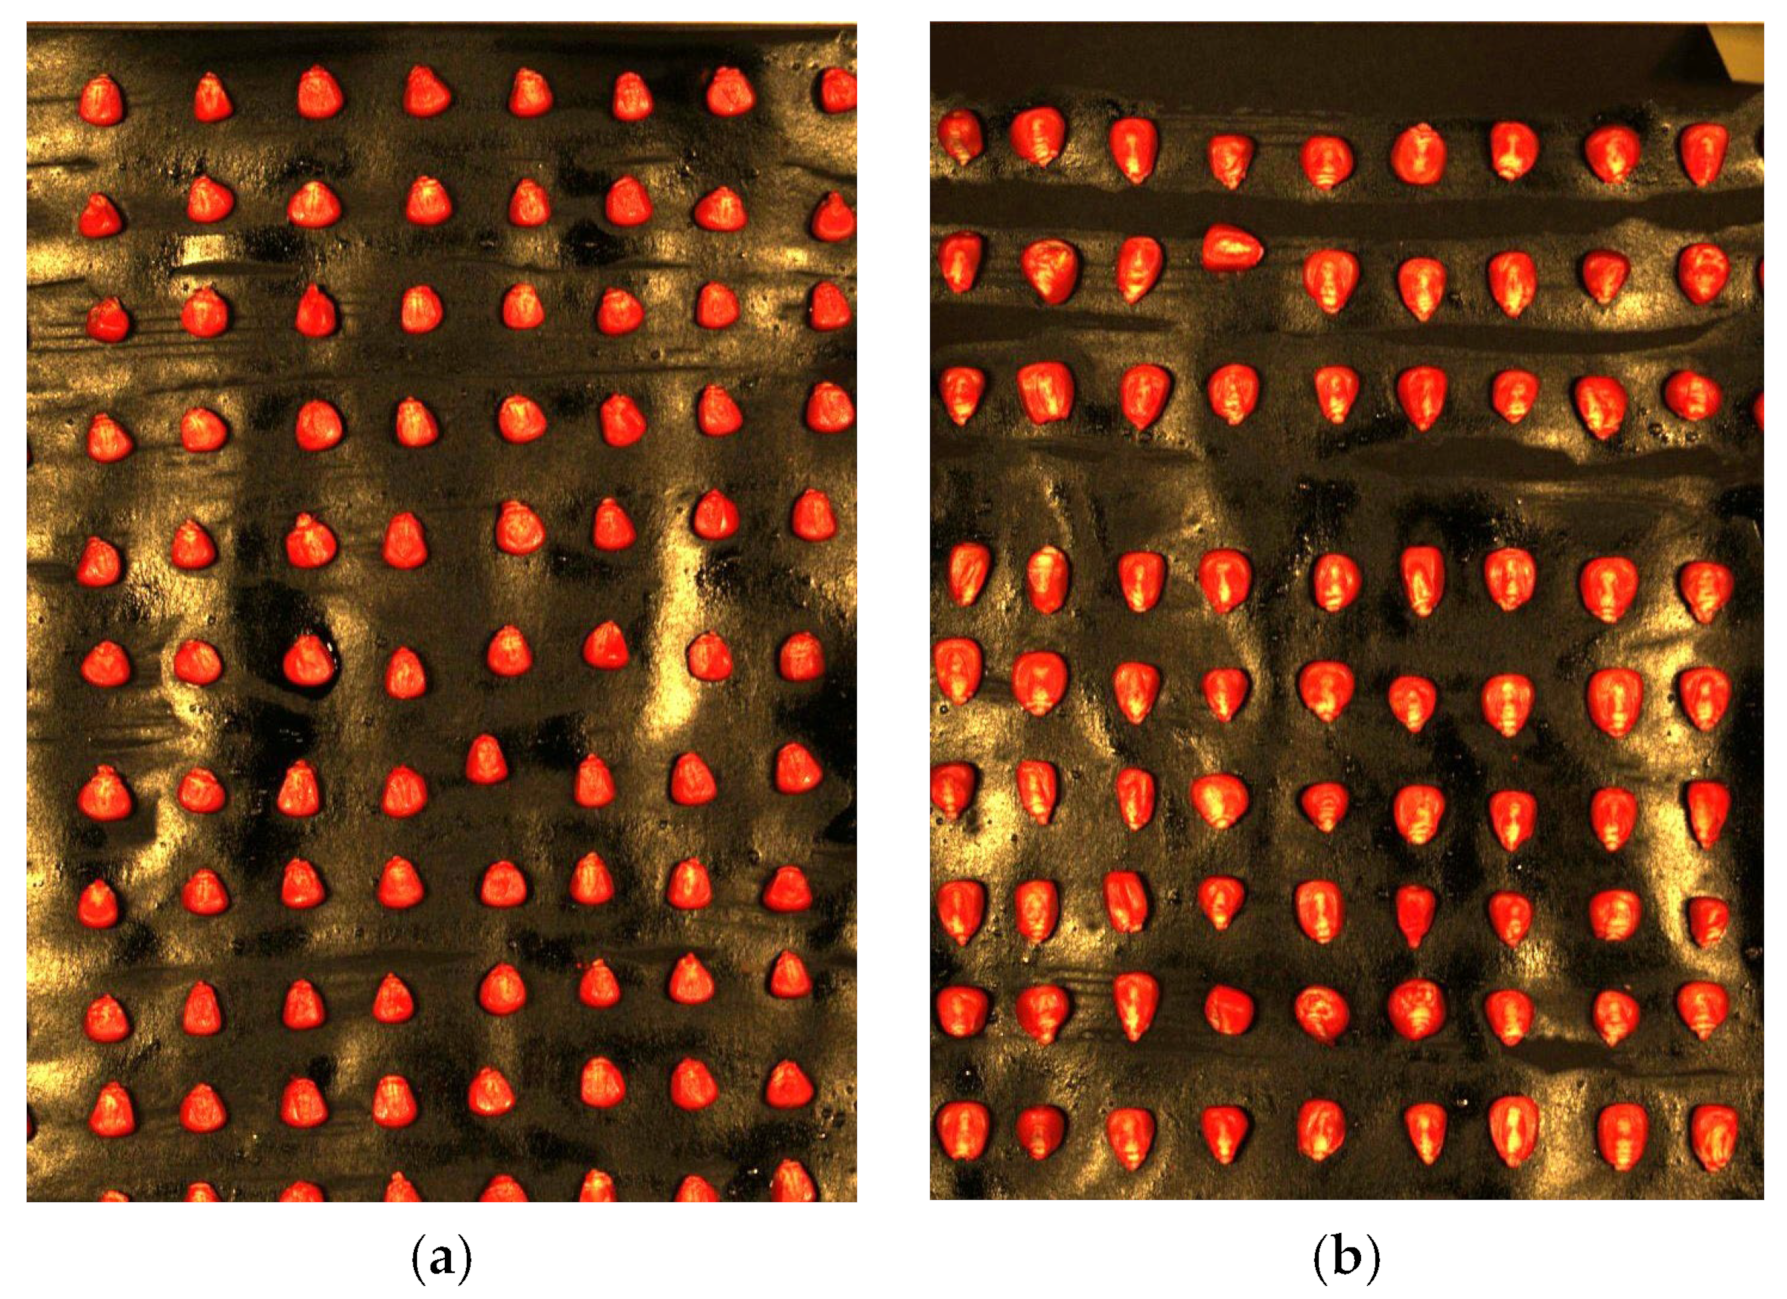
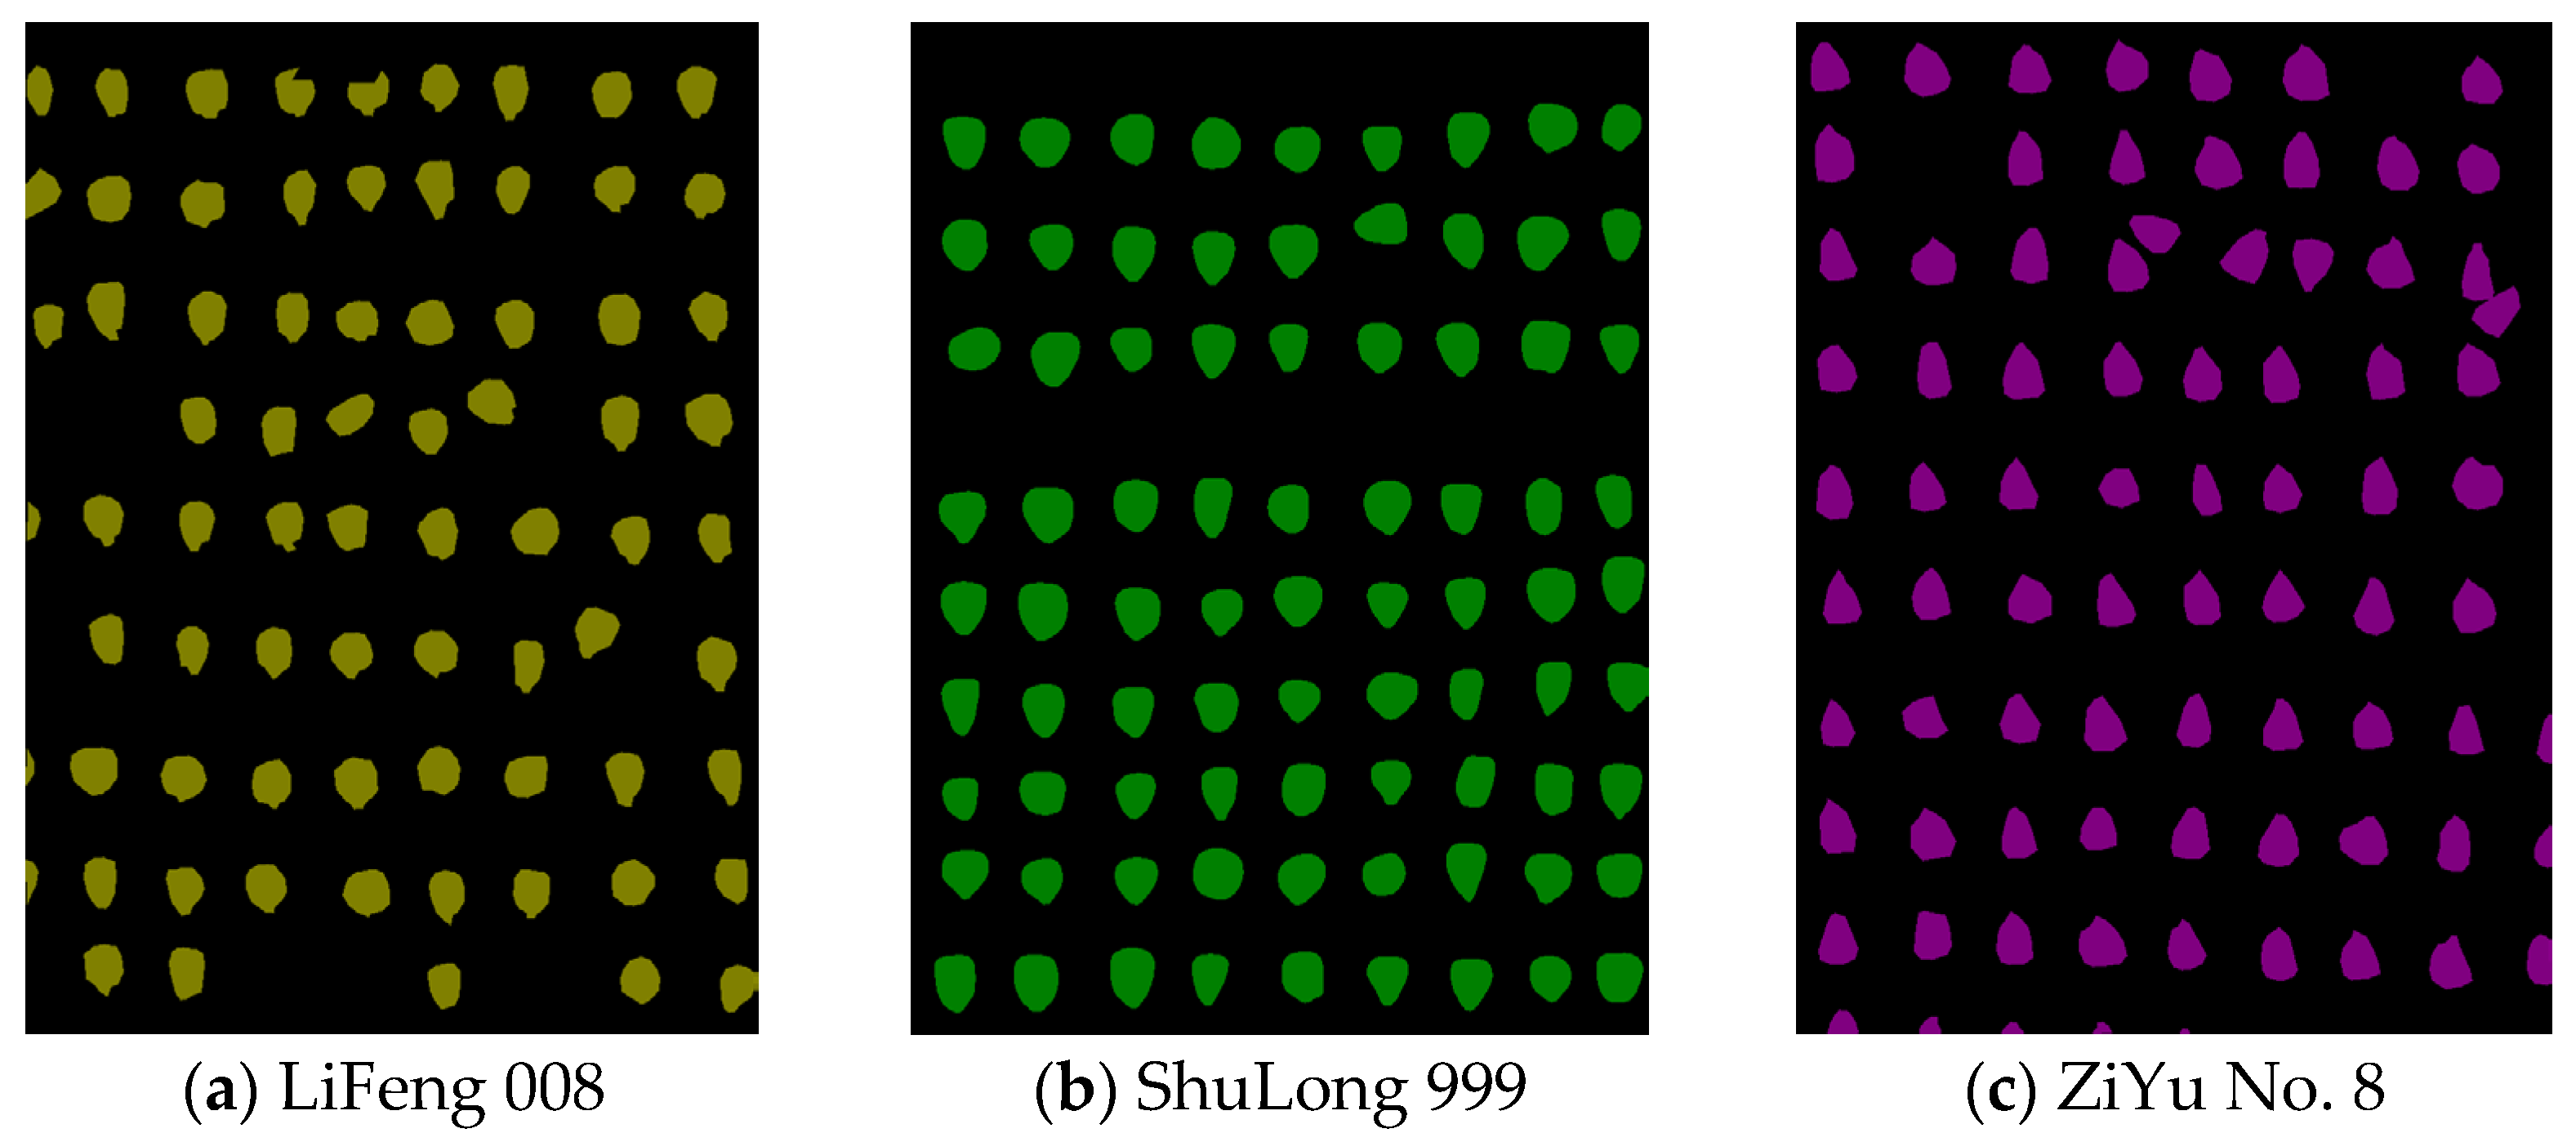
This study collected six widely cultivated corn varieties from the southwestern region of China, representing the primary characteristics of corn cultivated in this area. These varieties include Wanke 818, Shulong 999, Lifeng 008, Aotiannuo 75, Ziyu No. 8, and Hechuang 599. All seeds were sourced from a reputable agricultural product distributor affiliated with Sichuan Agricultural University in Ya’an, Sichuan Province, China. The purity of each corn variety was confirmed using quality certification documents provided by trusted seed production companies.
To ensure uniformity among the experimental samples, 720 corn seeds were selected based on their consistent size, full kernel appearance, and the absence of visible mechanical damage or developmental defects. During the selection process, a high-resolution imaging device was used to standardize the measurement of seed appearance, further ensuring sample consistency. The selected seeds were categorized based on variety and labeled as Classes 1 through 6 for subsequent experimental analysis. Throughout the analysis, data processing was conducted using software such as ENVI 5.3 and Python 3.8, ensuring scientific rigor and reproducibility.
Figure 2 presents a selection of corn seed samples from the segregated varieties.
2.3. Hyperspectral Image Acquisition
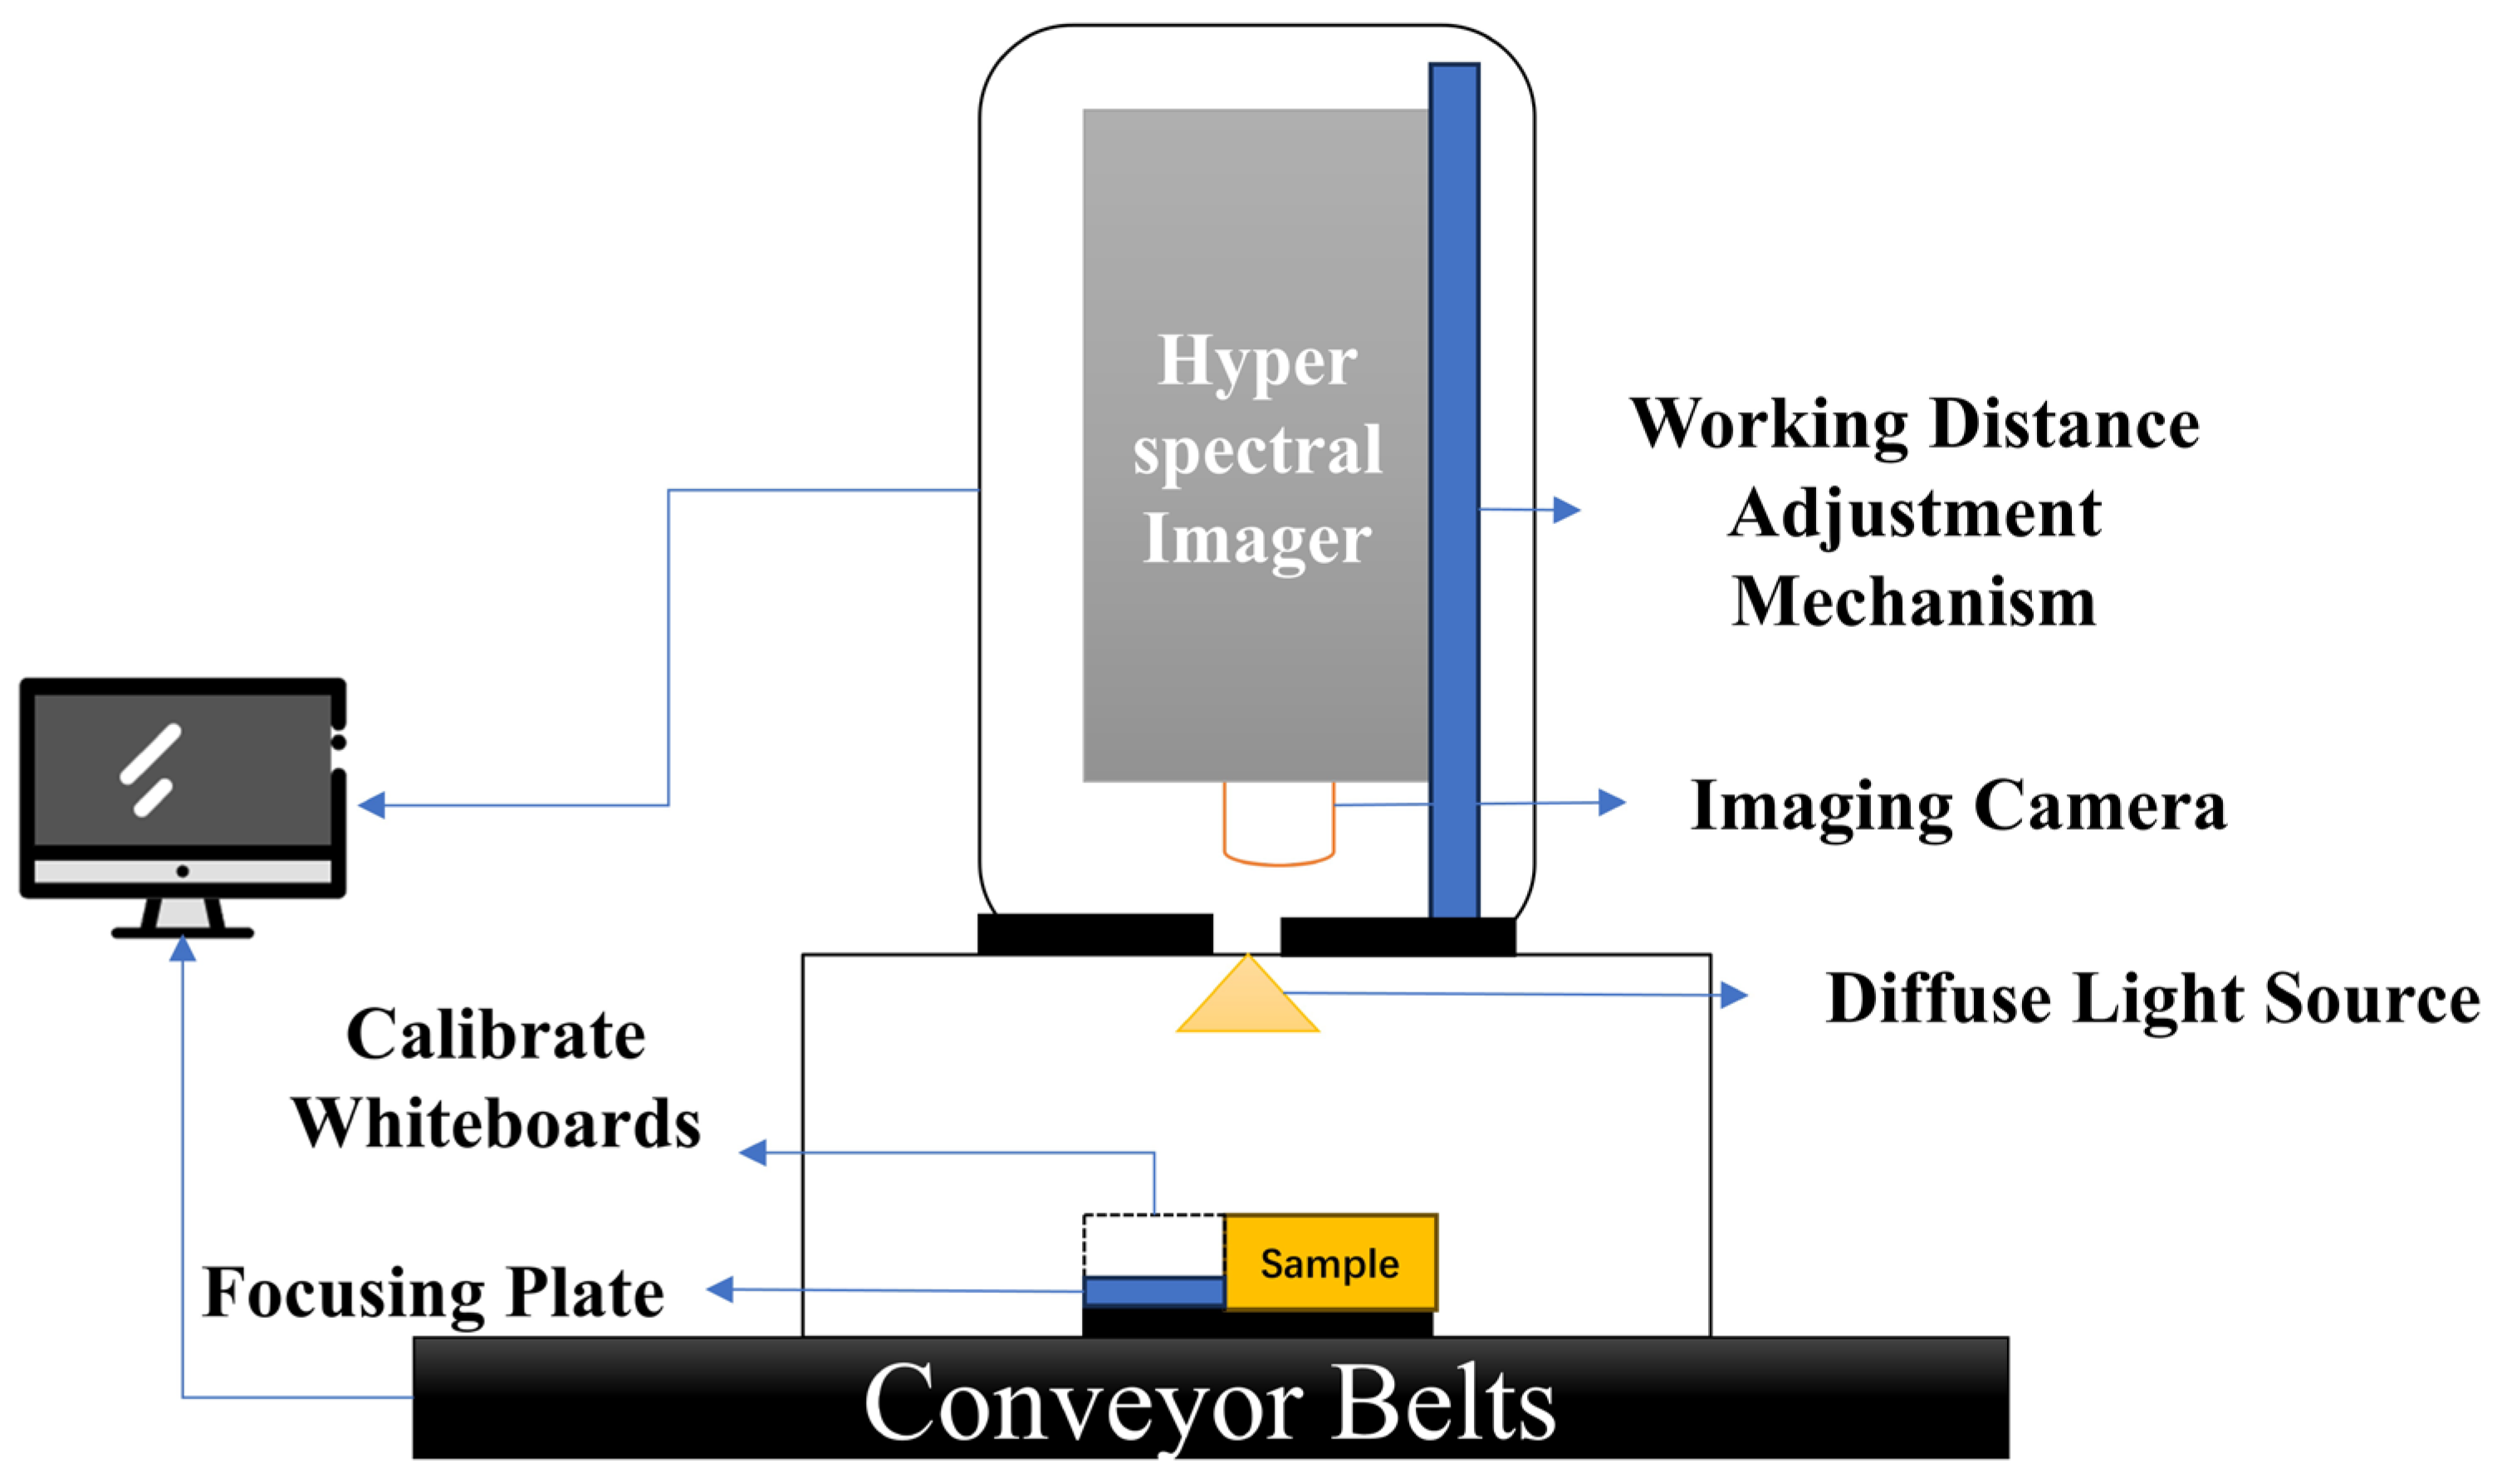
In this study, hyperspectral images of corn seeds were collected using a hyperspectral imaging system. The system primarily consists of a uniform light source, a spectral camera, an electronically controlled moving platform, a computer, and control software. Its structure is shown in
Figure 3. The system is capable of capturing data in three standard spectral ranges: 400–1000 nm, 900–1700 nm, and 1000–2500 nm. Additionally, it can be equipped with a compact conveyor belt for continuous hyperspectral data acquisition of corn seeds. For this study, the spectral range of 400–1000 nm was used.
The process of hyperspectral image acquisition is as follows. First, corn seeds were placed on a pure black background to minimize background reflection while ensuring uniform illumination to reduce external light interference. The LUMENERA_INFINITY camera integrated into the hyperspectral imaging system was then used to capture hyperspectral images of the corn seeds. The exposure time was set to 5.952 s, and the spectral range was selected as 400–1000 nm. The corn seeds were arranged uniformly in rows and columns, with the germ side facing upward. The system captured data continuously across 256 wavelengths, resulting in a hyperspectral image with dimensions of 1081 × 696 × 256.
During the spectral data acquisition process, factors such as background, lighting, and noise can significantly affect the accuracy and stability of the data [
26]. To reduce these interferences and improve the precision of corn seed spectral data acquisition, the corn seeds were placed on a pure black background to minimize background reflection and unnecessary light interference. Additionally, since the germ side contains richer characteristic information, the seeds were arranged with the germ side facing upward in a uniform grid pattern.
2.4. Hyperspectral Image Preprocessing
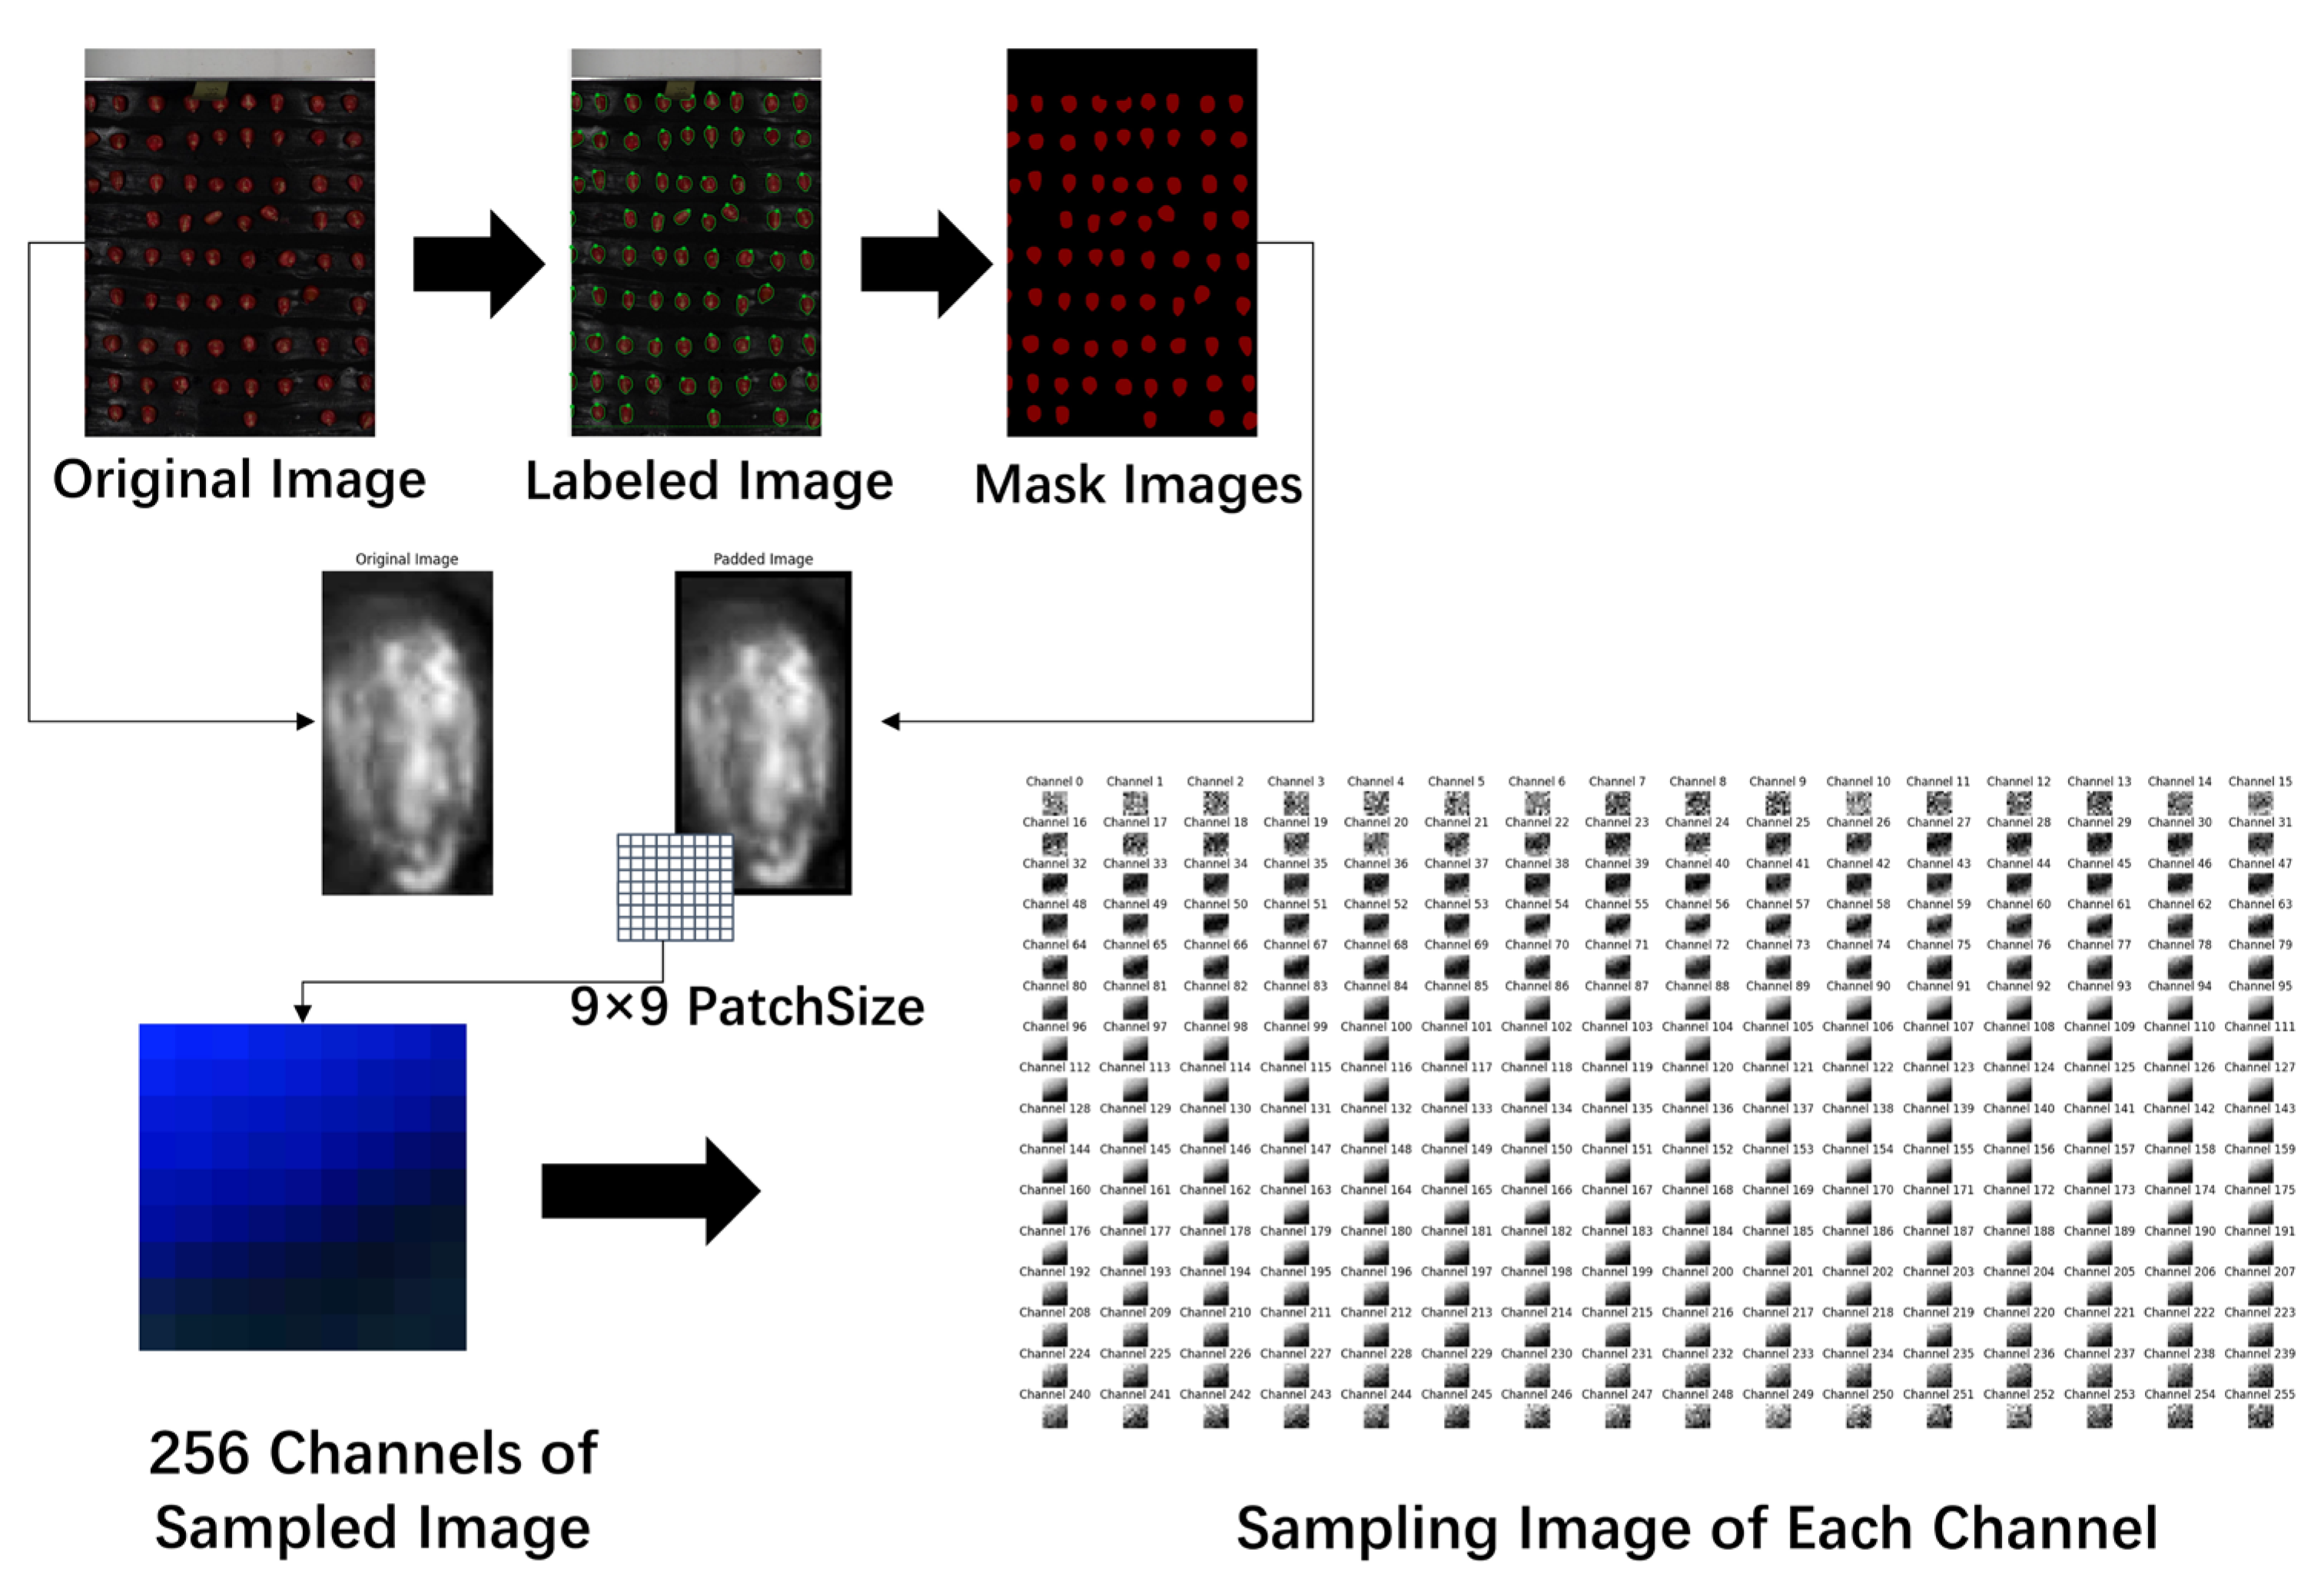
To better extract the spectral information of the samples, this study performed data processing on the original hyperspectral images. The processing workflow, illustrated in
Figure 4, is divided into four main steps, as follows.
(1) The collected hyperspectral images were converted from their original format to JPG format. The Labelme tool was then used to annotate individual corn seed images, designating each seed as the region of interest (ROI) within the entire image. This process also generated mask images for different seed samples, as shown in
Figure 5.
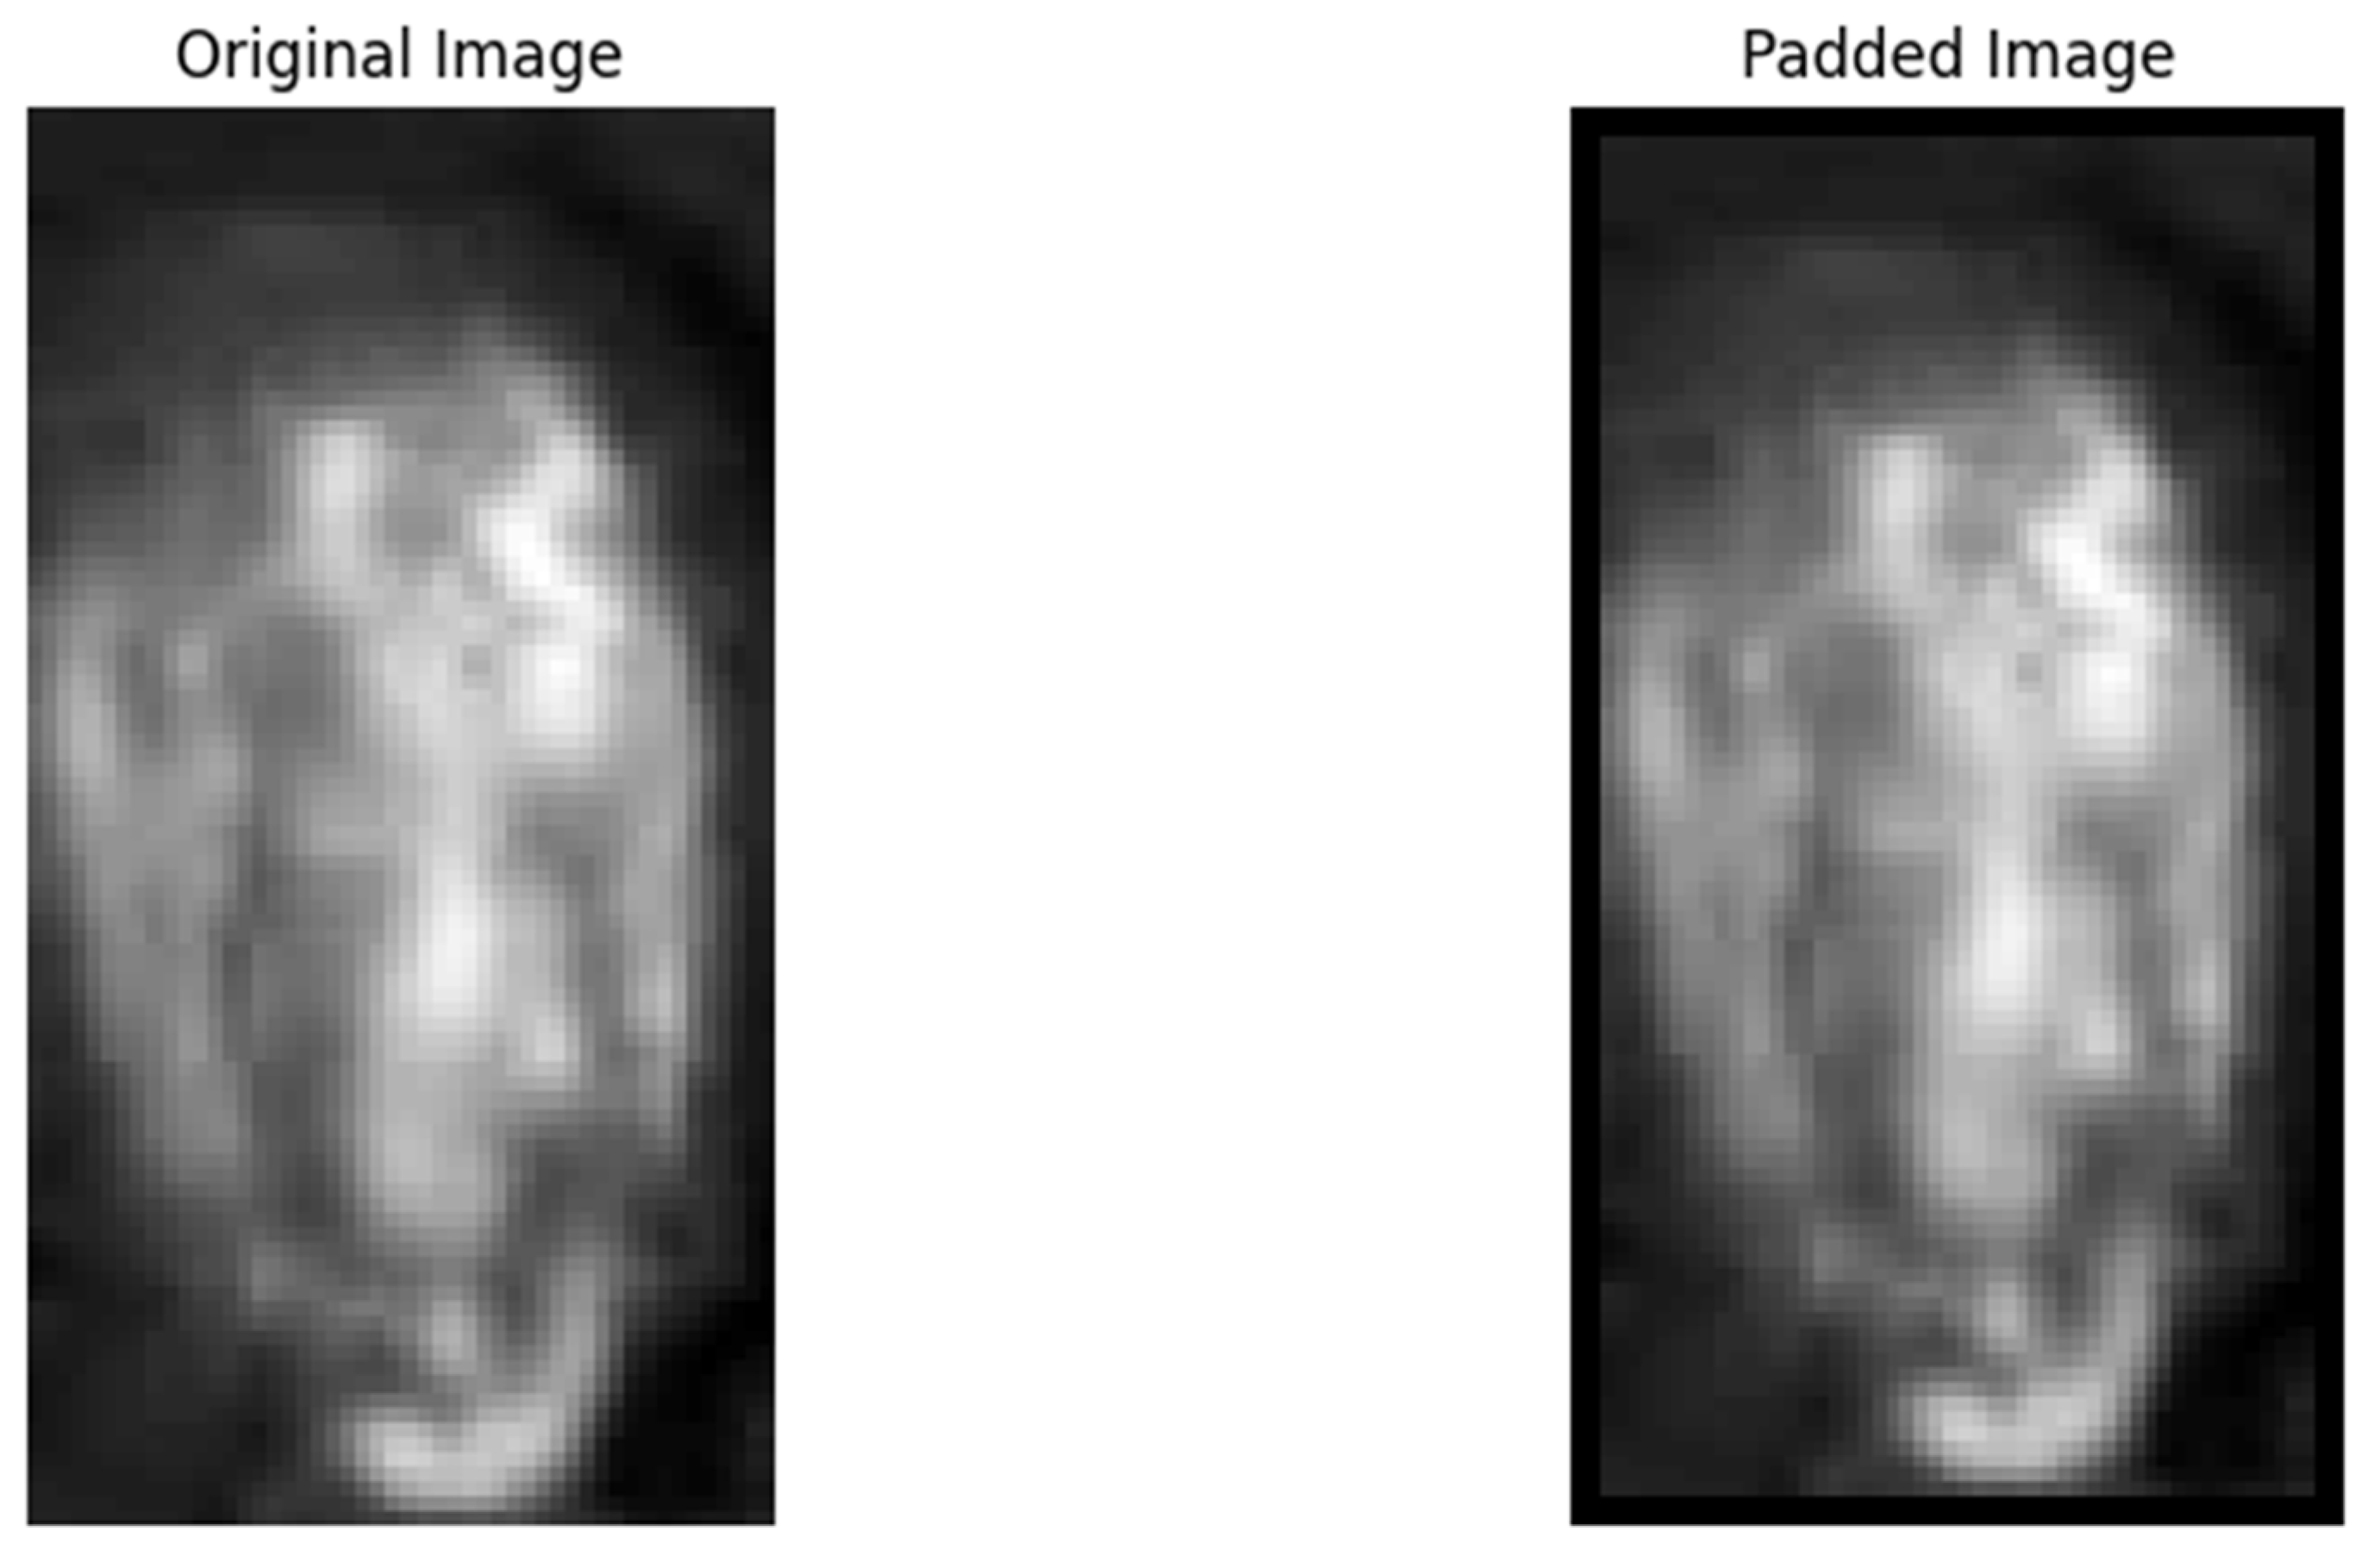
(2) The raw data were normalized to scale the values within the range of 0–1, while the mask images retained their original format. Padding of 2 pixels was applied to the edges of the region of interest (ROI) in the raw data images to ensure the extraction of edge feature pixels, as shown in
Figure 6.
(3) A 9 × 9 patch size was set to perform sliding window sampling on the padded images, which were then saved in npy format. Each sampled image and its corresponding label were aligned according to the sliding window, with the label of the central point used as the label for the sampled image.
(4) Due to the sliding window sampling, a large number of redundant background images were generated in the saved files. To avoid excessive duplicate data and ensure data balance across categories, the maximum number of background files was set to 12,000. The background files were randomly shuffled, and a random subset of background files were deleted to reduce the number to 12,000 while retaining other labeled files to ensure the quality of the training data.
2.5. DualTransAttNet Classification Model
In corn seed classification, spectral information and image information each provide key features at different levels. Spectral information reflects the internal chemical composition and physiological status of seeds, such as moisture content and protein levels. This is particularly advantageous for distinguishing seed varieties with similar appearances but different compositions. In contrast, image information primarily describes visual features such as seed shape, color, and texture, making it more effective for distinguishing varieties with obvious external characteristics.
To address the needs of corn seed classification, this paper proposes a model called DualTransAttNet, which is based on the CNN and Transformer architectures. The model fully utilizes the complementarity of spectral and image information for feature fusion. The experimental results demonstrate that spectral information plays a crucial role in capturing subtle internal differences among seeds, while image information performs exceptionally well when the external features of seeds are clearly distinguishable. The combination of both types of information enables the model to extract features across multiple dimensions, significantly improving classification accuracy and robustness and providing a novel approach for the efficient differentiation of seed varieties.
To fully leverage the multi-dimensional features, the network must first focus on global feature information. Especially in image processing, capturing global features from both the horizontal and vertical directions helps better recognize and distinguish subtle differences between samples. The extraction of global features reduces background interference and enhances the model’s decision-making ability.
Additionally, to capture richer feature data, it is essential to collect both local features and long-range dependencies. Local features are crucial for capturing fine details, while long-range dependencies help understand complex structures and contextual relationships.
To address the three aforementioned requirements, this study proposes the DualTransAttNet classification model. This model employs 3D-CNN for initial feature extraction to capture multi-dimensional feature information. Additionally, it introduces the HV-attention mechanism [
27], which focuses on global image feature extraction by using attention mechanisms in both the horizontal and vertical directions to reduce information interference. Finally, the Transformer module [
28] with multi-head attention is used to integrate both local and global features, enabling the model to capture long-range dependencies.
The structure of the DualTransAttNet classification model is shown in
Figure 7. This model performs feature extraction across multiple dimensions, enhancing feature representation and achieving more accurate classification results. The design of the network primarily consists of three components: 3D-CNN, HV-Attention, and Transformer-Attention. First, the input data are passed through 3D-CNN for initial feature extraction, capturing feature information across three dimensions: channel, spatial, and depth. This provides rich feature representations for subsequent feature extraction modules. After the feature extraction by 3D-CNN and 2D-CNN, the HV-Attention mechanism is introduced to focus on the image feature information. By capturing global feature information in both the horizontal and vertical directions, it reduces interference from other information and accelerates network inference. Finally, conventional convolutional neural networks (CNNs) can only capture local features and are unable to capture long-range dependencies. To address this limitation, the Transformer module, with its multi-head attention mechanism, is used to extract and integrate global features, capturing long-range dependencies and achieving better feature representation. The combination of local and global feature information through this integration further enhances the model’s performance.
3. Results
3.1. Implementation Details
This section discusses the training and validation of 77,109 corn seed samples. By employing the data processing method proposed in this study, a total of 77,109 data samples were generated, including 12,000 background images, 10,727 samples of Wanke 818 seeds, 12,826 samples of Shulong 999 seeds, 9640 samples of Lifeng 008 seeds, 9893 samples of Aotiannuo 75 seeds, 10,143 samples of Ziyu No. 8 seeds, and 11,880 samples of Hechuang 599 seeds. Finally, the data were split into training and validation sets with a 60–40% ratio, as detailed in
Table 1.
All the experiments were conducted on a Windows server with the following specifications: an Intel(R) Core(TM) i9-10900K CPU @ 3.70 GHz, 128 GB of RAM, an NVIDIA Quadro RTX 5000 GPU with 16 GB memory, and the 64-bit Windows Server 2019 operating system.
The experiment evaluated the model performance based on five metrics: model size, model inference time, overall accuracy (OA), F1-score, and Kappa coefficient. These metrics are widely used in classification tasks, each offering distinct advantages and characteristics.
Among them, OA is the most straightforward metric for assessing classification model accuracy. It is calculated as the ratio of correctly classified samples to the total number of samples. While simple and clear, the OA can be biased in cases of class imbalance, as it might favor the majority class. Therefore, it is often necessary to combine the OA with other metrics for a more balanced and comprehensive evaluation.
Here, TP represents the number of correctly predicted positive samples, TN the correctly predicted negative samples, FP the falsely predicted positive samples, and FN the falsely predicted negative samples.
The F1-score is the harmonic mean of precision and recall, providing a comprehensive evaluation of model performance. It is particularly useful for assessing imbalanced datasets, making it suitable for this study to evaluate the model’s classification capability across different categories. The formula for the F1-score is shown in Equation (2).
The Kappa coefficient is a statistical metric for evaluating the accuracy of classification models by assessing the reliability of classification results. It accounts for the possibility of chance agreement, making it suitable for multi-class classification tasks, especially with imbalanced samples. The formula for the Kappa coefficient is shown in Equation (3).
Here, represents the observed accuracy, and the expected accuracy under random classification.
During the network training process, the dataset is internally partitioned by the program according to a certain ratio into a training set and a validation set. The hyperparameters used for model fine-tuning and the software versions employed for training are listed in
Table 2. All subsequent experiments adopt this same parameter configuration.
In this experiment, hyperparameters were tuned to optimize model performance, using the training set for model training and the validation set to monitor performance. The tuned hyperparameters included the learning rate, with trials at 0.0001, 0.001, and 0.01 and ultimately the selection of 0.001; the batch size was tested at 64, 128, and 256, and 256 was ultimately selected; and the optimizer was tested with Adam, SGD, and Nadam, and Adam was finally chosen. The hyperparameter search space encompassed these parameters, and at least five distinct experimental configurations were tested to ensure the reliability and stability of the results. All experiments relied on performance metrics from the validation set for final selection, ensuring a systematic and scientifically rigorous optimization process.
Consequently, the deep learning model in this study was configured to use the Adam optimizer with a learning rate of 0.001, cross-entropy as the loss function, a maximum of 50 training epochs, and a batch size of 256. Training was performed using Python 3.8.0 and PyTorch 1.11.0.
3.2. Ablation Studies
In this part, an ablation study was conducted to validate the impact of the 3D-CNN, HV-Attention, and Transformer-Attention modules on the performance of the DualTransAttNet model. The specific results obtained are shown in
Table 3.
As shown in
Table 3, when using only the 3D-CNN module, the model’s performance was as follows: an accuracy of 0.786, F1-score of 0.773, and Kappa coefficient of 0.75. When the HV-Attention module was added to the 3D-CNN, the model’s performance significantly improved, achieving an accuracy of 0.841, F1-score of 0.832, and Kappa coefficient of 0.821. Compared to the baseline model using only the 3D-CNN, the accuracy was increased by 5.5%, the F1-score was improved by 5.9%, and the Kappa coefficient rose by 7.1%. Finally, when the Transformer-Encoder module was included alongside the 3D-CNN and HV-Attention modules, the model achieved its best performance, with an accuracy of 0.901, F1-score of 0.899, and Kappa coefficient of 0.884. Compared to the baseline model using only the 3D-CNN module, the accuracy was increased by 11.5%, the F1-score was improved by 12.6%, and the Kappa coefficient rose by 13.4%.
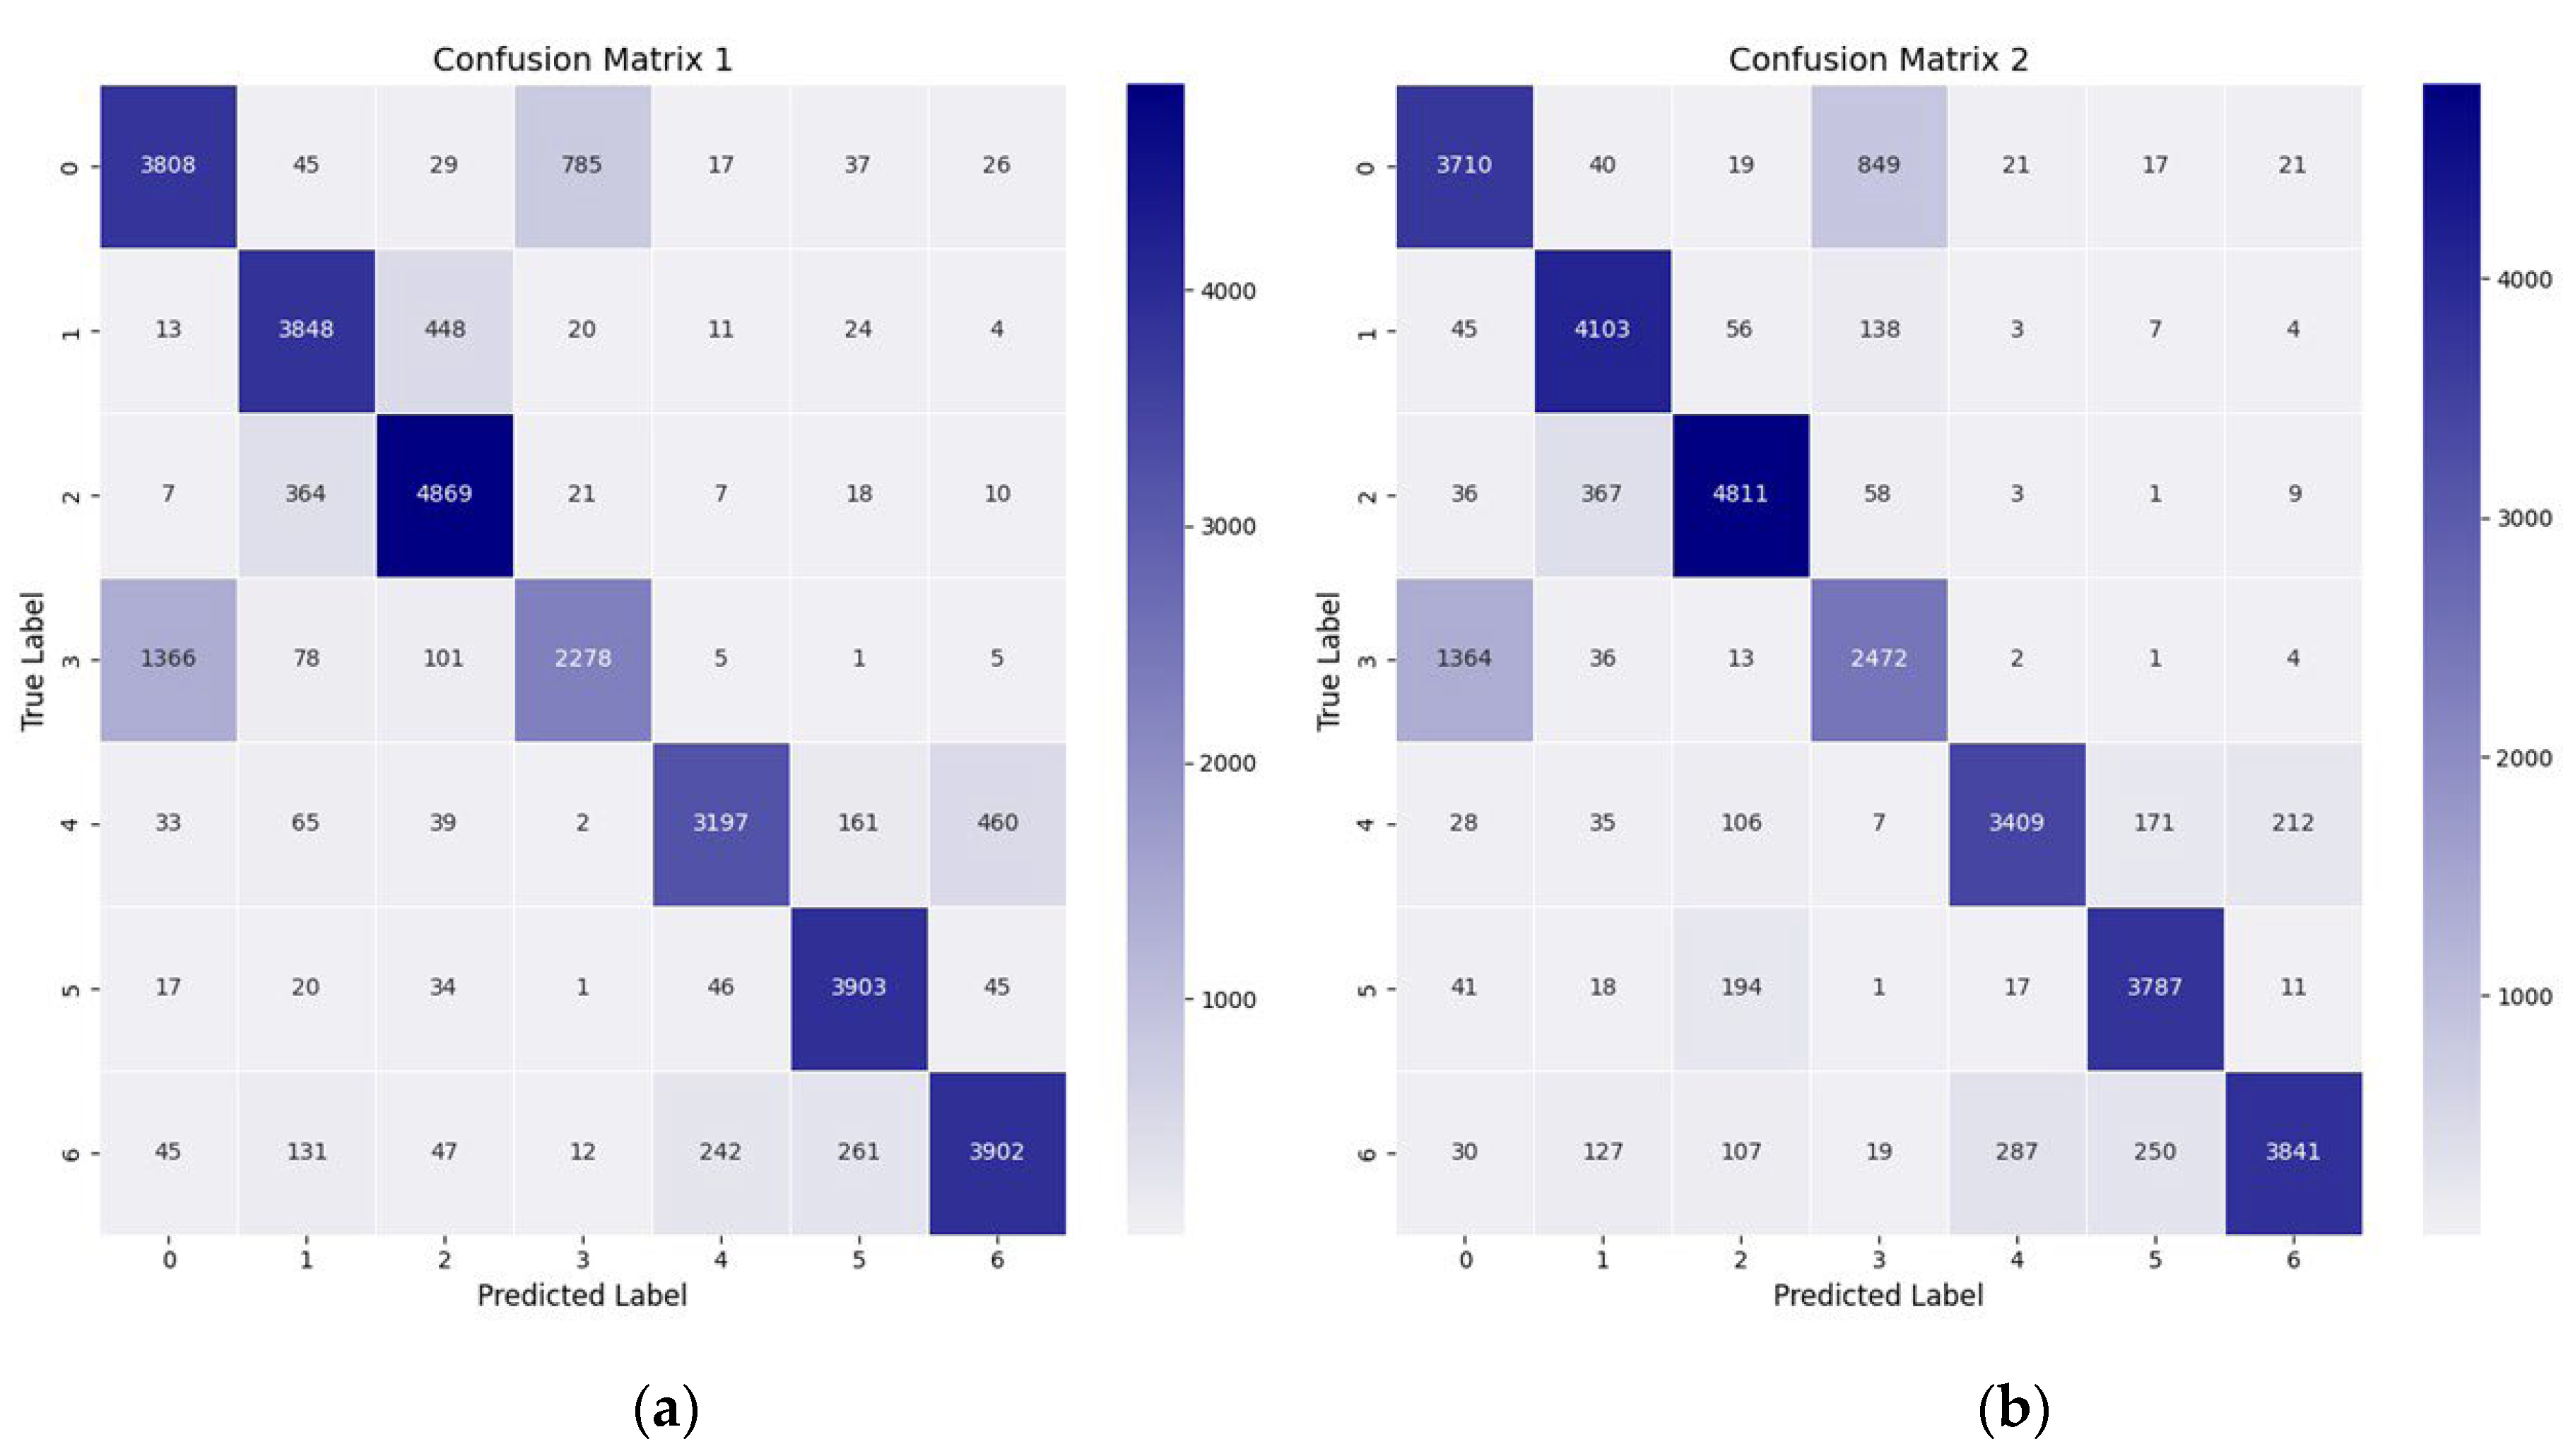
The confusion matrix for the network with only the 3D-CNN module, as shown in
Figure 8a, and for the DualTransAttNet network with the 3D-CNN, HV-Attention, and Transformer-Attention modules, as shown in
Figure 8b, indicates that DualTransAttNet predicted the correct number of seed samples for each corn variety much more accurately than the network with only the 3D-CNN module. Additionally, the misclassification rate for different corn seed varieties was lower in the DualTransAttNet network compared to the network with only the 3D-CNN module.
3.3. Comparison with Typical Classification Models
3.3.1. Comparison with Machine Learning Models
In this section, we compare the performance of the DualTransAttNet network with that of five typical machine learning classification models based on four evaluation metrics. The five machine learning classification models were support vector machine (SVM) [
29], logistic regression (LR) [
30], k-nearest neighbors (k-NN) [
31], decision tree (DT) [
32], and random forest (RF) [
33]. The specific experimental results are shown in
Table 4.
As shown in
Table 4, the SVM model had an overall accuracy of 0.539, F1-score of 0.502, and Kappa coefficient of 0.45. However, it had the longest inference time at 2.7710 ms, making its overall performance moderate. The logistic regression model had an overall accuracy of 0.524, F1-score of 0.486, and Kappa coefficient of 0.441, showing poor performance. Despite this, it had the fastest inference time of 0.0007 ms. The K-nearest neighbors (K-NN) model showed a slight improvement over the first two models, with an overall accuracy of 0.593, F1-score of 0.591, and Kappa coefficient of 0.524. However, its inference time was relatively long at 1.5657 ms. The decision tree model performed the worst among all the models, with an overall accuracy of only 0.498, F1-score of 0.498, and Kappa coefficient of 0.413. Nevertheless, it had a relatively fast inference time of 0.0015 ms. The random forest model showed the best performance among the machine learning models, second only to the DualTransAttNet model, with an overall accuracy of 0.669, F1-score of 0.665, and Kappa coefficient of 0.612.
The proposed DualTransAttNet model demonstrated the best performance among all the models, significantly outperforming other machine learning models in terms of the overall accuracy, F1-score, and KAPPA metrics. Specifically, the overall accuracy reached 0.901, representing a 34.7% improvement over random forest, 51.9% improvement over K-nearest neighbors, and 67.3% improvement over SVM. The F1-score reached 0.899, marking a 78.9% increase compared to the SVM model. The Kappa coefficient was 0.884, a remarkable 96.9% improvement over SVM. The inference speed of the model was 0.019 ms, only 0.0183 ms slower than the fastest machine learning model.
3.3.2. Comparison of Results Using Different Deep Learning Classification Models
This section compares the DualTransAttNet network with three deep learning classification models based on five performance metrics. The three models selected for comparison were 1D-CNN, 2D-CNN, and HybridSN [
34]. The detailed experimental results are presented in
Table 5.
From the table, it can be observed that the proposed DualTransAttNet outperformed all the other models in terms of accuracy across various metrics. The 1D-CNN model performed relatively well, surpassing 2D-CNN, with an overall accuracy of 0.875, F1-score of 0.872, and Kappa coefficient of 0.854. However, its model size was larger, at 2.696 MB, and the inference time was moderate at 0.006 ms. The 2D-CNN model achieved a lower overall accuracy of 0.817, with an F1-score of 0.810 and Kappa coefficient of 0.787. Although its performance was slightly worse than that of 1D-CNN, it had the smallest model size at only 1.23 MB and an inference time of 0.007 ms. The HybridSN model exhibited the lowest accuracy among all the models. Its overall accuracy was 0.792, its F1-score was 0.783, and its Kappa coefficient was 0.757. Although the model size was the largest at 2.877 MB, its inference time was the shortest among all the comparison models, at just 0.005 ms.
The proposed DualTransAttNet model achieved the best performance, with an overall accuracy of 0.901, representing a 13.72% improvement over HybridSN. The F1-score reached 0.899, which is a 14.8% increase compared to HybridSN, and the Kappa coefficient was 0.884, showing a 16.8% improvement over HybridSN, indicating better classification consistency. Although the inference time was slightly longer, it was only 0.014 ms higher than that of the fastest HybridSN model. The model size was 1.758 MB, second only to 2D-CNN.
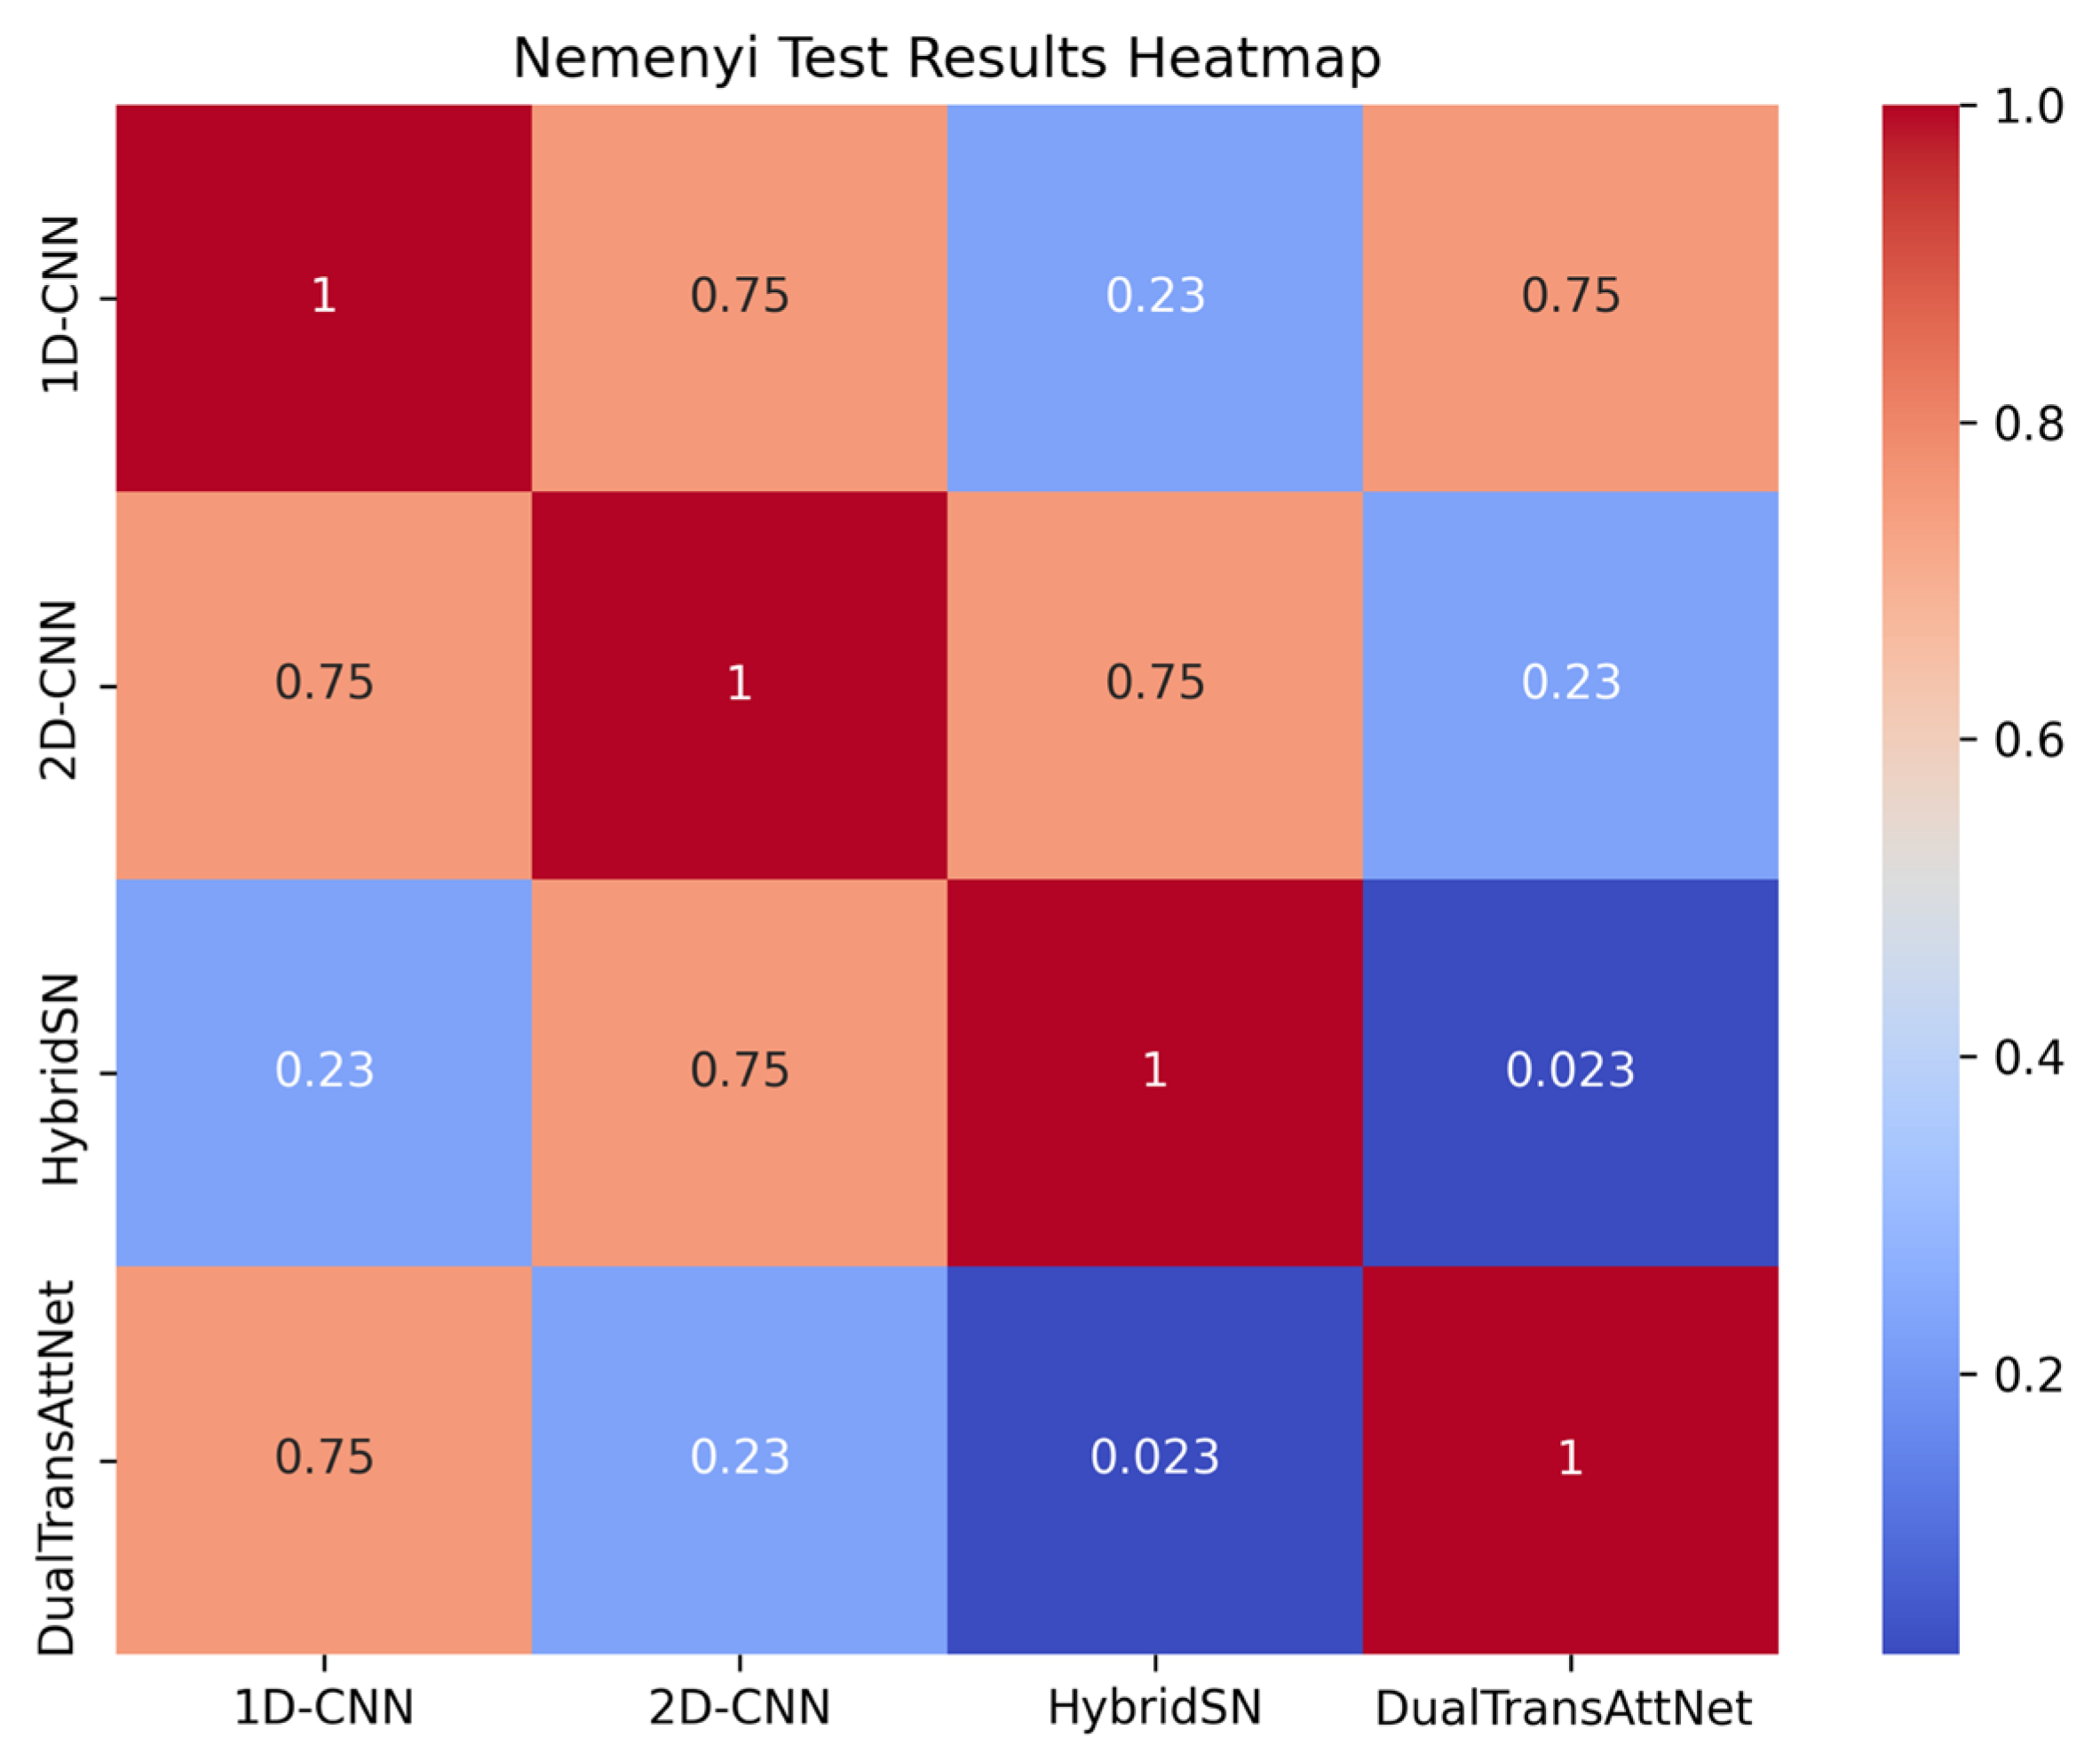
In this experiment, we performed a Nemenyi test to statistically analyze the performance of the four models in terms of the overall accuracy, F1-score, and Kappa coefficient to examine the specific differences between models. A
p-value of <0.05 indicates a significant difference between models, while a
p-value of >0.05 suggests no significant difference. The experimental results are shown in
Figure 9.
From the Nemenyi test results, it can be seen that there was a significant difference in performance between DualTransAttNet and HybridSN (p = 0.023), indicating that DualTransAttNet significantly outperformed HybridSN in terms of overall performance.
The p-values between 1D-CNN, 2D-CNN, and HybridSN were all greater than 0.05, suggesting no significant differences in performance between these models, and their performance in the three metrics was relatively close. This validates the effectiveness of the proposed method in complex task scenarios and provides strong support for future model optimization and applications.
4. Discussion
4.1. The Advantages of DualTransAttNet
The proposed DualTransAttNet model demonstrates superior performance compared to other deep learning models, primarily due to its integration of the advantages of convolutional neural networks (CNNs) and Transformers, achieving a balance between local feature extraction and global feature modeling. Traditional CNN models primarily extract local features through convolutional operations but struggle to capture long-range dependencies and global contextual information. Although 3D-CNNs can process spatial and spectral information, their ability to model long-range dependencies is still limited by the receptive field of convolutional kernels [
35]. In contrast, DualTransAttNet incorporates Transformer modules, effectively capturing richer high-dimensional data features, significantly improving classification accuracy and model stability. The model directly learns features from raw hyperspectral data, capturing the most comprehensive feature information, and has demonstrated exceptional performance in the corn seed variety classification task.
Moreover, machine learning models typically rely on manual feature extraction or simple statistical features, limiting their performance depending on the quality of feature engineering. Furthermore, they often require dimensionality reduction during data processing, which can result in the loss of crucial spectral information [
36]. In contrast, DualTransAttNet can perform feature learning directly on the original hyperspectral data without dimensionality reduction, allowing it to exhibit outstanding performance in corn seed variety classification.
4.2. Application Scenarios and Impact Analysis
The high-precision classification of corn seeds plays a crucial role in ensuring crop yield, improving crop consistency, and enhancing market value. Traditional manual sorting methods suffer from inefficiency and high misclassification rates. In contrast, the DualTransAttNet model proposed in this study, combined with hyperspectral imaging technology, significantly improves the automation and accuracy of the classification process.
The experimental results show that DualTransAttNet achieved a classification accuracy of 90.1%, with an F1-score of 89.9%, while maintaining a small model size of only 1.758 MB and a fast inference time of 0.019 ms. This performance significantly exceeded that of the comparison models, demonstrating the model’s high potential for practical application. For instance, when applied to corn seed classification, the model quickly and accurately performed the automated sorting of multiple corn seed varieties, greatly enhancing seed processing efficiency, reducing labor costs, and ensuring consistency in seed quality.
Furthermore, this model can be extended to other agricultural applications, such as crop disease detection and fruit quality assessment, providing technological support for agricultural automation and intelligence. By improving agricultural production efficiency and effectiveness, DualTransAttNet can contribute to the advancement of smart farming technologies.
4.3. Analysis of Reasons for Failed Cases and Future Perspectives
In the current study, despite the significant advantages of DualTransAttNet in handling high-dimensional data and integrating multi-dimensional features, several challenges remain in its practical application. First, the acquisition cost of hyperspectral imaging data is high, and the model training process requires substantial computational resources, which limits its widespread deployment. Hyperspectral imaging systems require the acquisition of continuous spectral band data, typically involving complex sampling equipment and high hardware costs. Additionally, the high dimensionality of hyperspectral data imposes significant demands on model storage and computational capacity, leading to long training times and high resource consumption, especially in real-world applications. Furthermore, during the training process, the model exhibits a high misclassification rate when distinguishing between similar categories, particularly LiFeng 008 (Category 3) corn seeds, which are often misclassified as background (Category 0). This misclassification primarily arises from the similarity in spectral features and the inadequacy of the sampling process. The substantial overlap in spectral and image features between the background category and LiFeng 008 corn seeds makes it challenging for the model to accurately distinguish between them, resulting in a high rate of misclassification.
Regarding data acquisition, the sampling process failed to adequately capture key spectral features of the target objects and instead gathered excessive background information, further exacerbating the misclassification problem. To address these issues, future research will focus on the following areas: First, model lightweighting will be pursued by optimizing network architectures or incorporating knowledge distillation techniques to reduce model complexity, enabling real-time inference on edge devices and alleviating computational bottlenecks. Second, multimodal data fusion will combine hyperspectral data with other sensor data (e.g., multispectral or RGB images) to enhance the model’s ability to learn from diverse data sources, improving classification accuracy and mitigating the negative effects of spectral overlap. Lastly, data acquisition optimization will focus on developing low-cost hyperspectral acquisition devices and more efficient data processing methods, reducing the barriers to hyperspectral data collection and providing better data support for the practical application of the model, particularly in smart agriculture.
By implementing these optimization strategies, future research will aim to effectively resolve the issues related to data acquisition and model training, improving the accuracy and robustness of the model in real-world applications and laying a stronger foundation for the broader use of hyperspectral imaging technology in smart agriculture.
4.4. Analysis of Model Limitations
Although this study demonstrates an effective evaluation of model performance, certain limitations remain. During the experiments, we employed the training set for model training and used the validation set for performance assessment. However, the validation set also played a role in tuning the model parameters, meaning these data were not entirely independent of the training process. Because part of the validation set was utilized in both the training and tuning stages, this experimental design could introduce bias into the performance evaluation.
Ideally, a completely independent test set should be used to evaluate the model’s generalization capability, thereby preventing any influence of the training data on the results. However, due to constraints in the experimental design, a separate test set was not employed for the final performance evaluation. Therefore, in future research, we will adopt an independent test set for performance assessment to provide a more reliable and unbiased estimate of the model’s capabilities.
5. Conclusions
This study proposes a hybrid model, DualTransAttNet, which combines the CNN and Transformer modules to address the limitations of existing classification methods for seed varieties, including time consumption, low accuracy, and potential irreversible damage to seeds. By integrating hyperspectral image and RGB image information, the model overcomes the inadequacies of feature extraction from a single information source. The combination of 3D-CNN and Transformer modules enables efficient extraction of both local and global features, significantly reducing model parameters and computational costs. This provides an efficient and practical solution for non-destructive detection and automated sorting in corn seed classification.
The experimental results show that DualTransAttNet outperformed typical machine learning and deep learning models in terms of its accuracy (90.01%), F1-score (88.9%), and Kappa coefficient (88.4%). Additionally, its network size was only 1.758 MB, and the inference time was merely 0.019 ms, demonstrating the model’s efficiency and lightweight nature. These findings validate the feasibility and superiority of integrating hyperspectral imaging technology with deep learning.
This research not only provides a new technological pathway for the seed sorting field but also lays a solid technical foundation for the intelligent development of modern agriculture.


 ,
, 

