1. Introduction
Pesticide drift is a persistent issue in the application of pesticide spraying equipment [
1]. The measurement of pesticide drift is fundamental to the study of pesticide spray drift. Currently, effective methods for drift measurement primarily include field trials and wind tunnel tests. However, field trials are subject to multiple uncontrollable factors, while wind tunnel tests do not accurately reflect real-field conditions [
2]. The ISO 22,401 [
3] method allows for a quick and easy assessment of potential spray drift from boom sprayers, with good repeatability. Potential spray drift is defined as the percentage of the initial spray volume that remains suspended in the air after the sprayer passage. It represents the fraction of spray liquid that is susceptible to drift out of the treated area by the action of air currents during the application process. An increasing number of researchers have demonstrated the effectiveness of using a field drift test bench for evaluating pesticide drift [
4,
5,
6,
7,
8,
9].
Chinese sprayer manufacturers have developed high-clearance chassis electric boom height adjustment sprayers to meet the needs of pesticide application in small and medium-sized fields. These sprayers are characterized by high-clearance, flexible steering, and automatic boom height adjustment, as well as lower prices. These features make them widely used in small- and medium-sized fields under low-wind conditions. However, most of these sprayers use front-mounted booms with non-truss structures, which are unstable during field operations. Many farmers increase the boom height to improve the sprayer’s clearance, with the boom height reaching up to 1.2 m. However, the drift resulting from these operations lacks extensive field testing, which has become a key limitation in the continuous upgrade and widespread application of the product.
Using drift measurement methods, international renowned pesticide companies and researchers have conducted extensive studies on drift control technologies. These studies have demonstrated effective drift reduction, and the resulting products were introduced worldwide. The research and development efforts primarily focus on three main areas. The first area is drift reduction through shielding technology, which involves adding external barriers around the nozzles to reduce the interference of crosswinds on fine droplets in the target area. Notable examples include the HARDI Twin Air Shield technology from Italy and the Wingssprayer drift shield technology from the Netherlands. The second area focuses on improving the drift control performance of sprayers through intelligent boom control technology [
10,
11]. A boom that is too low can result in uneven spray distribution [
12,
13] and may even cause damage by contacting the ground [
14], while a boom that is too high increases the risk of drift. Notable examples include John Deere’s boom leveling system and height adjustment technology. The third area involves optimizing the nozzle structure to alter parameters such as droplet size and droplet velocity thereby enhancing the drift control performance. Droplet size and velocity are the primary factors affecting drift. Generally, larger droplet sizes and higher velocities result in less drift [
15,
16,
17,
18,
19]. Some studies have found that nozzles with larger droplet sizes but lower droplet velocities may exhibit similar drift trends to nozzles with smaller droplet sizes but higher droplet velocities [
20]. Some researchers have studied the effects of different spray pressures on droplet size and velocity characteristics. The results show that droplet size and average droplet velocity are correlated [
21]. Optimizing nozzle structure is considered the most effective and economical method for drift reduction. Notable examples include the AirMix drift reduction nozzles from Germany, Lechler’s drift reduction nozzles, and Teejet’s drift reduction nozzles. The above research focuses on real-time boom height detection [
22], boom control [
23], and drift reduction nozzles [
24]. The evaluation of factors such as boom height and nozzle type on the effectiveness of pesticide application is important foundational data for the safe use of pesticides with sprayers. This information can provide a basis for decision-making in growers’ spraying operations. In the integration of various drift control technologies, some scholars have studied the effects of factors such as boom height and nozzle type on drift potential [
25,
26,
27,
28]. They have established the relationship between drift control techniques and spray drift reduction to further improve drift control effectiveness.
In summary, boom height and nozzle structure have a significant impact on spray drift. Understanding the relationship between boom height, nozzle parameters, and spray drift is crucial for optimizing the drift control performance of existing sprayers. To address these issues, this research focused on the widely used 3WSH-500 high-clearance sprayer (Yongjia, Linyi, China) in China. Using a droplet particle size measuring instrument and a field drift test bench, we designed experiments to investigate the relationship between boom height, nozzle type, and drift potential under field conditions, aiming to enhance the understanding of pesticide drift risks associated with unscientific increases in boom height. Furthermore, it offers practical recommendations for growers utilizing electric boom sprayers, focusing on optimal nozzle selection and boom height adjustment to effectively mitigate pesticide drift. Moreover, this research aims to contribute to the development of low-cost, effective drift control technologies by providing data accumulation and support, facilitating their widespread application in China.
2. Materials and Methods
2.1. Measurement of Nozzle Droplet Size and Velocity Under Influence of Boom Height
2.1.1. Composition of Test Bench
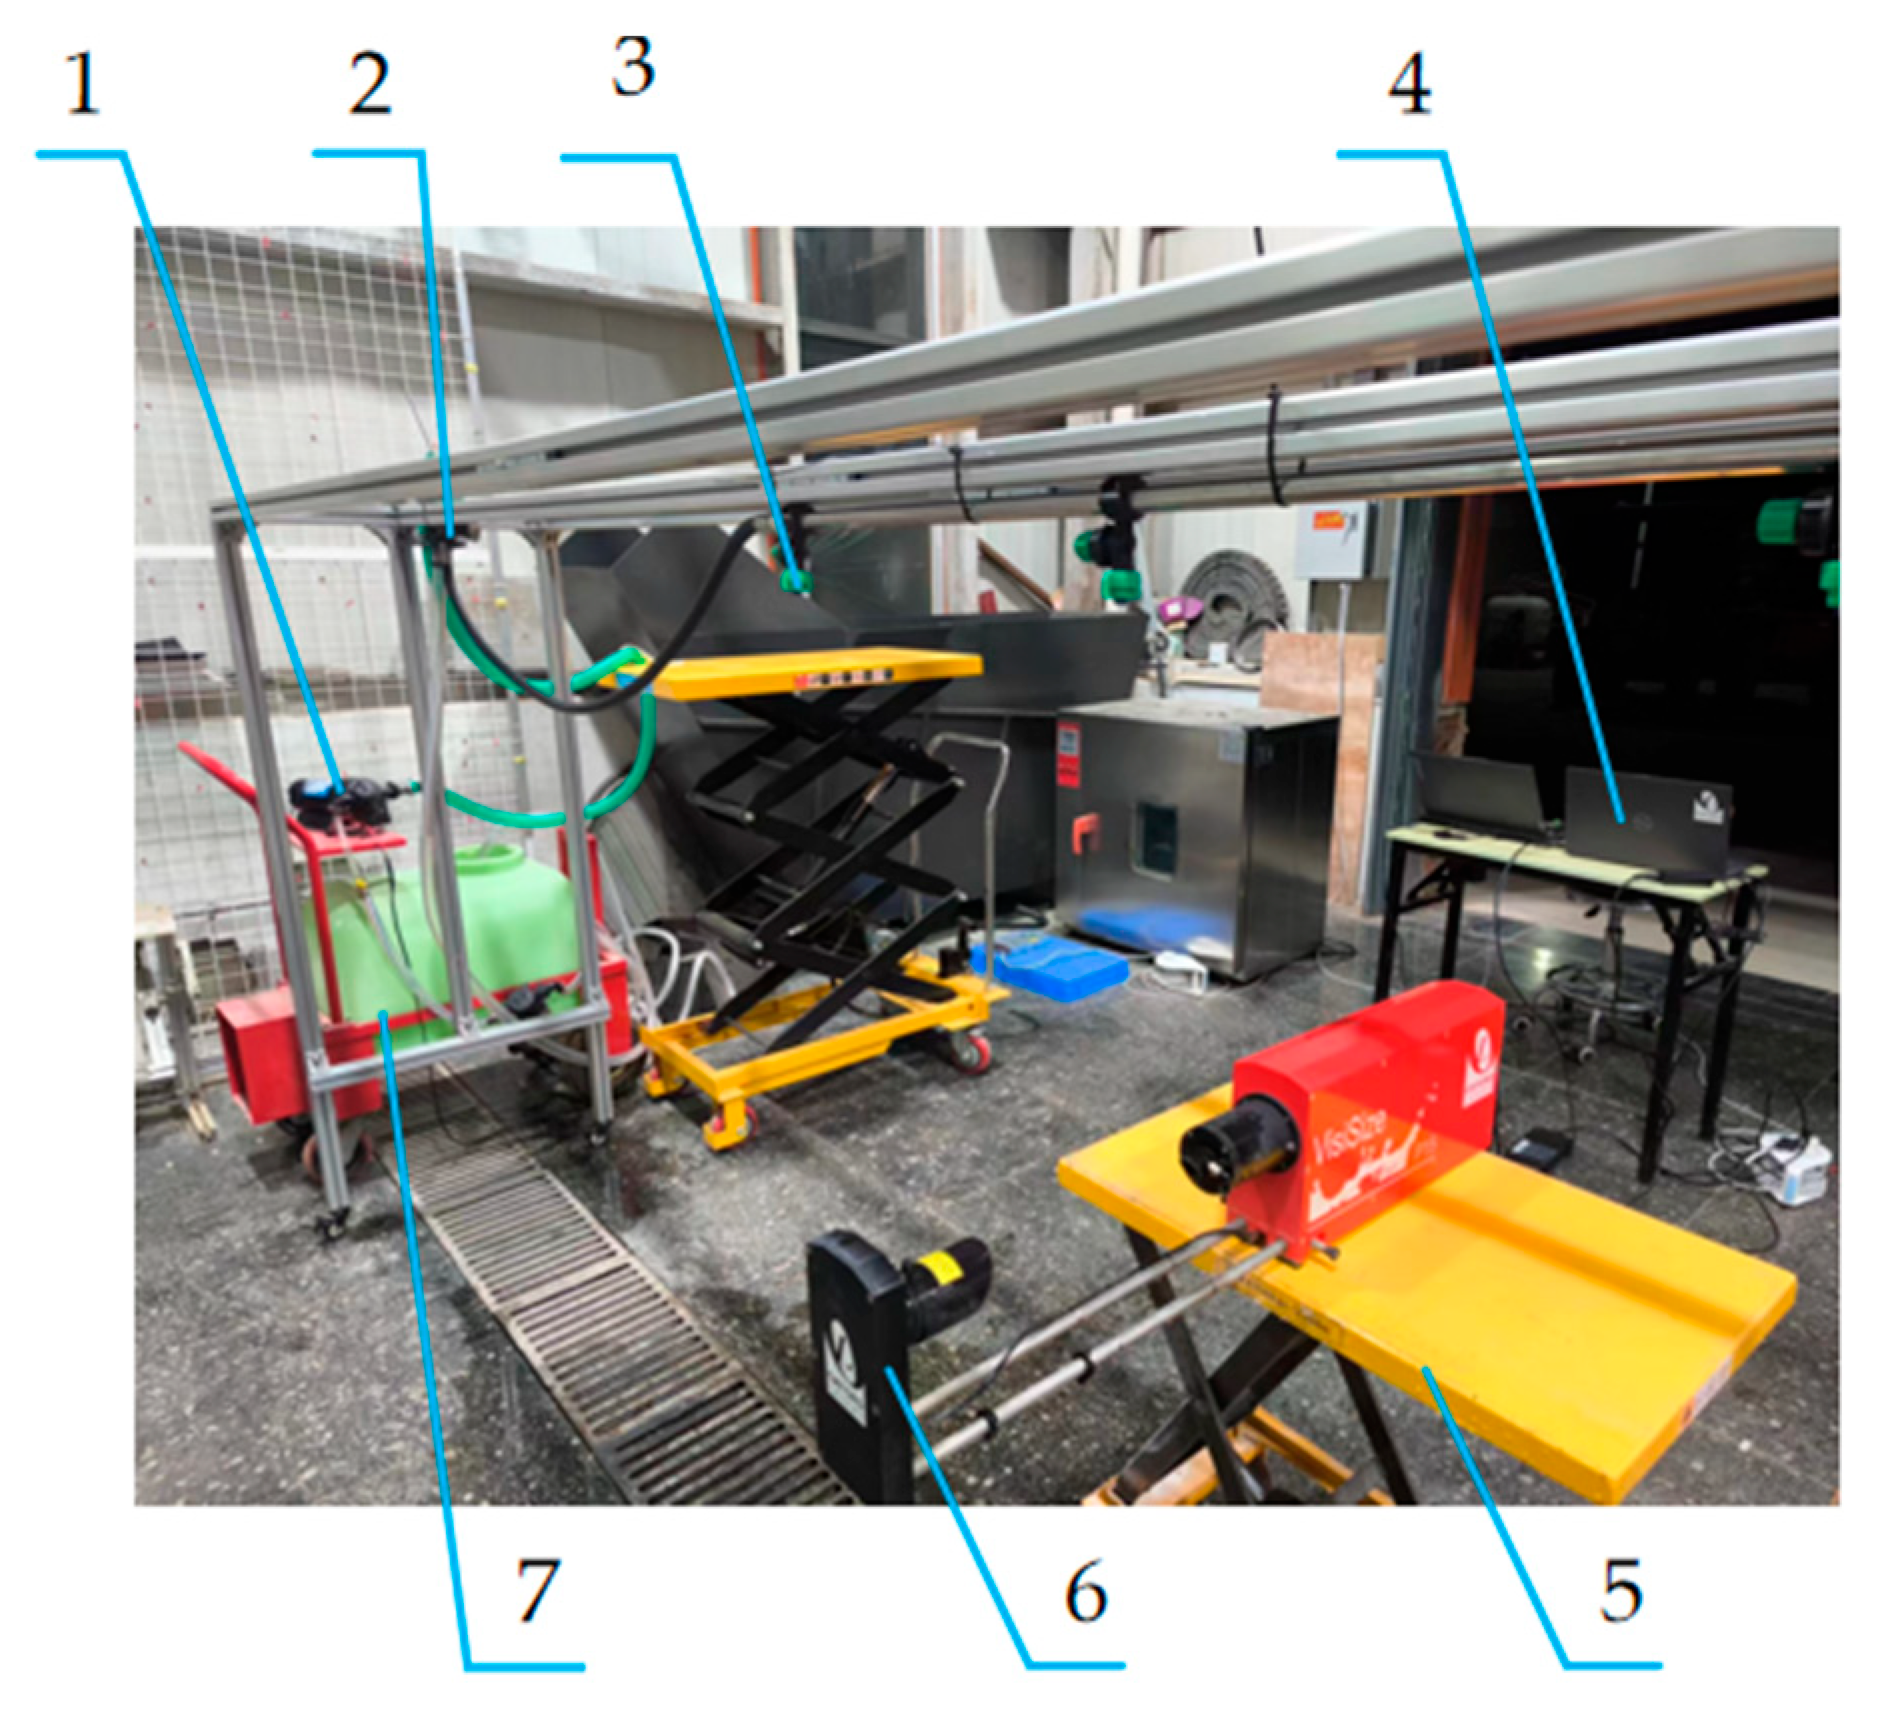
The spray quality test bench is shown in
Figure 1, and it consists of the following components: electric diaphragm pump (DP-150-24V, Shanghai Xin Xishan Industrial Co., Ltd., Shanghai, China), water tank, Oxford laser VisiSize P15 portable particle image velocimetry and particle/droplet image analysis (PDIA) (British, OXFORD LASERS Ltd., Didcot, UK), lifting platform, LI CHENG standard flat fan nozzle (VP11003, Ningbo LI CHENG Agricultural Spraying Technology Co., Ltd., Ningbo, China), Teejet standard flat fan nozzle (XR11003, Teejet Technologies Denmark ApS, Aabybro, Denmark), and water distributor (Hebei Qinong Machinery Co., Ltd., Xingtai, China). The parameters of the two nozzles are shown in
Table 1.
2.1.2. Spray Quality Measurement Methods
The droplet size and velocity measurements were conducted at the National Precision Agriculture Demonstration Base in Xiaotangshan, Beijing. The PDIA was used to measure the droplet velocity and size for the LI CHENG VP11003 and Teejet XR11003 nozzles. Through field surveys in the North China region, we found that to avoid the boom swaying and hitting crops or other obstacles, farmers typically raise the boom height, with the maximum distance from the crop reaching up to 1.2 m. Therefore, the droplet size and velocity were measured at nine vertical distances ranging from 0.4 to 1.2 m below the nozzle, with a minimum of 30,000 droplets measured. The PDIA was placed on a lifting platform, and the height of the lifting platform was adjusted to change the distance between the nozzle tip and the measurement area of the PDIA. The measurement procedure is as follows: Adjust the position of the lifting platform so that the spray fan from the nozzle is located in the groove of the PDIA’s push rod, ensuring that the PDIA light source is directly facing the spray fan. Observe the pressure gauge; when the spray pressure reaches and stabilizes at 0.3 MPa, start the PDIA to begin the measurement.
2.2. Field Drift Test
2.2.1. Test Bench and Experimental Site
The field drift test bench (AAMS-Salvarani, Maldegem, Belgium) is 10.5 m long and 0.5 m wide, consisting of 22 aluminum modules spaced 0.5 m apart. Twenty of these modules have covers that can be opened and closed using pneumatic valves, while the remaining two modules are permanently exposed. Each module can hold collection materials such as Petri dishes and filter papers.
The test bench is equipped with a trigger bar. When the test bench control system is set to automatic mode, the boom of the sprayer activates the trigger bar, causing the covers to open automatically. The collection materials in the modules then begin to collect the airborne droplets falling from above. The test bench control system, battery, and compressor are installed in a portable cart.
A 3wsh-500 boom sprayer, produced by Shandong Sanhe Power Group Co., Ltd. in Linyi, China, was used as the test equipment. Ultrasonic sensors installed at the center of the middle boom section and at the end of the right boom section were used to monitor the distance between the boom and the wheat canopy. A pressure transmitter installed on the precision spray control valve assembly recorded the changes in spray pressure during the test. The GNSS antenna mounted on top of the sprayer recorded the movement trajectory and speed of the sprayer. A small weather station recorded the temperature, humidity, wind speed, and wind direction during the test.
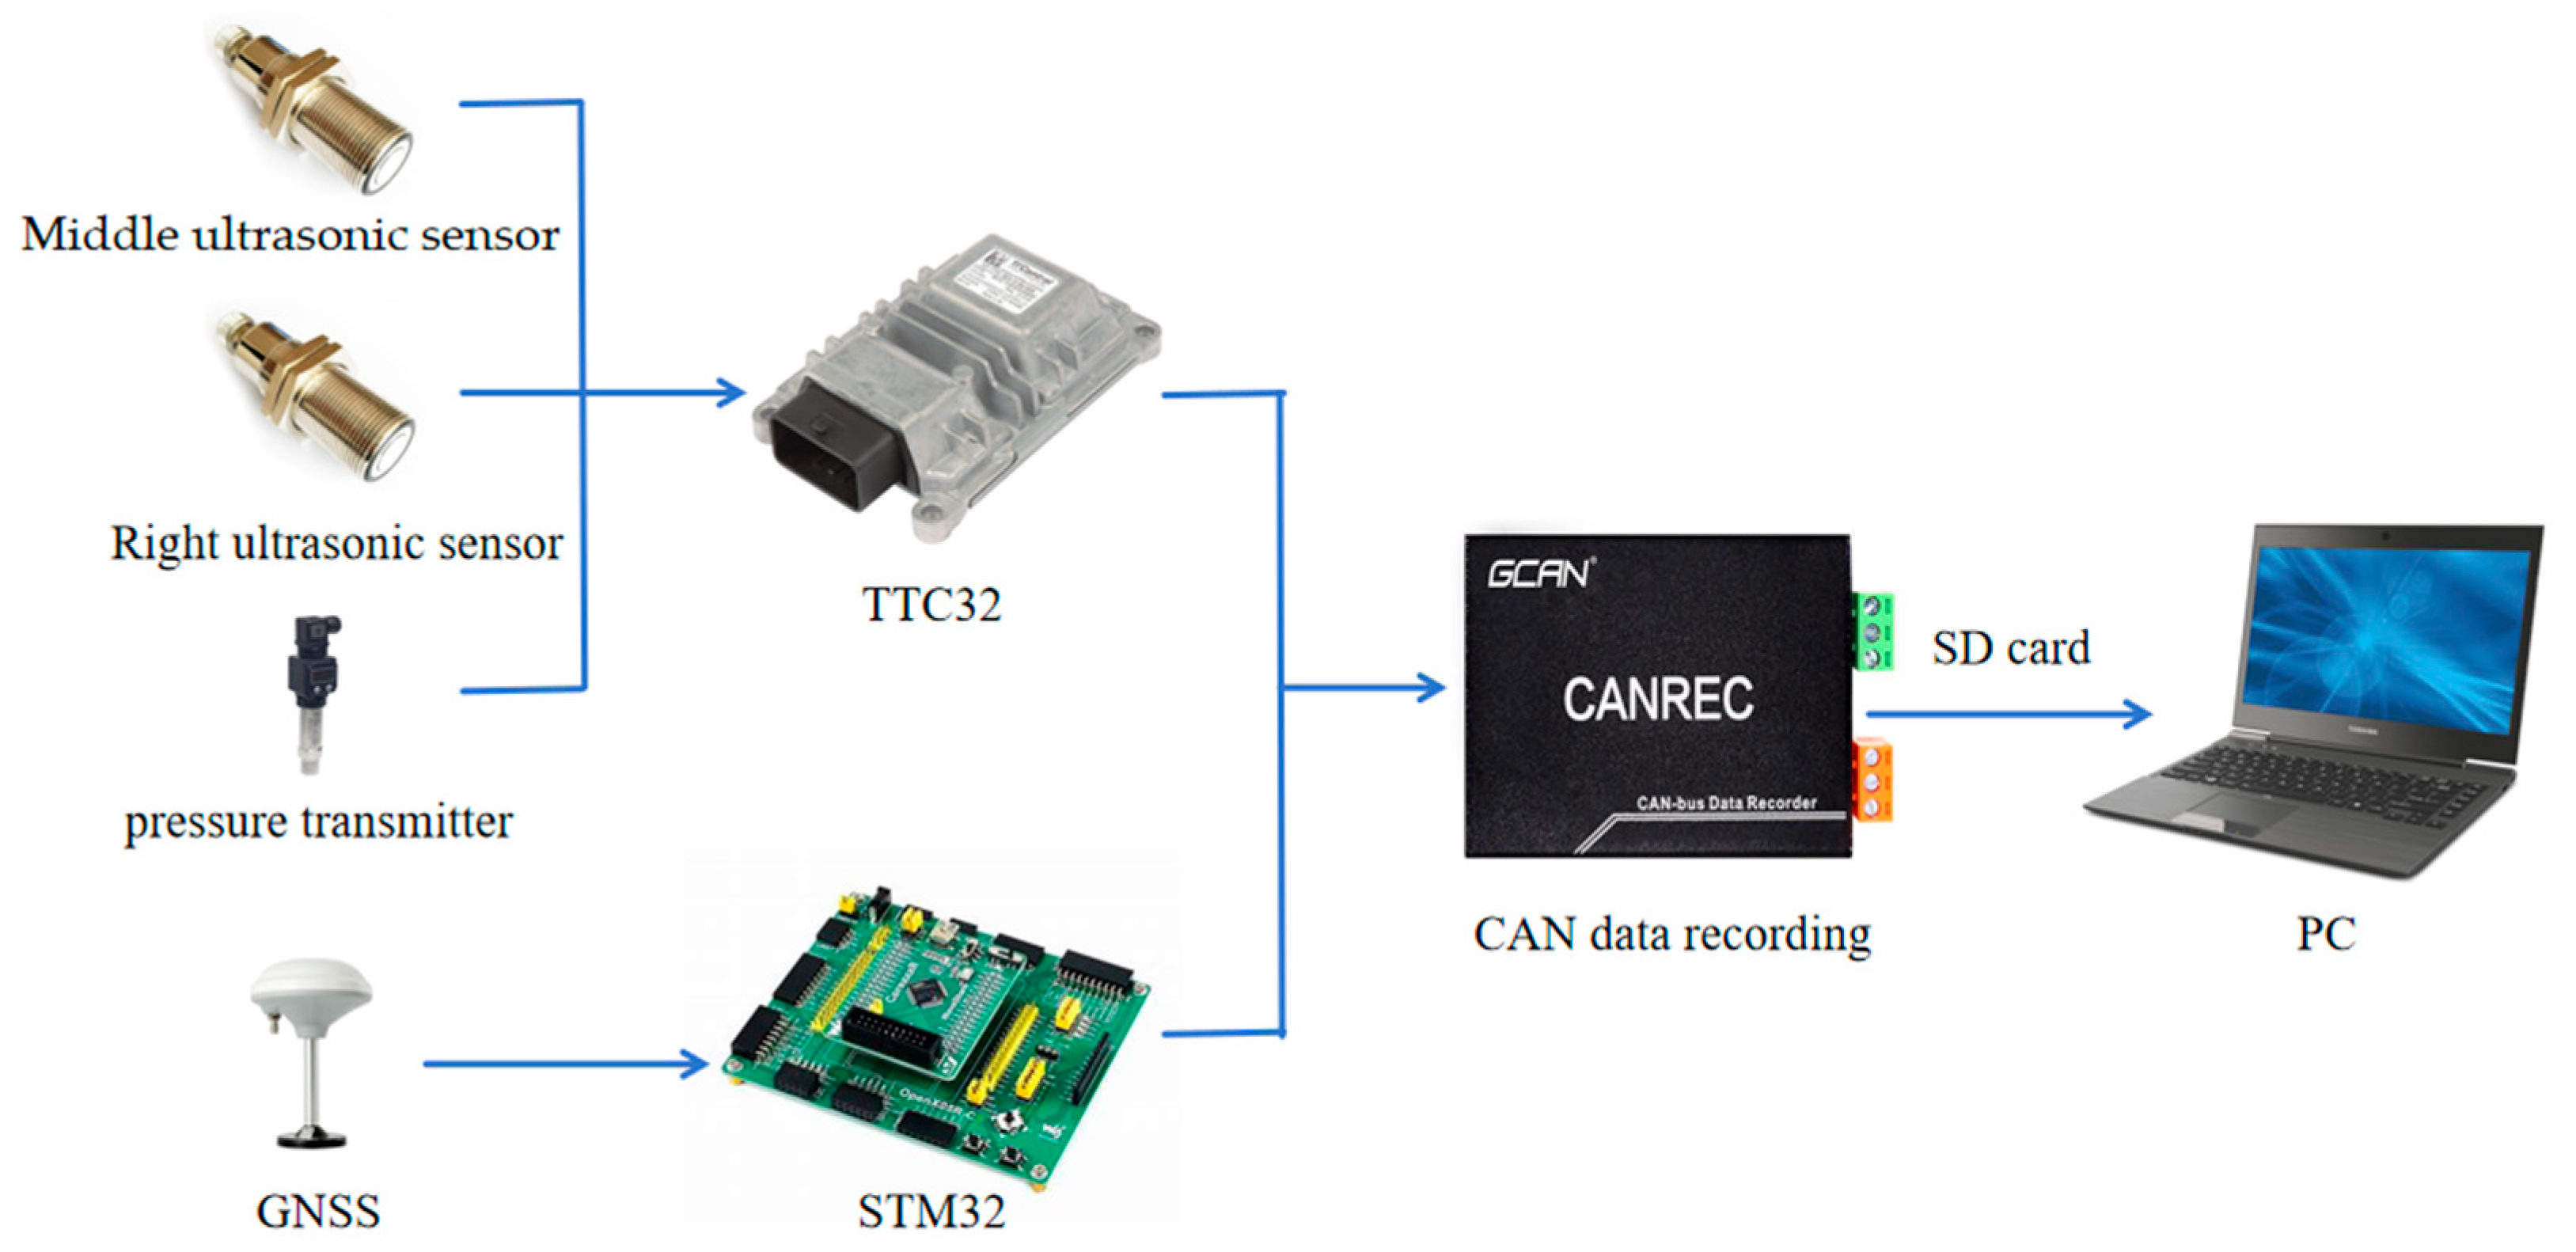
The information collection system is shown in
Figure 2. Ultrasonic sensors (HC175F30GM-I-2000-V1, HC Sensors, Shenzhen, China) installed on the middle and right sections of the boom, and a pressure transmitter (ELE 801S 0–1 MPa, Shanghai Xin Xishan Industrial Co., Ltd., Wenzhou, China) installed on the precision spray control valve group transmit real-time boom height and spray pressure data to the TTC32 vehicle control unit (HYDAC Technology, Shanghai, China). The GNSS antenna (TOPGNSS, Shenzhen, China) mounted on top of the sprayer transmits the sprayer’s position information to the STM32 F103RCT6 microcontroller (STMicroelectronics, Shanghai, China). A CAN data logger (Guangcheng Technology Co., Ltd., Shenyang, China) communicates in real-time with the TTC32 and GNSS systems, recording the boom height and movement position data onto an SD card. After the test, the experimental data can be extracted from the SD card using a computer (Lenovo Group Ltd., Beijing, China).
The experiments were conducted at the National Precision Agriculture Demonstration Base in Xiaotangshan, Changping District, Beijing. The experimental site was a wheat field, which was open and free of significant obstacles. The literature [
26] indicates that the impact of average wind speeds less than 1 m/s on drift potential can be negligible, and headwinds result in higher drift potential compared to crosswinds. According to the requirements of ISO 22401 [
3], the spray tests were conducted under environmental conditions with a temperature ranging from 6.2 to 11.3 °C, relative humidity between 53.6% and 56.2%, and wind speeds consistently below 1.5 m/s.
2.2.2. Experimental Methods
In the North China region, farmers using the 3WSH-500 boom sprayer (Yongjia, Linyi, China) typically control the operating speed to below 7 km/h to ensure the stability of the sprayer. Therefore, the experiment was conducted under the same conditions with the sprayer moving at a speed of 7 km/h and a spray pressure of 0.3 MPa. Two types of nozzles were used: LI CHENG VP110-03 and Teejet XR110-03. The distance between the boom and the test bench varied from 0.4 m to 1.2 m in 0.1 m increments.
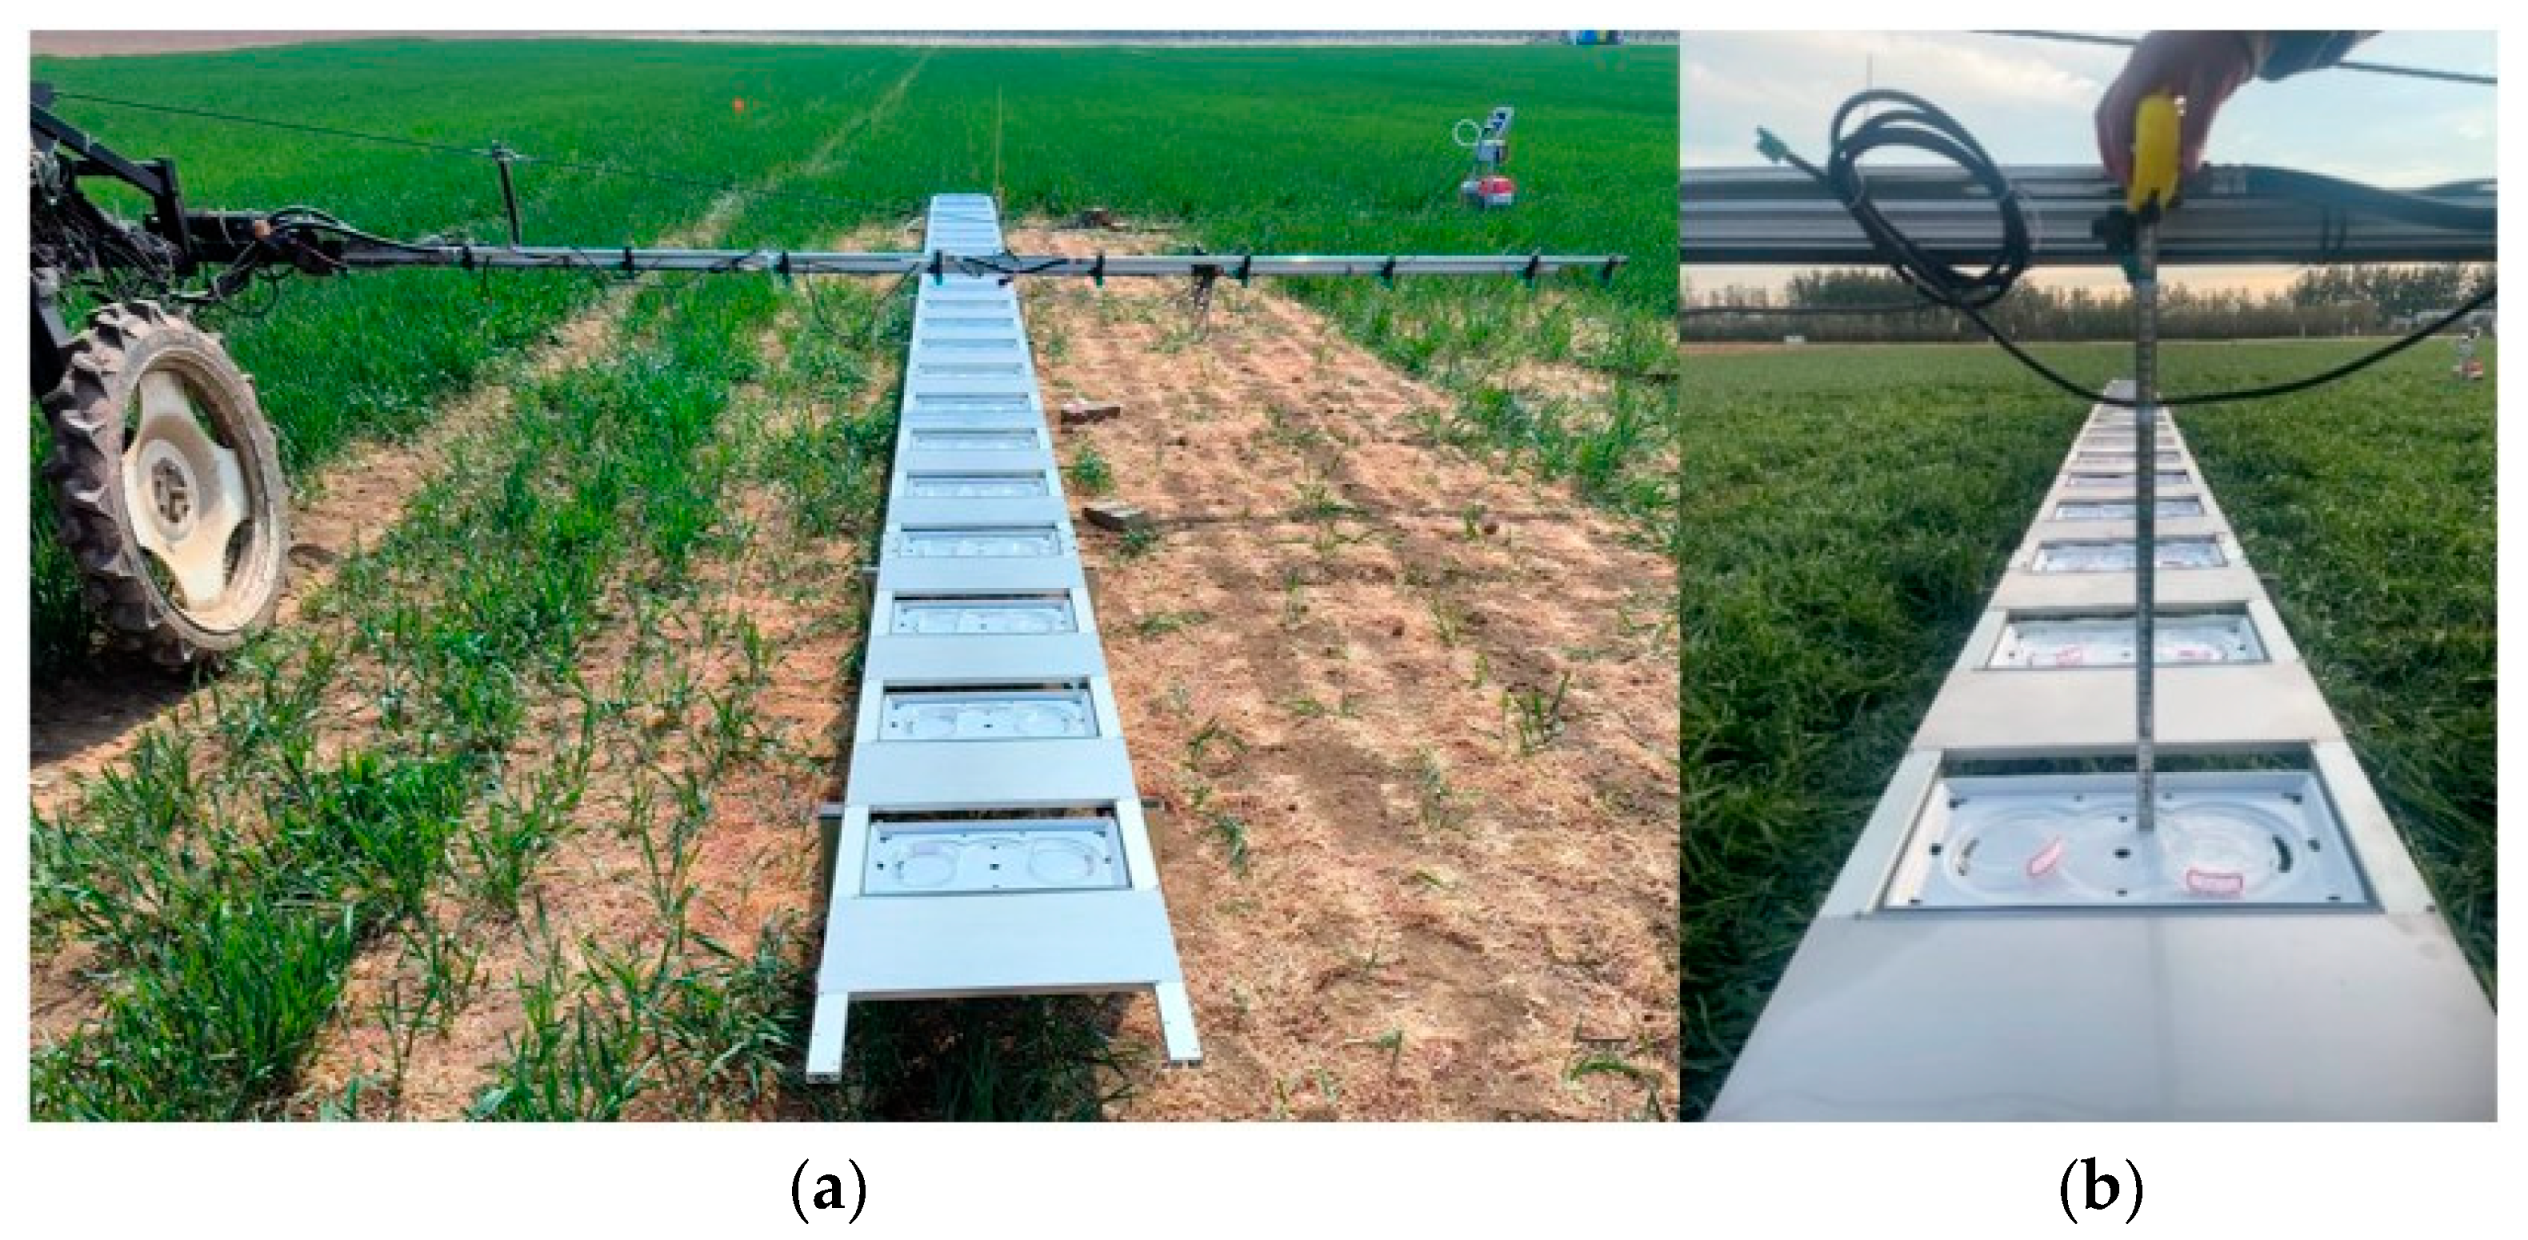
The test bench was placed in the middle of the right boom section, parallel to the direction of the sprayer’s movement, as shown in
Figure 3a. The droplet collectors used in this experiment were glass Petri dishes with a diameter of 100 mm. Two Petri dishes, labeled ‘a’ and ‘b’, were placed in each module, resulting in a total of 44 Petri dishes per trial. The Petri dishes were positioned 0.3 m above the ground. Among these, the 40 Petri dishes covered by the module covers on the test bench collected the deposition of droplets that remain suspended in the air. These droplets are prone to drift and represent the drift amount. The four exposed Petri dishes at the end of the test bench collected the total deposition, which included both the direct spray from the nozzles and the droplets that remain suspended in the air. This total deposition is referred to as the total deposition amount.
A solution of 0.18 g/L of the fluorescent dye Rhodamine B (Kemio Chemical Reagent Co., Ltd., Tianjin, China) was prepared to replace the pesticide for the spray tests. Before the experiment, the distance from the nozzle end to the test bench was measured, as shown in
Figure 3b. Once the specified height was reached, the sprayer was driven to a position 20 m in front of the test bench to start the test, ensuring that the spray pressure reached 0.3 MPa when the droplets were sprayed onto the test bench. The sprayer remained in place and sprayed for 2 min to ensure uniform mixing of the liquid, and the liquid from the nozzles was collected to measure the actual concentration. When the sprayer reached the end of the test area, the boom triggered a vertical rod, which opened the covers on the Petri dishes, allowing them to start collecting droplets. The trigger rod was always positioned 2 m behind the last covered Petri dish to prevent direct spraying onto the covered Petri dishes. The sprayer continued to move 20 m past the test bench before stopping the spray. After waiting 60 s for all the droplets that remained suspended in the air to fall and dry on the Petri dishes, the dishes were collected and placed in a cardboard box to ensure they remained in a dark and cool environment. The covers were wiped clean after each spray to prevent any residual liquid from dripping and contaminating the Petri dishes in subsequent tests.
2.2.3. Sample Processing
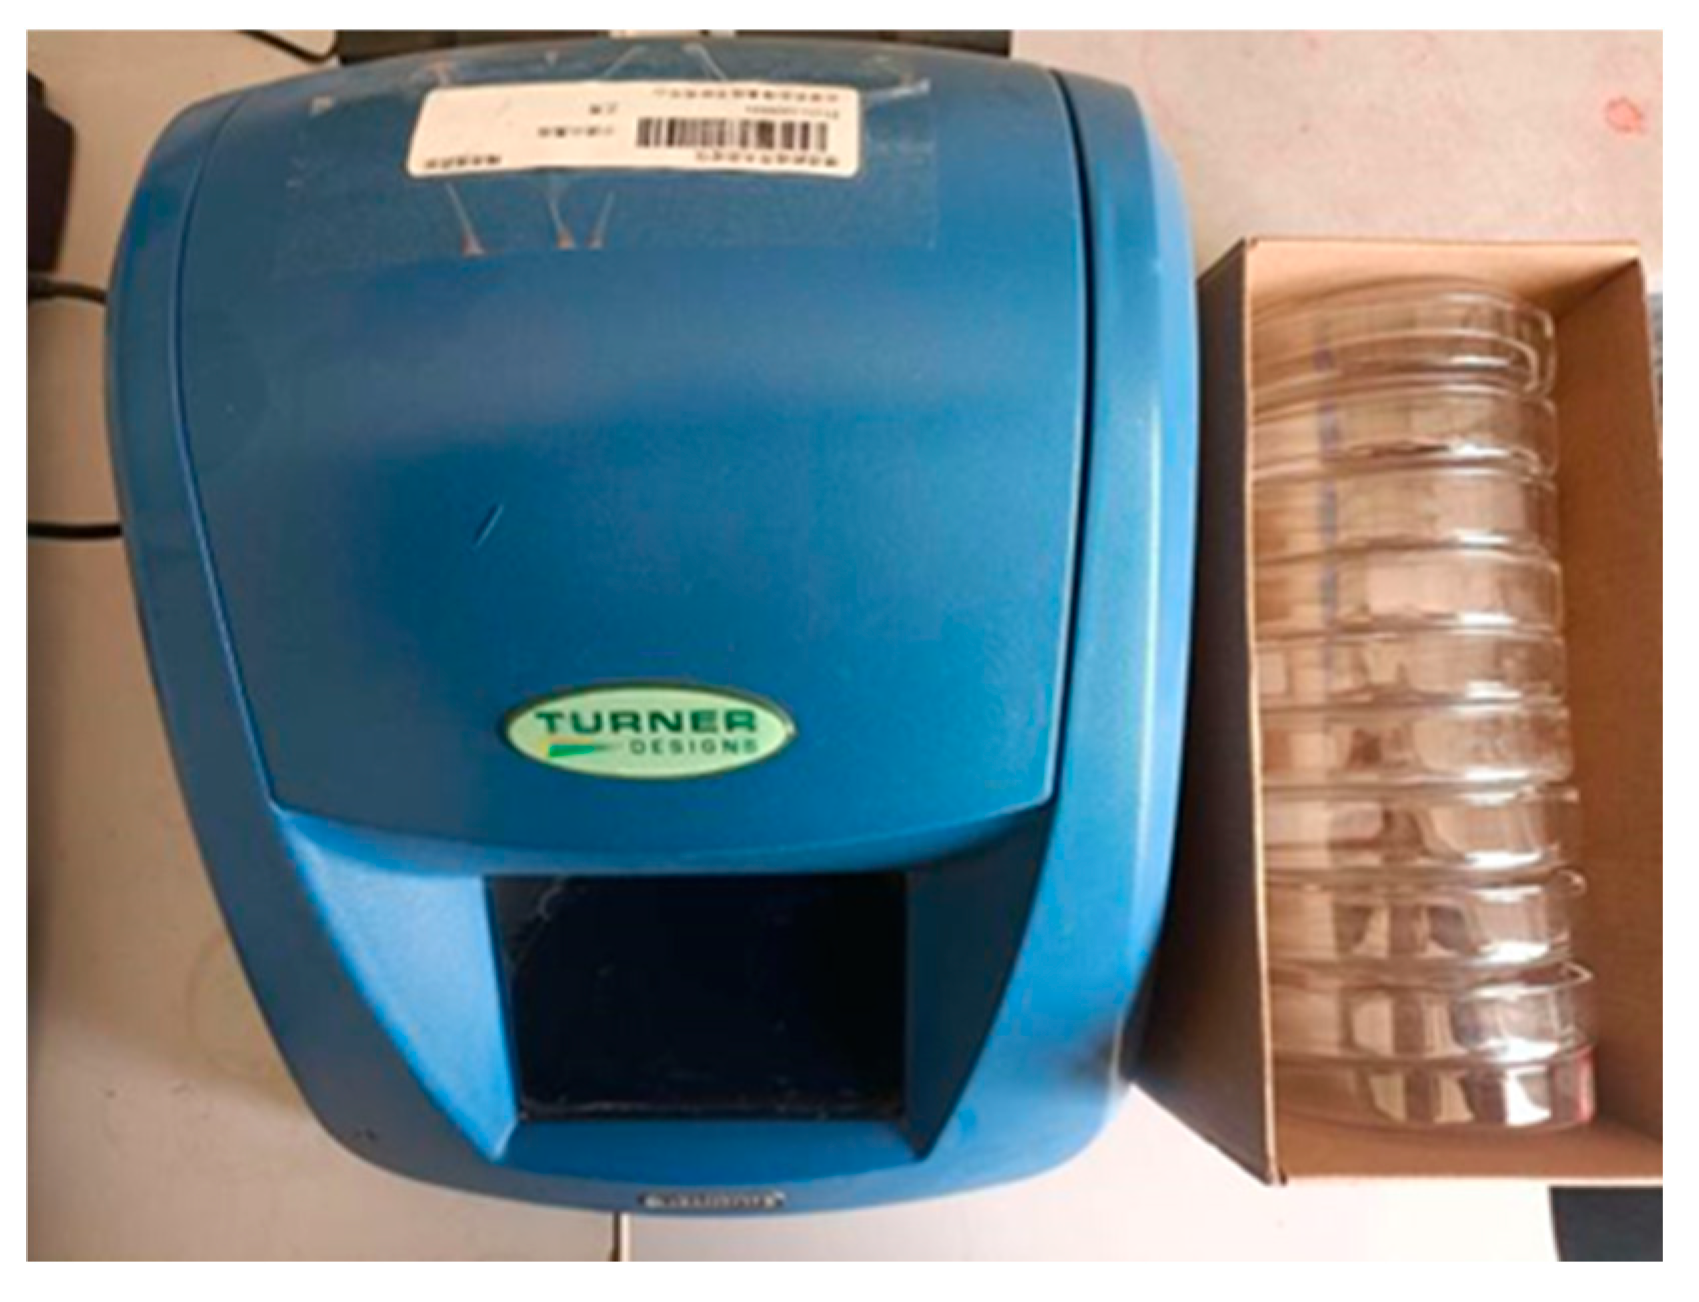
During the test, 20 mL of distilled water was added to each Petri dish. The dishes were then shaken for 2 min using an orbital shaker (RS-20PRO, Quan An Scientific Instrument Co., Ltd., Zhejiang, China) to elute the collected droplets. An appropriate amount of the eluate was then drawn using a pipette, and the fluorescence value of the eluate was measured using a Trilogy 720-000 Fluorometer (Turner Designs, San Jose, CA, USA), as shown in
Figure 4.
2.2.4. Drift Evaluation Metrics and Calculation Methods
According to the international drift classification standard ISO 22401:2015 [
3], the formula for calculating the drift per unit area is as follows:
where
Di (μL/cm
2) is the drift deposition per unit area in the Petri dish with a slot cover;
ρsmpl is the fluorescence value of the eluate;
ρblk is the fluorescence value of distilled water;
Vdil (μL) is the volume of the eluate added;
ρspray is the fluorescence value of the calibration solution; and
Acol (cm
2) is the area of the bottom surface of the Petri dish.
- 2.
Drift Potential
According to ISO 22401:2015 [
3], the formula for calculating drift potential is as follows:
where
DVP (%) is the drift potential; and
dRS (μL/cm
2) is the deposition per unit area in the exposed Petri dish, which represents the total deposition per unit area.
- 3.
Drift Percentage
Since the concentration of rhodamine may change over the course of a longer experiment, to better observe the patterns in the data and facilitate comparisons, the drift percentage is calculated using the following formula:
where
TDA (total amount of drift per unit area, μL/cm
2) is the sum of the drift deposition per unit area; and
Dpi (%) is the percentage of drift deposition in the Petri dish with a module cover.
3. Results
3.1. Droplet Size and Velocity
The droplet size and velocity measurement results are shown in
Table 2. Both droplet size and velocity have a significant impact on drift. For standard flat-fan nozzles of the same model but from different brands, differences in nozzle structure can result in different droplet sizes and velocities [
29]. By analyzing the spray quality of the LI CHENG VP110 03 and Teejet XR110 03 nozzles, it was found, as shown in
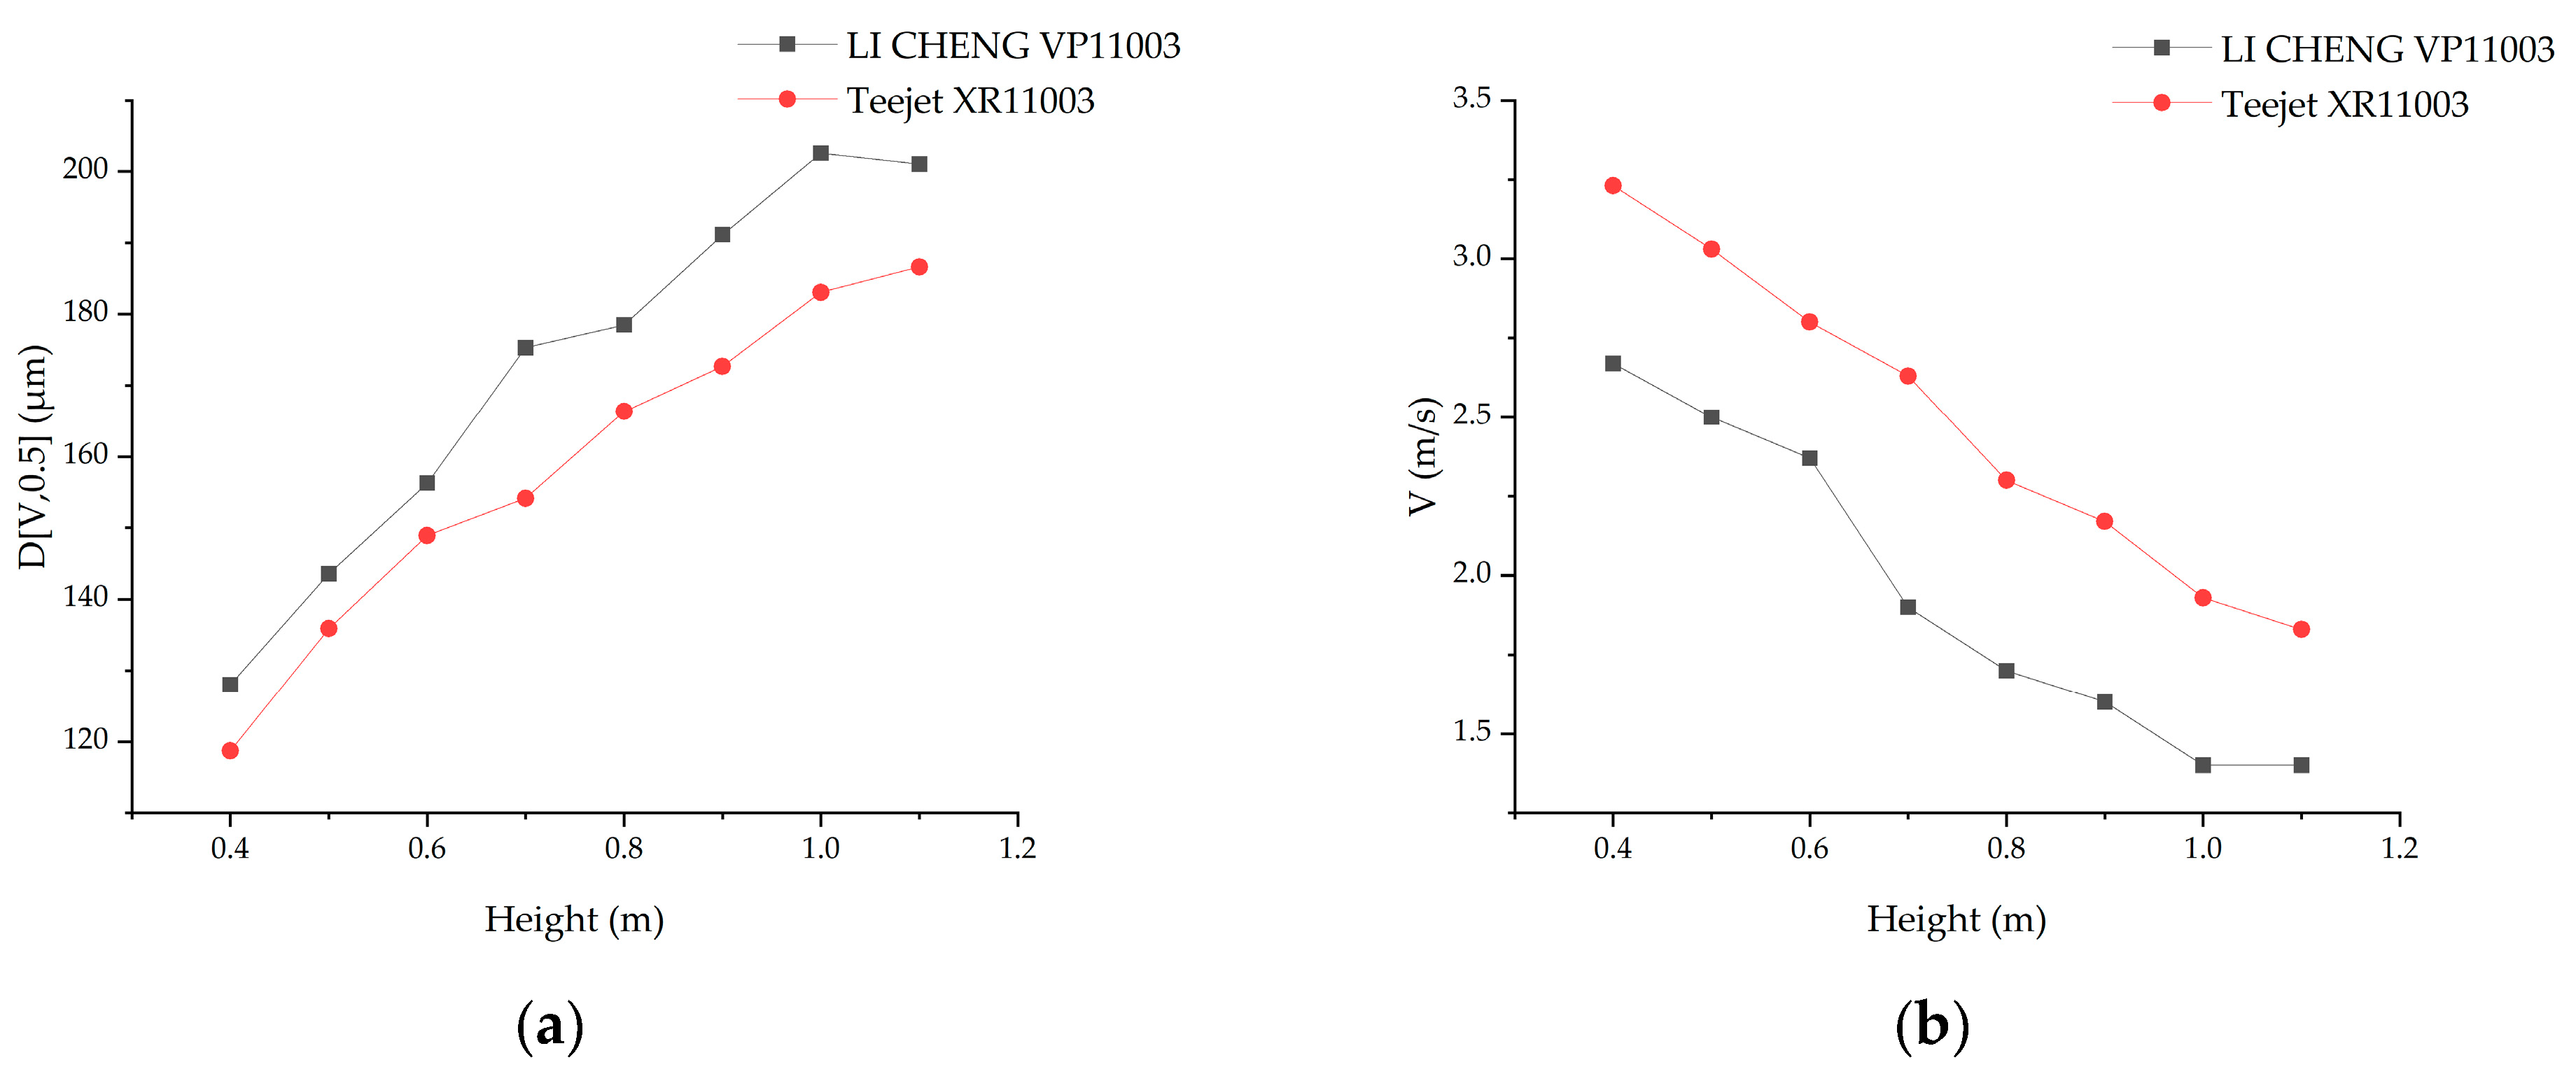
Figure 5a, that at a spray pressure of 0.3 MPa and at nine equally spaced boom heights ranging from 0.4 to 1.2 m below the nozzle, the D[V,0.5] for both nozzles generally increased as the height increased. However, existing studies have shown that height variations do not significantly affect droplet size [
30,
31]. This may be because previous studies were conducted at spray heights not exceeding 0.5 m. When spray heights exceed 0.5 m, fine droplets drift away from the measurement area, leaving a higher proportion of larger droplets, which results in an increase in the measured droplet size. As shown in
Figure 5b, droplet velocity decreases with increasing height, which is consistent with previous findings [
30]. Under the same measurement locations and spray pressure, the D[V,0.5] of droplets from the LI CHENG VP11003 nozzle is 14.6 µm larger than that from the Teejet XR11003 nozzle, accounting for 8.13% of the LI CHENG VP11003 nozzle’s D[V,0.5]. The D[V,0.1] decreased by an average of 1.96 µm (2.21%), while the D[V,0.9] increased by an average of 21.98 µm (7.89%). The droplet velocity from the Teejet XR11003 nozzle is higher than that from the LI CHENG VP11003 nozzle, with an average increase of 0.53 m/s, accounting for 29.26% of the LI CHENG VP11003 nozzle’s average velocity. When the droplet sizes in the droplet group are similar, a higher droplet velocity can reduce the time the droplets spend in the air thereby lowering drift. The relative span (RS) value of the droplet spectrum from the LI CHENG VP11003 nozzle is slightly higher than from the Teejet XR11003 nozzle, with an average increase of 0.05, accounting for 4.52% of the LI CHENG VP11003 nozzle’s RS value. This indicates a more uniform droplet size distribution from the Teejet XR11003 nozzle, with fewer small droplets. Under the same spray pressure, different nozzles exhibit distinct spray characteristics.
3.2. Effects of Boom Height and Nozzle Type on Drift Amount
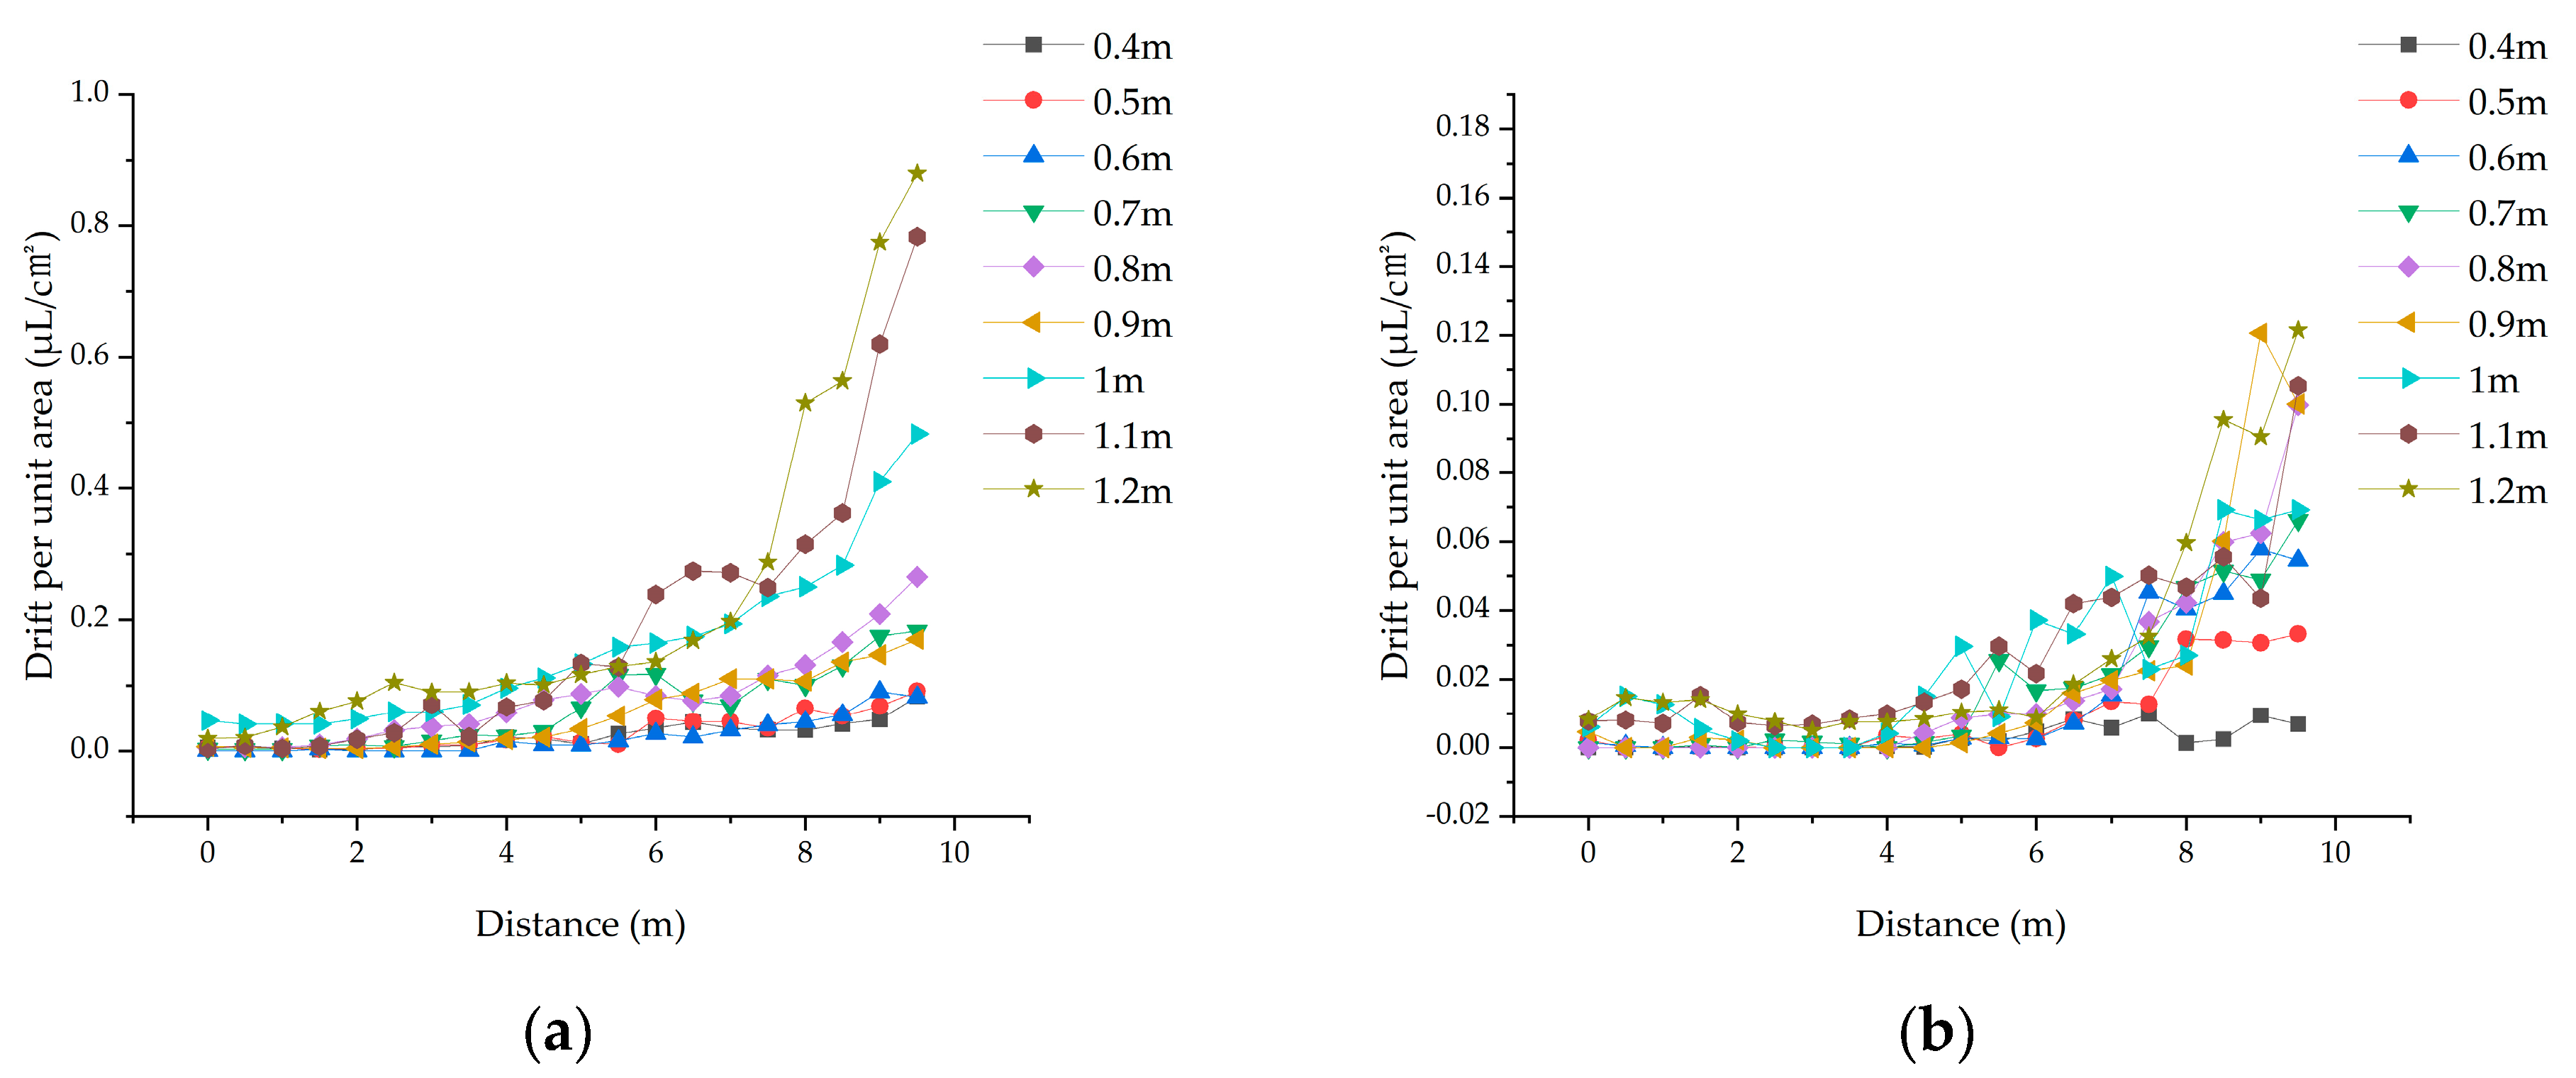
The variation in drift per unit area with distance for the two nozzles is shown in
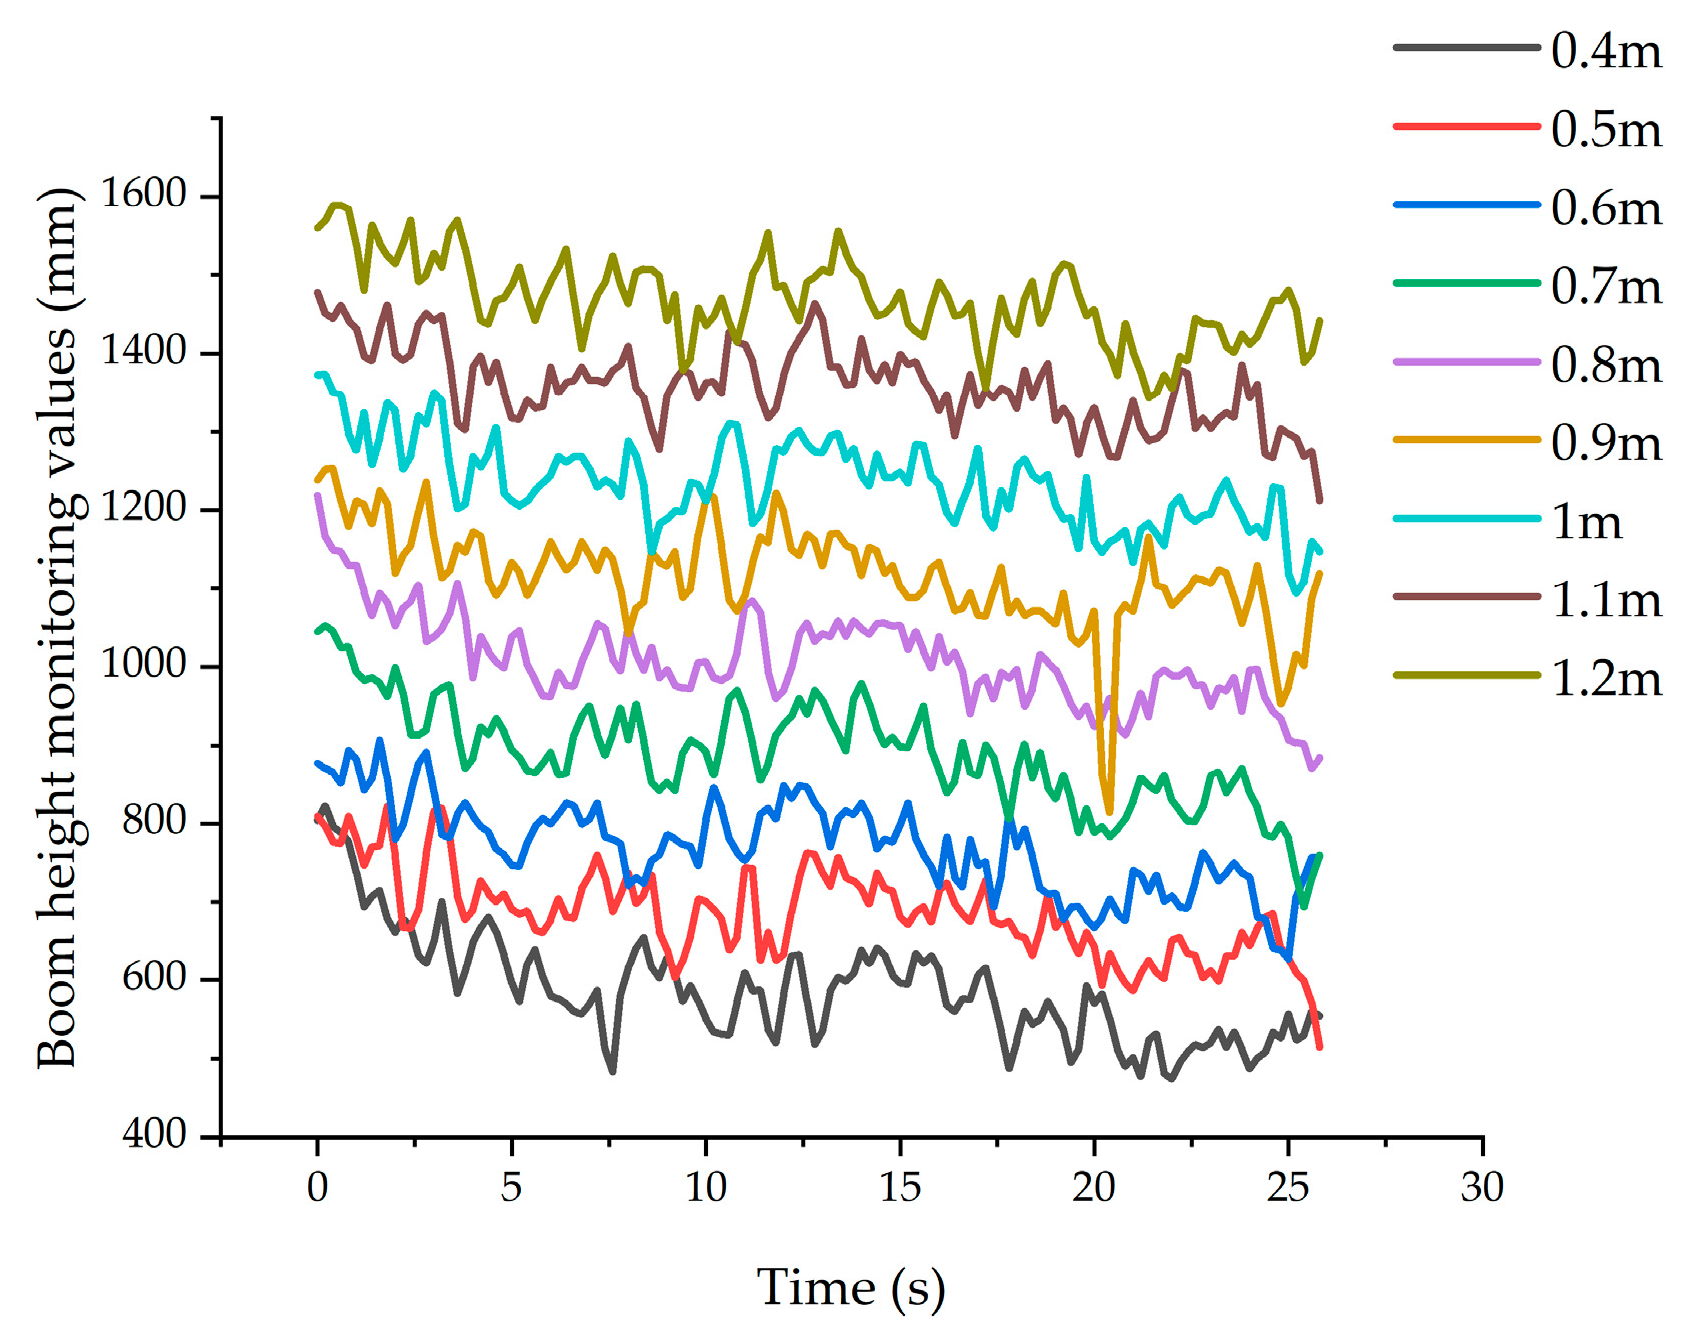
Figure 6. Regardless of the nozzle type and boom height, the trend in drift per unit area is the same: it gradually increases from the start to the end of the test bench, with most of the deposition occurring between 6 and 10 m. This change is not smooth but exhibits some fluctuations. The fluctuations are more pronounced for the Teejet XR11003 nozzle compared to the LI CHENG VP11003 nozzle, and they become more significant with increasing boom height. Additionally, there is no clear distinction between the drift curves at adjacent boom heights, and in some cases, higher boom heights result in lower drift than lower boom heights. This may be due to the swaying of the boom during the sprayer’s movement and small variations in natural wind. The changes in boom height during the sprayer’s movement were recorded, as shown in
Figure 7. Although the boom height varies continuously during the sprayer’s movement, the monitoring values from the ultrasonic sensors at different set heights can be clearly distinguished. Therefore, the effect of boom swaying on the results can be neglected, indicating that small variations in boom height do not significantly affect drift.
From
Table 3 and
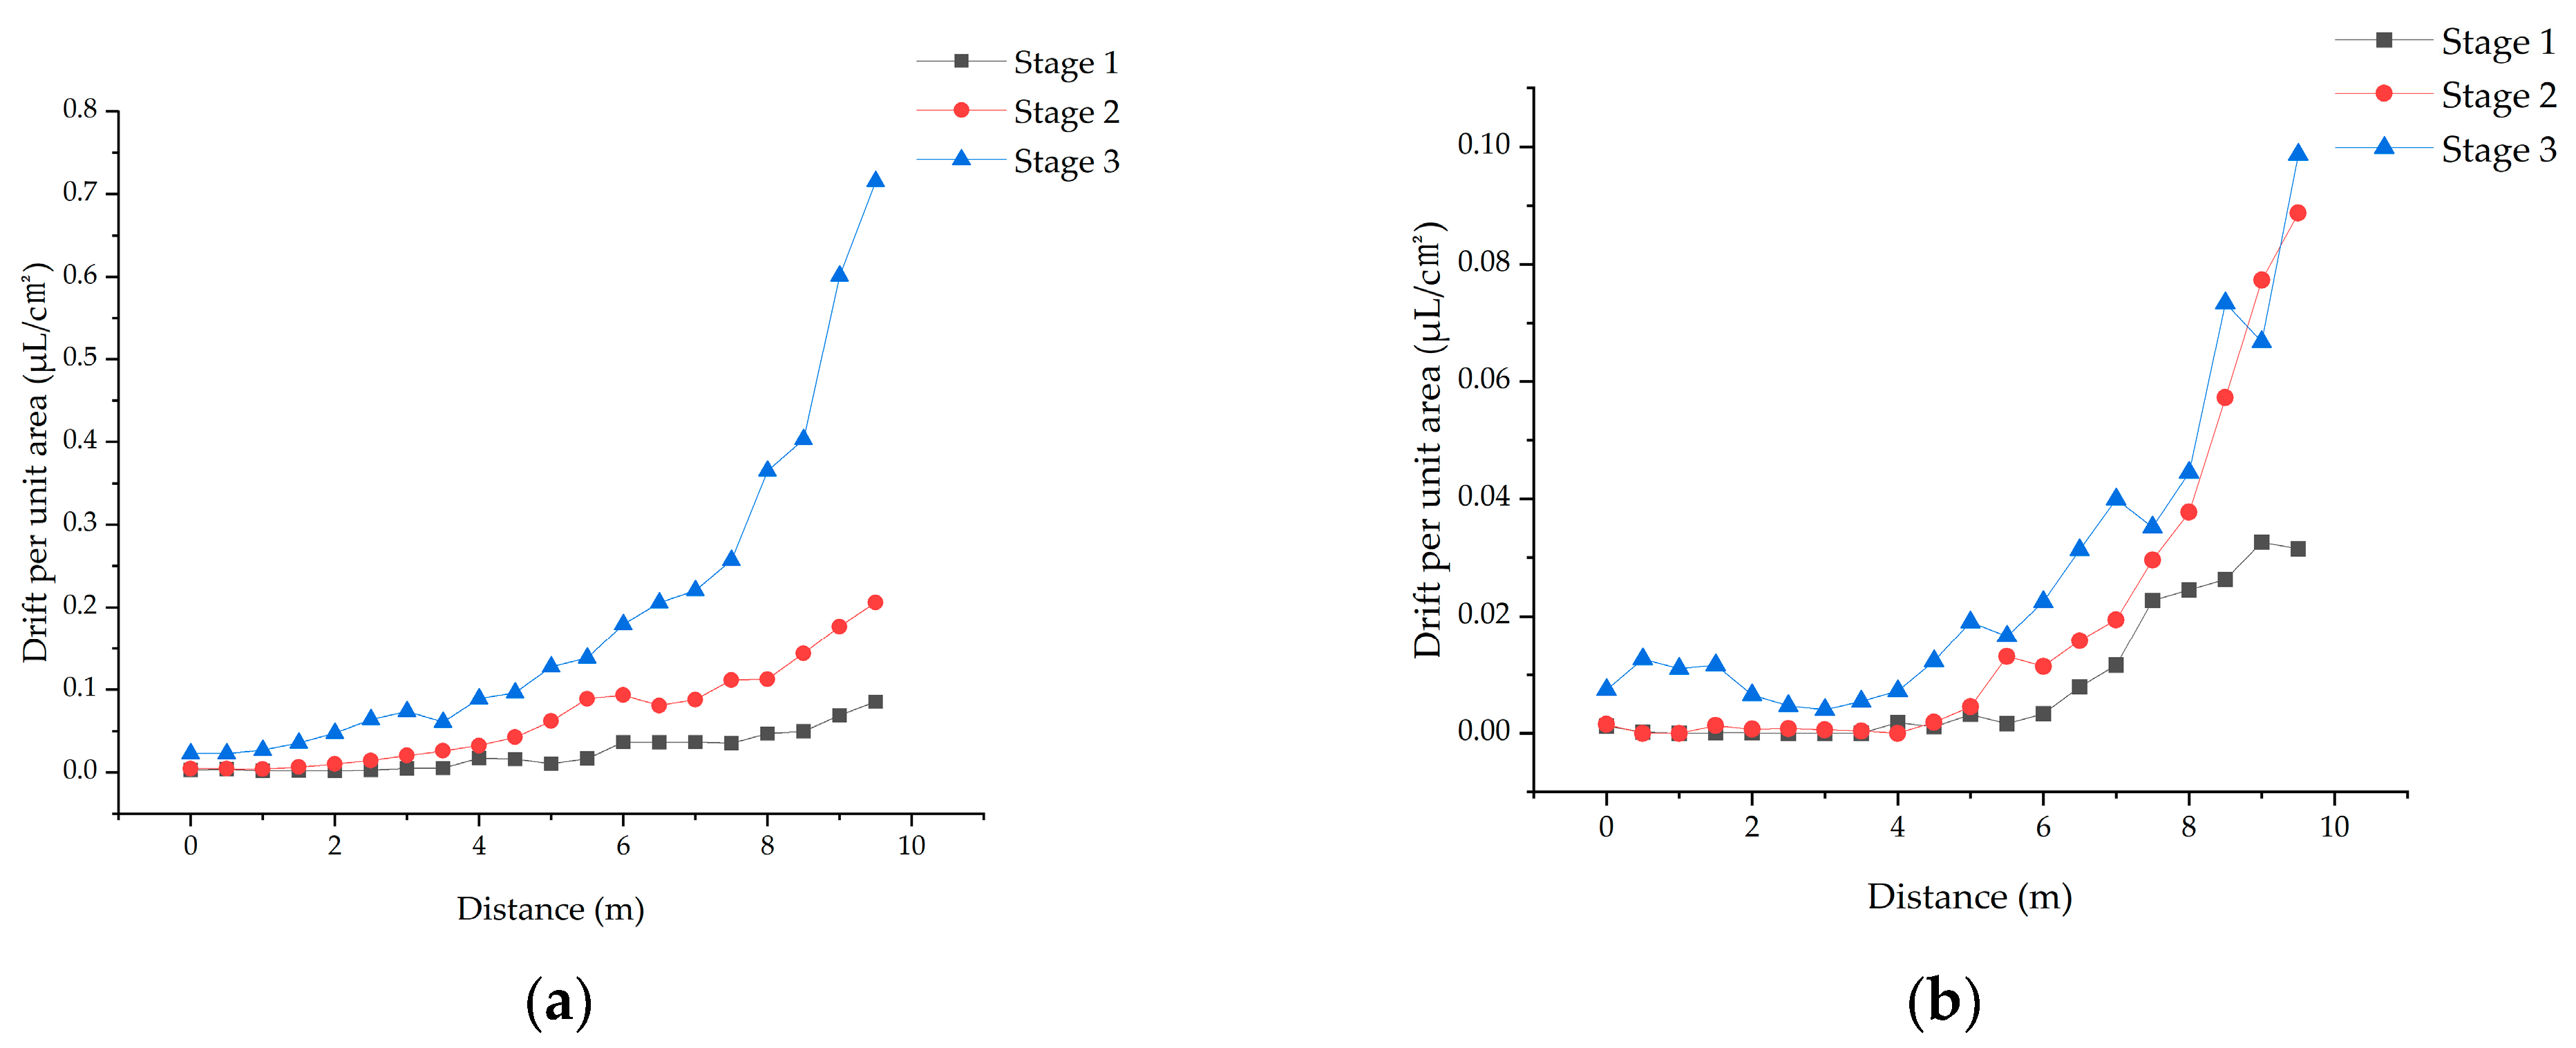
Table 4, the TDA of the two nozzles varies differently as the boom height increases. The TDA of the LI CHENG VP11003 nozzle does not vary significantly within the boom height ranges of 0.4–0.6 m, 0.7–0.9 m, and 1–1.2 m. However, there are noticeable increases in TDA from 0.6 m to 0.7 m and from 0.9 m to 1 m. To clearly understand the impact of boom height on drift, three boom heights are considered as one stage. For example, boom heights of 0.4 m, 0.5 m, and 0.6 m are grouped as Stage 1, and the average drift per unit area (
Di) at this stage was calculated by taking the mean of
Di at the three boom heights. Stages 2 and 3 are defined similarly. The resulting LI CHENG VP11003 drift curve is shown in
Figure 8a, indicating that higher boom heights result in greater drift. Compared to the stepwise increase in TDA of the LICHENG VP11003 nozzle as the boom height increases, the TDA of the Teejet XR11003 nozzle changes more smoothly. The same processing is applied to facilitate better comparison, as shown in
Figure 8b. Assuming that a
Di greater than 0.01 μL/cm
2 indicates significant drift. For the LI CHENG VP11003 nozzle, the
Di in the first 3.5 m of the test bench at Stage 1 is lower than this value, suggesting that the potential drift droplets suspended in the air begin to be collected after 3.5 m. For Stage 2, this distance is 1.5 m, and for Stage 3, the suspended droplets already exist before the start of the test bench. Higher boom heights result in a smaller distance from the start of the test bench where the Petri dishes collect the deposited droplets. This is because higher boom heights lead to longer times for the suspended droplets to fall into the Petri dishes, and all the slot covers open at the same time. As a result, droplets from lower boom heights may land on the slot covers before they open, preventing them from being collected in the Petri dishes. The Teejet nozzle shows significant drift starting at 0.5 m for Stage 3, and at 7 m and 5.5 m for Stages 1 and 2, respectively. The LI CHENG nozzle exhibits drift at positions closer to the start of the test bench compared to the Teejet nozzle for all three stages. Field surveys found that the LI CHENG VP11003 nozzle is widely used in pesticide spraying operations by farmers in the North China region. The drift risk was evaluated by comparing it to the Teejet XR11003 nozzle. For the LI CHENG VP11003 nozzle, the boom height can be moderately adjusted within Stage 1 to enhance the sprayer’s clearance without significantly increasing drift. However, exceeding Stage 1 results in a marked rise in drift potential. For the Teejet XR11003 nozzle, precise control of the boom height has a greater impact on drift, and the boom height should not be increased arbitrarily.
The TDA for both nozzles as a function of boom height was fitted to equations, as shown in
Table 5. The TDA for both the LI CHENG VP11003 and Teejet XR11003 nozzles increases in a quadratic polynomial form with increasing boom height. However, the TDA for the LI CHENG VP11003 nozzle increases more rapidly with boom height compared to the Teejet XR11003 nozzle. This indicates that the drift from the LI CHENG VP11003 nozzle is more sensitive to changes in boom height.
3.3. Drift Percentage
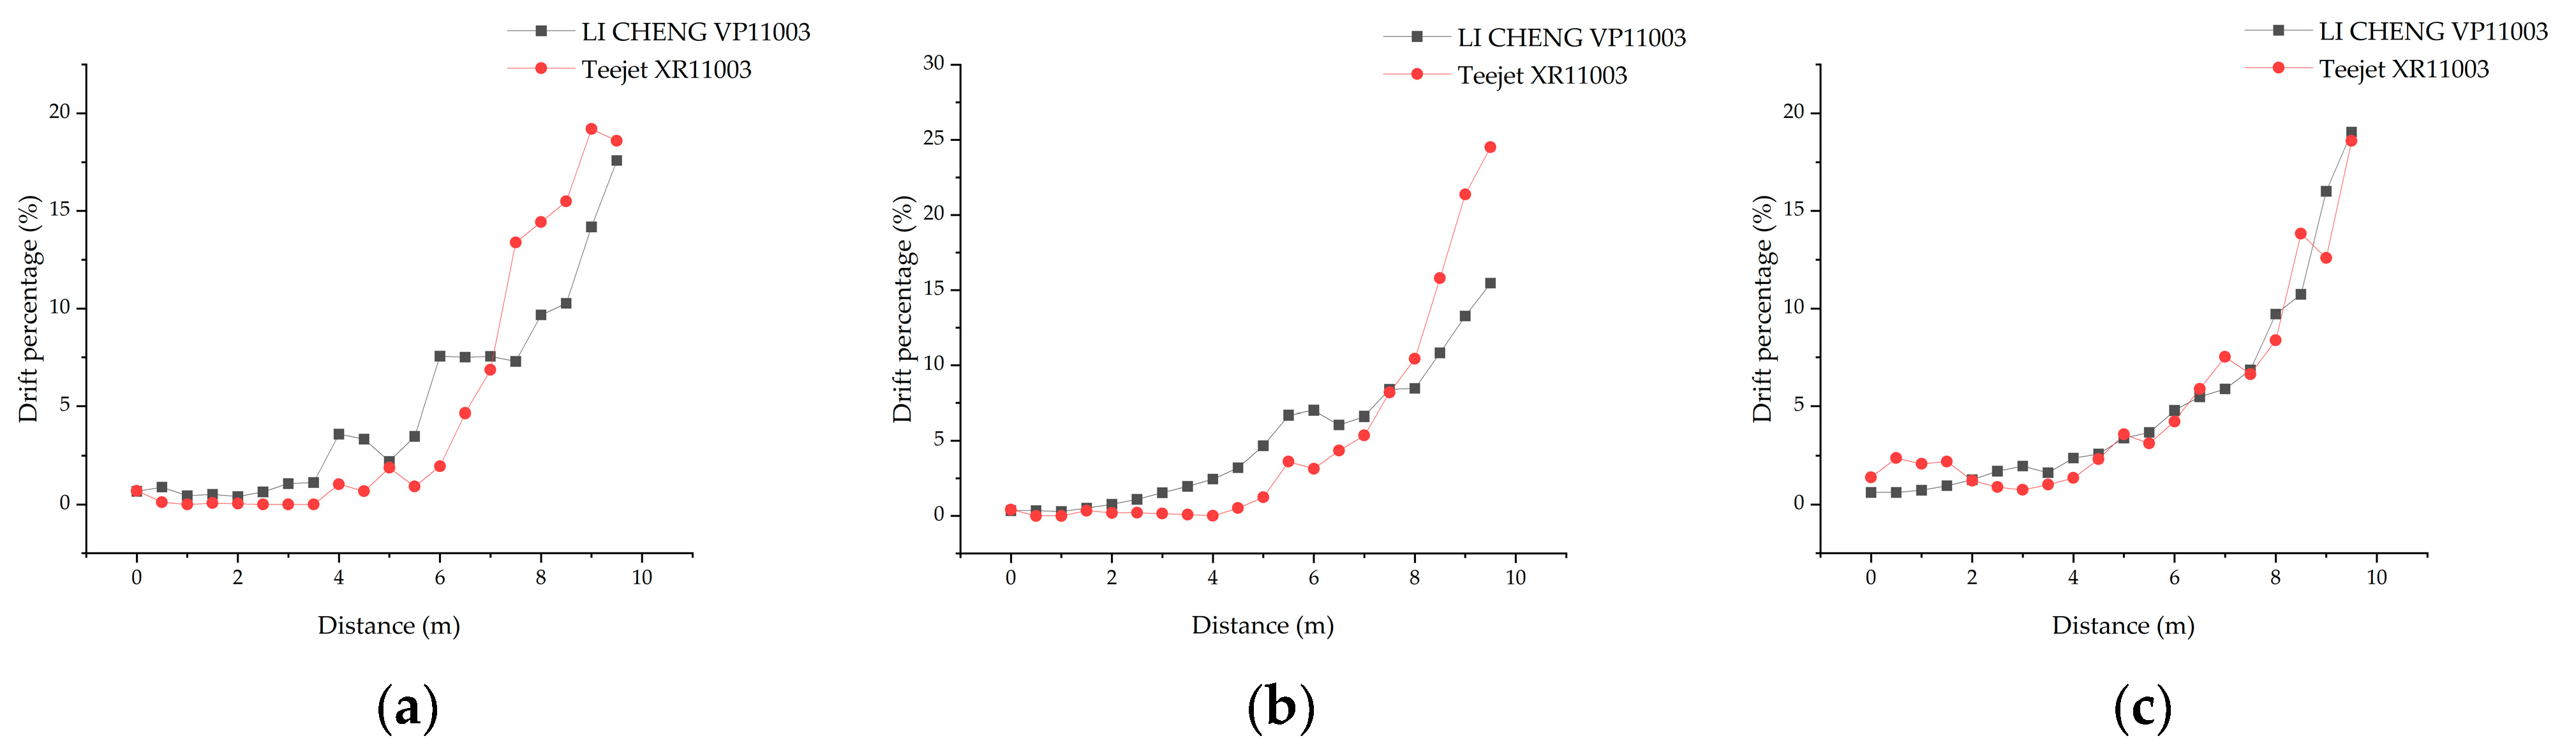
After spraying, the settling time of droplets suspended in the air significantly affects pesticide drift, and this settling time is related to the droplet fall velocity. Given the significant difference in TDA produced by the two nozzles, the drift per unit area data were normalized to obtain the variation in drift percentage with the deposition distance along the test bench, as shown in
Figure 9. Comparing the rising trends of the drift percentage curves for the two nozzles, it was found that at all three boom height stages, the drift percentage curve for the Teejet XR11003 nozzle rises more steeply than that for the LI CHENG VP11003 nozzle, with the difference being more pronounced in Stages 1 and 2. This indicates that the droplets from the Teejet XR11003 nozzle settle faster in the air compared to those from the LI CHENG VP11003 nozzle. This can be attributed to the fact that, despite similar droplet sizes, the LI CHENG VP11003 nozzle has a slightly larger RS value, producing smaller droplets that fall more slowly in the air. Additionally, the drift deposition of the Teejet XR11003 nozzle was more concentrated in the middle to rear section of the test bench compared to the LICHENG VP11003 nozzle. In the range of 7.5–9.5 m along the test bench, the total drift percentages for the LI CHENG VP11003 nozzle in Stages 1, 2, and 3 are 58.99%, 56.38%, and 62.34%, respectively. For the Teejet XR11003 nozzle, the corresponding values are 81.10%, 80.28%, and 60.04%. In stages one and two, the Teejet XR11003 nozzle has a higher percentage of drift in the middle to rear section of the test bench (7.5–9.5 m) compared to the LI CHENG VP11003 nozzle. In stage three, at the higher boom height, the percentage of drift for both nozzles changes similarly along the length of the test bench. Therefore, as the boom height increases, the difference in the percentage of drift between the two nozzles gradually decreases. Farmers should not increase the boom height to improve the sprayer’s clearance, as this not only increases drift but also weakens the differences in drift control performance between nozzles.
3.4. Drift Potential
From
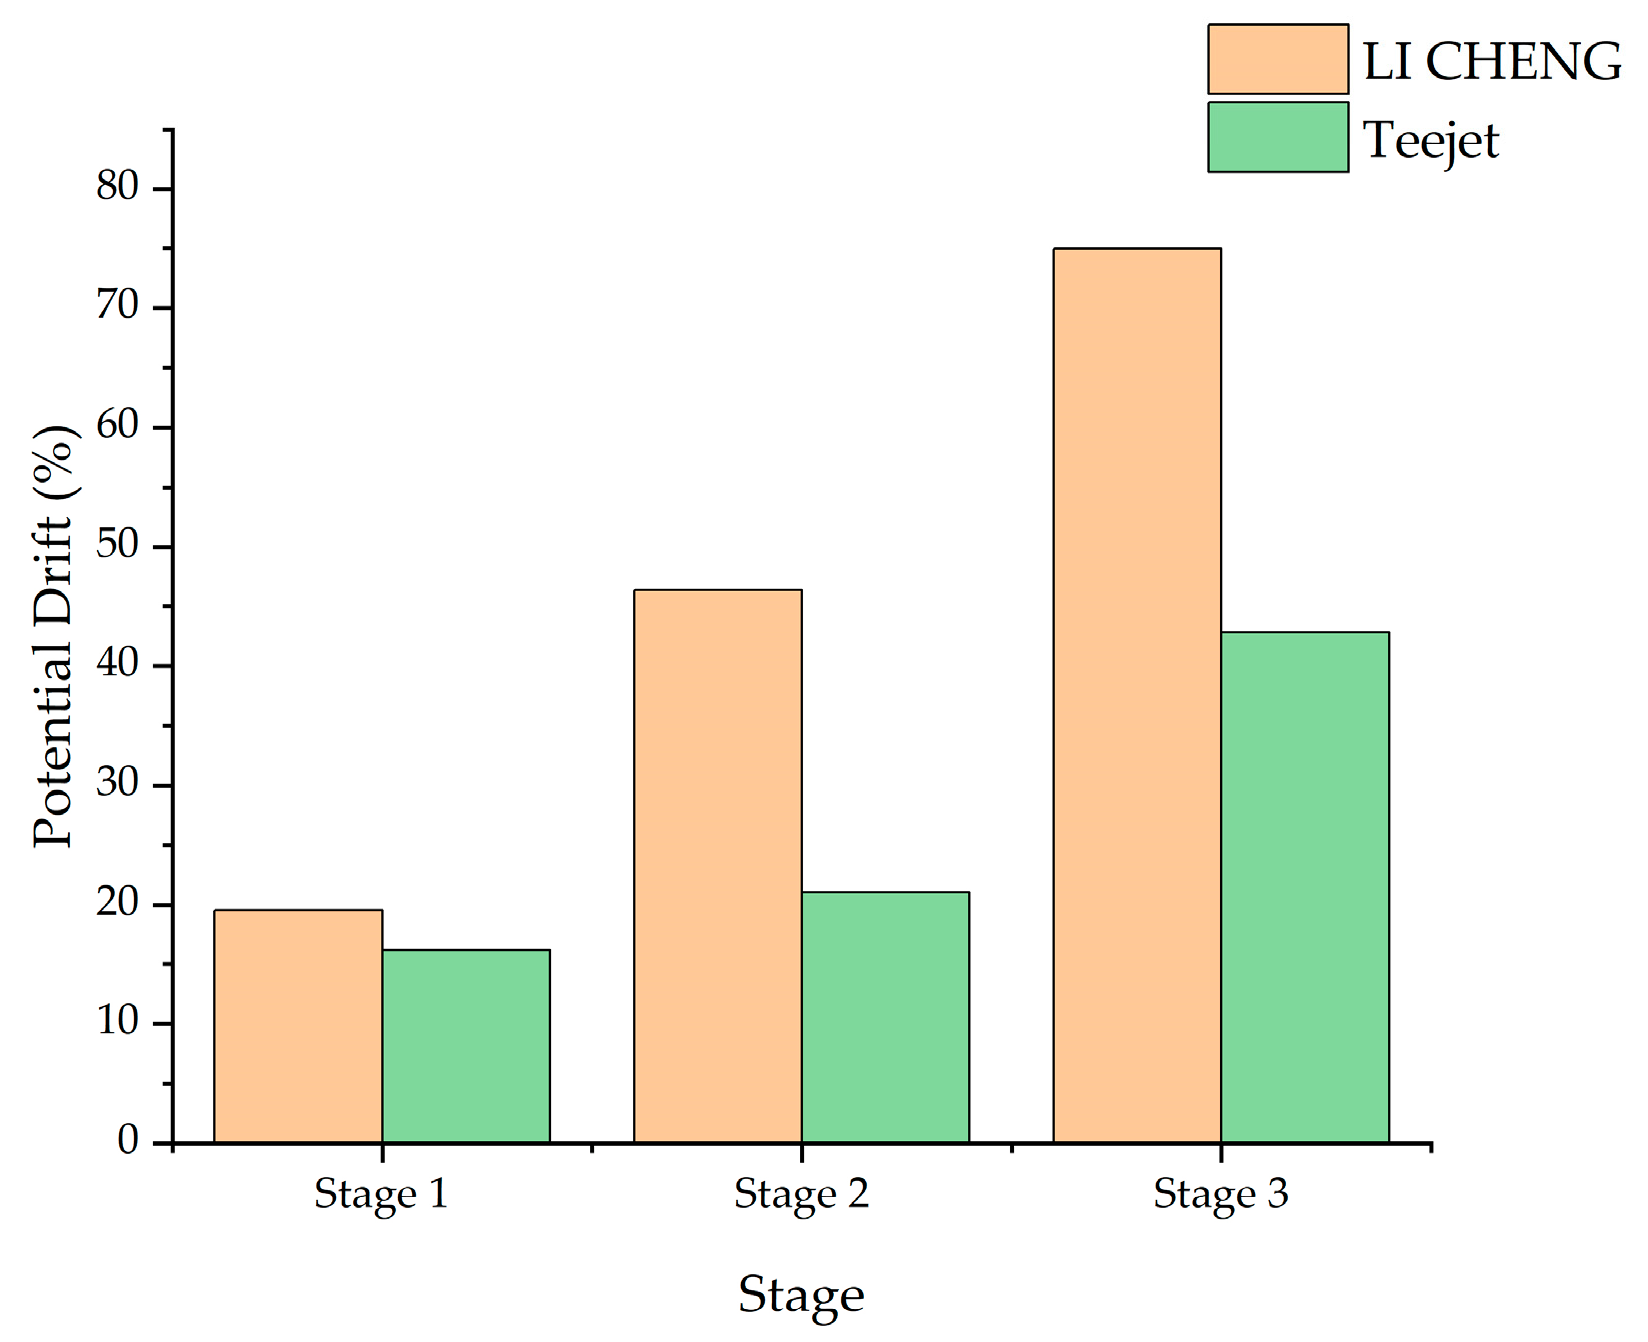
Figure 10, it can be observed that the drift potential of the Teejet nozzle is lower than that of the LI CHENG nozzle. For both nozzles, the drift potential increases with increasing boom height. The two nozzles exhibit different trends in the increase in drift potential. From
Table 6, For the LI CHENG nozzle, the drift potentials at the three boom height stages are 19.58%, 46.33%, and 74.93%, respectively. The changes between stages are significant: Stage 2 shows a 136.62% increase over Stage 1, Stage 3 shows a 61.73% increase over Stage 2, and Stage 3 shows a 282.69% increase over Stage 1. For the Teejet nozzle, the drift potentials at the three boom height stages are 16.12%, 21.04%, and 42.80%, respectively. The increases between stages are 30.52% from Stage 1 to Stage 2, 103.42% from Stage 2 to stage 3, and 165.51% from Stage 1 to Stage 3. The increase from Stage 1 to Stage 2 is relatively small, while the increase from Stage 2 to Stage 3 is more substantial. Therefore, the impact of boom height on drift is very significant. It is necessary to conduct spraying operations at the optimal boom height and not to increase the boom height solely to improve the sprayer’s clearance. At the same boom height stages, the drift potential of the Teejet nozzle is 17.63%, 54.58%, and 42.88% lower than that of the LI CHENG nozzle. In Stage 1, where the boom height is lower, the drift potentials of the two nozzles are similar. As the boom height increases, the drift potential of the Teejet nozzle becomes significantly lower than that of the LI CHENG nozzle.
4. Discussion
In low-wind conditions, standard flat-fan nozzles, known for their excellent deposition performance, are commonly used in field spraying operations. Boom height remains a significant factor influencing spray drift. Experimental data show that higher boom heights are associated with increased drift potential, a finding consistent with previous studies in this field [
5]. Interestingly, this trend becomes less pronounced when comparing boom heights that are very close, such as 0.5 m to 0.6 m or 0.8 m to 0.9 m, particularly when using the LI CHENG nozzle. This phenomenon may be attributed to the combined effects of environmental conditions in the wheat field and the sprayer’s operation. In this environment, several factors—such as natural wind and the wheat canopy—could have influenced the results. Although wind speeds during the experiments were consistently below 1.5 m/s, in accordance with ISO 22401 testing standards [
3], the intermittent and unpredictable nature of natural wind may still have impacted the outcomes. Previous research has shown that even minor changes in wind direction can significantly alter the spatial distribution of droplet deposition along the test bench [
26]. Additionally, variations in terrain, which are inherent in wheat fields, may have caused boom vibrations, further contributing to the observed discrepancies. These findings highlight the importance of maintaining a highly consistent experimental environment to ensure the reliability of drift potential assessments.
Due to the limitations of the experimental conditions, it was not possible to test droplet drift under high wind speed conditions. Furthermore, the boom sprayer used in the experiment could only be raised to a maximum height of 1.5 m above the ground, while the drift testing bench was 0.3 m high. As a result, the maximum boom height available for droplet drift testing was 1.2 m, which falls short of the requirements for testing droplet drift on tall crops such as corn.
The experimental data also reveal distinct differences in the drift behavior between the LI CHENG VP11003 nozzle and the Teejet XR11003 nozzle. For instance, the TDA of the LI CHENG VP11003 nozzle shows clear stage-wise changes as the boom height increases, whereas no such pattern is observed with the Teejet XR11003 nozzle. This indicates that drift control strategies for sprayers using these two nozzles may need to be specifically tailored to their distinct behaviors to achieve effective drift reduction. The variation in drift potential between different nozzles suggests that a one-size-fits-all approach to drift control is unlikely to be effective. Therefore, studying the drift potential of various nozzles is essential for developing appropriate drift control technologies. Additionally, the experiments demonstrate that fluctuations in boom height during field operations can result in significant variations in drift potential. This underscores the importance of developing advanced boom leveling systems and real-time boom height control technologies to mitigate spray drift. Boom height control not only influences drift and deposition uniformity [
32] but also has implications for economic efficiency. The boom control system used in the experiment was unable to stabilize the boom, requiring operations to be conducted at low vehicle speeds to maintain boom stability, which, in turn, reduced operational efficiency. In contrast, sprayers manufactured by companies such as John Deere are equipped with boom stability control systems, enabling them to operate at higher vehicle speeds and improving operational efficiency. Therefore, the sprayer used in this experiment has significant room for improvement in terms of boom stability control. The drift potential of the LICHENG VP11003 nozzle and the Teejet XR11003 nozzle differs minimally at boom height Stage 1 (0.4–0.6 m). However, at higher boom heights in Stages 1 and 2, the drift potential of the LICHENG VP11003 nozzle is significantly greater than that of the Teejet XR11003 nozzle. As a result, the LICHENG VP11003 nozzle cannot serve as a substitute for the Teejet XR11003 nozzle in its applications. Furthermore, in China, most boom sprayers are equipped with front-mounted booms that are often unstable. To improve sprayer clearance, farmers typically raise the boom height, but the increased pesticide droplet drift caused by higher boom heights poses a serious health risk to operators. Therefore, the use of anti-drift nozzles remains essential for operations involving high boom heights.
The droplet size produced by a nozzle is widely regarded as the primary factor influencing drift risk. Larger droplets are less affected by wind forces and are less likely to drift away from the target area thereby exhibiting a lower drift potential. As such, droplet size is a key indicator of a nozzle’s drift control performance. While most existing research has focused on the impact of droplet size on drift, fewer studies have examined the role of droplet velocity, which may also play a crucial role. Our experimental results comparing the LI CHENG VP11003 and Teejet XR11003 standard flat-fan nozzles reveal significant differences in their drift potential, despite both nozzles producing similar droplet sizes. Notably, the Teejet nozzle outperforms the LI CHENG nozzle in terms of droplet velocity and RS value, which may explain its lower drift potential. These differences in droplet velocity and RS value suggest that nozzle characteristics, particularly those influencing droplet formation and distribution dynamics, can significantly affect drift behavior. As highlighted in previous research [
33,
34], nozzle structure plays a critical role in determining spray characteristics. In light of our findings, further research is needed to investigate the relationship between nozzle structure, droplet size, RS value, and droplet velocity. Specifically, under consistent spray pressure, increasing droplet velocity while reducing the RS value—without significantly decreasing droplet size—could be an effective strategy for reducing pesticide drift. This approach represents a promising direction for the structural optimization of standard flat-fan nozzles and has the potential to greatly enhance drift control in field spraying operations.
5. Conclusions
The spray quality of the commonly used LI CHENG VP11003 nozzle installed on a 3WSH-500 electric boom sprayer was evaluated using PDIA. A comparative analysis of spray quality was carried out with the Teejet XR11003 nozzle. At spray heights ranging from 0.4 to 1.2 m and a spray pressure of 0.3 MPa, the LI CHENG VP11003 nozzle showed an average increase of 8.13% in droplet size, a 4.52% increase in the relative span (RS) value, and a 29.26% decrease in droplet velocity compared to the Teejet XR11003 nozzle.
Drift tests were performed on a 3WSH-500 electric boom sprayer equipped with LI CHENG VP11003 and Teejet XR11003 nozzles, using a field drift test bench. The boom height was categorized into three stages: Stage 1 (0.4–0.6 m), Stage 2 (0.7–0.9 m), and Stage 3 (1.0–1.2 m). For the LI CHENG VP11003 nozzle, the drift percentage was more concentrated in the middle to rear sections of the test bench. In the 7.5–9.5 m range of the bench, the total drift percentage of the LI CHENG VP11003 nozzle across the three boom height stages was 58.99%, 56.38%, and 62.34%, respectively. For the Teejet XR11003 nozzle, the corresponding values were 81.10%, 80.28%, and 60.04%. Drift potential increased with rising boom height. In Stage 3, the drift potential for the LI CHENG VP11003 and Teejet XR11003 nozzles increased by 282.69% and 165.51%, respectively, compared to Stage 1. Across the three boom height stages, the drift potential of the Teejet XR11003 nozzle was reduced by 17.63%, 54.58%, and 42.88% compared to the LI CHENG VP11003 nozzle.
When droplet sizes are comparable, droplet velocity and RS values become critical factors in determining drift potential. Higher droplet velocities and lower RS values tend to reduce drift. At the same time, they enhance drift deposition in the latter section of the test bench. To optimize drift control, domestic nozzles should undergo structural improvements, such as the shape and size of the orifice, to enhance droplet size distribution and velocity. Changes in boom height have a significant impact on drift. For the LI CHENG VP11003 nozzle, moderate height adjustments within the Stage 1 range can improve sprayer clearance. However, exceeding this range results in a substantial increase in drift. In contrast, the boom height for the Teejet XR11003 nozzle should not be adjusted arbitrarily. Boom sprayers should incorporate real-time height adjustment and stability control systems to effectively reduce drift during operation.
Author Contributions
Conceptualization, X.P. and C.Z.; methodology, X.P., C.Z., S.Y., Y.G. and W.Q.; validation, C.Z.; formal analysis, C.Z., X.P. and S.Y.; investigation, X.P., S.Y. and Y.G.; resources, C.Z. and S.Y.; data curation, X.P.; writing—original draft preparation, X.P.; writing—review and editing, C.Z., W.Q., S.Y. and Z.W.; visualization, X.P.; supervision, W.Q., C.Z. and S.Y. All authors have read and agreed to the published version of the manuscript.
Funding
This research was funded by the National Natural Science Foundation of China (32201661), S.Y.; the Reform and Development Project of Beijing Academy of Agricultural and Forestry Sciences, S.Y.; the Jiangsu Province and Education Ministry Cosponsored Synergistic Innovation Center of Modern Agricultural Equipment (XTCX1002), C.Z; the Youth Science Foundation of Beijing Academy of Agricultural and Forestry Sciences (QNJJ202210), S.Y.; and the Science and Technology Project of Wuhu City (20231y05), C.Z.
Data Availability Statement
The data presented in this study are available upon request from the corresponding author.
Acknowledgments
The authors are grateful to Jianguo Wu and Jiakai Wang for their support in the investigation, and to Senlin Song for his support in data curation.
Conflicts of Interest
The authors declare no conflicts of interest.
References
- Jia, W.D.; Zhang, L.J.; Yan, M.D.; Xue, X.Y. Current situation and development trend of boom sprayer. J. Chin. Agric. Mech. 2013, 34, 19–22. [Google Scholar]
- Liu, X.H.; Yuan, L.L.; Shi, X.; Du, Y.H.; Yang, D.B.; Yuan, K.Z.; Yan, X.J. Research progress on spray drift of droplets of plant protection machainery. Chin. J. Pestic. Sci. 2022, 24, 232–247. [Google Scholar]
- ISO 22401; Equipment for Crop Protection—Method for Measurement of Potential Spray Drift from Horizontal Boom Sprayers by the Use of a Test Bench. ISO: Geneva, Switzerland, 2015.
- Gil, E.; Balsari, P.; Gallart, M.; Llorens, J.; Marucco, P.; Andersen, P.G.; Fàbregas, X.; Llop, J. Determination of drift potential of different flat fan nozzles on a boom sprayer using a test bench. Crop Prot. 2014, 56, 58–68. [Google Scholar] [CrossRef]
- Balsari, P.; Marucco, P.; Tamagnone, M. A test bench for the classification of boom sprayers according to drift risk. Crop Prot. 2007, 26, 1482–1489. [Google Scholar] [CrossRef]
- Nuyttens, D.; Zwertuaegher, I.K.A.; Dekeyser, D. Spray drift assessment of different application techniques using a drift test bench and comparison with other assessment methods. Biosyst. Eng. 2017, 154, 14–24. [Google Scholar] [CrossRef]
- Wang, C.; Wongsuk, S.; Huang, Z.; Yu, C.; Han, L.; Zhang, J.; Sun, W.; Zeng, A.; He, X. Comparison between Drift Test Bench and Other Techniques in Spray Drift Evaluation of an Eight-Rotor Unmanned Aerial Spraying System: The Influence of Meteorological Parameters and Nozzle Types. Agronomy 2023, 13, 270. [Google Scholar] [CrossRef]
- Wongsuk, S.; Zhu, Z.Y.; Zheng, A.J.; Qi, P.; Li, Y.F.; Huang, Z.; Han, H.; Wang, C.L.; He, X.K. Assessing the potential spray drift of a six-rotor unmanned aerial vehicle sprayer using a test bench and airborne drift collectors under low wind velocities: Impact of atomization characteristics and application parameters. Pest Manag. Sci. 2024, 80, 6053–6067. [Google Scholar] [CrossRef]
- Marco, G.; Paolo, M.; Paolo, B. Toward a new method to classify the airblast sprayers according to their potential drift reduction: Comparison of direct and new indirect measurement methods. Pest Manag. Sci. 2019, 75, 2219–2235. [Google Scholar]
- Wu, J.; Li, C.; Pan, X.; Wang, X.; Zhao, X.; Gao, Y.; Yang, S.; Zhai, C. Model for Detecting Boom Height Based on an Ultrasonic Sensor for the Whole Growth Cycle of Wheat. Agriculture 2024, 14, 21. [Google Scholar] [CrossRef]
- Li, F.; Bai, X.; Su, Z.; Tang, S.; Wang, Z.; Li, F.; Yu, H. Development of a Control System for Double-Pendulum Active Spray Boom Suspension Based on PSO and Fuzzy PID. Agriculture 2023, 13, 1660. [Google Scholar] [CrossRef]
- Da Cunha, J.P.A.R.; De Morais Silva, R.A. Volumetric distribution uniformity of spray nozzles under different liquid pressures and boom heights. Biosci. J. 2010, 26, 52–58. [Google Scholar]
- Dou, H.; Wang, S.; Zhai, C.; Chen, L.; Wang, X.; Zhao, X. A LiDAR Sensor-Based Spray Boom Height Detection Method and the Corresponding Experimental Validation. Sensors 2021, 21, 2107. [Google Scholar] [CrossRef]
- Burgers, T.A.; Gaard, J.D.; Hyronimus, B.J. Comparison of Three Commercial Automatic Boom Height Systems for Agricultural Sprayers. Appl. Eng. Agric. 2021, 37, 287–298. [Google Scholar] [CrossRef]
- Chen, S.; Lan, Y.; Zhou, Z.; Ouyang, F.; Wang, G.; Huang, X.; Deng, X.; Cheng, S. Effect of Droplet Size Parameters on Droplet Deposition and Drift of Aerial Spraying by Using Plant Protection UAV. Agronomy 2020, 10, 195. [Google Scholar] [CrossRef]
- Wang, S.; Dorr, G.J.; Khashehchi, M.; He, X. Performance of Selected Agricultural Spray Nozzles using Particle Image Velocimetry. J. Agric. Sci. Technol. 2015, 17, 601–613. [Google Scholar]
- De Schamphelerie, M.; Spanoghe, P.; Nuyttens, D.; Baetens, K.; Cornelis, W.; Gabriels, D.; Van der Meeren, P. Classification of spray nozzles based on droplet size distributions and wind tunnel tests. Commun. Agric. Appl. Biol. Sci. 2006, 71, 201–207. [Google Scholar]
- Liu, Q.; Shan, C.; Zhang, H.; Song, C.; Lan, Y. Evaluation of Liquid Atomization and Spray Drift Reduction of Hydraulic Nozzles with Four Spray Adjuvant Solutions. Agriculture 2023, 13, 236. [Google Scholar] [CrossRef]
- Nuyttens, D.; Taylor, W.A.; De Schampheleire, M.; Verboven, P.; Dekeyser, D. Influence of nozzle type and size on drift potential by means of different wind tunnel evaluation methods. Biosyst. Eng. 2009, 103, 271–280. [Google Scholar] [CrossRef]
- Vieira, B.C.; Butts, T.R.; Rodrigues, A.O.; Schleier, J.J.; Fritz, B.K.; Kruger, G.R. Particle drift potential of glyphosate plus 2,4-D choline pre-mixture formulation in a low-speed wind tunnel. Weed Technol. 2020, 34, 520–527. [Google Scholar] [CrossRef]
- Nuyttens, D.; De Schampheleire, M.; Verboven, P.; Brusselman, E.; Dekeyser, D. Droplet size and velocity characteristics of agricultural sprays. Trans. ASABE 2009, 52, 1471–1480. [Google Scholar] [CrossRef]
- Wu, J.; Yang, S.; Gao, Y.; Pan, X.; Zou, W.; Wei, Y.; Zhai, C.; Chen, L. Optimization of a Boom Height Ultrasonic Detecting Model for the Whole Growth Cycle of Wheat: Affected by the Oscillation of the Three-Section Boom of the Sprayer. Agriculture 2024, 14, 1733. [Google Scholar] [CrossRef]
- Li, J.; Nie, Z.; Chen, Y.; Ge, D.; Li, M. Development of Boom Posture Adjustment and Control System for Wide Spray Boom. Agriculture 2023, 13, 2162. [Google Scholar] [CrossRef]
- Alidoost, D.R.; Milad, K.; Yu, S.H.; Choi, Y.; Jee-Keun, L. Design and Performance Evaluation of Air Induction (AI) Nozzles to Reduce Drift Potential for Agricultural Unmanned Aerial Vehicles (UAVs). J. Biosyst. Eng. 2021, 46, 462–473. [Google Scholar]
- Balsari, P.; Gil, E.; Marucco, P.; van de Zande, J.C.; Nuyttens, D.; Herbst, A.; Gallart, M. Field-crop-sprayer potential drift measured using test bench: Effects of boom height and nozzle type. Biosyst. Eng. 2017, 154, 3–13. [Google Scholar] [CrossRef]
- Gil, E.; Gallart, M.; Balsari, P.; Marucco, P.; Almajano, M.P.; Llop, J. Influence of wind velocity and wind direction on measurements of spray drift potential of boom sprayers using drift test bench. Agric. For. Meteorol. 2015, 202, 94–101. [Google Scholar] [CrossRef]
- Vanella, G.; Salyani, M.; Balsari, P.; Futch, S.H.; Sweeb, R.D. A Method for Assessing Drift Potential of a Citrus Herbicide Applicator. Horttechnology 2011, 21, 745–751. [Google Scholar] [CrossRef]
- Wang, X.N.; He, X.K.; Herbst, A.; Langenakens, J.; Zheng, J.Q.; Li, Y.L. Development and performance test of spray drift test system for sprayer with bar. Trans. Chin. Soc. Agric. Eng. 2014, 30, 55–62. [Google Scholar]
- Hu, J.; Liu, C.X.; Wang, Z.C.; Li, Y.F.; Song, J.L.; Liu, Y.J.; Chu, X. Motion model for describing the quantity of air in droplets through changing the structure of air induction nozzle. Int. J. Agric. Biol. Eng. 2021, 14, 35–40. [Google Scholar] [CrossRef]
- Li, X.; Chen, L.; Tang, Q.; Li, L.; Cheng, W.; Hu, P.; Zhang, R. Characteristics on the Spatial Distribution of Droplet Size and Velocity with Difference Adjuvant in Nozzle Spraying. Agronomy 2022, 12, 1960. [Google Scholar] [CrossRef]
- Li, X.P.; Zhang, R.R.; Tang, Q.; Li, L.L.; Ding, C.C.; Chen, L.P. Experimental study on the spatial distribution of spray nozzle atomization droplet size and velocity. J. Agric. Mech. Res. 2024, 46, 159–167. [Google Scholar]
- Markowski, P.; Kaliniewicz, Z.; Lipiński, A.; Lipiński, S.; Burg, P.; Mašán, V. Horizontal Distribution of Liquid in an Over-Row Sprayer with a Secondary Air Blower. Appl. Sci. 2024, 14, 9036. [Google Scholar] [CrossRef]
- Dafsari, R.A.; Yu, S.; Choi, Y.; Lee, J. Effect of geometrical parameters of air-induction nozzles on droplet characteristics and behaviour. Biosyst. Eng. 2021, 209, 14–29. [Google Scholar] [CrossRef]
- Kasbi, M.K.; Dafsari, R.A.; Charanandeh, A.; Yu, S.; Choi, Y.; Lee, J. Parametric study on the internal geometry affecting agricultural air induction nozzle performance. Phys. Fluids 2023, 35, 023316. [Google Scholar] [CrossRef]
Figure 1.
Spray quality test bench: 1. electric diaphragm pump (provides stable flow rate for nozzle), 2. water distributor (regulates pressure), 3. nozzle, 4. PC (control PDIA and store data), 5. lifting platform (change measurement position), 6. PDIA (measure droplet size and velocity), 7. water tank.
Figure 2.
Information collection system.
Figure 2.
Information collection system.
Figure 3.
Test bench layout and boom height measurement: (a) Test bench layout; (b) measurement of boom height.
Figure 3.
Test bench layout and boom height measurement: (a) Test bench layout; (b) measurement of boom height.
Figure 4.
Trilogy 720-000 fluorometer and Petri dishes for testing.
Figure 4.
Trilogy 720-000 fluorometer and Petri dishes for testing.
Figure 5.
Changes in D[V,0.5] and droplet velocity with boom height: (a) D[V,0.5]; (b) droplet velocity.
Figure 5.
Changes in D[V,0.5] and droplet velocity with boom height: (a) D[V,0.5]; (b) droplet velocity.
Figure 6.
Variation in drift along test bench at different boom heights: (a) LI CHENG VP11003; (b) Teejet XR11003.
Figure 6.
Variation in drift along test bench at different boom heights: (a) LI CHENG VP11003; (b) Teejet XR11003.
Figure 7.
Boom height variation during experiment.
Figure 7.
Boom height variation during experiment.
Figure 8.
Variation in drift along test bench at different stages of boom height: (a) LI CHENG VP11003; (b) Teejet XR11003.
Figure 8.
Variation in drift along test bench at different stages of boom height: (a) LI CHENG VP11003; (b) Teejet XR11003.
Figure 9.
Comparison of drift from two nozzles after normalization: (a) Stage 1; (b) Stage 2; (c) Stage 3.
Figure 9.
Comparison of drift from two nozzles after normalization: (a) Stage 1; (b) Stage 2; (c) Stage 3.
Figure 10.
Comparison of drift potential between two nozzles.
Figure 10.
Comparison of drift potential between two nozzles.
Table 1.
Nozzle parameters.
Table 1.
Nozzle parameters.
| | LI CHENG VP11003 | Teejet XR11003 |
|---|
| | ![Agronomy 15 00160 i001]() | ![Agronomy 15 00160 i002]() |
| Flow rate (0.3 MPa, L/min) | 1.2 | 1.188 |
| Droplet size (0.3 MPa, D[V,0.5], μm) | 143.57 | 135.9 |
| Droplet velocity (0.3 MPa, m/s) | 2.4 | 3.03 |
| Price (CNY/unit) | 2 | 56 |
Table 2.
Measurement results of droplet size and velocity.
Table 2.
Measurement results of droplet size and velocity.
| Nozzle | Nozzle Height/m | D[V,0.1]/μm | D[V,0.5]/μm | D[V,0.9]/μm | V/m/s | RS |
|---|
| LI CHENG VP110 03 | 0.4 | 73.90 | 128.03 | 193.30 | 2.67 | 0.93 |
| 0.5 | 77.67 | 143.57 | 226.40 | 2.40 | 1.04 |
| 0.6 | 80.43 | 156.27 | 255.27 | 2.37 | 1.12 |
| 0.7 | 84.53 | 175.30 | 278.23 | 1.90 | 1.10 |
| 0.8 | 87.37 | 185.23 | 295.40 | 1.73 | 1.12 |
| 0.9 | 86.23 | 191.13 | 301.17 | 1.60 | 1.12 |
| 1.0 | 90.10 | 202.57 | 313.03 | 1.40 | 1.10 |
| 1.1 | 88.53 | 197.20 | 311.97 | 1.40 | 1.13 |
| 1.2 | 92.32 | 206.78 | 316.86 | 1.38 | 1.09 |
| Teejet XR110 03 | 0.4 | 73.20 | 118.70 | 178.87 | 3.23 | 0.89 |
| 0.5 | 78.30 | 135.90 | 212.00 | 3.03 | 0.98 |
| 0.6 | 82.17 | 148.93 | 236.77 | 2.80 | 1.04 |
| 0.7 | 84.30 | 154.13 | 249.57 | 2.63 | 1.07 |
| 0.8 | 87.37 | 166.33 | 271.63 | 2.30 | 1.11 |
| 0.9 | 89.63 | 172.70 | 277.57 | 2.17 | 1.09 |
| 1.0 | 92.40 | 183.07 | 286.70 | 1.93 | 1.06 |
| 1.1 | 94.13 | 186.63 | 289.33 | 1.83 | 1.05 |
| 1.2 | 97.26 | 188.26 | 291.38 | 1.69 | 1.03 |
Table 3.
Deposition per unit area of LI CHENG VP110 03 nozzle.
Table 3.
Deposition per unit area of LI CHENG VP110 03 nozzle.
Distance
/m | Drift Per Unit Area (Di)/μL/cm2 |
|---|
| BH 1 0.4m | BH 0.5m | BH 0.6m | BH 0.7m | BH 0.8m | BH 0.9m | BH 1.0m | BH 1.1m | BH 1.2m |
|---|
| 0 | 0.0051 | 0.0042 | 0.0005 | 0.0026 | 0.0049 | 0.0064 | 0.0463 | 0.0037 | 0.0189 |
| 0.5 | 0.0052 | 0.0078 | −0.0002(0) 2 | 0.0025 | 0.0059 | 0.0055 | 0.0408 | 0.0079 | 0.0202 |
| 1 | 0.0032 | 0.0033 | −0.0016(0) | 0.0023 | 0.0054 | 0.0046 | 0.0416 | 0.0038 | 0.0363 |
| 1.5 | 0.0021 | 0.0025 | 0.0030 | 0.0077 | 0.0092 | 0.0037 | 0.0406 | 0.0071 | 0.0606 |
| 2 | 0.0019 | 0.0040 | −0.0025(0) | 0.0094 | 0.0184 | 0.0034 | 0.0488 | 0.0176 | 0.0764 |
| 2.5 | 0.0059 | 0.0035 | −0.0004(0) | 0.0065 | 0.0315 | 0.0061 | 0.0596 | 0.0277 | 0.1048 |
| 3 | 0.0064 | 0.0092 | −0.0016(0) | 0.0152 | 0.0368 | 0.0098 | 0.0603 | 0.0711 | 0.0900 |
| 3.5 | 0.0081 | 0.0082 | 0.0001 | 0.0239 | 0.0411 | 0.0136 | 0.0708 | 0.0218 | 0.0906 |
| 4 | 0.0210 | 0.0170 | 0.0146 | 0.0230 | 0.0583 | 0.0169 | 0.0962 | 0.0673 | 0.1038 |
| 4.5 | 0.0186 | 0.0214 | 0.0088 | 0.0295 | 0.0783 | 0.0207 | 0.1118 | 0.0775 | 0.1012 |
| 5 | 0.0106 | 0.0131 | 0.0085 | 0.0661 | 0.0874 | 0.0334 | 0.1330 | 0.1339 | 0.1166 |
| 5.5 | 0.0257 | 0.0099 | 0.0153 | 0.1161 | 0.0982 | 0.0535 | 0.1585 | 0.1285 | 0.1292 |
| 6 | 0.0345 | 0.0497 | 0.0263 | 0.1173 | 0.0844 | 0.0790 | 0.1649 | 0.2388 | 0.1364 |
| 6.5 | 0.0437 | 0.0451 | 0.0209 | 0.0771 | 0.0770 | 0.0886 | 0.1747 | 0.2742 | 0.1685 |
| 7 | 0.0345 | 0.0448 | 0.0312 | 0.0693 | 0.0846 | 0.1104 | 0.1939 | 0.2715 | 0.1975 |
| 7.5 | 0.0322 | 0.0349 | 0.0393 | 0.1102 | 0.1153 | 0.1102 | 0.2358 | 0.2488 | 0.2878 |
| 8 | 0.0316 | 0.0652 | 0.0446 | 0.1006 | 0.1312 | 0.1066 | 0.2502 | 0.3149 | 0.5304 |
| 8.5 | 0.0414 | 0.0534 | 0.0552 | 0.1307 | 0.1663 | 0.1358 | 0.2829 | 0.3622 | 0.5640 |
| 9 | 0.0481 | 0.0685 | 0.0907 | 0.1752 | 0.2092 | 0.1467 | 0.4100 | 0.6198 | 0.7748 |
| 9.5 | 0.0833 | 0.0914 | 0.0823 | 0.1831 | 0.2655 | 0.1703 | 0.4832 | 0.7829 | 0.8804 |
| TDA | 0.4630 | 0.5571 | 0.4416 | 1.2682 | 1.6090 | 1.1251 | 3.1039 | 3.6811 | 4.4886 |
Table 4.
Deposition per unit area of Teejet 110 03 nozzle.
Table 4.
Deposition per unit area of Teejet 110 03 nozzle.
| Distance | Drift Per Unit Area (Di)/μL/cm2 |
|---|
| /m | BH 0.4m | BH 0.5m | BH 0.6m | BH 0.7m | BH 0.8m | BH 0.9m | BH 1.0m | BH 1.1m | BH 1.2m |
|---|
| 0 | −0.0026(0) | 0.0022 | 0.0014 | −0.0027(0) | −0.0015(0) | 0.0046 | 0.0061 | 0.0078 | 0.0083 |
| 0.5 | −0.0029(0) | −0.0016(0) | 0.0006 | −0.0034(0) | −0.0022(0) | −0.0005(0) | 0.0151 | 0.0081 | 0.0147 |
| 1 | −0.0025(0) | −0.0012(0) | −0.0017(0) | −0.0014(0) | −0.0022(0) | 0 | 0.0127 | 0.0071 | 0.0133 |
| 1.5 | 0.0003 | −0.0027(0) | −0.0016(0) | 0.0008 | −0.0012(0) | 0.003 | 0.0055 | 0.0153 | 0.0141 |
| 2 | −0.0028(0) | 0.0002 | −0.0018(0) | −0.0001(0) | −0.0021(0) | 0.0022 | 0.002 | 0.0074 | 0.0099 |
| 2.5 | −0.0018(0) | −0.0005(0) | −0.0006(0) | 0.0023 | −0.0020(0) | −0.0016(0) | −0.0015(0) | 0.0064 | 0.0077 |
| 3 | −0.0021(0) | −0.0014(0) | −0.0026(0) | 0.0017 | −0.0026(0) | −0.0008(0) | −0.0017(0) | 0.0068 | 0.0051 |
| 3.5 | −0.0004(0) | −0.0030(0) | −0.0020(0) | 0.0011 | −0.0012(0) | −0.0008(0) | −0.0004(0) | 0.0085 | 0.0076 |
| 4 | 0.0004 | 0.0036 | 0.0013 | −0.0008(0) | 0.0001 | 0 | 0.0042 | 0.0099 | 0.0075 |
| 4.5 | 0.0002 | 0.0026 | 0.0007 | 0.0015 | 0.0043 | 0 | 0.0151 | 0.0134 | 0.0084 |
| 5 | 0.0028 | 0.004 | 0.0027 | 0.0034 | 0.0087 | 0.0014 | 0.0296 | 0.0172 | 0.0104 |
| 5.5 | 0.0019 | −0.0002(0) | 0.0028 | 0.0255 | 0.0097 | 0.0041 | 0.009 | 0.0296 | 0.0111 |
| 6 | 0.0047 | 0.0027 | 0.0026 | 0.0168 | 0.01 | 0.0073 | 0.0372 | 0.0217 | 0.0088 |
| 6.5 | 0.0084 | 0.0081 | 0.0071 | 0.0175 | 0.0138 | 0.016 | 0.0332 | 0.042 | 0.0186 |
| 7 | 0.0058 | 0.0136 | 0.0155 | 0.0214 | 0.0172 | 0.0197 | 0.0499 | 0.0438 | 0.026 |
| 7.5 | 0.0099 | 0.0128 | 0.0453 | 0.0296 | 0.0367 | 0.0225 | 0.0229 | 0.0502 | 0.0325 |
| 8 | 0.0014 | 0.0317 | 0.0404 | 0.0467 | 0.0423 | 0.0241 | 0.027 | 0.0468 | 0.0596 |
| 8.5 | 0.0025 | 0.0314 | 0.0449 | 0.0515 | 0.0598 | 0.0601 | 0.0692 | 0.0555 | 0.0955 |
| 9 | 0.0094 | 0.0306 | 0.0577 | 0.0489 | 0.0624 | 0.1206 | 0.0663 | 0.0435 | 0.0906 |
| 9.5 | 0.0069 | 0.0332 | 0.0545 | 0.0662 | 0.0998 | 0.1001 | 0.0692 | 0.1053 | 0.1215 |
| TDA | 0.0547 | 0.1767 | 0.2774 | 0.3348 | 0.3648 | 0.3857 | 0.4742 | 0.5462 | 0.5714 |
Table 5.
Test nozzles and fitted equations for TDA and boom height.
Table 5.
Test nozzles and fitted equations for TDA and boom height.
| Nozzle | Fitting Formula of TDA and Boom Height | R2 |
|---|
| LI CHENG VP11003 | y = 7.2597x2 − 6.5062x + 1.9345 | 0.9401 |
| Teejet XR11003 | y = −0.3212x2 + 1.1172x − 0.3127 | 0.9759 |
Table 6.
Drift Potential.
Table 6.
Drift Potential.
| Nozzle | DVP/% |
|---|
| Stage 1 | Stage 2 | Stage 3 |
|---|
| LI CHENG VP11003 | 19.58 | 46.33 | 74.93 |
| Teejet XR11003 | 16.12 | 21.04 | 42.80 |
| Disclaimer/Publisher’s Note: The statements, opinions and data contained in all publications are solely those of the individual author(s) and contributor(s) and not of MDPI and/or the editor(s). MDPI and/or the editor(s) disclaim responsibility for any injury to people or property resulting from any ideas, methods, instructions or products referred to in the content. |
© 2025 by the authors. Licensee MDPI, Basel, Switzerland. This article is an open access article distributed under the terms and conditions of the Creative Commons Attribution (CC BY) license (https://creativecommons.org/licenses/by/4.0/).


 ,
, 


