
Deep Learning-Assisted Measurement of Liquid Sheet Structure in the Atomization of Hydraulic Nozzle Spraying
 ,
, 
 ,
,  and
and
Abstract
1. Introduction
2. Materials and Methods
2.1. Experimental Materials
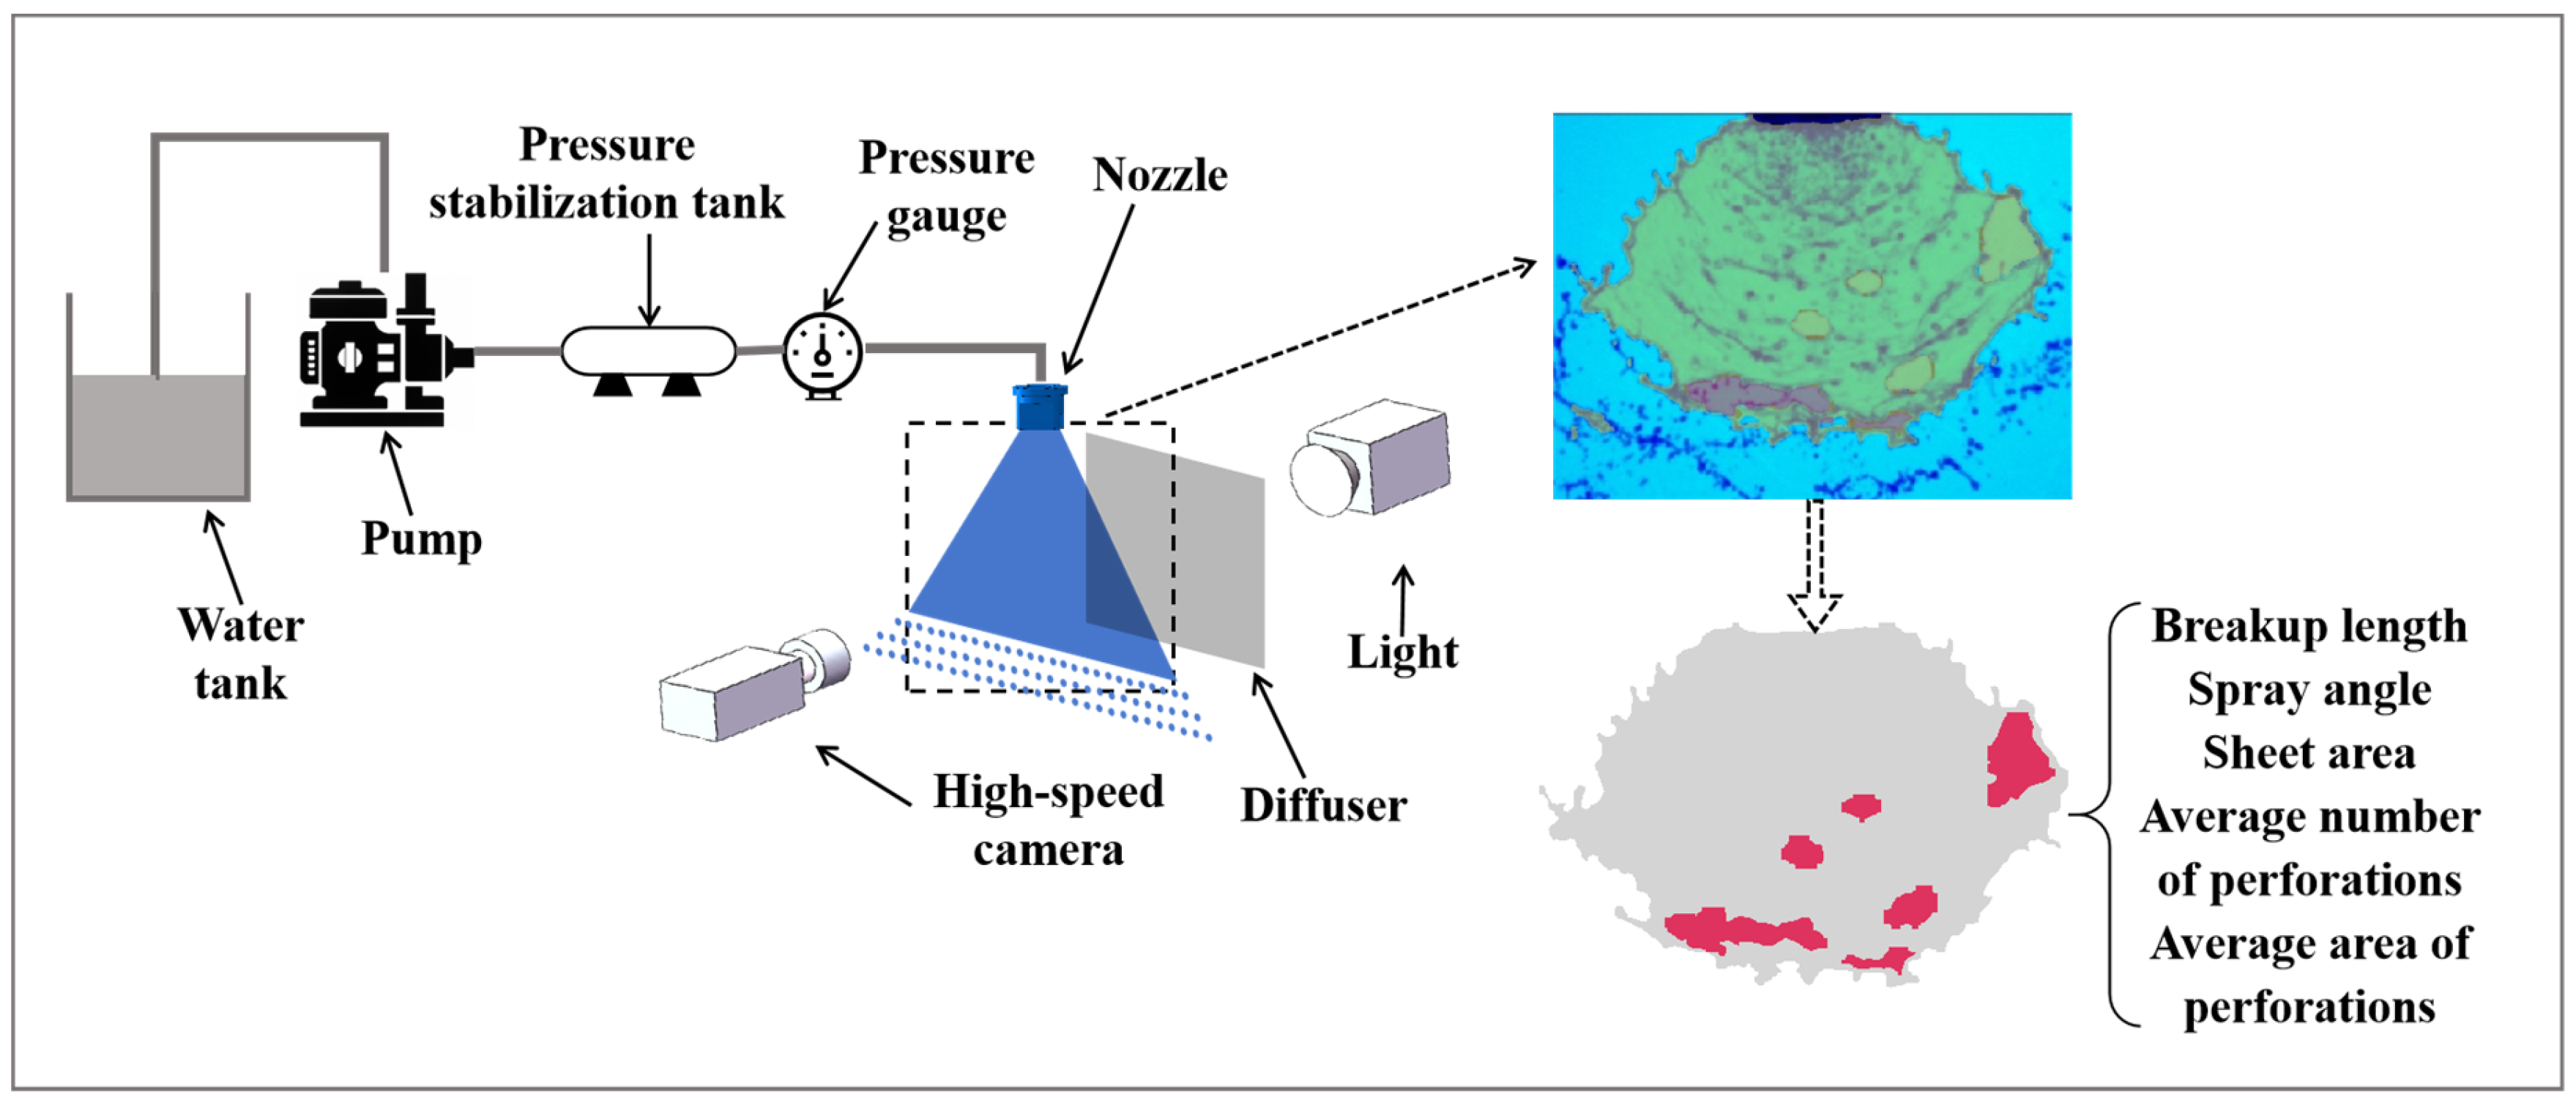
2.2. Experimental Platform
2.3. Liquid Sheet Image Capture Experiment
3. Liquid Sheet Structure Recognition Modeling and Parameters Measurement
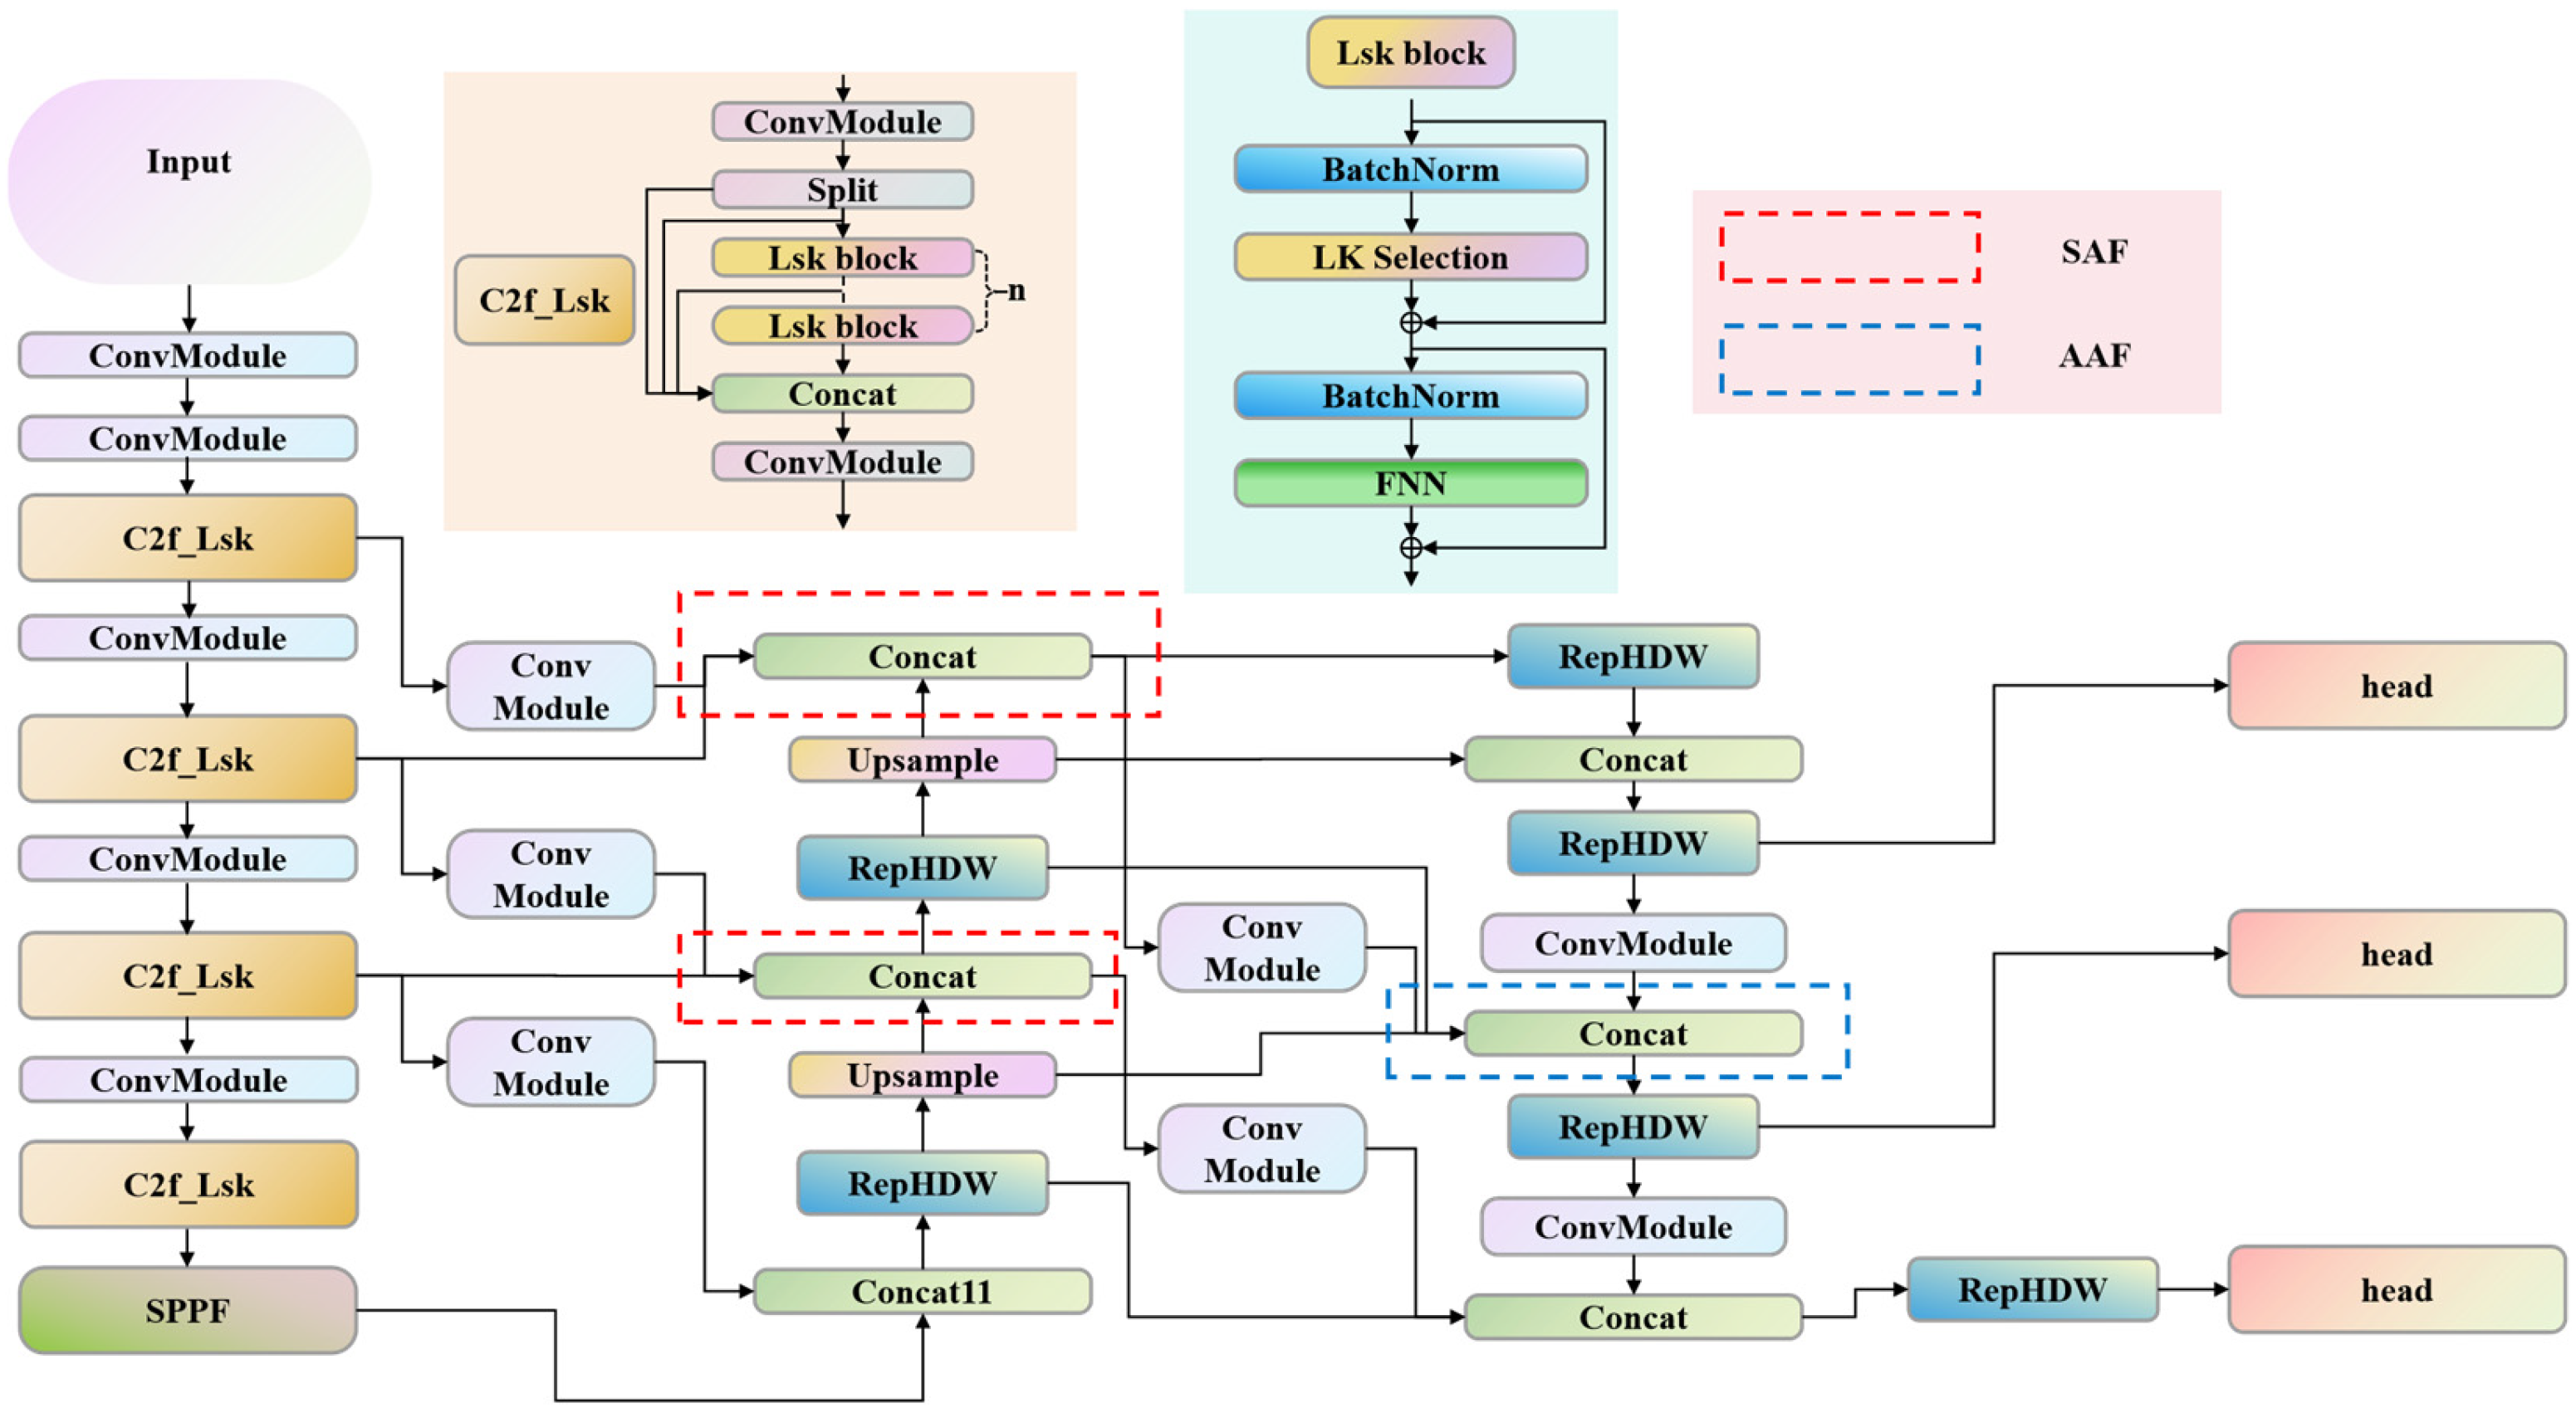
3.1. Recognition Model
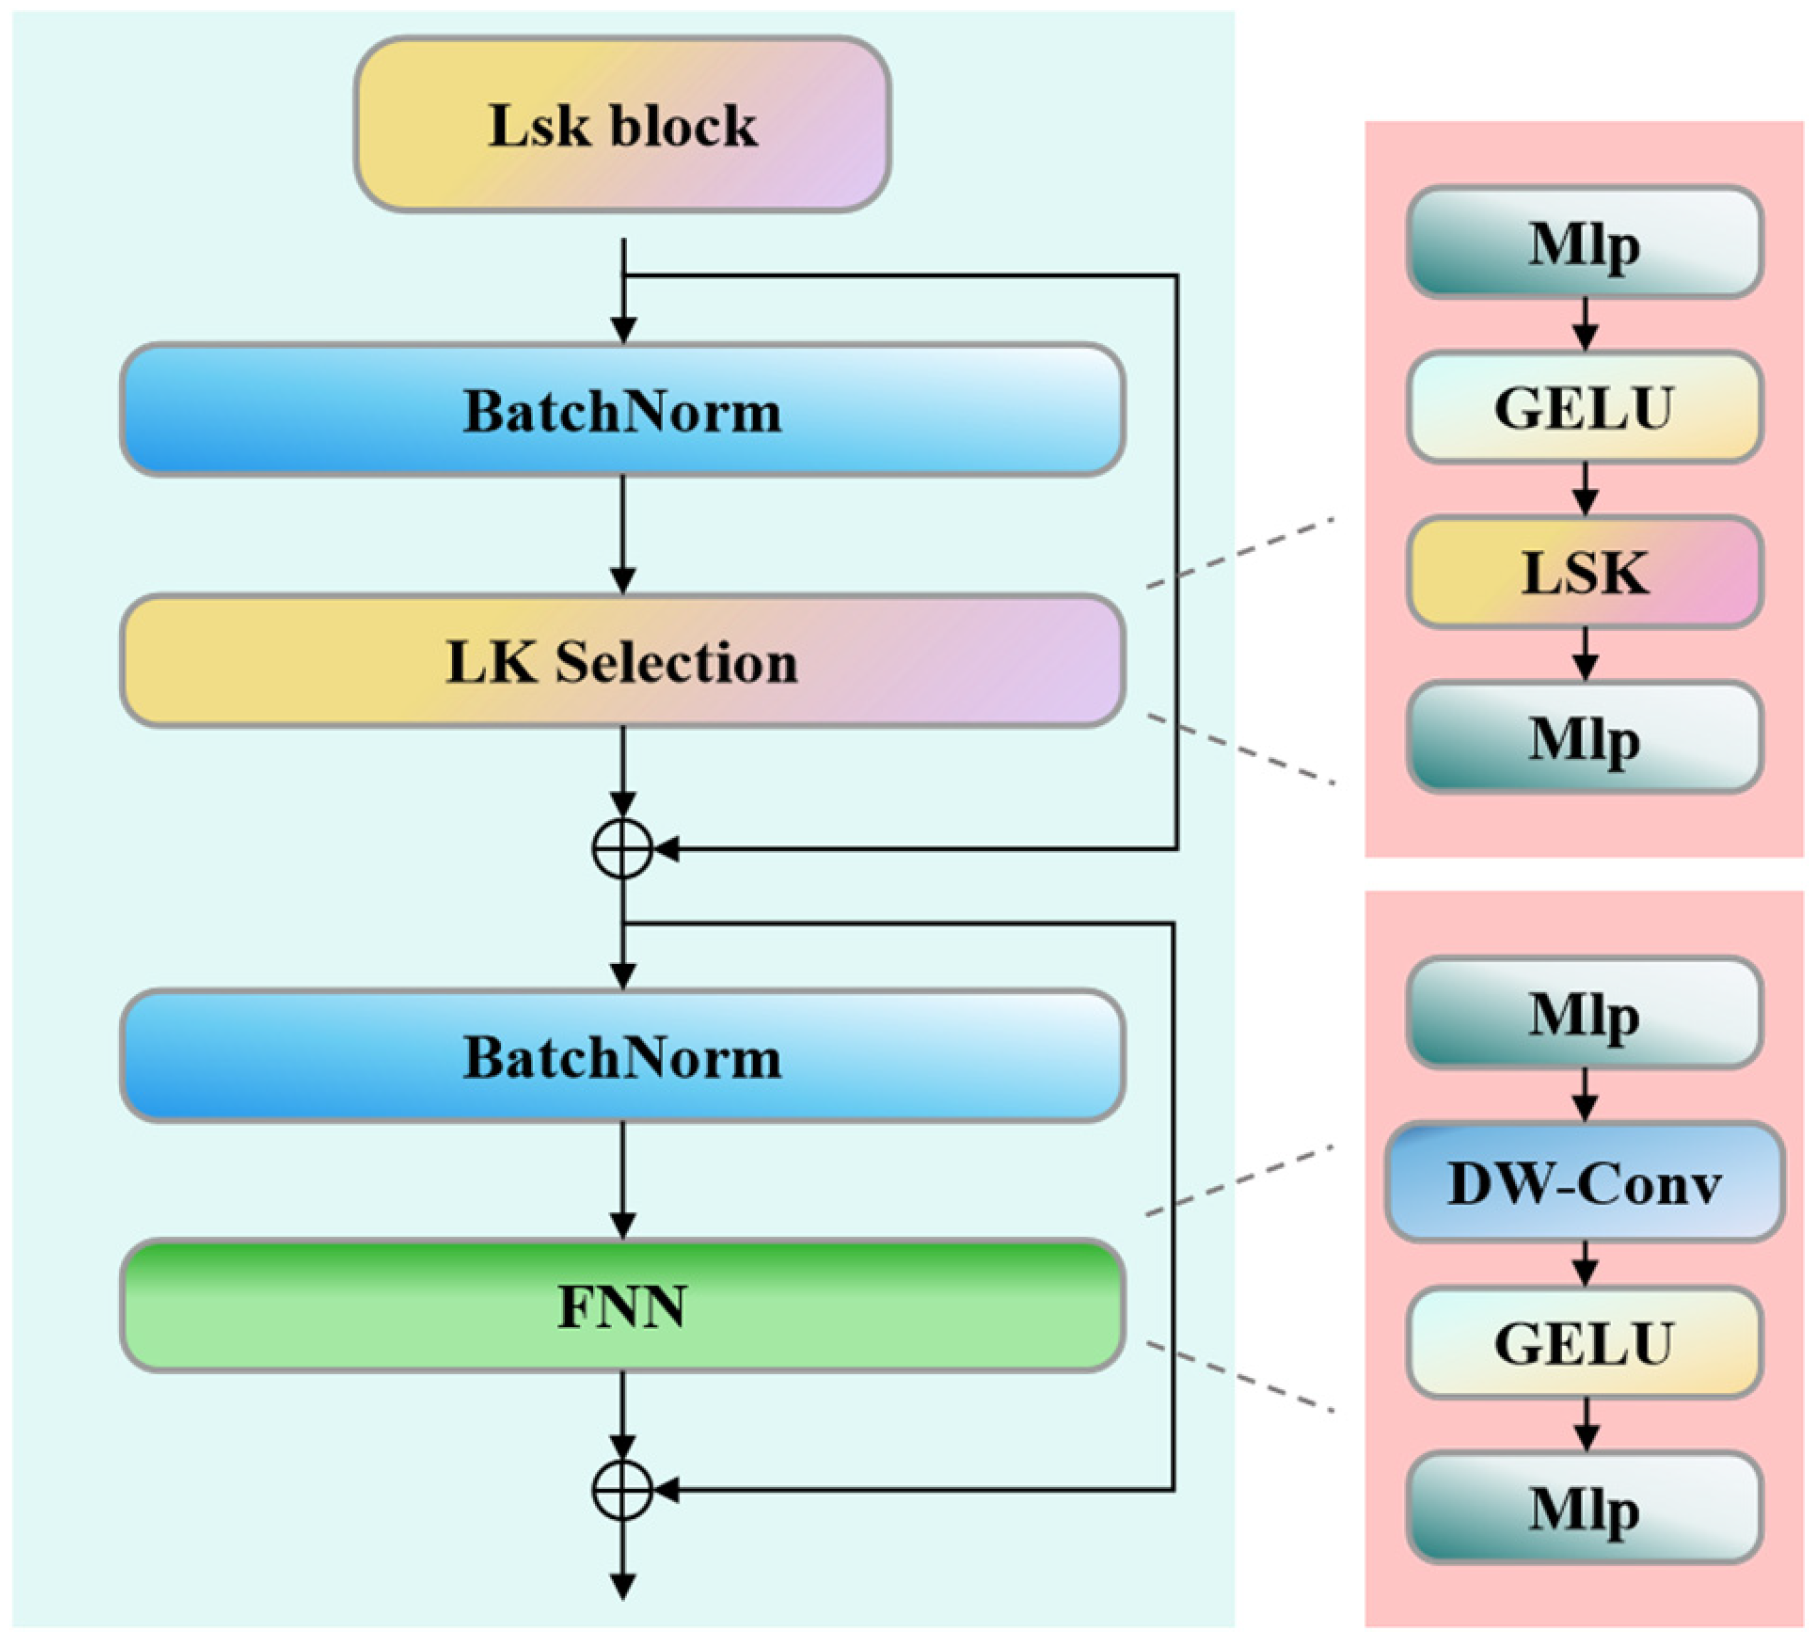
3.1.1. C2f_LSK Module: Dynamically Capturing Liquid Sheet Image Features via Selective Kernels
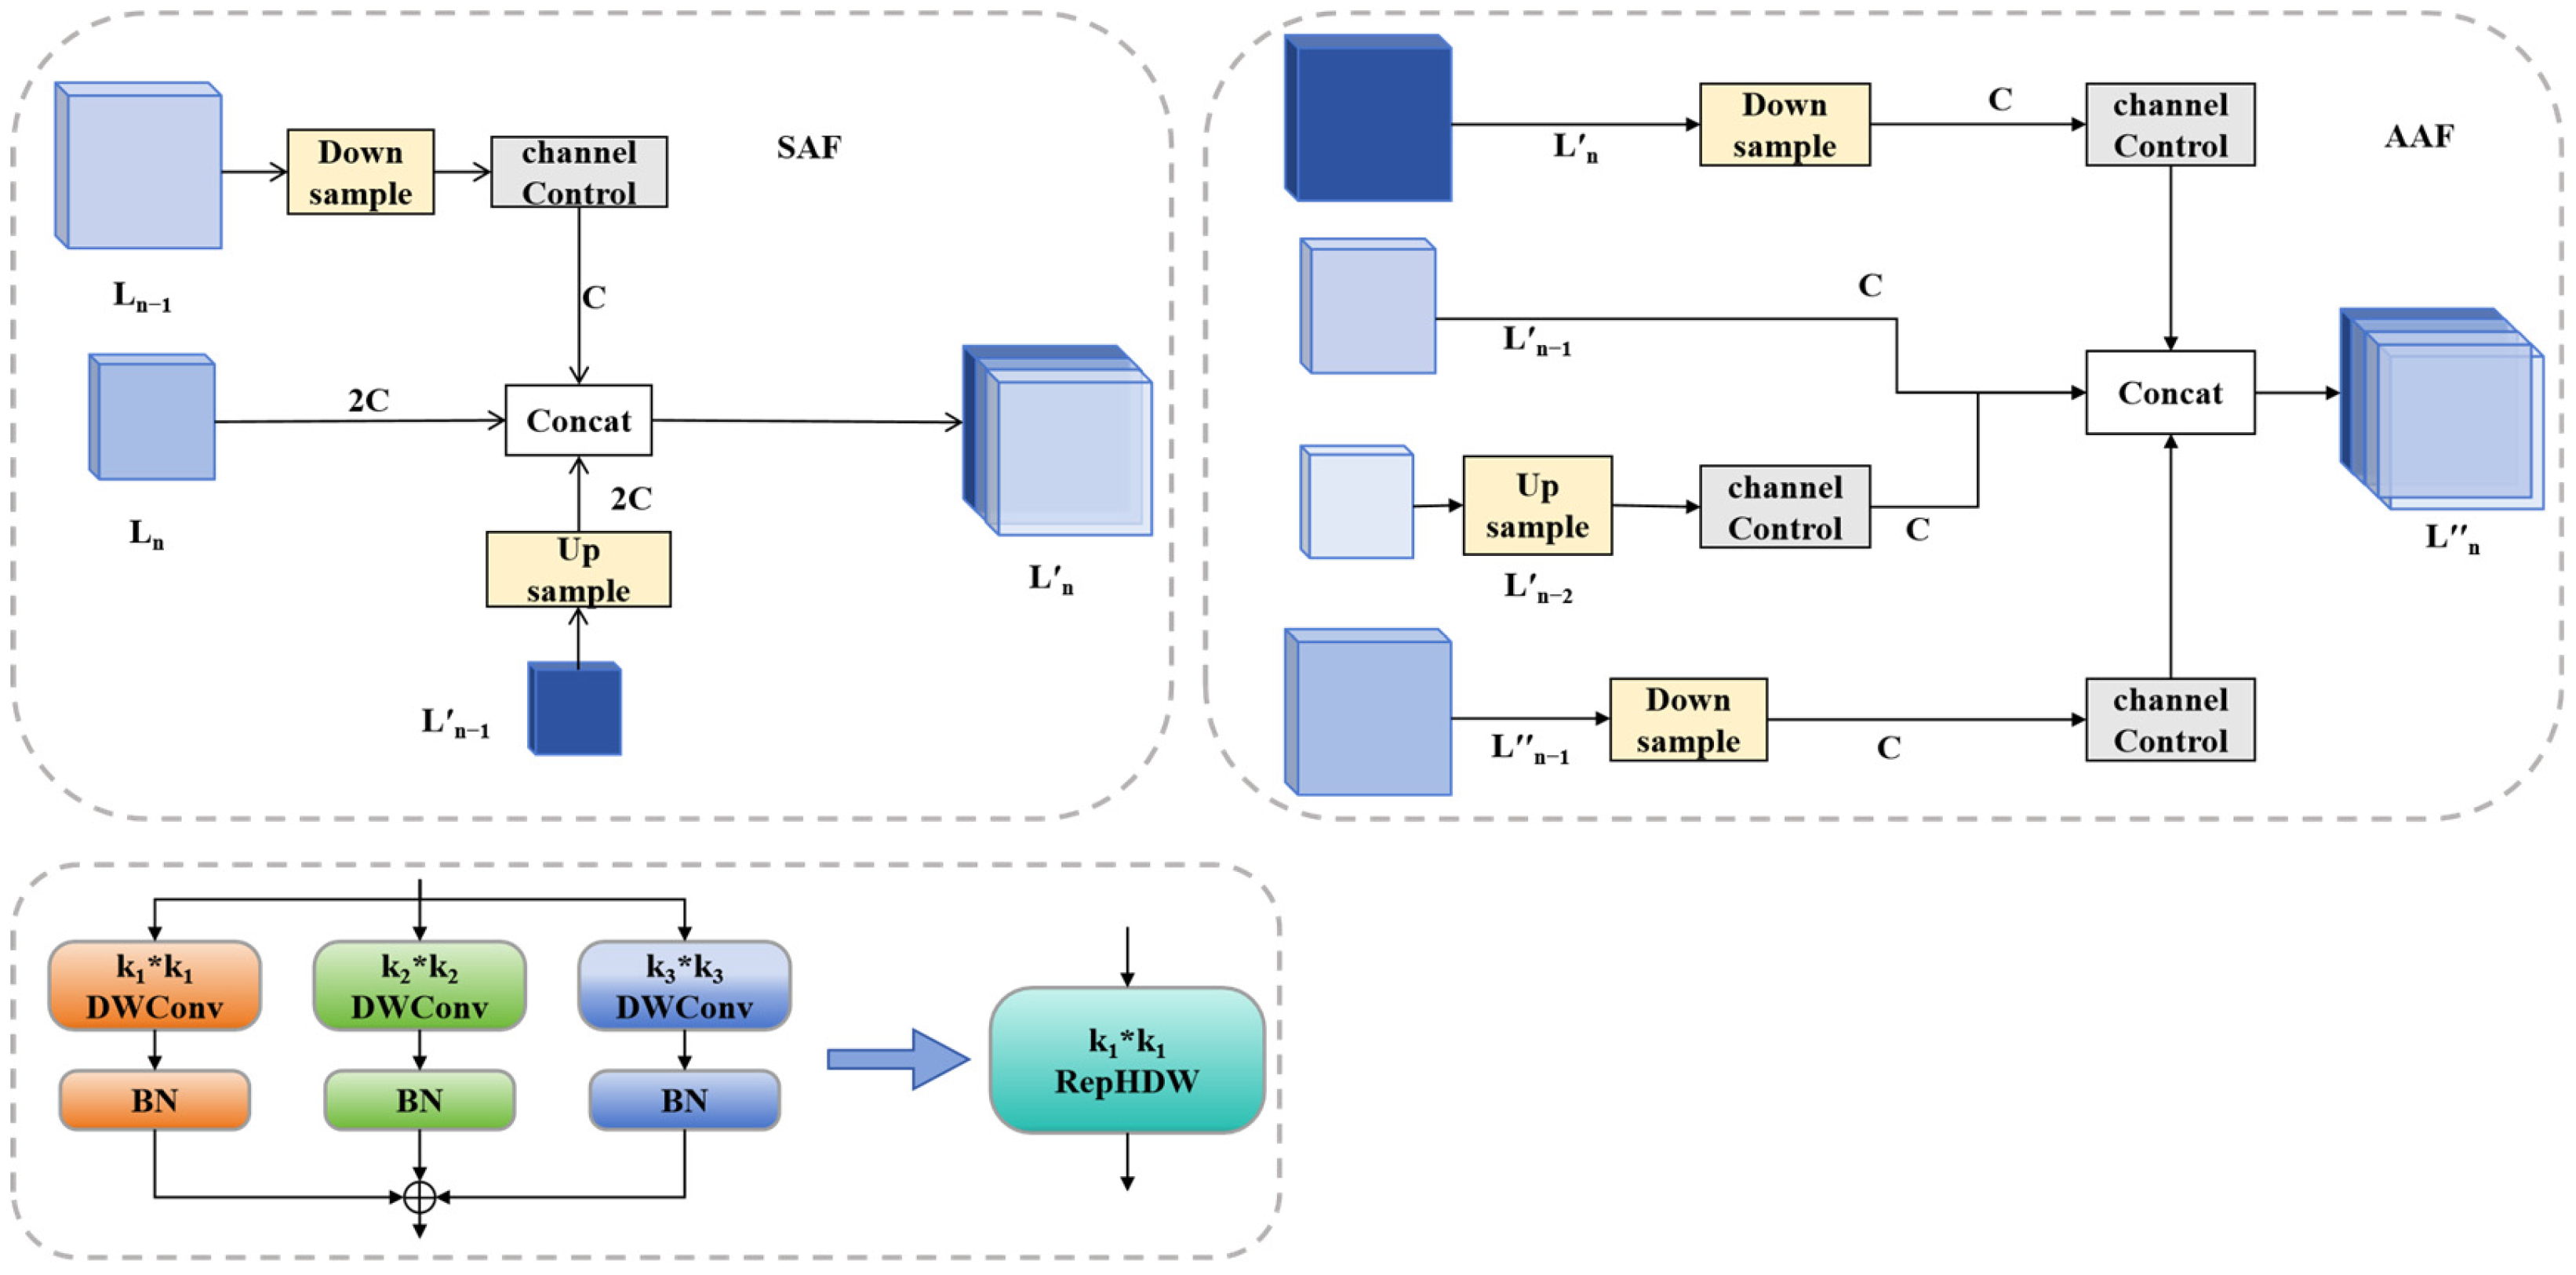
3.1.2. MAF Module: Multi-Scale Feature Integration of Liquid Sheet Image
3.1.3. Optimize Loss Function: Boosting Regression Precision
3.2. Measurement of Structural Parameters
4. Results and Discussion
4.1. Experimental Environment and Dataset
4.2. Ablation Experiments
4.3. Comparative Experiment of Different Models
4.4. Comparison and Analysis of Measurement Results of Structural Parameters
4.4.1. Analysis of Liquid Sheet Structural Parameters
4.4.2. Analysis of Perforation Structural Parameters
5. Conclusions
Supplementary Materials
Author Contributions
Funding
Data Availability Statement
Conflicts of Interest
References
- Altieri, A.; Cryer, S.A.; Acharya, L. Mechanisms, Experiment, and Theory of Liquid Sheet Breakup and Drop Size from Agricultural Nozzles. At. Sprays 2014, 24, 695–721. [Google Scholar] [CrossRef]
- Gaillard, A.; Sijs, R.; Bonn, D. What Determines the Drop Size in Sprays of Polymer Solutions? J. Non-Newton. Fluid 2022, 305, 104813. [Google Scholar] [CrossRef]
- Li, L.; Zhang, R.; Chen, L.; Hewitt, A.J.; He, X.; Ding, C.; Tang, Q.; Liu, B. Toward a Remote Sensing Method Based on Commercial LiDAR Sensors for the Measurement of Spray Drift and Potential Drift Reduction. Sci. Total Environ. 2024, 918, 170819. [Google Scholar] [CrossRef] [PubMed]
- Hu, P.; Zhang, R.; Yang, J.; Chen, L. Development Status and Key Technologies of Plant Protection UAVs in China: A Review. Drones 2022, 6, 354. [Google Scholar] [CrossRef]
- Samuelsen, G. An Experimental Study of the Breakup of a Two-Dimensional Liquid Sheet in the Presence of Co-Flow Air Shear. In Proceedings of the 28th Aerospace Sciences Meeting, Reno, NV, USA, 8–11 January 1990; American Institute of Aeronautics and Astronautics: Reston, VA, USA, 2012. [Google Scholar]
- Kumar, S.P.; Jat, D.; Sahni, R.K.; Jyoti, B.; Kumar, M.; Subeesh, A.; Parmar, B.S.; Mehta, C.R. Measurement of Droplets Characteristics of UAV Based Spraying System Using Imaging Techniques and Prediction by GWO-ANN Model. Measurement 2024, 234, 114759. [Google Scholar] [CrossRef]
- Cryer, S.A.; Altieri, A.L. Role of Large Inhomogeneities in Initiating Liquid Sheet Breakup in Agricultural Atomisation. Biosyst. Eng. 2017, 163, 103–115. [Google Scholar] [CrossRef]
- Makhnenko, I.; Alonzi, E.R.; Fredericks, S.A.; Colby, C.M.; Dutcher, C.S. A Review of Liquid Sheet Breakup: Perspectives from Agricultural Sprays. J. Aerosol Sci. 2021, 157, 105805. [Google Scholar] [CrossRef]
- Miller, P.C.H.; Ellis, M.C.B. Effects of Formulation on Spray Nozzle Performance for Applications from Ground-Based Boom Sprayers. Crop Prot. 2000, 19, 609–615. [Google Scholar] [CrossRef]
- Charalampous, G.; Hadjiyiannis, C.; Hardalupas, Y. Comparative Measurement of the Breakup Length of Liquid Jets in Airblast Atomisers Using Optical Connectivity, Electrical Connectivity and Shadowgraphy. Measurement 2016, 89, 288–299. [Google Scholar] [CrossRef]
- Zhao, H.; Liu, H.-F.; Xu, J.-L.; Li, W.-F.; Cheng, W. Breakup and Atomization of a Round Coal Water Slurry Jet by an Annular Air Jet. Chem. Eng. Sci. 2012, 78, 63–74. [Google Scholar] [CrossRef]
- Gong, C.; Chen, F.; Kang, C. Theoretical and Experimental Studies on the Oil-Based Emulsion Spray. Front. Plant Sci. 2023, 14, 1164200. [Google Scholar] [CrossRef]
- Gong, C.; Li, D.; Kang, C.; Wang, Y. Visualisation of the Evolution of Perforations in Oil-Based Emulsion Sheets Formed by Flat-Fan Spray Nozzles. Biosyst. Eng. 2021, 207, 68–80. [Google Scholar] [CrossRef]
- Gong, C.; Kang, C.; Jia, W.; Yang, W.; Wang, Y. The Effect of Spray Structure of Oil-Based Emulsion Spray on the Droplet Characteristics. Biosyst. Eng. 2020, 198, 78–90. [Google Scholar] [CrossRef]
- Yang, W.; Zhong, W.; Jia, W.; Ou, M.; Dong, X.; Zhang, T.; Ding, S.; Yu, P. The Effect of Oil-in-Water Emulsion Pesticide on the Evolution of Liquid Sheet Rim Disintegration and the Spraying Distribution. Crop Prot. 2024, 177, 106547. [Google Scholar] [CrossRef]
- Yang, W.; Zhong, W.; Jia, W.; Ou, M.; Dong, X.; Zhang, T.; Ding, S.; Jiang, L.; Wang, X. Study on Atomization Mechanisms and Spray Fragmentation Characteristics of Water and Emulsion Butachlor. Front. Plant Sci. 2023, 14, 1265013. [Google Scholar] [CrossRef] [PubMed]
- Yang, W.; Jia, W.; Ou, M.; Zhong, W.; Jiang, L.; Wang, X. Effect of Physical Properties of an Emulsion Pesticide on the Atomisation Process and the Spatial Distribution of Droplet Size. Agriculture 2022, 12, 949. [Google Scholar] [CrossRef]
- Elbasi, E.; Mostafa, N.; AlArnaout, Z.; Zreikat, A.I.; Cina, E.; Varghese, G.; Shdefat, A.; Topcu, A.E.; Abdelbaki, W.; Mathew, S.; et al. Artificial Intelligence Technology in the Agricultural Sector: A Systematic Literature Review. IEEE Access 2023, 11, 171–202. [Google Scholar] [CrossRef]
- Chen, T.; Meng, Y.; Su, J.; Liu, C. Deep CNN Based Droplet Deposition Segmentation for Spray Distribution Assessment. In Proceedings of the 2022 27th International Conference on Automation and Computing (ICAC), Bristol, UK, 1–3 September 2022; IEEE: Piscataway, NJ, USA, 2022; pp. 1–6. [Google Scholar]
- Li, H.; Cryer, S.; Raymond, J.; Acharya, L. Interpreting Atomization of Agricultural Spray Image Patterns Using Latent Dirichlet Allocation Techniques. Artif. Intell. Agric. 2020, 4, 253–261. [Google Scholar] [CrossRef]
- Li, H.; Cryer, S.; Acharya, L.; Raymond, J. Video and Image Classification Using Atomisation Spray Image Patterns and Deep Learning. Biosyst. Eng. 2020, 200, 13–22. [Google Scholar] [CrossRef]
- Dafsari, R.A.; Yu, S.; Choi, Y.; Lee, J. Effect of Geometrical Parameters of Air-Induction Nozzles on Droplet Characteristics and Behaviour. Biosyst. Eng. 2021, 209, 14–29. [Google Scholar] [CrossRef]
- Zhang, R.; Hu, P.; Li, L.; Tang, Q.; Yang, J.; Yang, J.; Chen, L. Fine-Grained Method for Determining Size and Velocity Distribution Patterns of Flat-Fan Nozzle-Atomised Droplets Based on Phase Doppler Interferometer. Comput. Electron. Agric. 2024, 225, 109343. [Google Scholar] [CrossRef]
- Stallbaumer-Cyr, E.M.; Aguilar, J.; Betz, A.R.; Derby, M.M. The Effects of Surfactin on Sprayed Droplets in Flat Fan, Full Cone, and Low Energy Precision Application Bubbler Nozzles: Droplet Formation and Spray Breakup. Front. Mech. Eng. 2024, 10, 1354664. [Google Scholar] [CrossRef]
- Lechler. Agricultural Spray Nozzles and Accessories; Lechler: Metzingen, Germany, 2023; pp. 1–152. [Google Scholar]
- Li, Y.; Hou, Q.; Zheng, Z.; Cheng, M.-M.; Yang, J.; Li, X. Large Selective Kernel Network for Remote Sensing Object Detection. In Proceedings of the IEEE/CVF International Conference on Computer Vision, Paris, France, 2–6 October 2023. [Google Scholar]
- Yang, Z.; Guan, Q.; Zhao, K.; Yang, J.; Xu, X.; Long, H.; Tang, Y. Multi-Branch Auxiliary Fusion YOLO with Re-Parameterization Heterogeneous Convolutional for Accurate Object Detection. In Proceedings of the Chinese Conference on Pattern Recognition and Computer Vision (PRCV), Urumqi, China, 18–20 October 2024. [Google Scholar]
- Diemuodeke, O.E.; Sher, I. Mechanistic Model for the Breakup Length in Jet Atomization. SAE Int. J. Engines 2016, 9, 1314–1319. [Google Scholar] [CrossRef]
- He, K.; Gkioxari, G.; Dollár, P.; Girshick, R. Mask R-CNN. In Proceedings of the 2017 IEEE International Conference on Computer Vision (ICCV), Venice, Italy, 22–29 October 2017. [Google Scholar]
- Bolya, D.; Zhou, C.; Xiao, F.; Lee, Y.J. YOLACT: Real-Time Instance Segmentation. In Proceedings of the IEEE/CVF International Conference on Computer Vision, Seoul, Republic of Korea, 27 October–2 November 2019. [Google Scholar]
- Chen, L.-C.; Zhu, Y.; Papandreou, G.; Schroff, F.; Adam, H. Encoder-Decoder with Atrous Separable Convolution for Semantic Image Segmentation. In Proceedings of the European Conference on Computer Vision (ECCV), Munich, Germany, 8–14 September 2018. [Google Scholar]
- Dorman, R.G. The Atomization of Liquid in a Flat Spray. Br. J. Appl. Phys. 1952, 3, 189–192. [Google Scholar] [CrossRef]
- Sirignano, W.A.; Mehring, C. Review of Theory of Distortion and Disintegration of Liquid Streams. Prog. Energ. Combust. 2000, 26, 609–655. [Google Scholar] [CrossRef]
- Strutt, J.W. Investigation of the Character of the Equilibrium of an Incompressible Heavy Fluid of Variable Density. Proc. Lond. Math. Soc. 1882, 1, 170–177. [Google Scholar]
- Wang, N. Investigation on Breakup and Atomization Characteristics of Hollow Conical Liquid Film Under Cross Flow. Master’s Thesis, Shenyang Aerospace University, Shenyang, China, 2022. [Google Scholar]
- Odier, N.; Balarac, G.; Corre, C.; Moureau, V. Numerical Study of a Flapping Liquid Sheet Sheared by a High-Speed Stream. Int. J. Multiph. Flow 2015, 77, 196–208. [Google Scholar] [CrossRef]
- Cryer, S.A.; Altieri, A.L.; Schmucker, A.L.; Day, K.M. Minimising Atomisation Drift Potential by Exploring the Break-up of Liquid Sheets Using Multiphase Methylated Soybean and Silicon Oil Emulsions. Biosyst. Eng. 2021, 202, 142–151. [Google Scholar] [CrossRef]


| Nozzle Type | Orifice Long Axis Length/μm | Orifice Short Axis Length/μm |
|---|---|---|
| IDK120-03 | 3250 | 844 |
| IDK120-015 | 2385 | 534 |
| LU120-03 | 2563 | 449 |
| LU120-015 | 1457 | 330 |
| rr,cc=draw.polygon(np.array(other_mask_coords_array)[::2],np.array(other_mask_coords_array) [1::2] mask_image.size) area = len(rr) * (pixel_to_distance_ratio ** 2) sheet_area1 = np.sum(np.array(mask_image) ==[128, 128, 128]) // 3 sheet_area = white_area1 * (pixel_to_distance_ratio ** 2) |
| Name | Configuration |
|---|---|
| Operating system | Windows11 |
| GPU | NVIDIA GeForce RTX 3090 Ti, 24 GB |
| CPU | Intel(R) Core(TM) i9-10940X CPU |
| Memory | 256 GB |
| Programming language | Python 3.8.19 |
| Framework | Pytorch 2.0.0+CUDA 11.7 |
| IDE | Pycharm 2022.2.1 |
| Methods | Epochs | Model Size/MB | Params/106 | Dataset | mAPmask@0.5/% |
|---|---|---|---|---|---|
| YOLOv8s | 300 | 22.7 | 11.78 | IDK | 78.2 |
| LU | 66.5 | ||||
| +C2f_LSK | 300 | 22.7 | 11.17 | IDK | 80.1 |
| 172 | LU | 68.5 | |||
| +MAF | 300 | 24.6 | 12.05 | IDK | 79.4 |
| 152 | LU | 68.7 | |||
| +C2f_LSK+MAF | 291 | 23.4 | 11.44 | IDK | 80.5 |
| 159 | LU | 69.4 | |||
| +C2f_LSK+MAF+EIoU | 300 | 24.4 | 11.45 | IDK | 81.0 |
| LU | 71.3 |
| Methods | Epochs | Model Size/MB | Params/106 | Dataset | mAPmask@0.5/% |
|---|---|---|---|---|---|
| YOLOv8s | 300 | 22.7 | 11.78 | IDK | 78.2 |
| LU | 66.5 | ||||
| Mask-RCNN | 150 | 168 | 44.04 | IDK | 48.4 |
| LU | 50.6 | ||||
| YOLACT | 201 | 117 | 30.67 | IDK | 67.2 |
| LU | 54.5 | ||||
| YOLOv5s | 300 | 18.9 | 9.78 | IDK | 78.1 |
| LU | 68.1 | ||||
| DeepLabv3+ | 300 | 22.4 | 5.85 | IDK | 50.8 |
| LU | 49.8 | ||||
| Ours | 300 | 24.4 | 11.45 | IDK | 81.0 |
| LU | 71.3 |
| Pressure/kPa | LU120-03 | LU120-015 | IDK120-03 | IDK120-015 | ||||
|---|---|---|---|---|---|---|---|---|
| Water | Solution with 0.01‰ Silicone Adjuvant | Water | Solution with 0.01‰ Silicone Adjuvant | Water | Solution with 0.01‰ Silicone Adjuvant | Water | Solution with 0.01‰ Silicone Adjuvant | |
| 150 | 81.6° | 86.5° | 65.2° | 77.4° | 90.9° | 89° | 85.5° | 68.8° |
| 200 | 93.2° | 94.7° | 77.2° | 91.6° | 101° | 93.8° | 91.4° | 79.3° |
| 250 | 106.9° | 114.6° | 97.2° | 104.9° | 104.5° | 101.6° | 98.3° | 96° |
| 300 | 123.8° | 120.3° | 114.9° | 109.9° | 106.6° | 105.3° | 104.3° | 101.5° |
| 350 | 131.7° | 126.1° | 119.2° | 113.5° | 108.7° | 108.2° | 107.1° | 106.7° |
| 400 | 133.5° | 127.3° | 124.3° | 118.2° | 112.8° | 111.1° | 111.1° | 109° |
| Nozzle Type | Liquid Sheet Images Under Different Experimental Conditions | ||
|---|---|---|---|
| LU120-03 |  |  | 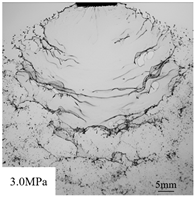 |
| Fewer perforations and farther away from the nozzle, fewer wave-like structures. | The number of perforations is slightly increased and closer to the nozzle, the number of wave-like structures is less. | The number of perforations is significantly higher and closer to the nozzle, and the number of wave-like structures is increased. | |
| IDK120-03 | 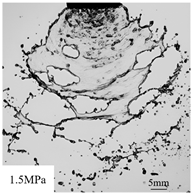 | 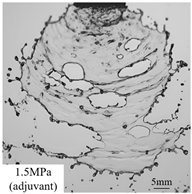 | 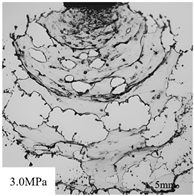 |
| The number of perforations is lower. | Slight increase in the number of perforations. | Significant increase in the number of perforations. | |
Disclaimer/Publisher’s Note: The statements, opinions and data contained in all publications are solely those of the individual author(s) and contributor(s) and not of MDPI and/or the editor(s). MDPI and/or the editor(s) disclaim responsibility for any injury to people or property resulting from any ideas, methods, instructions or products referred to in the content. |
© 2025 by the authors. Licensee MDPI, Basel, Switzerland. This article is an open access article distributed under the terms and conditions of the Creative Commons Attribution (CC BY) license (https://creativecommons.org/licenses/by/4.0/).
Share and Cite
Yan, W.; Li, L.; Song, J.; Hu, P.; Xu, G.; Wu, Q.; Zhang, R.; Chen, L. Deep Learning-Assisted Measurement of Liquid Sheet Structure in the Atomization of Hydraulic Nozzle Spraying. Agronomy 2025, 15, 409. https://doi.org/10.3390/agronomy15020409
Yan W, Li L, Song J, Hu P, Xu G, Wu Q, Zhang R, Chen L. Deep Learning-Assisted Measurement of Liquid Sheet Structure in the Atomization of Hydraulic Nozzle Spraying. Agronomy. 2025; 15(2):409. https://doi.org/10.3390/agronomy15020409
Chicago/Turabian StyleYan, Wenlong, Longlong Li, Jianli Song, Peng Hu, Gang Xu, Qiangjia Wu, Ruirui Zhang, and Liping Chen. 2025. "Deep Learning-Assisted Measurement of Liquid Sheet Structure in the Atomization of Hydraulic Nozzle Spraying" Agronomy 15, no. 2: 409. https://doi.org/10.3390/agronomy15020409
APA StyleYan, W., Li, L., Song, J., Hu, P., Xu, G., Wu, Q., Zhang, R., & Chen, L. (2025). Deep Learning-Assisted Measurement of Liquid Sheet Structure in the Atomization of Hydraulic Nozzle Spraying. Agronomy, 15(2), 409. https://doi.org/10.3390/agronomy15020409