Article

CSGD-YOLO: A Corn Seed Germination Status Detection Model Based on YOLOv8n

1
School of Information and Communication Engineering, Hainan University, Haikou 570228, China
2
Key Laboratory of Tropical Intelligent Agricultural Equipment, Ministry of Agriculture and Rural Affairs, Haikou 570228, China
3
Mechanical and Electrical Engineering College, Hainan University, Haikou 570228, China
4
Sanya Institute, China Agricultural University, Sanya 572025, China
*
Authors to whom correspondence should be addressed.
Agronomy 2025, 15(1), 128; https://doi.org/10.3390/agronomy15010128
Submission received: 9 December 2024 / Revised: 29 December 2024 / Accepted: 3 January 2025 / Published: 7 January 2025
(This article belongs to the Section Precision and Digital Agriculture)

Abstract

:
Seed quality testing is crucial for ensuring food security and stability. To accurately detect the germination status of corn seeds during the paper medium germination test, this study proposes a corn seed germination status detection model based on YOLO v8n (CSGD-YOLO). Initially, to alleviate the complexity encountered in conventional models, a lightweight spatial pyramid pooling fast (L-SPPF) structure is engineered to enhance the representation of features. Simultaneously, a detection module dubbed Ghost_Detection, leveraging the GhostConv architecture, is devised to boost detection efficiency while simultaneously reducing parameter counts and computational overhead. Additionally, during the downsampling process of the backbone network, a downsampling module based on receptive field attention convolution (RFAConv) is designed to boost the model’s focus on areas of interest. This study further proposes a new module named C2f-UIB-iAFF based on the faster implementation of cross-stage partial bottleneck with two convolutions (C2f), universal inverted bottleneck (UIB), and iterative attention feature fusion (iAFF) to replace the original C2f in YOLOv8, streamlining model complexity and augmenting the feature fusion prowess of the residual structure. Experiments conducted on the collected corn seed germination dataset show that CSGD-YOLO requires only 1.91 M parameters and 5.21 G floating-point operations (FLOPs). The detection precision(P), recall(R), mAP0.5, and mAP0.50:0.95 achieved are 89.44%, 88.82%, 92.99%, and 80.38%. Compared with the YOLO v8n, CSGD-YOLO improves performance in terms of accuracy, model size, parameter number, and floating-point operation counts by 1.39, 1.43, 1.77, and 2.95 percentage points, respectively. Therefore, CSGD-YOLO outperforms existing mainstream target detection models in detection performance and model complexity, making it suitable for detecting corn seed germination status and providing a reference for rapid germination rate detection.

1. Introduction

Corn is one of the three major staple crops worldwide, and its yield plays a crucial role in maintaining the stability of agricultural markets and ensuring national food security [1,2]. Securing corn yields involves not only the selection of high-quality cultivars but also the choice of premium seeds, making seed quality testing an indispensable part of agricultural production. Seed vigor, a critical index of seed quality, reflects the potential growth performance of seeds in the field. Current methods for assessing seed vigor include spectroscopy, germination tests, and enzyme activity measurements [3,4,5], typically benchmarked against the germination rates from standard germination tests. Traditional statistics on germination rates are obtained through repetitive trials and statistical analysis, requiring the skilled assessment of seed radicle and shoot lengths by experienced personnel. This process is not only labor-intensive and time-consuming but also prone to subjectivity. Consequently, there is an urgent need for the development of a rapid, economical, and reliable method to assess seed germination status.
With the rapid advancement of visual detection technology, object detection and image segmentation techniques have been widely applied in the agricultural sector. In seed vitality detection, the methods can be categorized into visible light-based detection, spectral-based detection, and a combination of both. The seed vigor detection based on spectral technology primarily utilizes scanning of seed samples with light of different wavelengths to obtain reflectance or transmittance spectral data from the seeds. Then, by means of machine learning and deep learning techniques, spectral features indicative of seed vigor with significant characteristic wavelength bands or feature vectors are extracted from the spectral data as target features. Subsequently, through germination tests, the germination rate is artificially counted and an intrinsic relationship model between the spectral target features and germination rate is established, thereby achieving the detection of vigor. Although this method yields favorable detection results, it still relies on manual detection of the germination status. The visible light-based vitality detection method mainly relies on seed germination tests, using the germination status of seeds in the germination experiment to judge the vitality of the seeds. This automated detection method can be divided into two main categories: one involves manually designing feature extraction to obtain texture, color, and morphological characteristics, using different classifiers to determine the germination status of seeds [6,7]; the other utilizes convolutional neural networks (CNNs) to directly extract germination features, thereby achieving detection of seed growth status [8]. Genze et al. [9] aimed to reduce the training time for models by proposing a seed germination assessment method based on the Faster R-CNN architecture and transfer learning. This method achieved germination detection for corn, rye, and pearl millet within a cultivation environment in Petri dishes for 4 to 44 h, with mAP0.5 germination detection performance of over 94%. Ma et al. [10] proposed an automatic seed germination detection method based on Mask R-CNN image segmentation. The method first uses Mask R-CNN to extract the germination target area and then employs skeleton extraction and deep search algorithms to locate the centroid of the target area, thereby achieving the automation of measurements for indicators such as germination rate, germinability, root length, and shoot length, under simple laboratory conditions. Zhang et al. [11], based on the YOLO network architecture, Transformer encoder, small object detection layers, and the Complete IoU (CIoU) loss function, achieved an average detection accuracy of 95.39% for rice seeds in Petri dishes. To detect the germination status of corn seeds at different time intervals, Chen et al. [2] established a Petri dish-based dataset of corn seed germination status at different germination times, collected at 12 h intervals, and compared the performance of different object detection algorithms on this dataset. To enhance model applicability, the paragraph is written in Chinese. Yao et al. [12] collected the germination status data of wild rice seeds over 7 consecutive days under two cultivation methods: hydroponics and Petri dishes. By employing efficient channel attention (ECA), bidirectional feature pyramid network (BiFPN), and the YOLO framework, they proposed an SGR-YOLO model that can accurately detect seed germination status in both hydroponic tanks and Petri dishes, achieving mAP0.5 values of 94% and 98.2%, respectively.
Although research on corn seed germination status detection has achieved promising results, certain limitations remain: (a) Existing studies primarily focus on crops such as rice and tomatoes, which have relatively small seed sizes, and therefore commonly employ Petri dishes for germination trials. Paper-based germination, due to its low space requirements and high experimental efficiency, is currently the most widely applied germination method; however, there has been limited research in this area. (b) Existing methods for detecting the germination status of corn seeds frequently employ the original models of general object detection or image segmentation, such as YOLO, Faster R-CNN, and Mask R-CNN. Previous research has made relatively few improvements to the model structures. These general models were initially designed without dependence on specific datasets, which makes them prone to feature extraction redundancy, thereby reducing the detection performance of the models. Moreover, current research often overlooks the complexity of the models in pursuit of improving detection performance.
To address the aforementioned issues, this paper proposes an automated detection model for the paper roll germination status of corn seeds based on YOLOv8n. Initially, a germination trial for corn seeds on paper was conducted over a period of four to seven days, during which seed germination status images were collected at different germination stages. Subsequently, a CSGD-YOLO model was proposed based on UIB, iAFF, grouped convolution, GhostConv, and RFAConv. This model effectively detects the germination status of corn seeds on paper, providing a reference for the rapid assessment of corn seed germination rates.

2. Materials and Methods

2.1. Construction of Corn Seed Germination Dataset

2.1.1. Corn Seed Material

Corn seeds collected in 2023 from the seed market, specifically including Heyu 187, Huayu 11, Jingke 999, and Jinlongda 76, are all coated corn seeds with no visible damage. According to the “Technical Regulations for Crop Seed Germination” (GB/T 3543.4-1995), the seeds were placed on germination paper and rolled into bundles. The rolled seeds were then placed in a germination chamber at a constant temperature of 25 °C for germination.

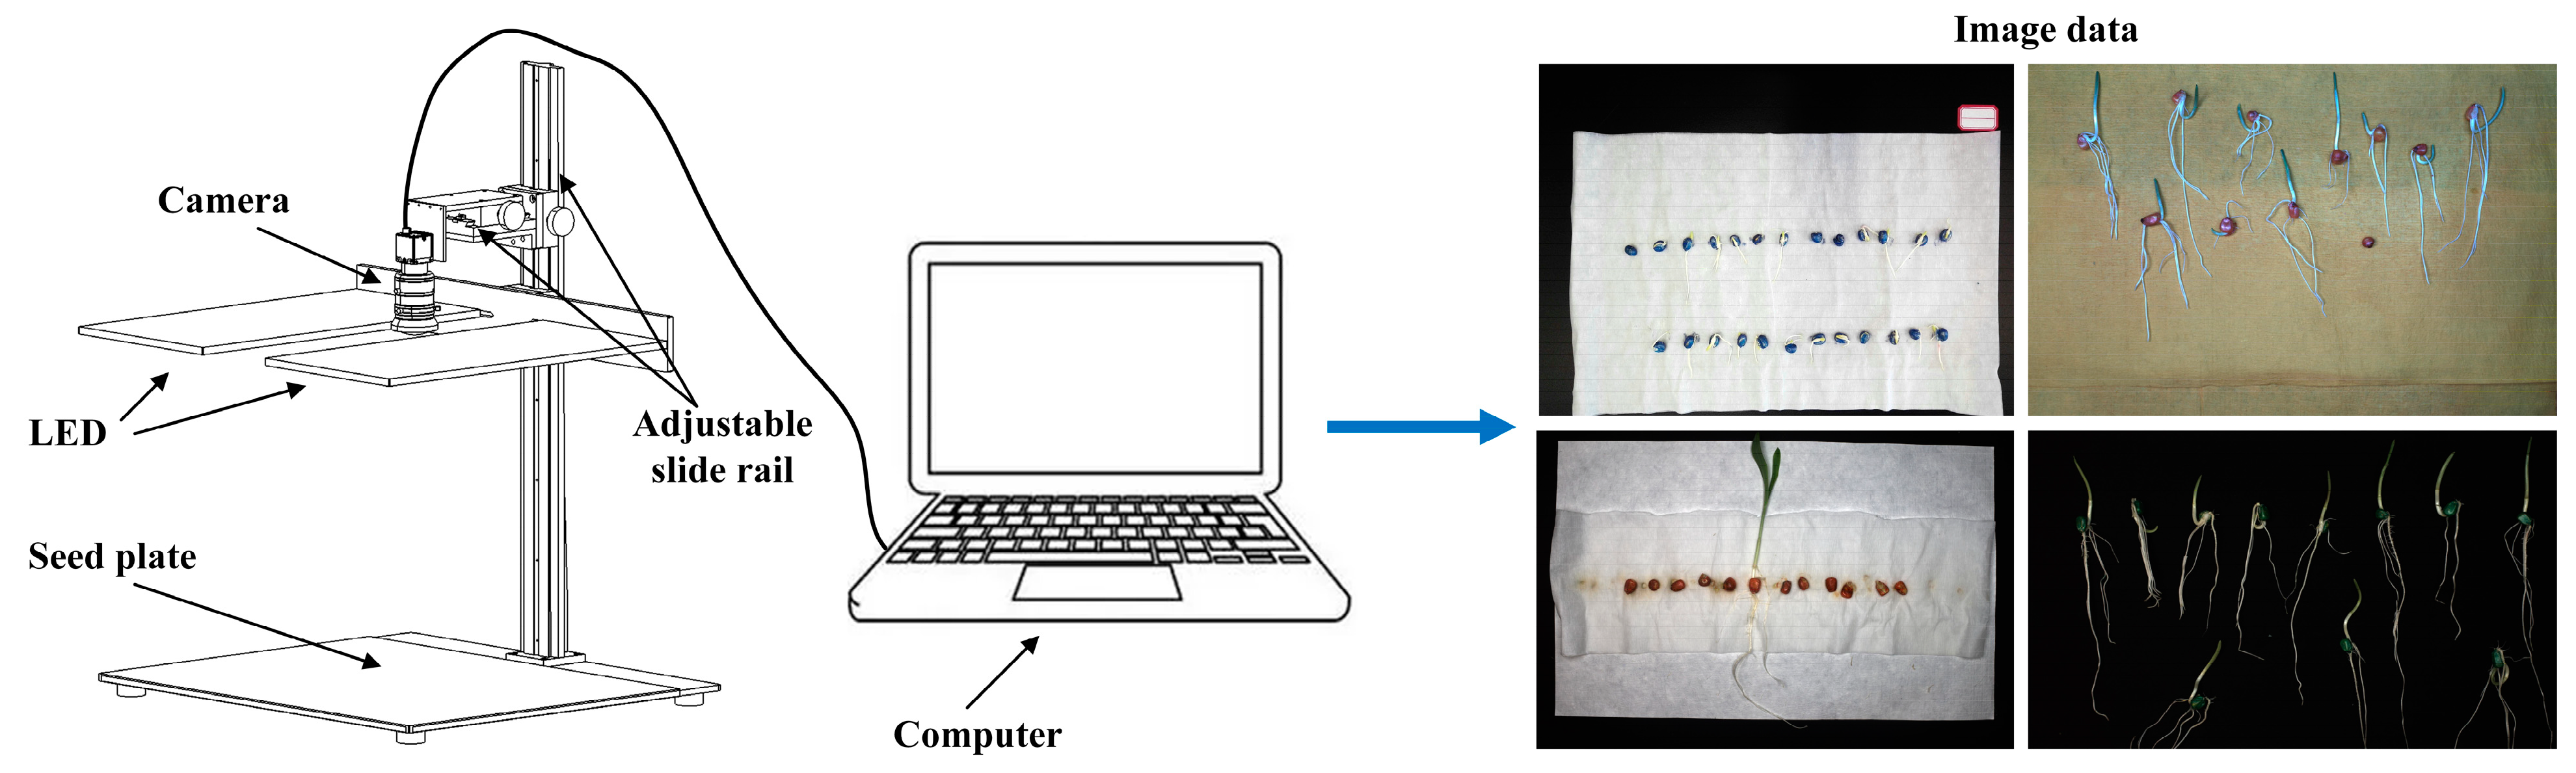
2.1.2. Image Acquisition

To obtain germination data for corn seed, a corn seed germination image acquisition platform was constructed, as shown in Figure 1. This data acquisition platform includes an industrial camera (Hikvision MV-CS2000-10UC, with a lens model MVL-KF1224M-25MP, Hangzhou, China), an LED light source, a movable sliding stage, and a detection platform. In order to capture images of corn seeds at various stages of germination, the germination rolls were placed on the data acquisition platform on the fourth, fifth, sixth, and seventh days after the start of the standard germination experiment. To enhance the diversity of the image data, images were taken against three different backgrounds: yellow, white, and black, as well as germination images of seeds between standard papers under partial cold soaking treatment. A total of 2096 images were collected, of which 1614 images were randomly selected as training data, and 482 images as testing data. Detailed information is provided in Table 1.

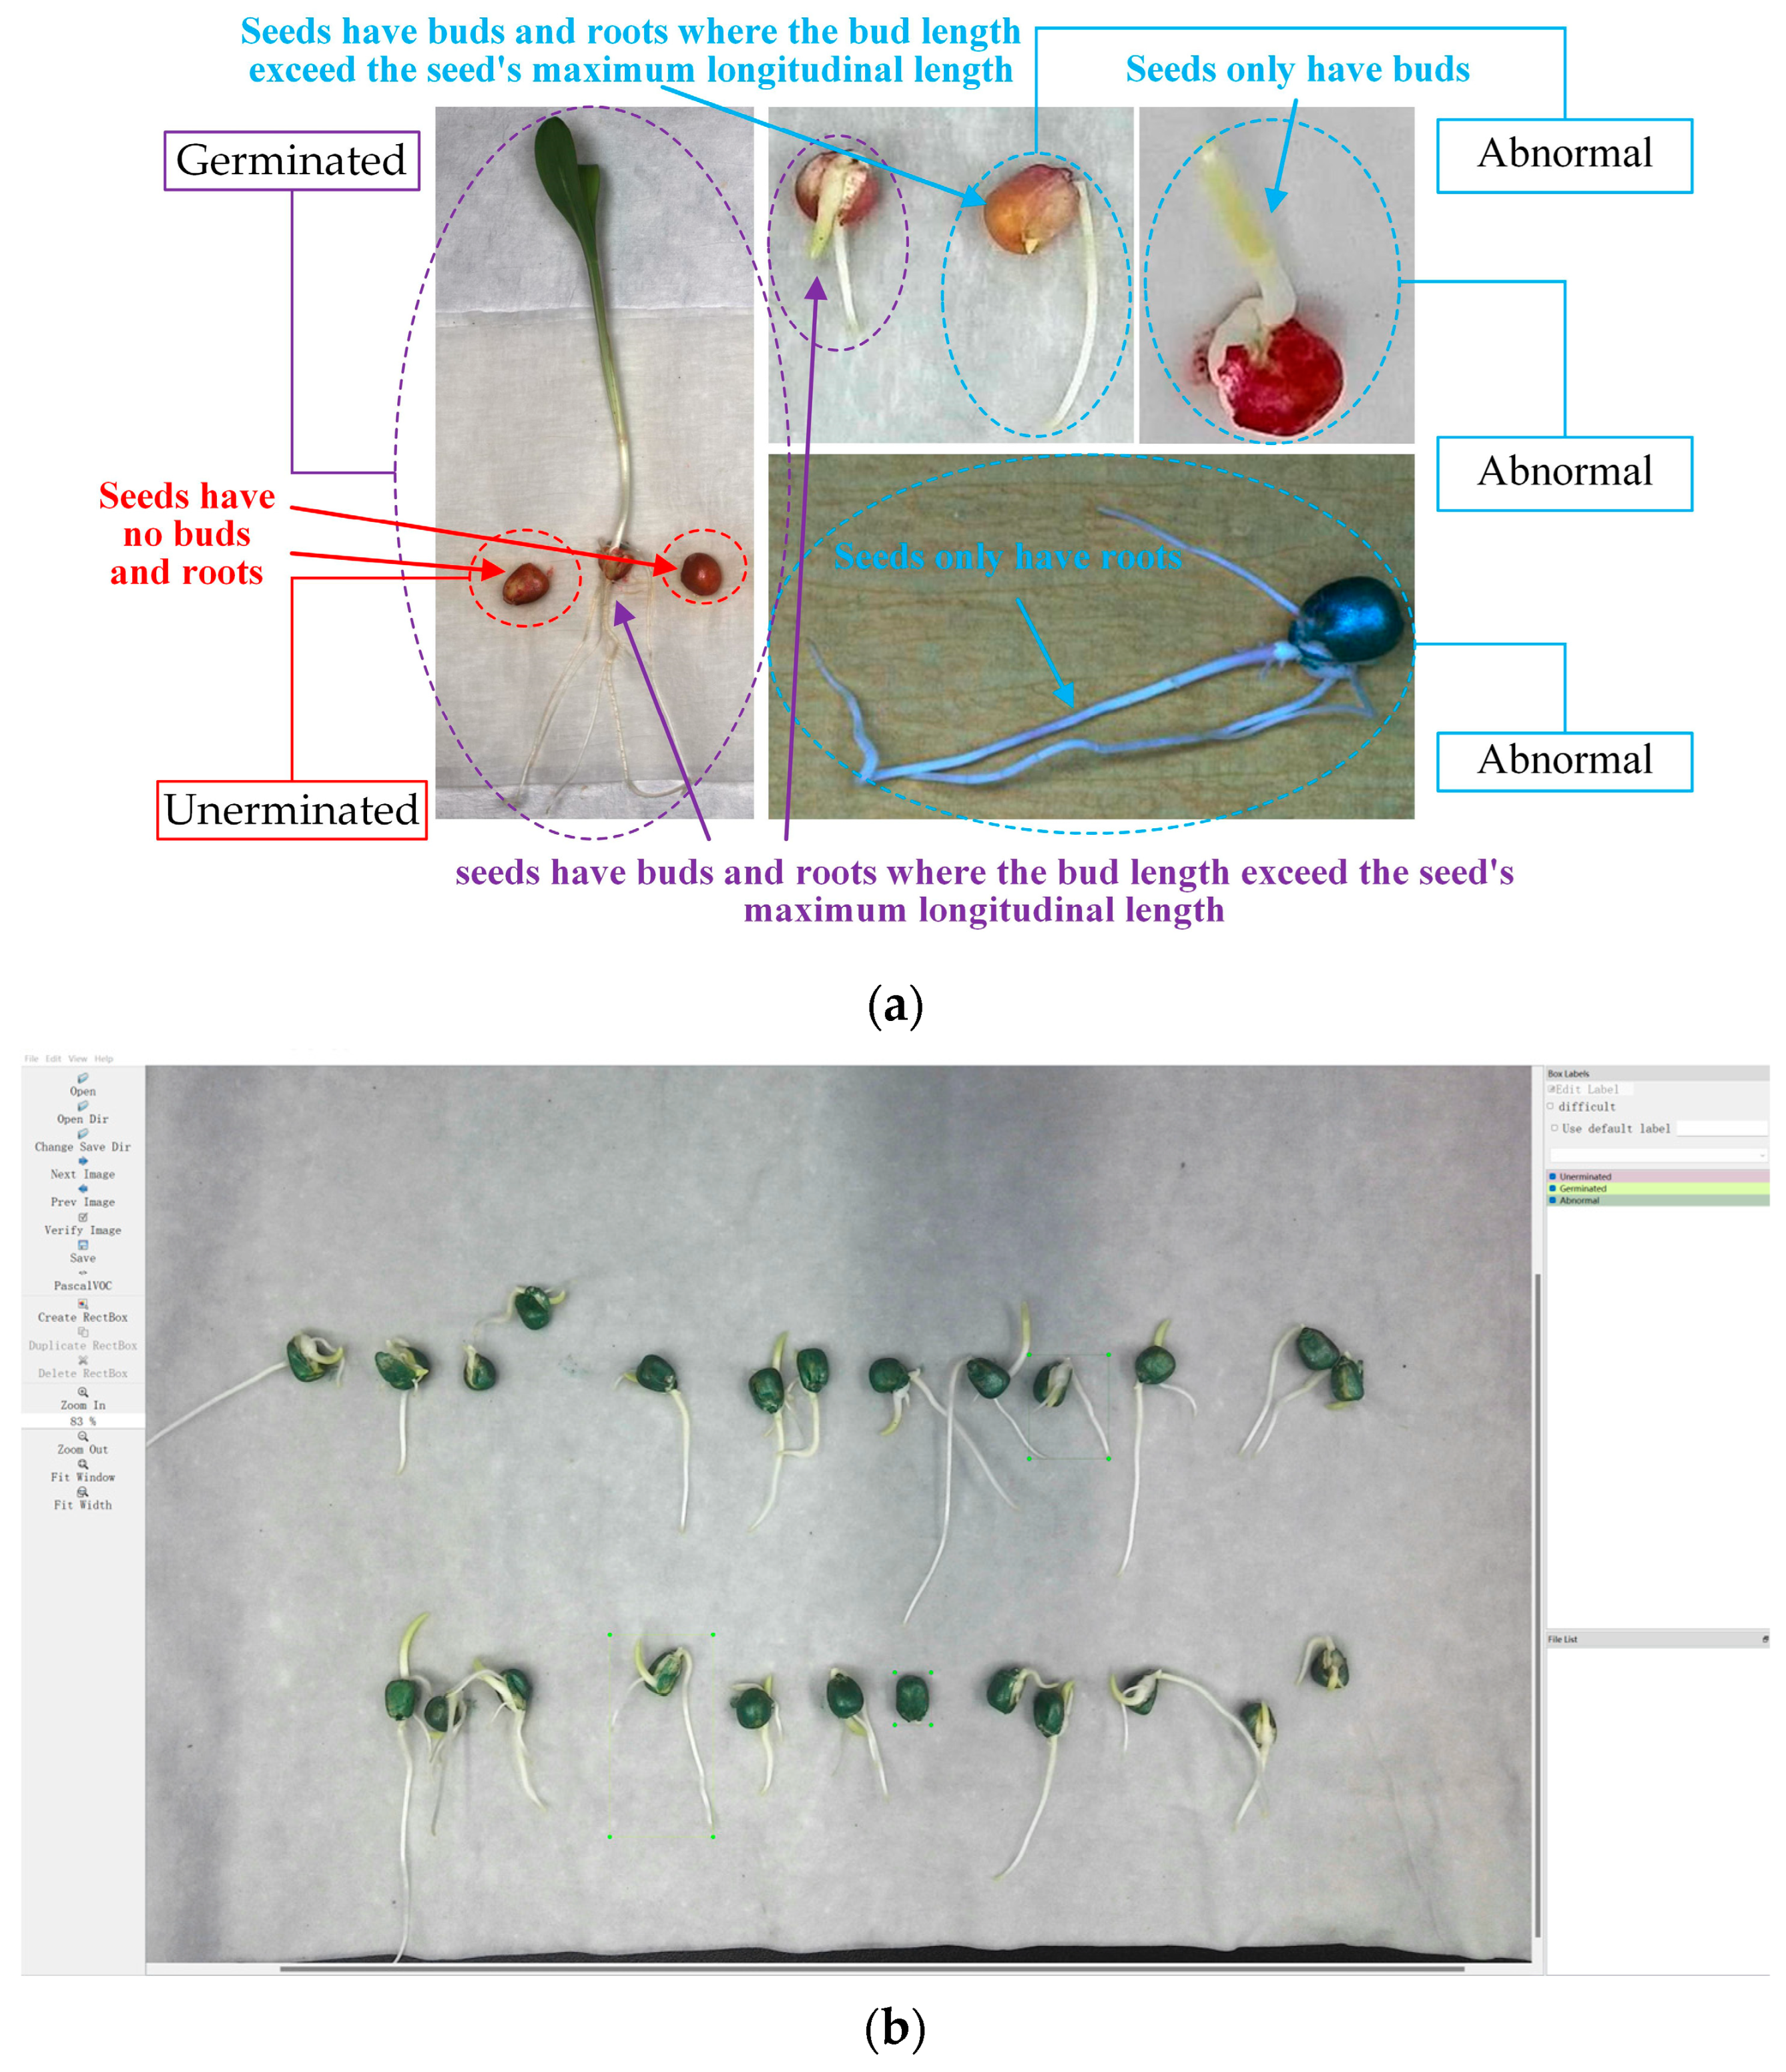
2.1.3. Data Preprocessing

For the germination images collected by the data acquisition platform, the regions of interest were annotated using Labelimg image annotation software (https://gitcode.com/gh_mirrors/labe/labelImg/?utm_source=artical_gitcode&index=top&type=card&webUrl) (accessed on 8 December 2024), with the data annotations stored as PASCAL VOC format. According to the “Technical Regulations for Germination of Crop Seeds” (GB/T 3543.4-1995) and references [2,9,10], the seed germination status was classified into three conditions: ungerminated, abnormal germination, and germinated during the annotation process. As shown in Figure 2, ungerminated is defined as the condition of seeds that lack both roots and buds. Abnormal germination includes three scenarios: seeds with buds but no roots, seeds with roots but no buds, and seeds with both buds and roots where the bud length does not exceed the seed’s maximum longitudinal length. Conversely, normal germination is characterized by seeds exhibiting healthy growth, where both roots and buds are present, and the bud length exceeds the maximum longitudinal length of the seed. Therefore, the regions of interest were labeled into three categories: ungerminated, abnormal, and germinated.

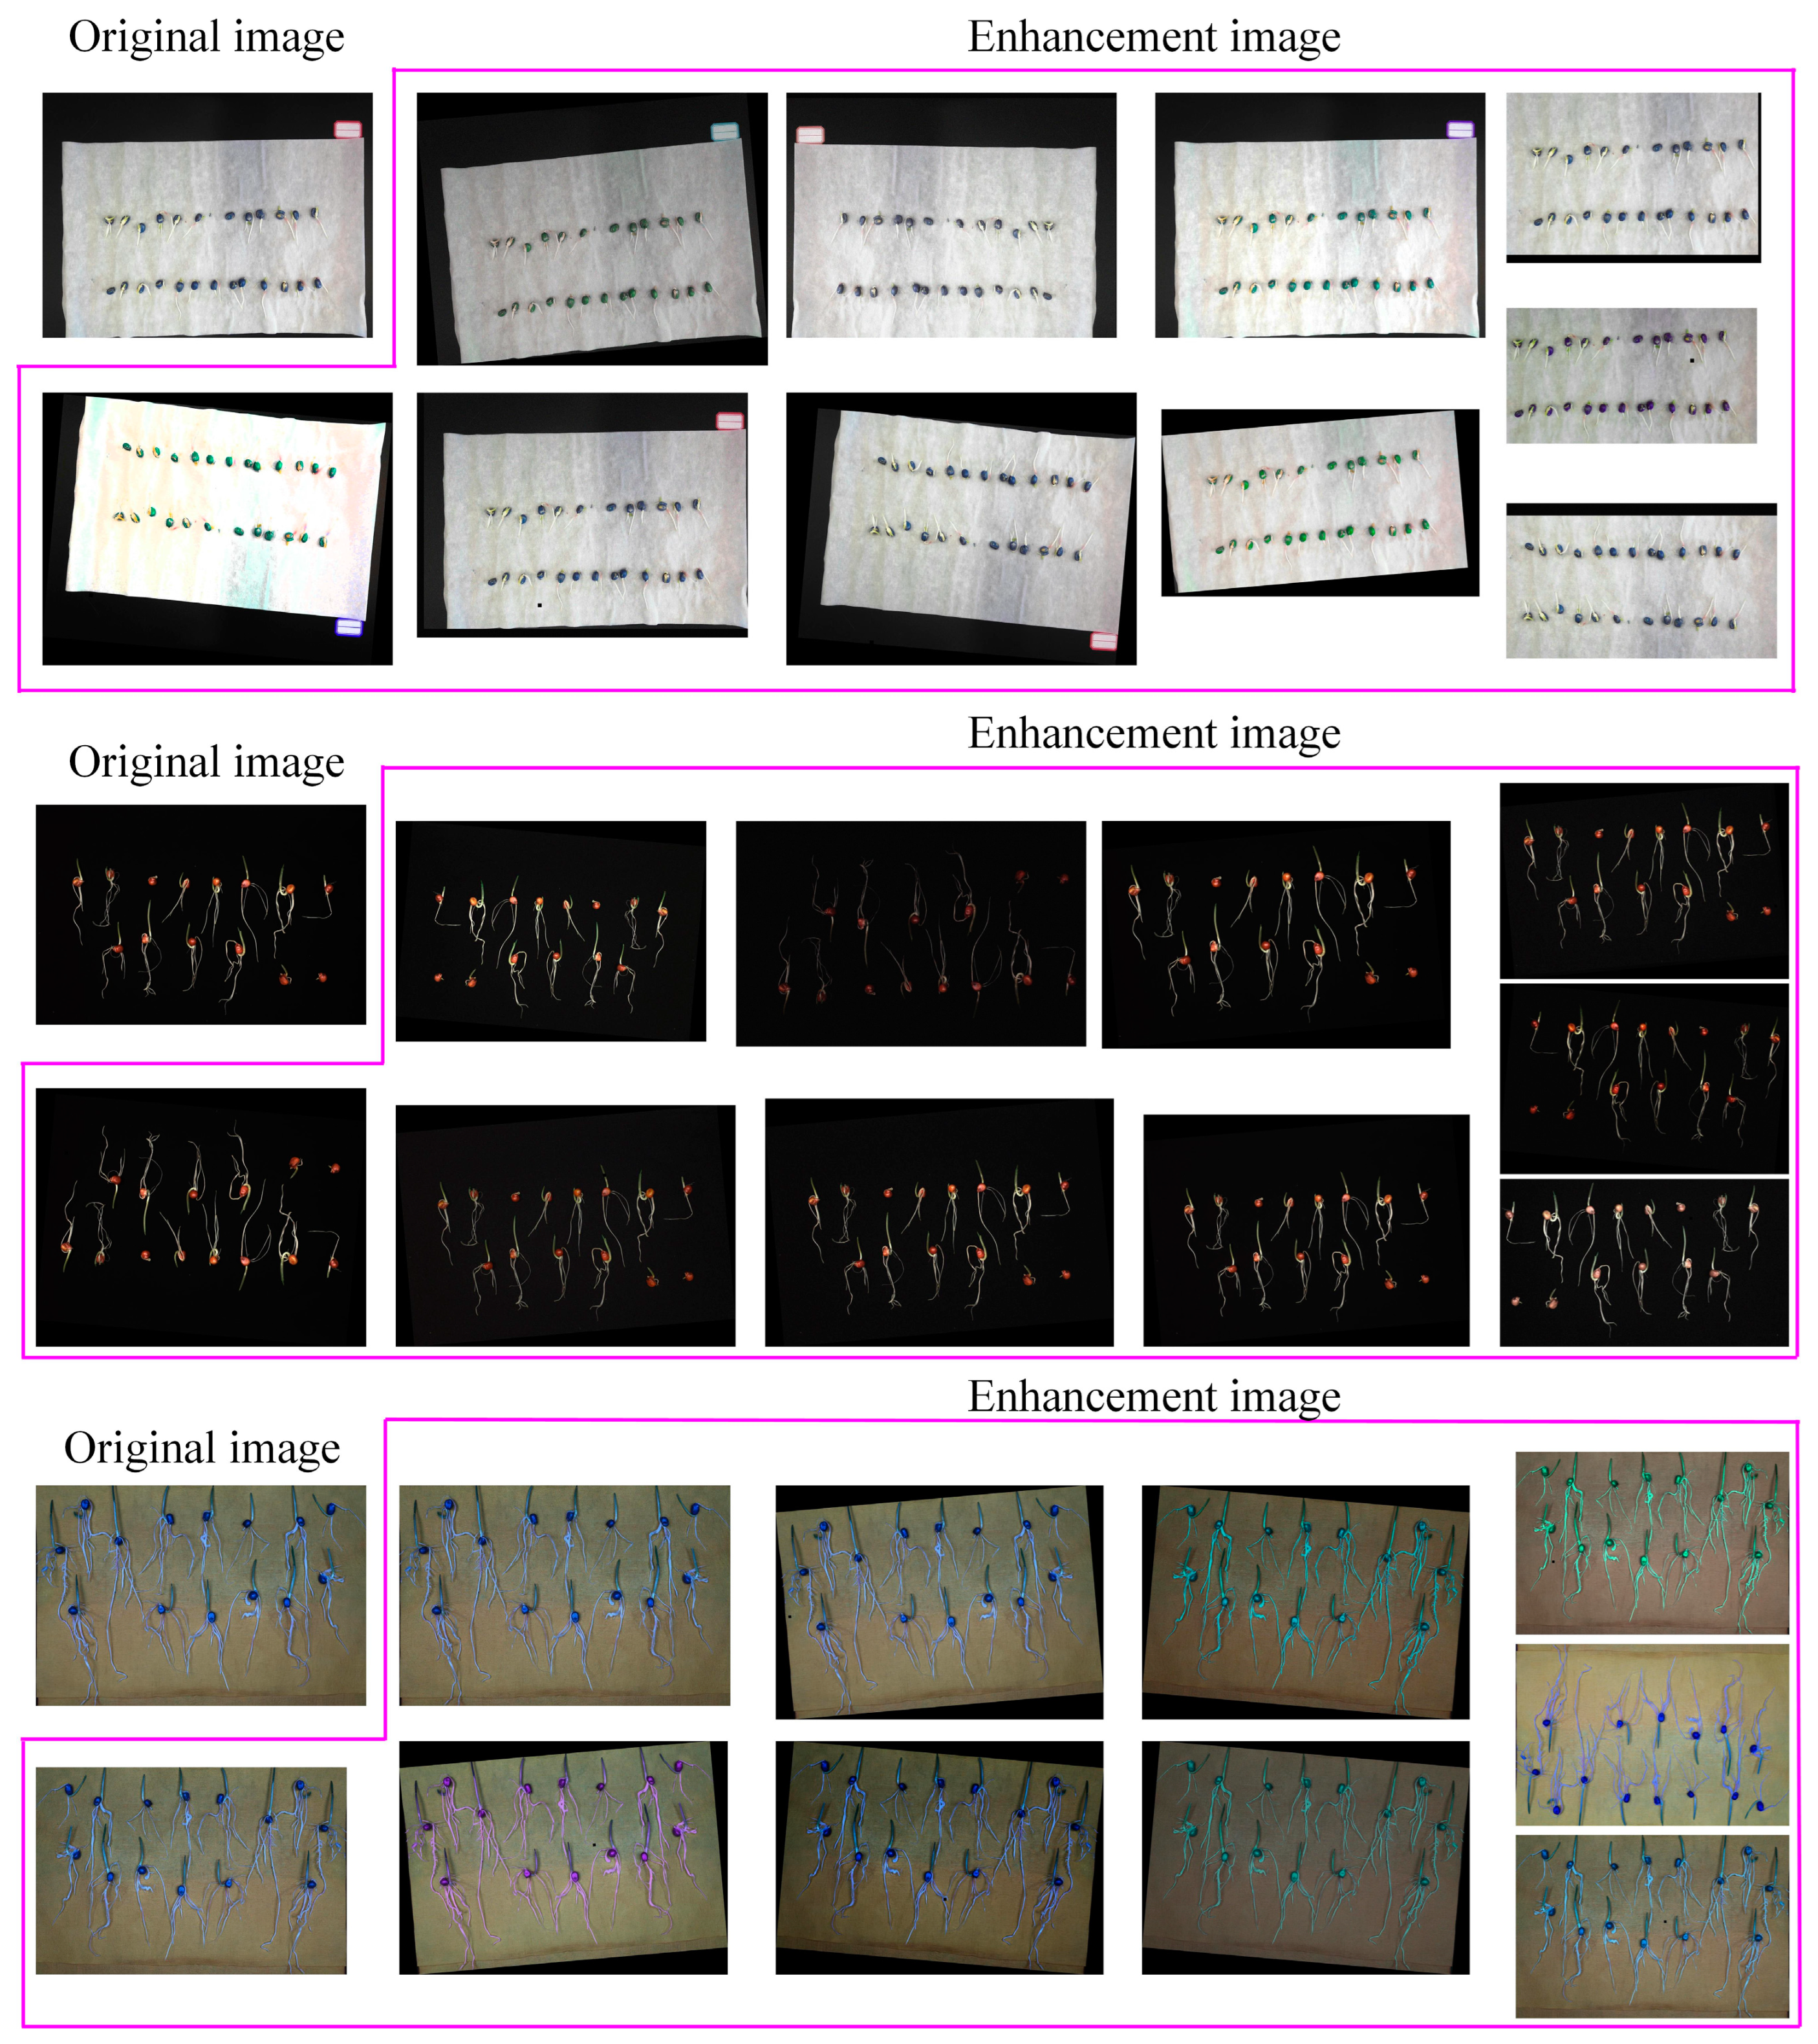
2.1.4. Data Enhancement

To adequately train a deep convolutional neural network, a large number of images are typically required for feature extraction. However, seed germination requires a significant amount of time. To reduce data collection time and prevent overfitting due to limited data, we applied data augmentation techniques to expand the training dataset. As shown in Figure 3, each training image was expanded tenfold using random combinations of methods such as adding Gaussian noise, adjusting brightness, HSV enhancement, Cutout, rotation, cropping, translation, and mirroring, while the test dataset remained unchanged. After data augmentation, the training dataset contained 17,754 images, while the test dataset contained 410 images. The distribution of the three category labels in the augmented training and test sets is presented in Figure 4.

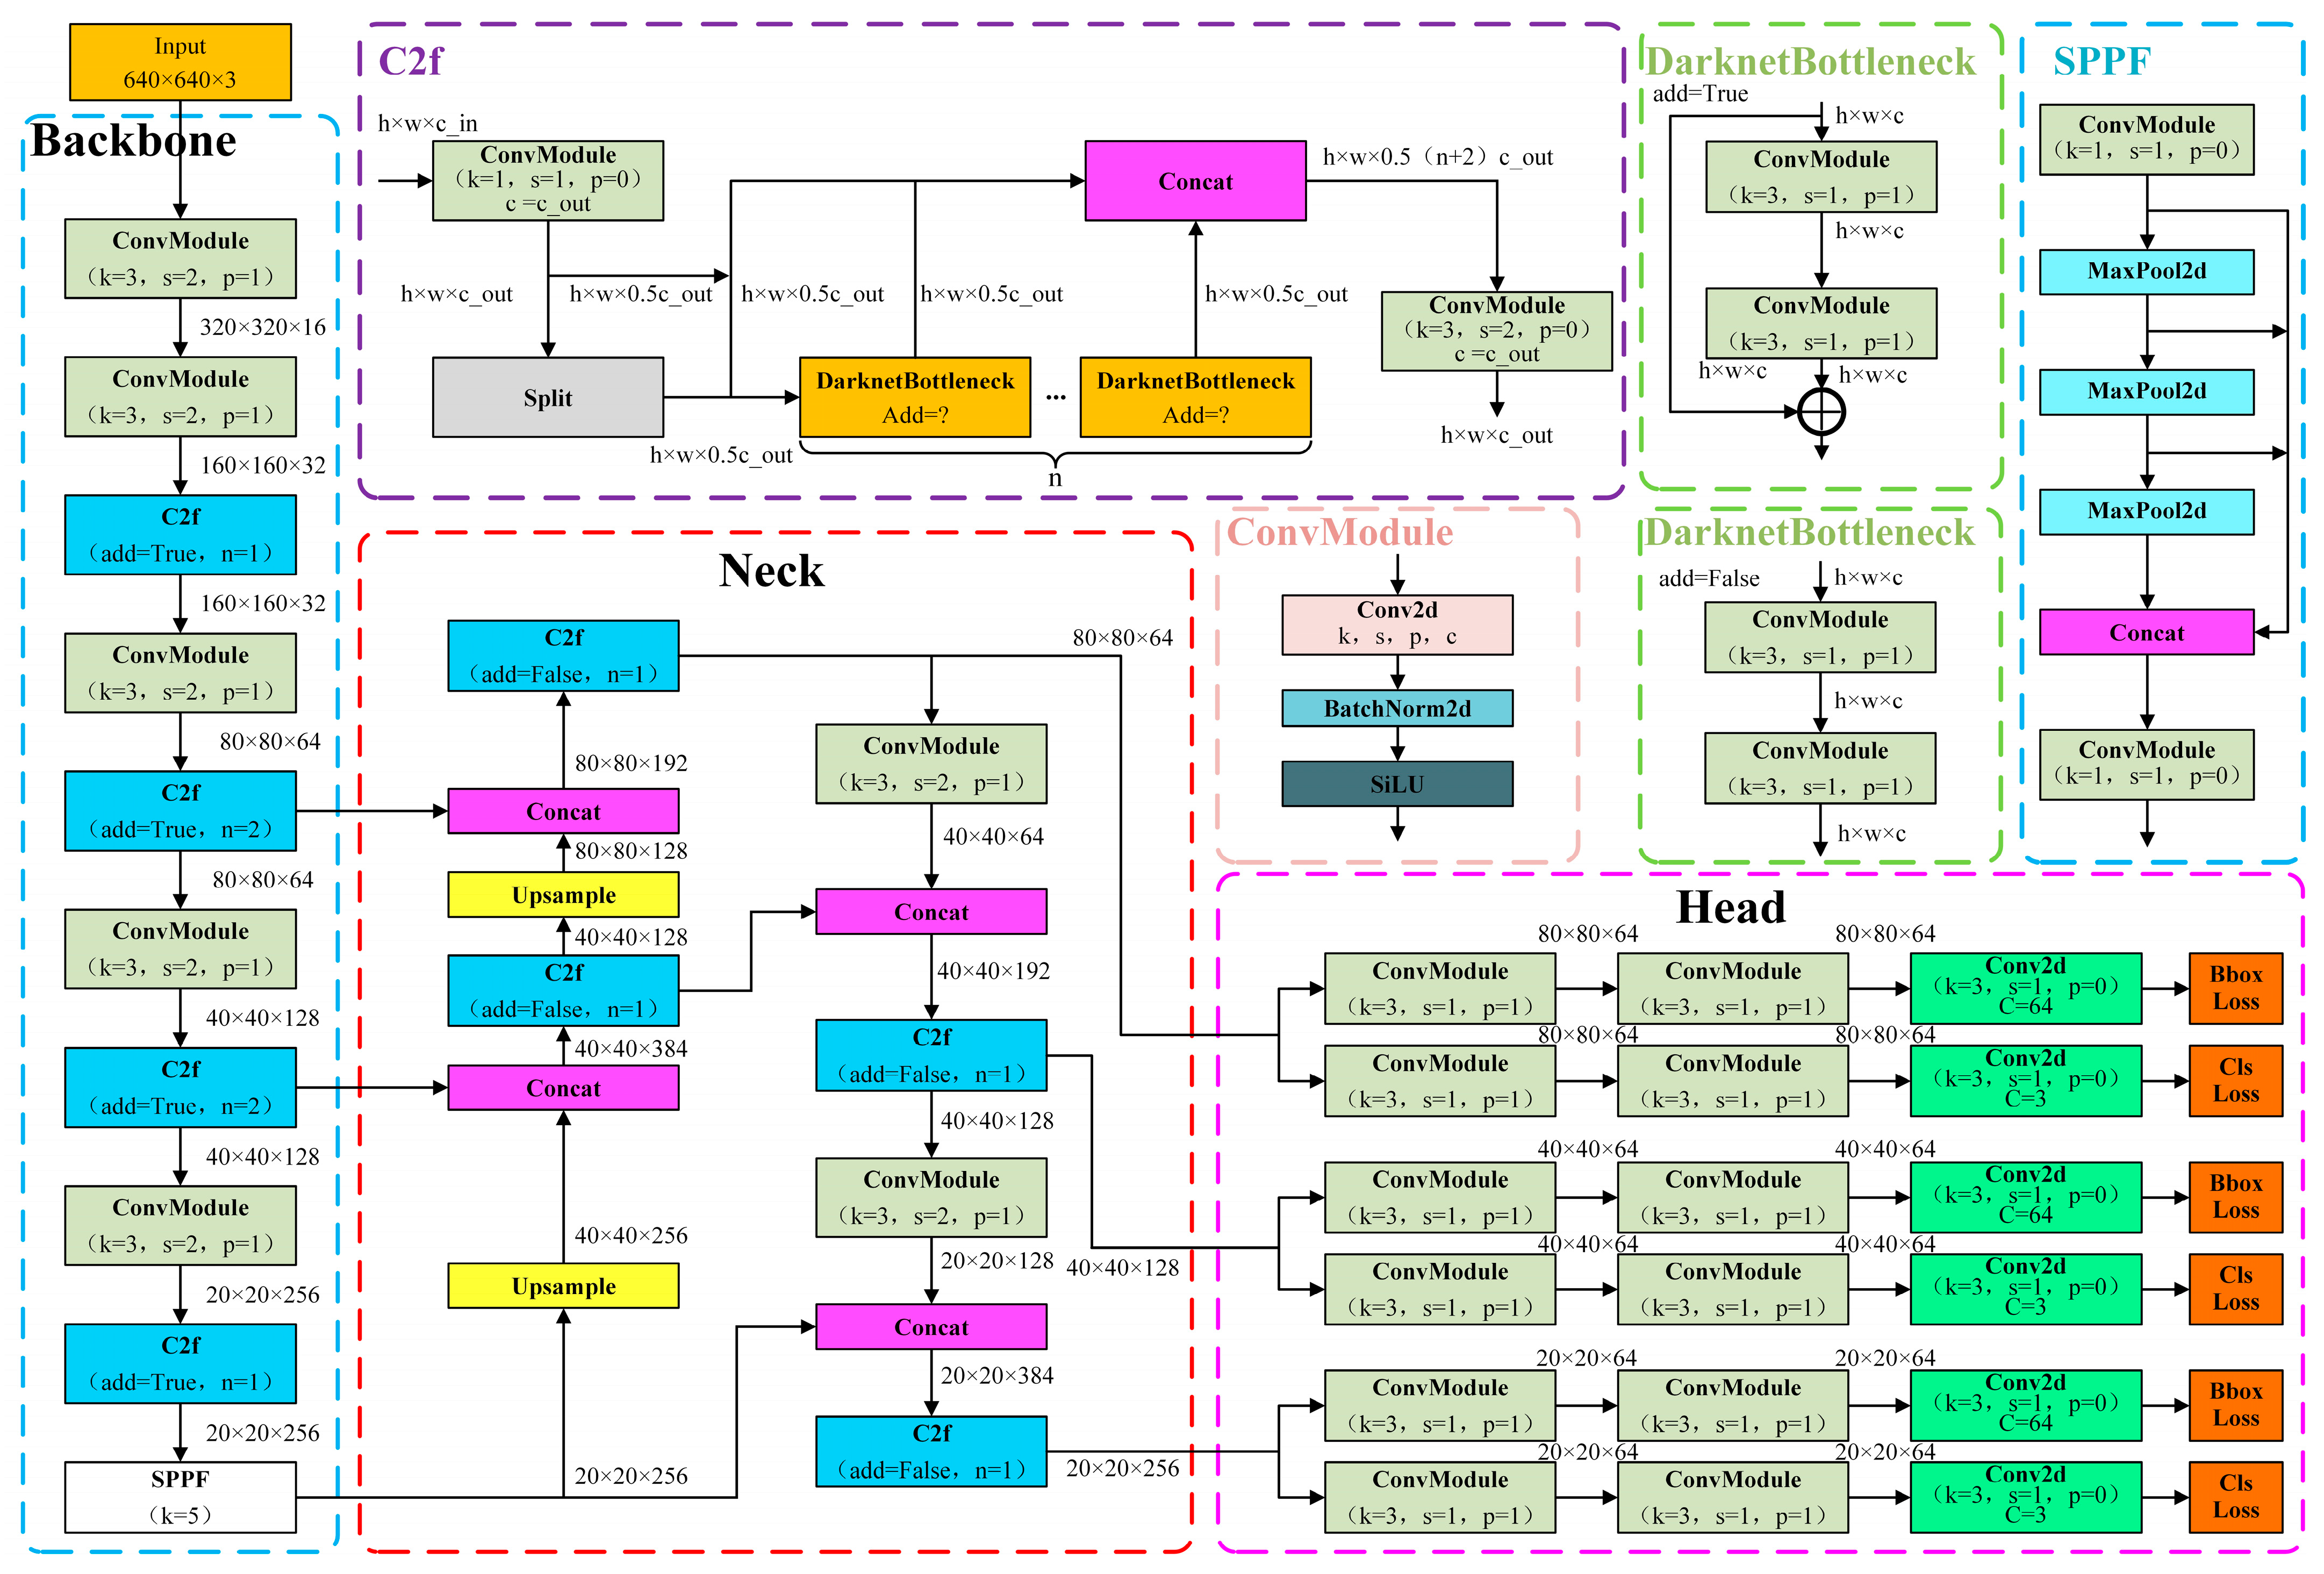
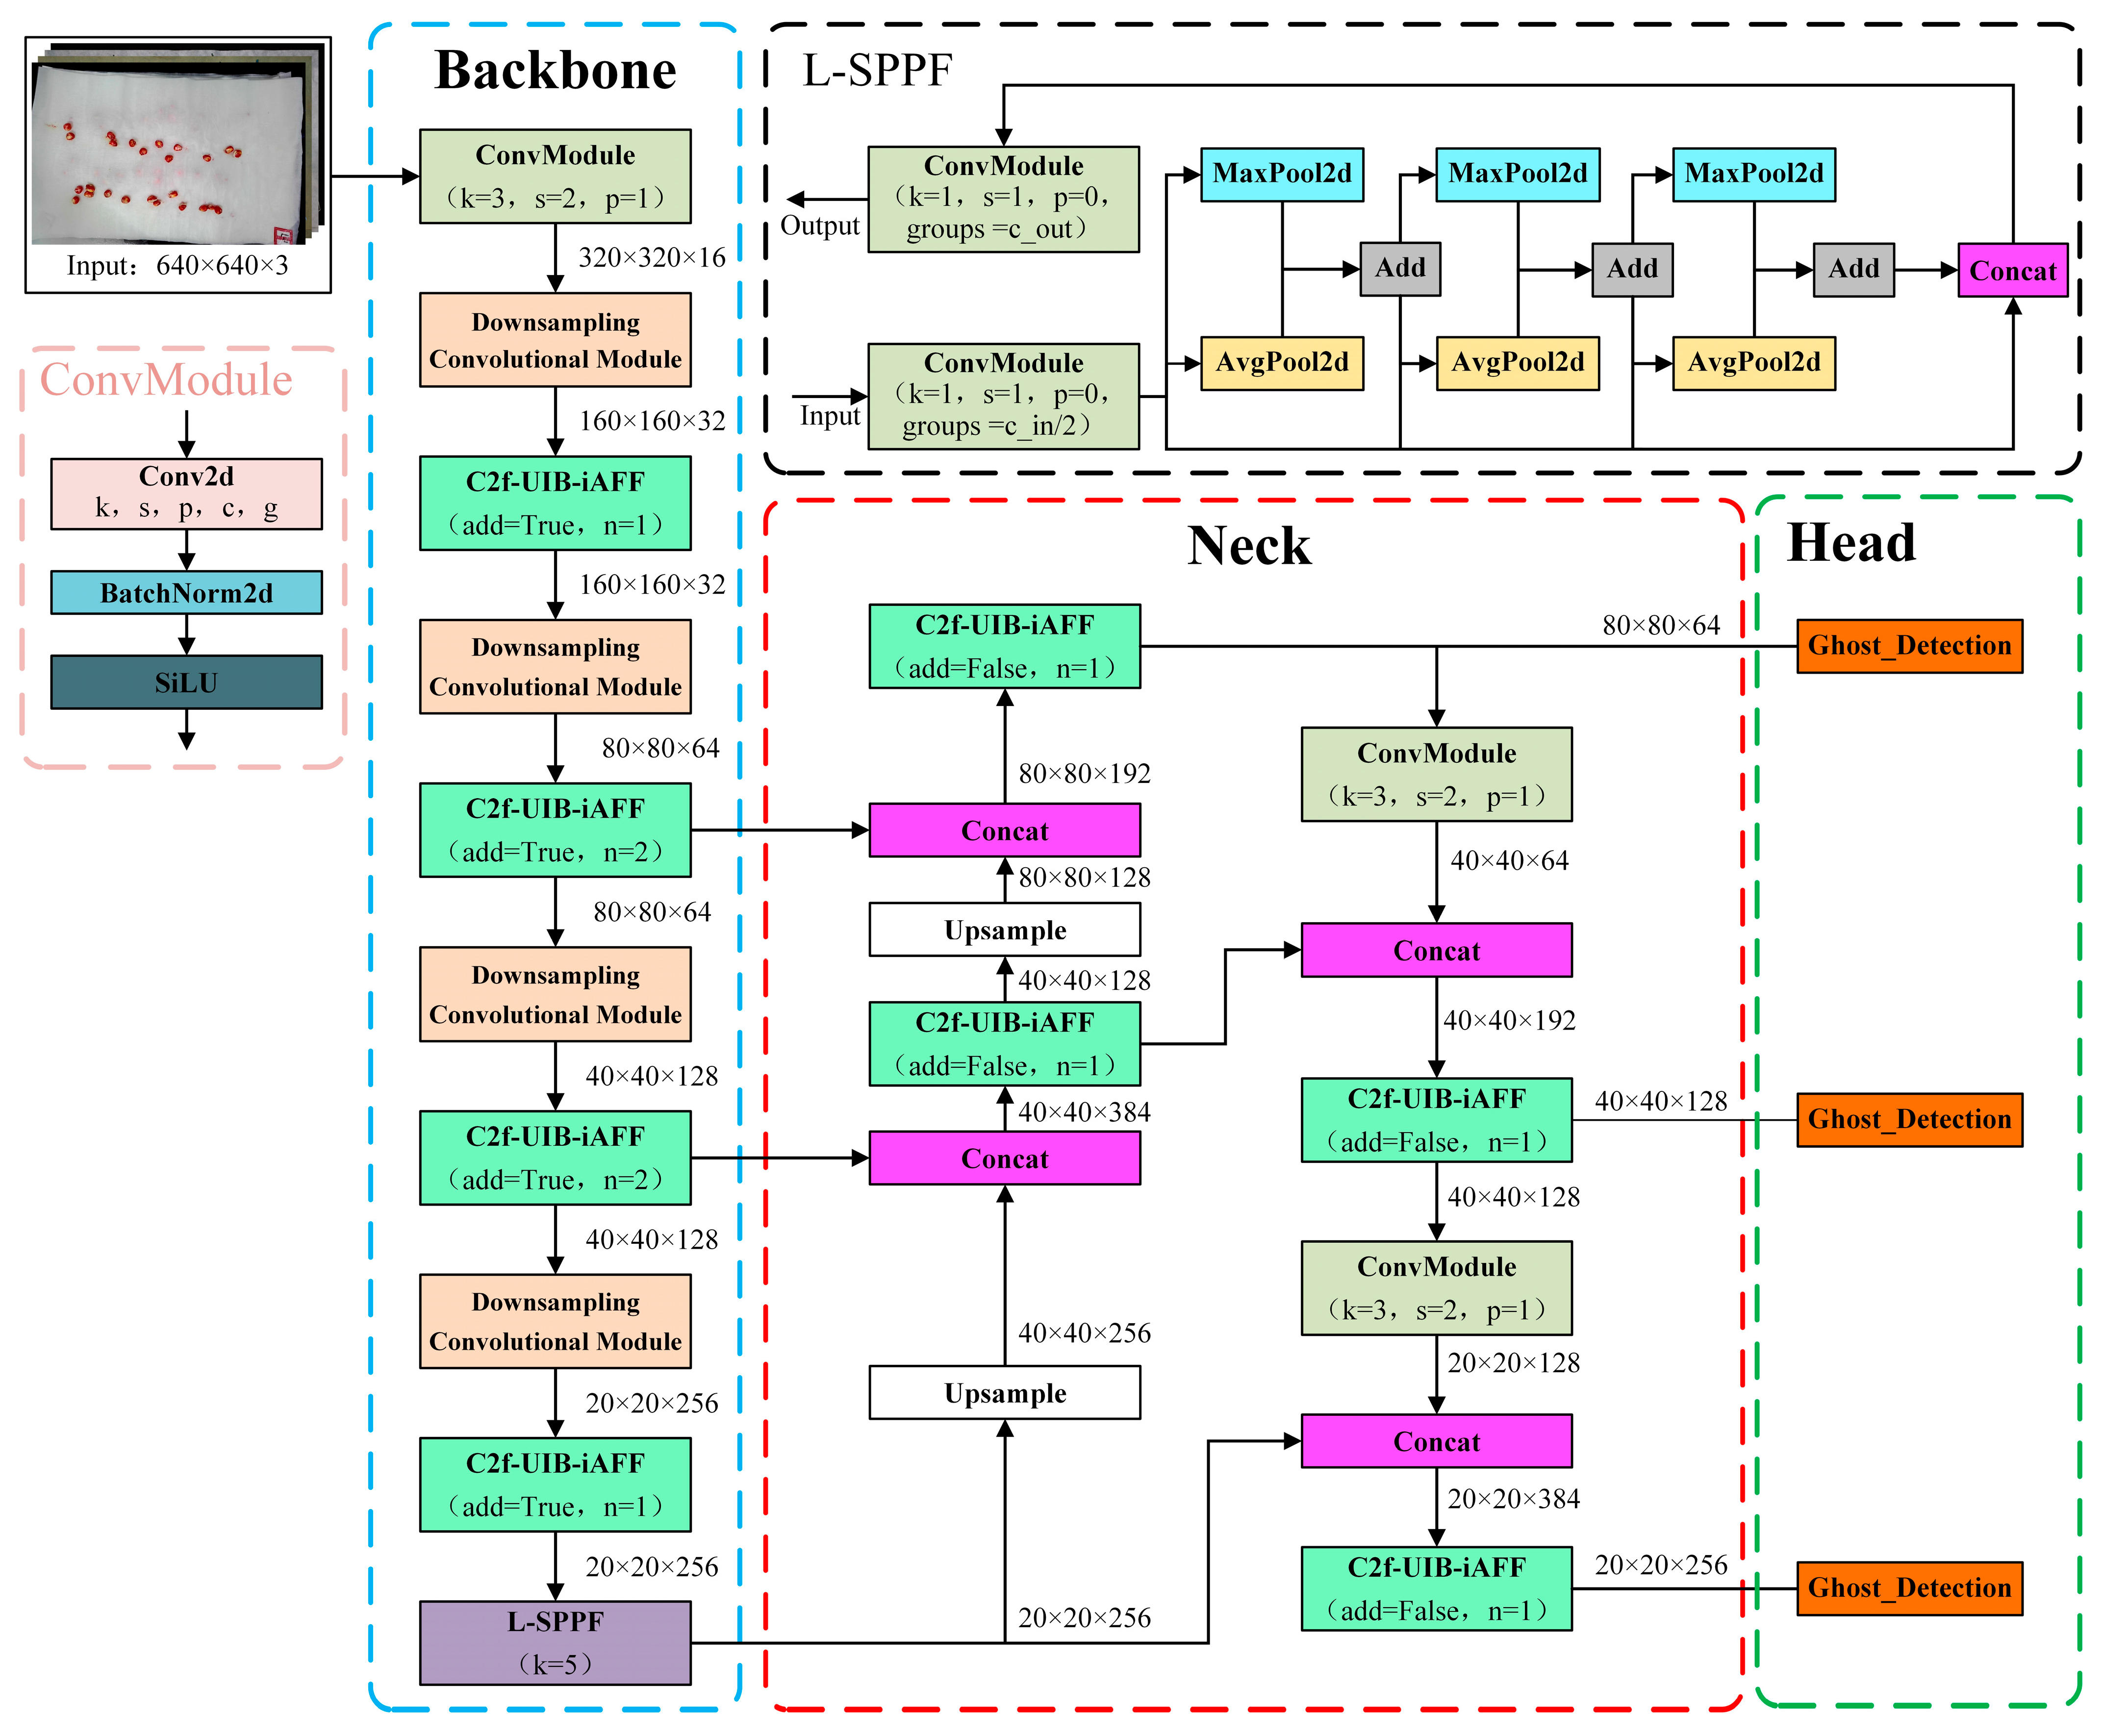
2.2. The Network Structure of CSGD-YOLO

YOLO v8 [13] is an anchor-free, single-stage object detection algorithm characterized by high detection accuracy, fast computation speed, and strong robustness, and it is widely used in various fields such as agriculture, medicine, and industry. Based on network depth and model size, YOLO v8 is divided into five versions: YOLO v8n, YOLO v8s, YOLO v8m, YOLO v8l, and YOLO v8x. Among these, YOLO v8n has the smallest number of parameters and computational requirements, making it the optimal choice for our baseline model improvement. The basic structure of the YOLO v8n model is shown in Figure 5, which is primarily composed of three parts: a feature extraction module, a neck module, and a detection head module. In this study, the input image size is 640 × 640 × 3, and the number of categories is 3. In Figure 5, k is the size of the convolutional kernel or pooling layer, s is the stride, and p is the size of the padding. Detailed parameter numbers for each layer are presented in Table 2.
The YOLO v8n model demonstrates strong performance in general object detection; however, there is still significant room for improvement in terms of model performance and computational complexity when applied to corn seed germination state detection. Based on Figure 5 and Table 2, the majority of YOLO v8n’s parameters and computational load are concentrated in the backbone network and detection head. Furthermore, due to the overlapping, occlusion, and multi-scale characteristics inherent in corn seed germination between papers, YOLO v8n struggles to effectively extract features, resulting in suboptimal performance. Therefore, to reduce model complexity while enhancing feature representation capability, we propose a CSGD-YOLO model based on YOLO v8n. To reduce model complexity, we designed a lightweight spatial pyramid pooling fast (L-SPPF) structure by incorporating grouped convolution and a pooling layer, which improves feature expression capability. Additionally, based on the low-cost linear transformation designed with the aid of GhostConv convolution, we have developed the Ghost_Detection module to improve detection efficiency and reduce the model’s parameter and computational requirements. To enhance the model’s feature extraction capabilities, we propose a downsampling convolutional module based on RFAConv to boost the model’s focus on areas of interest. This study designed a new C2f-UIB-iAFF module to replace the C2f module within the network, thereby enhancing the feature fusion capability of the residual structure while reducing model complexity. The CSGD-YOLO structure is illustrated in Figure 6.

2.2.1. L-SPPF Module

Fast Spatial Pyramid Pooling (SPPF) is proposed based on the Spatial Pyramid Pooling (SPP) [14] method to address issues such as inconsistent output dimensions caused by non-uniform input image sizes, redundant feature extraction, a large number of parameters, and low efficiency. In SPPF, a 1 × 1 standard convolution is first used to reduce the number of channels to half of the input feature map. Then, a 5 × 5 max pooling operation is applied to capture the global feature representation within the receptive field. This is followed by a serial structure to extract features at different scales (7 × 7, 9 × 9), with concatenation performed along the channel dimension. Finally, another 1 × 1 convolution is used to ensure that the number of output channels matches that of the input. Although SPPF employs a 1 × 1 standard convolution, the large number of channels in the input and output feature maps still results in a substantial parameter count. Moreover, max pooling tends to emphasize global features while overlooking local features. Therefore, in this study, we replace the 1 × 1 standard convolution in SPPF with grouped convolution and propose L-SPPF by combining max pooling and average pooling to enable feature extraction at multiple scales. The L-SPPF structure is illustrated in Figure 7.

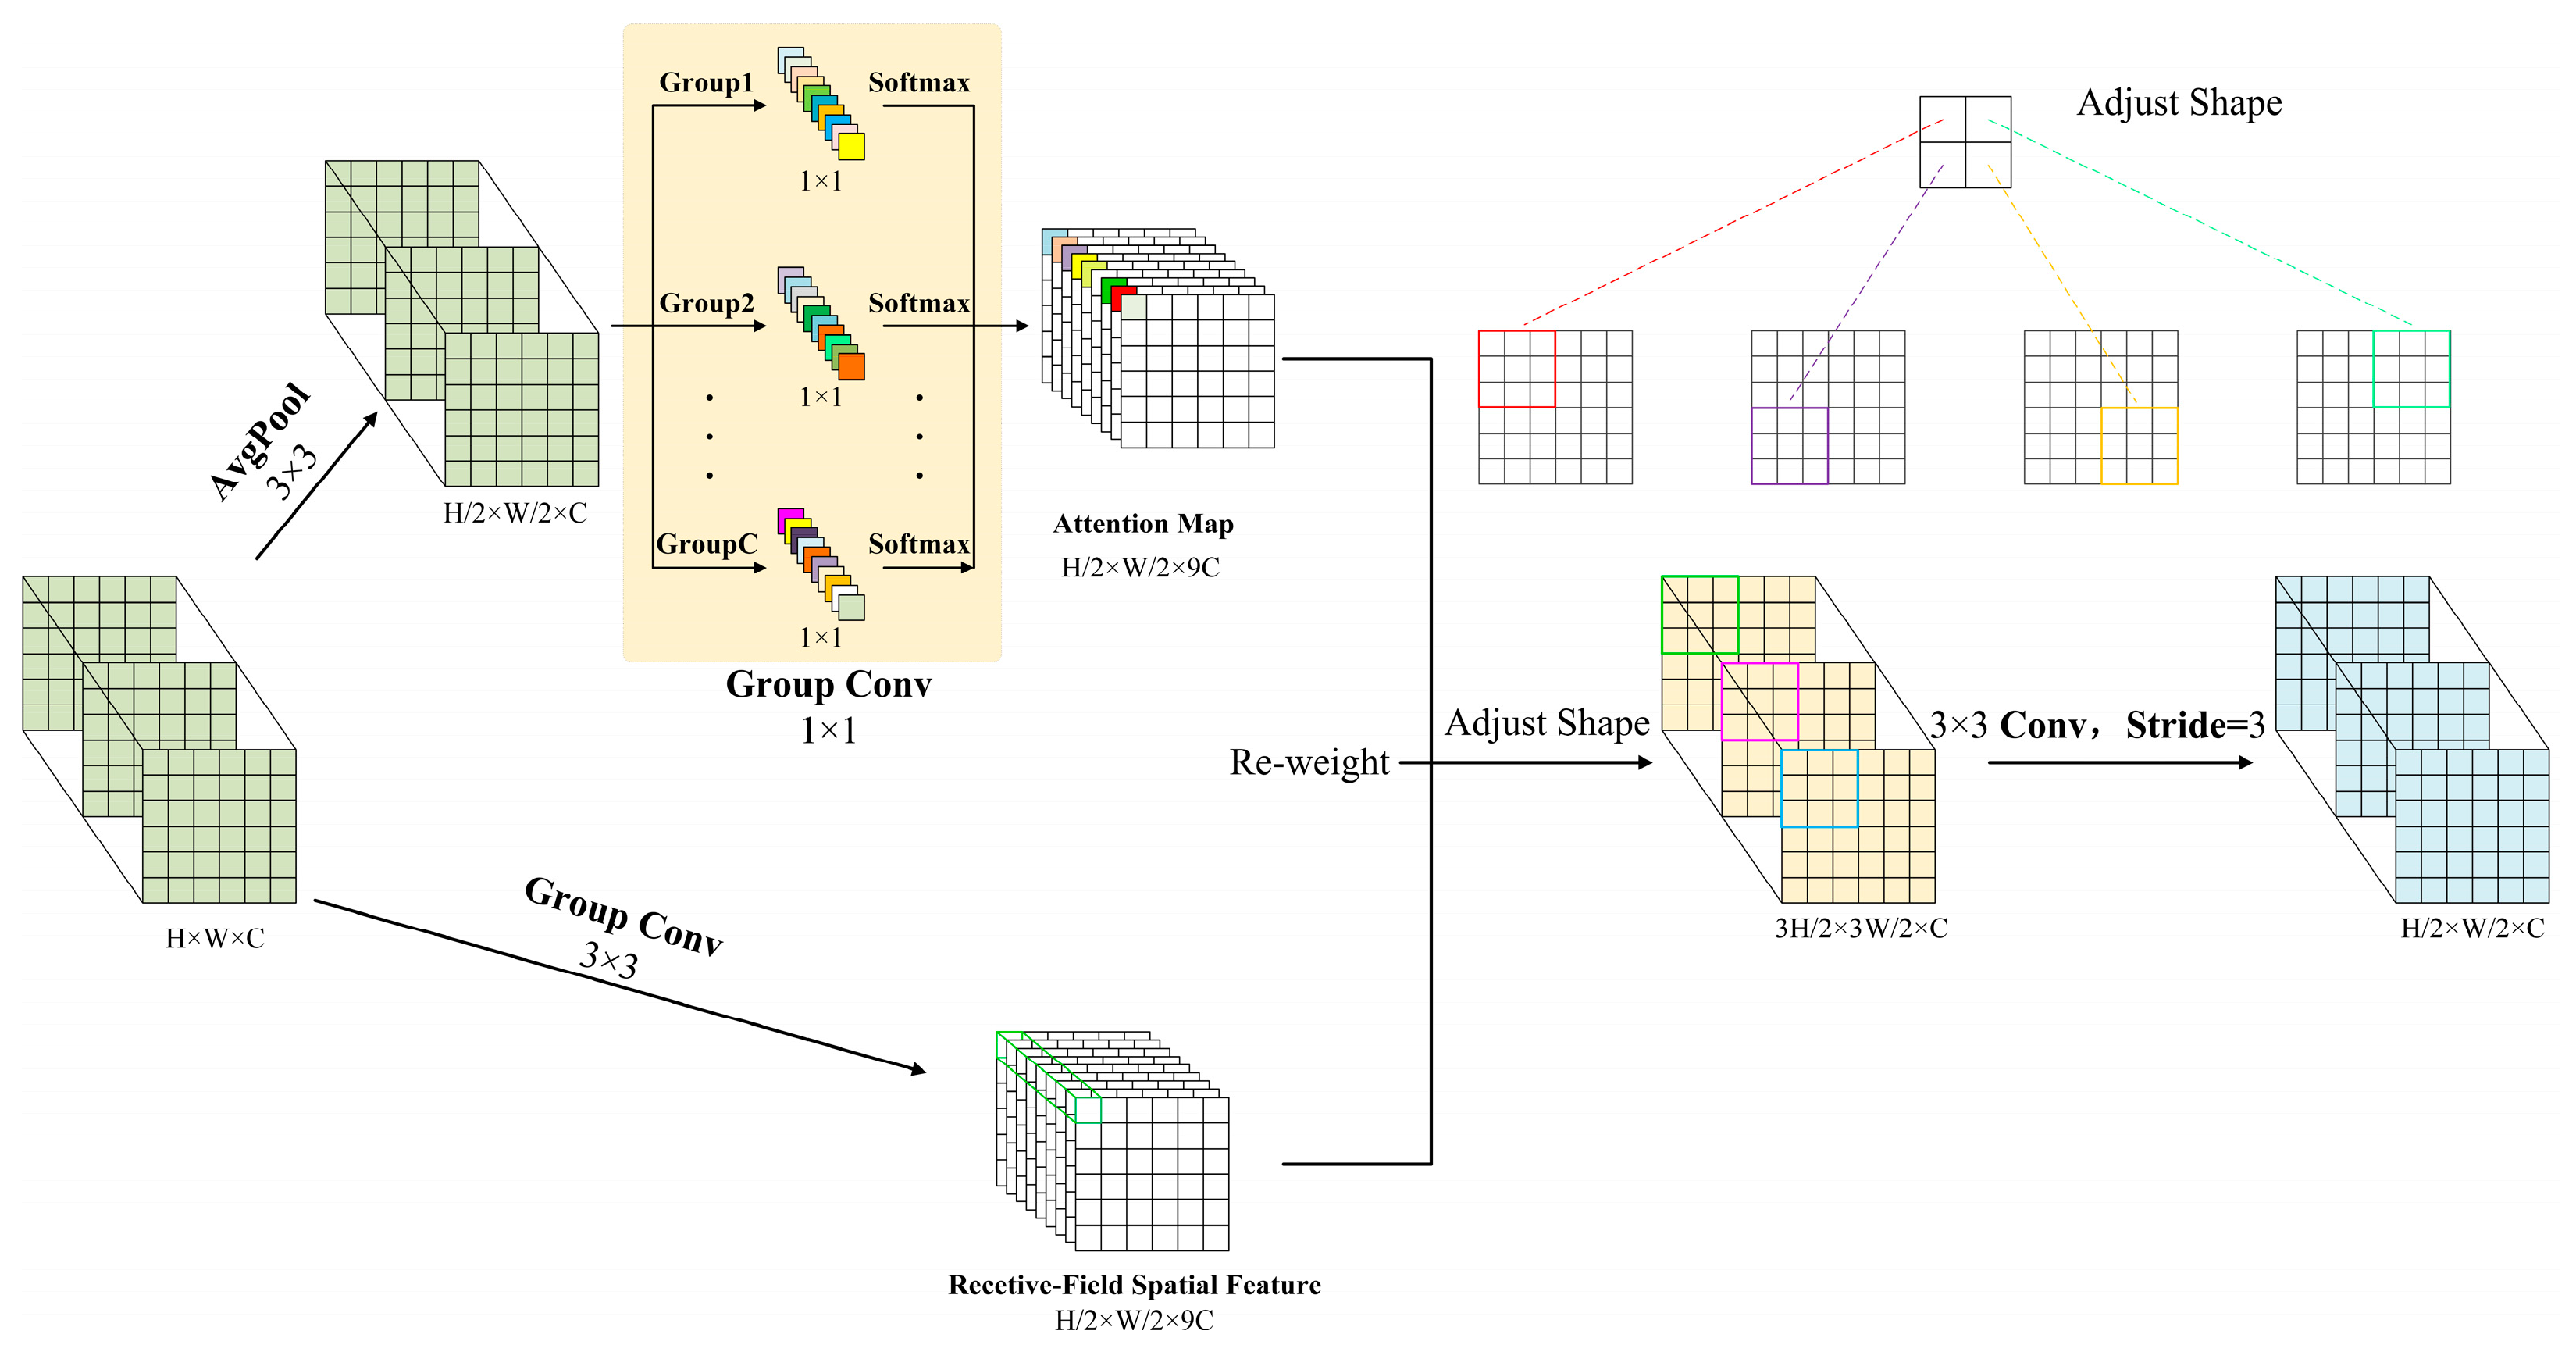
2.2.2. C2f-UIB-iAFF Module

To enhance the model’s feature extraction capabilities, we designed a C2f-UIB-iAFF module to replace the C2f module throughout the entire network, as illustrated in Figure 8. The C2f-UIB-iAFF primarily comprises the UIB and iAFF structures. The UIB, originally designed in MobileNet v4 to reduce model complexity, employs alternating 3 × 3 grouped convolutions and 1 × 1 standard convolutions in sequence to extract features, thereby reducing both the parameter count and computational cost [15]. Additionally, to avoid gradient vanishing problems caused by increased network depth, residual connections are used to add depth to the network. As shown in Figure 8b for UIB-iAFF, if the input feature map is Y R C i n   ×   H   ×   W , where Cin is the number of channels and H × W represents the feature map dimensions, then the channel count Cin1 is set to the nearest integer to Cin that is divisible by 8.
Traditional residual connections fuse features through simple linear summation, which is insufficient for addressing inconsistencies in scale and semantic features during fusion. Therefore, in UIB-iAFF, iAFF is utilized to enhance the feature fusion capability of the residual connections. As shown in Figure 8c, iAFF [16] consists of the Attention Feature Fusion (AFF) module combined with the Multi-Scale Channel Attention Module (MS-CAM). MS-CAM is primarily used to extract channel attention from two branches with different scales [17]. The computation flow of MS-CAM is illustrated in Figure 8d. If the input feature is Z R C   ×   H   ×   W , then the output feature Z′ is defined as follows:
L Z = F B N F P W C o n v 2 F R e L U F B N F P W C o n v 1 Z
G Z = F B N F P W C o n v 4 F R e L U F B N F P W C o n v 3 F G A P Z
Z = Z F δ L Z + G Z    
where F B N · , F G A P · , F δ · and F R e L U · denote batch normalization, global average pooling, sigmoid nonlinear activation function, and the nonlinear function ReLU. F P W C o n v 1 · , F P W C o n v 2 · , F P W C o n v 3 · and F P W C o n v 4 · represent pointwise convolutions (with kernel size 1 × 1). The indicates the element-wise multiplication of the corresponding positions in two feature maps.
In the iAFF module, the two input features are first subjected to initial feature fusion, followed by feature extraction using MS-CAM. Subsequently, a weighted average is applied to obtain the output feature map from AFF. This output feature map is then utilized for MS-CAM, ultimately producing the output of the iAFF. The specific computation is as follows:
M = F M 1 A + B A + 1 F M 2 A + B B
C = F M 3 M A + 1 F M 3 M B
where A R C   ×   H   ×   W 1 and B R C   ×   H   ×   W are the input feature maps from two different scales or semantic levels, F M 1 · , F M 2 · and F M 3 · denote the MS-CAM computation operations, M R C   ×   H   ×   W denotes the output feature map from the AFF module. C R C   ×   H   ×   W represents the output feature map of the iAFF module. The indicates the element-wise multiplication of the corresponding positions in two feature maps.

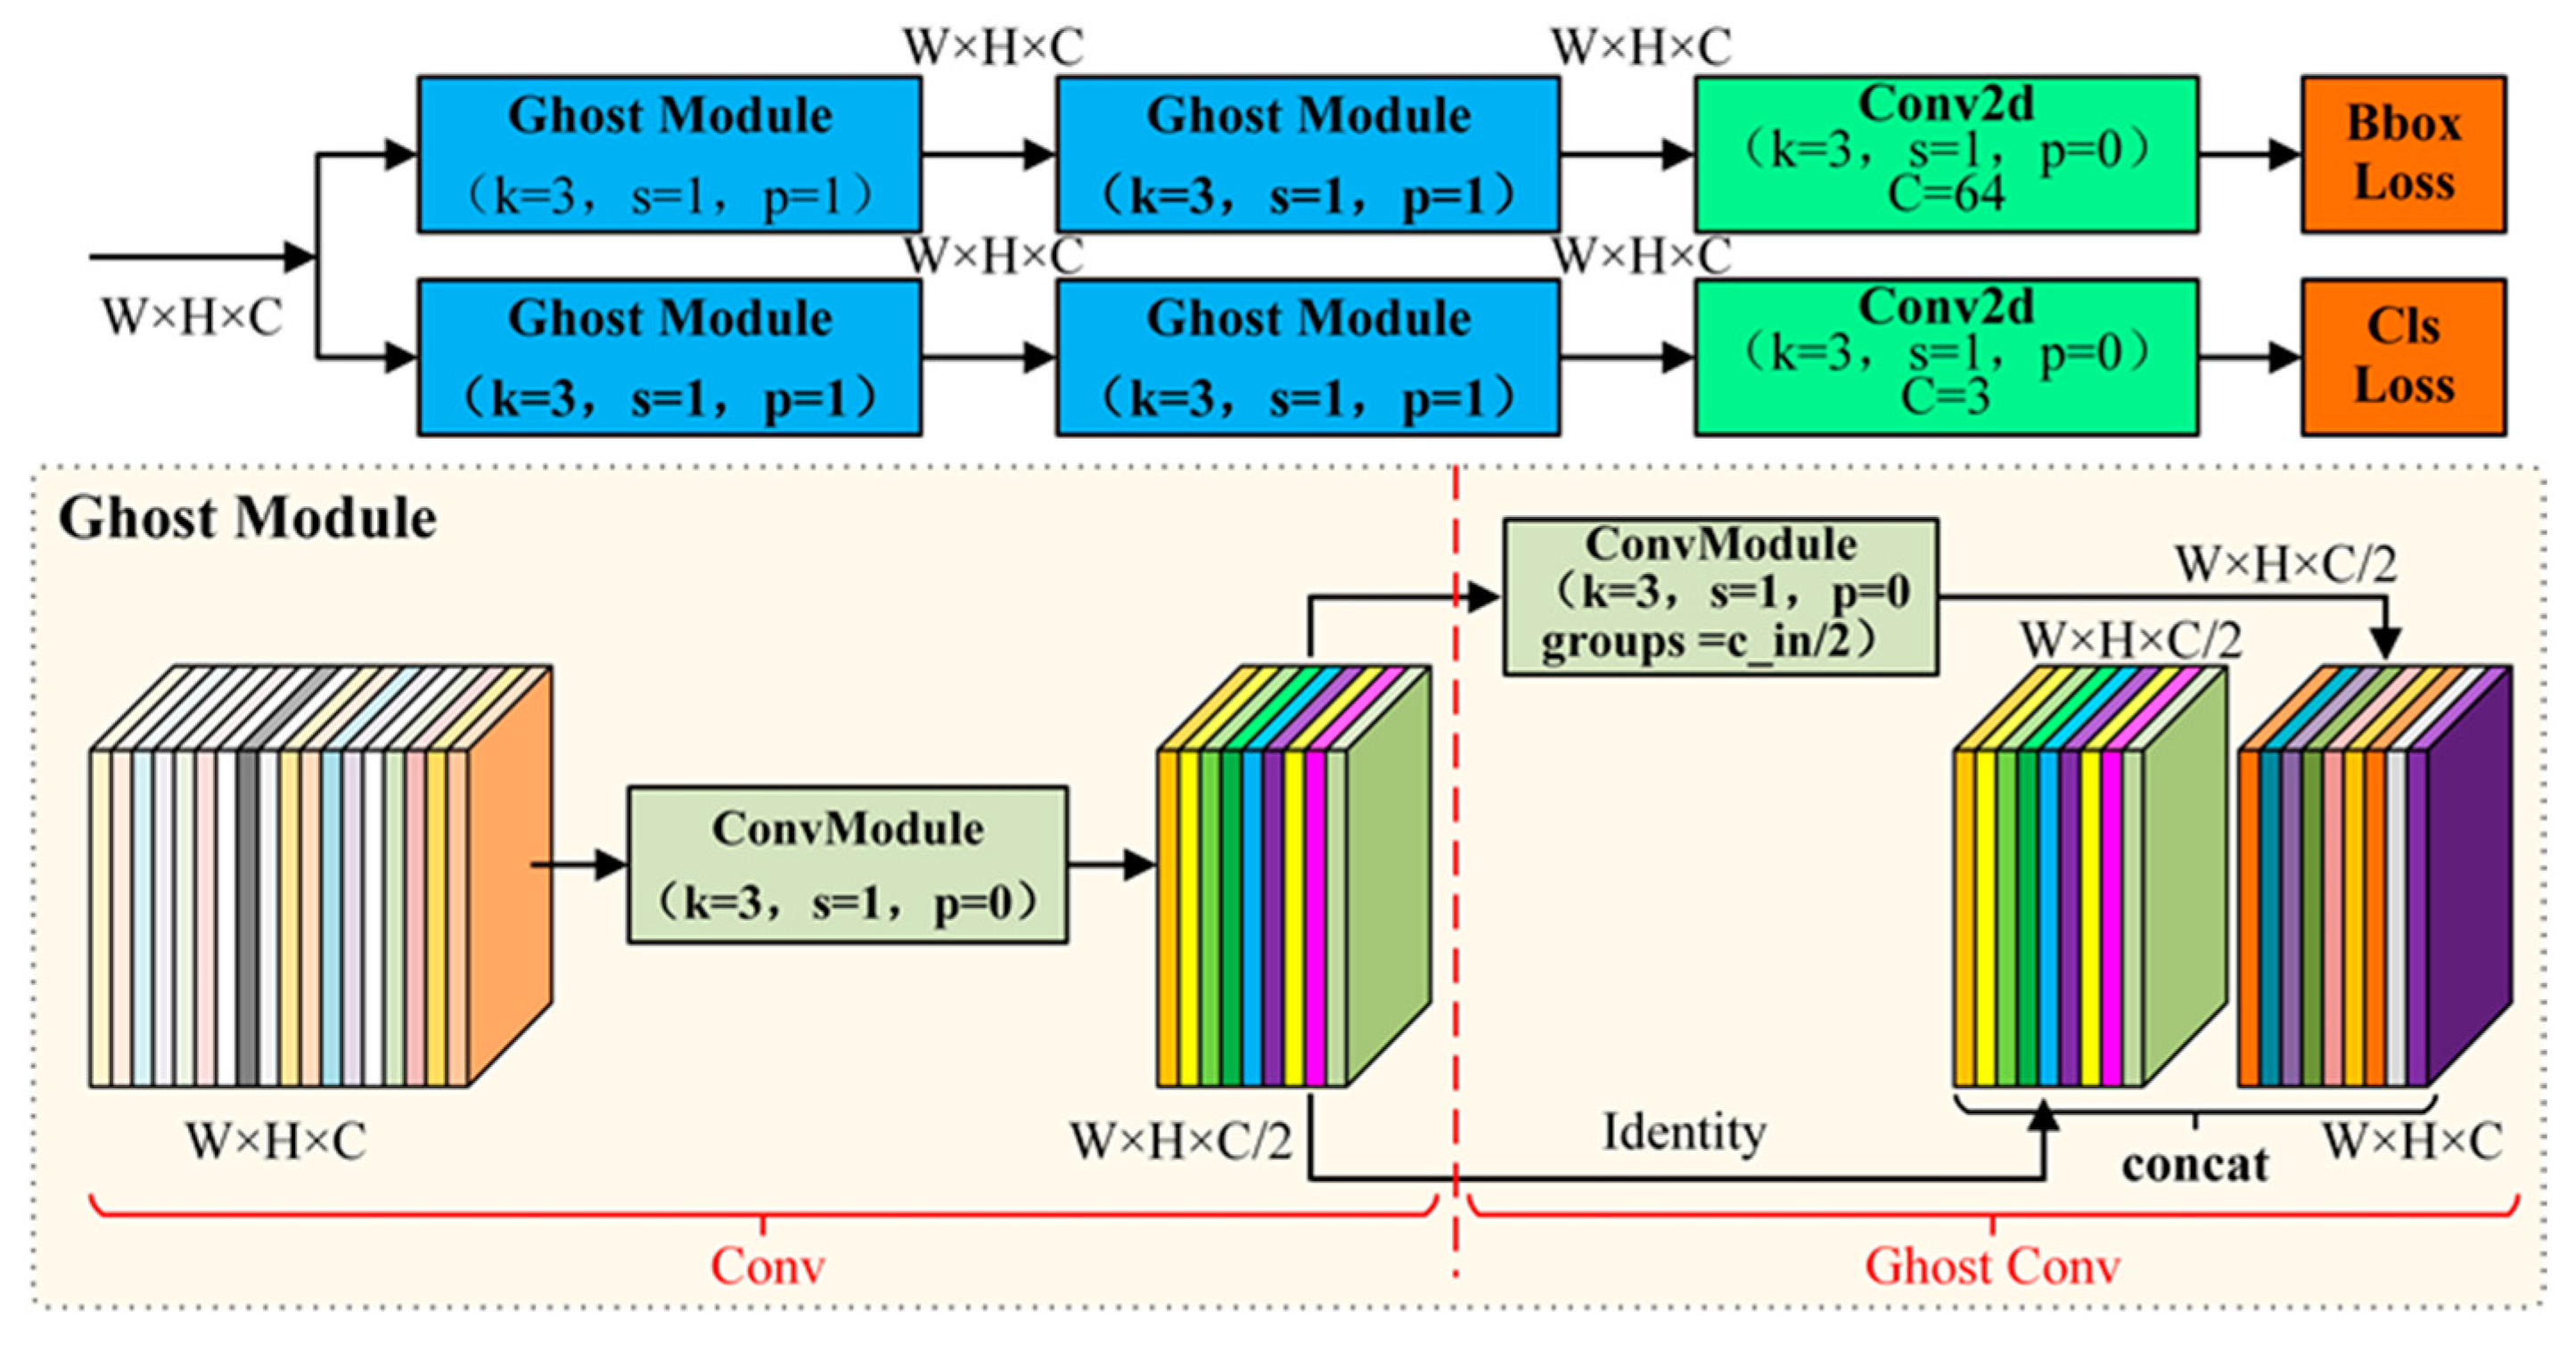
2.2.3. Ghost_Detection Module

In YOLOv8, the detection head employs decoupled classification and object box branches, which can improve the model’s performance to some extent but also increase its computational load and parameters. As shown in Table 2, the basic YOLOv8 detection head accounts for approximately 25% of the model’s parameters. The Ghost Module, proposed by Han et al., is a model compression technique that can reduce redundant feature extraction across channels, thereby reducing both the parameters and computational cost while maintaining model accuracy and reducing model complexity. In this work, the Ghost_Detection module replaces the first two standard convolutions in both the classification and object box branches of the detection head with the Ghost Module, resulting in a new detection head. The specific structure is illustrated in Figure 9.
The core idea of the Ghost module is to divide a standard convolution into two smaller convolutional layers in series, where one is a standard convolution, and the other is a Ghost convolutional layer. Specifically, the convolutional layer compresses the input feature channels, while the Ghost convolutional layer performs two subsequent operations on the compressed feature map. First, it applies grouped convolution to the compressed feature map. Then, the compressed feature map is concatenated along the channel dimension with the feature map produced by the grouped convolution. This approach reduces the learning cost of non-critical features by substituting standard convolutions with a combination of fewer convolutional filters and inexpensive linear transformations, thereby reducing both parameter count and computational cost. If the input feature map is X R C × H × W and the output feature map is X R C × H × W , the computational complexity and parameter count for the Ghost module and the standard convolution are given by the following formulas:
F G h o s t _ M o d u l e = C g × W × H × C × k 1 × k 1 + g 1 × C g × W × H × k 2 × k 2
P G h o s t _ M o d u l e = C g × C × k 1 × k 1 + g 1 × C g × k 2 × k 2
F C o n v = W × H × C × k × k × C
P C o n v = C × C × k × k
where FGhost_Module, PGhost_Module represent the computational complexity and parameter count of the Ghost Module, respectively, while FConv, PConv denote the computational complexity and parameter count of a standard convolution. In the Ghost Module, k1 and k2 represent the kernel sizes of the standard convolution and grouped convolution, respectively. The parameter g is the compression ratio of channel reduction, and k is the kernel size used in the standard convolution. The ratio between the parameter count and computational complexity of the standard convolution and the Ghost module is as follows:
r F = F C o n ν F G h o s t _ M o d u l e = C × k × k C g × k 1 × k 1 + g 1 g × k 2 × k 2 = g × C × k × k C × k 1 × k 1 + g 1 × k 2 × k 2
r p = P C o n ν P G h o s t _ M o d u l e = C × k × k C g × k 1 × k 1 + g 1 g × k 2 × k 2 = g × C × k × k C × k 1 × k 1 + g 1 × k 2 × k 2
rF is the ratio of computational complexity between the standard convolution and the Ghost Module, rp is the ratio of parameter count between the standard convolution and the Ghost Module. In the Ghost_Detection module, both k and k1 are set to 3, k3 is set to 5, and g is set to 2. Consequently, the values of rF and rp are calculated to be approximately 2. Thus, adopting the Ghost_Detection module structure can significantly reduce the model’s parameters and computational cost.

2.2.4. Downsampling Convolutional Module

In the backbone of YOLO v8n, a standard convolution module with a kernel size of 3 and a stride of 2 is used between two C2f modules for feature extraction and dimensionality reduction in the feature map. However, during the standard convolution operation, the same parameters are applied across the entire receptive field, which fails to account for the variations in shape, size, color, and distribution of objects at different locations within the image. Thus, the standard convolution module lacks sensitivity to location-specific variations, and it does not consider the relative importance of each feature within the receptive field. Consequently, this reduces the efficiency of feature extraction and limits the overall performance of the model. RAFConv was introduced to address the shortcomings of spatial attention mechanisms, specifically to overcome the limitations of parameter sharing in large convolution kernels and to distinguish the importance of each feature within the receptive field [18]. Based on RAFConv, we proposed a region-of-interest-based downsampling convolutional module and integrated it into the backbone of YOLO v8n to enhance the feature representation capability of the backbone network. The structure of the downsampling convolutional module is illustrated in Figure 10.
The downsampling convolutional module is mainly divided into two parts: the upper part and the lower part. The upper part processes the input feature map using a 3 × 3 global average pooling operation with a stride of 2 to extract global information from the receptive field. Next, a 1 × 1 grouped convolution is used to facilitate information exchange, and a softmax function is applied to normalize and determine the importance of each feature within the receptive field, resulting in an attention map of receptive field features.
The lower part processes the input feature map using a 3 × 3 grouped convolution with a stride of 2 to generate spatial features of the receptive field that have the same dimensions as the receptive field attention map. Both the attention map and the receptive field spatial features are computed using grouped convolution, which effectively reduces computational cost and complexity. Finally, the receptive field spatial features are weighed based on the attention map to extract the most important features. After dimensional adjustment, the final output of the receptive field attention convolution is obtained. The output result is defined as follows:
F R F A C o n ν = F S i L U ( F B N ( F C o n ν ( ( F R e L U ( F B N ( F G _ C o n ν 1 ( X ) ) ) F S o f t m a x ( F G _ C o n ν 2 ( F G A P _ 3 ( X ) ) ) ) ) ) )
where X is the input feature map, F G _ C o n v 1 · is the grouped convolution with kernel size of 3 × 3 and stride of 2, F G _ C o n v 2 · is the grouped convolution with kernel size of 1 × 1 and stride of 1, F G A P _ 3 · is global average pooling with kernel size of 3 × 3 and stride of 3, while F C o n v · represents standard convolution with kernel size of 3 × 3 and stride of 3, F B N · is Batch Normalization, F S i L U · is the nonlinear function SiLU, F R e L U · is the nonlinear function ReLU, F s o f t m a x · is the nonlinear function softmax, The indicates the element-wise multiplication of the corresponding positions in two feature maps.

3. Experiment

3.1. Experimental Configuration

The model training and testing were conducted on a 64-bit Ubuntu 22.04 operating system, utilizing two Intel 8488C CPUs (Santa Clara, CA, USA) and 512 GB of memory. The network model was trained using Python 3.8.19 and the PyTorch 2.3.1 framework, with the software platform being Visual Studio Code. The GPU used was an NVIDIA GeForce RTX 4090, featuring 16,384 CUDA cores and 24 GB of GDDR6, with a CUDA version of 12.1.

3.2. Experiment Parameters Setting

All experiments in this study were conducted under the same conditions, with YOLO v8n selected as the baseline model. The training images were resized to 640 × 640, and the model was optimized using the Stochastic Gradient Descent (SGD) algorithm. The momentum factor is set to 0.937, the initial learning rate is 0.01, the final learning rate is 0.00001, and the decay coefficient is 0.0005. The training was configured for 800 epochs, with a batch size of 32 and 64 worker threads. Mosaic data augmentation was disabled to ensure environmental consistency and pre-trained weights were not loaded. The loss function utilized was the original YOLO v8 loss function.

3.3. Evaluation Metrics

This study evaluates the model from two perspectives: detection performance and model complexity. The detection performance encompasses four metrics: P, R, mAP0.5, and mAP0.50:0.95. Model complexity primarily includes model weight size, the number of model parameters, and the number of floating-point operations (FLOPs). Specifically, mAP0.5 refers to the mean average precision when the Intersection over Union (IoU) exceeds 0.50, while mAP0.50:0.95 indicates the mean average precision calculated over an IoU range from 0.50 to 0.95 with an increment of 0.05. The model weight size reflects the storage space occupied by the model algorithm in the hardware platform’s ROM. Additionally, to ensure uniformity in model performance comparisons, the optimal combination for P, R, mAP0.5, and mAP0.50:0.95 was derived using weight coefficients of 0,0,0.1 and 0.9, respectively, in order to obtain the optimal training weight for the model.

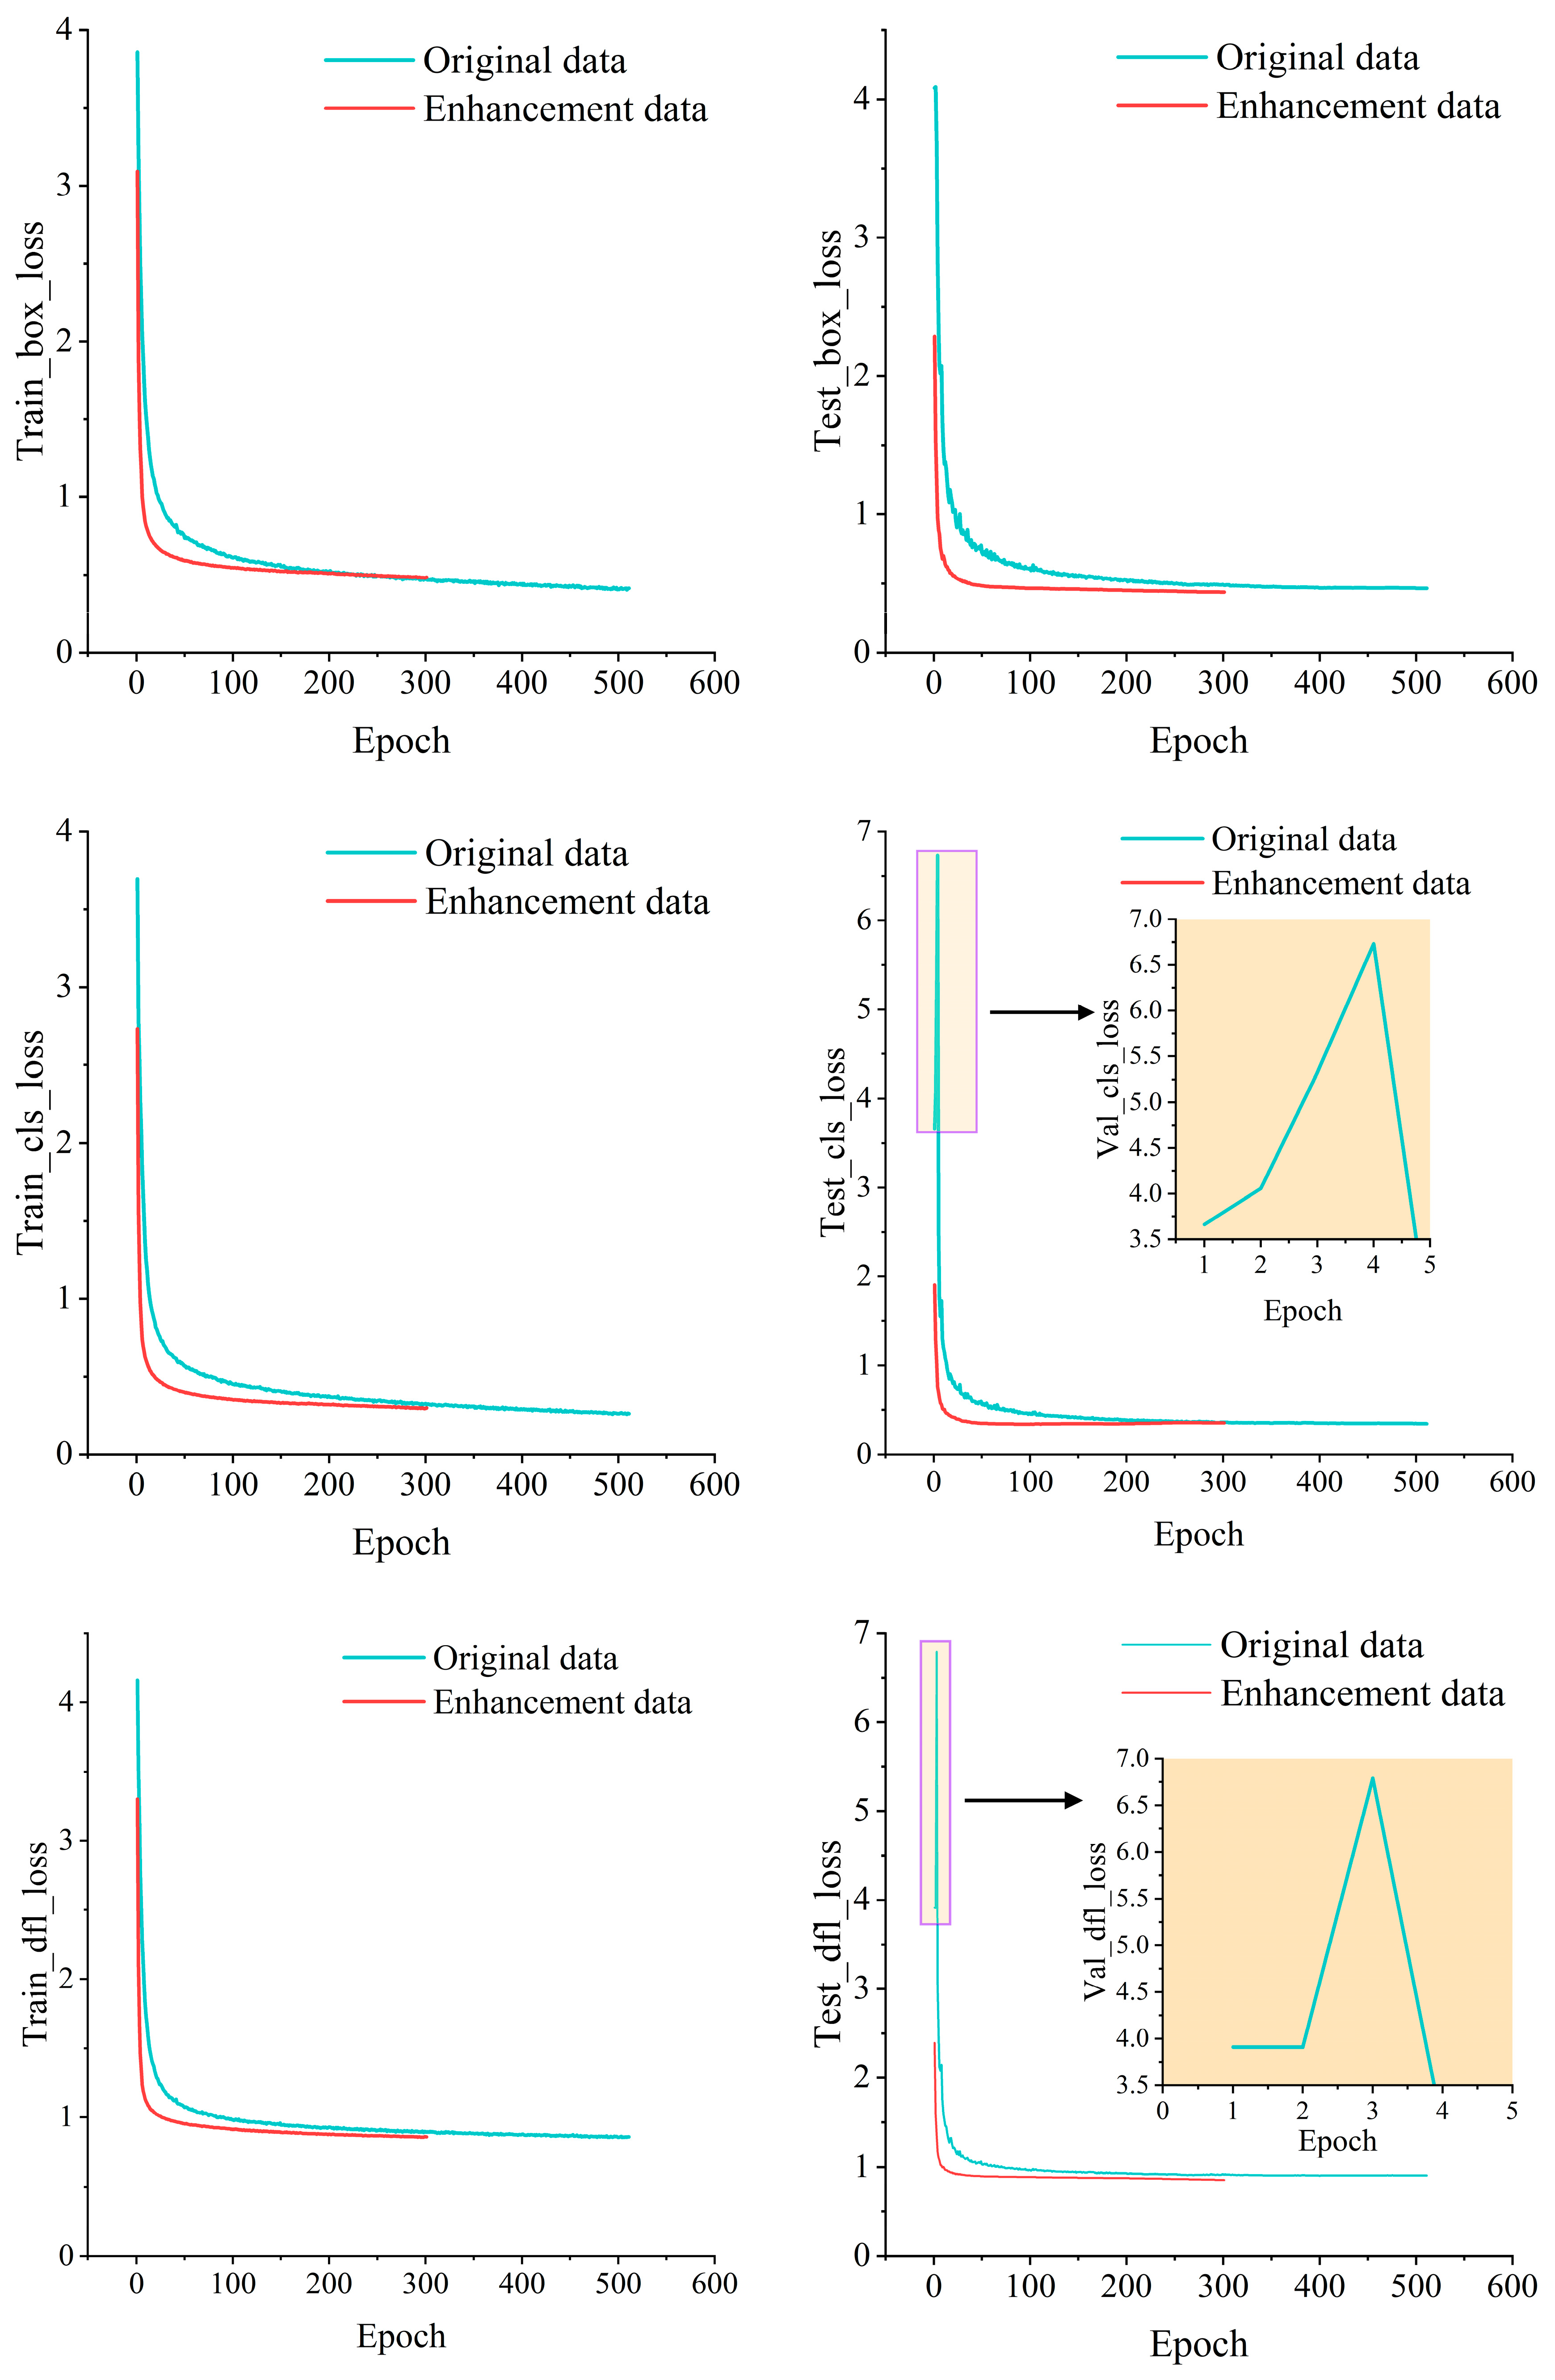
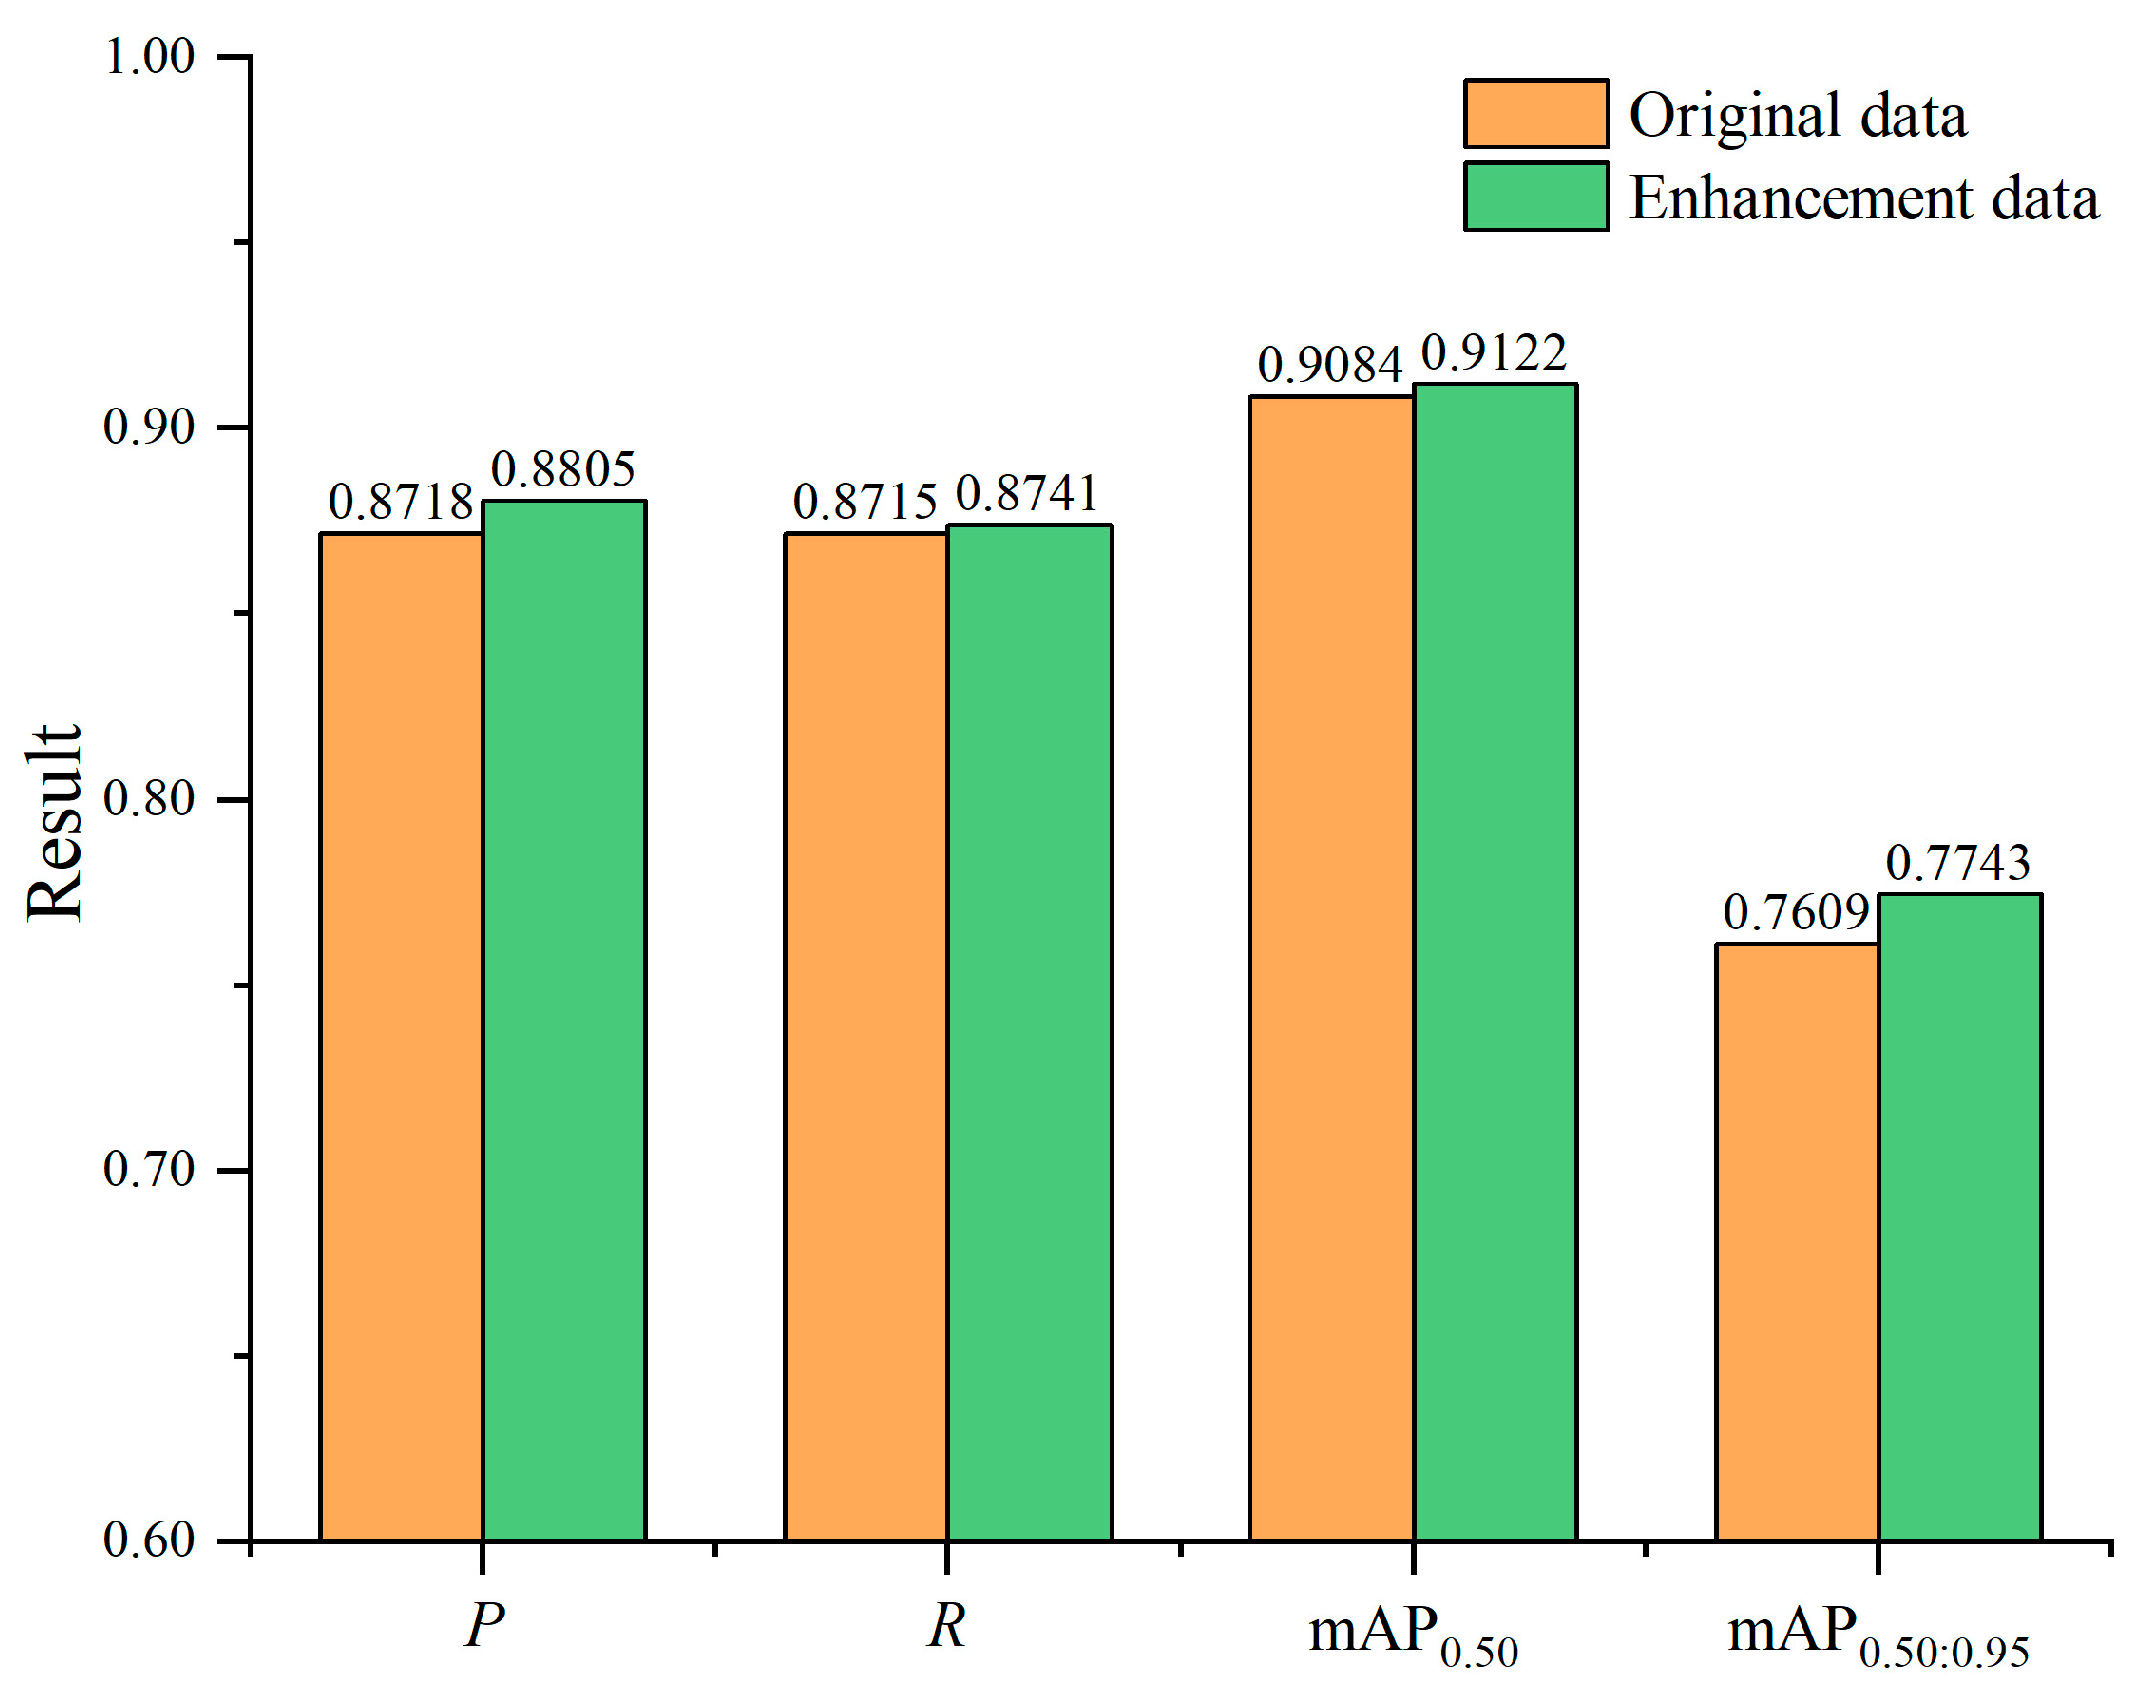
3.4. Data Augmentation Experiments

The dataset was partitioned in accordance with Table 1, and model training and testing were conducted under uniform experimental conditions. To ascertain the necessity of data augmentation, a comparative experiment was undertaken employing the methods detailed in Section 2.1.4 for augmentation, as well as a control scenario without augmentation, utilizing the baseline model YOLO v8n. Throughout the training phase, the fluctuations in the loss function are depicted in Figure 11. Here, Train_box_loss, Train_cls_loss, and Train_dfl_loss represent the change curves for the training data, whereas Test_box_loss, Test_cls_loss, and Test_dfl_loss correspond to those for the testing data. The training set’s change curves indicate that, with data augmentation, the expanded data volume facilitates more frequent parameter updates per epoch, while maintaining a consistent batch size, allowing the model to converge in fewer epochs. The training result is shown in Figure 12. Post-implementation of data augmentation, performance metrics including P, R, mAP0.50, and mAP0.50:0.95 revealed varying degrees of improvement, thus confirming that the augmentation techniques outlined in Section 2.1.4 effectively improve model performance. Consequently, this study employed the augmented training set for the subsequent model training.

4. Results

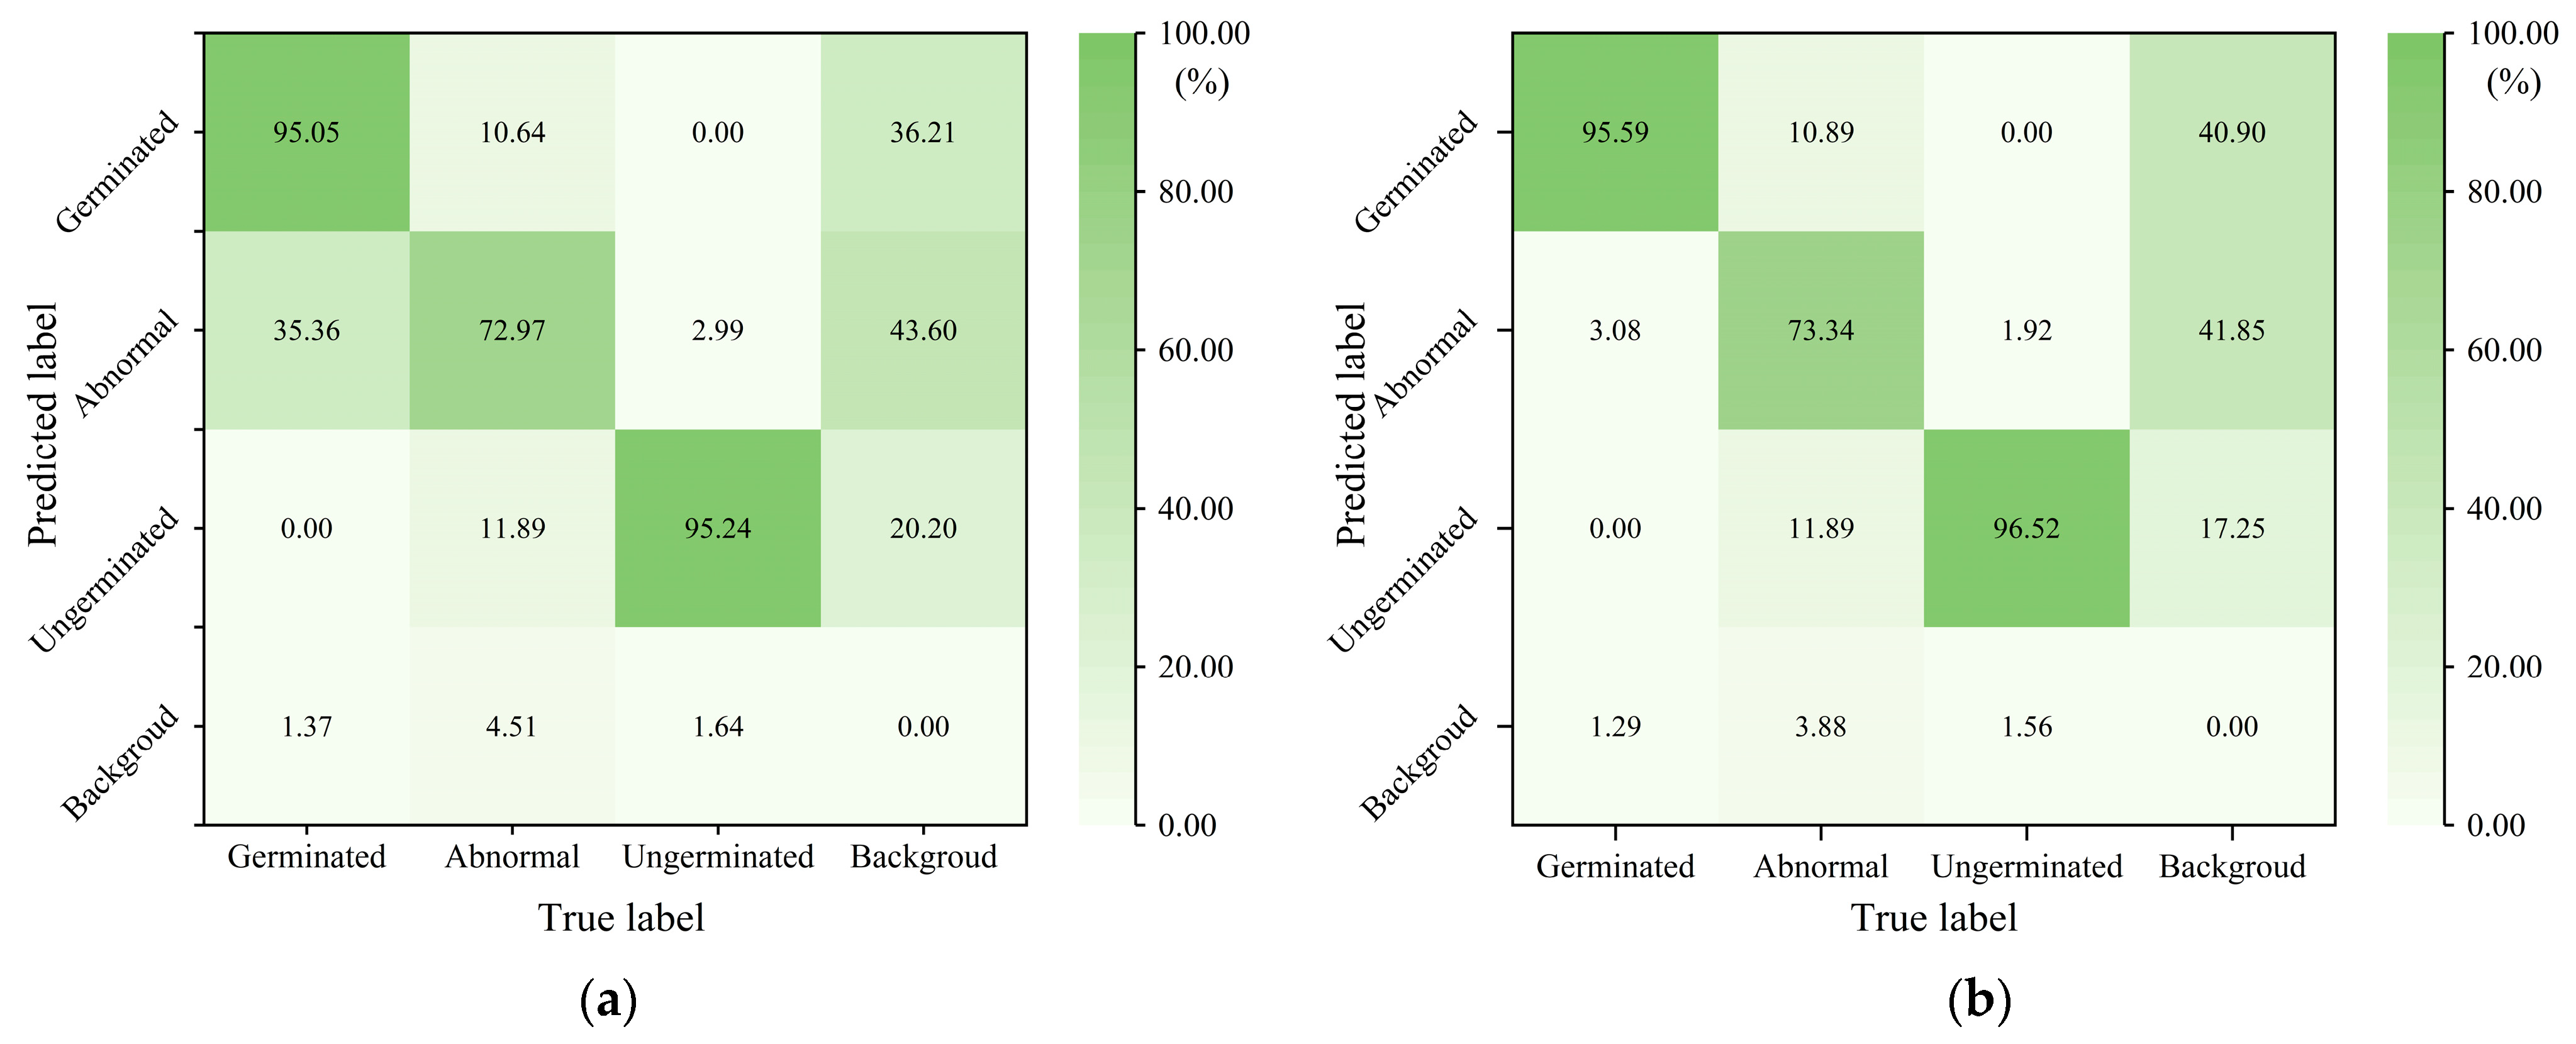
4.1. CSGD-YOLO Test Results and Analysis

To validate the effectiveness of the proposed model, CSGD-YOLO was trained on the augmented training set and tested on the test set. The confusion matrices for CSGD-YOLO and YOLO v8n are illustrated in Figure 13, while the relevant evaluation metrics are presented in Table 3.
As shown in Figure 13, the YOLO v8n demonstrates poor recognition performance for the “Abnormal” category. This is due to the fact that the “Abnormal” class label encompasses three scenarios: seeds with shoots but no roots, seeds with roots but no shoots, and seeds with both shoots and roots, where the shoot length does not exceed that of the seed. Notably, the scenario where seeds have both shoots and roots but the shoot length is shorter than the seed length bears significant similarity to normal germination. In contrast, the improved CSGD-YOLO enhances recognition performance for the “Abnormal” category to a certain extent. According to Table 3, the proposed CSGD-YOLO improves P, R, mAP0.50, and mAP0.50:0.95 by 1.39, 1.43, 1.77, and 2.95 percentage points, respectively. Simultaneously, weight size, parameters, and FLOPs are reduced by 27.87%, 36.54%, and 34.36%, respectively. These results robustly demonstrate the effectiveness of the proposed model.

4.2. Ablation Experiment Results of Proposed Model

To verify the efficacy of the improved modules in enhancing model performance, an ablation study of the relevant modules was designed, as shown in Table 4. The base model is the YOLO v8n. Comparisons between Experiments 1 and 2 reveal that, after incorporating the UIB structure in the YOLO v8n, there was approximately a 25% reduction in weight size, parameters, and FLOPs. Experiment 3, which utilized the L-SPPF module, demonstrated a modest reduction in model complexity while maintaining baseline detection performance, substantiating the claim that group convolution can decrease model complexity. Additionally, the combination of max pooling and average pooling, in conjunction, allows for the simultaneous consideration of both local and global features within the receptive field, thereby enhancing the model’s feature extraction capabilities and improving some of the model’s detection performance metrics. After implementing the Ghost_Detection module in Experiment 4, channel redundancy features were eliminated and model complexity was reduced by approximately half, as indicated in Equation (11), a finding corroborated by the ablation study results. Experiment 7 showed that employing the UIB, L-SPPF, and Ghost_Detection modules resulted in increases of 0.48% and 0.18% in P and mAP0.50, respectively, while R and mAP0.50:0.95 decreased by 0.18% and 0.26%; however, the overall model complexity (weight size, parameters, FLOPs) was reduced by about 40%. Experiment 5 indicated that the iAFF module resolved inconsistencies in scale and semantic feature fusion, thereby enhancing the model’s feature extraction capabilities. Experiment 6 confirmed that the downsampling convolutional module could enhance the nonlinear expression capabilities of the feature extraction network. Experiments 8 and 9, which built upon Experiment 7 by incorporating the iAFF and downsampling convolutional modules, demonstrated that Experiment 8 maintained the same weight, parameter count, and FLOPs as Experiment 7, while decreasing P by 0.79 percentage points but improving R, mAP0.50, and mAP0.50:0.95. Experiment 9, compared to Experiment 7, increased model complexity but achieved improvements in P, R, mAP0.50, and mAP0.50:0.95. The proposed CSGD-YOLO, based on the model from Experiment 7 with added iAFF and downsampling convolutional modules, strengthened the fusion of features from different layers during residual connections and within the receptive field. Compared to the original YOLO v8n, this model reduced the size, parameter count, and number of floating-point operations by 29.51%, 36.54%, and 34.36%, respectively, while enhancing performance metrics P, R, mAP0.50, and mAP0.50:0.95 by 1.39, 1.43, 1.77, and 2.95 percentage points, respectively.

4.3. Performance Comparison of the State-of-the-Art Models

To further validate the advantages of the proposed CSGD-YOLO, we conducted comparisons on mainstream models such as YOLO v5 [19], YOLO v6 [20], YOLO v7 [21], YOLO v9 [22], YOLO v10 [23], and YOLO v11 [24], as shown in Table 5. All models were trained and tested under the same experimental conditions and dataset. The experimental results are presented in Table 5. From Table 5, it can be observed that the CSGD-YOLO, when compared to the currently mainstream models YOLO v5n, YOLO v6n, YOLO v8n, YOLO v9t, YOLO v10n, YOLO v11n, achieves the lowest model complexity. In terms of detection performance, although the P is 0.41 percentage points lower than that of YOLO v9t, due to the difficulty of achieving all four detection performance indicators simultaneously for object detection tasks, the other aspects are superior to the currently mainstream object detection models, proving the effectiveness of the proposed model.

5. Discussion

This study provides an automated detection method for the germination status of corn seeds in a paper medium. During the detection process, it is only necessary to unfold the roll of paper to be tested and place it on the image acquisition platform shown in Figure 1, then run the detection model proposed in this paper on the computer to achieve automated detection of the corn seed germination status.
The lack of a public agricultural dataset is one of the bottlenecks for the application of computer vision and computer vision algorithms in agriculture [25,26]. As pointed out by some researchers [27,28], data augmentation techniques can artificially increase the size, quality, and diversity of the dataset, thereby ensuring the performance of the model. As shown in Figure 12 and Figure 13, after the application of data augmentation techniques, the values for P, R, mAP0.5, and mAP0.50:0.95 increased, respectively, by 0.87, 0.26, 0.38, and 1.34 percentage points, proving that data augmentation techniques can improve the training ability of the model and enhance its detection performance when the sample size is small.
During the research for this project, we found that there was no dataset on corn seed germination states based on paper medium germination that was identical to the one used in this study, nor had any researcher designed a specialized model for automated germination state detection for this particular research. To verify the effectiveness of the model we proposed, we compared it with other similar studies focused on seed germination state detection. Compared with the Fater RCNN detection model proposed by Genze et al. [9], our mAP0.5 was approximately two percentage points lower. While two-stage object detection networks generally have better detection performance than single-stage object detection networks, single-stage object detection models have significantly lower complexity. Our proposed model, similar to that of Zhang et al. [11], adopted a single-stage YOLO network architecture, but the detection accuracy was lower by about three percentage points, mainly due to the smaller grain shape of rice seeds and less complex germination states than corn seeds. However, this also indicates that seed germination state detection based on object detection is not only needed for corn seeds but also for other cereal crops, which is also a focus of agricultural scientists. Chen et al. [2] utilized the original YOLO object detection model in a culture environment based on culture medium and achieved a detection accuracy of mAP0.5 of 86.8% for corn germination states, suggesting that there are issues of feature redundancy when using general-purpose object detection models, and that network structure design is required.
In terms of network structure design, Fan X et al. [29] proposed a lightweight weed detection model based on YOLO v5, which, using the lightweight shuffleNet v2 and attention mechanism modules, achieved the best detection performance among existing models. This demonstrates that designing network structures can balance the relationship between model detection performance and complexity, thus obtaining a detection model that is most suitable for identifying paper-based corn seed germination states. Therefore, we designed the CSGD-YOLO network model using modules such as UIB, RFAConv, iAFF, and GhostConv.
Despite the good results achieved in this study, there are still some areas that can be improved. (1) Based on the model proposed in this paper, further research can be conducted using model compression techniques such as pruning and knowledge distillation to make the model more concise. (2) There is no completely unified standard for determining the germination status of seeds. The judgment criteria in this article mainly refer to the “Technical Regulations for Crop Seed Germination” (GB/T 3543.4-1995) and the literature [2,9,10]. Unifying the criteria for determining germination status to improve the adaptability of the model is also a point that future researchers can study. (3) Further research can be conducted on the detection of abnormal germination status to further improve the performance of the model

6. Conclusions

This paper proposes an automated model suitable for detecting the germination state of corn seeds in a paper medium. The model achieves a detection performance of 92.99% mAP0.5 and 80.38% mAP0.50:95 on the test set, balancing the relationship between model detection performance and complexity. This model provides a new rapid detection method for seed viability and holds significant research importance.

Author Contributions

Conceptualization, W.S., D.C. and R.Y.; Data curation, W.S., M.X., D.C. and J.W.; Funding acquisition, R.Y. and Q.C.; Investigation, M.X.; Methodology, W.S., K.X. and S.Y.; Project administration, R.Y. and Q.C.; Software, W.S., K.X. and D.C.; Supervision, J.W.; Validation, W.S.; Writing—original draft, W.S.; Writing—review and editing, W.S., J.W., R.Y., Q.C. and S.Y. All authors will be updated at each stage of manuscript processing, including submission, revision, and revision reminder, via emails from our system or the assigned Assistant Editor. All authors have read and agreed to the published version of the manuscript.

Funding

This research was funded by the National Key R and D Program of China under grant number 2023YFD2000400, the National Talent Foundation Project of China (Grant No. T2019136), the Modern Agro-Industry Technology Research System of Maize [Grant No. CARS-02-13], and the Project of Sanya Yazhou Bay Science and Technology City (Grant No. SCKJ-JYRC-2023-64).

Data Availability Statement

The original contributions presented in the study are included in the article, further inquiries can be directed to the corresponding author.

Conflicts of Interest

The authors declare no conflicts of interest.

References

  1. Song, P.; Yue, X.; Gu, Y.; Yang, T. Assessment of maize seed vigor under saline-alkali and drought stress based on low field nuclear magnetic resonance. Biosyst. Eng. 2022, 220, 135–145. [Google Scholar] [CrossRef]
  2. Chen, C.; Bai, M.; Wang, T.; Zhang, W.; Yu, H.; Pang, T.; Wu, J.; Li, Z.; Wang, X. An RGB image dataset for seed germination prediction and vigor detection-maize. Front. Plant Sci. 2024, 15, 1341335. [Google Scholar] [CrossRef] [PubMed]
  3. Ma, T.; Tsuchikawa, S.; Inagaki, T. Rapid and non-destructive seed viability prediction using near-infrared hyperspectral imaging coupled with a deep learning approach. Comput. Electron. Agric. 2020, 177, 105683. [Google Scholar] [CrossRef]
  4. Ali, F.; Qanmber, G.; Li, F.; Wang, Z. Updated role of ABA in seed maturation, dormancy, and germination. J. Adv. Res. 2022, 35, 199–214. [Google Scholar] [CrossRef]
  5. Zhang, Y.; Song, X.; Zhang, W.; Liu, F.; Wang, C.; Liu, Y.; Dirk, L.M.A.; Downie, A.B.; Zhao, T. Maize PIMT2 repairs damaged 3-METHYLCROTONYL COA CARBOXYLASE in mitochondria, affecting seed vigor. Plant J. 2023, 115, 220–235. [Google Scholar] [CrossRef]
  6. Škrubej, U.; Rozman, Č.; Stajnko, D. The accuracy of the germination rate of seeds based on image processing and artificial neural networks. Agricultura 2015, 12, 19–24. [Google Scholar] [CrossRef]
  7. Awty-Carroll, D.; Clifton-Brown, J.; Robson, P. Using k-NN to analyse images of diverse germination phenotypes and detect single seed germination in Miscanthus sinensis. Plant Methods 2018, 14, 5. [Google Scholar] [CrossRef]
  8. Bai, W.W.; Zhao, X.N.; Luo, B.; Zhao, W.; Huang, S.; Zhang, H. Study of YOLOv5-based germination detection method for wheat seeds. Acta Agric. Zhejiangensis 2023, 35, 445–454. [Google Scholar] [CrossRef]
  9. Genze, N.; Bharti, R.; Grieb, M.; Schultheiss, S.J.; Grimm, D.G. Accurate machine learning-based germination detection, prediction and quality assessment of three grain crops. Plant Methods 2020, 16, 157. [Google Scholar] [CrossRef] [PubMed]
  10. Ma, Q.L.; Yang, X.M.; Hu, S.X.; Huang, Z.H.; Qi, H.N. Automatic detection method of corn seed germination based on Mask RCNN and vision technology. Acta Agric. Zhejiangensis 2023, 35, 1927–1936. [Google Scholar] [CrossRef]
  11. Zhao, J.; Ma, Y.; Yong, K.; Zhu, M.; Wang, Y.; Luo, Z.; Wei, X.; Huang, X. Deep-learning-based automatic evaluation of rice seed germination rate. J. Sci. Food Agric. 2023, 103, 1912–1924. [Google Scholar] [CrossRef] [PubMed]
  12. Yao, Q.; Zheng, X.; Zhou, G.; Zhang, J. SGR-YOLO: A method for detecting seed germination rate in wild rice. Front. Plant Sci. 2024, 14, 1305081. [Google Scholar] [CrossRef]
  13. Solawetz, J.; Francesco. What is YOLOv8? The Ultimate Guide. 2023. Available online: https://roboflow.com/ (accessed on 15 August 2024).
  14. He, K.; Zhang, X.; Ren, S.; Sun, J. Spatial pyramid pooling in deep convolutional networks for visual recognition. IEEE Trans. Pattern Anal. Mach. Intell. 2015, 37, 1904–1916. [Google Scholar] [CrossRef] [PubMed]
  15. Qin, D.; Leichner, C.; Delakis, M.; Fornoni, M.; Luo, S.; Yang, F.; Wang, W.; Banbury, C.; Ye, C.; Akin, B. MobileNetV4-Universal Models for the Mobile Ecosystem. arXiv 2024, arXiv:2404.10518. [Google Scholar]
  16. Goswami, S.; Ashwini, K.; Dash, R. Grading of Diabetic Retinopathy using iterative Attentional Feature Fusion (iAFF). In Proceedings of the 2023 14th International Conference on Computing Communication and Networking Technologies (ICCCNT), Delhi, India, 6–8 July 2023; IEEE: New Jersey, NJ, USA, 2023; pp. 1–5. [Google Scholar] [CrossRef]
  17. Ma, X.; Ji, Z.; Niu, S.; Leng, T.; Rubin, D.L.; Chen, Q. MS-CAM: Multi-scale class activation maps for weakly-supervised segmentation of geographic atrophy lesions in SD-OCT images. IEEE J. Biomed. Health Inform. 2020, 24, 3443–3455. [Google Scholar] [CrossRef]
  18. Zhang, X.; Liu, C.; Yang, D.; Song, T.; Ye, Y.; Li, K.; Song, Y. RFAConv: Innovating spatial attention and standard convolutional operation. arXiv 2023, arXiv:2304.03198. [Google Scholar]
  19. Jocher, G.; Chaurasia, A.; Stoken, A.; Borovec, J.; Kwon, Y.; Michael, K.; Tao, X.; Fang, J.; Lorna; Zeng, Y.; et al. Ultralytics YOLOv5. 2020. Available online: https://zenodo.org/records/7347926 (accessed on 15 August 2024).
  20. Li, C.; Li, L.; Jiang, H.; Weng, K.; Geng, Y.; Li, L.; Ke, Z.; Li, Q.; Cheng, M.; Nie, W.; et al. YOLOv6: A single-stage object detection framework for industrial applications. arXiv 2022, arXiv:2209.02976. [Google Scholar]
  21. Wang, C.Y.; Bochkovskiy, A.; Liao, H.Y.M. YOLOv7: Trainable bag-of-freebies sets new state-of-the-art for real-time object detectors. In Proceedings of the 2023 IEEE/CVF Conference on Computer Vision and Pattern Recognition, Vancouver, BC, Canada, 17–24 June 2023; pp. 7464–7475. [Google Scholar]
  22. Wang, C.Y.; Yeh, I.H.; Liao, H.Y.M. Yolov9: Learning what you want to learn using programmable gradient information. arXiv 2024, arXiv:2402.13616. [Google Scholar]
  23. Wang, A.; Chen, H.; Liu, L.; Chen, K.; Lin, Z.; Han, J.; Ding, G. Yolov10: Real-time end-to-end object detection. arXiv 2024, arXiv:2405.14458. [Google Scholar]
  24. Khanam, R.; Hussain, M. YOLOv11: An Overview of the Key Architectural Enhancements. arXiv 2024, arXiv:2410.17725v1. [Google Scholar]
  25. Badgujar, C.M.; Armstrong, P.R.; Gerken, A.R.; Pordesimo, L.O.; Campbell, J.F. Real-time stored product insect detection and identification using deep learning: System integration and extensibility to mobile platforms. J. Stored Prod. Res. 2023, 104, 102196. [Google Scholar] [CrossRef]
  26. Lu, Y.; Young, S. A survey of public datasets for computer vision tasks in precision agriculture. Comput. Electron. Agric. 2020, 178, 105760. [Google Scholar] [CrossRef]
  27. Bazame, H.; Molin, J.P.; Althoff, D.; Martello, M. Detection, classification, and mapping of coffee fruits during harvest with computer vision. Comput. Electron. Agric. 2021, 183, 106066. [Google Scholar] [CrossRef]
  28. Nasirahmadi, A.; Wilczek, U.; Hensel, O. Sugar beet damage detection during harvesting using different convolutional neural network models. Agriculture 2021, 11, 1111. [Google Scholar] [CrossRef]
  29. Fan, X.; Sun, T.; Chai, X.; Zhou, J. YOLO-WDNet: A lightweight and accurate model for weeds detection in cotton field. Comput. Electron. Agric. 2024, 225, 109317. [Google Scholar] [CrossRef]
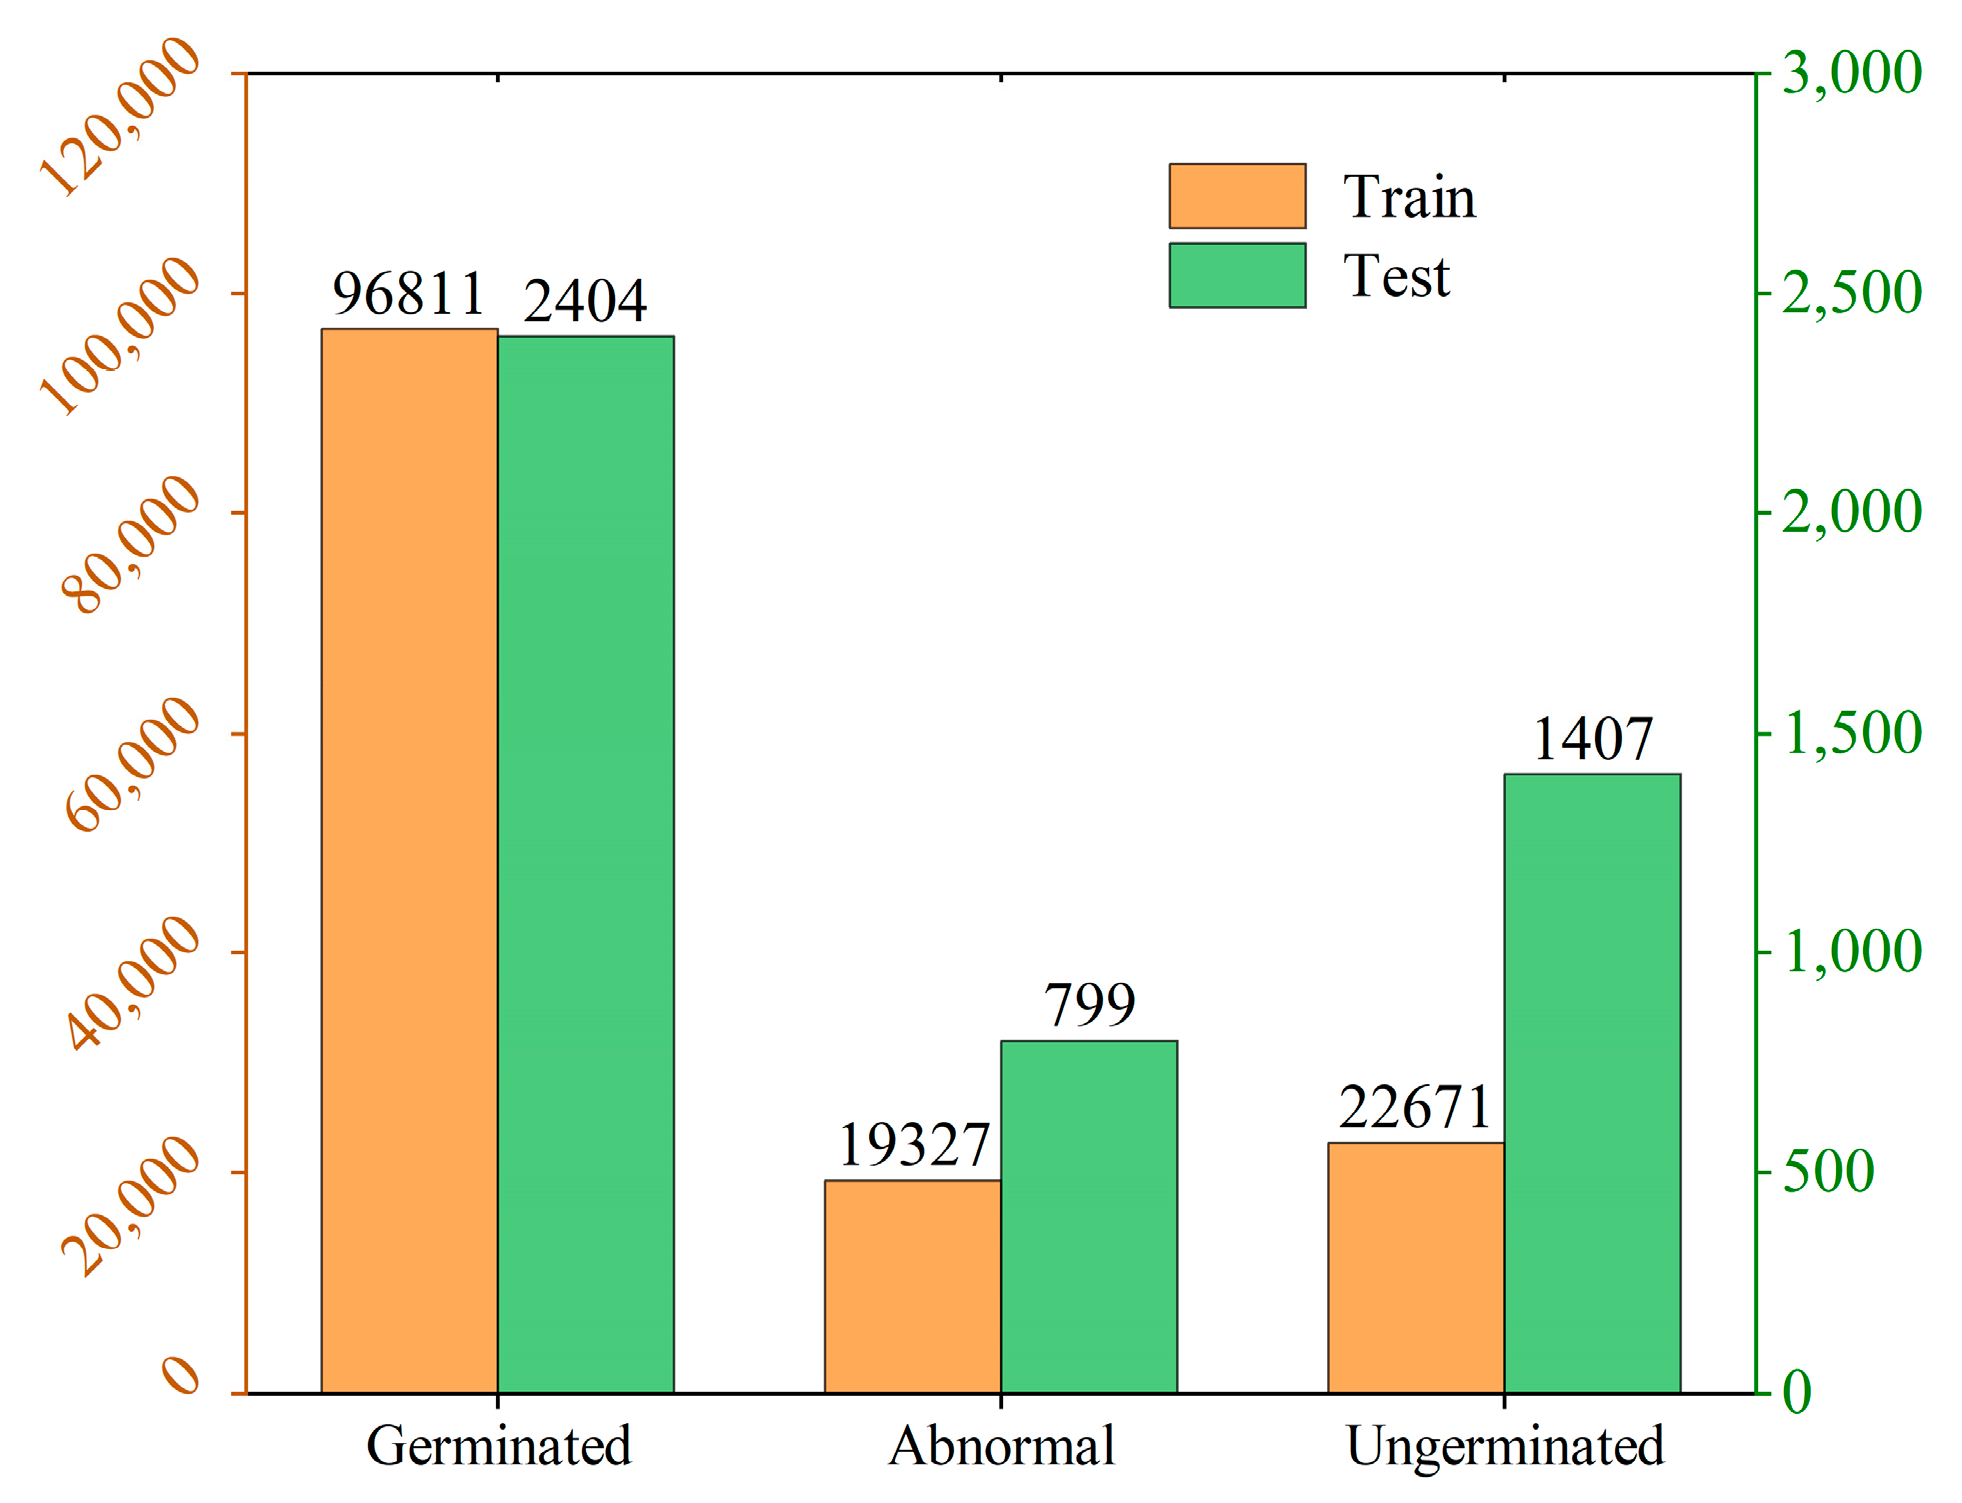
Figure 1. The platform for corn germination image collection.
Agronomy 15 00128 g001
Figure 2. Different germination states of corn seed in germination test. (a) Examples of seed germination states. (b) Boundary box annotations for seed germination states.
Agronomy 15 00128 g002
Figure 3. Examples of data enhancement.
Agronomy 15 00128 g003
Figure 4. The Distribution of number of tags.
Agronomy 15 00128 g004
Figure 5. The structures of YOLO v8n.
Agronomy 15 00128 g005
Figure 6. The structures of CSGD-YOLO.
Agronomy 15 00128 g006
Figure 7. The structures of SPPF and L-SPPF.
Agronomy 15 00128 g007
Figure 8. The structures of the C2f-UIB-iAFF module.
Agronomy 15 00128 g008
Figure 9. The structures of Ghost_Detection module.
Agronomy 15 00128 g009
Figure 10. The structures of the Downsampling Convolutional Module.
Agronomy 15 00128 g010
Figure 11. Train and test loss curves on different data.
Agronomy 15 00128 g011
Figure 12. Metrics curves of YOLO v8n.
Agronomy 15 00128 g012
Figure 13. Confusion matrix of the model test. (a) Confusion matrix of YOLO v8n (b) Confusion matrix of CSGD-YOLO.
Agronomy 15 00128 g013
Table 1. The original image data of corn seeds.
Data TypeGrowth DaysTrainTestTotalTotal
Background ColorBackground ColorBackground Color
WhiteBlackYellowWhiteBlackYellowWhiteBlackYellow
Original Data4 days142126114383431180160145485
5 days159118100463126205149126480
6 days126155168334045159195213567
7 days78257020660983230421
7 days
(Cold Soaking)
7100720014300143
Total5766563822091711027858274842096
16144822096/
Table 2. The params of YOLO v8n.
LayersModuleParamsLayersModuleParamsLayersModuleParams
1ConvModule4649C2f460,28817ConvModule36,992
2ConvModule467210SPPF164,60818Concat0
3C2f736011Upsample019C2f123,648
4ConvModule18,56012Concat020ConvModule147,712
5C2f49,66413C2f14,82421Concat0
6ConvModule73,98414Upsample022C2f493,056
7C2f197,63215Concat023Head (n = 3)751,897
8ConvModule295,42416C2f37,248///
Table 3. Test results based on YOLO v8n and CSGD-YOLO.
MethodP
(%)
R
(%)
mAP50
(%)
mAP50:95
(%)
Weight Size
(MB)
Params
(M)
FLOPs
(G)
YOLO v8n88.05 87.41 91.22 77.43 6.1 3.01 8.09
CSGD-YOLO89.44 88.82 92.99 80.38 4.4 1.91 5.21
Table 4. Ablation experiment results.
Experiment NumberModelsP
(%)
R
(%)
mAP0.50
(%)
mAP0.50:0.95
(%)
Weight Size
(MB)
Params
(M)
FLOPs
(G)
1Base88.05 87.41 91.22 77.43 6.33.01 8.09
2Base+UIB88.4085.4790.0876.374.72.186.13
3Base+L-SPPF87.4288.3091.7278.085.92.847.96
4Base+Ghost_Detection 88.4787.4992.0077.345.62.656.69
5Base+C2f_UIB_iAFF87.2986.9490.2876.895.12.336.47
6Base+ Downsampling Convolutional Module89.1388.9392.0778.366.33.038.29
7Base+UIB+L-SPPF+ Ghost_Detection88.5387.2391.4077.173.71.664.61
8Base+C2f_UIB+L-SPPF+Ghost_head+ Downsampling Convolutional Module87.7489.9192.5179.313.71.694.82
9Base+C2f_UIB_iAFF+L-SPPF+Ghost_Detection 89.9587.5791.8478.224.31.885.00
10CSGD-YOLO89.44 88.82 92.99 80.38 4.4 1.91 5.21
Table 5. Comparison of detection performance of different models.
ModelsP
(%)
R
(%)
mAP0.5
(%)
mAP0.50:0.95
(%)
Weight Size
(MB)
Params
(M)
FLOPs
(G)
YOLO v5n88.4186.2790.8877.375.32.507.07
YOLO v6n89.6887.5592.2577.408.74.2311.78
YOLO v8n88.05 87.41 91.22 77.43 6.33.01 8.09
YOLO v9t89.8588.2392.8278.624.61.977.60
YOLO v10n87.5587.7391.1377.635.82.708.23
YOLO v11n87.9488.1691.4777.145.52.586.32
CSGD-YOLO89.44 88.82 92.99 80.38 4.4 1.91 5.21
Disclaimer/Publisher’s Note: The statements, opinions and data contained in all publications are solely those of the individual author(s) and contributor(s) and not of MDPI and/or the editor(s). MDPI and/or the editor(s) disclaim responsibility for any injury to people or property resulting from any ideas, methods, instructions or products referred to in the content.

