3.1. Effect of Salinity Interactive in Different Bermudagrass Accessions of Neutral and Alkali Salt Tolerance
There were significant differences among different salinity concentrations (
p < 0.01), accessions (
p < 0.01 or 0.05), and salt types (
p < 0.01) for GR, GP, GI, PL, RL, and RRP (
Table 3), but SW was only affected by the salt concentration (
p < 0.01). Significant interaction effects existed between salinity concentration and accessions for GP, PL, and RL (
p < 0.05), between salinity concentration and salt types for GR, GI, PL, RL, and RRP (
p < 0.05), and between accessions and salt types for GR, GP, GI, PL, and RL (
p < 0.05). There was a significant three-way interaction effect (salinity concentration × accessions × salt types) for GR and RL (
p < 0.05).
3.2. Seed Germination and Seedling Growth Response of Bermudagrass Accessions under Neutral and Alkali Salt Stress
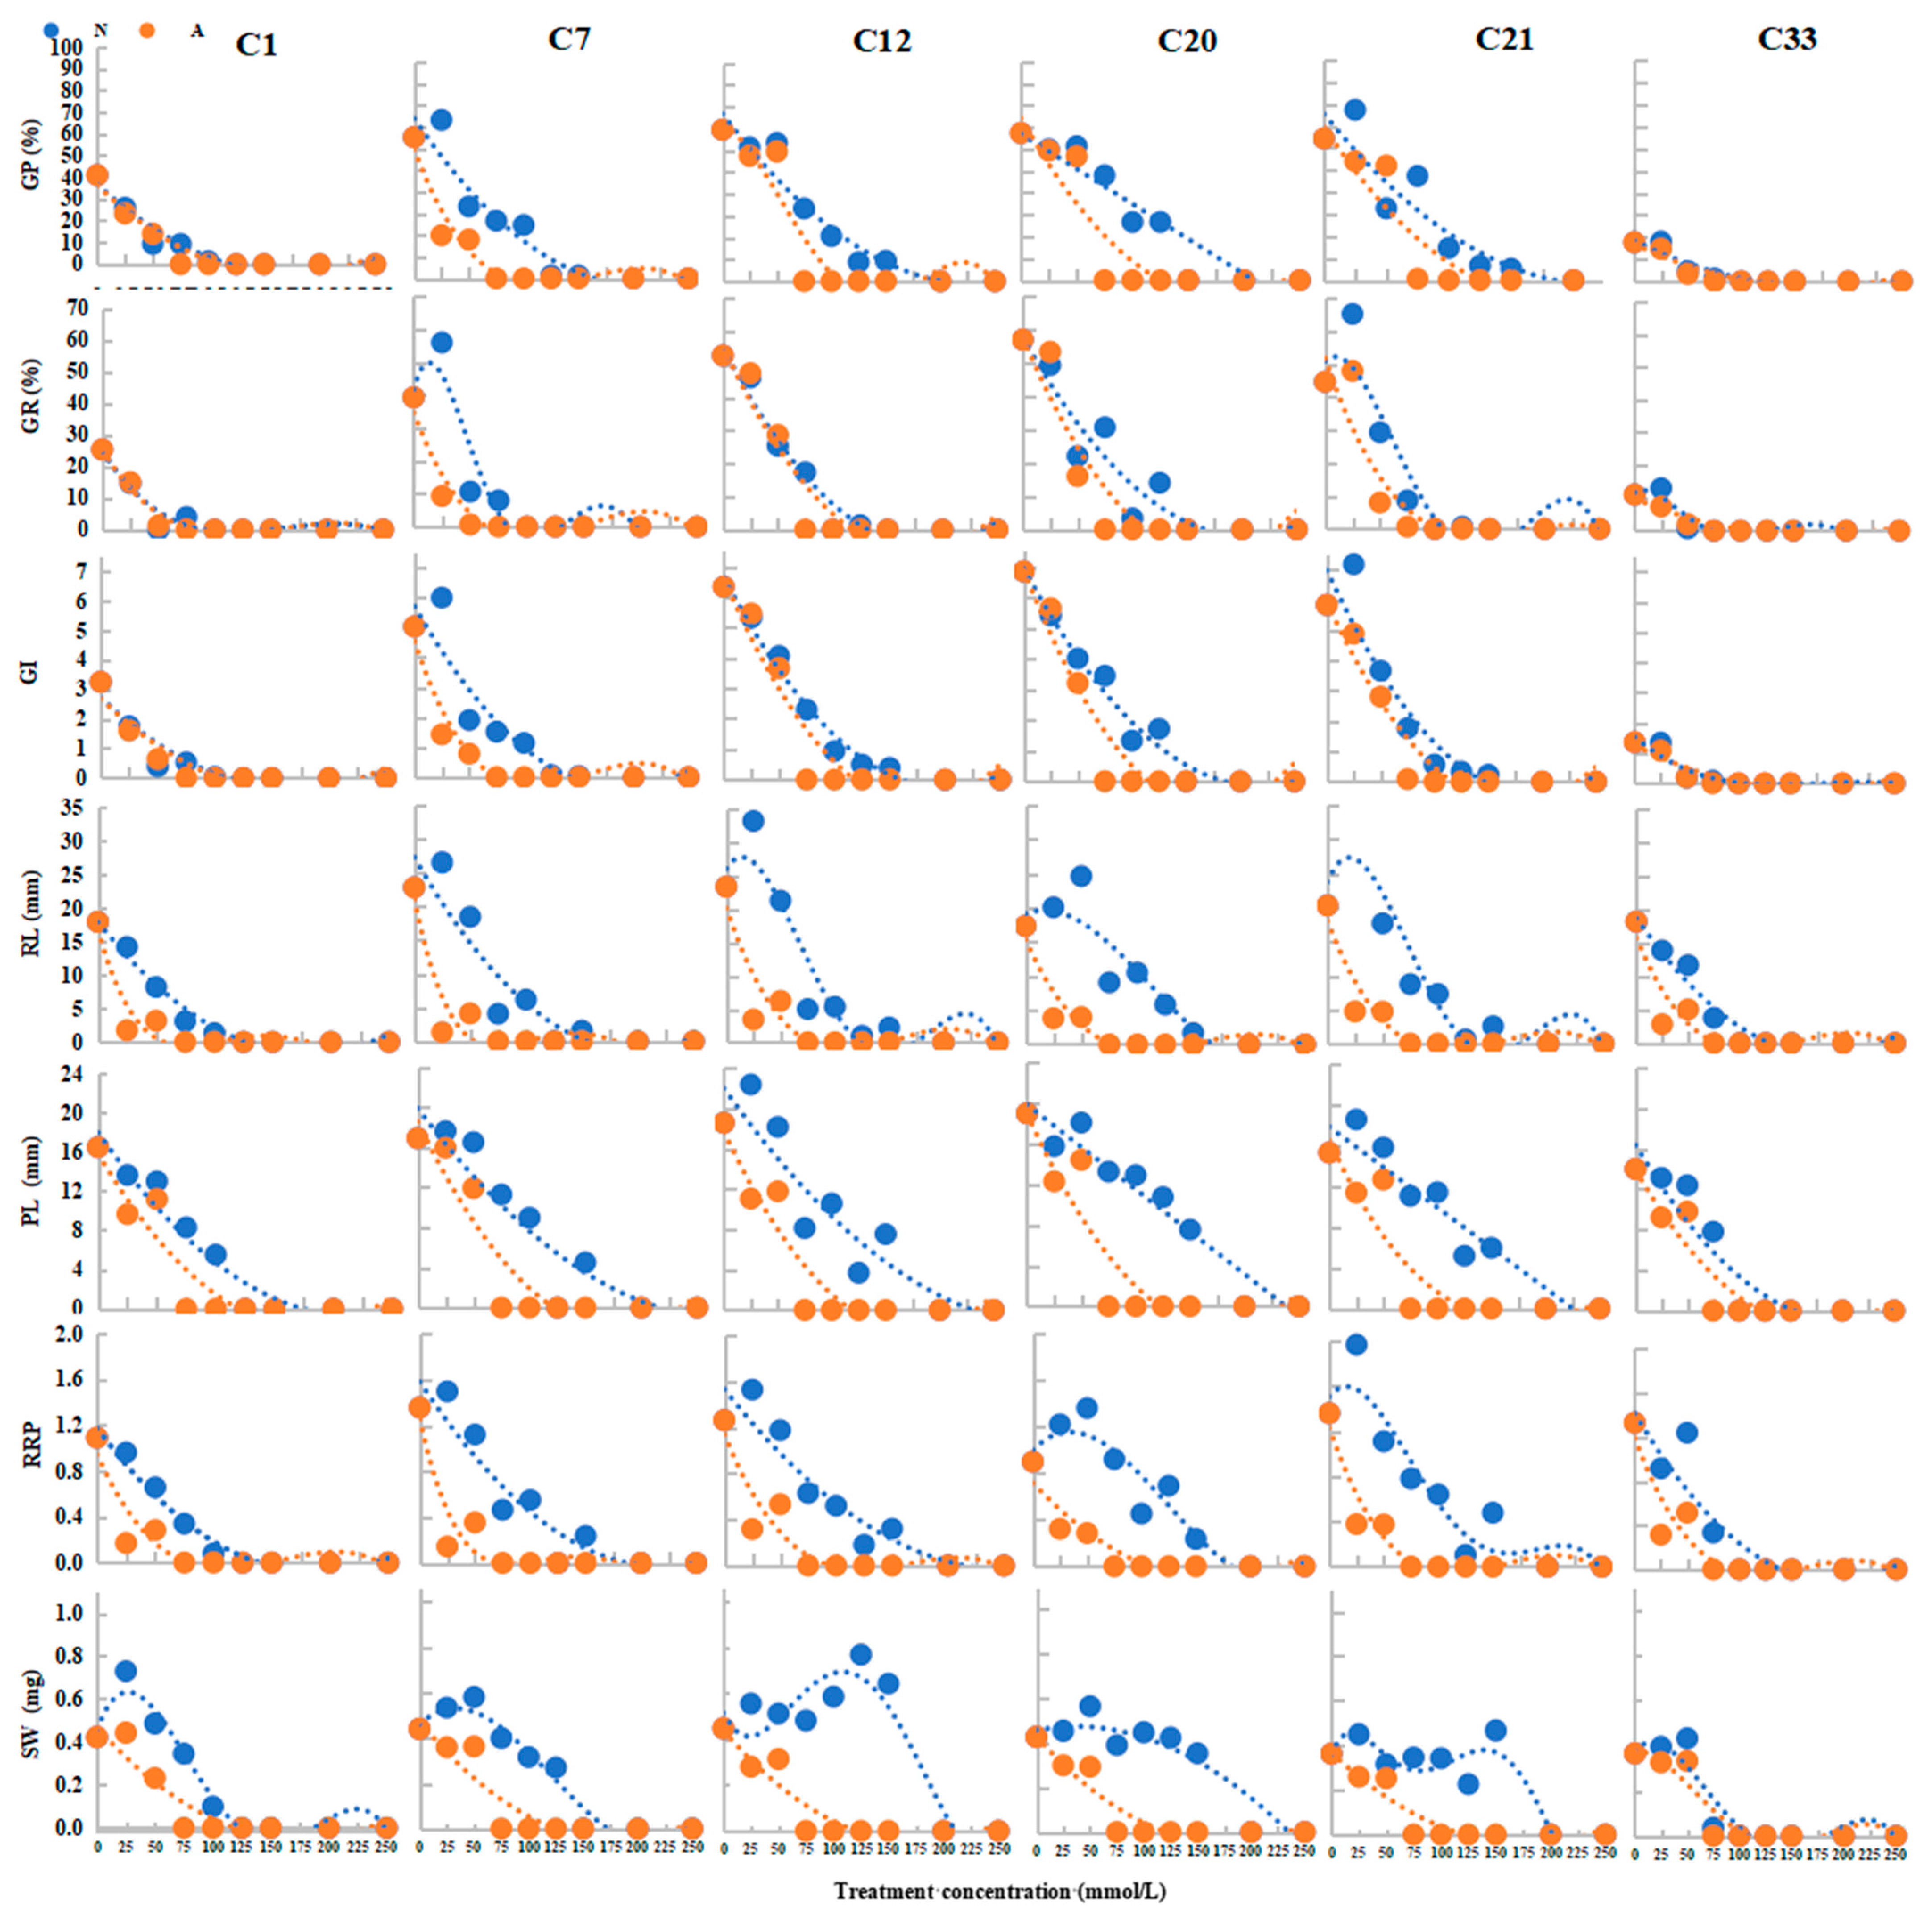
In this study, to explore the differences in seed germination response to various salt concentrations under neutral and alkaline salt stress in six bermudagrass accessions, the data were fitted with a Coefficient of determination of R
2 ≥ 0.85, and a linear graph was drawn for comparison (
Figure 2 and
Table 4). The study found that, for the majority of indicators in the six bermudagrass accessions, both neutral and alkaline salt stress decreased gradually as salinity concentration increased and ultimately reached zero.
We observed a minimal promotional effect in neutral salt stress but not in alkaline salt stress. At the same time, there were significant differences among the six bermudagrass accessions. The germination potential of C7 and C21, the radicle length of C12 and C21, the ratio of radicle and plumule length of C20 and C21, and the seedling weight of C1 and C21 were significantly higher under 25 mmol/L neutral salts than CK (p < 0.05). The radicle length and plumule length of C20, the ratio of radicle and plumule length of C20 and C33, and the seedling weight of C20, C33, and C7 were significantly higher under 50 mmol/L neutral salts than CK (p < 0.05).
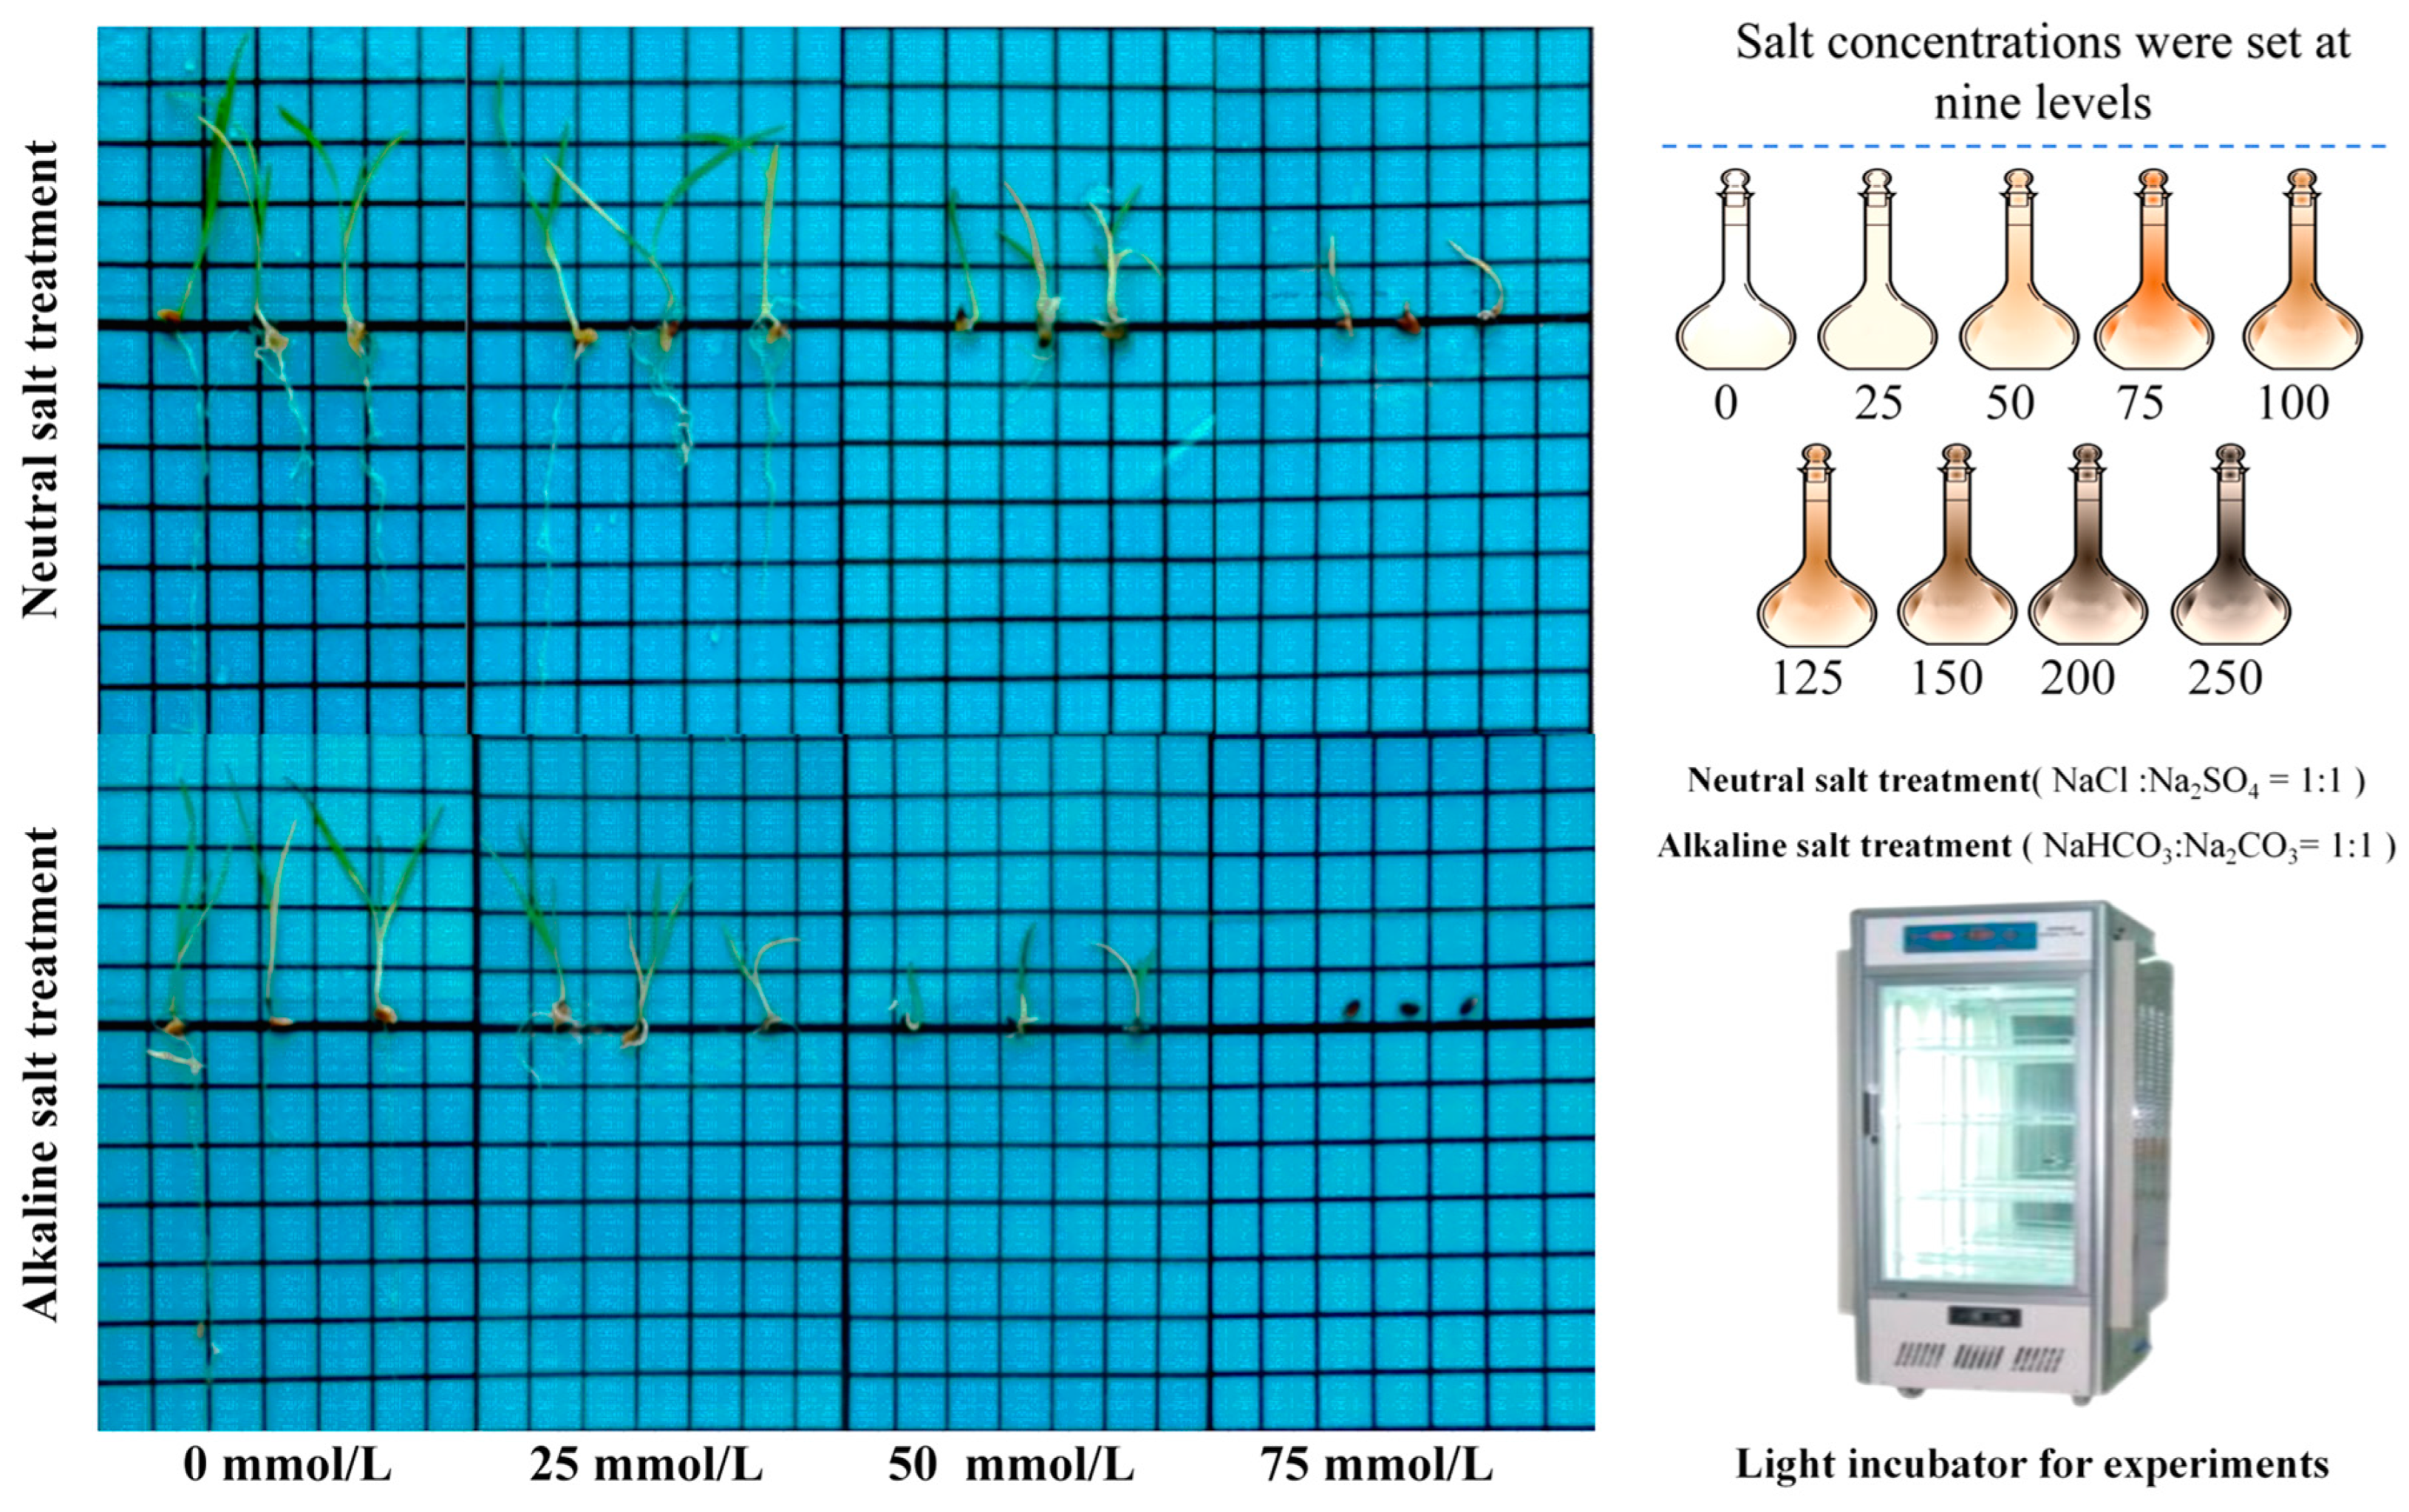
However, neutral and alkaline salts exerted different effects on seed germination of the bermudagrass accessions. Specifically, C33, C1, and C20 could not germinate at neutral salt concentrations of 100, 125, and 150 mmol/L, respectively. Only C7, C12, and C21 could germinate at a 150 mmol/L concentration of neutral salt. In contrast, when the alkaline salt concentration reached 50 mmol/L, five accessions could not germinate; only C21 could germinate under 75 mmol/L alkaline salt, but its germination rate was only 0.67%. At a salt concentration of 75 mmol/L, the germination potential of C33 was reduced to zero under neutral salt stress, while that of C20, C12, C21, C7, and C1 was 30.67, 17.33, 8.67, 8.00, and 4.00%, respectively. Furthermore, only C21 had a 0.67% germination potential under alkaline salt stress, while the rest of the accessions reached zero at 75 mmol/L. These results indicate that alkaline salt stress has a more pronounced inhibitory effect on germination than neutral salt treatment in bermudagrass accessions.
The difference in seedling growth indicators between neutral and alkaline salts was more pronounced than that observed in germination indicators (
Figure 2). Since alkaline salt stress showed minimal germination at 75 mmol/L, we compared the growth indicators of the two salt stresses at 50 mmol/L. Under neutral salt stress, the ranges of radicle length, the plumule length, the ratio of radicle to plumule length, and the seedling weight were 8.21–24.62 mm, 12.38–18.15 mm, 0.66–1.36, and 0.32–0.58 mg, respectively. Under alkaline salt stress, these ranges were 3.17–6.25 mm, 9.78–14.42 mm, 0.28–0.53, and 0.23–0.36 mg, respectively. These findings indicate that alkaline salt stress has a more significant impact on the growth of bermudagrass seedlings than neutral salt stress, particularly in inhibiting root length.
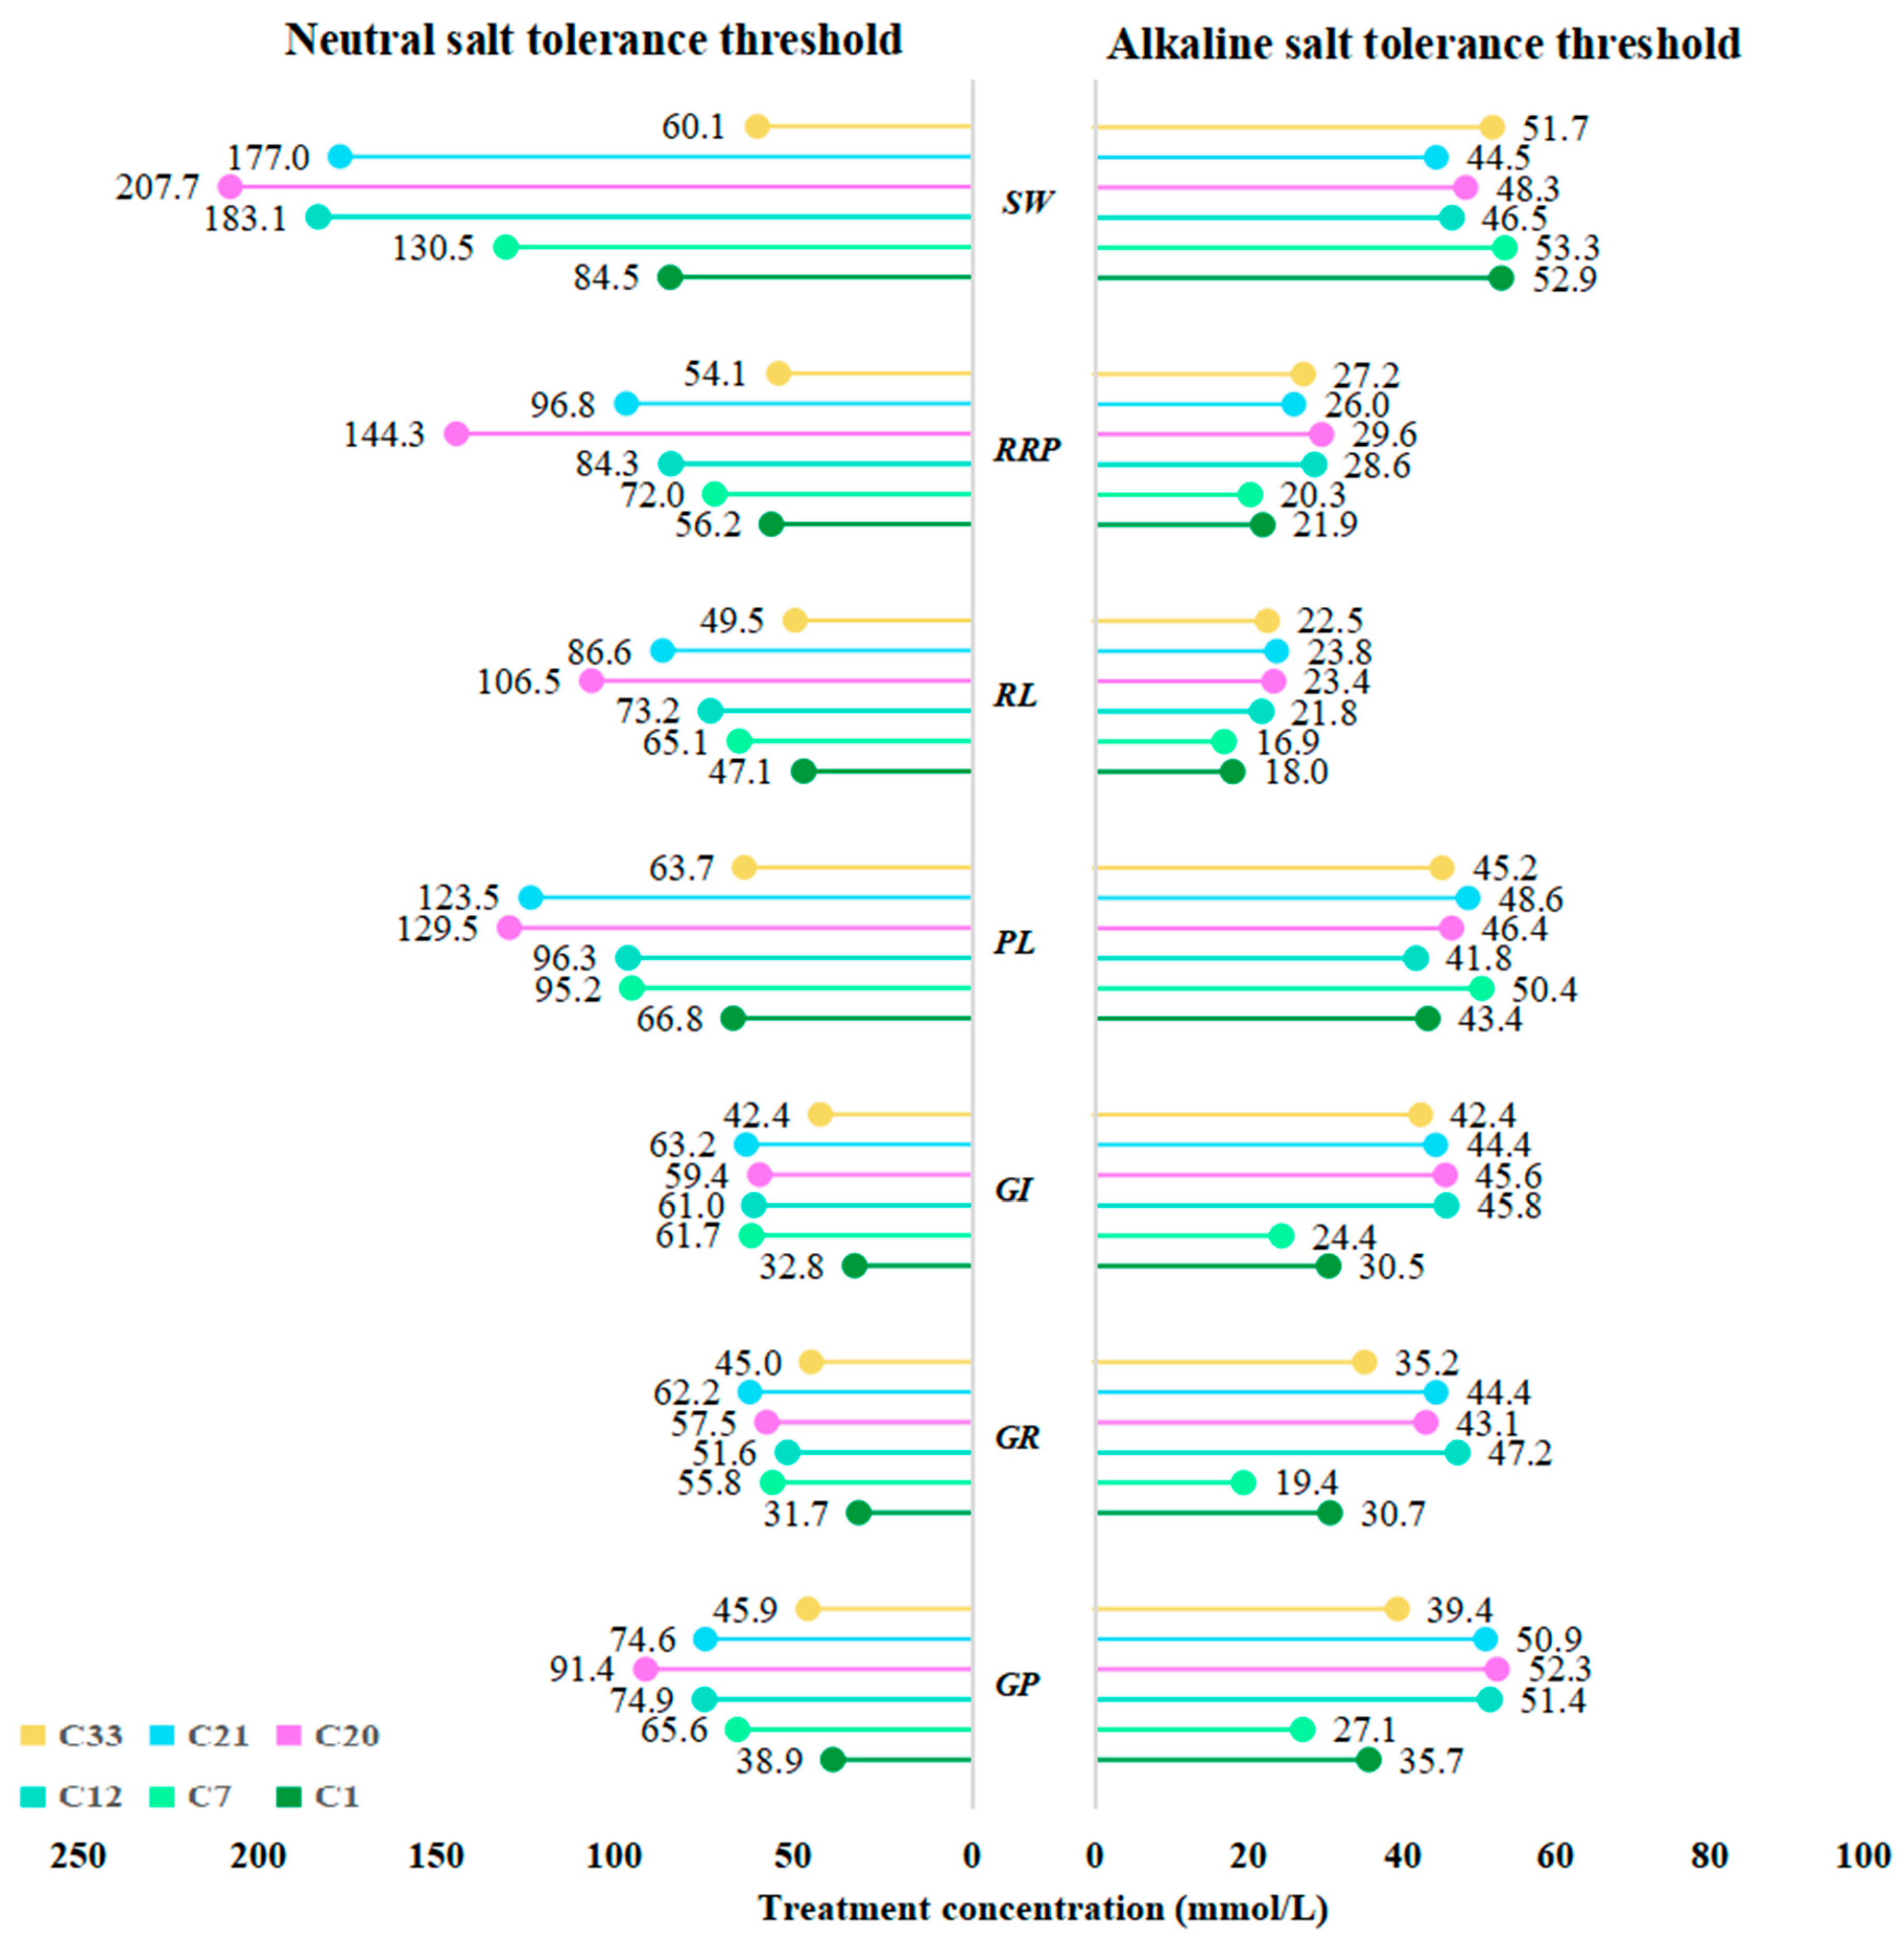
The standard for calculating thresholds involves reducing each index to 50% under control conditions (CK) to evaluate the tolerance of different germplasms under neutral and alkaline salt stress (
Figure 3). The thresholds for SW, RRP, RL, PL, GI, GP, and GE under neutral salt stress ranged from 60.1–207.7, 54.1–144.3, 47.1–106.5, 63.7–129.5, 32.8–63.2, 31.7–62.2, and 38.9–91.4 mmol/L, respectively. Under alkaline salt stress, the thresholds for SW, RRP, RL, PL, GI, GP, and GE ranged from 44.5–53.3, 20.3–29.6, 16.9–23.8, 41.8–50.4, 24.4–45.8, 19.4–47.2, and 27.1–52.3 mmol/L, respectively (
Figure 2).
3.3. Comprehensive Evaluation of Salt and Alkali Tolerance in Bermudagrass
The salt tolerance coefficient or alkali tolerance coefficient can reflect salt tolerance, further elucidating the correlation between indicators, and comparing the saline-alkali resistance of six bermudagrass accessions. Therefore, we replaced the original values with the neutral salt tolerance coefficient (SC
N) and the alkaline salt tolerance coefficient (SC
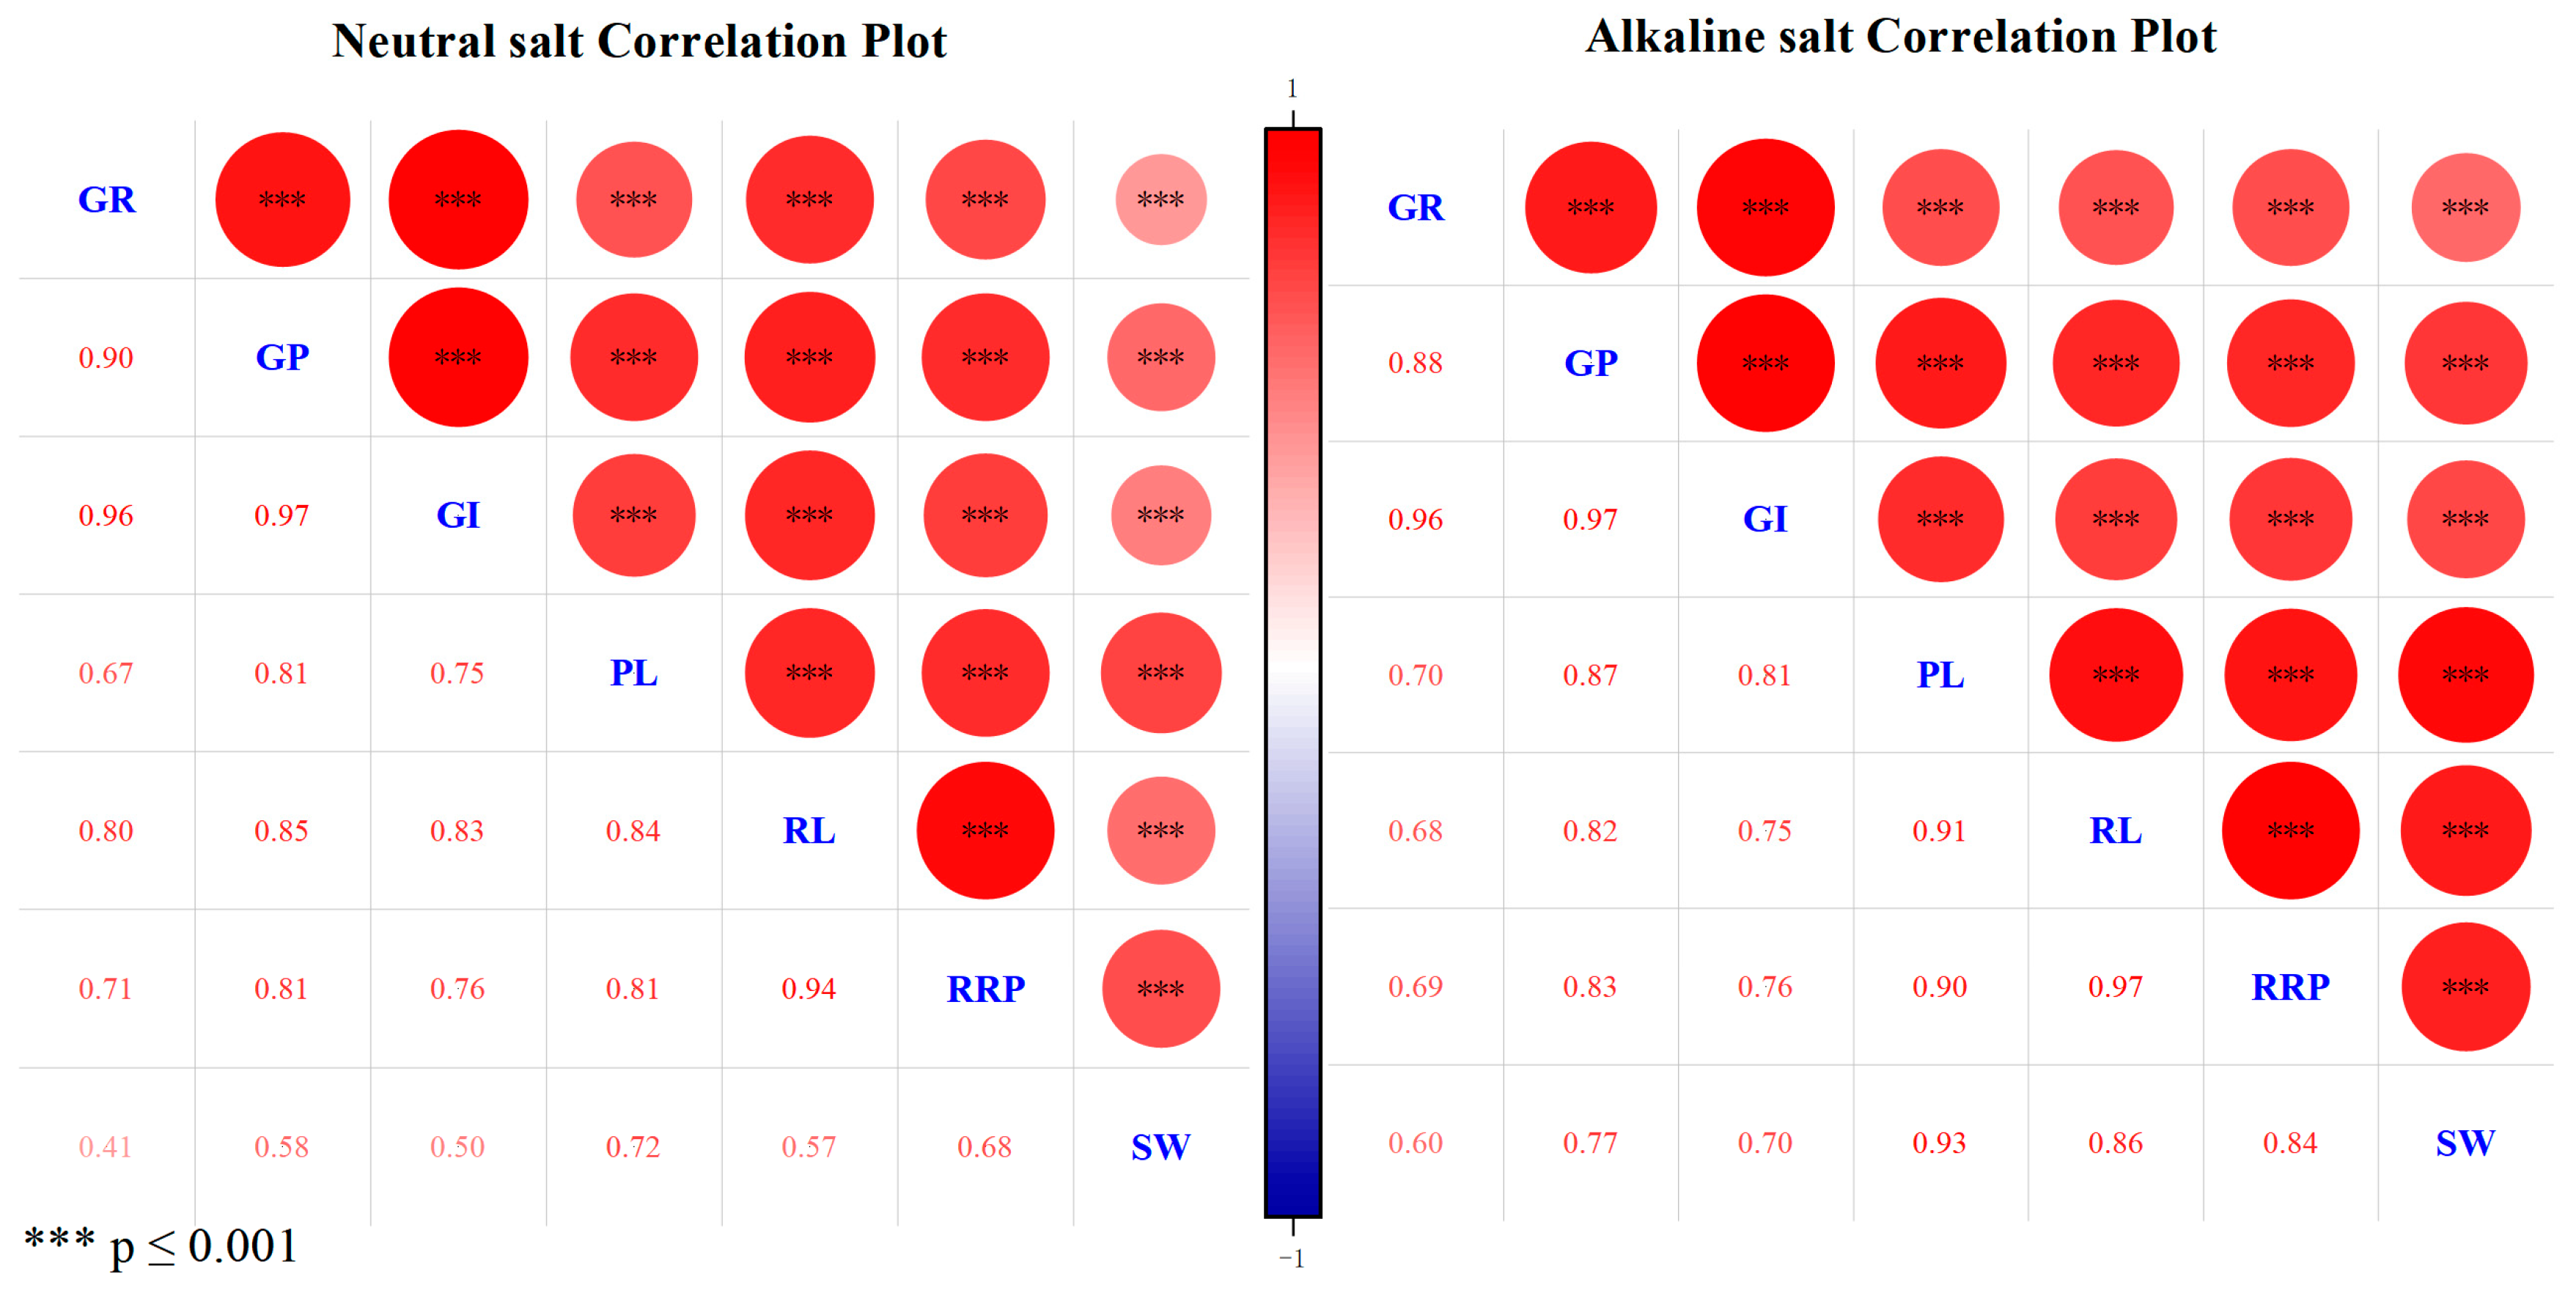
A). Given the significant correlation observed among the indicators (
Figure 4), this study carried out PCA to avoid information redundancy among the indicators under neutral or alkaline salt stress. PCA is a functional multivariate method that evaluates significant distinguishing features of variability, identifies relationships among growth indicators, and groups them based on similar properties.
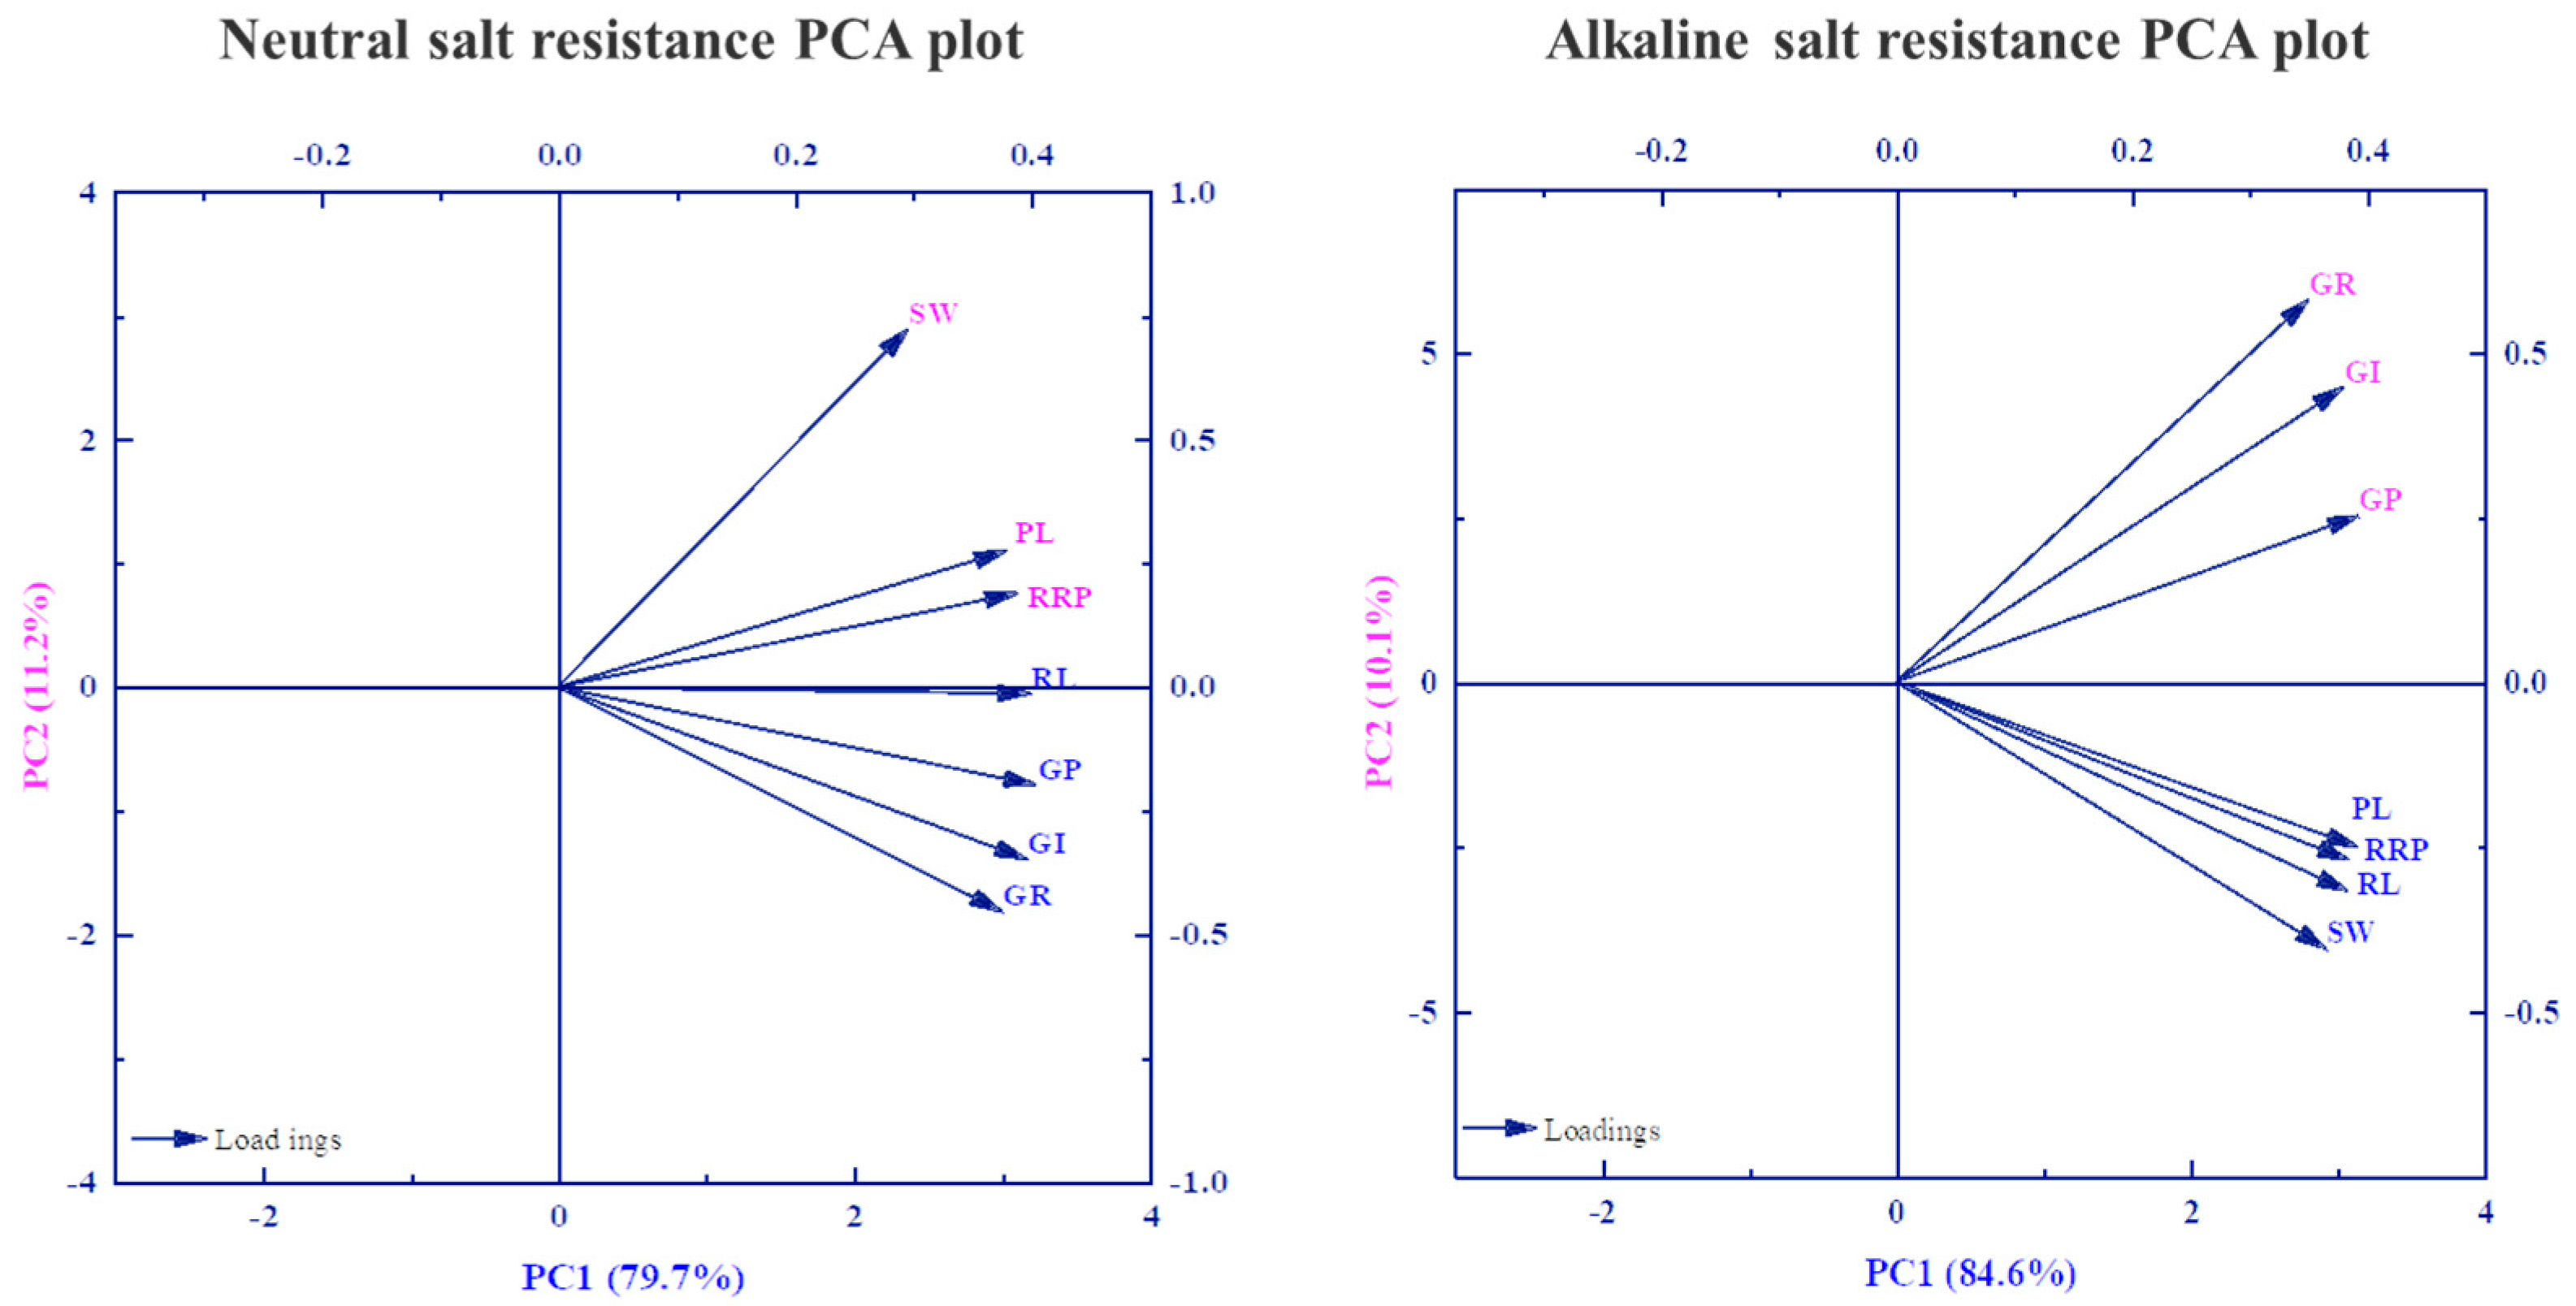
The PCA extracted a common factor with a cumulative variance contribution rate of 85%, which was conducted on germination and growth indicators under salt and alkali stress. We calculated the coefficients for each index in the comprehensive scoring model by determining the typical factor score, and these extracted scores were then weighted to form the neutral or alkaline salt tolerance indices of the bermudagrass accessions. In the present investigation, performing PCA converted seven indicators into two new comprehensive indexes that explained 90.9% and 94.7% of the original index information described under neutral and alkaline salt stress treatment, respectively (
Figure 5). Under neutral salt stress, PC1 showed the highest percentage of variation (79.7%), followed by 11.2% for PC2. Germination rate, index, potential, and radicle length were positively influential traits in PC1, while the ratio of radicle and plumule length, plumule length, and seedling weight were significant characteristics in PC2. Under alkaline salt stress, PC1 showed the highest percentage of variation (84.6%), followed by 10.1% for PC2. Seedling weight, radicle length, the ratio of radicle and plumule length, and plumule length were positively influential traits in PC1, while germination potential and germination rate were significant characteristics in PC2.
The trend of different bermudagrass accessions in response to increasing salt concentration differs under neutral and alkaline salt stresses (
Table 5). The tolerance coefficients of these accessions to neutral and alkaline salts were ranked using the membership function fuzzy comprehensive score value. The results showed that the response trends of different accessions under neutral salt treatment varied. Specifically, C1, C20, and C33 exhibited an increase followed by a decrease with increasing salt concentration, peaking at 50 mmol/L, indicating a promotion effect at low salt concentrations. In contrast, the remaining three accessions decreased with increasing salt concentration, whereas no promotion effect at low concentrations was observed.
Alkaline salt treatment showed no significant differences in bermudagrass accessions compared with neutral salt treatment. All accessions increased and then decreased with increasing salt concentration, similar to the neutral salt stress treatment, indicating a peak at 50 mmol/L. All alkaline salt stress treatments showed a particularly low salt concentrations promotion effect.
A comprehensive evaluation of the different accessions revealed differences in tolerance coefficients under neutral and alkaline salt stresses. The neutral and alkaline salts tolerance coefficients of the different bermudagrass accessions were ranked by calculating the mean of the membership function fuzzy comprehensive score value (
Table 6). Their ranks (1–6) were significantly higher than those of the alkaline salt stress treatments (7–12) under neutral salt stress. Bermudagrass seedlings suffered more harm under alkaline salt stress with high pH conditions than under neutral salt stress. All performed less well under alkaline salt stress than under neutral salt stress. In the different bermudagrass accessions, based on the size of the membership function fuzzy comprehensive score value, the rank order (highest to lowest) of the scores was C20, C21, C12, C7, C33, and C1 under neutral salt stress. At the same time, it was C33, C20, C21, C12, C1, and C7 under alkaline salt stress. Combining bermudagrass accessions into three levels of tolerance-high salt or alkaline, medium salt or alkaline, and sensitive salt or alkaline is necessary. Cluster analysis is also required to find accessions with both neutral salt and alkali salt tolerance, providing technical support for subsequent suggestions on cultivating accessions in saline-alkali land.
3.4. Clustering Based on Morphological Traits and Tolerance of Bermudagrass Accessions
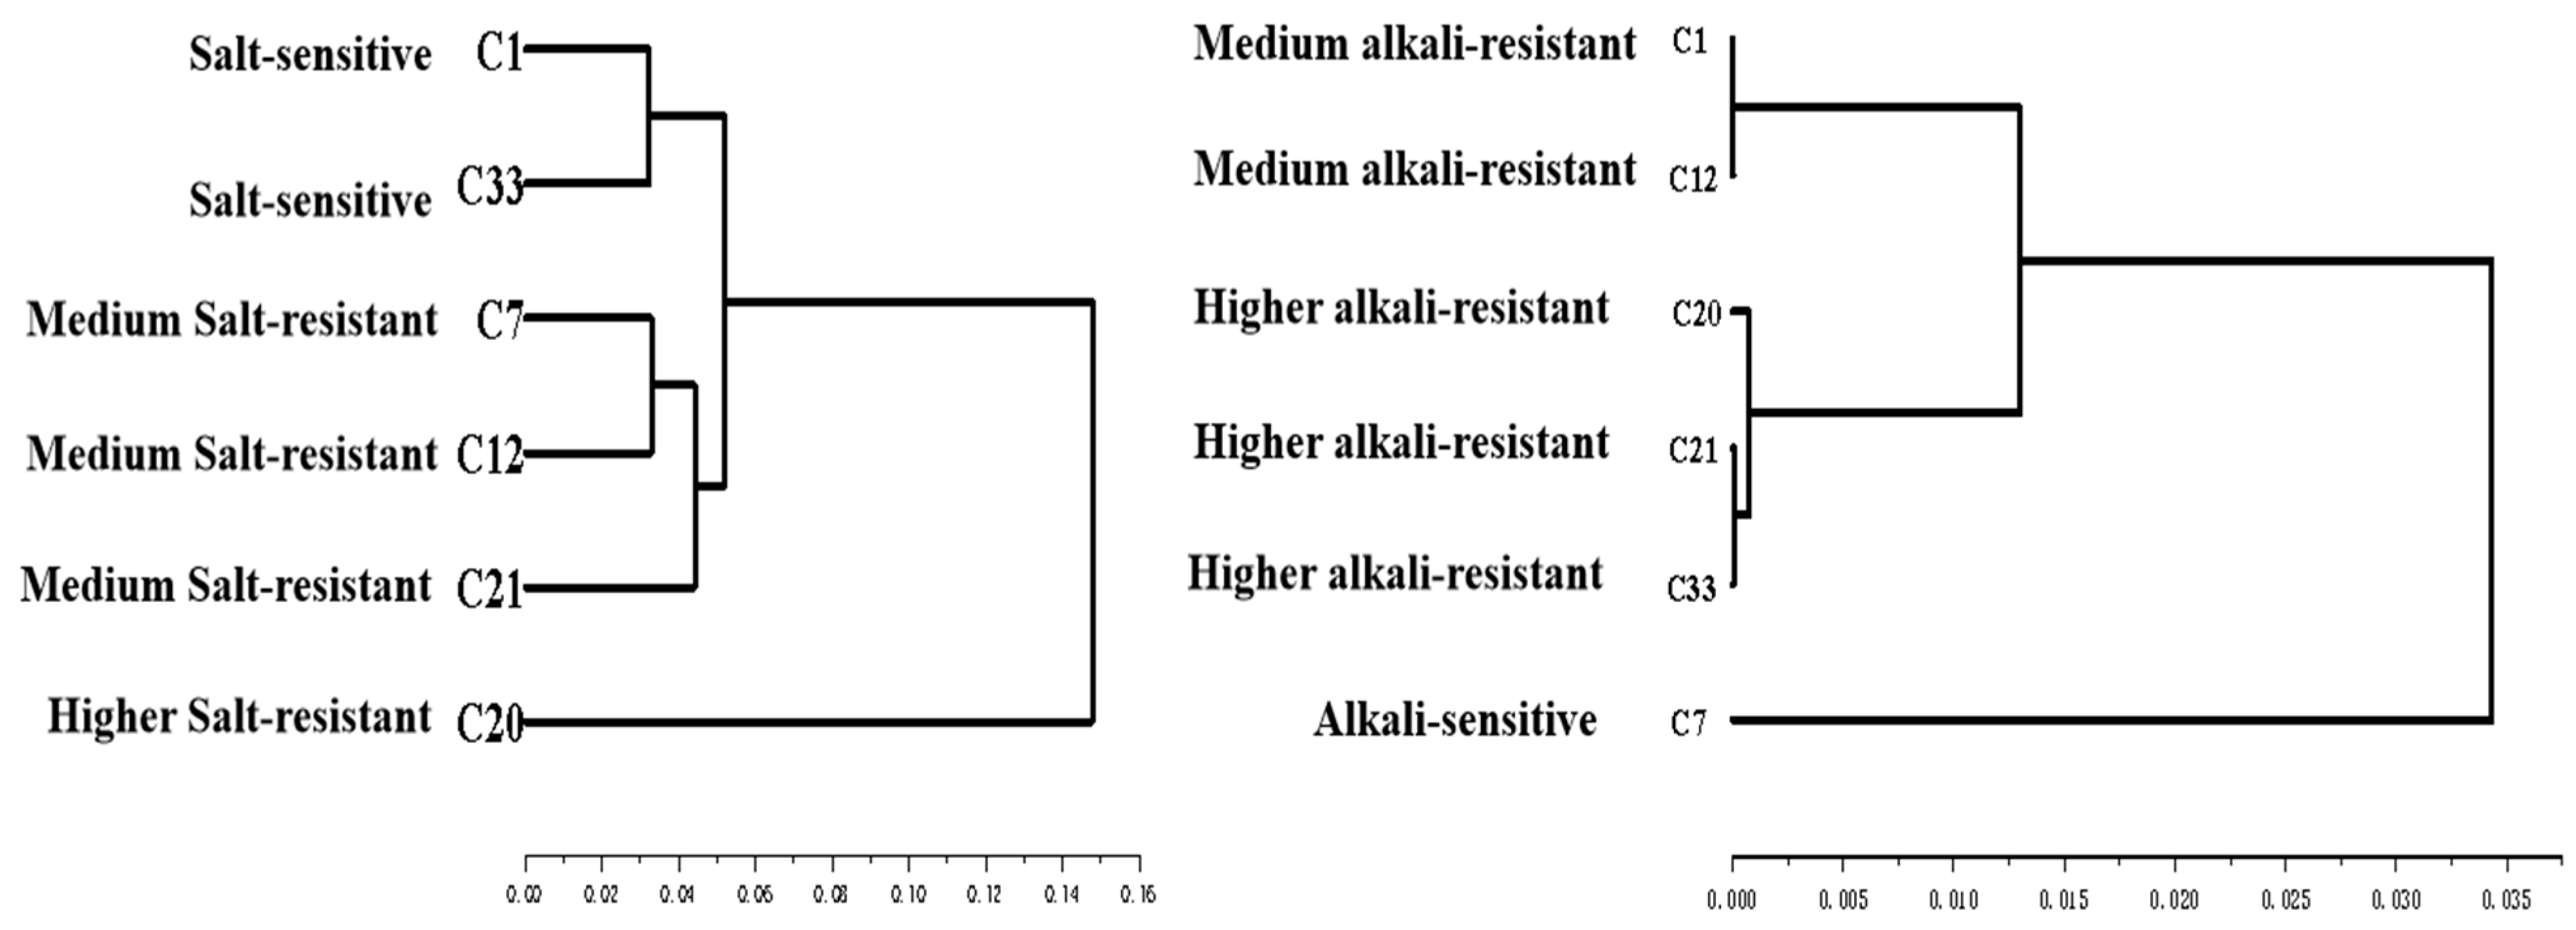
Cluster analysis was performed to group the bermudagrass accessions based on similar properties. The dendrogram was generated using the Euclidean squared distance method, considering all morphological traits and systematically clustering the D value. Cluster analysis grouped the six accessions into three distinct groups (Group 1—Higher, Group 2—Medium, and Group 3—Sensitive). Under neutral salt stress, Group 1 consisted of 1 accession, Group 2 of 3 accessions, and Group 3 of 2 accessions. Furthermore, under alkaline salt stress, Group 1 consisted of 3 accessions, Group 2 of 2 accessions, and Group 3 of 1 accession (
Figure 6).
Fisher discriminant analysis (Bayes Coefficient) was used to validate the accuracy of the neutral and alkaline salt resistance assessments and clustering results (
Figure 7). Under neutral salt stress, C20 showed the highest projected score, while C21, C12, and C7 exhibited moderate scores, and C33 and C1 had the lowest. Under alkaline salt stress, C33, C21, and C20 demonstrated the highest projected score, C12 and C1 showed moderate scores, and C7 had the lowest. The result of the discriminant function was 100% consistent with that of the Euclidean squared distance method.
