
Critical Drop Height Prediction of Loquat Fruit Based on Some Engineering Properties with Machine Learning Approach


Abstract
1. Introduction
2. Materials and Methods
2.1. Artificial Neural Networks (ANNs)
2.2. Support Vector Machines (SVMs)
2.3. Extra Trees (ETs)
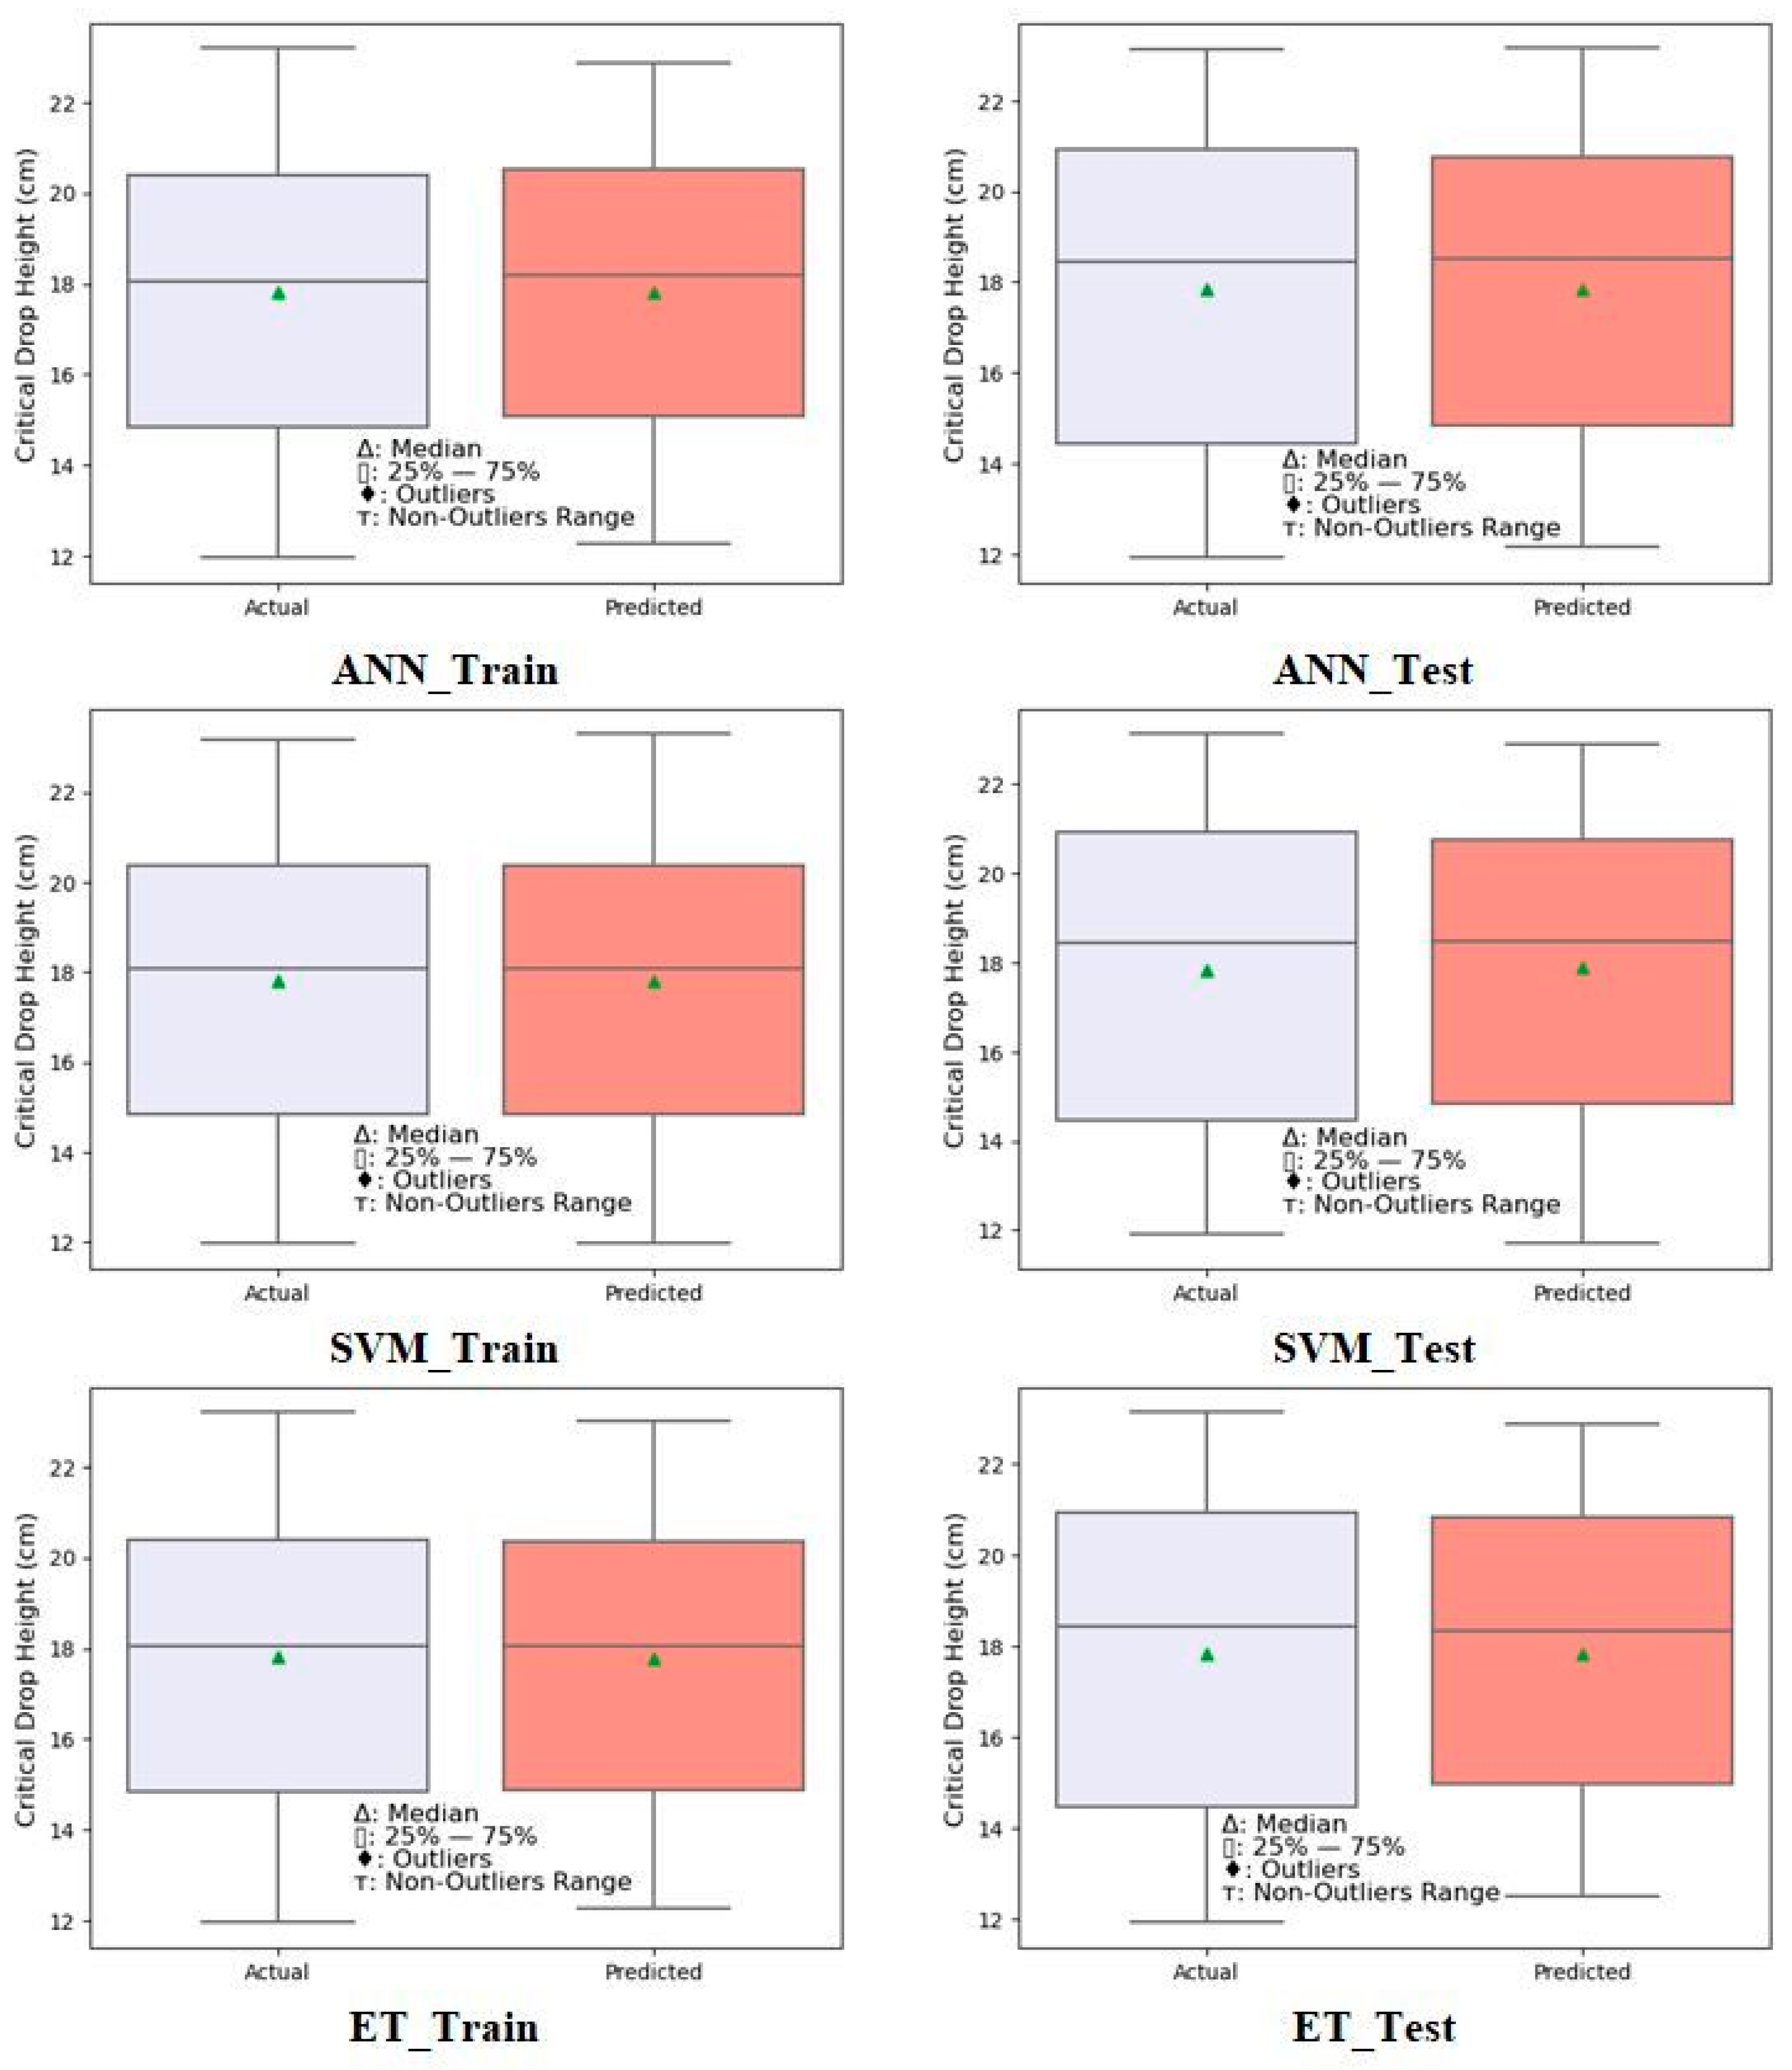
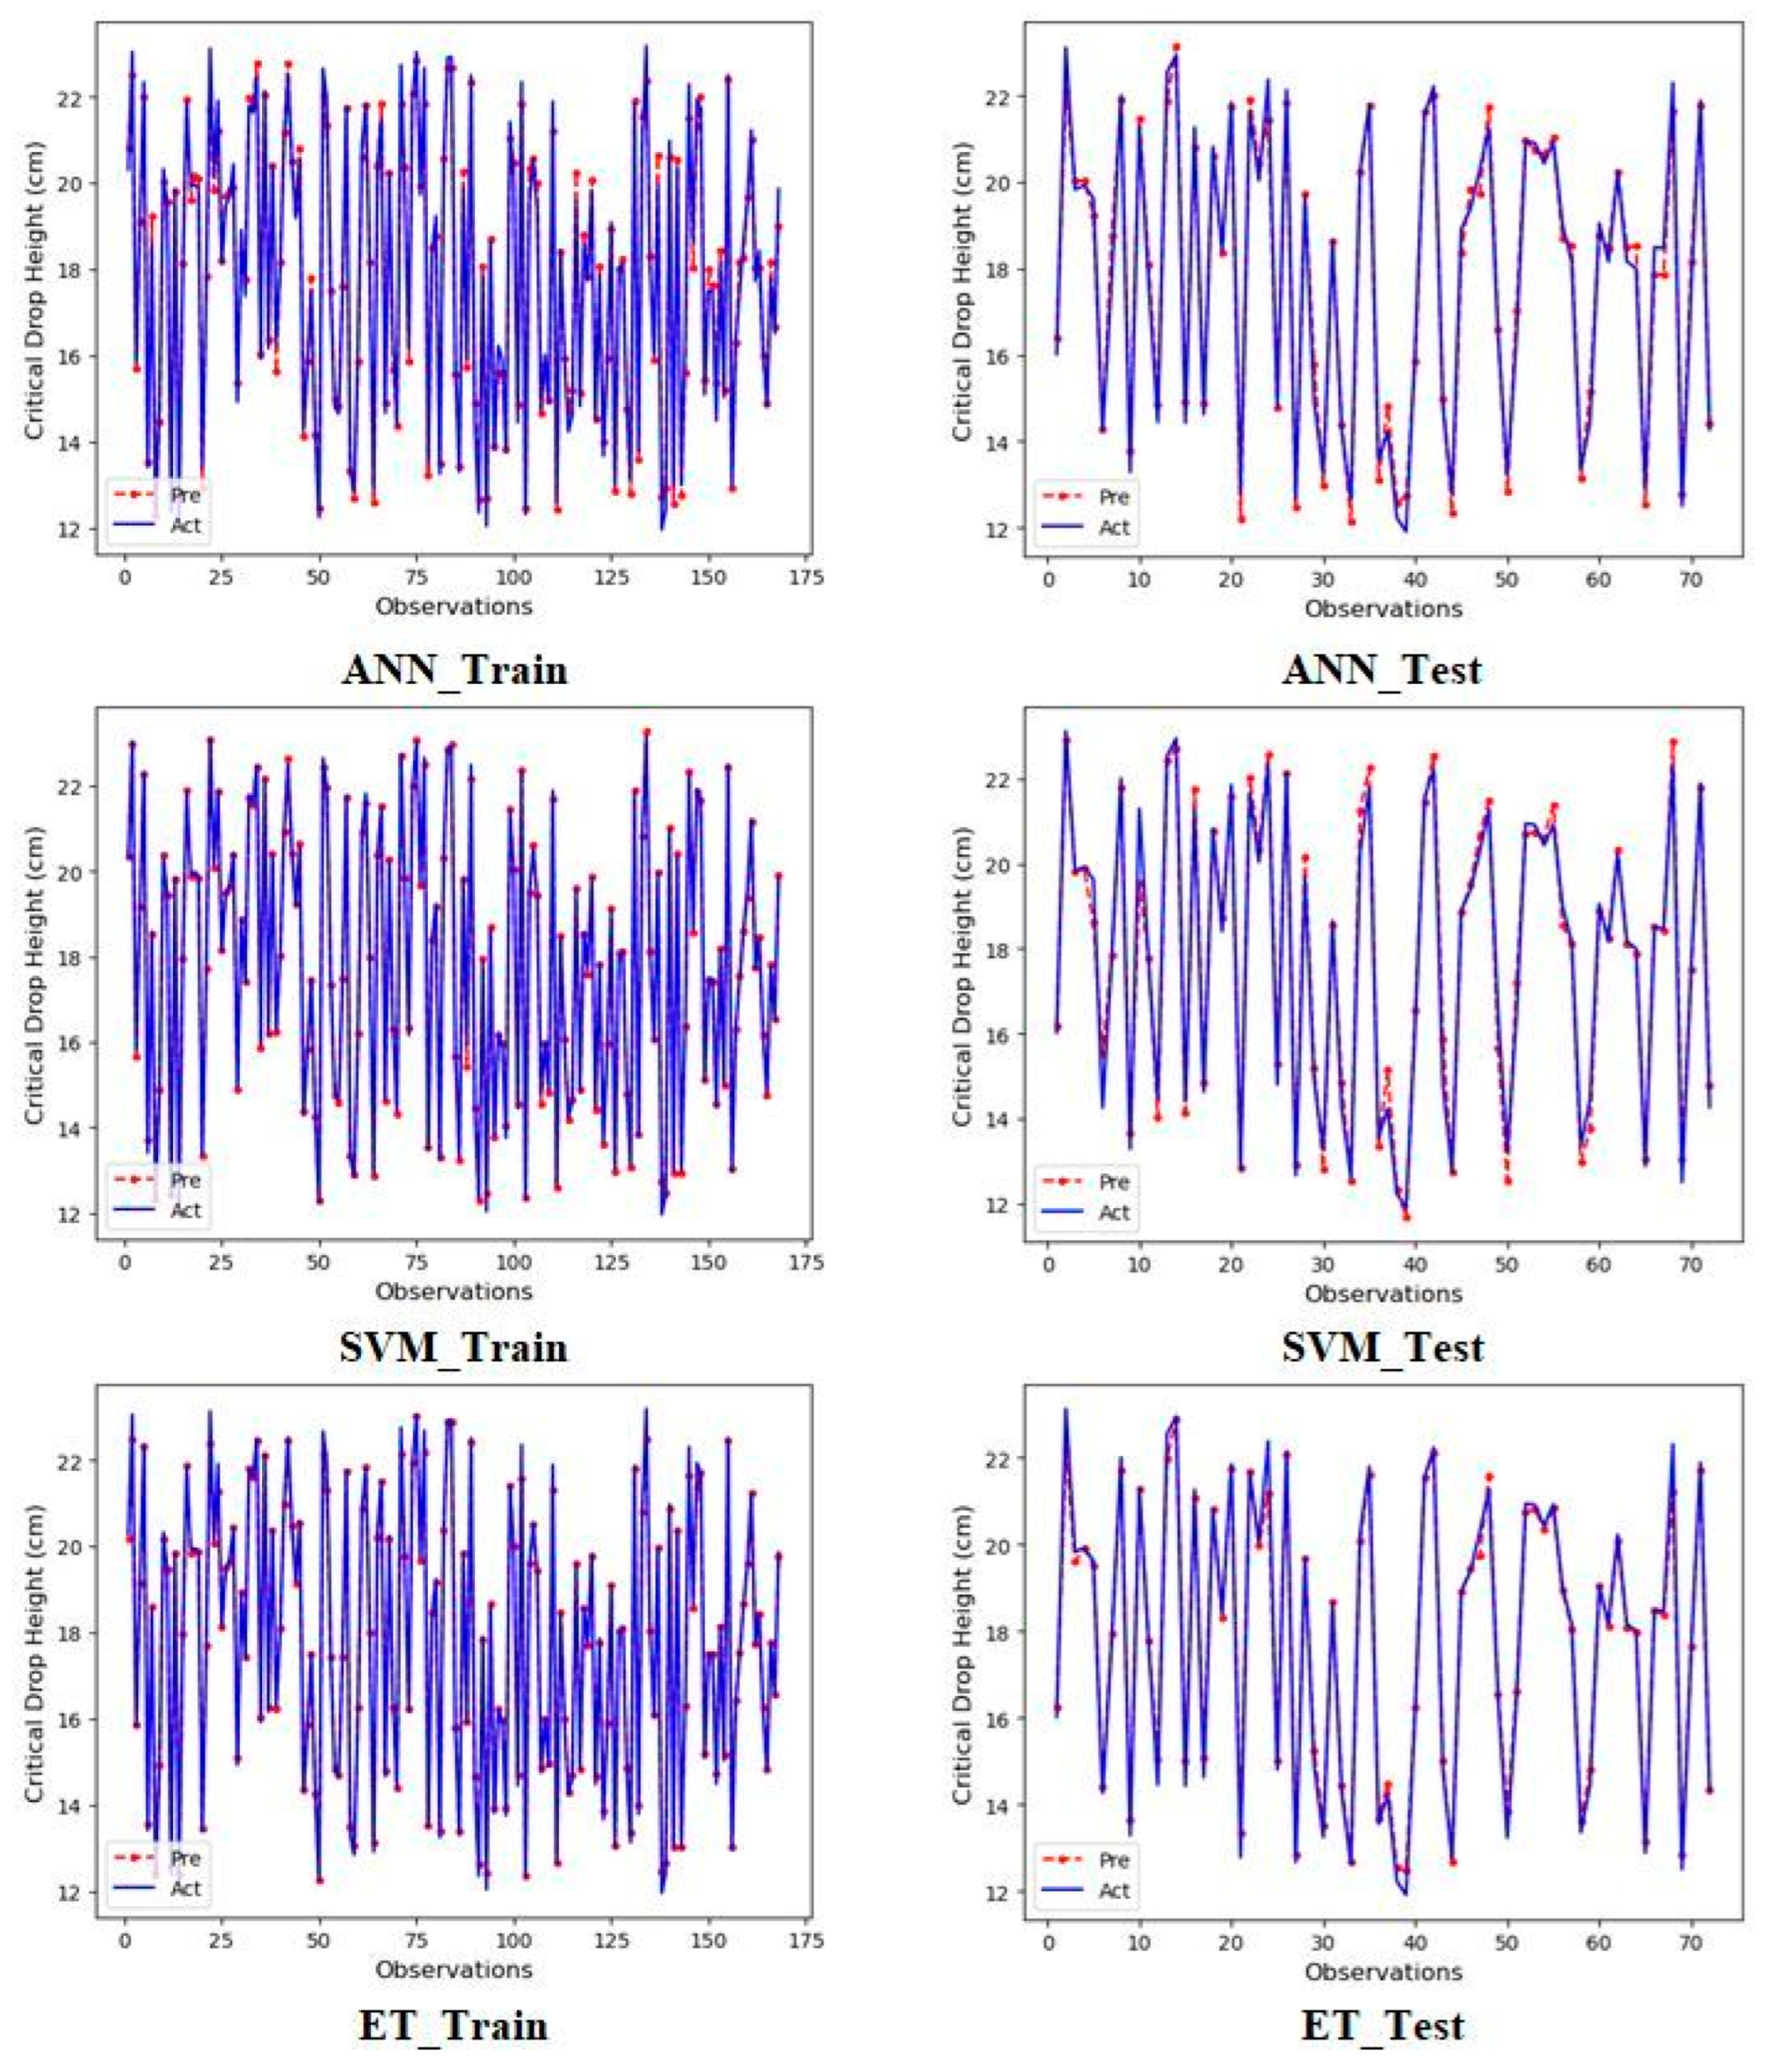
3. Results and Discussion
4. Conclusions
Author Contributions
Funding
Data Availability Statement
Conflicts of Interest
References
- Polat, A.A. Loquat Production in Turkey: Problems and Solutions. Eur. J. Plant Sci. Biotechnol. 2007, 1, 187–199. [Google Scholar]
- Murad, R.I. Some Physical and Mechanical Properties of Loquat (Eriobotrya japonica) Fruit With Change of Moisture Content. Alex. J. Fd. Sci. Technol 2012, 9, 1–8. [Google Scholar]
- Zhang, Y.; Zhang, J.; Wang, R.; Yang, Z. Chemical Constituents and Health Benefits of Loquat (Eriobotrya japonica). Food Chem. 2018, 240, 849–858. [Google Scholar]
- Shah, H.M.S.; Khan, A.S.; Singh, Z.; Ayyub, S. Postharvest Biology and Technology of Loquat (Eriobotrya japonica Lindl.). Foods 2023, 12, 1329. [Google Scholar] [CrossRef] [PubMed]
- Mohsenin, N.N. Physical Properties of Plant and Animal Materials: V. 1: Physical Characteristics and Mechanical Properties; Routledge: New York, NY, USA, 2020. [Google Scholar]
- Kabas, O.; Kayakus, M.; Ünal, İ.; Moiceanu, G. Deformation Energy Estimation of Cherry Tomato Based on Some Engineering Parameters Using Machine-Learning Algorithms. Appl. Sci. 2023, 13, 8906. [Google Scholar] [CrossRef]
- Lin, M.; Fawole, O.A.; Saeys, W.; Wu, D.; Wang, J.; Opara, U.L.; Nicolai, B.; Chen, K. Mechanical Damages and Packaging Methods along the Fresh Fruit Supply Chain: A Review. Crit. Rev. Food Sci. Nutr. 2023, 63, 10283–10302. [Google Scholar] [CrossRef]
- Li, Y.; Song, S.; Huang, X.; Zhao, C. Effect of Fruit Weight and Drop Height on Bruise Area and Contact Pressure Characteristics of Apple during Free Drop Test. J. Food Process. Preserv. 2023, 2023, 4828539. [Google Scholar] [CrossRef]
- Pathare, P.B.; Opara, U.L. Importance of Bruise Assessment and Control in Fresh Produce Industry. Mech. Damage Fresh Hortic. Prod. 2023, 337–350. [Google Scholar] [CrossRef]
- Hadjipieri, M.; Christofi, M.; Goulas, V.; Manganaris, G.A. The Impact of Genotype and Harvesting Day on Qualitative Attributes, Postharvest Performance and Bioactive Content of Loquat Fruit. Sci. Hortic. 2020, 263, 108891. [Google Scholar] [CrossRef]
- Ding, Z.; Tian, S.; Wang, Y.; Li, B.; Chan, Z.; Han, J.; Xu, Y. Physiological Response of Loquat Fruit to Different Storage Conditions and Its Storability. Postharvest Biol. Technol. 2006, 41, 143–150. [Google Scholar] [CrossRef]
- Cai, C.; Xu, C.J.; Shan, L.L.; Li, X.; Zhou, C.H.; Zhang, W.S.; Ferguson, I.; Chen, K.S. Low Temperature Conditioning Reduces Postharvest Chilling Injury in Loquat Fruit. Postharvest Biol. Technol. 2006, 41, 252–259. [Google Scholar] [CrossRef]
- Wang, Y.; Shan, Y.; Chen, J.; Feng, J.; Huang, J.; Jiang, F.; Zheng, S.; Qin, Q. Comparison of Practical Methods for Postharvest Preservation of Loquat Fruit. Postharvest Biol. Technol. 2016, 120, 121–126. [Google Scholar] [CrossRef]
- Ding, C.K.; Chachin, K.; Hamauzu, Y.; Ueda, Y.; Imahori, Y. Effects of Storage Temperatures on Physiology and Quality of Loquat Fruit. Postharvest Biol. Technol. 1998, 14, 309–315. [Google Scholar] [CrossRef]
- Abbasi, N.A.; Akhtar, A.; Hussain, A. Maintaining quality of loquat (Eriobotrya japonica Lindl.) fruit after harvest. Pak. J. Bot 2013, 45, 247–251. [Google Scholar]
- Pareek, S.; Benkeblia, N.; Janick, J.; Cao, S.; Yahia, E.M. Postharvest Physiology and Technology of Loquat (Eriobotrya japonica Lindl.) Fruit. J. Sci. Food Agric. 2014, 94, 1495–1504. [Google Scholar] [CrossRef] [PubMed]
- Lloha, I.; Kyçyk, O.; Cara, J. Preliminary Data on Physical and Biochemical Profile of Loquat (Eriobotrya japonica Lindl.) Harvested in Albania. Adv. Eng. Days 2023, 7, 106–108. [Google Scholar]
- Ullah, F.; Min, K.; Khattak, M.K.; Wahab, S.; Wahab, N.; Ameen, M.; Memon, M.S.; Wang, X.; Soomro, S.A.; Yousaf, K.; et al. Effects of Different Drying Methods on Some Physical and Chemical Properties of Loquat (Eriobotrya japonica) Fruits. Int. J. Fruit Sci. 2018, 18, 345–354. [Google Scholar] [CrossRef]
- Shahi-Gharahlar, A.; Yavari, A.R.; Khanali, M. Mass and Volume Modeling of Loquat (Eriobotrya japonica Lindl.) Fruit Based on Physical Characteristics. J. Fruit Ornam. Plant Res. 2009, 17, 175–189. [Google Scholar]
- Gentile, C.; Reig, C.; Corona, O.; Todaro, A.; Mazzaglia, A.; Perrone, A.; Gianguzzi, G.; Agusti, M.; Farina, V. Pomological Traits, Sensory Profile and Nutraceutical Properties of Nine Cultivars of Loquat (Eriobotrya japonica Lindl.) Fruits Grown in Mediterranean Area. Plant Foods Hum. Nutr. 2016, 71, 330–338. [Google Scholar] [CrossRef]
- Ding, C.K.; Chachin, K.; Ueda, Y.; Imahori, Y.; Wang, C.Y. Modified Atmosphere Packaging Maintains Postharvest Quality of Loquat Fruit. Postharvest Biol. Technol. 2002, 24, 341–348. [Google Scholar] [CrossRef]
- Barchi, G.L.; Berardinelli, A.; Guarnieri, A.; Ragni, L.; Fila, C.T. PH—Postharvest Technology: Damage to Loquats by Vibration-Simulating Intra-State Transport. Biosyst. Eng. 2002, 82, 305–312. [Google Scholar] [CrossRef]
- Ercisli, S.; Gozlekci, S.; Sengul, M.; Hegedus, A.; Tepe, S. Some Physicochemical Characteristics, Bioactive Content and Antioxidant Capacity of Loquat (Eriobotrya japonica (Thunb.) Lindl.) Fruits from Turkey. Sci. Hortic. 2012, 148, 185–189. [Google Scholar] [CrossRef]
- Xu, H.Z.; Zhao, Y.; Dai, H.Z. Experimental Study on Damage Characteristics of Loquat Fruit. J. Agric. Mech. Res. 2021, 43, 106–112. [Google Scholar]
- Cañete, M.L.; Hueso, J.J.; Pinillos, V.; Cuevas, J. Ripening Degree at Harvest Affects Bruising Susceptibility and Fruit Sensorial Traits of Loquat (Eriobotrya japonica Lindl.). Sci. Hortic. 2015, 187, 102–107. [Google Scholar] [CrossRef]
- Baryeh, E.A. Strength Properties of Avocado Pear. J. Agric. Eng. Res. 2000, 76, 389–397. [Google Scholar] [CrossRef]
- Jiménez-Jiménez, F.; Castro-García, S.; Blanco-Roldán, G.L.; Ferguson, L.; Rosa, U.A.; Gil-Ribes, J.A. Table Olive Cultivar Susceptibility to Impact Bruising. Postharvest Biol. Technol. 2013, 86, 100–106. [Google Scholar] [CrossRef]
- Du, D.; Wang, B.; Wang, J.; Yao, F.; Hong, X. Prediction of Bruise Susceptibility of Harvested Kiwifruit (Actinidia Chinensis) Using Finite Element Method. Postharvest Biol. Technol. 2019, 152, 36–44. [Google Scholar] [CrossRef]
- Sun, Y.; Pessane, I.; Pan, L.; Wang, X. Hyperspectral Characteristics of Bruised Tomatoes as Affected by Drop Height and Fruit Size. LWT 2021, 141, 110863. [Google Scholar] [CrossRef]
- Zhou, J.; He, L.; Karkee, M.; Zhang, Q. Effect of Catching Surface and Tilt Angle on Bruise Damage of Sweet Cherry Due to Mechanical Impact. Comput. Electron. Agric. 2016, 121, 282–289. [Google Scholar] [CrossRef]
- Stopa, R.; Szyjewicz, D.; Komarnicki, P.; Kuta, Ł. Limit Values of Impact Energy Determined from Contours and Surface Pressure Distribution of Apples under Impact Loads. Comput. Electron. Agric. 2018, 154, 1–9. [Google Scholar] [CrossRef]
- Wang, W.; Zhang, S.; Fu, H.; Lu, H.; Yang, Z. Evaluation of Litchi Impact Damage Degree and Damage Susceptibility. Comput. Electron. Agric. 2020, 173, 105409. [Google Scholar] [CrossRef]
- Hussein, Z.; Fawole, O.A.; Opara, U.L. Bruise Damage Susceptibility of Pomegranates (Punica granatum, L.) and Impact on Fruit Physiological Response during Short Term Storage. Sci. Hortic. 2019, 246, 664–674. [Google Scholar] [CrossRef]
- Sun, H.; Wan, F.; Huang, Y.; Xu, Z.; Huang, X. Evaluation of a New Method to Assess Blueberry Bruising Based on Intracellular and Extracellular Water Ratios. Sci. Hortic. 2024, 328, 112896. [Google Scholar] [CrossRef]
- Stropek, Z.; Gołacki, K. Bruise Susceptibility and Energy Dissipation Analysis in Pears under Impact Loading Conditions. Postharvest Biol. Technol. 2020, 163, 111120. [Google Scholar] [CrossRef]
- Belouz, K.; Nourani, A.; Zereg, S.; Bencheikh, A. Prediction of Greenhouse Tomato Yield Using Artificial Neural Networks Combined with Sensitivity Analysis. Sci. Hortic. 2022, 293, 110666. [Google Scholar] [CrossRef]
- Ercan, U.; Kabas, O.; Moiceanu, G. Prediction of Leaf Break Resistance of Green and Dry Alfalfa Leaves by Machine Learning Methods. Appl. Sci. 2024, 14, 1638. [Google Scholar] [CrossRef]
- Tripathi, P.; Kumar, N.; Rai, M.; Shukla, P.K.; Verma, K.N. Applications of Machine Learning in Agriculture. In Smart Village Infrastructure and Sustainable Rural Communities; Khan, M., Gupta, B., Verma, A., Praveen, P., Jennifer, C.P., Eds.; IGI Global: Hershey, PA, USA, 2023; pp. 99–118. [Google Scholar]
- Attri, I.; Awasthi, L.K.; Sharma, T.P. Machine Learning in Agriculture: A Review of Crop Management Applications. Multimed. Tools Appl. 2024, 83, 12875–12915. [Google Scholar] [CrossRef]
- Huang, X.; Wang, H.; Luo, W.; Xue, S.; Hayat, F.; Gao, Z. Prediction of Loquat Soluble Solids and Titratable Acid Content Using Fruit Mineral Elements by Artificial Neural Network and Multiple Linear Regression. Sci. Hortic. 2021, 278, 109873. [Google Scholar] [CrossRef]
- Munera, S.; Gómez-Sanchís, J.; Aleixos, N.; Vila-Francés, J.; Colelli, G.; Cubero, S.; Soler, E.; Blasco, J. Discrimination of Common Defects in Loquat Fruit Cv. “Algerie” Using Hyperspectral Imaging and Machine Learning Techniques. Postharvest Biol. Technol. 2021, 171, 111356. [Google Scholar] [CrossRef]
- Han, Z.; Li, B.; Wang, Q.; Yang, A.; Liu, Y. Detection Storage Time of Mild Bruise’s Loquats Using Hyperspectral Imaging. J. Spectrosc. 2022, 2022, 9989002. [Google Scholar] [CrossRef]
- Meng, Q.; Feng, S.; Tan, T.; Wen, Q.; Shang, J. Fast Detection of Moisture Content and Freshness for Loquats Using Optical Fiber Spectroscopy. Food Sci. Nutr. 2024. [CrossRef]
- Li, B.; Han, Z.; Wang, Q.; Sun, Z.; Liu, Y. Study on Qualitative Impact Damage of Loquats Using Hyperspectral Technology Coupled with Texture Features. Foods 2022, 11, 2444. [Google Scholar] [CrossRef]
- Feng, S.; Shang, J.; Tan, T.; Wen, Q.; Meng, Q. Nondestructive Quality Assessment and Maturity Classification of Loquats Based on Hyperspectral Imaging. Sci. Rep. 2023, 13, 131891. [Google Scholar] [CrossRef]
- Shousha, E.R.; Tayel, S.A.; Ghanem, T.H. Pomegranate Fruit Mass Modeling with Some Physical Properties. Al-Azhar J. Agric. Eng. 2024, 6. [Google Scholar] [CrossRef]
- Murakonda, S.; Patel, G.; Dwivedi, M. Characterization of Engineering Properties and Modeling Mass and Fruit Fraction of Wood Apple (Limonia acidissima) Fruit for Post-Harvest Processing. J. Saudi Soc. Agric. Sci. 2022, 21, 267–277. [Google Scholar] [CrossRef]
- Kabas, O.; Celik, H.K.; Ozmerzi, A.; Akinci, I. Drop Test Simulation of a Sample Tomato with Finite Element Method. J. Sci. Food Agric. 2008, 88, 1537–1541. [Google Scholar] [CrossRef]
- Liu, W.; Liu, T.; Zeng, T.; Ma, R.; Cheng, Y.; Zheng, Y.; Qiu, J.; Qi, L. Prediction of Internal Mechanical Damage in Pineapple Compression Using Finite Element Method Based on Hooke’s and Hertz’s Laws. Sci. Hortic. 2023, 308, 111592. [Google Scholar] [CrossRef]
- Celik, H.K. Explicit Dynamics Simulation of Pecan Fruit Deformation under Compressive Loading—Part-1: Determination of Modulus of Elasticity. J. Food Process Eng. 2017, 40, e12581. [Google Scholar] [CrossRef]
- Braga, G.C.; Couto, S.M.; Hara, T.; Almeida Neto, J.T.P. Mechanical Behaviour of Macadamia Nut under Compression Loading. J. Agric. Eng. Res. 1999, 72, 239–245. [Google Scholar] [CrossRef]
- Zheng, Z.; Chen, J.; Tian, W.; Zhang, C.; An, Z. Finite Element Analysis of Blueberry Stack Damage. J. Food Process Eng. 2021, 44, e13840. [Google Scholar] [CrossRef]
- Gupta, R.K.; Das, S.K. Physical Properties of Sunflower Seeds. J. Agric. Eng. Res. 1997, 66, 1–8. [Google Scholar] [CrossRef]
- Chandio, F.A.; Li, Y.; Ma, Z.; Ahmad, F.; Syed, T.N.; Shaikh, S.A.; Tunio, M.H. Influences of Moisture Content and Compressive Loading Speed on the Mechanical Properties of Maize Grain Orientations. Int. J. Agric. Biol. Eng. 2021, 14, 41–49. [Google Scholar] [CrossRef]
- Sirisomboon, P.; Kitchaiya, P.; Pholpho, T.; Mahuttanyavanitch, W. Physical and Mechanical Properties of Jatropha curcas L. Fruits, Nuts and Kernels. Biosyst. Eng. 2007, 97, 201–207. [Google Scholar] [CrossRef]
- Kabas, O.; Ozmerzi, A. Determining The Mechanical Properties of Cherry Tomato Varieties for Handling. J. Texture Stud. 2008, 39, 199–209. [Google Scholar] [CrossRef]
- Horsfield, B.C.; Fridley, R.B.; Claypool, L.L. Application of Theory of Elasticity to the Design of Fruit Harvesting and Handling Equipment for Minimum Bruising. Trans. ASAE 1972, 15, 746–0750. [Google Scholar] [CrossRef]
- Yilmaz, D.; Yildirim, I. Effects of Different Storage Techniques on Rupture Properties of Kiwifruits. J. Food Meas. Charact. 2016, 10, 539–545. [Google Scholar] [CrossRef]
- Pantic, I.; Paunovic, J.; Cumic, J.; Valjarevic, S.; Petroianu, G.A.; Corridon, P.R. Artificial Neural Networks in Contemporary Toxicology Research. Chem. Biol. Interact. 2023, 369, 110269. [Google Scholar] [CrossRef]
- Kantardzic, M. Data Mining: Concepts, Models, Methods, and Algorithms, 3rd ed.; John Wiley & Sons, Inc.: Hoboken, NJ, USA, 2019. [Google Scholar]
- Laurene, F. Fundamantals of Neural Networks: Architectures, Algorithms and Applications; Pearson Education: Tamil Nadu, India, 2006. [Google Scholar]
- Haykin, S. Neural Networks and Learning Machines, 3rd ed.; Pearson Education, Inc.: Hoboken, NJ, USA, 2009; ISBN 9780133002553. [Google Scholar]
- Widodo, A.; Yang, B.S. Support Vector Machine in Machine Condition Monitoring and Fault Diagnosis. Mech. Syst. Signal Process. 2007, 21, 2560–2574. [Google Scholar] [CrossRef]
- Chakraborty, N.; Chandra, S.; Banerji, A.; Biswas, S.K. Optimal Placement of DG Using Swarm Intelligence Approach in Distributed Network: Status & Challenges. In Proceedings of the 2016 21st Century Energy Needs-Materials, Systems and Applications (ICTFCEN), Kharagpur, India, 17–19 November 2016. [Google Scholar] [CrossRef]
- Shmilovici, A. Support Vector Machines. In Data Mining and Knowledge Discovery Handbook; Maimon, O., Rokach, L., Eds.; Springer: New York, NY, USA, 2010; pp. 231–247. [Google Scholar]
- Awad, M.; Khanna, R. Efficient Learning Machines: Theories, Concepts, and Applications for Engineers and System Designers; Apress Media LLC: New York, NY, USA, 2015; ISBN 9781430259909. [Google Scholar]
- El Bilali, A.; Abdeslam, T.; Ayoub, N.; Lamane, H.; Ezzaouini, M.A.; Elbeltagi, A. An Interpretable Machine Learning Approach Based on DNN, SVR, Extra Tree, and XGBoost Models for Predicting Daily Pan Evaporation. J. Environ. Manag. 2023, 327, 116890. [Google Scholar] [CrossRef]
- Ghazwani, M.; Begum, M.Y. Computational Intelligence Modeling of Hyoscine Drug Solubility and Solvent Density in Supercritical Processing: Gradient Boosting, Extra Trees, and Random Forest Models. Sci. Rep. 2023, 13, 10046. [Google Scholar] [CrossRef] [PubMed]
- Wang, Z.; Mu, L.; Miao, H.; Shang, Y.; Yin, H.; Dong, M. An Innovative Application of Machine Learning in Prediction of the Syngas Properties of Biomass Chemical Looping Gasification Based on Extra Trees Regression Algorithm. Energy 2023, 275, 127438. [Google Scholar] [CrossRef]
- Kocer, A. Numerical Investigation of Heat Transfer and Thermo-Hydraulic Performance of Solar Air Heater with Different Ribs and Their Machine Learning-Based Prediction. J. Braz. Soc. Mech. Sci. Eng. 2024, 46, 1–16. [Google Scholar] [CrossRef]
- Duman, S.; Elewi, A.; Yetgin, Z. Distance Estimation from a Monocular Camera Using Face and Body Features. Arab. J. Sci. Eng. 2022, 47, 1547–1557. [Google Scholar] [CrossRef]
- Chicco, D.; Warrens, M.J.; Jurman, G. The Coefficient of Determination R-Squared Is More Informative than SMAPE, MAE, MAPE, MSE and RMSE in Regression Analysis Evaluation. PeerJ Comput. Sci. 2021, 7, e623. [Google Scholar] [CrossRef]
- de Myttenaere, A.; Golden, B.; Le Grand, B.; Rossi, F. Mean Absolute Percentage Error for Regression Models. Neurocomputing 2016, 192, 38–48. [Google Scholar] [CrossRef]


| Evaluation Criteria | Equation Representation | Best Case | Worst Case |
|---|---|---|---|
| MAE | 0 | ∞ | |
| MAPE | 0 | ∞ | |
| RMSE | 0 | ∞ | |
| R2 | 1 | 0 |
| Mass (g) | Diameter (mm) | Length (mm) | Volume (cm3) | Sphericity (%) | Radius of Curvature (mm) | Compression Force (N) | |
| min | 55.19 | 38.51 | 44.16 | 34.66 | 71.63 | 22.24 | 51.32 |
| max | 88.08 | 49.68 | 64.28 | 77.78 | 89.30 | 25.78 | 87.51 |
| mean | 64.85 | 45.25 | 57.54 | 62.20 | 82.06 | 24.16 | 72.22 |
| std. dev. | 9.91 | 2.95 | 3.93 | 10.21 | 3.98 | 0.88 | 8.11 |
| Compression deformation (mm) | Poisson ratio | Elasticity of modulus (Nmm−2) | Absorbed energy (mJ) | Toughness (mJ cm−3) | Hardness (Nmm−1) | Critical Drop Height (cm) | |
| min | 11.99 | 0.21 | 0.14 | 629.70 | 5.45 | 3.15 | 12.20 |
| max | 19.13 | 0.60 | 2.10 | 1117.50 | 19.76 | 6.62 | 22.83 |
| mean | 15.44 | 0.34 | 0.37 | 873.38 | 9.27 | 4.76 | 17.82 |
| std. dev. | 2.07 | 0.10 | 0.35 | 110.82 | 2.71 | 0.86 | 3.33 |
| Method | Partition | Evaluation Metrics | |||
|---|---|---|---|---|---|
| MAE | MAPE | RMSE | R2 | ||
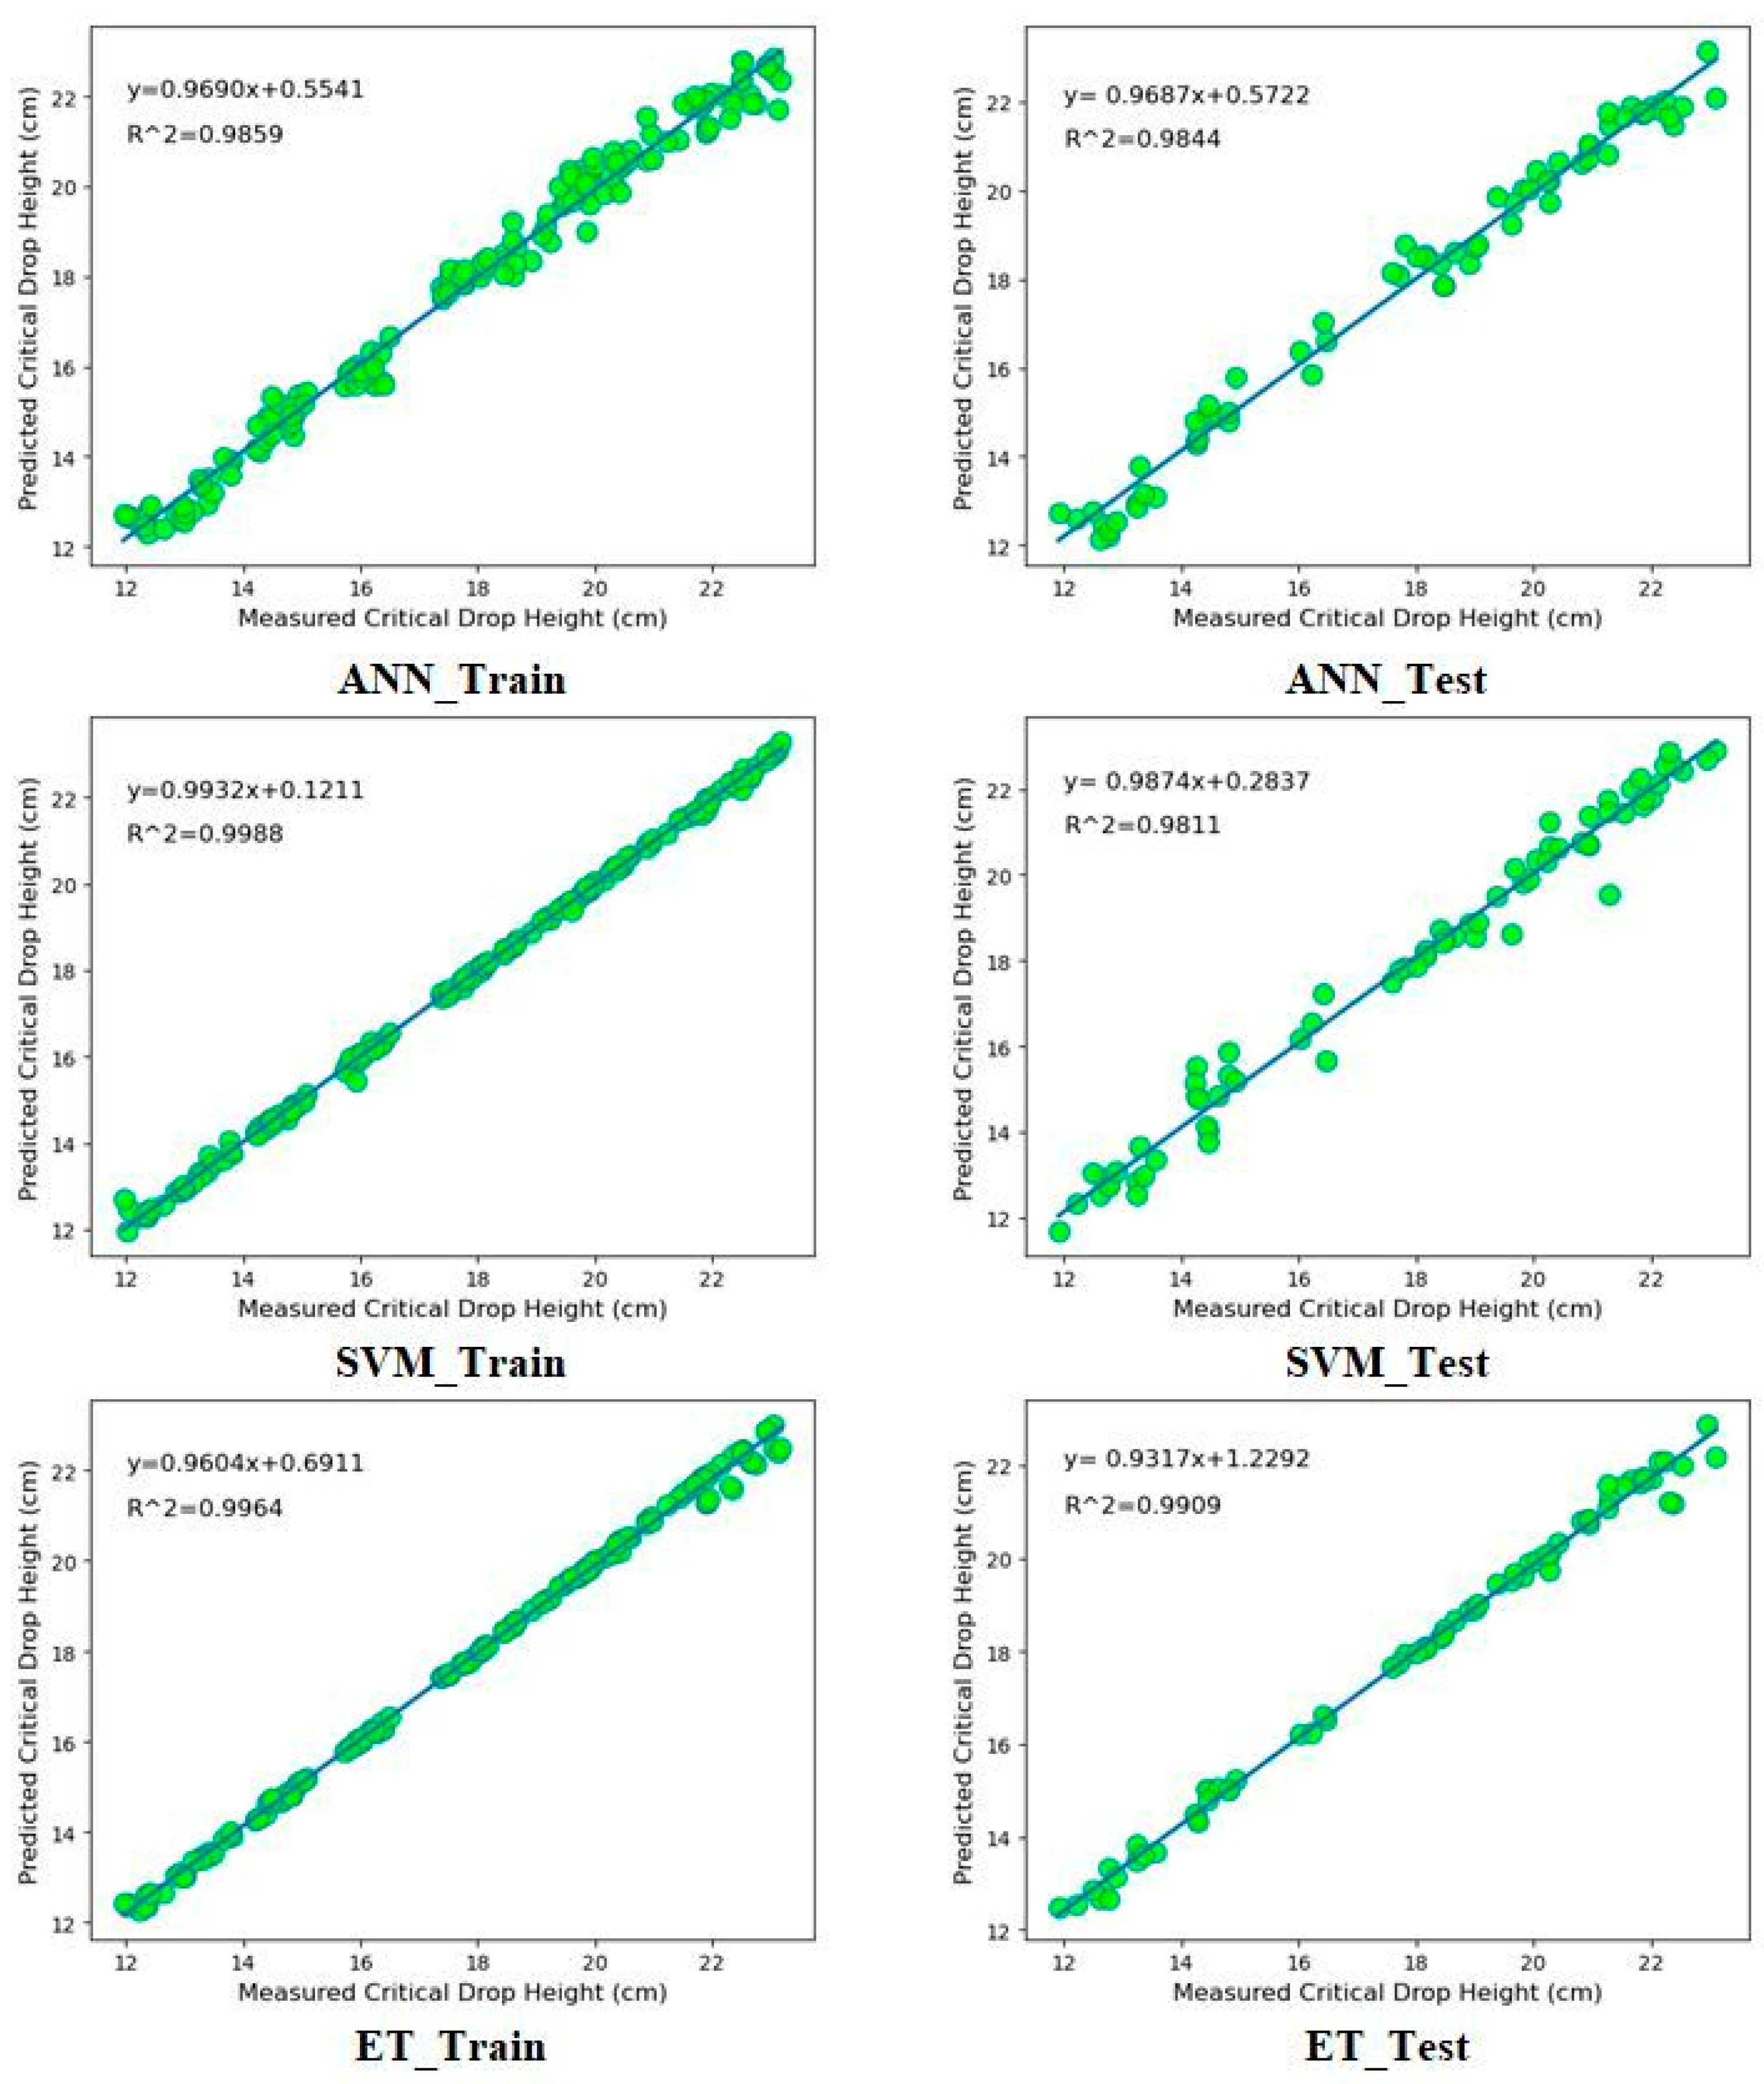
| ANN | Training | 0.3012 | 0.0172 | 0.3845 | 0.9859 |
| Testing | 0.3491 | 0.0207 | 0.4247 | 0.9844 | |
| SVM | Training | 0.0720 | 0.0044 | 0.1107 | 0.9988 |
| Testing | 0.3356 | 0.0200 | 0.4678 | 0.9811 | |
| ET | Training | 0.1081 | 0.0062 | 0.1947 | 0.9964 |
| Testing | 0.2194 | 0.0132 | 0.3248 | 0.9909 | |
Disclaimer/Publisher’s Note: The statements, opinions and data contained in all publications are solely those of the individual author(s) and contributor(s) and not of MDPI and/or the editor(s). MDPI and/or the editor(s) disclaim responsibility for any injury to people or property resulting from any ideas, methods, instructions or products referred to in the content. |
© 2024 by the authors. Licensee MDPI, Basel, Switzerland. This article is an open access article distributed under the terms and conditions of the Creative Commons Attribution (CC BY) license (https://creativecommons.org/licenses/by/4.0/).
Share and Cite
Kabas, O.; Ercan, U.; Moiceanu, G. Critical Drop Height Prediction of Loquat Fruit Based on Some Engineering Properties with Machine Learning Approach. Agronomy 2024, 14, 1523. https://doi.org/10.3390/agronomy14071523
Kabas O, Ercan U, Moiceanu G. Critical Drop Height Prediction of Loquat Fruit Based on Some Engineering Properties with Machine Learning Approach. Agronomy. 2024; 14(7):1523. https://doi.org/10.3390/agronomy14071523
Chicago/Turabian StyleKabas, Onder, Uğur Ercan, and Georgiana Moiceanu. 2024. "Critical Drop Height Prediction of Loquat Fruit Based on Some Engineering Properties with Machine Learning Approach" Agronomy 14, no. 7: 1523. https://doi.org/10.3390/agronomy14071523
APA StyleKabas, O., Ercan, U., & Moiceanu, G. (2024). Critical Drop Height Prediction of Loquat Fruit Based on Some Engineering Properties with Machine Learning Approach. Agronomy, 14(7), 1523. https://doi.org/10.3390/agronomy14071523