Article

Effects of Drought at Anthesis on Flag Leaf Physiology and Gene Expression in Diverse Wheat (Triticum aestivum L.) Genotypes

1
Department for Breeding & Genetics of Small Cereal Crops, Agricultural Institute Osijek, Juzno Predgradje 17, 31000 Osijek, Croatia
2
Faculty of Agriculture, University of Zagreb, Svetosimunska Cesta 25, 10000 Zagreb, Croatia
3
Department of Biology, Josip Juraj Strossmayer University of Osijek, Cara Hadrijana 8a, 31000 Osijek, Croatia
*
Author to whom correspondence should be addressed.
Agronomy 2024, 14(7), 1522; https://doi.org/10.3390/agronomy14071522
Submission received: 5 June 2024 / Revised: 2 July 2024 / Accepted: 9 July 2024 / Published: 12 July 2024

Abstract

:
The current study aimed to quantify the effects of two drought intensities achieved by deprivation of watering for 45 and 65% of the volumetric soil moisture content (VSMC) for 14 days after wheat anthesis to identify physio-biochemical and molecular changes associated with drought tolerance in six genotypes with different drought tolerance. Drought at 65% of VSMC induced a significant decrease in the chlorophyll a content in the drought-sensitive genotype, which indicated a strong loss of photosynthetic reaction centres. Further, in the drought-tolerant genotype, the content of carotenoids, which could play a vital role in resisting water shortage stress, tended to increase. The increased production of malondialdehyde showed that the antioxidant system in the drought-sensitive genotypes was not properly activated. A significant decrease in catalase (CAT; EC 1.11.1.6) was observed at a 45% reduction in VSMC, compared to the control, in the drought-sensitive genotype, and at a reduction in VSMC of 65%, in all medium sensitive genotypes. Further, the drought-tolerant and -medium tolerant genotypes responded to drought with a decline in total glutathione concentrations with the intention to reinforce their defence system. Thereby, dehydroascorbate reductase (DHAR; EC 1.8.5.1), monodehydroascorbate reductase (MDHAR; EC 1.6.5.4), and glutathione reductase (GR; EC 1.6.4.2) were critical enzymes involved in the ascorbate–glutathione cycle together with CAT, showing their main role in the detoxification of ROS produced with the reduction in VSMC by 65%. The results of gene expression analysis showed that severe drought increased the levels of the DHN5 and WZY2 genes (that were significantly positively correlated) in the drought-tolerant genotype, whose grain weight, area, and length did not change in maturity. Also, it was seen that DHN5 expression showed a significant positive correlation with grain length and proline content at a 45% reduction in VSMC. The identification of different mechanisms under drought can contribute to the selection of drought-tolerant genotypes.

1. Introduction

Wheat (Triticum aestivum L.) is the basic food for an estimated 35% of the population, with a global production of 700 million tons [1]. Also, wheat is one of the four major crops grown worldwide, and drastic environmental and climatic changes dramatically influence grain yields [2]. Among stresses, drought is a major abiotic stress limiting wheat productivity worldwide and resulting in grain yield losses of up to 86% [3]. The fact is that climate change has altered the average amount of precipitation on land, which has increased the frequency of droughts [4]. Drought is also characterized by a reduction in water in the atmosphere and soil, which causes wastage of water transpiration and evaporation [5]. Hence, global food security is threatened by drought events that are declared a major stress on crop production, due to the low amount of precipitation and high temperatures associated with them [6]. Therefore, to satisfy the needs of the world’s fast-increasing population and to ensure food security, wheat production must double by 2050 [7]. In the current context of both climate changes and increasing population over the globe, the main challenge for breeders is to enlarge the wheat yields.
During the growing season, wheat plants are under the influence of many biotic or abiotic stresses, each affecting the development of plants. As a consequence, severe morphological, biochemical, and physiological changes might occur in wheat plants. Drought affects all growing stages of wheat causing a delay in the germination of seeds, tillering, booting, heading, anthesis, grain filling, and maturity [8]. Hence, it has a negative impact on physio-morphological traits such as shoot and root length, relative water content, photosynthesis activity, and leaf area in wheat plants [9]. It was previously reported that the most sensitive periods to drought are the anthesis and grain filling stages when the highest grain yield losses are expected [10]. It was described that the initiation of flowering and inflorescence are badly affected by drought [11]. Thus, the reduction in grain yield may vary from 1% to 30% during mild drought in the post-anthesis stage or even reach 92% in the case of prolonged mild drought in the anthesis stage and during grain formation. Finally, a water deficit can negatively affect plant growth and development by modifying different agro-physiological and biochemical processes and pathways [12]. However, plants can cope with drought by different mechanisms: (i) by finishing the life cycle before the occurrence of severe drought; (ii) through water-conserving mechanisms such as the closure of stomata and a reduction in leaf area; (iii) through osmotic adjustment and increased cell wall elasticity; (iv) through increased antioxidant metabolism [13]. Drought influences photosynthesis due to limitations in the CO2 influx, resulting in damage to chloroplast and chlorophyll structure, thylakoid membrane, and photosystem II and in the disruption of electron transport. Also, the earliest affected process under drought is photosynthesis [14]. The first modification that occurs in wheat tissue during drought events is the closure of the stomata as a result of other processes, such as a reduced water content in guard cells [15]. The activity of Rubisco is also disturbed, resulting in reduced photosynthesis rate [16]. Further, the rate of photorespiration increases dramatically, causing the production of reactive oxygen species (ROS) and lipid peroxidation [17]. Mitochondria are the most important sources of ROS, such as superoxide and hydrogen peroxide (H2O2), and ROS-scavenging systems try to eliminate them [18]. After ROS production, an increase in the expression of genes encoding antioxidants will start, leading to the intensification of the antioxidative system activity. ROS can be eliminated by both enzymatic and non-enzymatic antioxidative defence [19]. Enzymatic defence involves superoxide dismutase (SOD), catalase (CAT), peroxidase (POD), glutathione peroxidase (GPX), glutathione reductase (GR), glutathione S-transferases (GST), ascorbate peroxidase (APX), monodehydroascorbate reductase (MDHAR), and dehydroascorbate reductase (DHAR) [20]. Usually, MDHAR, DHAR, and GR are important in maintaining redox homeostasis under drought [21]. One of the most common non-enzymatic antioxidants is glutathione (GSH), which influences the stability of the redox state in all parts of the plant cell [22]. Further, a non-enzymatic antioxidant defence system includes proline, tocopherol, phenolic compounds, and carotenoids. In the case of genotypic sensitivity to drought, the plant response will fail, resulting in cell damage. It was previously reported that traits associated with drought tolerance include high soluble sugar and chlorophyll content, low gas exchange, increased proline and carbohydrate content, and decreased superoxide dismutase concentration [12]. However, the physiological responses of plants to drought can vary in different stages of plant development, and the responses in the final stages of wheat growth are not very much explored.
As mentioned, the physiological as well as the biochemical responses to drought are controlled by an extensive modification of gene expression [23]. One of the most characterised transcription factor families involved in plant abiotic stress is the apetala2/ethylene-responsive element-binding protein (AP2/EREBP) family including dehydration-responsive element-binding proteins (DREBs), which regulates developmental, physiological, and metabolic processes [5,24]. The DREB subfamily can influence the expression of multiple dehydration-regulated (DRE)/C-repeat element (CRT) genes through their dehydration- or cold-regulated (RD/COR) gene promoters, which respond to drought and low temperatures [25,26]. It was shown that in wheat, many genes encoding different DREB transcription factors are regulated under drought, thereby improving tolerance to drought [27,28,29]. According to research by Abedini et al. [30], the accumulation of dehydrin transcripts or proteins was positively correlated with drought tolerance. Several studies reported that overexpression of the dehydrin gene DHN5 resulted in tolerance to osmotic and salt stress in Arabidopsis plants as a consequence of the regulation of proline content and improved antioxidative response [31,32], while the dehydrin gene WZY2 may have a main role in the signalling pathway of ABA through interaction with 2C protein phosphatases, influencing the expression of stress-responsive genes in wheat [28]. It was previously observed that proline accumulation is the cause of increased osmotic stress tolerance in wheat [33]. Therefore, the expression of the P5CS gene encoding the enzyme pyrroline-5-carboxylate synthase (P5CS) in wheat was enhanced under osmotic stress in positive correlation with the proline content [33]. Also, it was observed that in drought, the overexpression of the P5CS gene in wheat transgenic plants resulted in increased stress tolerance [34].
The traditional drought tolerance assessments are largely based on determining survival rates, yield, and other growth indicators, with less attention given to physiological and cellular-level oxidative stress responses, such as chlorophyll content, malondialdehyde (MDA) levels, proline content, and changes in the antioxidant enzyme system. These enzymes, including SOD, CAT, and APX, play crucial roles in regulating plant adaptation to drought. The existing standards may not fully consider these biochemical parameters, potentially overlooking the link between plant antioxidant capacity and drought tolerance.
Furthermore, the choice of flag leaves as the study subject and the initiation of measurements 14 days post-anthesis is due to the significant role of flag leaves in photosynthesis and biomass accumulation in wheat, directly affecting grain weight and yield. The two weeks post-anthesis represent a critical period in wheat development, during which drought can directly impact the grain yield. Given this, the current study aims to develop a new set of evaluation standards that consider both enzymatic and non-enzymatic physiological indicators to more comprehensively assess the drought tolerance of wheat genotypes. By systematically analysing the activity of antioxidant enzymes and key physiological indicators in flag leaves, we hope to reveal the intrinsic connections between these parameters and wheat drought tolerance, providing more precise selection criteria for breeding work.

2. Materials and Methods

2.1. Plant Material and Experimental Layout

In the current study, six winter wheat genotypes (Bubnjar, Pepeljuga, Anđelka, Rujana, Fifi, and Silvija) from the Agriculture Institute Osijek were investigated at different levels of drought in the anthesis stage. These genotypes were previously characterised in the study of Duvnjak et al. [8] and sorted according to their drought tolerance (Table 1). After the germination stage, seedlings of each wheat genotype were moved in a plant growth chamber for a period of vernalisation of six weeks under conditions of 12 hours of day/12 hours of night (4/3 °C). After vernalisation, the plants were moved into a greenhouse (Gis Impro d.o.o., Vrbovec, Croatia). Each genotype was subjected to three treatments: a control treatment (C) with regular irrigation and two drought treatments at different intensities (T1 and T2). In the control treatment (C), the volumetric soil moisture content (VSMC) was maintained at 30–35%, while in the drought treatments, the water content was reduced by 45% (T1) and 65% (T2). The measurement of VSMC was carried out daily by a soil moisture measuring device (TDR 150 Soil Moisture Meter, Spectrum Technologies, Aurora, IL, USA). After simulating drought during two weeks, the flag leaves of the plants were sampled, frozen in liquid nitrogen, and stored at −80 °C. Prior to extraction for further analyses, the flag leaves were ground in 10 mL stainless steel jars together with a grinding ball for 1 min at 30 Hz in a TissueLyser II bead mill (Qiagen, Hilden, Germany).

2.2. Determination of the Photosynthetic Pigments

The photosynthetic pigments were determined by a method described by Lichtenthaler [35]. The mass of sample for pigment analysis was 0.01 g. The lyophilized wheat flag leave tissue powder obtained after grinding was homogenised in absolute acetone. Further, extraction was carried out for 15 min at 4 °C and centrifugation for 15 min at 16,000× g and 4 °C. This procedure was repeated until the plant material was uncoloured. The absorption of the extracted material was measured spectrophotometrically at 470, 645, and 662 nm, and the photosynthetic pigment concentrations are reported as mg g−1 DW.

2.3. Determination of Malondialdehyde (MDA)

The malondialdehyde (MDA) content was measured using thiobarbituric acid (TBA) [36]. The procedure was based on the production of a red colouration from lipid peroxidation breakdown products with TBA. Frozen flag leaf tissue powder (0.2 g) was homogenised in a 0.1% trichloroacetic acid (TCA) solution (1/5, w/v) and centrifugated at 10,000× g for 10 min at 4 °C. The incubation of the reaction mixture that consisted of 0.5 mL of tissue extract and 1 mL of reagent (0.5% TBA in 20% TCA) was carried out for 30 min at 95 °C on a TS-100 Thermo-Shaker (Biosan, Riga, Latvia). The reaction mixture was cooled in an ice bath, and the red colouration was measured at 532 and 600 nm on a LAMBDA 25 UV-Vis equipped with UV WinLab v6.0.4 software package (PerkinElmer, Waltham, MA, USA). The results were calculated as nmol g−1 FW.

2.4. Determination of the Proline Content

The proline content was evaluated according to the method described by Carillo et al. [37]. To extract proline, 0.03 g of lyophilized tissue powder incubated in 40% ethanol overnight at 4 °C was used. The homogenate was centrifuged at 14,000× g for 5 min at 4 °C after cold extraction. Incubation of an aliquot of extract (50 μL) with 0.1 mL of ninhydrin reagent (1% (w/v) in 60% (v/v) acetic acid and 20% ethanol (v/v)) was performed at 95 °C for 20 min on a TS-100 Thermo-Shaker (Biosan, Riga, Latvia). Then, 100 μL of the reaction mixture was transferred to a microplate after cooling for 5 min and a brief centrifugation at 2500× g for 1 min at 4 °C. The absorbance was measured at 520 nm and 25 °C using a Spark multimode microplate reader with SparkControl software (Tecan, Männedorf, Switzerland). The proline content was measured using a proline standard curve and is expressed in nmol mg−1 DW.

2.5. Determination of the Glutathione Content

The total glutathione (tGSH) content was calculated by a modified microplate assay using a kinetic method based on the continuous reduction of 5,5-dithiobis (2-nitrobenzoic acid) (DTNB) to 5-thio-2-nitrobenzoic acid (TNB) by reduced glutathione (GSH), where NADPH reduces GSSG in the presence of GR [38]. Greiner UV Star 96-well plates on a Spark multimode microplate reader were used for the measurements. For tGSH content determination, frozen flag leaf tissue powder was homogenised in a 5% 5-sulfosalicylic acid solution (1/10, w/v) and centrifuged for 10 min at 16,000× g and 4 °C. The subsequent reaction mixture consisted of 10 μL of the resulting supernatant, 0.03 mg mL−1 of DTNB, 0.12 U mL−1 of GR, 1 mM EDTA, and 100 mM phosphate buffer (pH 7.0). Incubation was performed for 5 min at room temperature, and after that, the addition of NADPH initiated the reaction. For 5 min every 15 s, the formation of TNB was measured at 412 nm and 25 °C. The final amount of tGSH was calculated using a standard curve of GSH and is expressed as nmol g−1 FW.

2.6. Antioxidant Enzyme Activity Determination

Homogenisation of flag leaf tissue powder obtained by grounding the leaves in cold 100 mM phosphate buffer (pH 7.0) containing 1 mM EDTA (1/5, w/v) was performed. The homogenates were moved onto ice for 15 min and centrifuged at 19,000× g for 15 min at 4 °C. The supernatants were stored at −80 °C until further analysis. Then, 96-well plates were used for the measurement of enzyme activities with a Spark Multimode microplate reader with SparkControl software version 2.1 (Tecan, Männedorf, Switzerland). Bovine serum albumin was used as a protein standard for the determination of protein concentration in the enzyme extracts by the Bradford method [39] modified for microplate assay analysis. Incubation was performed with the Bradford reagent (Sigma-Aldrich, Steinheim, Germany) for 5 min at room temperature. After the incubation was finished, a Spark multimode microplate reader was used for the measurement of the intensity of the resulting blue colour at 595 nm.
For the measurement of ascorbate peroxidase (APX, EC 1.11.1.11) activity [40], the reaction mixture consisted of the enzyme extracts (10 μL), 0.7 mM ascorbic acid, 5 mM H2O2, and 0.1 mM EDTA in 50 mM potassium phosphate buffer (pH 7.0). Incubation was performed for 3 min at room temperature, after which, the decrease in absorbance was monitored at 290 nm for 3 min every 15 s. APX activity was measured using a molar extinction coefficient (ε = 1.71 mM cm−1) and is expressed in U mg −1 protein.
For catalase (CAT, EC 1.11.1.6) activity [41], the reaction mixture consisted of 0.036% H2O2 in 50 mM phosphate buffer pH (7.0), while the reaction started with the addition of 10 μL of diluted protein extract. The decrease in absorbance was measured at 240 nm for 3 min every 15 s. CAT activity was measured using the molar extinction coefficient (ε = 0.04 mM cm−1) and is expressed as U mg−1 protein.
Glutathione S-transferase (GST, EC 2.5.1.18) activity was measured based on the formation of glutathione-2,4-dinitrobenzene due to the conjugation of 1-chloro-2,4-dinitrobenzene (CDNB) with GSH [42]. The reaction mixture consisted of 1 mM GSH, 2 mM CDNB, 1 mM EDTA, and 10 μL of protein extract in 100 mM phosphate buffer (pH 6.5). The increase in absorbance was recorded at 340 nm for 3 min every 15 s. GST activity was measured using the molar extinction coefficient (ε = 5.71 mM cm−1) and is expressed as U g−1 protein.
To determine dehydroascorbate reductase (DHAR, EC 1.8.5.1) activity, the method described by Ma and Cheng [43] was used, after modification for microplate assay [44]. The reaction mixture was composed of 0.1 mM EDTA, 2.5 mM GSH, 0.2 mM dehydroascorbate (DHA), and 10 μL of protein extract in 50 mm HEPES buffer (pH 7.0). The increase in absorbance was measured at 265 nm for 3 min every 15 s. The calculation of DHAR activity was performed using the molar extinction coefficient (ε = 8.33 mM cm−1), and the activity is expressed in U g−1 protein.
The measurement of monodehydroascorbate reductase (MDHAR, EC 1.6.5.4) activity was performed according to [45] with modifications for the microplate assay. The reaction mixture was composed of 2.5 mM ascorbate, 0.5 mM NADH, and 10 μL of protein extract in 50 mM Tris-HCl buffer (pH 7.6). The incubation was performed for 3 min at room temperature, while the reaction was started by the addition of ascorbate oxidase at a final concentration of 0.14 U. The decrease in absorbance was measured at 340 nm for 3 min every 15 s. The calculation of MDHAR activity was performed using the molar extinction coefficient (ε = 3.7 mM cm−1), and the activity is expressed in U g−1 protein.
For the determination of glutathione reductase (GR, EC 1.6.4.2) activity [44,46], the reaction mixture consisted of 50 mM HEPES buffer (pH 8.0), 0.5 mM EDTA, 0.25 mM NADPH, and 10 μL of protein extract. After 10 min of equilibration at room temperature, the reaction was initiated by adding oxidised glutathione (GSSG). The decrease in absorbance was recorded at 340 nm for 5 min every 15 s. GR activity was finally measured by the molar extinction coefficient for NADPH (ε = 3.7 mM cm−1) and is expressed in U g−1 protein.

2.7. Molecular Analysis

2.7.1. RNA Extraction and cDNA Synthesis

RNA was isolated using the NucleoZOL reagent (Macherey-Nagel, Dueren, Germany), according to the manufacturer’s instructions, using 50 mg of frozen wheat flag leaf tissue powder. Further, in the obtained RNA solution, residual DNA was eliminated using rDNase (Macherey-Nagel). For DNA digestion, the rDNase buffer premix (1/10, v/v) was added to the RNA solution, and the mixture was incubated at 37 °C for 10 min. Further, the repurification of RNA was conducted by ethanol precipitation (0.1 volume of 3 M sodium acetate (pH 5.2) and 2.5 volumes of 100% ethanol were added to one sample volume). The incubation of the samples lasted for 2 h at −20 °C, after which, the samples were centrifuged at maximum speed for 10 min. At this point, 70% ethanol was used to wash the RNA pellet, which was then dried and resuspended in RNase-free water. The NanoPhotometer NP-80 (Implen, München, Germany) was used for the estimation of the purity and concentration of RNA.
The synthesis of first-strand cDNA was carried out according to the manufacturer’s instructions from 3 μg of total RNA using the GoTaq® 2-Step RT-qPCR System (Promega, Madison, WI, USA). The RNA template and the Oligo(dT)15 primer premix were denaturized at 70 °C for 5 min, and cDNA was synthesised in a final volume of 20 μL by combining the denatured premix with the reaction mixture (1× GoScript buffer, 2.5 mM MgCl2, 0.5 mM nucleotide mix, 20 U of ribonuclease inhibitor, and 1U of reverse transcriptase). The MiniAmp Plus Thermal PCR Cycler (Applied Biosystems, Waltham, MA, USA) was used for cDNA synthesis (primer annealing for 5 min at 25 °C, extension for 1 h at 42 °C, and enzyme inactivation for 5 min at 70 °C). Prior to being used in the quantitative PCR (qPCR) step, all cDNAs were diluted 5-fold with nuclease-free water.

2.7.2. QPCR Analysis

The StepOnePlus™ Real-Time PCR System with StepOnePlus™ Software v2.3 (Applied Biosystems, Waltham, MA, USA) and the GoTaq® 2-Step RT-qPCR System (Promega) were used for qPCR analysis to analyse the transcript levels of six genes (P5CS, DHN5, WZY2, DREB1, DREB2, and actin). Specific oligonucleotide primers were designed based on sequences in the GeneBank database using Primer3 software (Table 2). All target sequences were amplified in a 25 μL reaction mixture containing 5 μL of five-fold diluted cDNA template, 200 nmol of each primer, 12.5 μL of GoTaq qPCR Master Mix (2×), and 0.25 μL of the CXR reference dye. Amplification was performed with the following cycling program: GoTaq Hot Start Polymerase activation for 2 min at 95 °C, followed by 40 cycles consisting in denaturation for 15 s at 95 °C, primer annealing, and extension for 1 min at 60 °C. For the quantification, three replicates were used, and the expression of each gene was recorded using three biological replicates. A relative standard curve based on five points was used for relative gene expression and normalised using the geometric average of the reference gene actin [47].

2.8. Grain Morphology

After ripening, the grains of the investigated genotypes from sampled ears in each treatment were analysed. The analyses of grain morphology (weight (g), area (Ø), length (mm), width (mm), and circularity (Ø)) were performed with the MARViN seed analyser (MARViTECH GmbH, Wittenburg, Germany). The grain area and circularity represent 2D projection of a grain to an area and a circle.

2.9. Data Analysis

A randomised complete block design was applied in the greenhouse to minimise the effect of the environment. Six and three replications of pooled tissue of the flag leaf samples, each derived from at least six or three different pots with four plants per pot, were used for the biochemical and molecular analyses, respectively, i.e., the data are based on 18 biological replications. For grain morphology analysis, six biological replications provided the mean values for each treatment (C, T1, and T2). Fisher’s Least Significant Difference (LSD) test (α = 0.05) was used to calculate whether the observed difference in performance between treatments for each genotype separately (control plants vs. plants under two drought stresses) was significant (Statsoft Inc., Tulsa, OK, USA). The error bars represent standard deviations. Correlation analyses were performed at p < 0.05 [48].

3. Results

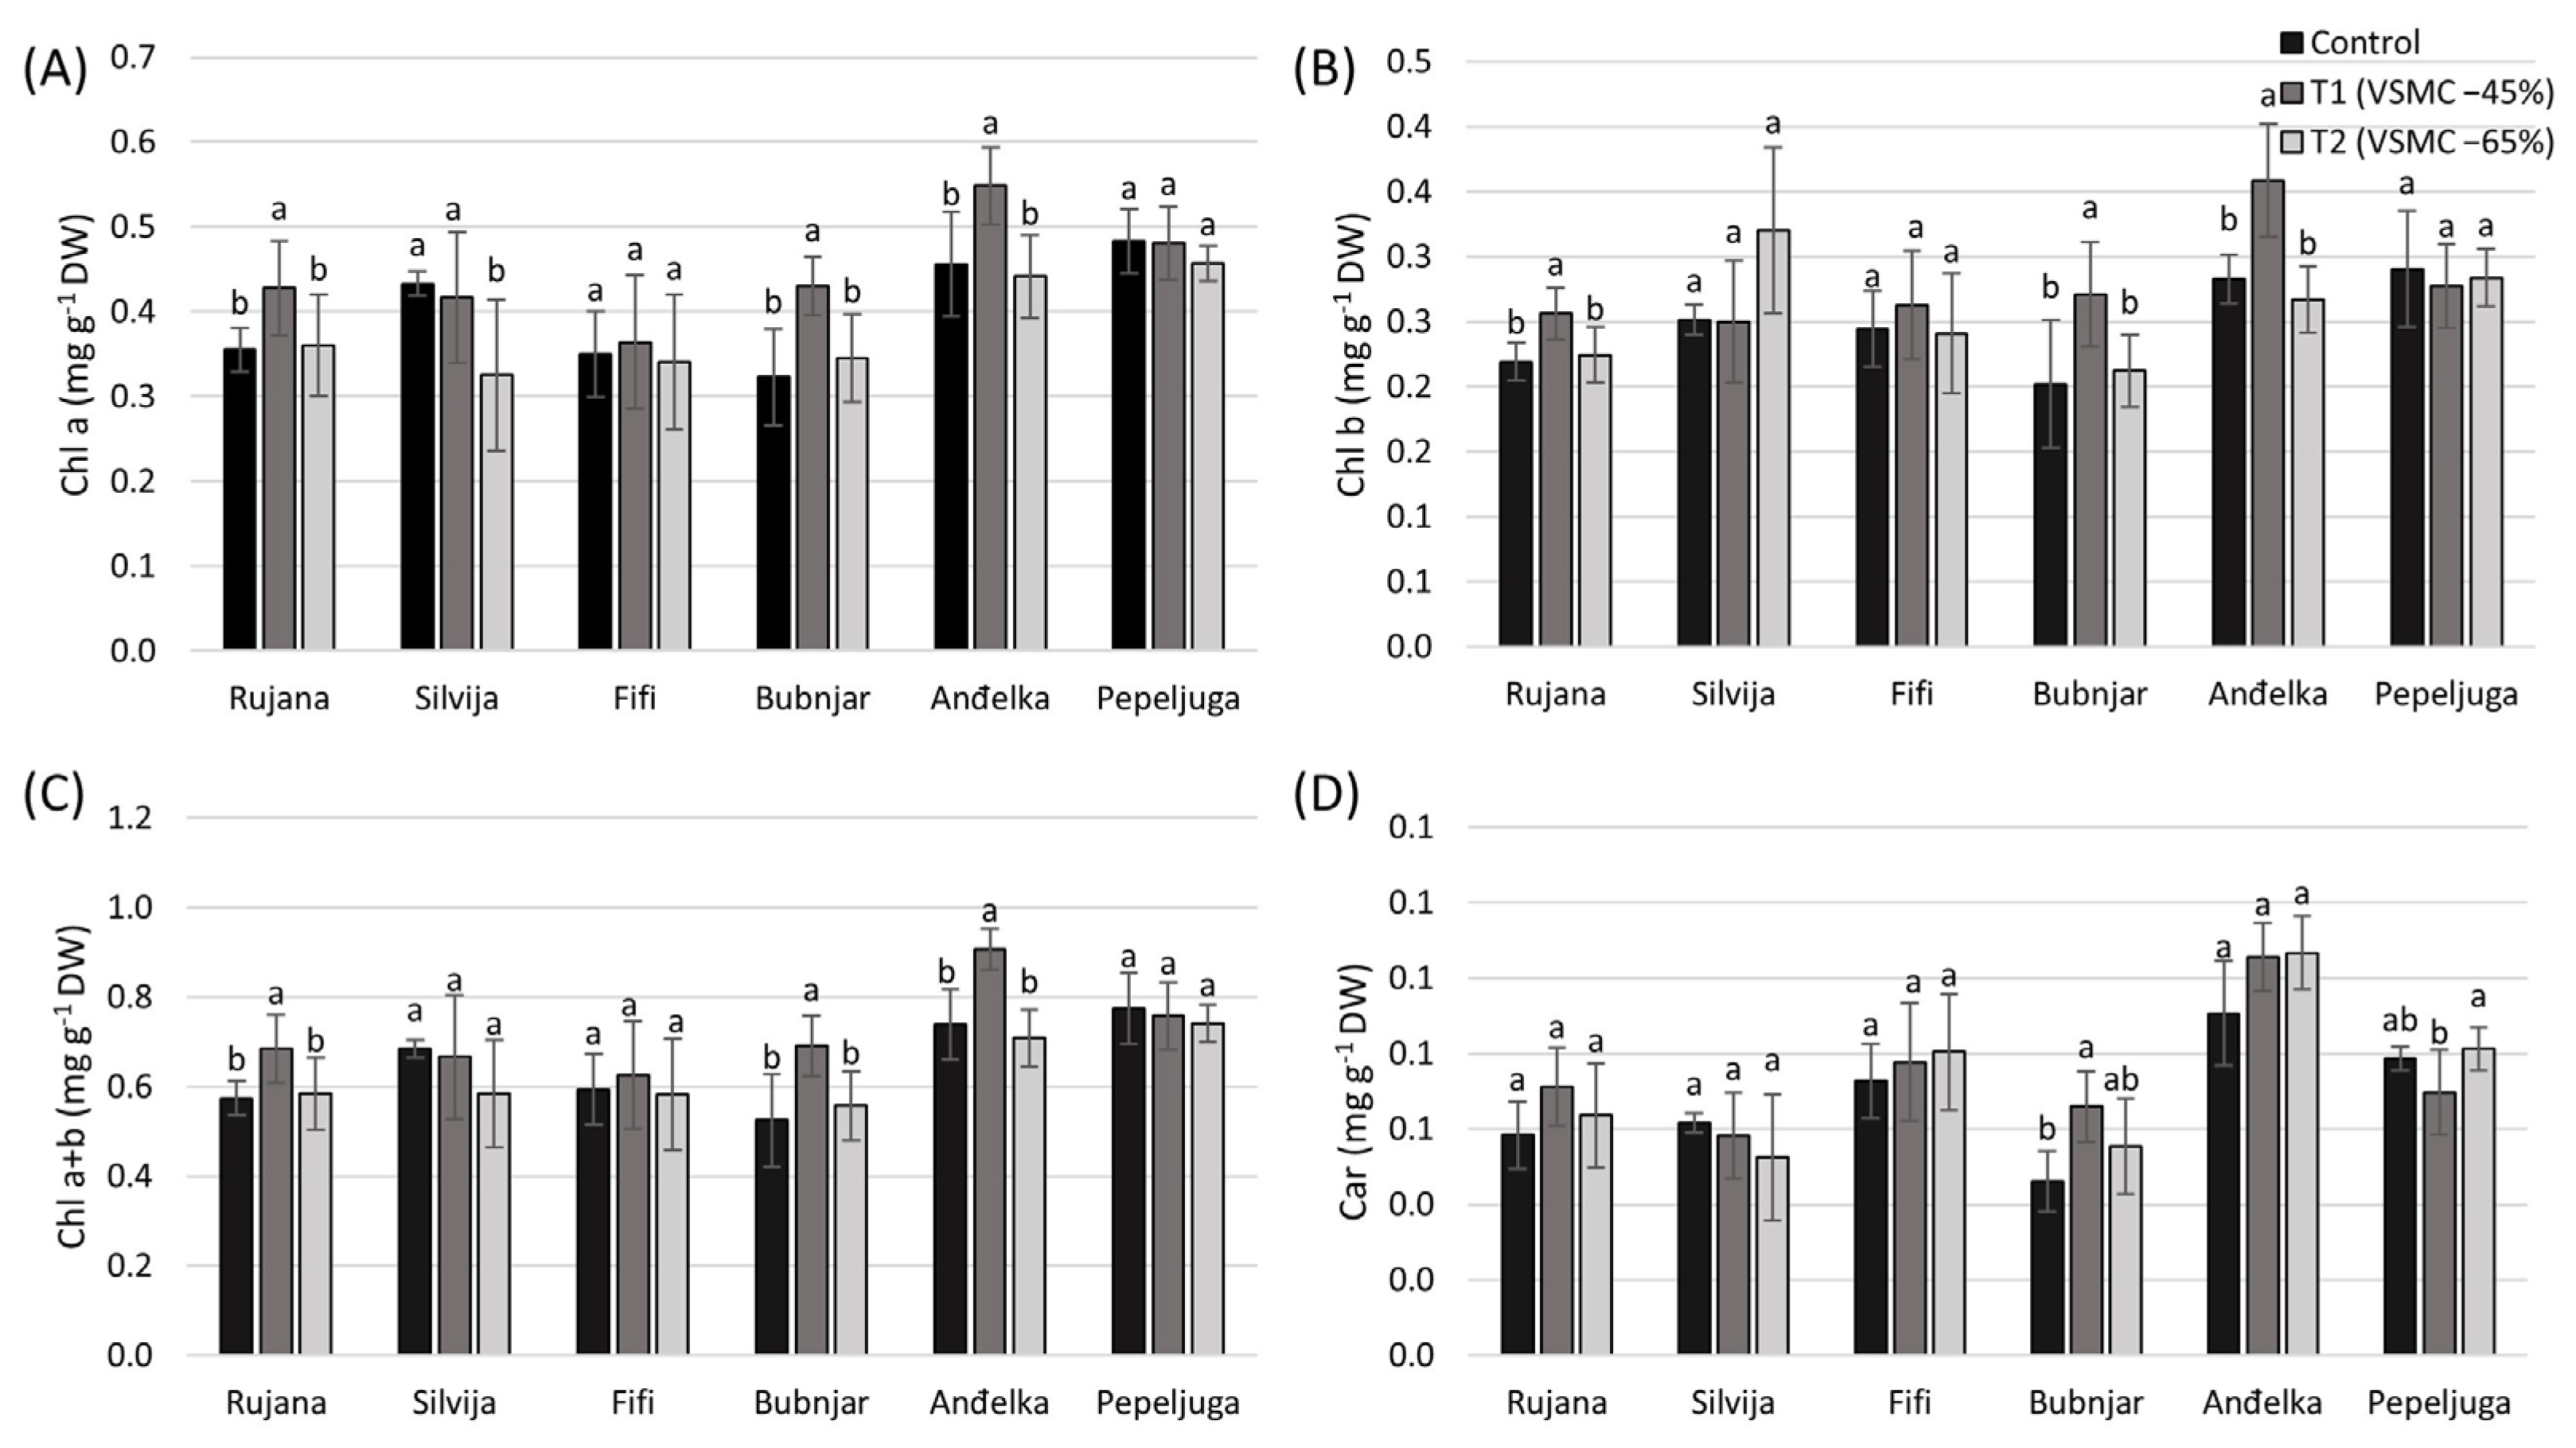
3.1. Content of Chlorophylls and Carotenoids

At a reduction in VSMC of 45%, compared to the control, the genotypes Rujana, Bubnjar, and Anđelka showed significant increases in the content of chlorophyll a (Chl a), chlorophyll b (Chl b), and chlorophyll a + b (Chl a+b), while at the same time, the content of total carotenoids increased by 43% in the flag leaves of Bubnjar (Figure 1A–D). Bubnjar also showed the highest significant increases in Chl a, Chl b, and Chl a+b, corresponding to 33, 34, and 32%, respectively, compared to the other genotypes. The drought-stressed-plants of Silvija at a 65% reduction in VSMC showed a strong decrease in Chl a (25%), compared to the control, while more drought-tolerant and -medium tolerant genotypes reported the same Chl a level as the control.

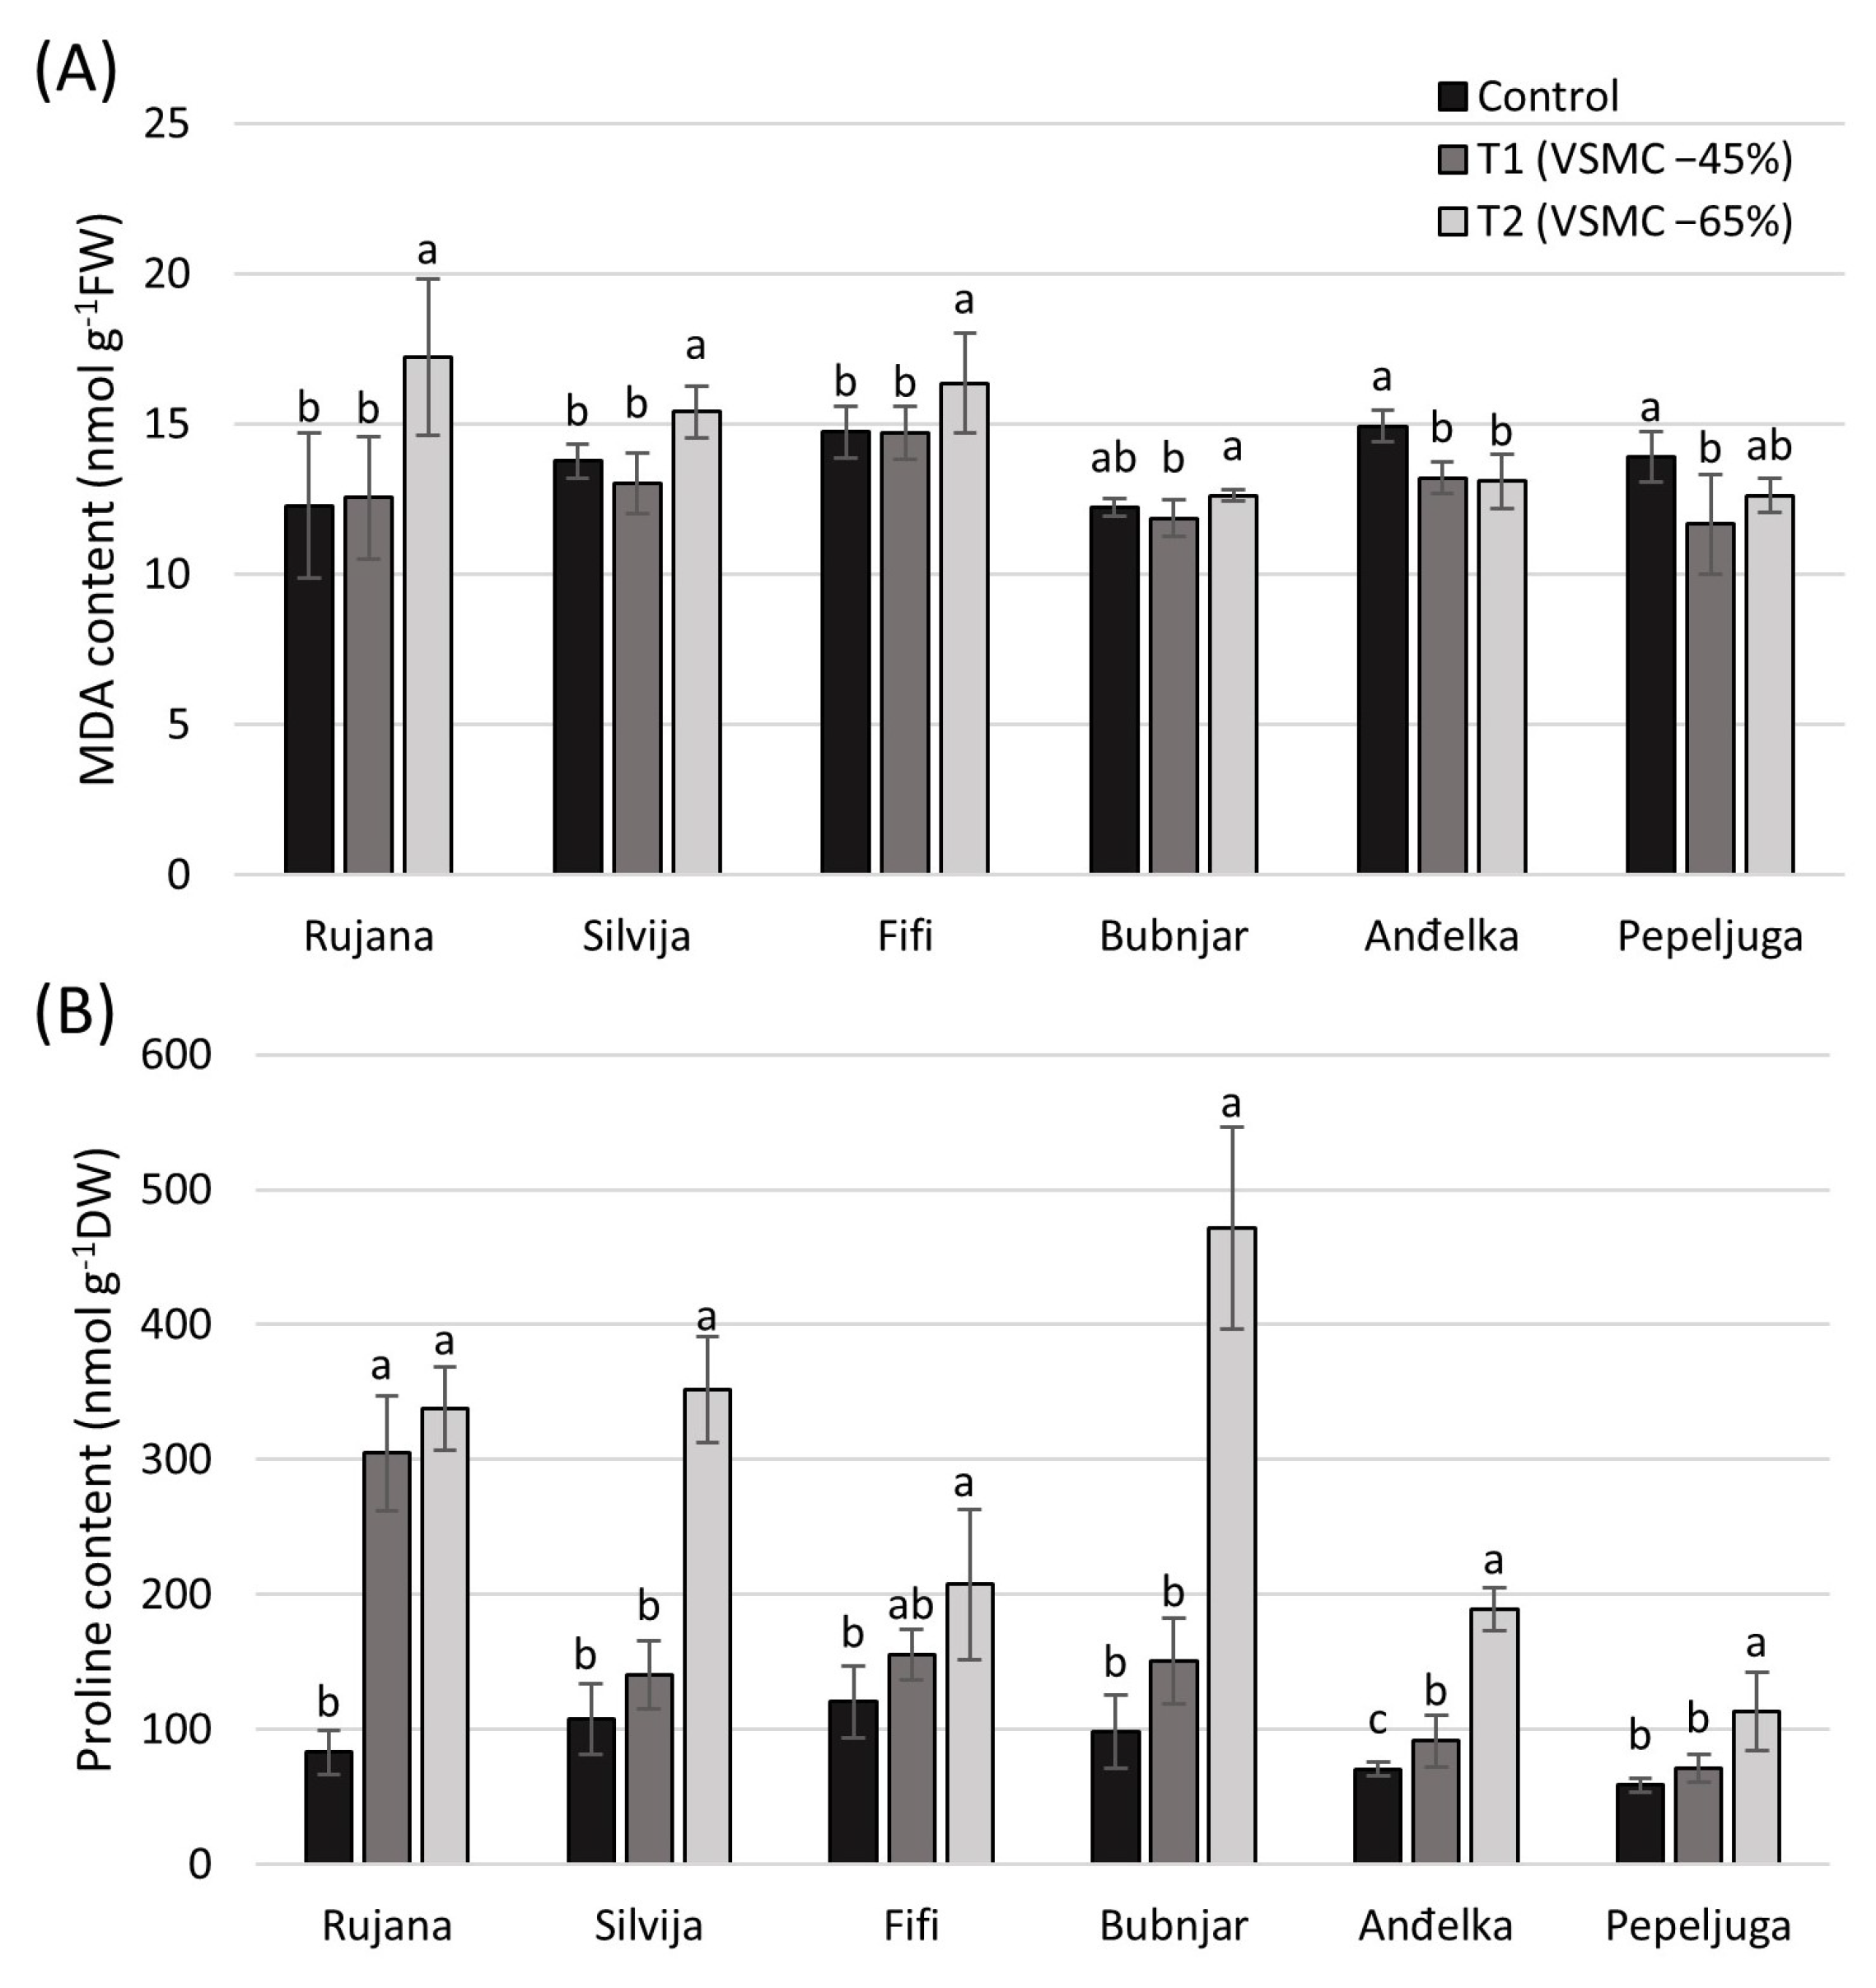
3.2. Content of Malondialdehyde (MDA) and Proline

At a reduction in VSMC of 45%, the MDA content in most genotypes was the same as in the control conditions, while it was significantly reduced in Anđelka and Pepeljuga (Figure 2A). The drought-sensitive and -medium sensitive genotypes showed significantly elevated MDA levels at a reduction in VSMC by 65%, in contrast to the drought-tolerant and -medium tolerant genotypes that showed the same MDA level as the control or a significantly reduced level, as found for Anđelka. The highest significant increase in MDA content was observed in Rujana (40%), followed by Silvija (12%) and Fifi (11%).
The proline content was at the same significant level in the control and at a 45% reduction in VSMC in all genotypes, except for Rujana and Anđelka, in which it significantly increased by 267 and 30%, respectively (Figure 2B). At 65% reduction in VSMC, Bubnjar, Rujana, Silvija, Anđelka, Pepeljuga, and Fifi showed a significantly increased proline content by 378, 306, 227, 168, 93, and 72%, respectively.

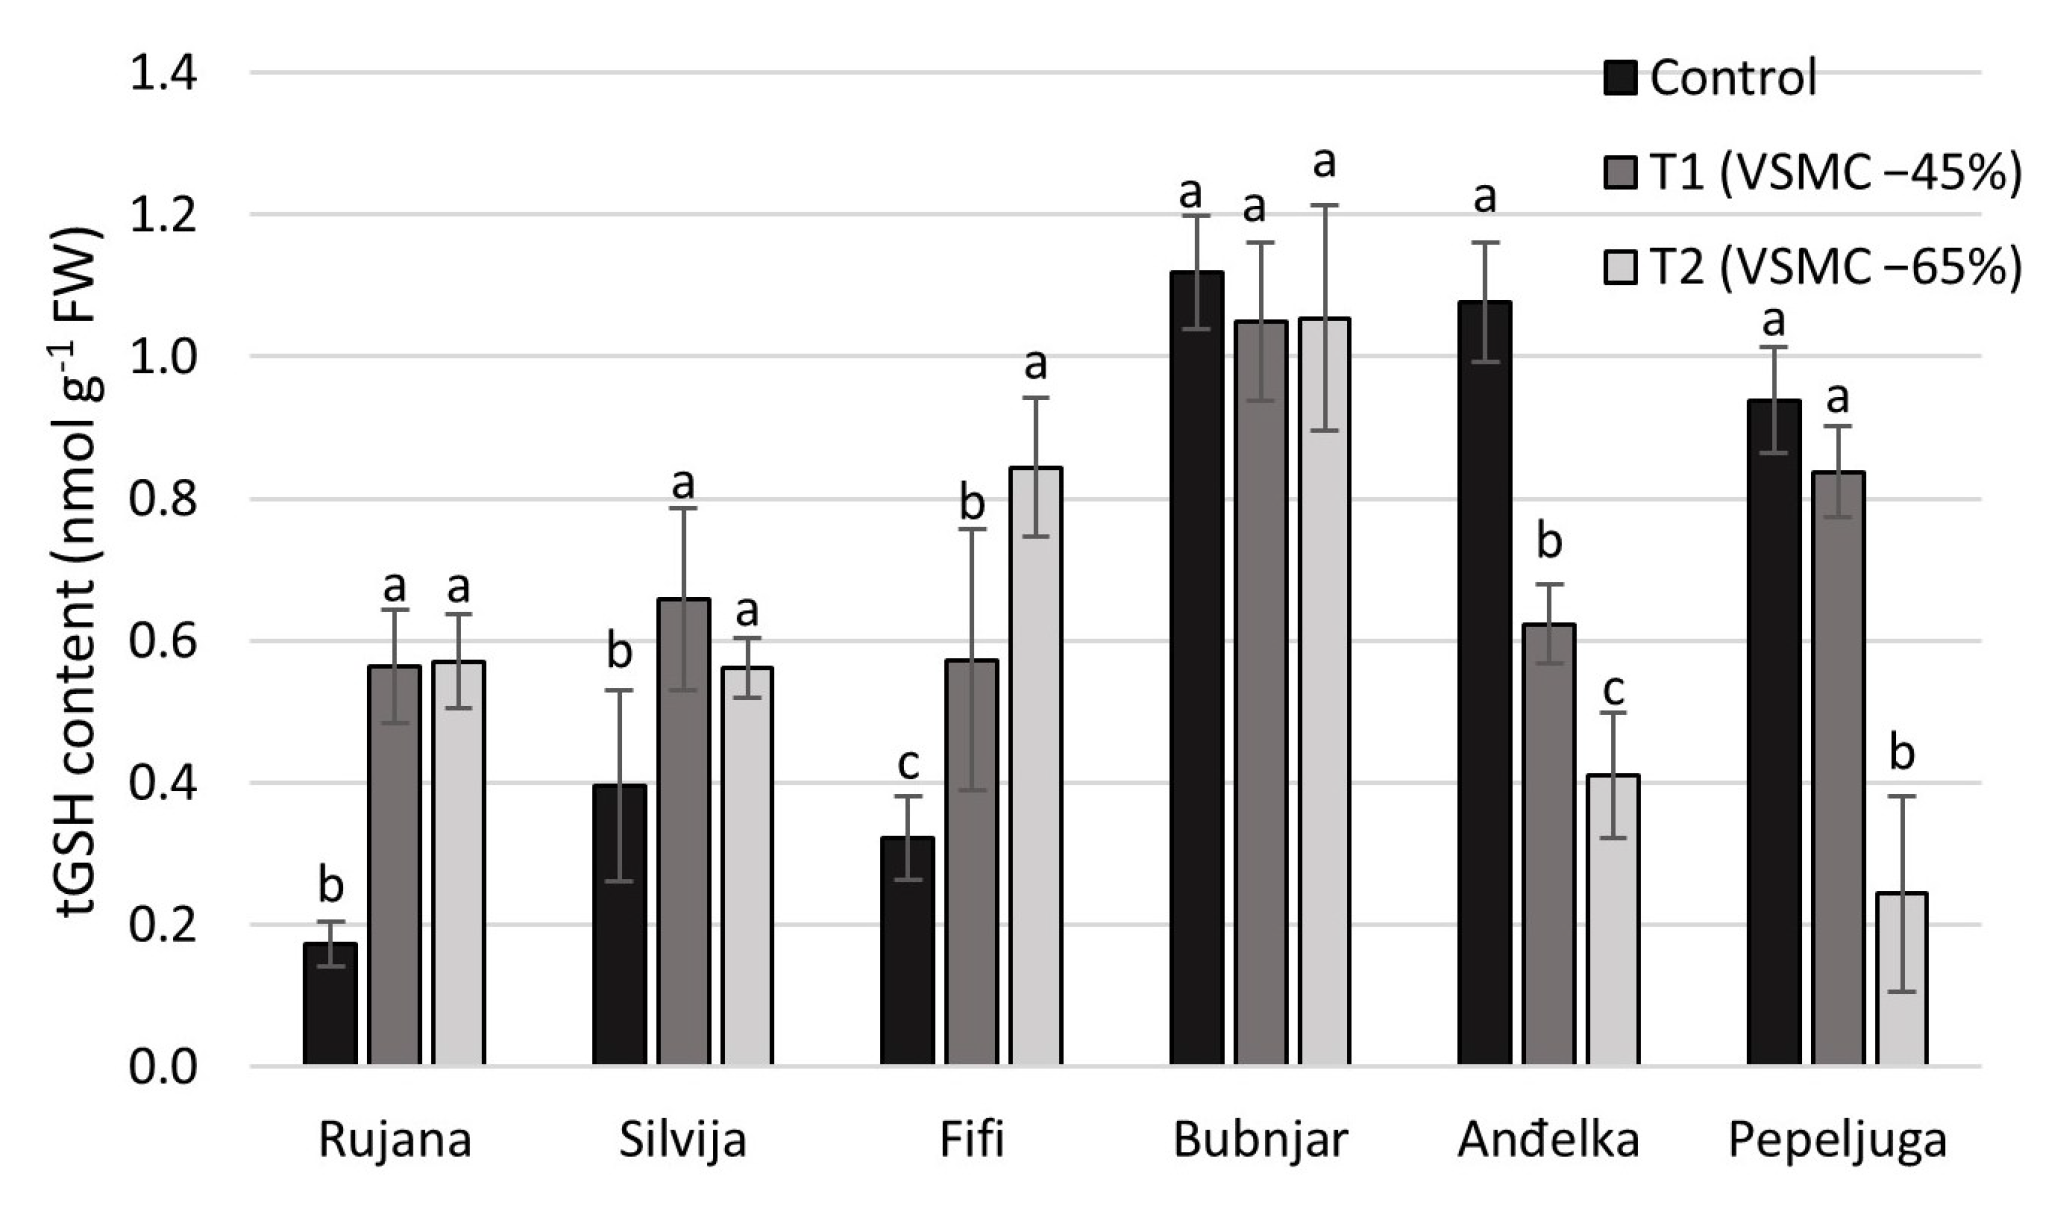
3.3. Content of Total Glutathione (tGSH)

The content of tGSH significantly increased in the drought-sensitive and -medium sensitive genotypes by 226% (Rujana), 78% (Fifi), and 67% (Silvija) at a 45% reduction in VSMC (Figure 3). On the contrary, in the drought-tolerant and -medium tolerant genotypes, the tGSH level significantly decreased, such as by 42% in Anđelka, or remained at the same level, such as in the flag leaves of Bubnjar and Pepeljuga. Further, at a 65% reduction in VSMC, Rujana, Fifi, and Silvija showed significant increases in the tGSH content by 230, 162, and 42%. Pepeljuga and Anđelka reported significantly reductions of 74 and 62%, while in Bubnjar, it remained at the same level.

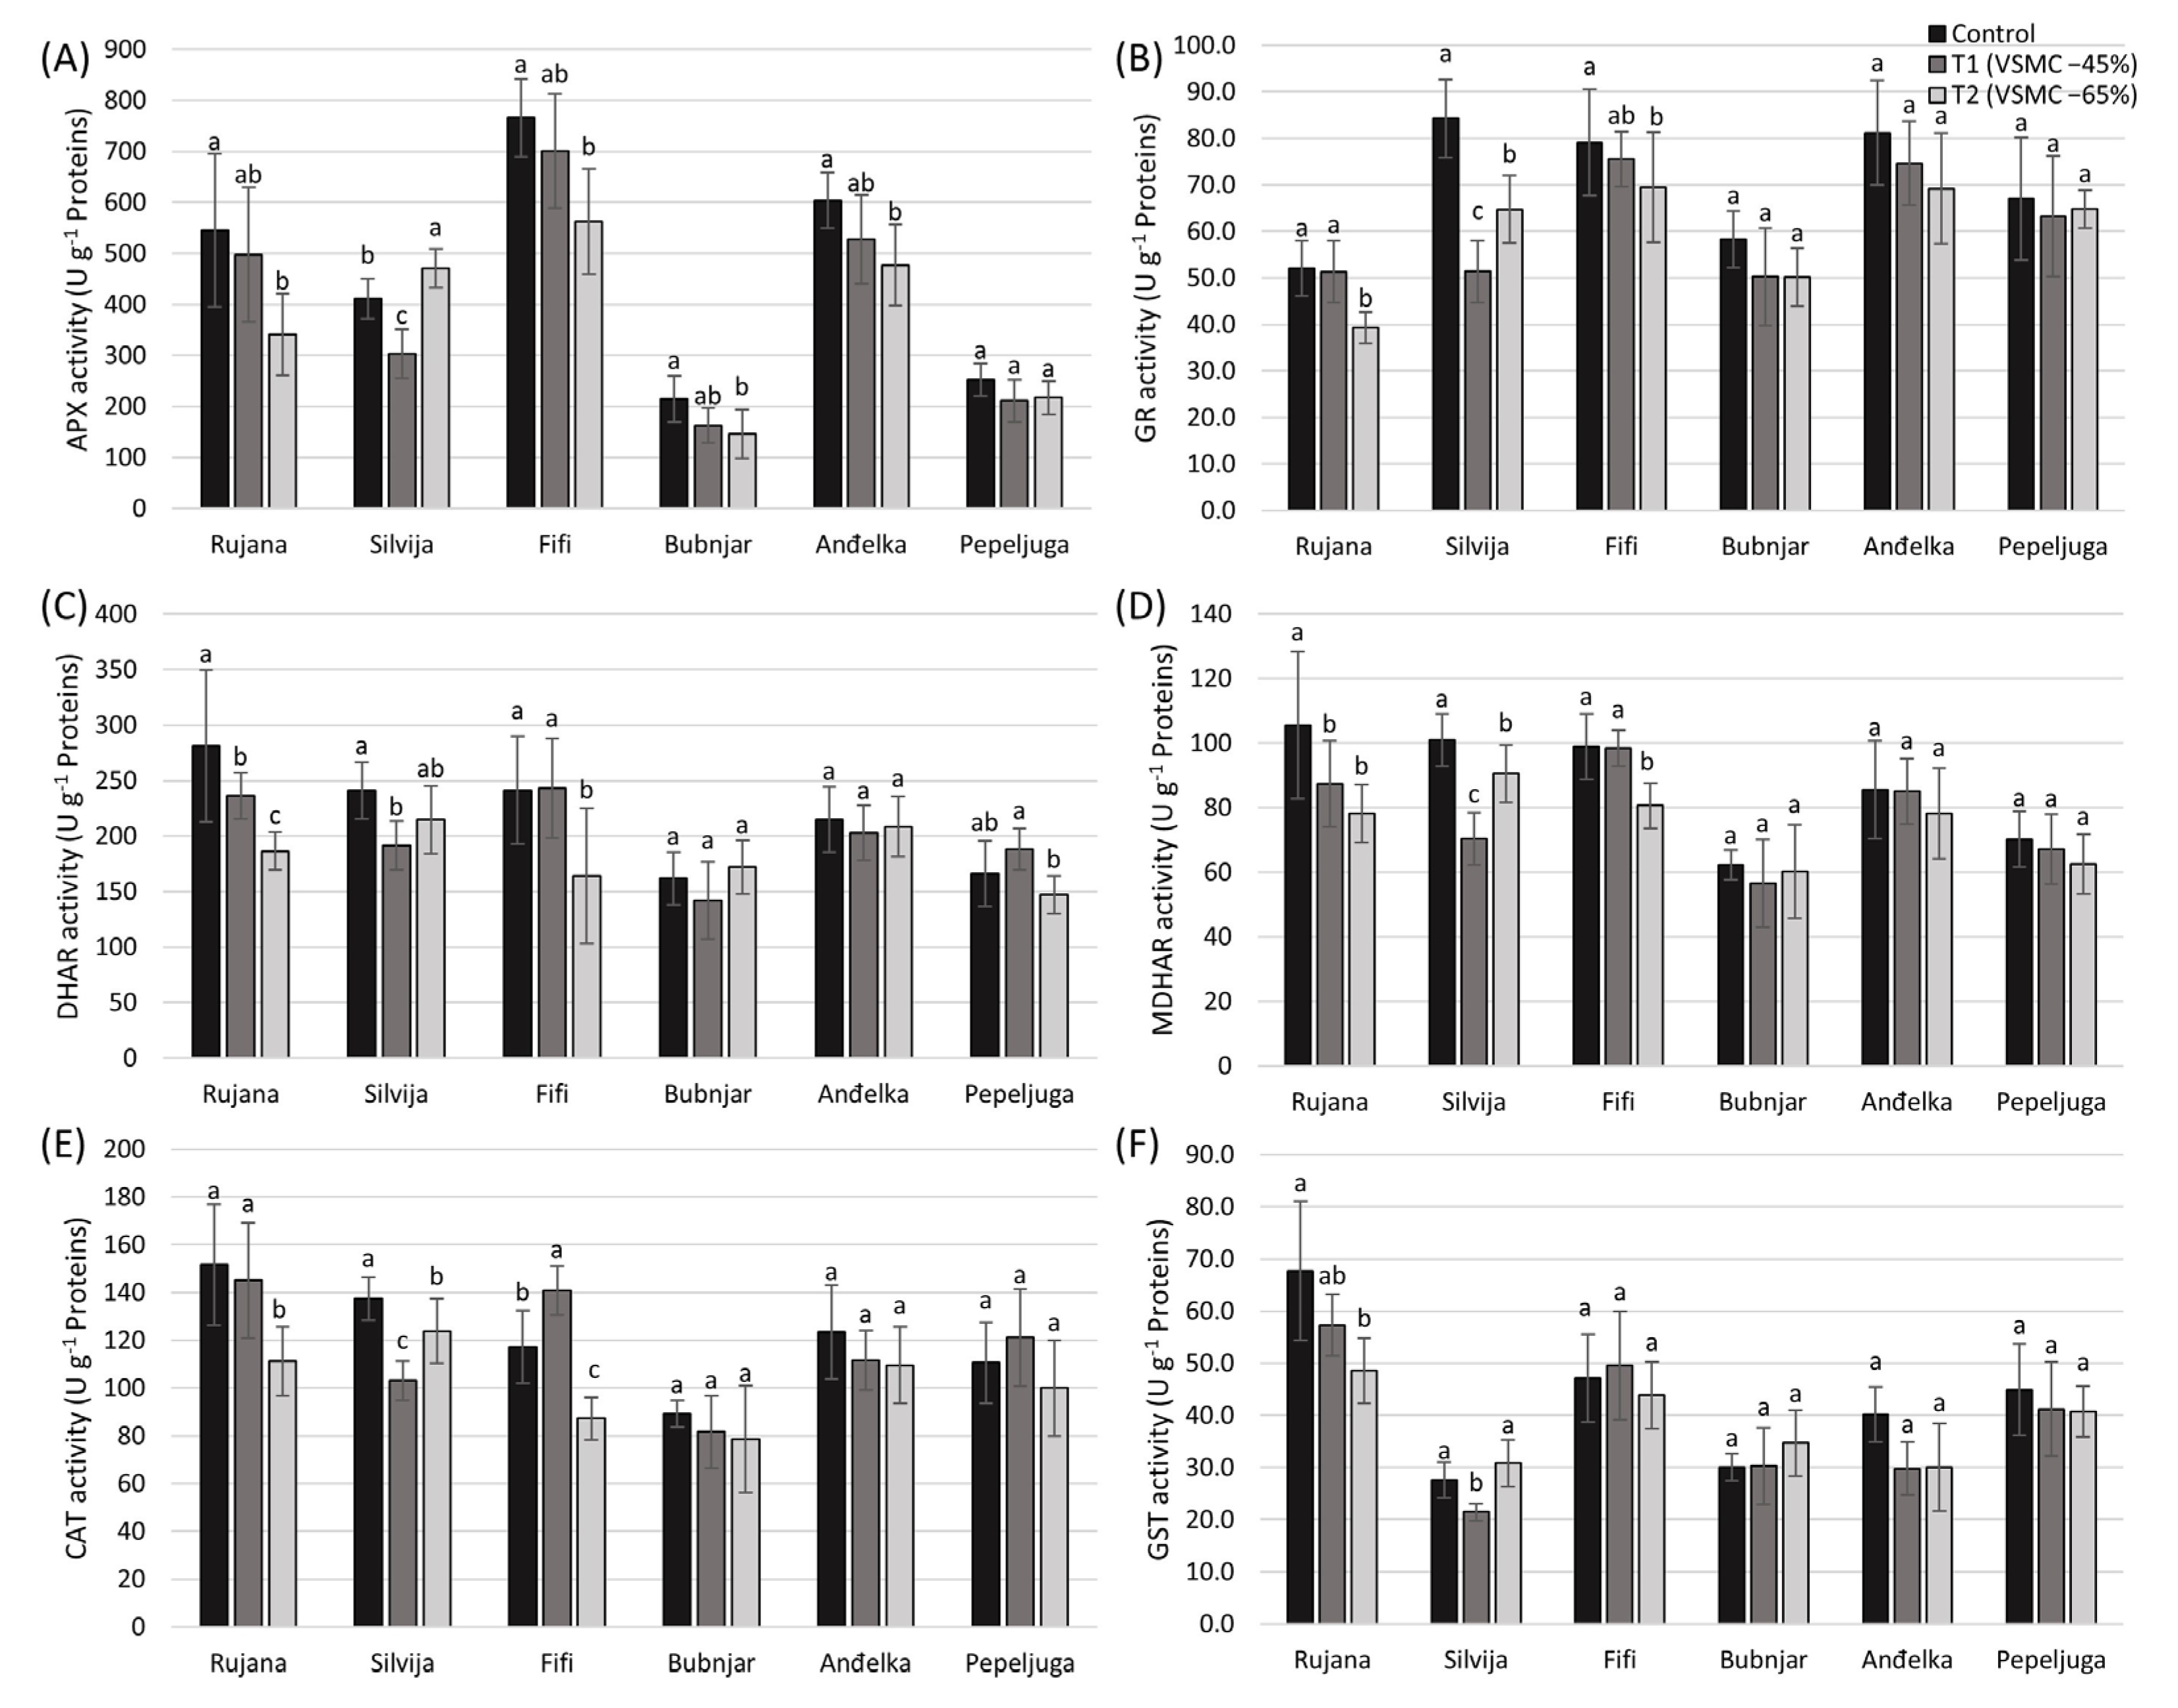
3.4. Enzymatic Activity

3.4.1. Activity of Ascorbate Peroxidase (APX)

At a 45% reduction in VSMC, APX activity in the flag leaves was significantly reduced in the drought-sensitive genotype Silvija by 26%, while in other genotypes, APX did not significantly change (Figure 4A). APX showed higher activity by 15% in the flag leaves of Silvija at a 65% reduction in VSMC, while in the other genotypes, APX activity significantly decreased, compared to the control, except in Pepeljuga, in which it remained at the same level.

3.4.2. Activity of Glutathione Reductase (GR)

In Silvija, GR activity was significantly reduced by 39% at a reduction in VSMC by 45%, while in the other genotypes, it remained at the same level as in the control (Figure 4B). At a 65% reduction in VSMC, the drought-sensitive and -medium sensitive genotypes, namely, Rujana, Silvija, and Fifi, showed significant reductions in GR activity by 24, 23, and 12%, respectively.

3.4.3. Activity of Dehydroascorbate Reductase (DHAR) and Monodehydroascorbate Reductase (MDHAR)

DHAR activity was significantly reduced in Silvija and Rujana by 21 and 16% at a reduction in VSMC by 45%. No significant difference was obtained in MDHAR activity between control conditions and the drought treatment with a reduction in VSMC of 45% for Anđelka, Bubnjar, Pepeljuga, and Fifi (Figure 4C). Rujana and Fifi exhibited significantly reduced DHAR activity by 34 and 32% at a reduction in VSMC of 65%.
MDHAR activity was significantly reduced in Silvija and Rujana by 30 and 10% at a reduction in VSMC of 45% (Figure 4D). Rujana, Fifi, and Silvija showed significantly reduced MDHAR activity by 26, 18, and 10%, respectively, at a reduction in VSMC of 65%.

3.4.4. Activity of Catalase (CAT)

At a reduction in VSMC of 45%, CAT activity significantly decreased in Silvija by 25% and an increased in Fifi by 21% (Figure 4E). At a reduction in VSMC of 65%, the drought-sensitive and -medium sensitive genotypes displayed significantly reduced CAT activity: Rujana by 27%, Fifi by 26%, and Silvija by 10%. On the other hand, the drought-tolerant and -medium tolerant genotypes showed the same CAT activity level in control and drought conditions.

3.4.5. Activity of Glutathione S-Transferase (GST)

GST activity was significantly reduced in Silvija by 22% at a reduction in VSMC of 45% (Figure 4F). Rujana presented significantly reduced GST activity by 28% at a reduction in VSMC of 65%.

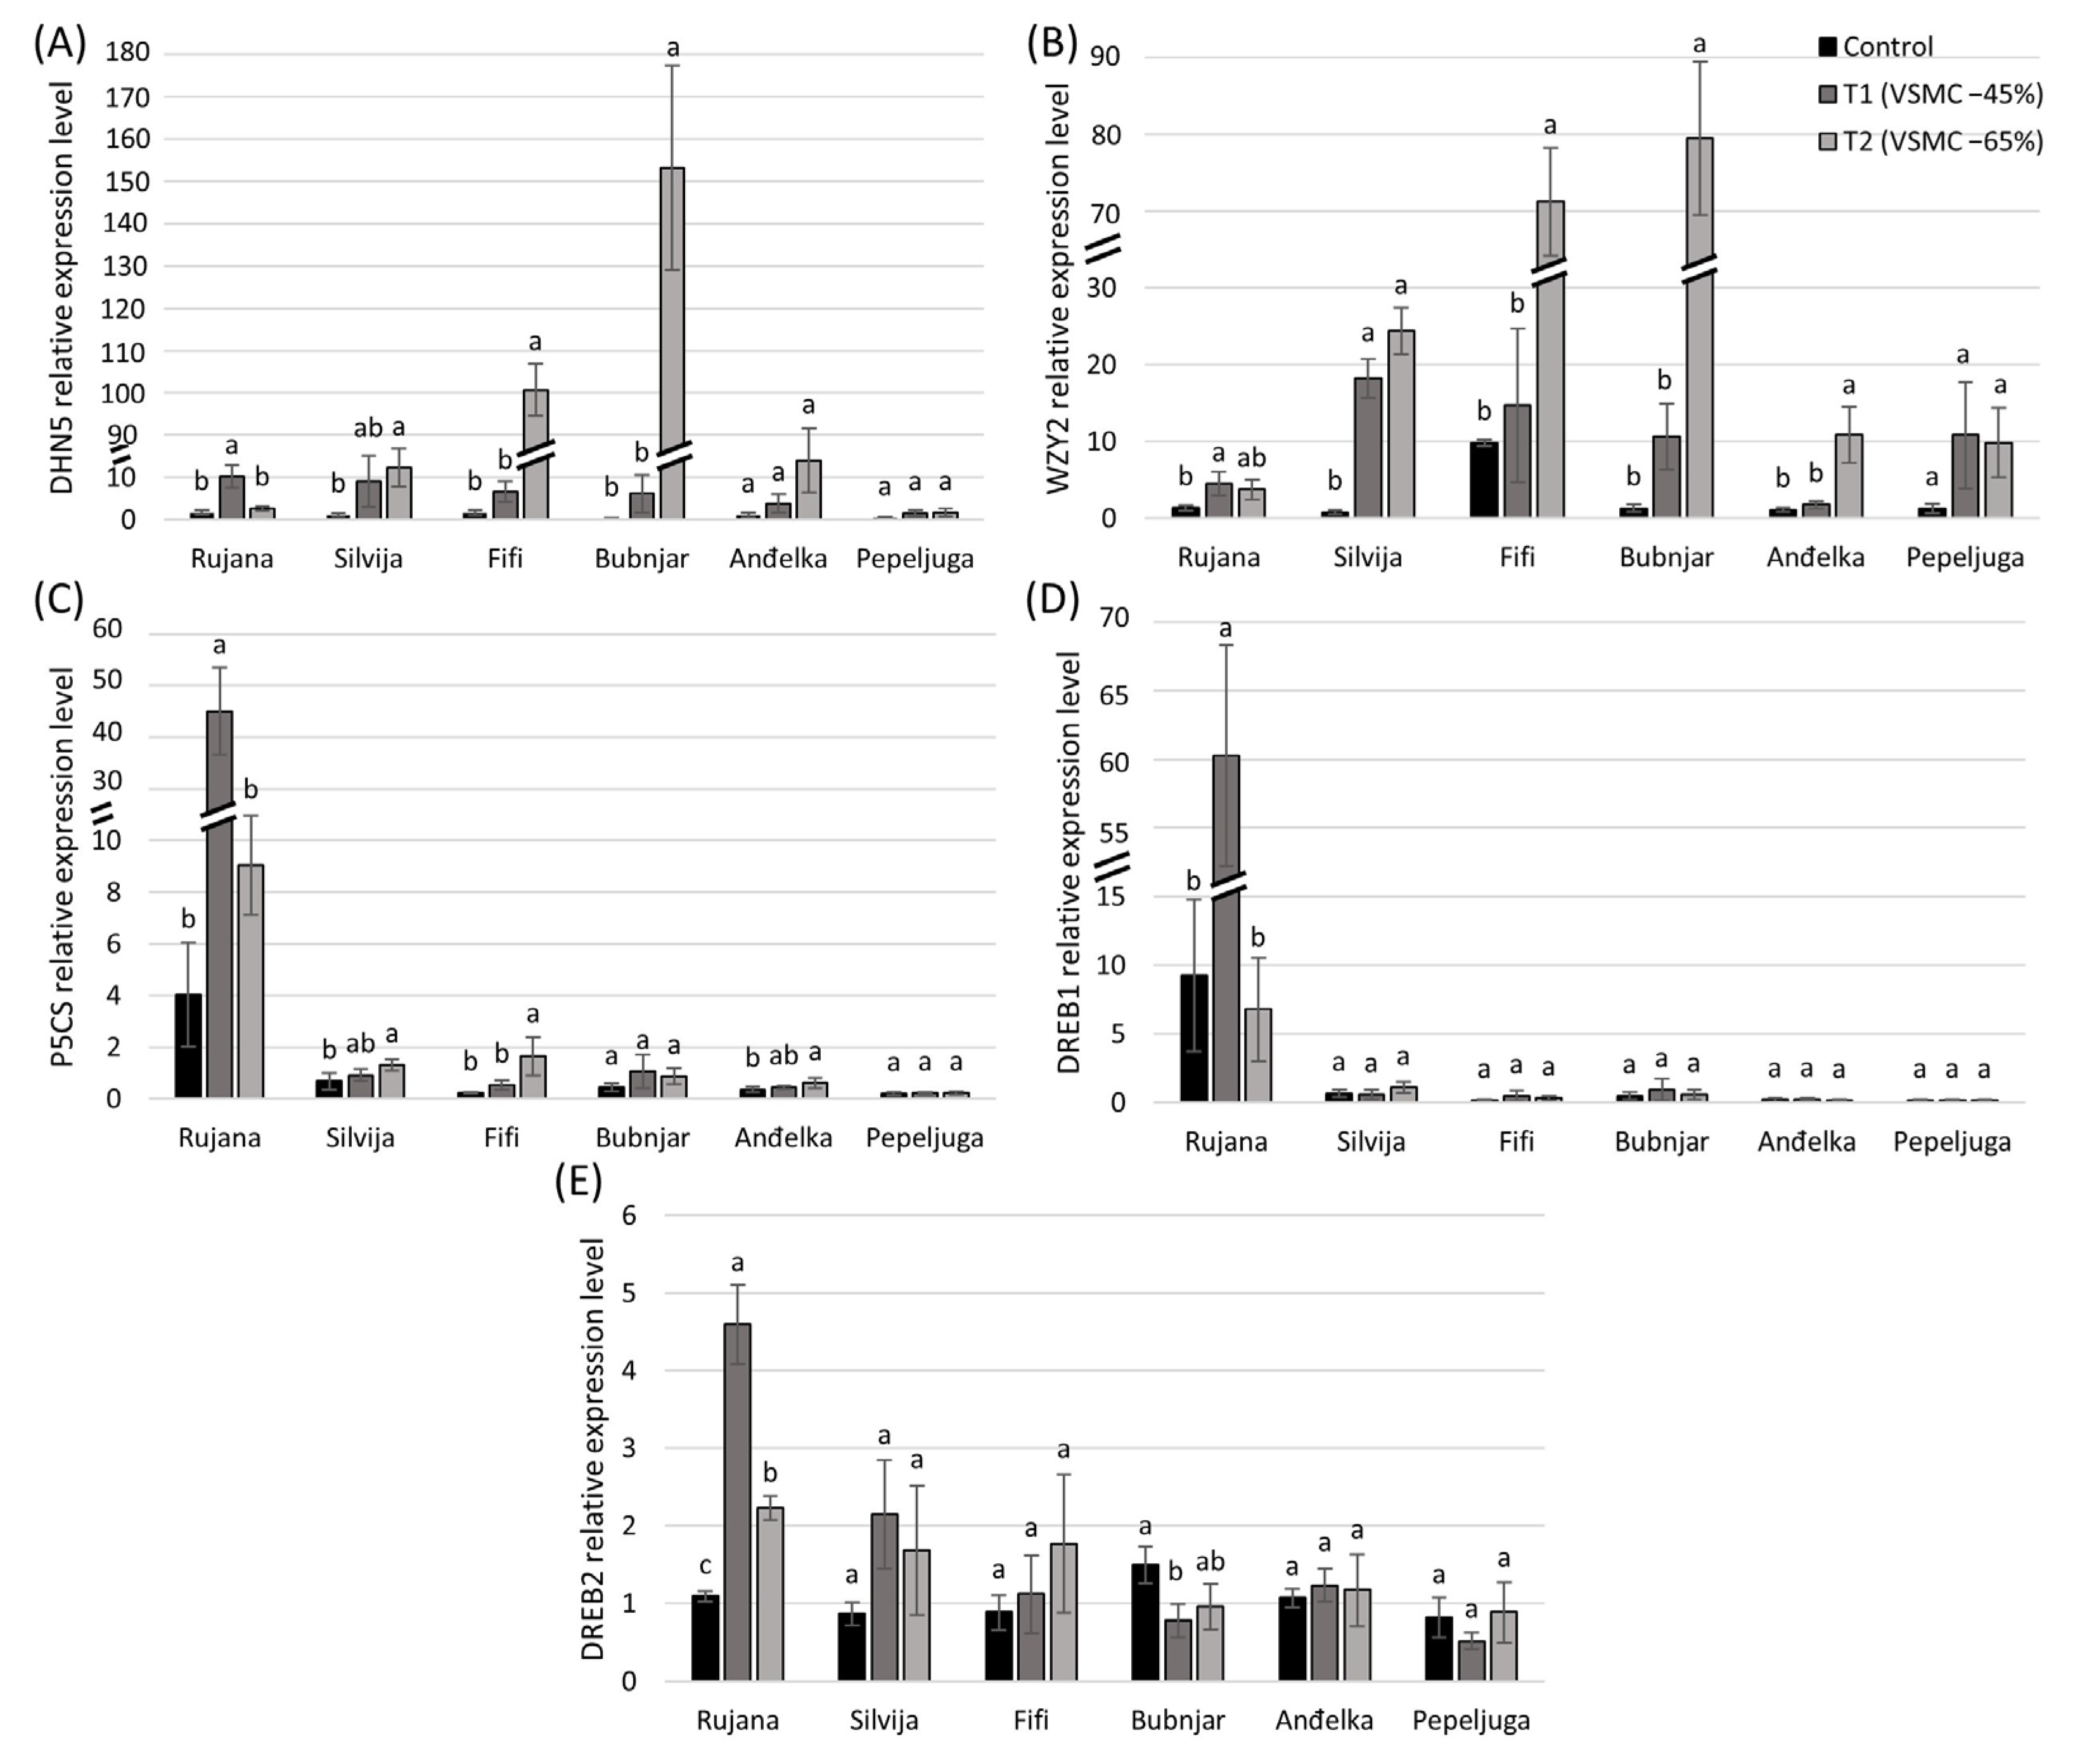
3.5. Relative Expression of Genes

Only Rujana showed significantly increased DHN5 expression in milder drought conditions, i.e., at a reduction in VSMC by 45%, while the other genotypes showed the same expression level (Figure 5A). A significant increase in severe drought, at a reduction in VSMC of 65%, was recorded in the genotypes Silvija, Fifi, and Bubnjar. Although WZY2 gene expression under both drought treatments was upregulated in all tested genotypes, significant increases in milder drought were recorded only in the genotypes Rujana and Silvija, while in severe drought, a significant increase was recorded in all genotypes except Rujana and Pepeljuga (Figure 5B). The highest expression of both genes in severe drought was recorded in the genotype Bubnjar (577-fold higher for DHN5 and 58-fold higher for WZY2).
In milder drought, at a reduction in VSMC of 45%, a significantly increased expression of P5CS was recorded only in the genotype Rujana (Figure 5C). P5CS gene expression was significantly increased due to severe drought at a reduction in VSMC of 65% in the genotypes Silvija, Fifi, and Anđelka. In both drought treatments, no significant changes in gene expression were recorded only in the genotypes Bubnjar and Pepeljuga.
Significant changes in DREB1 expression were recorded only in Rujana, which showed significantly increased expression at a reduction in VSMC of 45% (Figure 5D). Considering the expression of DREB2, only Rujana reported a significantly increased level at a reduction in VSMC of 45%, while Bubnjar exhibited significantly decreased expression (Figure 5E). The other genotypes did not show significant differences.

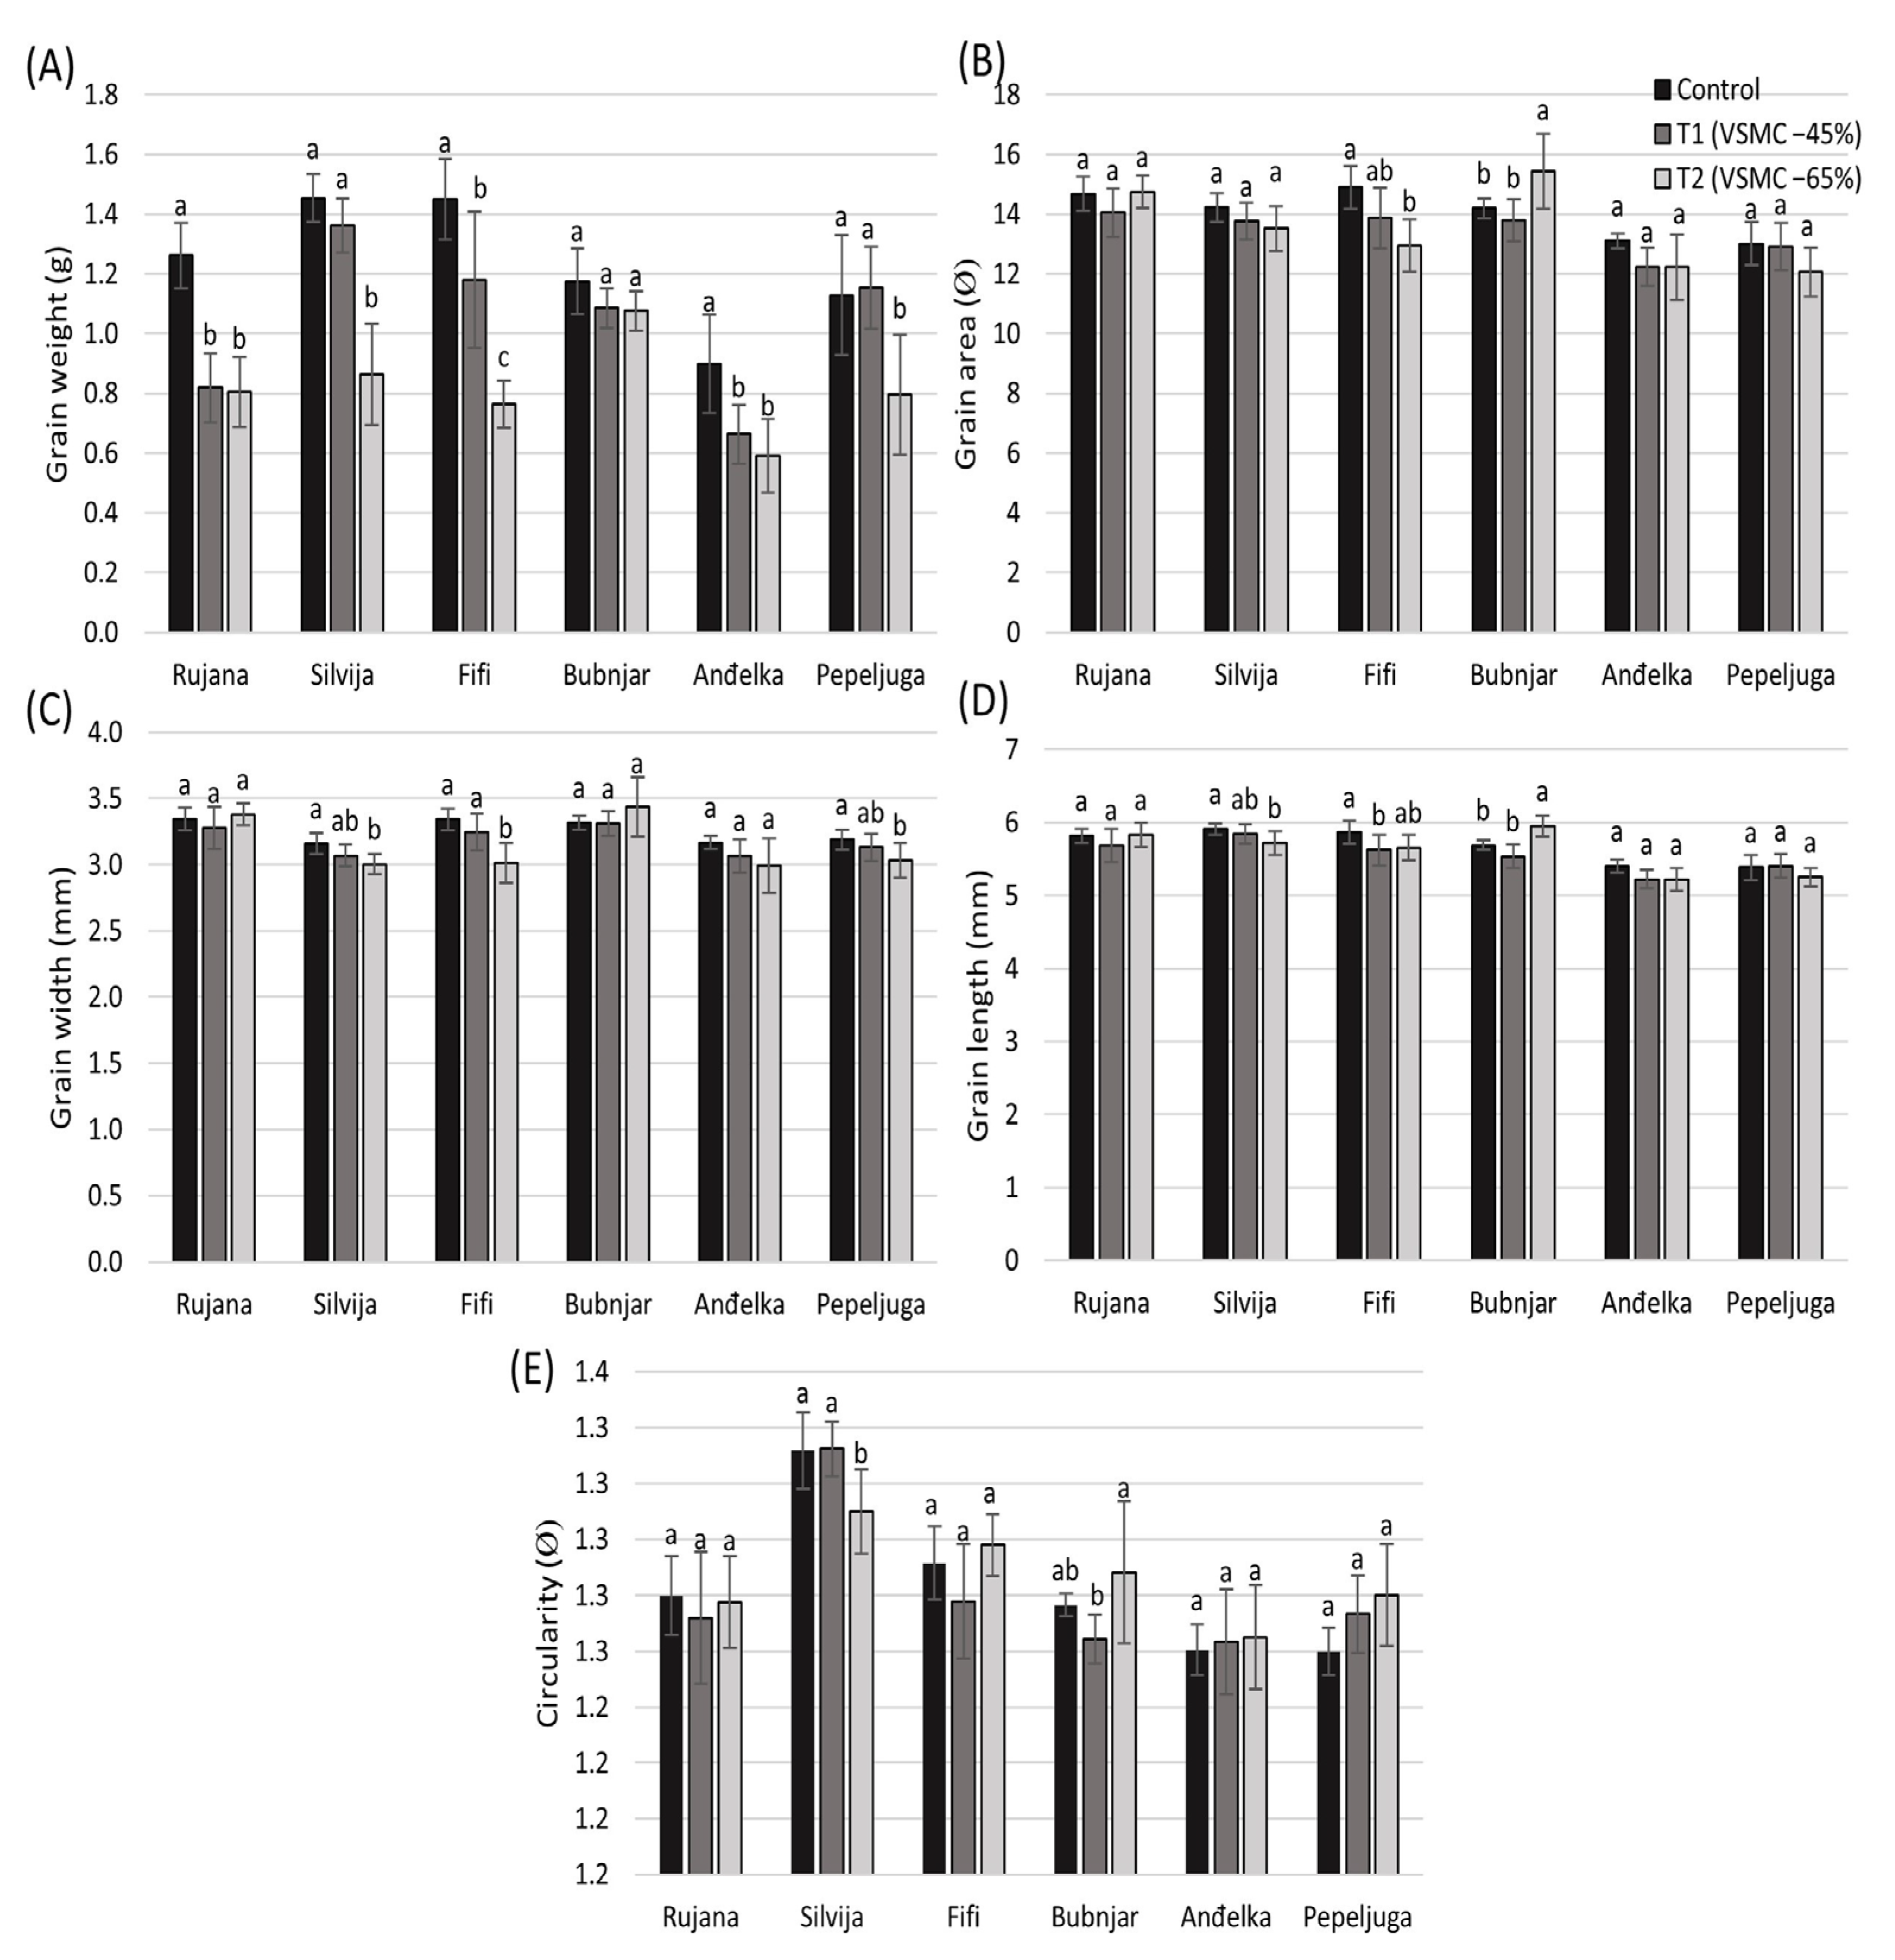
3.6. Grain Morphology

Rujana, Anđelka, and Fifi showed a significant decrease in grain weight at a reduction in VSMC of 45%. There were no significant differences in grain weight in Bubnjar at a reduction in VSMC of 65%, while in all other genotypes, a significant decrease was observed (Figure 6A). The highest significant decrease in grain weight was observed in Fifi (47%) and Silvija (41%).
No significant differences were obtained for grain area between control and 45% reduction in VSMC, for all genotypes (Figure 6B). At a 65% reduction in VSMC, the grain area of all genotypes showed no significant changes, except for those of Bubnjar, which significantly increased by 9%, and Fifi, which significantly decreased by 13%.
At a reduction in VSMC of 45%, the grain width of all genotypes was not significantly different, compared to that in control conditions (Figure 6C). At a reduction in VSMC of 65%, Silvija, Fifi, and Pepeljuga showed a significant reduction in grain width by 10, 5, and 5%, respectively.
At a reduction in VSMC of 45%, the grain length of all genotypes showed no significant differences, except for that of Fifi, which was significantly reduced by 4% (Figure 6D). At a reduction in VSMC of 65%, the drought-sensitive genotype Silvija showed a significantly decreased grain length by 3%, while the drought-tolerant genotype Bubnjar reported a significantly increased grain length by 5%.
The grain circularity of all genotypes showed no significant differences between control and 45% and 65% reductions in VSMC, except for that of Silvija, which showed a significant reduction of 2% at a reduction in VSMC of 65% (Figure 6E).

3.7. Correlation Analysis

Under control conditions, APX showed a significant positive correlation (p < 0.05) with DHN5 (Supplementary Figure S1A). CAT, DHAR, and MDHAR displayed a significant positive correlation, while DHAR and MDHAR reported a significant negative correlation with tGSH and a significant positive correlation with DHN5. In contrast, DHN5 was negatively correlated with tGSH. GR was positively correlated with MDA, and MDA with carotenoids. Chlorophylls were significantly positively correlated, while Chl b showed a significant positive correlation with Car. DREB1 exhibited a significant positive correlation with P5CS. Grain area and width were significantly negatively correlated with Chl a and Chl a+b, while grain area and length showed a significant positive correlation with proline content. Grain length and circularity were significantly positively correlated. Grain weight presented a significant positive correlation with grain length and circularity, and length with grain area.
Under drought with 45% reduction in VSMC, APX had a significant negative correlation with tGSH and a significant positive correlation with MDA, DHAR, and MDHAR (Supplementary Figure S1B). CAT, DHAR, and MDHAR displayed a significant positive correlation, and CAT was positively correlated with GST. DHAR and MDHAR were significantly negatively correlated with tGSH, while DHAR exhibited significant positive correlation with MDA. Chlorophylls were significantly positively correlated, while Chl b was significantly positively correlated with Car. Proline was significantly positively correlated with DHN5, P5CS, DREB1, and DREB2. P5CS, DREB1, and DREB2 displayed a significant positive correlation. Grain area was significantly negatively correlated with chlorophylls, while grain length showed a negative correlation with Chl b and Chl a+b and a positive correlation with DHN5 and grain area.
At a 65% reduction in VSMC, MDHAR reported a significant positive correlation with APX (Supplementary Figure S1C). GR was significantly negatively correlated with DREB1, and DREB1 was significantly positively correlated with P5CS. tGSH showed a significant negative correlation with Chl a+b and a significant positive correlation with DHN5 and WZY2, while Chl a was significantly positively correlated with Chl a+b. MDA exhibited a significant positive correlation with DREB2, while DHN5 showed a significant negative correlation with CAT and a significant positive correlation with WZY2. Grain area showed a negative correlation with MDHAR and Chl a+b and a significant positive correlation with grain length and width, while grain width revealed a negative correlation with GR. Grain length was negatively correlated with Chl a, Chl a+b, and carotenoids and positively correlated with proline, while proline exhibited a significant negative correlation with Chl a+b and significant positive correlation with grain area and length.

4. Discussion

Drought in wheat refers to external influences that adversely affect plant growth, development, or grain productivity. However, plants have defence mechanisms consisting of enzymatic and non-enzymatic defence systems such as carotenoids and proline. Pompelli et al. [49] reported that the elevation in the activity of enzymatic and non-enzymatic systems, defending plant tissues against oxidative injury, is the result of decreased amounts of MDA, H2O2, and proline. The ascorbate–glutathione (AsA-GSH) cycle is a major antioxidative system that detoxifies ROS and is composed of MDHAR, DHAR, APX, and GR.

4.1. Pigments Involved in Photosynthesis during Drought

Photosynthates and assimilates are transported to the developing grain after photosynthesis in the flag leaf and from pre-anthesis reserves in tissues such as the stem and the ear. The chloroplast is an organelle that contains the photosynthetic pigment chlorophyll and is the site of the earliest abiotic injury visible in plants [50] due to the photo-oxidation of pigments and the degradation of chlorophyll. In the current research, in most of the wheat genotypes, Chl a, Chl b, and Chl a+b tended to increase in the flag leaves at a 45% reduction in VSMC, while some genotypes showed no significant changes. García-Valenzuela et al. [51] showed that an increase in chlorophyll accumulation may be the result of osmotic stress. In the present study, at a reduction in VSMC of 65%, all wheat genotypes exhibited the same amount of chlorophylls as in the control conditions, except the most sensitive genotype, Silvija, which showed a significantly reduced level of Chl a. It was demonstrated that drought in wheat reduced the chlorophyll content and photosynthesis in the leaf [3]. In previous research, a reduced content of Chl a, Chl b, total Chl, and carotenoids was reported under drought [52]. Thus, the chloroplast structure could be changed, or inhibition of the biosynthesis of Chl or its precursors might occur. Thereby, decreased concentrations of pigments involved in photosynthesis can directly limit the photosynthetic efficiency.
One of the main causes of a reduced photosynthetic activity is the formation of ROS such as superoxides and hydroxyl radicals, which impair the photosynthetic machinery where the ROS-scavenging system is not induced properly [53]. Thus, in the current research, mild stress, with a reduction in VSMC of 45%, resulted in an increase in chlorophyll content. If the concentration of the chlorophyll pigment increases, the photosynthetic systems should be efficient in ROS scavenging [54]. Further, other pigments, such as carotenoids, protect photosystems as a result of a reaction with lipid peroxidation products and scavenging singlet oxygen [55]. In the present study, only the drought-tolerant genotype Bubnjar showed a significantly increased level of carotenoids in mild drought, with a production of MDA that did not significantly change in both types of drought stress. It was reported that carotenoids, with ascorbate, GSH, and α-tocopherol, might be good indicators of drought tolerance [56].
In the current research, different metabolic processes in severe drought, at a reduction in of by 65%, were affected, leading to a significant reduction in chlorophyll content in the drought-sensitive genotype (Silvija). The loss of chlorophyll content can be the first sign of the inactivation of photosynthesis. Those genotypes that exhibited higher chlorophyll contents under drought could lead us to the conclusion that they turned on the ROS-scavenging system to some extent. It was also shown that chlorophylls were significantly positively correlated in mild stress, while Chl b showed a significant correlation with carotenoids, while in severe stress, only Chl a+b presented a positive correlation with Chl a. Similar findings were obtained by Ahmed et al. [9], who showed that chlorophylls were positively related among themselves under drought conditions. This shows the significance of these attributes for drought in future wheat breeding programs.

4.2. Content of Malondialdehyde (MDA) and Proline

The structure and function of cellular membranes could be damaged during drought via lipid peroxidation, in particular, the thylakoid membranes within the chloroplast [57]. Hence, the stability of the cell membrane is determined in the screening of drought-tolerant genotypes [58]. Lipids, the main components of the cellular membrane, are the primary target of ROS, undergoing lipid peroxidation. The cell membranes are damaged the earliest during oxidative stress by ROS, which will result in lipid peroxidation and, consequently, membrane injuries, enzyme inactivation, and protein degradation. The product of lipid peroxidation is MDA, which is usually used as a marker for oxidative hurt and antioxidant status. From the data of the current research, it is obvious that the drought-sensitive and -medium sensitive genotypes displayed elevated MDA levels at a reduction in VSMC of 65% in contrast to the drought-tolerant and -medium tolerant genotypes. Similar results were obtained by Sultan et al. [59], who reported that drought-tolerant genotypes showed significantly increased proline and relative water content, while the MDA content decreased under drought conditions. Vuković et al. [22] also highlighted that lipid peroxidation was induced by drought in wheat genotypes, with a higher increase in MDA in seedlings of drought-sensitive genotypes. In the current research, with both drought intensities, the MDA level was reduced or significantly unchanged in the genotypes Bubnjar, Pepeljuga, and Fifi, thus indicating a stronger antioxidative response in them. The enhancement of enzymatic and non-enzymatic systems that have a role in plant tissues protection against oxidative injury was evidenced by the lower amounts of MDA in the flag leaves in mild than in severe drought, except for the drought-tolerant and -medium tolerant genotypes. However, the drought-sensitive and -medium sensitive genotypes under mild drought did not differ significantly in MDA content. The differences between drought-tolerant or -medium tolerant and drought-sensitive or -medium sensitive genotypes became evident as the degree of the stress increased, where the drought-sensitive genotypes experienced more stress injury.
Proline is an amino acid that accumulates under different stresses. It is an osmolyte and a reservoir of carbon and nitrogen, but it also protects plants against free-radical-induced damage, and its accumulation is related to high temperatures and drought [60]. The increase in osmolytes, like proline or glycine betaine, and in late-embryogenesis-abundant proteins, which have a role in the protection of lipid membranes, stabilises the membrane [61]. Peršić et al. [62] reported that there are contrasting results on the relation between proline content and drought tolerance. According to some research, it is believed that an increased proline content is an indicator of drought-induced stress, while other authors believe that proline is associated with sensitivity to drought [63,64,65]. In the current research, all genotypes showed a significantly higher proline content in severe drought, and four genotypes in mild stress. Similarly, Anjum et al. [55] observed that the accumulation of proline and other osmolytes in maize plants increased with the severity of drought. Also, the increased proline content in plants under severe drought conditions could have important role in recovery after stress [66]. In the current research, it was observed that proline displayed a significant positive correlation with P5CS, DREB1, and DREB2 in mild drought but not in severe drought. However, it was observed that the proline content was significantly positively correlated with grain area and length. It was previously reported tha there was a strong correlation between elevated enzymatic activity of P5CS and proline content [33].

4.3. ROS-Scavenging System

An increased content of ROS at the cell level influences protein degradation, the inhibition of enzymes, oxidative damage to DNA and RNA, and lipid peroxidation in membranes, causing the death of cells [67]. Among the antioxidant enzymes involved in the degradation of ROS during drought, the best described are CAT, SOD, GPX, APX, and GR [22,68,69]. For instance, the activity of the enzymes of the AsA-GSH scavenging pathway (APX and GR) was elevated under drought [66]. Drought led to the upregulation of APX in the endosperm, while GR, CAT, and POD activity increased in the shoots of seedlings in drought-tolerant genotypes of wheat [70]. The same authors concluded that a genotype is likely to be drought-tolerant if any of the specified enzymes’ activities is upregulated in specified tissues under drought. According to Foyer and Noctor [71], the main ROS detoxification process is under the influence of the enzymes, including APX, GR, DHAR, and MDHAR, involved in AsA-GSH metabolism. CAT predominantly scavenges H2O2 in the peroxisomes. Therefore, CAT can neutralise H2O2 by decomposing it into molecular oxygen and water. Under stress conditions, a strong elevation in CAT activity in the leaves may protect the chloroplasts, the principal generators and targets of ROS, thus supporting persistent electron fluxes [72]. Thus, the stability of CAT activity in the leaves is likely responsible for the elimination of photorespiratory H2O2. In the current research, significant reductions in CAT in response to drought appeared in the drought-sensitive and -medium sensitive genotypes, especially at a 65% reduction in VSMC. Hence, we may assume that CAT activity in drought-tolerant genotypes is a critical and accessory component of photosynthesis that prevents ROS accumulation. Similar results were obtained by Chakraborty and Pradhan [52], who reported that the CAT and SOD activity decreased in all periods of drought in more drought-sensitive wheat genotypes. Anjum et al. [55] also observed that the activities of some enzymes, such as POD and CAT, decreased with drought severity. Further, Vuković et al. [22] reported a negative correlation between reduced CAT activity and lipid peroxidation levels, suggesting that the absence of CAT induction resulted in increased lipid peroxidation. Similar results were obtained in the current research, where the drought-sensitive and -medium sensitive genotypes showed significantly elevated MDA levels in severe drought, with a decrease in CAT activity. It could be seen that CAT exhibited a significant negative correlation with DHN5 in severe drought.
APX is an integral component of the AsA-GSH cycle that has the ability to reduce H2O2 to H2O and DHA, using ascorbic acid in the cytosol and chloroplasts [68]. DHA is further reduced to ascorbate by the action of DHAR, with an expenditure of GSH or NADPH. The second line of antioxidant defence is more activated with an increase in stress when APX activity is elevated [73]. Silvija could increase APX activity in flag leaves, trying to detoxify ROS and minimise the photooxidative damage during severe drought. Similar results were observed by D’Arcy-Lameta et al. [74] when the transcript levels of the cytosolic and peroxisomal APX genes appeared elevated in a genotype sensitive to drought. According to that, we can assume that APX was expressed much earlier in the more drought-tolerant genotypes that managed to decrease the MDA content.
Glutathione is involved in multiple metabolic functions, such as the protection of membranes, by maintaining the reduced form of both α-tocopherol and zeaxanthin, preventing the oxidative denaturation of proteins under stress [75]. GSH is also the substrate of GPX reactions and GST, which also participates in the removal of ROS. It was reported that an elevation in tGSH in the flag leaves of wheat implies its role in drought tolerance [76]. In the current research, the tGSH content significantly increased in the drought-sensitive and -medium sensitive genotypes in both types of drought stress, thus showing that the decline in tGSH concentration in the drought-tolerant and -medium tolerant genotypes indicated sufficient defence capacities. Loggini et al. [77] reported that more drought-tolerant genotypes did not increase the enzyme activity because its present activity was enough to tolerate stress, whereas the more drought-sensitive genotype reinforced its defence systems. However, GSH is also a protector of chlorophyll biosynthesis enzymes, which might be related to a higher chlorophyll content [78]. In the current research, the drought-sensitive and -medium sensitive genotypes showed a significantly elevated tGSH level, which might protect the chlorophyll structure. For example, adding exogenous GSH enhanced non-enzymatic and enzymatic components in some plants [79]. Further, genotypes with different drought tolerance showed a decrease in the tGSH level and a higher GSH/GSSG ratio after one month of drought [77]. However, in the current research, it was observed that an increase in tGSH activity was only observed in the drought-sensitive and -medium sensitive genotypes. It might be assumed that different genotypes depend on tGSH to decrease oxidative stress, whereas enhanced antioxidative functioning in drought-tolerant and -medium tolerant genotypes might occur early to withstand drought, compared to drought-sensitive and -medium sensitive genotypes, where tGSH content significantly increased later. After two weeks of drought, the drought-sensitive and -medium sensitive genotypes were still not able to defend themselves, thus elevating tGHS content
GR catalyses GSSG reduction to GSH using NADPH, and the reduced GSH is further utilised for the regeneration of ascorbic acid [19]. This helps in regulating the ratio of GSH/GSSG and suppling GSH to GPX and DHAR. Due to the maintenance of a favourable GSH/GSSG ratio, GR provides stress tolerance in plants [80]. The drought-sensitive and -medium sensitive genotypes showed significantly reduced GR activity at a 65% reduction in VSMC, which thus did not contribute to the detoxification of ROS. Due to the decreased GR activity in these three genotypes, GSH could not be recycled sufficiently, as shown by the significant increase in tGSH in the drought-sensitive and -medium sensitive genotypes in both types of drought stress. In contrast, the drought-tolerant genotype showed no significant differences in tGSH in control and drought conditions, thus minimising the formation of ROS. It was observed previously that tGSH increased contribution to the redox potential could compensate for the modest increase in GR activity in roots under drought [19]. Similar results were observed in the current research, where the drought-tolerant and -medium tolerant genotypes had a tendency to decrease the tGSH level, maintaining GR activity significantly unchanged in flag leaves. Also, it could be seen that GR showed a significant negative correlation with DREB1 as well as with grain area and width in severe drought. According to the research of Chakraborty and Pradhan [52], increased POD and GR activity was the most influential factor conferring drought tolerance.
GST is an enzyme that catalyses the reaction of electrophilic substrates in the removal of ROS and is also related to tolerance to abiotic stresses [54]. It can repair phospholipid damages in the membrane [81]. However, previous research about the importance of GST in drought is not consistent [22]. In the current research, no clear picture was obtained about the role of GST in drought tolerance in wheat genotypes. However, some studies found that an increase in GST might reduce the accumulation of H2O2 and MDA and help to maintain the GSH/GSSG ratio under salt stress [20].
Ascorbate is an efficient primary scavenger of ROS, being oxidised and further recycled back by the activities of MDHAR and DHAR [71]. It was previously concluded that higher ascorbate levels in transgenic plants of rice were due to increased MDHAR and DHAR activities [82]. In the plant antioxidant system, MDHAR is important in maintaining the ascorbate pool by catalysing the reduction of monodehydroascorbate (MDHA) to ascorbate and, therefore, maintains a pool of reduced ascorbate [20]. In the research of Shokat et al. [21], higher MDHAR activity within the leaves of wheat was a predictive biomarker for a higher grain number under drought. In the current research, the drought-tolerant and -medium tolerant genotypes did not show significant changes in MDHAR activity at both drought intensities, while the drought-sensitive and -medium sensitive genotypes showed a tendency to a significant reduction.
DHAR participates in the catalysis of the reduction of DHAR using reduced GSH, yielding ascorbic acid and GSSG and thus keeping an ascorbate redox state [20]. The main role of the AsA-GSH cycle, particularly of DHAR, is in minimising the drought-induced grain yield loss in rice [83]. Therefore, in the current research, the drought-tolerant and -medium tolerant genotypes showed no significant changes in DHAR in the two drought treatments and in control conditions. This indicated that in those genotypes, DHAR activity was sufficient to overcome drought. Also, DHAR activity maintains high levels of chlorophyll and photosynthetic functioning, resulting in delayed leaf ageing [84]. Further, the decrease in DHAR was associated with reduced photosynthesis and increased oxidative injury.

4.4. The Expression of Genes (P5CS, DHN5, WZY2, DREB1, and DREB2) under Drought

Knowledge about the relation of antioxidant defence at both protein and gene expression levels to genetic variation in drought tolerance is important for the identification of predominant or major protection pathways to improve drought tolerance. Thus, in the current research, the expression patterns of the drought-sensitive gene P5CS, of genes encoding dehydrins (DHN5 and WZY2), and of genes encoding transcription factors (DREB1 and DREB2) were analysed.
The elevation in the relative expression of the analysed stress-responsive genes DHN5 and WZY2 was mostly evident under drought conditions. Only Rujana showed a significant increase in the expression of both genes in mild stress, and Silvija showed an increase in WZY2 expression. It is evident from the current research that the most drought-tolerant genotype, Bubnjar, highly overexpressed DHN5 and WZY2 in severe drought, compared to all other genotypes. Previous studies reported that the DHN genes are important in abiotic stress tolerance [85,86,87]. Moreover, the TaDHN genes respond strongly to stresses such as drought, cold, and high salinity [88]. Saibi et al. [32] reported that a higher expression of TtDHN5 elevated tolerance to osmotic and salt stress in transgenic Arabidopsis plants. Also, dehydrin WZY2, whose relative expression was increased in most plants during cold, drought, heat, or other abiotic stresses, was identified as a drought stress-responsive gene [89,90].
Ma et al. [91] showed that under osmotic stress, TaP5CS was overexpressed in transgenic Arabidopsis, which further showed increased proline content and decreased lipid peroxidation. In addition to osmotic stress, the transcription of P5CR was also increased under cold and biotic stress [92,93]. According to the current research, in severe drought (65% reduction in VSMC) P5CS gene expression was significantly increased in Silvija, Fifi, and Anđelka, but only Anđelka displayed a significant reduction in MDA. Rujana showed a significant increase in P5CS already in mild drought, together with an increase in proline content. Furthermore, many studies previously reported that increased P5CS enzyme activity strongly correlated with proline accumulation [33,94], which ultimately led to an increase in stress tolerance [34]. According to Bohnert et al. [95], the DREB genes are grouped into classes based on similarities in their functioning. Two main subgroups of the DREB subfamily include the genes DREB1 and DREB2 [96]. Currently, both genes DREB1 and DREB2 are used in molecular breeding studies to improve the tolerance of wheat to abiotic stresses. It was concluded that the DREB transcription factor plays crucial roles in the abiotic stress response [97]. For example, increased proline content was related to CpDreb2 ectopic overexpression in tobacco [98]. This was similarly observed in the current research, where Rujana was the only genotype with a significant increase in DREB1 and DREB2 in mild drought and in DREB2 in severe drought. This genotype also showed a significant and strong increase in proline in both drought treatments. However, as mentioned before, there is not a clear understanding of the role of proline in drought tolerance.
It was previously reported that the expression of DREB2B under stress was similar to or lower than that in control plants [99], suggesting that this gene does not have a role in tolerance. A decreased expression may simply reflect impairment of the normal metabolic functioning of a plant. In the current research, only Bubnjar (drought-tolerant genotype) showed a significantly decreased DREB2 expression in mild drought. According to the expression of DREB2, we might conclude that the expression levels might serve as indicators of the degree of stress in relation to plant metabolism. Further, the transcriptional activity of several APX genes and the activity of the APX protein were increased in DREB2C overexpressors [100]. It is evident that the most drought-sensitive genotype Silvija showed significantly increased APX activity in severe drought.
According to previous research, more drought-tolerant genotypes of wheat accumulated more DREB1 gene transcripts under drought than sensitive genotypes [27,101]. In contrast, Yousfi et al. [98] reported that drought-sensitive genotypes increased DREB1A expression, compared with tolerant ones, suggesting that the expression of this gene is not related to drought tolerance. It shows that for sensitives genotypes, it is not possible to deal with stress. Due to the significant expression of DREB1 only in one genotype, it is not possible to make a proper conclusion about the role of this gene, although DREB1 showed a negative correlation with GR activity and grain area and width in severe stress. Other genes not investigated in the current research might influence the antioxidant defence.

4.5. Postharvest Traits of Grain Morphology Influenced by Drought

One of the ways to increase the grain yield is the selection for enhanced grain size, as it is directly related to 1000 kernel weight, a component of grain yield. Grain size is related to grain filling and includes grain length, grain width, grain thickness, and grain surface area. Brinton et al. [102] reported that the 5A locus was responsible for an increase in grain weight influencing grain length. Along with that goes the fact that grain length is genetically controlled and stable across environments, has a pleiotropic effect on grain width in the final stage of grain development, and is more variable across environments. In this study, five traits of grain morphology (grain weight, grain area, grain width, grain length, and grain circularity) were analysed after harvest. For milling, the best morphology is that of large and spherical grains [103], while small and shrivelled grains will decrease the yield of milling. Furthermore, grain yield is positively affected by grain size, as the latter increases the grain weight [104,105]. During the grain filling stage, drought affects the accumulation of starch and protein in the grains, which results in a decrease in grain size, thus affecting grain yield and quality [106]. Simmonds et al. [107] reported that grain width genes on chromosome 6A are under the influence of increased grain weight, suggesting that increased grain size could contribute to a higher grain yield. Further, during anthesis, drought will provoke partial or complete sterility of the florets [108]. Grain formation lasts 12–14 days after anthesis and fertilisation of the florets. This is also the time when most of the endosperm is formed, which corresponds to the cell division phase. It is evident that high post-anthesis temperatures or drought reduce the mature grain weight in wheat [109]. On the other hand, terminal drought will reduce the grain number, rather than the grain size, which causes a significant decrease in grain yield in wheat [110].
According to the current research, only the drought-tolerant genotype did not significantly change the grain weight and even significantly increased grain area as well as grain length under both intensities of drought. According to the above, we can conclude that the genotype Bubnjar proved to be more tolerant to drought than the other tested genotypes, as was already concluded in previous research [22]. Further, it was seen that DHN5 showed a significant positive correlation with grain length and proline content in mild drought, while in severe drought, proline content showed a significant positive correlation with grain area and length. On the other hand, the drought-sensitive genotype Silvija showed a significant decrease in almost all traits of grain morphology in severe drought. In the early stage of grain filling, the number of endosperm cells and starch granules per cell will be reduced under drought, resulting in a decrease in grain size [111]. It could be seen that when drought occurred at the grain filling stage, grain weight was reduced in almost all genotypes, thus meaning that the rate of grain filling was not optimal. Photosynthetic activity and remobilisation of sugars were probably decreased in other plant parts up to the grain. Drought also triggers early senescence, thus shortening the accumulation period of dry weight in the grains.

5. Conclusions

Compiling all data, the extinguishing of chlorophyll may be a stress indicator as a first-line defence system in the flag leaves of wheat, with increased MDA accumulation. On the other hand, the accumulation of carotenoids may help plants cope with drought. APX and GST expression under drought was genotype-specific and dependent on drought intensity. The results suggest that drought induced oxidative stress and that besides CAT, the enzymes of the AsA-GSH cycle (GR, MDHAR, and DHAR) appeared to function as important components of the antioxidative defence system under severe drought. The relative expression of the DHN5 and WZY2 genes in severe drought was higher in the drought-tolerant genotype (Bubnjar) compared to the other genotypes. These two genes showed a significant positive correlation in severe drought, while in control conditions and mild drought, no correlation was recorded between them. Our results suggest that drought-tolerant and -medium tolerant wheat genotypes can better acclimatize to drought and induce antioxidant systems earlier than drought-sensitive genotypes. Wheat breeders should use these results in the selection of drought-tolerant genotypes and in the development of high-yielding wheat genotypes.

Supplementary Materials

The following supporting information can be downloaded at: https://www.mdpi.com/article/10.3390/agronomy14071522/s1, Figure S1: Correlation analysis of the investigated traits in (A) control conditions, (B) mild drought (VSMC − 45%), and (C) strong drought (VSMC − 65%).

Author Contributions

Conceptualization, J.D. and V.S.; methodology, J.D., V.S. and R.V.; software, J.D. and R.V.; validation, V.S. and H.S.; formal analysis, J.D.; investigation, J.D., V.S. and R.V.; resources, V.S. and H.S.; data curation, J.D.; writing—original draft preparation, J.D. and V.S.; writing—review and editing, J.D., V.S., H.S. and R.V.; visualization, J.D. and V.S.; supervision, V.S. and H.S.; project administration, V.S. All authors have read and agreed to the published version of the manuscript.

Funding

The work of the doctoral student Jurica Duvnjak was supported in part by the “Young researchers’ career development project—training of doctoral students” of the Croatian Science Foundation. This research was funded by the European Union, which provided the EUROPEAN REGIONAL DEVELOPMENT FUND, grant number KK.01.1.1.04.0067.

Institutional Review Board Statement

Not applicable.

Data Availability Statement

The raw data supporting the conclusions of this article will be made available by the authors on request.

Conflicts of Interest

The authors declare no conflicts of interest.

References

  1. Grote, U.; Fasse, A.; Nguyen, T.T.; Erenstein, O. Food security and the dynamics of wheat and maize value chains in Africa and Asia. Front. Sustain. Food Syst. 2021, 4, 617009. [Google Scholar] [CrossRef]
  2. Asseng, S.; Ewert, F.; Martre, P.; Rötter, R.P.; Lobell, D.B.; Cammarano, D.; Kimball, B.A.; Ottman, M.J.; Wall, G.W.; White, J.W.; et al. Rising temperatures reduce global wheat production. Nat. Clim. Chang. 2015, 5, 143–147. [Google Scholar] [CrossRef]
  3. Prasad, P.V.V.; Pisipati, S.; Momčilović, I.; Ristic, Z. Independent and combined effects of high temperature and drought stress during grain filling on plant yield and chloroplast EF-Tu expression in spring wheat. J. Agron. Crop Sci. 2011, 197, 430–441. [Google Scholar] [CrossRef]
  4. Yusa, A.; Berry, P.J.; Cheng, J.; Ogden, N.; Bonsal, B.; Stewart, R.; Waldick, R. Climate change, drought and human health in Canada. Int. J. Environ. Res. Public Health 2015, 12, 8359–8412. [Google Scholar] [CrossRef] [PubMed]
  5. Begna, T. Effects of drought stress on crop production and productivity. Int. J. Res. Stud. Agric. Sci. 2020, 6, 34–43. [Google Scholar] [CrossRef]
  6. Wan, C.; Dang, P.; Gao, L.; Wang, J.; Tao, J.; Qin, X.; Feng, B.; Gao, J. How does the environment affect wheat yield and protein content response to drought? A meta-analysis. Front. Plant Sci. 2022, 13, 896985. [Google Scholar] [CrossRef] [PubMed]
  7. FAO. Crop Prospects and Food Situation. Available online: https://openknowledge.fao.org/handle/20.500.14283/cb7877en (accessed on 23 March 2024).
  8. Duvnjak, J.; Lončarić, A.; Brkljačić, L.; Šamec, D.; Šarčević, H.; Salopek-Sondi, B.; Španić, V. Morpho-physiological and hormonal response of winter wheat varieties to drought stress at stem elongation and anthesis stages. Plants 2023, 12, 3. [Google Scholar] [CrossRef]
  9. Ahmed, H.G.M.D.; Zeng, Y.; Shah, A.N.; Yar, M.M.; Ullah, A.; Ali, M. Conferring of drought tolerance in wheat (Triticum aestivum L.) Genotypes using seedling indices. Front. Plant Sci. 2022, 13, 961049. [Google Scholar] [CrossRef]
  10. Ma, J.; Li, R.; Wang, H.; Li, D.; Wang, X.; Zhang, Y.; Zhen, W.; Duan, H.; Yan, G.; Li, Y. Transcriptomics analyses reveal wheat responses to drought stress during reproductive stages under field conditions. Front. Plant Sci. 2017, 8, 592. [Google Scholar] [CrossRef] [PubMed]
  11. Raza, A.; Razzaq, A.; Mehmood, S.S.; Zou, X.; Zhang, X.; Lv, Y.; Xu, J. Impact of climate change on crops adaptation and strategies to tackle its outcome: A review. Plants 2019, 8, 34. [Google Scholar] [CrossRef]
  12. Bapela, T.; Shimelis, H.; Tsilo, T.J.; Mathew, I. Genetic improvement of wheat for drought tolerance: Progress, challenges and opportunities. Plants 2022, 11, 1331. [Google Scholar] [CrossRef] [PubMed]
  13. Qayyum, A.; Al Ayoubi, S.; Sher, A.; Bibi, Y.; Ahmad, S.; Shen, Z.; Jenks, M. Improvement in drought tolerance in bread wheat is related to an improvement in osmolyte production, antioxidant enzyme activities, and gaseous exchange. Saudi J. Biol. Sci. 2021, 28, 5238–5249. [Google Scholar] [CrossRef] [PubMed]
  14. Camaille, M.; Fabre, N.; Clément, C.; Barka, E.A. Advances in wheat physiology in response to drought and the role of plant growth promoting rhizobacteria to trigger drought tolerance. Microorganisms 2021, 9, 687. [Google Scholar] [CrossRef] [PubMed]
  15. Fahad, S.; Bajwa, A.A.; Nazir, U.; Anjum, S.A.; Farooq, A.; Zohaib, A.; Sadia, S.; Nasim, W.; Adkins, S.; Saud, S.; et al. Crop production under drought and heat stress: Plant responses and management options. Front. Plant Sci. 2017, 8, 1147. [Google Scholar] [CrossRef] [PubMed]
  16. Reddy, S.K.; Liu, S.; Rudd, J.C.; Xue, Q.; Payton, P.; Finlayson, S.A.; Mahan, J.; Akhunova, A.; Holalu, S.V.; Lu, N. Physiology and transcriptomics of water-deficit stress responses in wheat cultivars TAM 111 and TAM 112. J. Plant Physiol. 2014, 171, 1289–1298. [Google Scholar] [CrossRef] [PubMed]
  17. Miller, G.; Suzuki, N.; Ciftci-Yilmaz, S.; Mittler, R. Reactive oxygen species homeostasis and signaling during drought and salinity stresses. Plant Cell Environ. 2010, 33, 453–467. [Google Scholar] [CrossRef] [PubMed]
  18. Mazat, J.; Devin, A.; Ransac, S. Modelling mitochondrial ROS production by the respiratory chain. Cell. Mol. Life Sci. 2020, 77, 455–465. [Google Scholar] [CrossRef]
  19. Mishra, N.; Jiang, C.; Chen, L.; Paul, A.; Chatterjee, A.; Shen, G. Achieving abiotic stress tolerance in plants through antioxidative defense mechanisms. Front. Plant Sci. 2023, 14, 1110622. [Google Scholar] [CrossRef]
  20. Rajput, V.D.; Harish, S.R.K.; Verma, K.K.; Sharma, L.; Quiroz-Figueroa, F.R.; Meena, M.; Gour, V.S.; Minkina, T.; Sushkova, S.; Mandzhieva, S. Recent developments in enzymatic antioxidant defence mechanism in plants with special reference to abiotic stress. Biology 2021, 10, 267. [Google Scholar] [CrossRef]
  21. Shokat, S.; Großkinsky, D.K.; Roitsch, T.; Liu, F. Activities of leaf and spike carbohydrate-metabolic and antioxidant enzymes are linked with yield performance in three spring wheat genotypes grown under well-watered and drought conditions. BMC Plant Biol. 2020, 20, 400. [Google Scholar] [CrossRef]
  22. Vuković, R.; Štolfa Čamagajevac, I.; Vuković, A.; Šunić, K.; Begović, L.; Mlinarić, S.; Sekulić, R.; Sabo, N.; Španić, V. Physiological, biochemical and molecular response of different winter wheat varieties under drought stress at germination and seedling growth stage. Antioxidants 2022, 11, 693. [Google Scholar] [CrossRef] [PubMed]
  23. Rampino, P.; Pataleo, S.; Gerardi, C.; Mita, G.; Perrotta, C. Drought stress response in wheat: Physiological and molecular analysis of resistant and sensitive genotypes. Plant Cell Environ. 2006, 29, 2143–2152. [Google Scholar] [CrossRef] [PubMed]
  24. Javed, T.; Shabbir, R.; Ali, A.; Afzal, I.; Zaheer, U.; Gao, S.J. Transcription factors in plant stress responses: Challenges and potential for sugarcane improvement. Plants 2020, 9, 491. [Google Scholar] [CrossRef] [PubMed]
  25. Lucas, S.; Durmaz, E.; Akpınar, B.A.; Budak, H. The drought response displayed by a DRE-binding protein from Triticum dicoccoides. Plant Physiol. Biochem. 2011, 49, 346–351. [Google Scholar] [CrossRef] [PubMed]
  26. Mizoi, J.; Shinozaki, K.; Yamaguchi-Shinozaki, K. AP2/ERF Family transcription factors in plant abiotic stress responses. Biochim. Biophys. Acta Gene Regul. 2012, 1819, 86–96. [Google Scholar] [CrossRef] [PubMed]
  27. Shen, Y.G.; Zhang, W.K.; He, S.J.; Zhang, J.S.; Liu, Q.; Chen, S.Y. An EREBP/AP2-type protein in Triticum aestivum was a DRE-binding transcription factor induced by cold, dehydration and ABA stress. Theor. Appl. Genet. 2003, 106, 923–930. [Google Scholar] [CrossRef] [PubMed]
  28. Liu, H.; Yang, Y.; Zhang, L. Identification of upstream transcription factors and an interacting PP2C protein of dehydrin WZY2 gene in wheat. Plant Signal Behav. 2019, 14, 1678370. [Google Scholar] [CrossRef]
  29. Zotova, L.; Kurishbayev, A.; Jatayev, S.; Khassanova, G.; Zhubatkanov, A.; Serikbay, D.; Sereda, S.; Sereda, T.; Shvidchenko, V.; Lopato, S. Genes encoding transcription factors TaDREB5 and TaNFYC-A7 are differentially expressed in leaves of bread wheat in response to drought, dehydration and ABA. Front. Plant Sci. 2018, 9, 1441. [Google Scholar] [CrossRef]
  30. Abedini, R.; Ghanegolmohammadi, F.; Pishkamrad, R.; Pourabed, E.; Jafarnezhad, A.; Shobbar, Z.S.; Shahbazi, M. Plant dehydrins: Shedding light on structure and expression patterns of dehydrin gene family in barley. J. Plant Res. 2017, 130, 747–763. [Google Scholar] [CrossRef]
  31. Brini, F.; Yamamoto, A.; Jlaiel, L.; Takeda, S.; Hobo, T.; Dinh, H.Q.; Hattori, T.; Masmoudi, K.; Hanin, M. Pleiotropic effects of the wheat dehydrin DHN-5 on stress responses in Arabidopsis. Plant Cell Physiolog. 2011, 52, 676–688. [Google Scholar] [CrossRef]
  32. Saibi, W.; Feki, K.; Mahmoud, R.B.; Brini, F. Durum wheat dehydrin (DHN-5) confers salinity tolerance to transgenic Arabidopsis plants through the regulation of proline metabolism and ROS scavenging system. Planta 2015, 242, 1187–1194. [Google Scholar] [CrossRef] [PubMed]
  33. Maghsoudi, K.; Emam, Y.; Niazi, A.; Pessarakli, M.; Arvin, M.J. P5CS expression level and proline accumulation in the sensitive and tolerant wheat cultivars under control and drought stress conditions in the presence/absence of silicon and salicylic acid. J. Plant Interact. 2018, 13, 461–471. [Google Scholar] [CrossRef]
  34. Vendruscolo, E.C.G.; Schuster, I.; Pileggi, M.; Scapim, C.A.; Molinari, H.B.C.; Marur, C.J.; Vieira, L.G.E. Stress-induced synthesis of proline confers tolerance to water deficit in transgenic wheat. J. Plant Physiol. 2007, 164, 1367–1376. [Google Scholar] [CrossRef] [PubMed]
  35. Lichtenthaler, H.K. Chlorophylls and carotenoids: Pigments of photosynthetic biomembranes. Methods Enzymol. 1987, 148, 350–382. [Google Scholar] [CrossRef]
  36. Verma, S.; Dubey, R.S. Lead toxicity induces lipid peroxidation and alters the activities of antioxidant enzymes in growing rice plants. Plant Sci. 2003, 164, 645–655. [Google Scholar] [CrossRef]
  37. Carillo, P.; Gibon, Y. Protocol: Extraction and Determination of Proline. Available online: https://www.researchgate.net/publication/211353600_PROTOCOL_Extraction_and_determination_of_proline (accessed on 25 March 2024).
  38. Griffith, O.W. Determination of glutathione and glutathione disulfide using glutathione reductase and 2-vinylpyridine. Anal. Biochem. 1980, 106, 207–212. [Google Scholar] [CrossRef] [PubMed]
  39. Bradford, M.M. A rapid and sensitive method for the quantitation of microgram quantities of protein utilizing the principle of protein-dye binding. Anal. Biochem. 1976, 72, 248–254. [Google Scholar] [CrossRef] [PubMed]
  40. Nakano, Y.; Asada, K. Hydrogen peroxide is scavenged by ascorbate-specific peroxidase in spinach chloroplasts. Plant Cell Physiolog. 1981, 22, 867–880. [Google Scholar] [CrossRef]
  41. Aebi, H. Catalase in vitro. Methods Enzymol. 1984, 105, 121–126. [Google Scholar] [CrossRef]
  42. Habig, W.H.; Pabst, M.J.; Jakoby, W.B. Glutathione S-Transferases: The first enzymatic step in mercapturic acid formation. J. Biol. Chem. 1974, 249, 7130–7139. [Google Scholar] [CrossRef]
  43. Ma, F.W.; Cheng, L. Exposure of the shaded side of apple fruit to full sun leads to up-regulation of both the xanthophyll cycle and the ascorbate-glutathione cycle. Hortic. Sci. 2004, 39, 887A–887. [Google Scholar] [CrossRef]
  44. Murshed, R.; Lopez-Lauri, F.; Sallanon, H. Microplate quantification of enzymes of the plant ascorbate–glutathione cycle. Anal. Biochem. 2008, 383, 320–322. [Google Scholar] [CrossRef]
  45. Hossain, M.A.; Araki, H.; Takahashi, T. Poor grain filling induced by waterlogging is similar to that in abnormal early ripening in wheat in western Japan. Field Crops Res. 2011, 123, 100–108. [Google Scholar] [CrossRef]
  46. Racker, E. Glutathione reductase from bakers’ yeast and beef liver. J. Biol. Chem. 1955, 217, 855–865. [Google Scholar] [CrossRef]
  47. Paolacci, A.R.; Tanzarella, O.A.; Porceddu, E.; Ciaffi, M. Identification and validation of reference genes for quantitative RT-PCR normalization in wheat. BMC Mol. Biol. 2009, 10, 11. [Google Scholar] [CrossRef]
  48. Tang, D.; Chen, M.; Huang, X.; Zhang, G.; Zeng, L.; Zhang, G.; Wu, S.; Wang, Y. SRplot: A free online platform for data visualization and graphing. PLoS ONE 2023, 18, e0294236. [Google Scholar] [CrossRef]
  49. Pompelli, M.F.; Arrieta, D.V.; Rodríguez, Y.Y.P.; Ramírez, A.M.J.; Bettin, A.M.V.; Avilez, M.A.Q.; Cárcamo, J.A.A.; Garcia-Castaño, S.G.; González, L.M.M.; Cordero, E.D.F.; et al. Can chlorophyll a fluorescence and photobleaching be a stress signal under abiotic stress in Vigna unguiculata L.? Sustainability 2022, 14, 15503. [Google Scholar] [CrossRef]
  50. Li, X.; Zhang, X.; Liu, G.; Tang, Y.; Zhou, C.; Zhang, L.; Lv, J. The spike plays important roles in the drought tolerance as compared to the flag leaf through the phenylpropanoid pathway in Wheat. Plant Physiol. Biochem. 2020, 152, 100–111. [Google Scholar] [CrossRef]
  51. García-Valenzuela, X.; García-Moya, E.; Rascón-Cruz, Q.; Herrera-Estrella, L.; Aguado-Santacruz, G.A. Chlorophyll accumulation is enhanced by osmotic stress in graminaceous chlorophyllic cells. J. Plant Physiol. 2005, 162, 650–661. [Google Scholar] [CrossRef]
  52. Chakraborty, U.; Pradhan, B. Drought stress-induced oxidative stress and antioxidative responses in four wheat (Triticum aestivum L.) varieties. Arch. Agron. Soil Sci. 2012, 58, 617–630. [Google Scholar] [CrossRef]
  53. Gururani, M.A.; Venkatesh, J.; Tran, L.S. Regulation of photosynthesis during abiotic stress-induced photoinhibition. Mol. Plant. 2015, 8, 1304–1320. [Google Scholar] [CrossRef]
  54. Mohi-Ud-Din, M.; Siddiqui, N.; Rohman, M.; Jagadish, S.V.K.; Ahmed, J.U.; Hassan, M.M.; Hossain, A.; Islam, T. Physiological and biochemical dissection reveals a trade-off between antioxidant capacity and heat tolerance in bread wheat (Triticum aestivum L.). Antioxidants 2021, 10, 351. [Google Scholar] [CrossRef]
  55. Anjum, S.A.; Ashraf, U.; Tanveer, M.; Khan, I.; Hussain, S.; Shahzad, B.; Zohaib, A.; Abbas, F.; Seleem, M.F.; Ali, I.; et al. Drought induced changes in growth, osmolyte accumulation and antioxidant metabolism of three maize hybrids. Front. Plant Sci. 2017, 8, 69. [Google Scholar] [CrossRef]
  56. Ahmed, H.G.M.; Zeng, Y.; Yang, X.; Anwaar, H.A.; Mansha, M.Z.; Hanif, C.M.S.; Ikram, K.; Ullah, A.; Alghanem, S.M.S. Conferring drought-tolerant wheat genotypes through morpho-physiological and chlorophyll indices at seedling stage. Saudi J. Biol. Sci. 2020, 27, 2116–2123. [Google Scholar] [CrossRef]
  57. Jiang, Y.; Huang, B. Drought and heat stress injury to two cool-season turfgrasses in relation to antioxidant metabolism and lipid peroxidation. Crop. Sci. 2001, 41, 436–442. [Google Scholar] [CrossRef]
  58. Barnabás, B.; Jäger, K.; Fehér, A. The effect of drought and heat stress on reproductive processes in cereals. Plant Cell Environ. 2008, 31, 11–38. [Google Scholar] [CrossRef]
  59. Sultan, M.A.R.F.; Hui, L.; Yang, L.J.; Xian, Z.H. Assessment of drought tolerance of some Triticum L. species through physiological indices. Czech J. Genet. Plant Breed. 2012, 48, 178–184. [Google Scholar] [CrossRef]
  60. Kavi Kishor, P.B.; Suravajhala, P.; Rathnagiri, P.; Sreenivasulu, N. Intriguing role of proline in redox potential conferring high temperature stress tolerance. Front. Plant Sci. 2022, 13, 867531. [Google Scholar] [CrossRef]
  61. Reddy, A.R.; Chaitanya, K.V.; Vivekanandan, M. Drought-induced responses of photosynthesis and antioxidant metabolism in higher plants. J. Plant Physiol. 2004, 161, 1189–1202. [Google Scholar] [CrossRef] [PubMed]
  62. Peršić, V.; Ament, A.; Antunović Dunić, J.; Drezner, G.; Cesar, V. PEG-induced physiological drought for screening winter wheat genotypes sensitivity–integrated biochemical and chlorophyll a fluorescence analysis. Front. Plant Sci. 2022, 13, 987702. [Google Scholar] [CrossRef] [PubMed]
  63. Chun, S.C.; Paramasivan, M.; Chandrasekaran, M. Proline accumulation influenced by osmotic stress in arbuscular mycorrhizal symbiotic plants. Front. Microbiol. 2018, 9, 2525. [Google Scholar] [CrossRef] [PubMed]
  64. Zhang, X.; Wang, Z.; Li, Y.; Guo, R.; Liu, E.; Liu, X.; Gu, F.; Yang, Z.; Li, S.; Zhong, X.; et al. Wheat genotypes with higher yield sensitivity to drought overproduced proline and lost minor biomass under severer water stress. Front. Plant Sci. 2022, 13, 1035038. [Google Scholar] [CrossRef] [PubMed]
  65. Wang, Z.; Yang, Y.; Yadav, V.; Zhao, W.; He, Y.; Zhang, X.; Wei, C. Drought-induced proline is mainly synthesized in leaves and transported to roots in watermelon under water deficit. Hortic. Plant J. 2022, 8, 615–626. [Google Scholar] [CrossRef]
  66. Khaleghi, A.; Naderi, R.; Brunetti, C.; Maserti, B.E.; Salami, S.A.; Babalar, M. Morphological, physiochemical and antioxidant responses of Maclura pomifera to drought stress. Sci. Rep. 2019, 9, 19250. [Google Scholar] [CrossRef] [PubMed]
  67. Checa, J.; Aran, J.M. Reactive oxygen species: Drivers of physiological and pathological processes. J. Inflamm. Res. 2020, 13, 1057–1073. [Google Scholar] [CrossRef] [PubMed]
  68. Keleş, Y.; Öncel, I. Response of antioxidative defence system to temperature and water stress combinations in wheat seedlings. Plant Sci. 2002, 163, 783–790. [Google Scholar] [CrossRef]
  69. Caverzan, A.; Passaia, G.; Rosa, S.B.; Ribeiro, C.W.; Lazzarotto, F.; Margis-Pinheiro, M. Plant responses to stresses: Role of ascorbate peroxidase in the antioxidant protection. Genet. Mol. Biol. 2012, 35, 1011–1019. [Google Scholar] [CrossRef] [PubMed]
  70. Devi, R.; Kaur, N.; Gupta, A.N. Potential of antioxidant enzymes in depicting drought tolerance of wheat (Triticum aestivum L.). Indian J. Biochem. Biophys. 2012, 49, 257–265. [Google Scholar]
  71. Foyer, C.H.; Noctor, G. Ascorbate and glutathione: The heart of the redox hub. Plant Physiol. 2011, 155, 2–18. [Google Scholar] [CrossRef]
  72. Sofo, A.; Dichio, B.; Xiloyannis, C.; Masia, A. Antioxidant defences in olive trees during drought stress: Changes in activity of some antioxidant enzymes. Funct. Plant Biol. 2005, 32, 45–53. [Google Scholar] [CrossRef]
  73. Smirnoff, N. Ascorbic acid metabolism and functions: A comparison of plants and mammals. Free Radic. Biol. Med. 2018, 122, 116–129. [Google Scholar] [CrossRef] [PubMed]
  74. D’Arcy-Lameta, A.; Ferrari-Iliou, R.; Contour-Ansel, D.; Pham-Thi, A.T.; Zuily-Fodil, Y. Isolation and characterization of four ascorbate peroxidase cDNAs responsive to water deficit in cowpea leaves. Ann. Bot. 2006, 97, 133–140. [Google Scholar] [CrossRef] [PubMed]
  75. Hasanuzzaman, M.; Nahar, K.; Anee, T.I.; Fujita, M. Exogenous silicon attenuates cadmium-induced oxidative stress in Brassica napus L. by modulating AsA-GSH pathway and glyoxalase system. Front. Plant Sci. 2017, 8, 1061. [Google Scholar] [CrossRef] [PubMed]
  76. Herbinger, K.; Tausz, M.; Wonisch, A.; Soja, G.; Sorger, A.; Grill, D. Complex interactive effects of drought and ozone stress on the antioxidant defence systems of two wheat cultivars. Plant Physiol. Biochem. 2002, 40, 691–696. [Google Scholar] [CrossRef]
  77. Loggini, B.; Scartazza, A.; Brugnoli, E.; Navari-Izzo, F. Antioxidative defense system, pigment composition, and photosynthetic efficiency in two wheat cultivars subjected to drought1. Plant Physiol. 1999, 119, 1091–1100. [Google Scholar] [CrossRef] [PubMed]
  78. Khattab, H. Role of glutathione and polyadenylic acid on the oxidative defense systems of two different cultivars of canola seedlings grown under saline condition. Aust. J. Basic Appl. Sci. 2007, 1, 323–334. [Google Scholar]
  79. Nahar, K.; Hasanuzzaman, M.; Alam, M.M.; Fujita, M. Glutathione-induced drought stress tolerance in mung bean: Coordinated roles of the sntioxidant defence and methylglyoxal detoxification systems. AoB Plants 2015, 7, plv069. [Google Scholar] [CrossRef] [PubMed]
  80. Rao, A.S.V.C.; Reddy, A.R. Glutathione Reductase: A Putative Redox Regulatory System in Plant Cells; Khan, N.A., Singh, S., Umar, S., Eds.; Springer: Berlin/Heidelberg, Germany, 2008; pp. 111–147. [Google Scholar] [CrossRef]
  81. Jiang, Y.; Zhang, Y.; Duan, R.; Fan, J.; Jiao, P.; Sun, H.; Guan, S.; Liu, S. Overexpression of maize Glutathione S-Transferase ZmGST26 decreases drought resistance of Arabidopsis. Agronomy 2022, 12, 2948. [Google Scholar] [CrossRef]
  82. Kim, Y.S.; Park, S.I.; Kim, J.J.; Shin, S.Y.; Kwak, S.S.; Lee, C.H.; Park, H.M.; Kim, Y.H.; Kim, I.S.; Yoon, H.S. Over-expression of dehydroascorbate reductase improves salt tolerance, environmental adaptability and productivity in Oryza Sativa. Antioxidants 2022, 11, 1077. [Google Scholar] [CrossRef]
  83. Melandri, G.; AbdElgawad, H.; Riewe, D.; Hageman, J.A.; Asard, H.; Beemster, G.T.; Kadam, N.; Jagadish, K.; Altmann, T.; Ruyter-Spira, C.; et al. Biomarkers for grain yield stability in rice under drought stress. J. Exp. Bot. 2020, 71, 669–683. [Google Scholar] [CrossRef]
  84. Chen, Z.; Gallie, D.R. Dehydroascorbate reductase affects leaf growth, development, and function. Plant Physiol. 2006, 142, 775–787. [Google Scholar] [CrossRef] [PubMed]
  85. Xie, C.; Zhang, R.; Qu, Y.; Miao, Z.; Zhang, Y.; Shen, X.; Wang, T.; Dong, J. Overexpression of MtCAS31 enhances drought tolerance in transgenic Arabidopsis by reducing stomatal density. New Phytol. 2012, 195, 124–135. [Google Scholar] [CrossRef]
  86. Liu, H.; Yu, C.; Li, H.; Ouyang, B.; Wang, T.; Zhang, J.; Wang, X.; Ye, Z. Overexpression of ShDHN, a dehydrin gene from solanum habrochaites enhances tolerance to multiple abiotic stresses in tomato. Plant Sci. 2015, 231, 198–211. [Google Scholar] [CrossRef] [PubMed]
  87. Bao, F.; Du, D.; An, Y.; Yang, W.; Wang, J.; Cheng, T.; Zhang, Q. Overexpression of prunus mume dehydrin genes in tobacco enhances tolerance to cold and drought. Front. Plant Sci. 2017, 8, 151. [Google Scholar] [CrossRef] [PubMed]
  88. Hao, Y.; Hao, M.; Cui, Y.; Kong, L.; Wang, H. Genome-wide survey of the dehydrin genes in bread wheat (Triticum aestivum L.) and its relatives: Identification, evolution and expression profiling under various abiotic stresses. BMC Genom. 2022, 23, 73. [Google Scholar] [CrossRef] [PubMed]
  89. Huang, F.; Zhang, L.; Wang, L.; Jiang, B.; Wen, J. Cloning and sequence analysis of a new dehydrin gene (wzy2) from wheat. J. Northwest A F Univ.-Nat. Sci. Ed. 2009, 37, 93–99. [Google Scholar]
  90. Zhu, W.; Zhang, L.; Zhang, N.; Xing, Y.; Jiang, B. The clone of wheat dehydrin-like gene Wzy2 and its functional analysis in Pichia pastoris. Afr. J. Biotechnol. 2012, 11, 9549–9558. [Google Scholar] [CrossRef]
  91. Ma, L.; Zhou, E.; Gao, L.; Mao, X.; Zhou, R.; Jia, J. Isolation, expression analysis and chromosomal location of P5CR gene in common wheat (Triticum aestivum L.). S. Afr. J. Bot. 2008, 74, 705–712. [Google Scholar] [CrossRef]
  92. De Ronde, J.A.; Cress, W.A.; Krüger, G.H.J.; Strasser, R.J.; Staden, J.V. Photosynthetic response of transgenic soybean plants, containing an Arabidopsis P5CR gene, during heat and drought stress. J. Plant Physiol. 2004, 161, 1211–1224. [Google Scholar] [CrossRef]
  93. Nocek, B.; Chang, C.; Li, H.; Lezondra, L.; Holzle, D.; Collart, F.; Joachimiak, A. Crystal structures of Δ1-Pyrroline-5-Carboxylate reductase from human pathogens Neisseria meningitides and Streptococcus pyogenes. J. Mol. Biol. 2005, 354, 91–106. [Google Scholar] [CrossRef]
  94. Hien, D.; Jacobs, M.; Angenon, G.; Hermans, C.; Thanh, T.; Le Van Son, T.; Roosens, N. Proline accumulation and D 1-pyrroline-5-carboxylate synthetase gene properties in three rice cultivars differing in salinity and drought tolerance. Plant Sci. 2003, 165, 1059–1068. [Google Scholar] [CrossRef]
  95. Bohnert, H.J.; Nelson, D.E.; Jensen, R.G. Adaptations to environmental stresses. Plant Cell 1995, 7, 1099–1111. [Google Scholar] [CrossRef]
  96. Liu, Q.; Kasuga, M.; Sakuma, Y.; Abe, H.; Miura, S.; Yamaguchi-Shinozaki, K.; Shinozaki, K. Two transcription factors, DREB1 and DREB2, with an EREBP/AP2 DNA binding domain separate two cellular signal transduction pathways in drought-and low-temperature-responsive gene expression, respectively, in Arabidopsis. Plant Cell 1998, 10, 1391–1406. [Google Scholar] [CrossRef]
  97. Hou, L.; Wu, Q.; Zhu, X.; Li, X.; Fan, X.; Hui, M.; Ye, Q.; Liu, G.; Liu, X. Transcription factor VvDREB2A from Vitis vinifera improves cold tolerance. Int. J. Mol. Sci. 2023, 24, 9381. [Google Scholar] [CrossRef]
  98. Arroyo Herrera, A.; Figueroa-Yáñez, L.; Castaño, E.; Santamaría, J.; Pereira-Santana, A.; Espadas, J.; Sánchez-Teyer, L.; Espadas-Gil, F.; Alcaraz, L.D.; López-Gómez, R. A novel Dreb2-type gene from carica papaya confers tolerance under abiotic stress. Plant Cell Tissue Organ. Cult. 2016, 125, 119–133. [Google Scholar] [CrossRef]
  99. Yousfi, S.; Márquez, A.J.; Betti, M.; Araus, J.L.; Serret, M.D. Gene expression and physiological responses to salinity and water stress of contrasting durum wheat genotypes. J. Integr. Plant Biol. 2016, 58, 48–66. [Google Scholar] [CrossRef]
  100. Hwang, J.E.; Lim, C.J.; Chen, H.; Je, J.; Song, C.; Lim, C.O. Overexpression of Arabidopsis dehydration-responsive element-binding protein 2C confers tolerance to oxidative stress. Mol. Cell 2012, 33, 135–140. [Google Scholar] [CrossRef]
  101. Kurahashi, Y.; Terashima, A.; Takumi, S. Variation in dehydration tolerance, ABA sensitivity and related gene expression patterns in D-genome progenitor and synthetic hexaploid wheat lines. Int. J. Mol. Sci. 2009, 10, 2733–2751. [Google Scholar] [CrossRef]
  102. Brinton, J.; Simmonds, J.; Minter, F.; Leverington-Waite, M.; Snape, J.; Uauy, C. Increased pericarp cell length underlies a major quantitative trait locus for grain weight in hexaploid wheat. New Phytol. 2017, 215, 3. [Google Scholar] [CrossRef]
  103. Evers, A.D.; Cox, R.I.; Shaheedullah, M.Z.; Withey, R.P. Predicting milling extraction rate by image analysis of wheat grains. Asp. Appl. Biol. 1990, 25, 417–426. [Google Scholar]
  104. Russo, M.; Ficco, D.; Laidò, G.; Marone, D.; Papa, R.; Blanco, A.; Gadaleta, A.; De Vita, P.; Mastrangelo, A. A dense durum wheat × T. dicoccum linkage map based on SNP markers for the study of seed morphology. Mol. Breed. 2014, 34, 1579–1597. [Google Scholar] [CrossRef]
  105. Wu, Q.H.; Chen, Y.X.; Zhou, S.H.; Fu, L.; Chen, J.J.; Xiao, Y.; Zhang, D.; Ouyang, S.H.; Cui, Y.; Zhang, D.Y.; et al. High-density genetic linkage map construction and QTL mapping of grain shape and size in the wheat population Yanda1817 × Beinong6. PLoS ONE 2015, 10, 0118144. [Google Scholar] [CrossRef] [PubMed]
  106. Ahmadi, A.; Baker, D.A. The effect of water stress on the activities of key regulatory enzymes of the sucrose to starch pathway in wheat. Plant Growth Regul. 2001, 35, 81–91. [Google Scholar] [CrossRef]
  107. Simmonds, J.; Scott, P.; Leverington-Waite, M.; Turner, A.S.; Brinton, J.; Korzun, V.; Snape, J.; Uauy, C. Identification and independent validation of a stable yield and thousand grain weight QTL on chromosome 6A of hexaploid wheat (Triticum aestivum L.). BMC Plant Biol. 2014, 14, 191. [Google Scholar] [CrossRef] [PubMed]
  108. Alghabari, F.; Lukac, M.; Jones, H.E.; Gooding, M.J. Effect of Rht alleles on the tolerance of wheat grain set to high temperature and drought stress during booting and anthesis. J. Agron. Crop. Sci. 2014, 200, 36–45. [Google Scholar] [CrossRef]
  109. Kino, R.I.; Pellny, T.K.; Mitchell, R.A.C.; Gonzalez-Uriarte, A.; Tosi, P. High post-anthesis temperature effects on bread wheat (Triticum aestivum L.) grain transcriptome during early grain-filling. BMC Plant Biol. 2020, 20, 1. [Google Scholar] [CrossRef] [PubMed]
  110. Dolferus, R.; Ji, X.; Richards, R.A. Abiotic stress and control of grain number in cereals. Plant Sci. 2011, 181, 331–341. [Google Scholar] [CrossRef]
  111. Dhakal, A. Effect of drought stress and management in wheat—A review. Food Agribus. Manag. 2021, 2, 62–66. [Google Scholar] [CrossRef]
Figure 1. Content of (A) chlorophyll a (Chl a), (B) chlorophyll b (Chl b), (C) chlorophyll a + b (Chl a+b), and (D) carotenoids (Car) in the wheat flag leaves of six winter wheat genotypes under control and two drought treatments (T1 = VSMC − 45%, T2 = VSMC − 65%). Data are average values of six biological replicates ± SD. Significant differences among treatments for each genotype, separately, were assessed by the Fisher LSD test. Trait means with the same letter do not significantly differ at p < 0.05.
Agronomy 14 01522 g001
Figure 2. Content of (A) malondialdehyde (MDA) and (B) proline in wheat flag leaves of six winter wheat genotypes under control and two drought treatments (T1 = VSMC − 45%, T2 = VSMC − 65%). Data are average values of six biological replicates ± SD. Significant differences among treatments for each genotype, separately, were assessed by the Fisher LSD test. Trait means with the same letter do not significantly differ at p < 0.05.
Agronomy 14 01522 g002
Figure 3. Content of total glutathione (tGSH) in wheat flag leaves of six winter wheat genotypes under control and two drought treatments (T1 = VSMC − 45%, T2 = VSMC − 65%). Data are average values of six biological replicates ± SD. Significant differences among treatments for each genotype, separately, were assessed by the Fisher LSD test. Trait means with the same letter do not significantly differ at p < 0.05.
Agronomy 14 01522 g003
Figure 4. The activity of (A) ascorbate peroxidase (APX), (B) glutathione reductase (GR), (C) dehydroascorbate reductase (DHAR), (D) monodehydroascorbate (MDHAR), (E) catalase (CAT), and (F) glutathione S-transferase (GST) in wheat flag leaves of six winter wheat genotypes under control and two drought treatments (T1 = VSMC − 45%, T2 = VSMC − 65%). Data are average values of six biological replicates ± SD. Significant differences among treatments for each genotype, separately, were assessed by the Fisher LSD test. Trait means with the same letter do not significantly differ at p < 0.05.
Agronomy 14 01522 g004
Figure 5. Relatively expression levels of DHN5 (A), WZY2 (B), P5CS (C), DREB1 (D), and DREB2 (E) in wheat flag leaves of six winter wheat genotypes under control and two drought treatments (T1 = VSMC − 45%, T2 = VSMC − 65%). Data are average values of three biological replicates ± SD. Significant differences among treatments, for each genotype, separately, were assessed by the Fisher LSD test. Trait means with the same letter do not significantly different at p < 0.05.
Agronomy 14 01522 g005
Figure 6. Grain weight (A), grain area (B), grain width (C), grain length (D), and grain circularity (E) after harvest of six winter wheat genotypes under control and two drought treatments (T1 = VSMC − 45%, T2 = VSMC − 65%). Data are average values of six biological replicates ± SD. Significant differences among treatments, for each genotype, separately, were assessed by the Fisher LSD test. Trait means with the same letter do not significantly differ at p < 0.05.
Agronomy 14 01522 g006
Table 1. Origin and tolerance of wheat genotypes to drought.
Wheat CultivarOriginRegistration YearDrought Tolerance
BubnjarAIO, HR2016tolerant
PepeljugaAIO, HR2017medium tolerant
AnđelkaAIO, HR2008medium tolerant
RujanaAIO, HR2017medium sensitive
FifiAIO, HR2016medium sensitive
SilvijaAIO, HR2010sensitive
Abbreviations: AIO, Agricultural Institute Osijek; HR, Croatia.
Table 2. Oligonucleotide primer sequences.
Target GeneGenBank
Accession No.
Product Length (bp)Forward PrimerTm
and
%CG
Reverse PrimerTm
and
%CG
P5CSKT86885085ccggtgaatggcagagtaat60 °C, 50%ccccacggagaactttaaca60 °C, 50%
DHN5AY61956699agaagaagggcatcatggac59.1 °C, 50%ggcacctccactctcagaag60 °C, 60%
WZY2KF112871142tcgttcgtcgtggtagtctg59.9 °C, 55%atgaccttgctgtccgtagg60 °C, 55%
DREB1DQ19507080gttggtacccaacccaagtg60.1 °C, 55%aacagaacgaagcagggcta60 °C, 50%
DREB2AY781345.1121ccacagctcgttcaaagtga60 °C, 50%atgccattcaaaaaccaagc60 °C, 40%
actinAK457930215tgaccgtatgagcaaggag58 °C, 53%ccagacaactcgcaacttag60 °C, 50%
Disclaimer/Publisher’s Note: The statements, opinions and data contained in all publications are solely those of the individual author(s) and contributor(s) and not of MDPI and/or the editor(s). MDPI and/or the editor(s) disclaim responsibility for any injury to people or property resulting from any ideas, methods, instructions or products referred to in the content.

