Article

Continuous Intercropping Increases the Depletion of Soil Available and Non-Labile Phosphorus

1
College of Resources and Environment, Yunnan Agricultural University, Kunming 650201, China
2
Institute of Resources and Environment, Kunming Academy of Agricultural Sciences, Kunming 650118, China
3
Yunnan Open University, Kunming 650599, China
*
Author to whom correspondence should be addressed.
These authors contributed equally to this work.
Agronomy 2024, 14(6), 1121; https://doi.org/10.3390/agronomy14061121
Submission received: 12 April 2024 / Revised: 13 May 2024 / Accepted: 21 May 2024 / Published: 24 May 2024
(This article belongs to the Special Issue Advances in Soil Fertility, Plant Nutrition and Nutrient Management)

Abstract

:
Background and aims: This research aimed to evaluate the effects of consecutive intercropping on soil phosphorus (P) partitioning, concentrations, and sensitivity to P fertilizer application, elucidating its impact on soil P bioavailability. Methods: A field experiment investigated soil P fractions and content under continuous wheat and faba bean intercropping. Three P levels (0, 45, and 90 kg P2O5 ha−1 denoted as P0, P1, and P2, respectively) and three planting patterns (monocropped wheat (MW), monocropped faba bean (MF), and wheat and faba bean intercropping (W//F)) were established since 2014. Aboveground P uptake by wheat and faba bean was determined. The soil P fractions and content were analyzed after six-, seven-, and eight-year continuous field experiments. Results: Wheat and faba bean intercropping increased wheat aboveground P uptake by 28.3–42.7% compared to MW under P1 and P2 levels and presented a P uptake advantage (LERPuptake > 1), although W//F had no impact on faba bean P uptake. Consequently, continuous intercropping for 8 years decreased soil available P reserves by 9.0–23.4% in comparison to the weighted average value of MW and MF (It). Faba bean consumed greater non-labile and labile P than wheat with low P input. W//F had nearly no impact on the labile P pool but reduced the non-labile P pool by 5.0–12.1% under all P levels and lowered the moderately labile P pool by 1.7–4.7% at P0 and P1 levels compared to It with consecutive intercropping for 8 years. Consecutive intercropping of wheat and faba bean primarily decreased the proportion of Resin-P in the labile P pool and the proportion of Residual-P in the non-labile P pool. According to the structural equation model, crop P uptake mainly originated from soil available P, which was directly affected by non-labile P (Residual-P and Conc. HCl-P). In addition, intercropping changed the contribution of each P faction to crop P uptake compared to MW and MF, and P uptake in intercropping primarily depended on Conc. HCl- P and Dil. HCl-P. Therefore, consecutive intercropping decreased soil non-labile P and drove soil available P depletion, and intercropping’s increase of P uptake was related to the non-labile P mobilized to moderately labile and labile P. Conclusions: Continuous wheat and faba bean intercropping reduced non-labile P and led to soil available P depletion under low P input. This practice stimulated non-labile P mobilization, enhancing soil P fraction effectiveness and facilitating P uptake in intercropping. Continuous intercropping of wheat and faba bean is as an effective method to maximize the biological availability of soil P and reduce P application rates.

1. Introduction

Phosphorus (P) is an essential nutrient required for crop growth and development, contributing to the composition and metabolism of important compounds within plants [1]. Phosphorus exhibits poor mobility in the soil and is susceptible to adsorption and fixation, thereby reducing its effectiveness for crops [2,3]. The application of P fertilizers is an effective method for rapidly meeting crop growth demands. However, the long-term excessive use of P fertilizers not only leads to resource waste and economic loss but also results in a mismatch between soil P supply and plant P demand [4]. Long-term excessive P application significantly increases the available P content in the soil, but increasing the use of P fertilizer is not a feasible choice for improving crop yields [5,6]. From 1980 to 2007, the surplus of P in farmland continued to increase [7,8], and farmland soil has become a huge potential P reservoir [9], much of which crops cannot utilize [2,10]. The improvement of soil P efficiency and the stimulation of soil P bioavailability are highlighted for sustainable agriculture.
Intercropping plays an important role in improving soil P availability and promoting efficient P uptake and utilization [11,12], with cereal and legume intercropping being the most representative examples [11,13]. Previous studies have well reviewed the mechanism by which intercropping increases soil P availability and P use efficiency, showing that it stimulates root exudation, including proton, carboxylates, and acid phosphatase, and modulates root architecture and morphology [14]. For example, corn and faba bean intercropping promotes proton and organic acid secretion and increases the activity of acid phosphatase, which results in the activation of insoluble P [15]. Similarly, white lupin intercropped with cereal crops mobilizes insoluble soil P by increasing carboxylate secretion and enhancing cereal crop P uptake [16]. In particular, corn P uptake was stimulated when corn was intercropped with faba bean under low P conditions [17]. When wheat is intercropped with faba bean, the spatial distribution of root systems expands, the quantity of root systems increases, the secretion of root exudates contributing to the higher wheat rhizosphere available P content is increased, and the yield and income are increased [18,19].
The distribution of soil P pool and fractions depend on many factors, such as the P fertilizer application rate, soil type, crop species, and management practices [20]. It is well known that soil P can be classified into labile P, moderately labile P, and non-labile P [21,22]. However, the biological availability of soil P fractions varies with crop species [23] because different crops can absorb and utilize P from different fractions [24]. For example, corn is more likely to absorb inorganic P extracted by NaOH in the Hedley fractionation method (NaOH-Pi) [25], but soybean consumes less from the NaOH-Pi fraction [26]. In a sole faba bean system, a significant accumulation of organic P extracted by NaHCO3 (NaHCO3-Po) occurred. However, when maize and faba bean were intercropped, the mineralization of soil organic P fractions (NaOH-Po, Conc. HCl-Po) was promoted. Furthermore, intercropping resulted in the accumulation of NaOH-Pi and Dil. HCl-Pi fractions compared to monocropping [27]. Similarly, legume-based intercropping increases the content of labile, water-soluble, and non-labile P in the soil compared to monocropping [28].
To date, numerous investigations have focused on the increased crop P uptake and the transformation of soil insoluble P into soluble P in legume- and cereal-based intercropping. However, these findings mainly resulted from short-term intercropping. The long-term effects of intercropping on soil P pools and fractions due to continuous intercropping remain unclear. Liao et al. [27] found that regardless of P application, both mono- and inter-cropping depleted inorganic P from the labile P pool while accumulating organic P. Presti et al. [29] found that wheat and faba bean intercropping enhanced soil P bioavailability and crop P uptake, especially under low P conditions, and thus, it could be deduced that continuous intercropping might result in soil P depletion. However, it is unknown whether similar depletion patterns of soil P fractions are present among different soil types. Moreover, if soil P depletion exists due to continuous intercropping, which soil P fraction would be depleted, and do P rates affect the changes in soil P fractions? Therefore, this study aimed to: (1) determine the changes in soil P fractions due to continuous wheat and faba bean intercropping under different P rates; (2) identify the difference in soil P biological availability between wheat and faba bean and determine whether the contribution of the interaction of wheat and faba bean to intercropping enhances the P uptake.

2. Materials and Methods

2.1. Field Site

A field experiment was conducted at the Yunnan Agricultural University research station, which was established in 2014, located in Xundian (23°32′ N, 103°13′ E), Kunming, Yunnan Province, China. This region experiences a subtropical monsoon climate with four distinct seasons and an average annual temperature of 14.70 °C. The mean annual rainfall in this area is 1254 mm, and the field site is situated at an altitude of 1953.00 m. The monthly average temperature and rainfall during the growing season of the present study are shown in Figure S1. The soil in this region is classified as red soil (Ferralic Cambisol, FAO 2006), with clay, silt, and sand contents of 34, 52, and 14%, respectively, at a soil depth of 0–30 cm. At the beginning of the present study, the soil exhibited a bulk density of 1.38 g cm−3 and a pH of 7.2 (soil-to-water ratio of 1:2.5) [30]. The initial physical and chemical properties of the soil were as follows: soil organic matter (measured by the H2SO4-K2Cr2O7 oxidation method [31]) content of 20.6 g·kg−1, total nitrogen (N) (determined with the semi-micro Kjeldahl method) content of 1.14 g·kg−1, total P content of 0.98 g·kg−1, total potassium (K) (measured by the sodium hydroxide melting method with flame photometers) content of 24.25 g·kg−1, available nitrogen (measured by alkaline hydrolysis di-fusion method) [32] content of 80 mg·kg−1, Olsen P content of 17 mg·kg−1, and exchangeable K was measured by the measured in 1.0 mol L−1 NH4OAc extracts by flame photometry (LBT-6400A, Beijing Lichen Instrument Technology Co., Ltd., Beijing, China) [33], with the content of 146 mg·kg−1.

2.2. Experimental Design

A two-factor randomized block design was used in this study, with three planting patterns (monocropped wheat (MW), monocropped faba bean (MF), and intercropped wheat and faba bean (W//F)) and three P application levels (no P (P0), 45 kg P2O5 ha–1 (P1), and 90 kg P2O5 ha–1 (P2)). Each plot area was 5.4 m × 6 m, for a total area of 32.4 m2. All treatments were replicated three times.
Wheat was sown using the drill sowing method, with a sowing rate of 180 kg·ha−1 and a row spacing of 0.2 m. Consequently, 27 rows were present in each MW plot. Faba bean was sown using the dibble sowing method, with a row spacing of 0.3 m and a plant spacing of 0.1 m. As a result, each MF plot contained 18 rows. The planting pattern of wheat and faba bean intercropping was six rows of wheat intercropped with two rows of faba bean, which is a widely adopted practice by local farmers and in previous research. Intercropping plots were planted at identical densities for wheat and faba bean, and the details are shown in Figure 1.
In the present study, local wheat and faba bean varieties were utilized. Specifically, the wheat cultivar was Yunmai-52 (Triticum aestivum L.), while the faba bean cultivar was Yuxi Dalidou (Vicia faba L.). The wheat and faba bean seeds were provided by the Yunnan Academy of Agricultural Sciences. Urea, containing 46.0% nitrogen (N), was the N source, and ordinary superphosphate, containing 16.0% P2O5, served as the P source. Potassium sulfate, containing 50.0% K2O, was the potassium (K) source. Both the wheat and faba bean received equal application rates of P and K fertilizers, which were applied solely as base fertilizers. The K fertilizer was applied at 90 kg K2O·ha−1. The N application rate for wheat was 180 kg·ha−1, whereas for faba beans, it was 90 kg·ha−1. In the case of wheat, 90 kg·ha−1 N was applied as basal fertilizer, with an additional 90 kg·ha−1 applied as top-dressing during the wheat jointing stage. For faba beans, N fertilizer was applied as basal fertilizer.

2.3. Field Management

Since 2014, wheat and faba beans were sown at the same time, from October 15th to 20th in each year and harvested on April 20th–30th of the following year. After wheat and faba bean were harvested, the straw was removed, and the soil was left fallow from May to September. Local farmer practices, such as spray irrigation, weeding, and pesticide application, were followed for crop management during the experiment.

2.4. Sample Collection and Determination

Faba bean and wheat plants were collected at maturity, and each sample was collected randomly from five points in each given plot in 2020, 2021, and 2022. At that time, the field experiment was continuously conducted for 6, 7, and 8 years. The wheat sampling area was 0.2 m × 0.2 m, and each sampling point for faba bean was one plant. The plant P was solubilized using the H2SO4-H2O2 wet digestion method, and P was quantified by the vanadium–molybdenum method. The soil bulk density was measured after wheat and faba bean were harvested each year as follows: a ring knife was used to cut a natural soil sample from the plot, and brought back to the laboratory, dried in an oven at 105 °C, then we calculated the dried soil weight per unit volume [34]. Subsequently, 5-point (diagonal) and 10-point sampling methods were used to collect soil from a 0–20 cm depth in mono- and inter-cropped plots. For the intercropped plot, two-thirds of the soil samples were collected from the wheat rows and one-third from the faba bean rows. The soil sampling details are shown in Figure 1.
The Olsen-P content was determined using Olsen’s method through extraction of a known weight of soil with 0.5 M NaHCO3 (sodium bicarbonate, Chengdu Cologne Chemical Co., Ltd., Chengdu, China) [35]. The soil total P concentration (g·kg−1) was determined by alkaline fusion (NaOH (sodium hydroxide, Tianjin Zhiyuan Chemical Reagent Co., Ltd., Tianjin, China) 2 g, <0.25 mm soil 0.25 g, 450 °C for 15 min and then 720 °C for 15 min), and the Olsen-P and total P content of the extract followed colorimetric measurement using the molybdate–ascorbic acid method [36].
Sequential fractionation, as proposed by Hedley et al. [21] and modified by Tiessen and Moir [37], was used to analyze the P fractions. First, 0.5 g of soil was added to each 50-mL centrifuge tube. Subsequently, a 46 mm × 20 mm anionic resin strip and 30 mL of deionized water were added to the tube and shaken for 16 h at 200 R/s. After rinsing it in 50 mL water and shaking it with 0.5 M HCl (Chongqing Wansheng Chuandong Chemical Co., Ltd., Chongqing, China) for 16 h, the soil-containing tube water was discarded. Then, 30 mL of 0.5 M NaHCO3 at pH 8.5 was added, and the suspension was shaken for 16 h, resulting in NaHCO3-P. Subsequently, 30 mL of 0.1 M NaOH was added and shaken for 16 h, leading to NaOH-P. To obtain 1 M HCl-P, 30 mL of 1 M HCl was added and shaken for 16 h. The two consecutive steps in the process were followed by centrifugation at 8000× g for 8 min at 0 °C. After adding 10 mL of concentrated HCl to the soil residue, it was heated at 80 °C in a water bath for 10 min. After removing it from the bath, 5 mL of concentrated HCl was added. The suspension was centrifuged at 8000× g for 8 min at 0 °C. Then, 35 mL of deionized water was added to the centrifuge tube, mixed well, and centrifuged for 8 min, and the supernatant was collected as Conc. HCl-P. Finally, the soil residue was digested with concentrated H2SO4-H2O2 Sulfuric acid (Chongqing Wansheng Chuandong Chemical Co., Ltd., Chongqing, China) for 2 h at 380 °C, resulting in Residual-P. All extracts from the soil samples, inorganic P (Pi) was determined by molybdenum blue colorimetry, and total P (Pt) was determined by molybdenum blue colorimetry after ammonium persulfate digestion. The difference between Pt and Pi, referred to as organic P (Po), was observed.

2.5. Data Collection

Crop P uptake (Puptake, kg·ha−1) was calculated using the formula proposed by Shi et al. [38] as follows:
P uptake = YG × CG + YS × CS
where YG represents the grain yield (kg·ha−1), CG represents the grain P content (%), YS represents the straw yield (kg·ha−1), and CS represents the straw P content (%).
The land equivalent ratio (LER) is an indicator of intercropping benefits [39]. LERPuptake was used to express the land equivalent ratio of P uptake by the aboveground parts of the plant and was calculated as follows:
LER Puptake = 2 3 × IW Puptake MW Puptake + 1 3 × IF Puptake MF Puptake
where IWPuptake, MWPuptake, IFPuptake, and MFPuptake represent the amounts of P uptake by IW, MW, IF, and MF, respectively, under the same areas. LER > 1 indicates an intercropping advantage, and LER ≤ 1 indicates a neutral or negative effect of intercropping on P uptake.
The soil apparent P balance (Pb, kg·ha−1) was calculated based on the formula developed by Zamuner et al. [40] as follows:
P b = P input P uptake
where Pinput represents the P fertilizer input.
The soil P fraction stock was calculated using the following formula proposed by Tan et al. [41]:
P i S t o c k = Pi × BD × d 20
where PiStock represents the stock of the soil P fraction (kg·ha−1), Pi is the P content (mg·kg−1) of the i-th form of P in the soil, and BD and d represent soil bulk density (g·m−3) and topsoil depth (0.2 m), respectively.
To determine whether wheat and faba bean intercropping presented advantages, the weighted average of monocropping was calculated based on the area occupied by wheat and faba bean in the intercropping plot. This value was defined as the theoretical value of intercropping (It), which was used to compare it with the value observed in the given intercropping plot (W//F). This was calculated as follows:
It = 2 3 × MW + 1 3 MF

2.6. Statistical Analysis

Data organization was performed using Microsoft Excel 2019, and statistical analysis was conducted using IBM SPSS Statistics 25. Planting pattern and P levels were considered fixed factors, and replication was considered a random factor. The homogeneity of variance test was used to confirm that the data satisfied parametric testing assumptions. The significance of differences among treatment means for each trait was tested using Duncan’s multiple range test (p = 0.05) when the F test was significant (p = 0.05). Two-way ANOVA was performed on P uptake, P stock, and P fractious. A t-test was conducted to compare the difference between It and W//F. Amos 28.0 was used to integrate various methods, such as factor analysis, covariance analysis, path analysis, and regression analysis. A structural equation model (SEM) with standard regression coefficients was utilized to analyze the impact pathways and relationships between observed soil P, crop P uptake, soil P balance, and the interconversion of soil P fractions [42].

3. Results

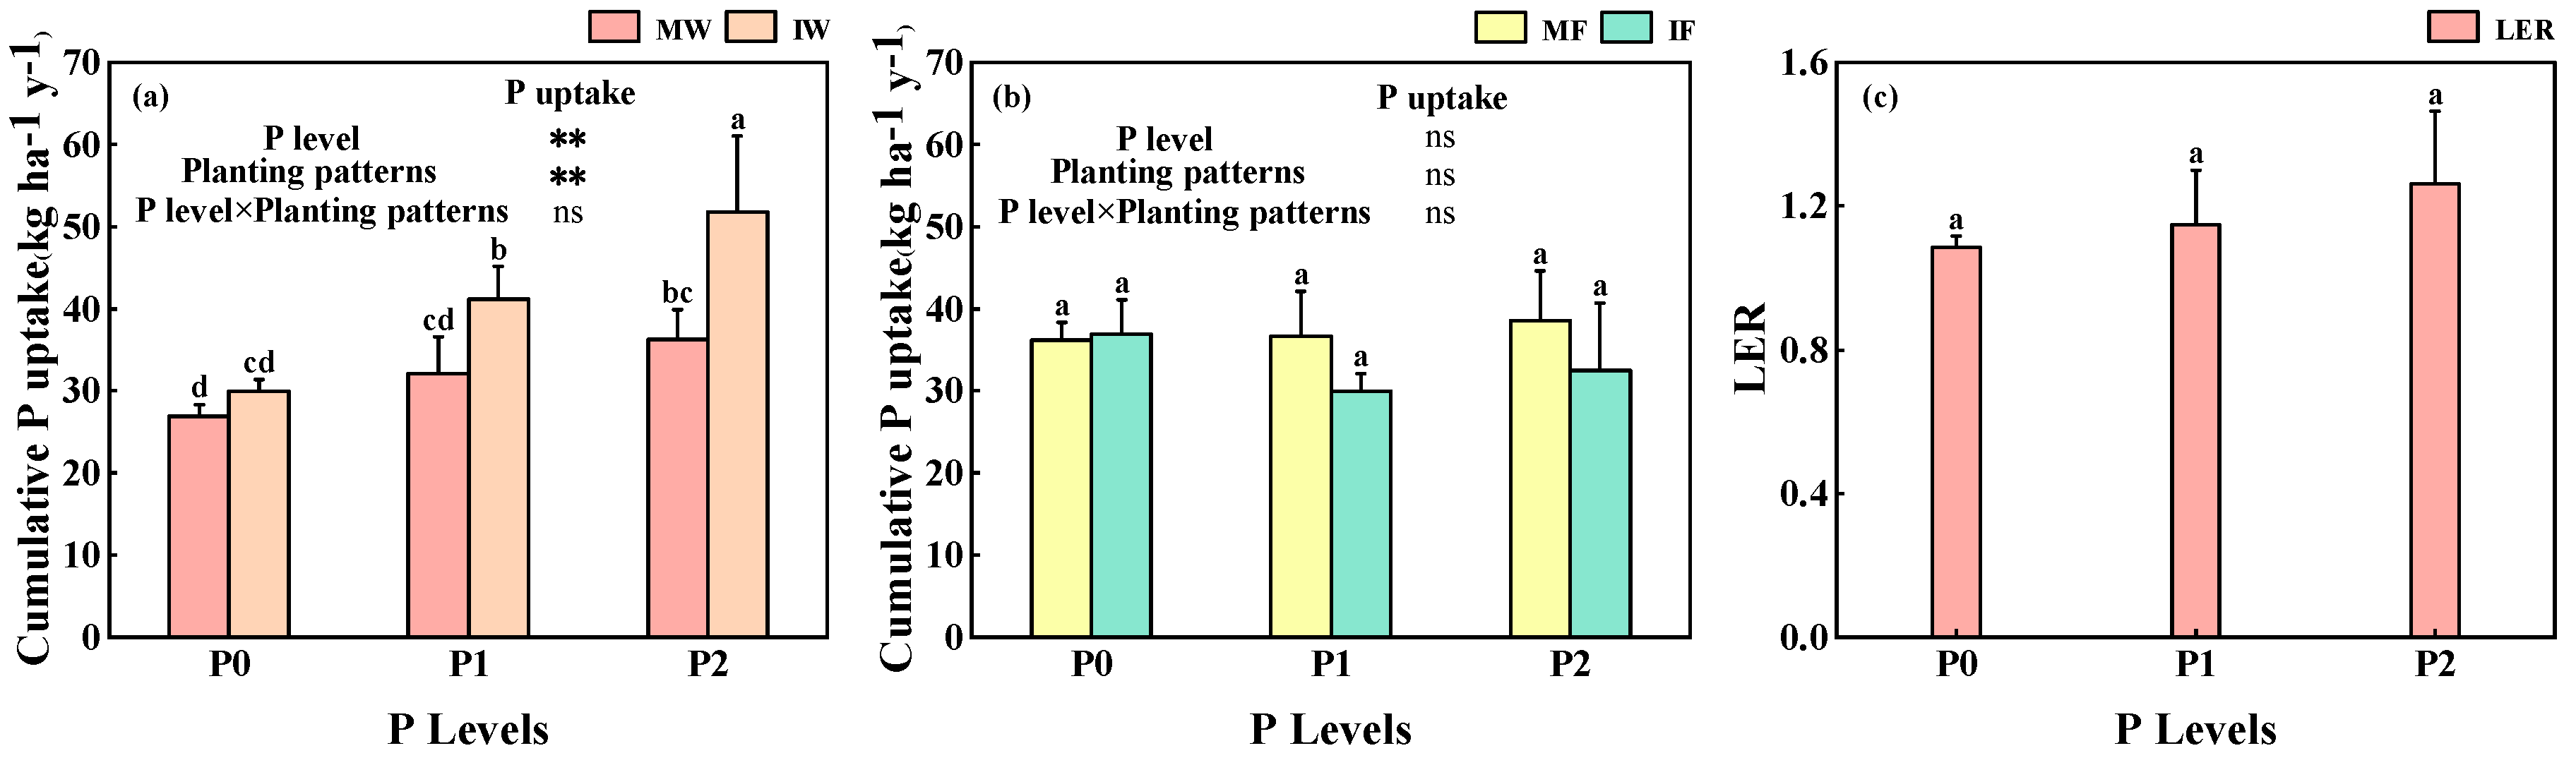
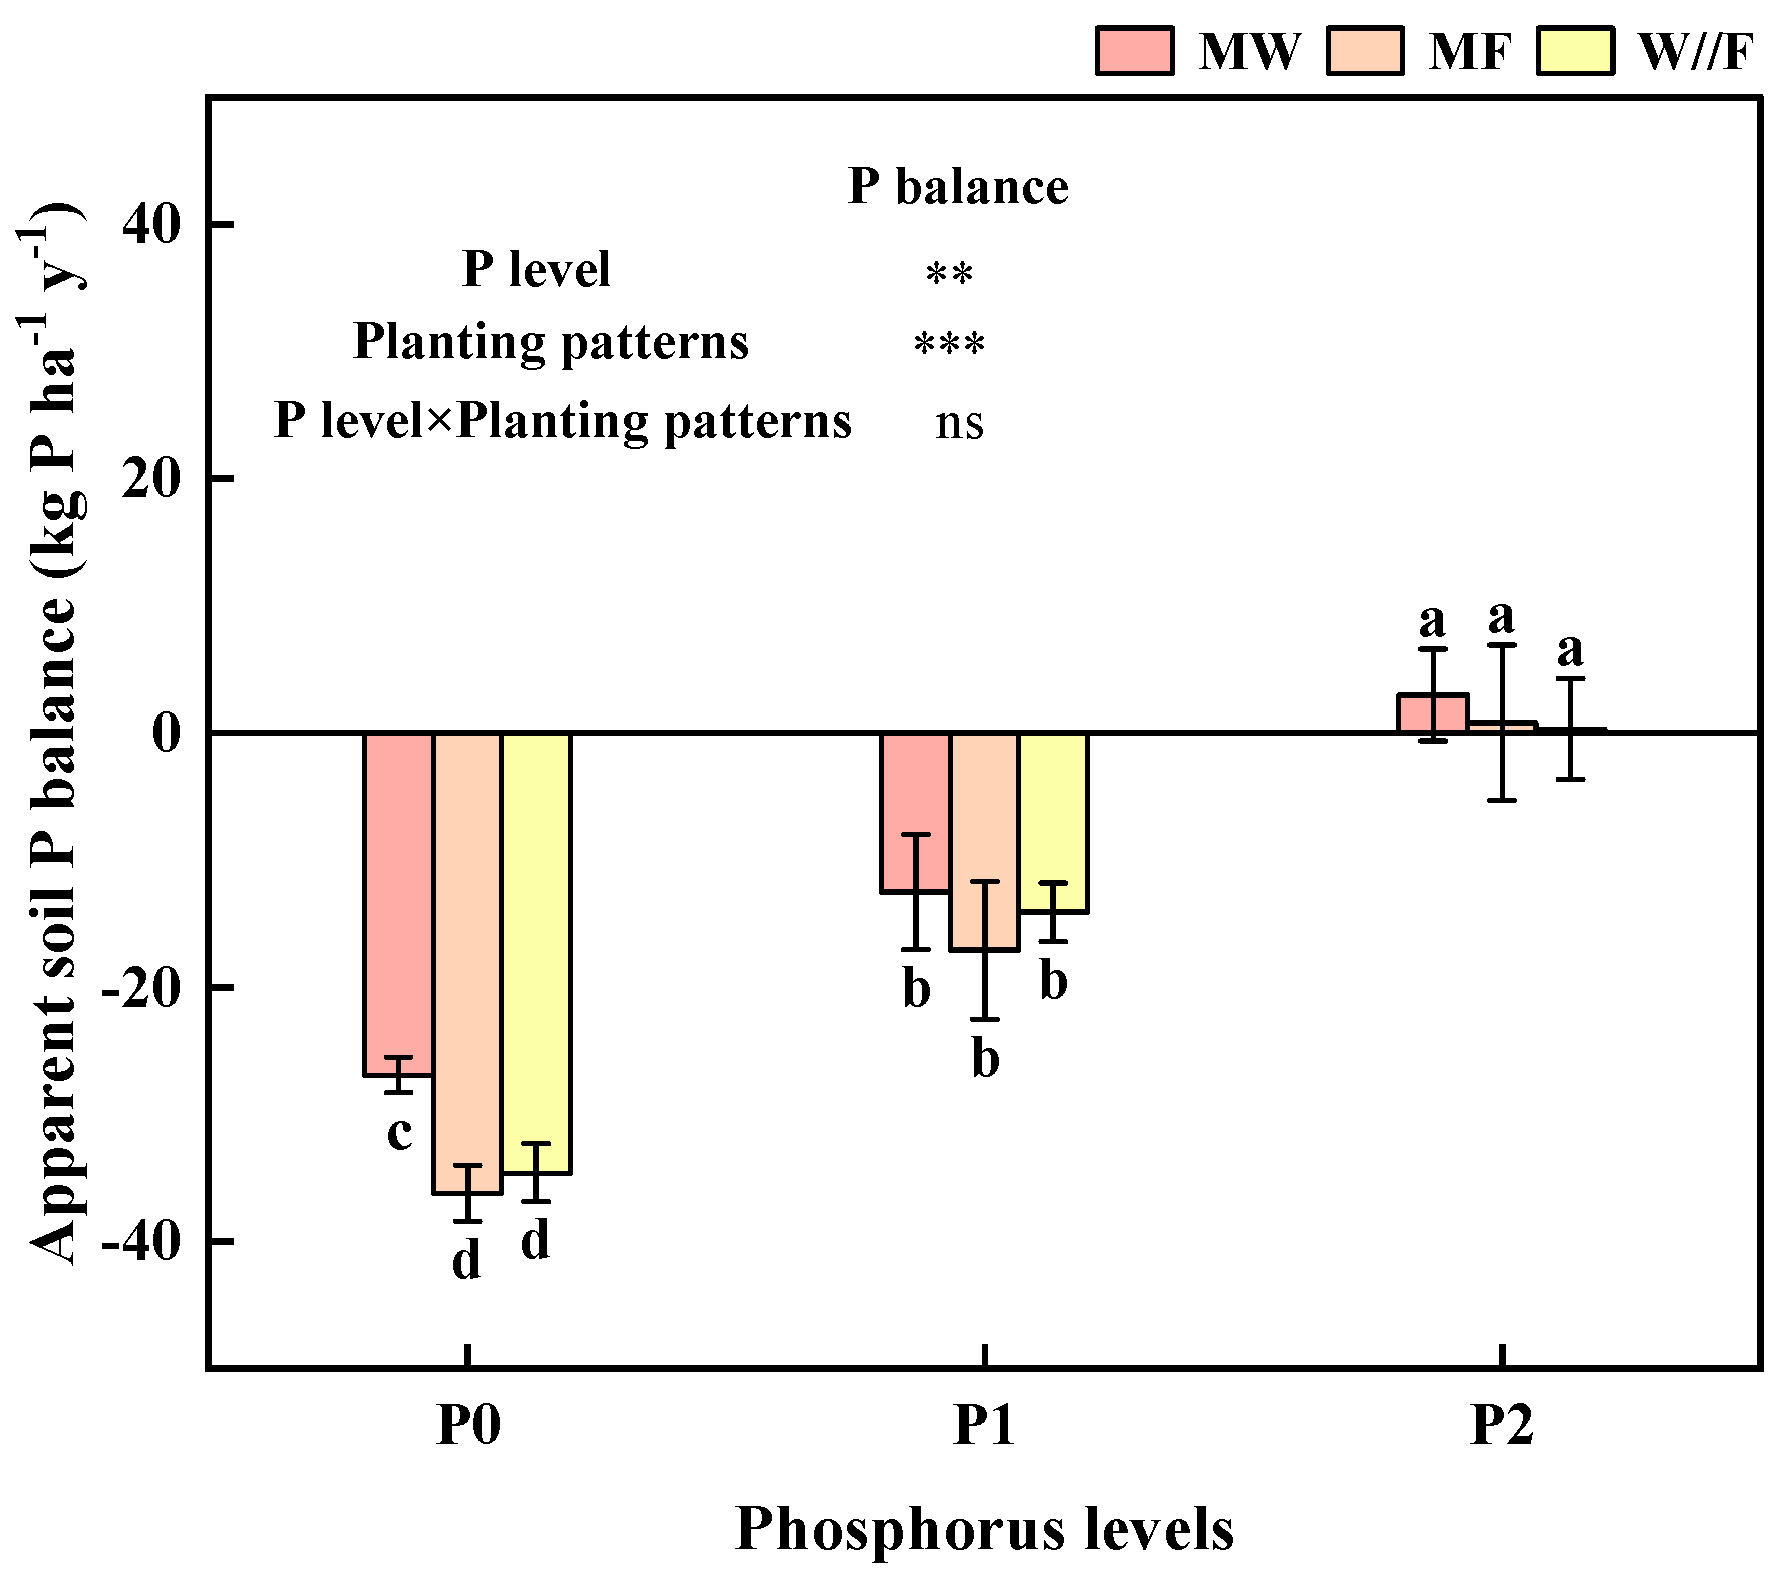
3.1. Crop P Uptake and Apparent Soil P Balance

The P levels and planting patterns exerted significant effects on the wheat aboveground P uptake, but the interaction of P levels and planting patterns had no impact on wheat’s aboveground P uptake. In contrast, P levels, planting patterns, and the interaction between P levels and planting patterns had no effect on faba bean P uptake (Figure 2a,b). On average, the amount of aboveground P uptake by MW and IW ranged from 31.8 to 41.0 kg∙ha−1∙y−1 (Figure 2a). For MF and IF, the aboveground P uptake ranged from 33.1 to 37.1 kg∙ha−1∙y−1 (Figure 2b). Under the conditions of P1 and P2 levels, wheat and faba bean intercropping enhanced the amount of wheat P uptake by 28.3 and 42.7%, respectively, compared to MW, but no difference in P uptake between IW and MW was observed under P0. Under all P levels, wheat and faba bean intercropping presented P uptake advantages compared to monocropping, although intercropping had no impact on faba bean P uptake. LERPuptake was higher than 1, and LERPuptake was not affected by P levels (Figure 2c).
The soil P apparent balance was influenced by both P levels and planting patterns but was not affected by the interaction of P levels and planting patterns (Figure 3). Soil P depletion both for monocropping and intercropping were observed under P0 and P1 levels, with annual average depletion rates of 14.6–32.5 kg∙ha−1∙y−1. Under the P2 level, the soil P tended to maintain balance both for monocropping and intercropping plots. At the P0 level, W//F accelerated soil P depletion compared to MW, leading to an increase of 28.3% in depletion rate. However, there was no difference in soil P apparent balance between W//F and MF. At the P1 and P2 levels, no significant differences in soil P apparent balance were observed among MW, MF, and W//F.

3.2. Soil Available P Stock

The soil available P stock was influenced by P levels, planting patterns, and the interaction between P levels and planting patterns, but the effect of intercropping on soil available P stock varied across years (Figure 4). In 2020, the soil available P stock decreased by 14.8 and 18.7% in W//F compared to MW and MF, respectively, under P2. However, no differences were observed among treatments at the P0 and P1 levels. In 2021, W//F decreased the soil available P stock by 26.4 and 14.2% compared to MW and MF at the P0 level, respectively. Likewise, at the P1 level, the soil available P stock in W//F decreased by 12.1% compared to MW. In 2022, at the P1 level, W//F decreased the soil available P stock by 17.3 and 33% compared to MW and MF, respectively. In comparison with It, W//F resulted in a reduction of 16.1% in soil available P stock at the P2 level in 2020. Similarly, W//F resulted in reductions of 22.7 and 9.0% at the P0 and P1 levels, respectively, in 2021, and a reduction of 23.4% at the P1 level in 2022.

3.3. Soil P Pool

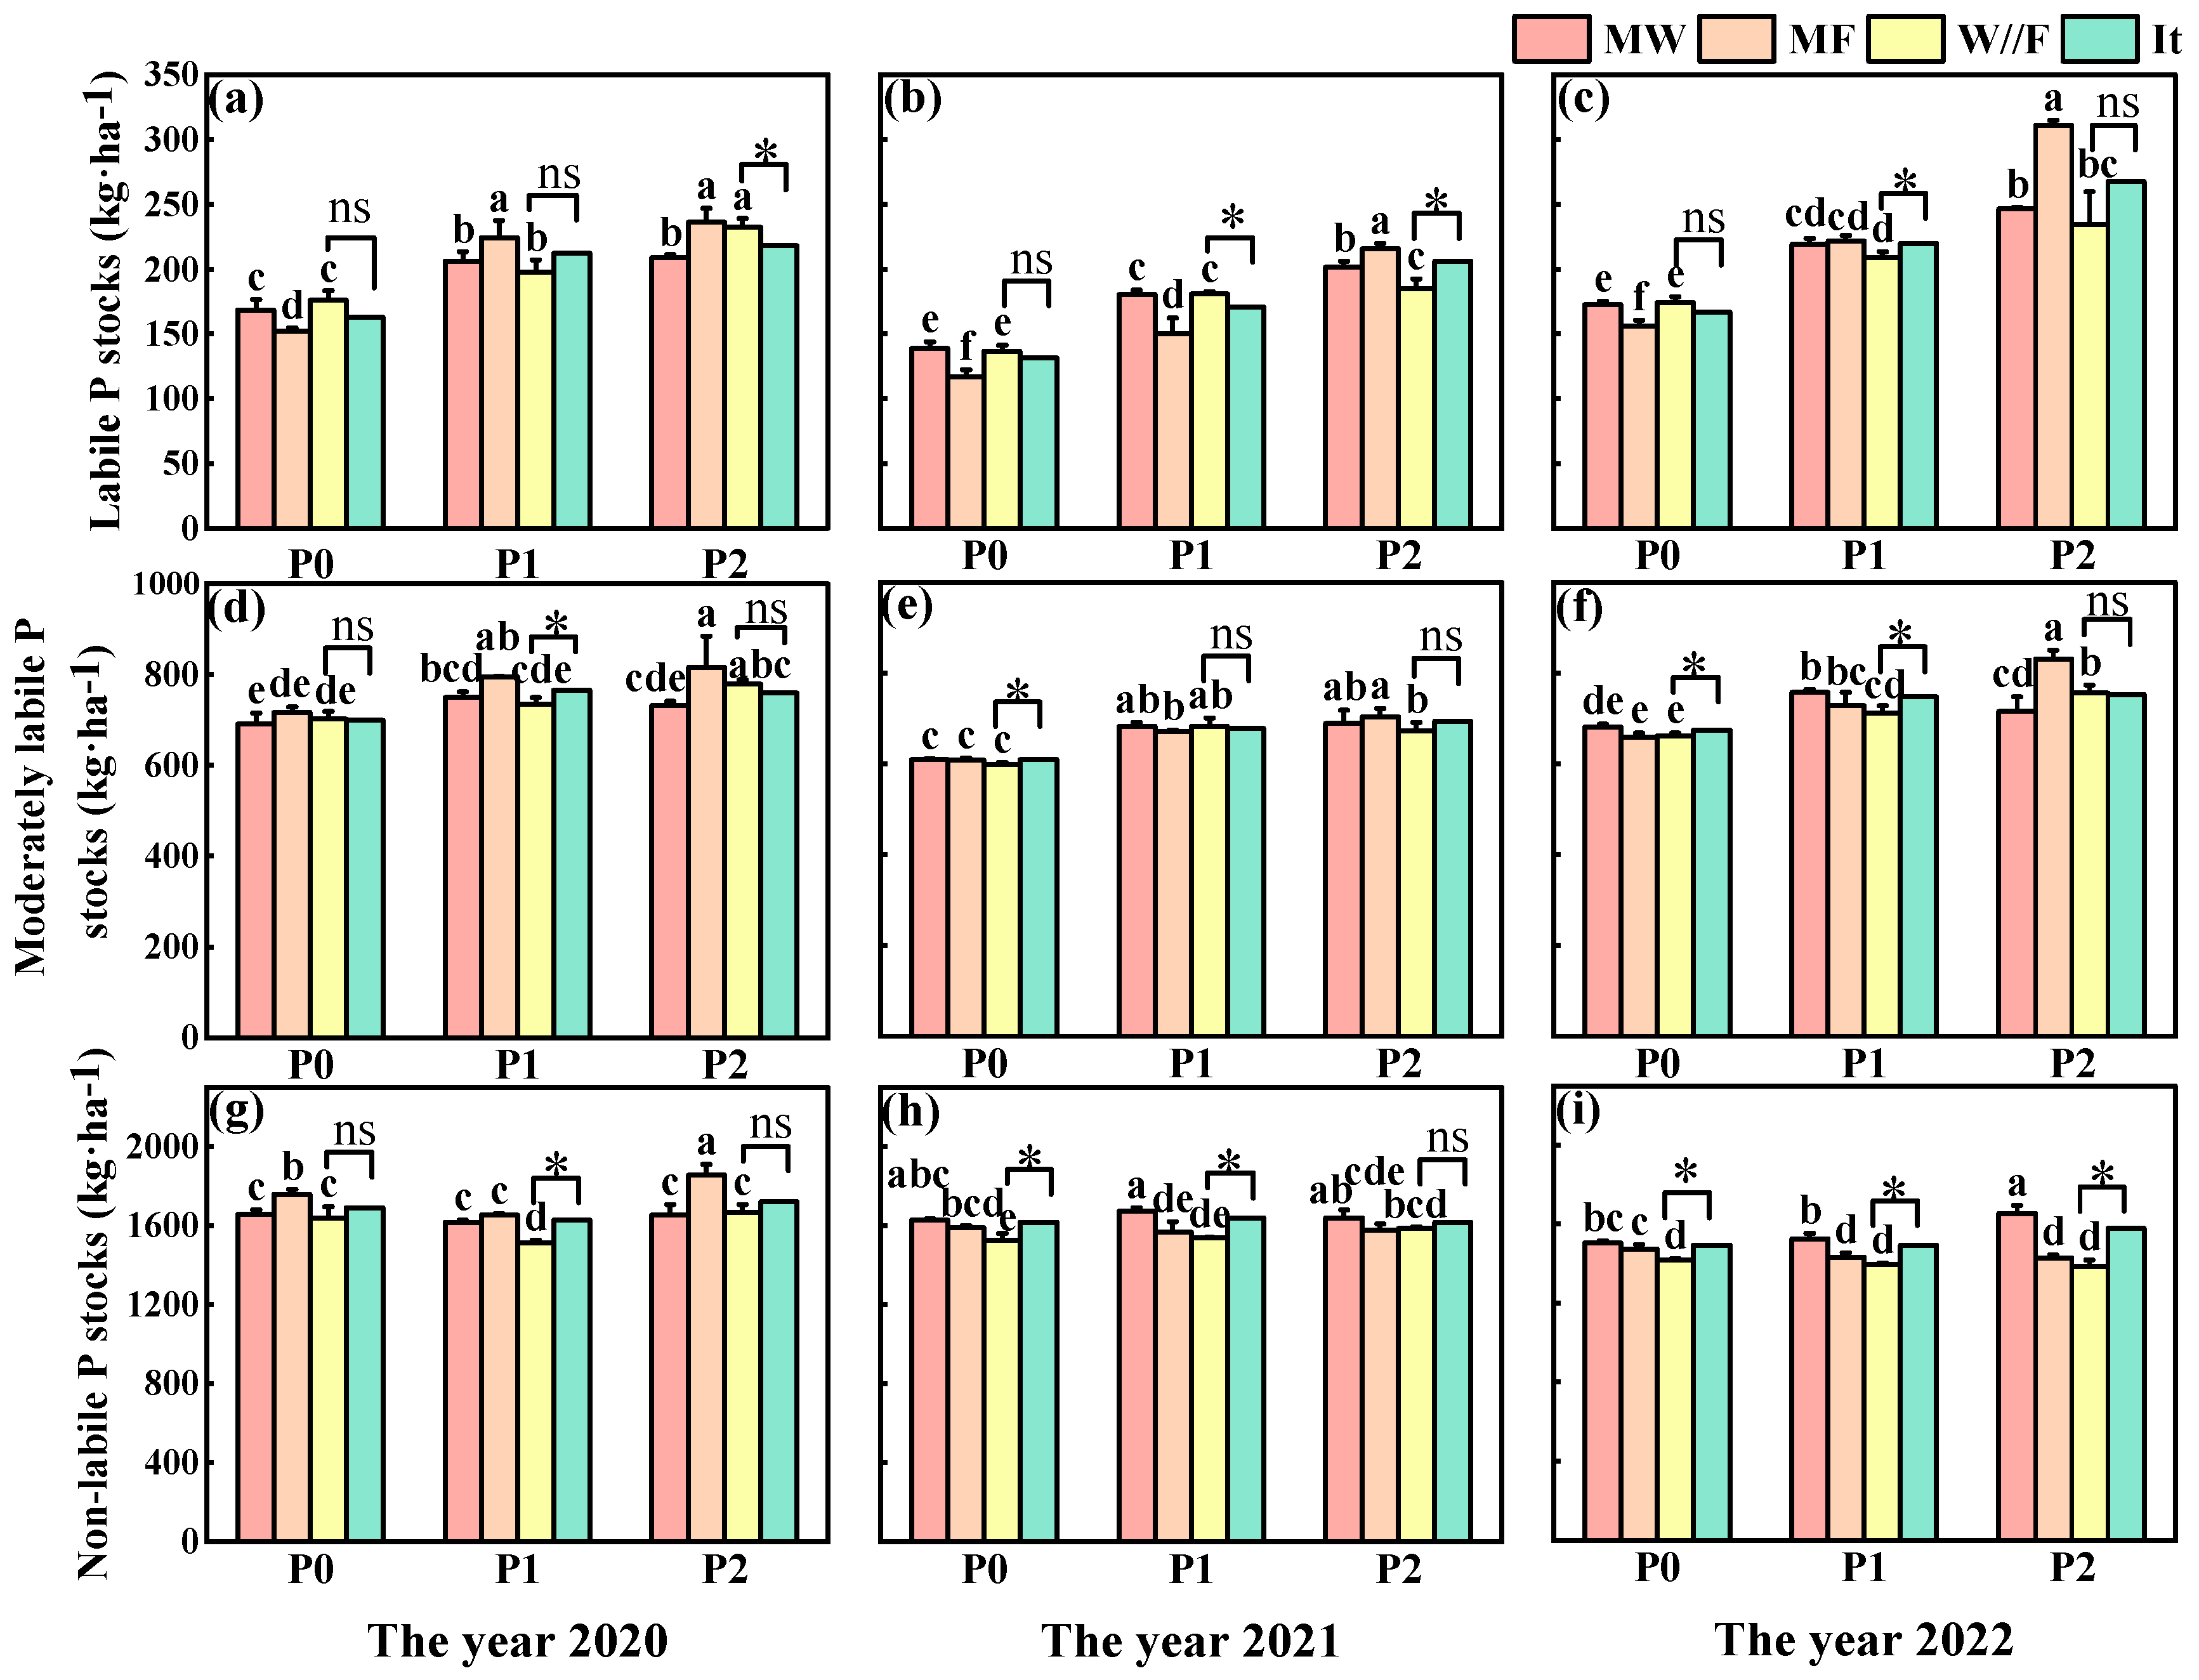
3.3.1. Labile P Pool

The soil labile P stock was affected by P level, planting pattern, and the interaction between P level and planting pattern, except in 2020 (Table 1). At P0 and P1 levels, no differences in the soil labile P stock were found between MW and W//F among years, but the difference in labile P stock between MW and W//F varied from year to year under the P2 level. The labile P stock in MF was lower than that in MW and W//F at the P0 level in all years, but the difference in labile P stock between MF and W//F varied year to year under P1. The soil labile P stock in MF was higher than that in MW and W//F at the P2 level. As a result, no differences in labile P stock were found between W//F and It among years at the P0 level, and a large difference among years was presented at the P1 and P2 levels (Figure 5a–c).

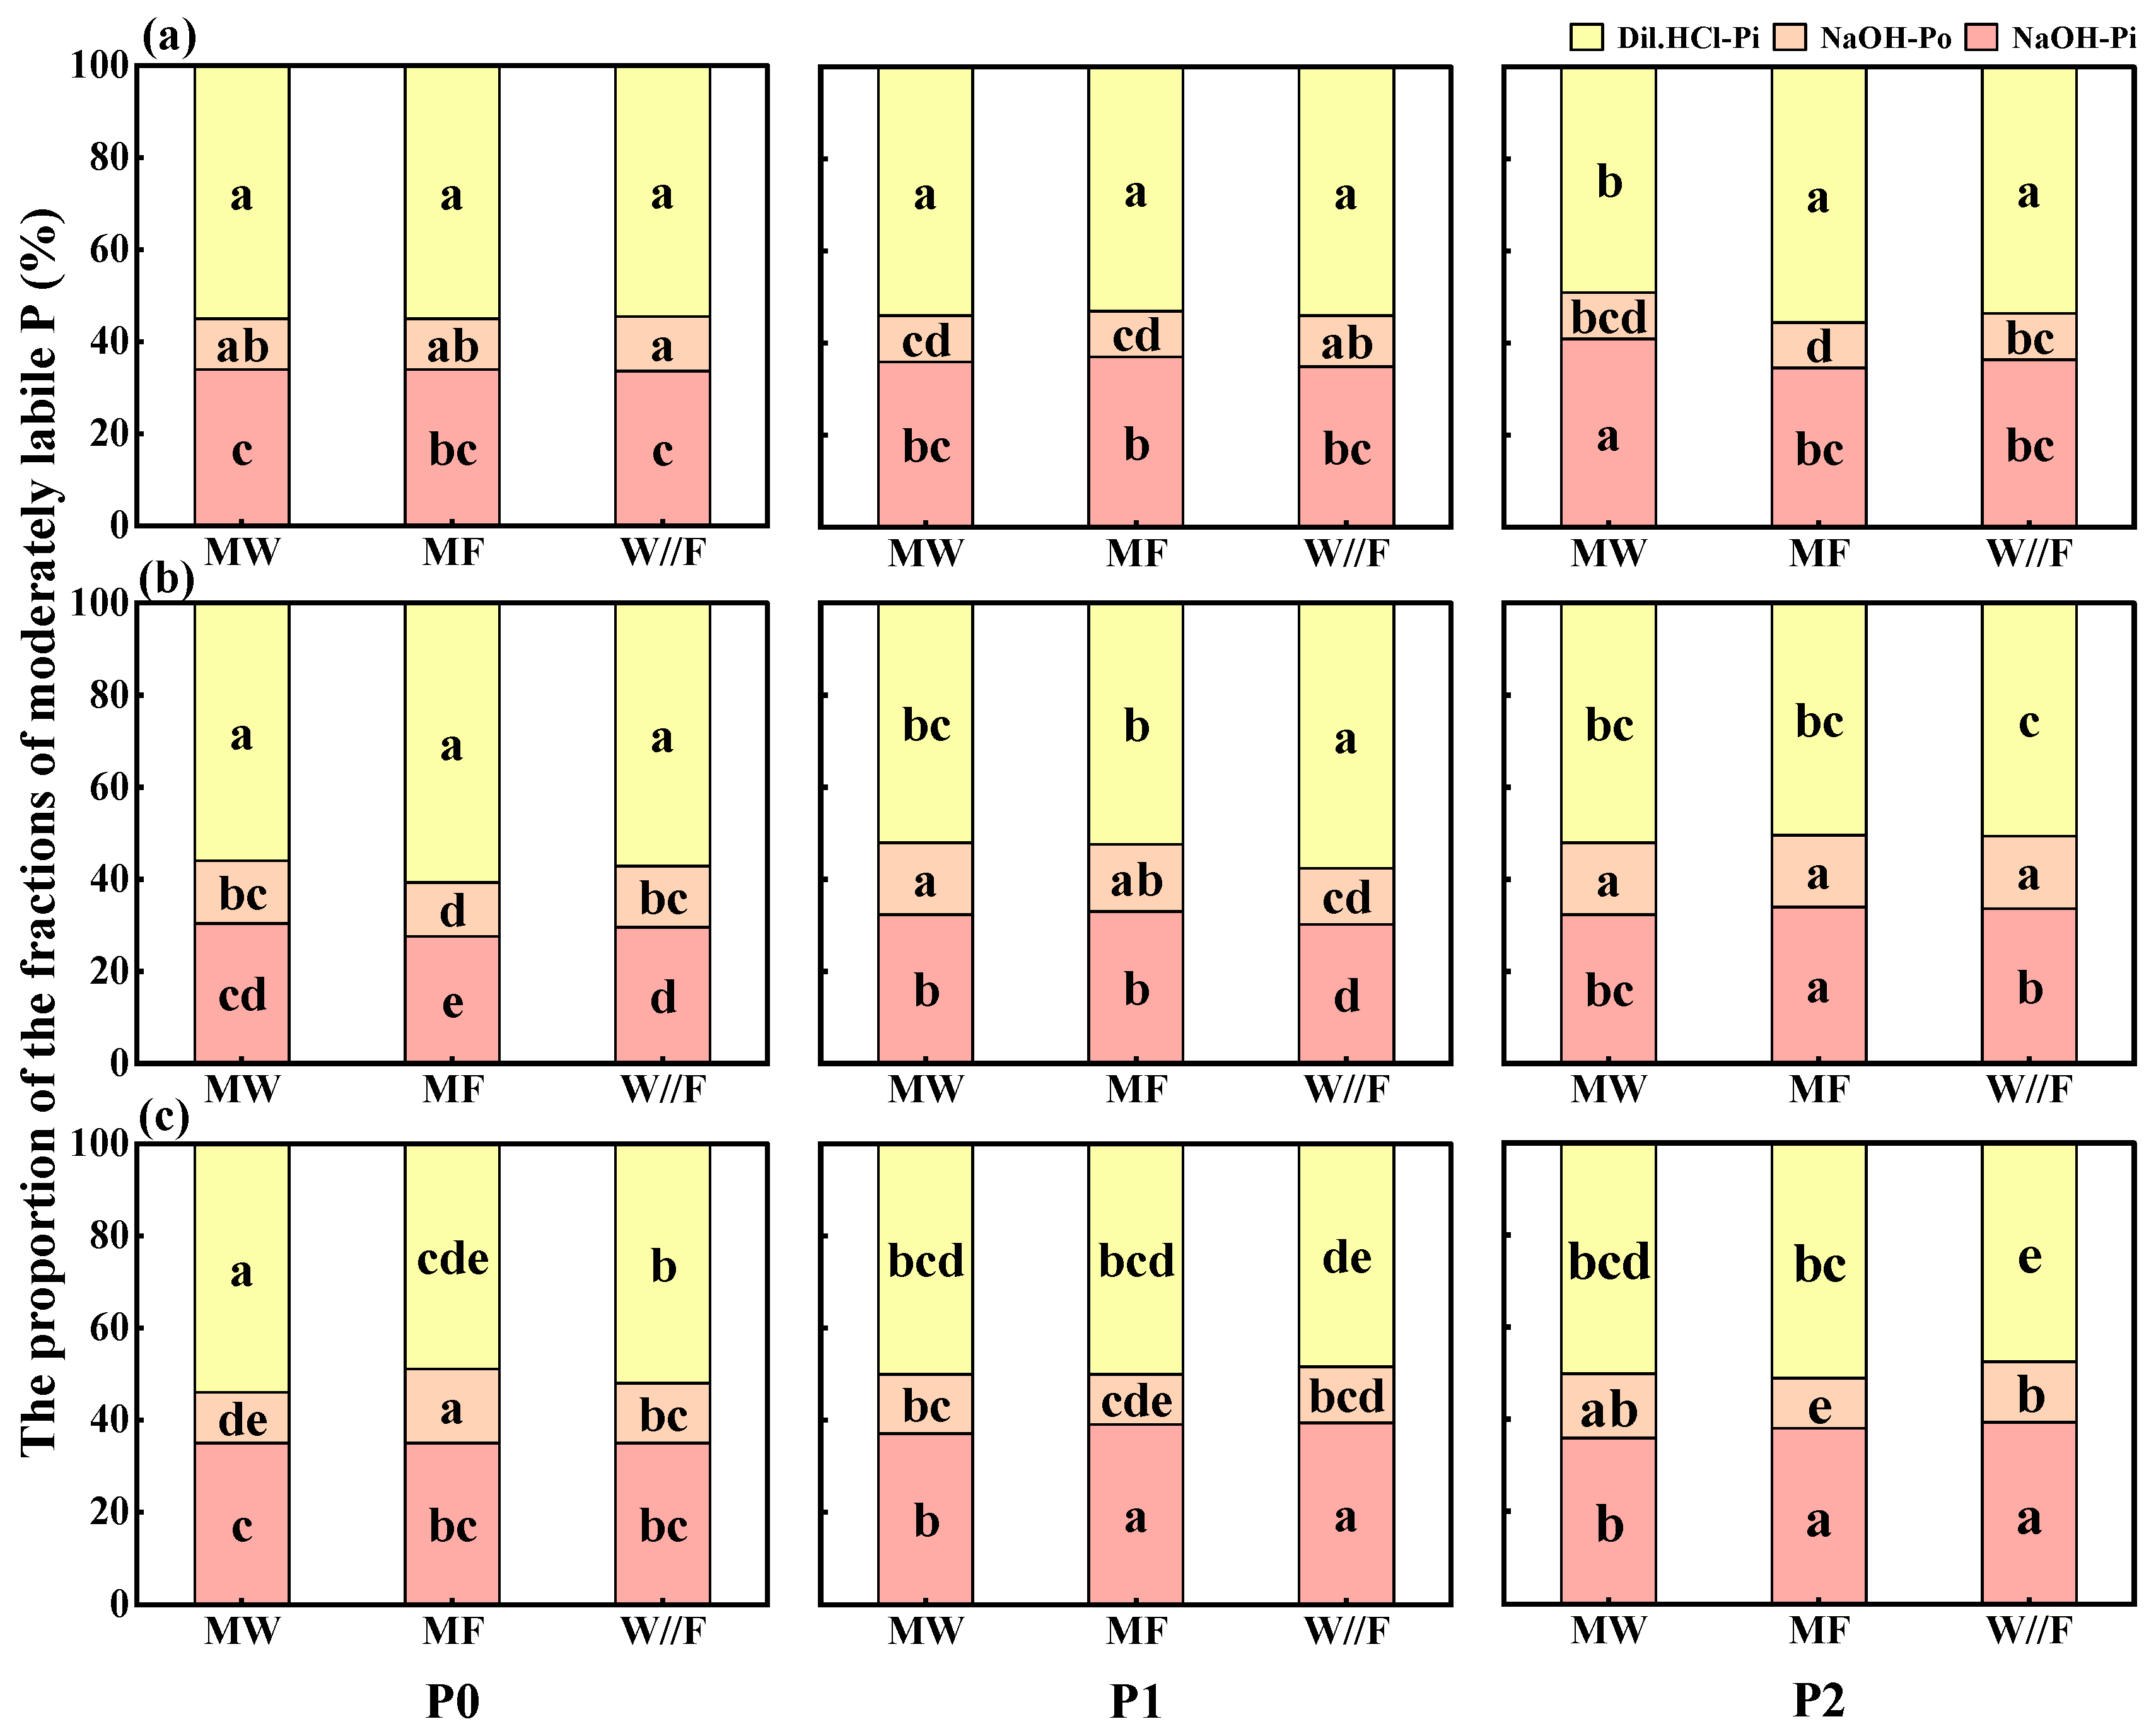
3.3.2. Moderately Labile P Pool

The moderately labile P stock was affected by the P level among years, and planting patterns affected moderately labile P in 2020 and 2021. However, the moderately labile P stock was only affected by the interaction of P level and planting pattern in 2022 (Table 1). No differences in soil moderately labile P stock were found among MW, MF, and W//F among years under the P0 level, and no differences in soil moderately labile P stock were observed between MW and MF among years under P1. However, soil moderately labile P stock in W//F was sometimes lower than or higher than that in MW or MF at the P1 level. At the P2 level, W//F decreased the moderately labile P stock in 2021 and 2022 relative to MF (Figure 5d–f). On average, compared to It, W//F decreased moderately labile P by 1.7–1.8 and 4.1–4.7% under the P0 and P1 levels, respectively, in 2021 and 2022. No differences were found between W//F and It at the P2 level among years (Figure 5d–f).

3.3.3. Non-Labile P Pool

In both 2020 and 2022, the soil non-labile P stock was affected by the P level, planting pattern, and their interaction, but the non-labile P stock was only affected by the planting pattern in 2021 (Table 1). W//F decreased the soil non-labile P stock by 3.7–6.8% relative to MF at the P0 level in the three-year experiment, and W//F decreased the soil non-labile P stock by 6.3 and 5.6% relative to MW at the P0 level in 2021 and 2022, respectively. Similarly, at the P1 level, compared with MW, W//F decreased the soil non-labile P stock by 6.4–8.6% in the three-year experiment, and W//F decreased the soil non-labile P stock by 6.4% relative to MF in 2020 at the P1 level. At the P2 level, W//F decreased the soil non-labile P stock by 10.1 and 16.1% relative to MF in 2020 and 2022, respectively. Furthermore, consecutive MF for 7–8 years decreased the non-labile P stock compared to MW, especially under the P1 and P2 levels.
In comparison to It, W//F decreased the soil non-labile P stock by 5.5 and 5.0% at the P0 level in 2021 and 2022, respectively. Similarly, the soil non-labile P stock in W//F decreased by 6.1–7.1% compared to that in It at the P1 level during the three-year experiment. Additionally, W//F decreased the soil non-labile P stock by 12.1% relative to It in 2022 at the P2 level (Figure 5g–i).

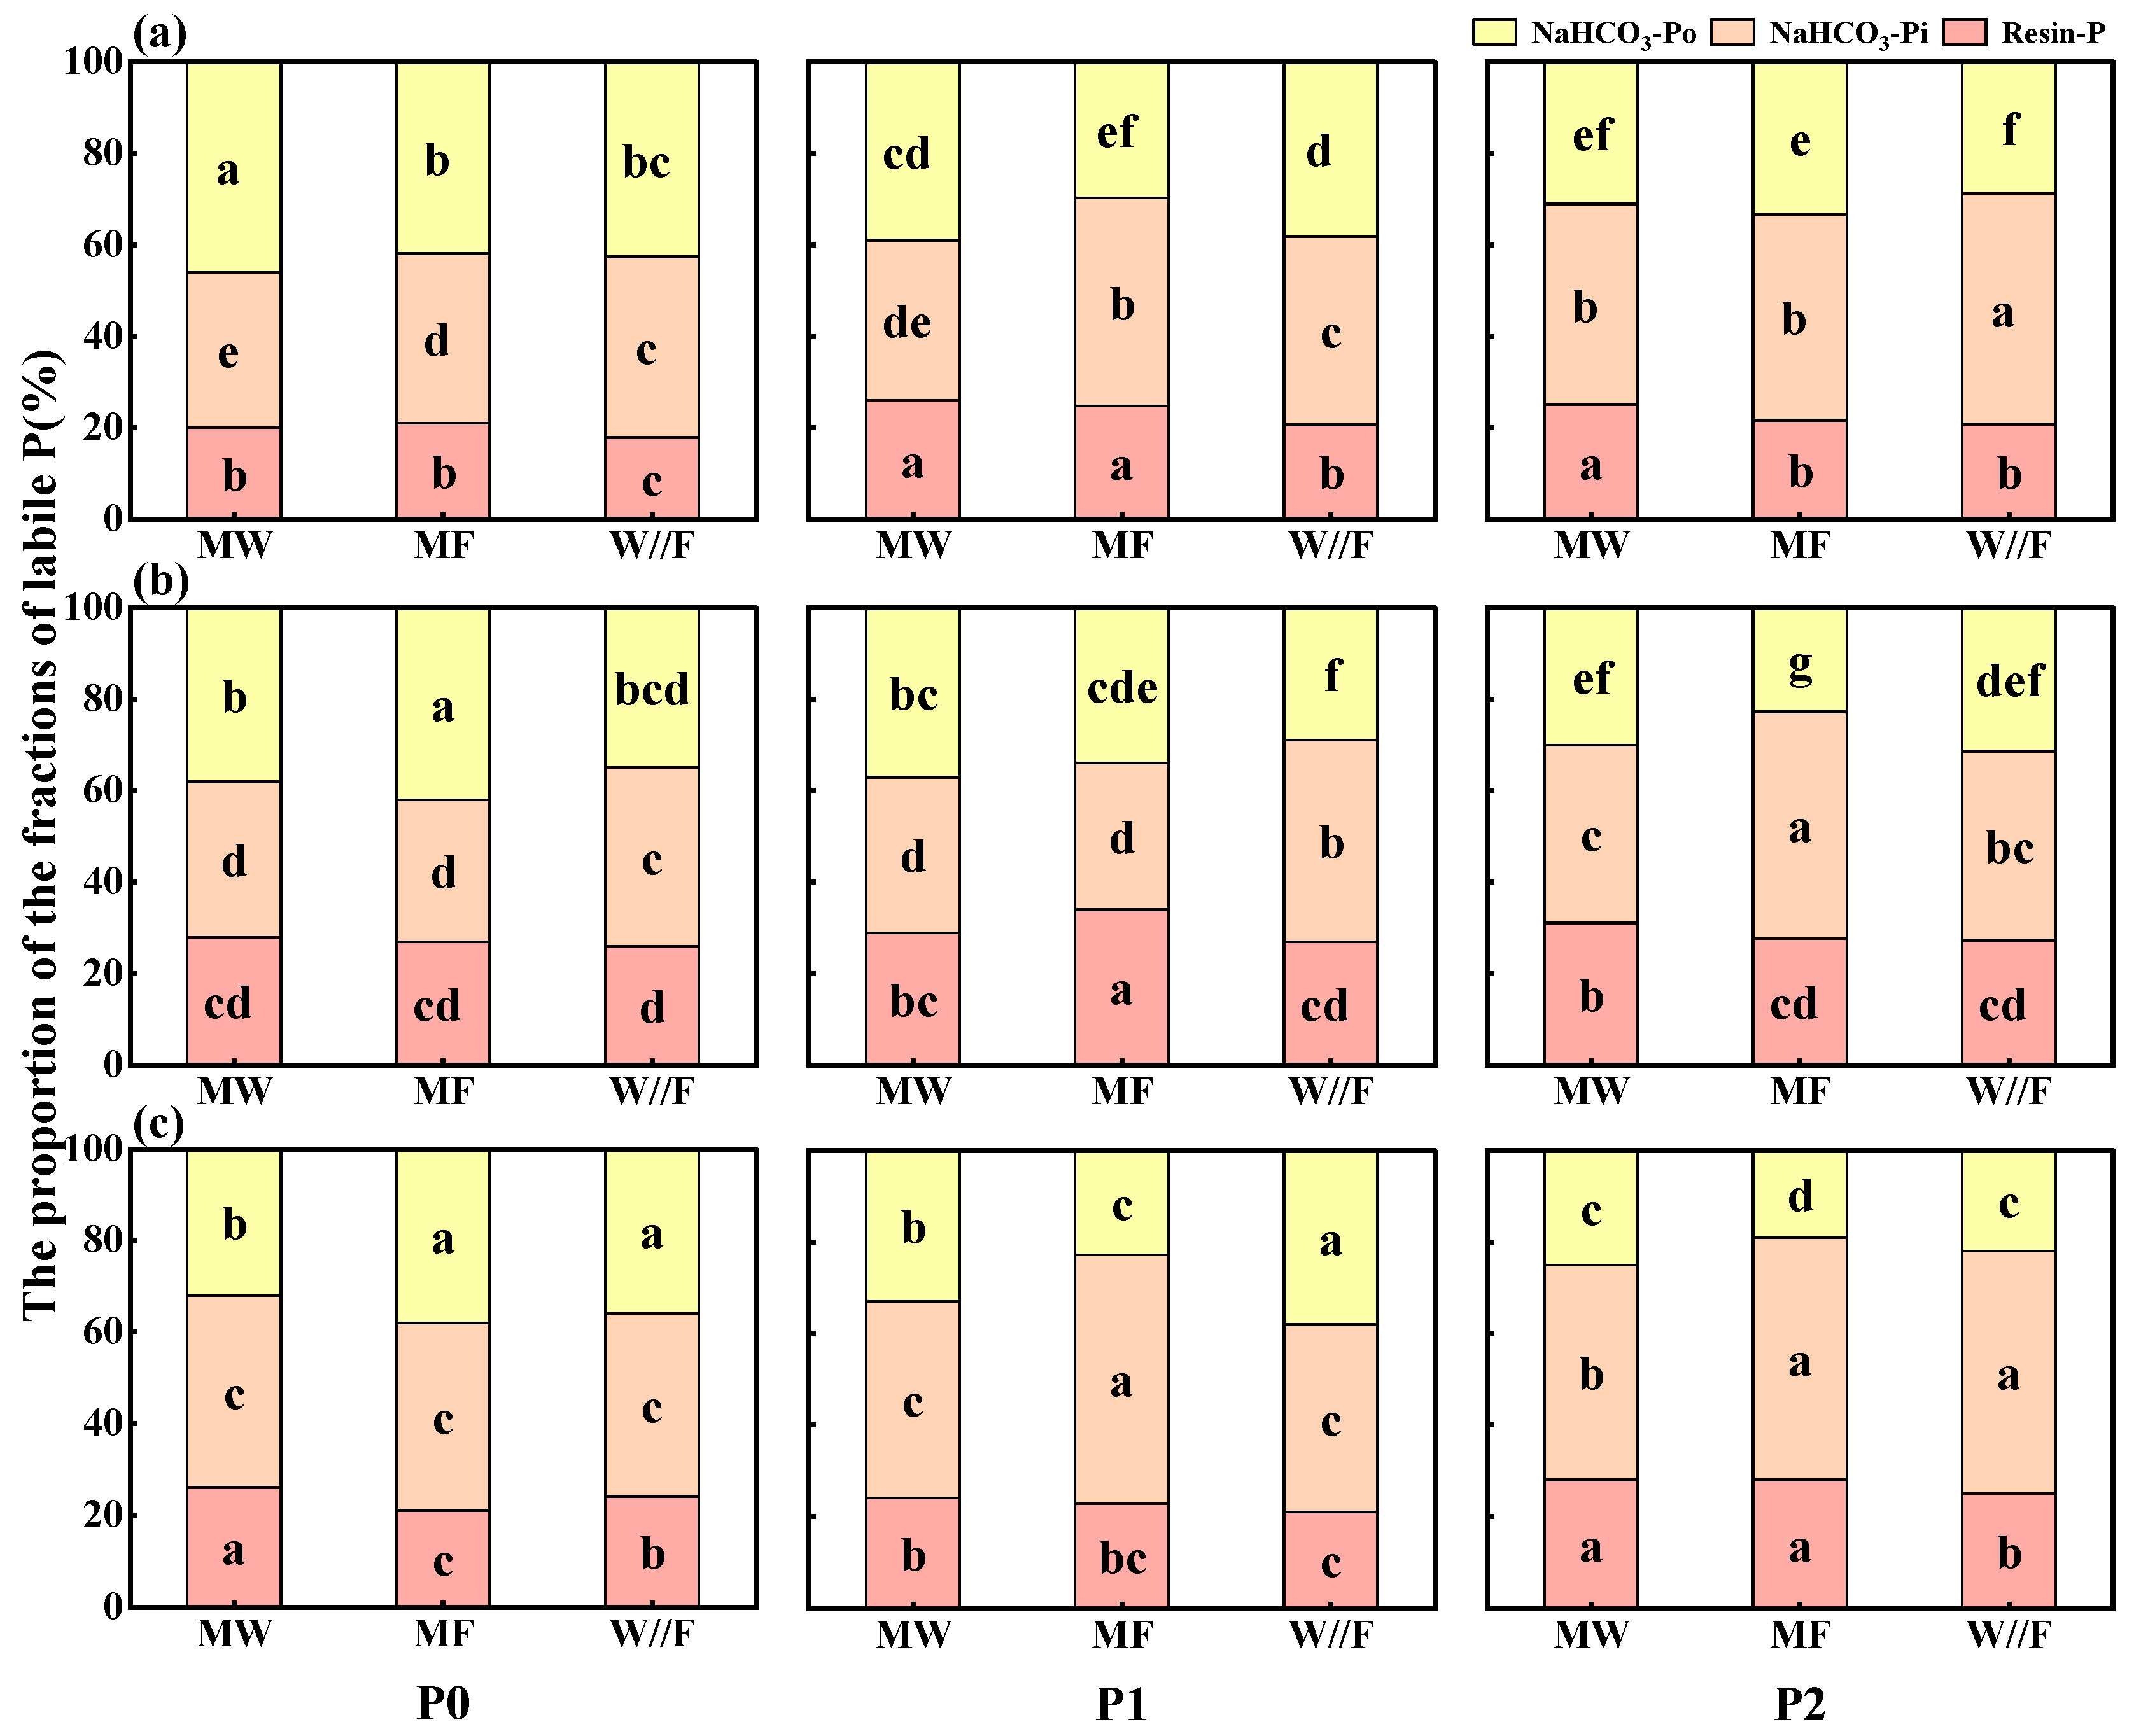
3.4. Proportions of Different P Fractions in the Soil

The proportions of Resin-P, NaHCO3-Pi, and NaHCO3-Po fractions in soil labile P were influenced by the P level, planting pattern, and their interaction among years (Table 2). W//F decreased the proportion of Resin-P in soil labile P by 9.7–21.1% under all P levels compared to MW, except for the P0 and P1 levels in 2021, and increased the proportion of NaHCO3-Pi in soil labile P by 13.5–28.6% under all treatments, except for the P0 and P1 levels in 2022 and the P2 level in 2021. Similarly, W//F decreased the proportion of Resin-P in soil labile P by 13.7–21.0% under P0 and P1 levels relative to MF, except for the P0 level in 2021 and the P0 and P1 levels in 2022. An increased proportion of NaHCO3-Pi was observed in labile P in the intercropping plots compared to MF under the P0 and P1 levels in 2020 and 2021, except for the P0 level in 2020. W//F had no impact on the proportion of NaHCO3-Po in labile P under the P2 level relative to MW, but the difference in the proportion of NaHCO3-Po in labile P was uncertain among MW, MF, and W//F under the P0 and P1 levels because a difference among years was presented (Figure 6).
The proportions of Dil. HCl-Pi, NaOH-Po, and NaOH-Pi in the soil moderately labile P were frequently influenced by the planting pattern, P level, and the interaction of planting pattern and P level, except for the P fractions in the given years in the present study (Table 3). However, the effect of intercropping on the proportion of the moderately labile P fraction in each soil relative to MW and MF was ambiguous due to the differences among years (Figure 7).
The proportion of soil non-labile P fractions, including Conc. HCl-P and Residual-P, was frequently influenced by the planting pattern, P level, and their interaction (Table 4). Intercropping had no impact on the proportion of Conc. HCl-P and Residual-P in soil non-labile P in 2020 and 2021 under any of the P levels, except for the P0 level in 2021. However, the proportion of the Conc. HCl-P in W//F was increased by 4.7–17.8% relative to that in MW under all P levels in 2022, and those values were 3.1–12.6% compared to MF. In 2022, the proportion of Residual-P in W//F was decreased by 33.1–17.8% compared to that in MW, and those values were 4.7–12.6% in comparison to MF (Figure 8).

3.5. Co-Relationship among Crop P Uptake, Soil Available P, and Soil P Fractions

Principal component analysis showed differences among different P levels on the X-axis, while differences between MW and W//F and between MF and W//F were observed on the Y-axis (Figure S3). Pearson correlation analysis showed that aboveground P uptake by crops was positively correlated with soil available P, NaHCO3-Po, Dil. HCl-P, and Conc. HCl-P (Figure 9a) (please refer to the specific Figure 9 in the PDF for details), but crop P uptake mainly depended on soil available P based on SEM. Additionally, Residual-P, Conc. HCl-P, NaOH-Po, NaHCO3-Pi, and Resin-P fractions had an indirect effect on crop P uptake (Figure 9b), and Conc. HCl-P, Residual-P, and Resin-P directly affected soil available P stock. According to the results of random forest modeling, Conc. HCl-P, Residual-P, NaOH-Po, NaHCO3-Pi, and Resin-P fractions contributed 13.34, 11.12, 10.31, 10.14, and 4.59%, respectively, to the aboveground P uptake in MW. However, Conc. HCl-P and Dil. HCl-P fractions in the W//F system contributed 13.59 and 9.53%, respectively, to aboveground P uptake in W//F (Figure 9c,d), and each single P fraction had no direct contribution to aboveground P uptake under MF (Figure S4).

4. Discussion

4.1. Effects of Continuous Cereal and Legume Intercropping on the Soil P Pool

The present study was partly aligned with most previous studies that showed that wheat and legume intercropping had P uptake advantages (LERuptake > 1) [29], but these advantages were mainly derived from wheat and were not regulated by P application rates because wheat and faba bean intercropping had no impact on faba bean’s P uptake under any of the studied P rates (Figure 4). Consequently, we found that intercropping tended to increase soil P depletion relative to monocropped wheat, especially with no P application. Liao et al. [27] reported that a decrease in soil total P content ensued after 8 consecutive years of intercropping, but continuous wheat and faba bean intercropping for 8 years had nearly no impact on soil total P stock in this study (Figure S1). However, the decreased soil total P stock should be presented with the increase in intercropping years because intercropping increased soil P depletion, particularly under low P input. In contrast, in this study, intercropping led to the depletion of available P because of the higher P uptake in intercropping [6,28,43]. Notably, the effect of intercropping on available P stock sometimes differed among years; this may be related to climatic conditions, soil P fraction transformation, and the cumulative effects of intercropping [44].
The short-term intercropping of maize and soybean can increase the content of both labile P and non-labile P fractions within the soil [28]. In contrast, in this study, continuous wheat and faba bean intercropping had nearly no impact on labile P but decreased non-labile and moderately labile P, especially with low P input (Figure 7). An et al. [45] found that long-term intercropping reduced soil Residual-P concentration, while corresponding monocultures did not exhibit this effect, indicating that intercropping was more efficient at utilizing soil P. These results indicated that long-term intercropping increased the conversion of soil non-labile P fractions into forms readily absorbed by crops, consequently decreasing non-labile P fractions. However, in the present study, continuous intercropping nearly had no impaction on the soil labile P fraction content. The result might be linked with wheat and faba bean intercropping stimulated the conversion of moderately and non-labile P to labile P due to enhanced acid phosphatase activity and organic acid secretion [46,47]. It means that long-term intercropping resulted in the activation of insoluble P (moderately and non-labile P), thereby replenishing labile P while it was being consumed simultaneously [1].

4.2. Effects of Cereal and Legume Intercropping on Soil Labile P Fractions

Resin-P and NaHCO3-Pi in soil labile P fractions primarily exist in the forms of H2PO4 and HPO42− and are considered the most effective P fractions for plant short-term requirements [15,37,48]. In the present study, intercropping had nearly no impact on labile P despite a LERP-uptake > 1 (Figure 4), possibly because labile organic P (NaHCO3-Po) and moderately labile inorganic P can be potential sources of labile inorganic P [49], especially under low P input conditions in which P fixation–mineralization is mainly controlled by P supply and plant demand for P [50,51]. A previous study identified that cereal and legume intercropping could enhance soil organic P mineralization [52]. Similarly, we found that wheat and faba bean intercropping frequently increased the proportion of NaHCO3-Pi but decreased the proportion of Resin-P and NaHCO3-Po in labile P in the present study, especially under the P0 and P1 levels (Figure 5). However, there was still a lack of direct evidence in the present study to show that continuous intercropping of wheat and faba bean induced the conversion of NaOH-Po to NaOH-Pi. Liao et al. [53] reported that the addition of root residues increased microbial populations and enhanced acid phosphatase activity, promoting the mineralization of organic P in the soil and enhancing the advantages of intercropping in terms of biomass and P content. Hence, the change in the proportion of each P fraction within labile P due to wheat and faba bean intercropping should be related to changes in soil bacterial and fungal diversity and microbial community structures in bulk and rhizosphere soil [54].
Legume crops accumulate a substantial amount of NaHCO3-Po [26], while grain crops consume NaHCO3-Po and NaOH-Po and, to a lesser extent, Conc. HCl-Po [55]. However, in the present study, a higher proportion of NaHCO3-Pi and lower proportions of Resin-P and NaHCO3-Po were frequently found in faba bean soil compared to wheat soil, which partly accounted for changes in the proportions of P fractions with soil labile P due to intercropping. Thus, the present study showed that soil P uptake and P transformation are complex in cereal and legume intercropping systems, and still more work should be done in the future to better understand this topic. In this study, when no P was input, the soil labile P in the faba bean system was lower than in monocropped wheat, but when 90 kg ha−1 P2O5 was input, the soil labile P in the faba bean system was higher than in monocropped wheat (Figure 5). This suggests that wheat and faba bean present different strategies to respond to P input in terms of labile P.

4.3. Effects of Cereal and Legume Intercropping on Moderately Labile and Non-Labile P Fractions in Soil

Moderately labile P, which cannot be immediately utilized by plants, can be converted into an accessible form through biological or chemical processes [56]. Wheat and faba bean continuous intercropping for 8 years decreased the moderately labile P pool under a low P input, but the effect of intercropping on each P fraction within the moderately labile P pool was unclear in the present study (Figure 9). This phenomenon may be related to the complex interconversion among different P fractions in the soil. Normally, NaOH-Pi is associated with Fe and Al oxides and organic matter [57], but the rhizosphere acidification induced by intercropping can change the soluble and adsorbable Fe and Al oxides, which might result in NaOH-Pi and Dil. HCl-Pi fraction transformation [58,59]. Furthermore, interconversion among P fractions extracted by NaOH may cause fluctuations in the proportion of NaOH-Pi [60,61].
An et al. [45] found that maize intercropping with rapeseed and faba bean resulted in reduced levels of non-labile P pools compared to monoculture maize. The present study also confirmed that wheat and faba bean continuous intercropping drove the decrease in soil non-labile P pools, and the decrease in the soil non-labile P pool due to intercropping was not influenced by P levels (Figure 8). The present study found that faba bean had a better ability to use non-labile P than wheat, especially under P0 and P1 levels. However, we argue that wheat and faba bean intercropping increased non-labile P pool utilization not only due to the different biological availability of soil P fractions between wheat and faba bean but also because intercropping improved soil non-labile P transformation. Obviously, intercropping amplifies crops’ biological availability to use non-labile P both for wheat and faba bean because the non-labile P stock in W//F was lower than that in It (Figure 5) and because a higher proportion of Con HCl-P, but a lower proportion of Residual-P were found in intercropping relative to both monocropped wheat and faba bean (Figure 8). This provided direct evidence for this study, demonstrating that intercropping activated a portion of non-labile and moderately labile P in the soil, possibly due to the secretion of organic acids or phosphatase, as well as other root exudates [55]. Long-term wheat and faba bean intercropping stimulated species–species interactions, which induced the mobilization of non-labile and moderately labile P and amplified crops’ biological availability of soil P factions and finally guaranteed crops’ P uptake under the current situation. Certainly, the transformation among different P factions was complex; thus, we still could not fully understand the effect of continuous intercropping on each fraction based on the present study. However, the present study indicated that eight years of wheat and faba bean intercropping primarily resulted a decrease in the most stable P fraction (Residual-P) and the most effective labile P fraction (Resin-P). Previous research, based on a 12-year study, discovered that intercropping chickpeas and maize under low P levels, as well as intercropping rapeseed and maize, both reduced the content of Residual-P fractions in the soil. The researchers proposed that this occurred because crop root exudates released significant amounts of carboxylates and phosphatases, mobilizing less absorbable P and organic P into an available P pool, thereby boosting P uptake. This explanation can also elucidate the results of the current study.

4.4. Interrelationship between Crop P Uptake and the P Fraction

Phosphorus in soil primarily exists in insoluble forms with low effectiveness, a characteristic of particular significance in red soils with low P bioavailability [62]. Some research has highlighted the significant impact of moderately labile P and non-labile P fractions on crop P uptake, with insignificant effects from labile P fractions [63]. In particular, HCl-P influenced the apparent and economic utilization of soil P [64]. Likewise, the findings of this study showed that Residual-P and Conc. HCl-P fractions directly influenced soil available P, which mainly determined crops’ P uptake in the current situation (Figure 9). Thus, we argue that future research should pay more attention to the effectiveness of moderately labile P and non-labile P to better understand soil P fractions and their transformation. The present study also found that the contributions of each P fraction to P uptake by wheat and faba bean differed, and the contribution of each P fraction to the crop’s P uptake was changed due to the intercropping of wheat and faba bean. In agreement with Hou et al. [64], the present study supports that Con. HCl-P and Dil. HCl-P primarily contribute to soil P utilization when wheat is intercropped with faba bean.
The present study found that soil available P was directly affected by Residue-P and Con. HCl-P (Figure 9b); thus, continuous intercropping of wheat and faba bean decreased the non-labile P pool, resulting in the depletion of soil available P stock. Zhou et al. [52] reported that maize and soybean intercropping decreased the non-labile P fraction, possibly due to alterations induced by intercropping in mineral or organic fractions in rhizosphere soil through root exudates, influencing the soil pH and organic anions and promoting the activation of insoluble P. In the present study, the total P stock did not change despite wheat and faba bean intercropping for 8 years, but non-labile and moderately labile P decreased, which is converted to labile P and then taken up by crops. Thus, continuous intercropping had nearly no impact on the labile P pool but increased crop P uptake.

5. Conclusions

Wheat and faba bean intercropping presented a P uptake advantage (LERPuptake > 1), leading to a reduction in soil available P by 9.0–23.4% after 8 years of continuous intercropping. Compared to the weighted average of MW and MF (It), the non-labile P components decreased by 5.0–12.1% at all P levels after 8 years of continuous intercropping, while the moderately labile P content decreased by 1.7–4.7% at P0 and P1 levels. Wheat and faba bean intercropping primarily decreased the proportion of Resin-P in the labile P pool and Residual-P in the non-labile P pool. Faba bean presented higher ability than wheat to use both labile and non-labile P, especially under low P input conditions. Consequently, wheat and faba bean continuous intercropping boosted the biological utilization rate of soil P fractions by crops, and thus enhancing P uptake by crops.

Supplementary Materials

The following supporting information can be downloaded at: https://www.mdpi.com/article/10.3390/agronomy14061121/s1, Table S1: Contents of Various Phosphorus Fractions. Figure S1: The monthly average temperature and rainfall during the field experiments in 2019 and 2022. Figure S2: Soil total P stock under different planting patterns and P levels. Figure S3: Principal component analysis of soil P fractions and crop P uptake under different planting patterns and P levels. Figure S4: Depicts the random forest modeling of crop P uptake and soil P fractions under monocropped faba bean system.

Author Contributions

J.H. (Jianyang He) and J.H. (Jun He): Methodology, validation, formal analysis, investigation, data curation, writing—original draft; H.L.: Methodology, investigation; Y.Y.: Visualization, writing—original draft; L.Q.: Investigation, project administration; L.T.: Investigation, data curation; Y.Z.: Conceptualization, writing—review and editing, project administration, funding acquisition; J.X.: Supervision, resources, writing—review and editing, funding acquisition. All authors have read and agreed to the published version of the manuscript.

Funding

This work was supported by the National Key R&D Program of China (2022YFD1901500/2022YFD1901502), the National Natural Science Foundation of China (32060718 and 31760611), and the Agricultural Joint Special Project of Yunnan Province (202301BD070001-201).

Data Availability Statement

Data are contained within the article and Supplementary Materials.

Conflicts of Interest

The authors declare no conflicts of interest.

References

  1. Dissanayaka, D.M.S.B.; Maruyama, H.; Masuda, G.; Wasaki, J. Interspecific facilitation of P acquisition in intercropping of maize with white lupin in two contrasting soils as influenced by different rates and forms of P supply. Plant Soil 2015, 390, 223–236. [Google Scholar] [CrossRef]
  2. Gao, Y.; Wang, X.; Shah, J.A.; Chu, G. Polyphosphate fertilizers increased maize (Zea mays L.) P, Fe, Zn, and Mn uptake by decreasing P fixation and mobilizing microelements in calcareous soil. J. Soils Sediments 2020, 20, 1–11. [Google Scholar] [CrossRef]
  3. MacDonald, G.K.; Bennett, E.M.; Potter, P.A.; Ramankutty, N. Agronomic phosphorus imbalances across the world’s croplands. Proc. Natl. Acad. Sci. USA 2011, 108, 3086–3091. [Google Scholar] [CrossRef] [PubMed]
  4. Sattari, S.Z.; Bouwman, A.F.; Giller, K.E.; van Ittersum, M.K. Residual soil phosphorus as the missing piece in the global phosphorus crisis puzzle. Proc. Natl. Acad. Sci. USA 2012, 109, 6348–6353. [Google Scholar] [CrossRef] [PubMed]
  5. Dawson, C.; Hilton, J. Fertiliser availability in a resource-limited world: Production and recycling of nitrogen and phosphorus. Food Policy 2011, 36, S14–S22. [Google Scholar] [CrossRef]
  6. Hinsinger, P.; Betencourt, E.; Bernard, L.; Brauman, A.; Plassard, C.; Shen, J.; Tang, X.; Zhang, F. P for Two, Sharing a Scarce Resource: Soil Phosphorus Acquisition in the Rhizosphere of Intercropped Species. Plant Physiol. 2011, 156, 1078–1086. [Google Scholar] [CrossRef] [PubMed]
  7. Li, H.; Huang, G.; Meng, Q.; Ma, L.; Yuan, L.; Wang, F.; Zhang, W.; Cui, Z.; Shen, J.; Chen, X.; et al. Integrated soil and plant phosphorus management for crop and environment in China. A review. Plant Soil 2011, 349, 157–167. [Google Scholar] [CrossRef]
  8. Li, Y.; Gao, R.; Yang, R.; Wei, Y.; Li, Y.; Xiao, H.; Wu, J. Using a Simple Soil Column Method to Evaluate Soil Phosphorus Leaching Risk. CLEAN—Soil Air Water 2013, 41, 1100–1107. [Google Scholar] [CrossRef]
  9. Bruulsema, T.W.; Peterson, H.M.; Prochnow, L.I. The Science of 4R Nutrient Stewardship for Phosphorus Management across Latitudes. J. Environ. Qual. 2019, 48, 1295–1299. [Google Scholar] [CrossRef]
  10. Shen, J.; Yuan, L.; Zhang, J.; Li, H.; Bai, Z.; Chen, X.; Zhang, W.; Zhang, F. Phosphorus Dynamics: From Soil to Plant. Plant Physiol. 2011, 156, 997–1005. [Google Scholar] [CrossRef]
  11. He, Y.; Ding, N.; Shi, J.; Wu, M.; Liao, H.; Xu, J. Profiling of microbial PLFAs: Implications for interspecific interactions due to intercropping which increase phosphorus uptake in phosphorus limited acidic soils. Soil Biol. Biochem. 2013, 57, 625–634. [Google Scholar] [CrossRef]
  12. Li, H.; Zhang, F.; Rengel, Z.; Shen, J. Rhizosphere properties in monocropping and intercropping systems between faba bean (Vicia faba L.) and maize (Zea mays L.) grown in a calcareous soil. Crop. Pasture Sci. 2013, 64, 976–984. [Google Scholar] [CrossRef]
  13. Darch, T.; Giles, C.D.; Blackwell, M.S.; George, T.S.; Brown, L.K.; Menezes-Blackburn, D.; Shand, C.A.; Stutter, M.I.; Lumsdon, D.G.; Mezeli, M.M. Inter-and intra-species intercropping of barley cultivars and legume species, as affected by soil phosphorus availability. Plant Soil 2018, 427, 125–138. [Google Scholar] [CrossRef]
  14. Li, L.; Tilman, D.; Lambers, H.; Zhang, F. Plant diversity and overyielding: Insights from belowground facilitation of intercropping in agriculture. New Phytol. 2014, 203, 63–69. [Google Scholar] [CrossRef] [PubMed]
  15. Niederberger, J.; Kohler, M.; Bauhus, J. Distribution of phosphorus fractions with different plant availability in German forest soils and their relationship with common soil properties and foliar P contents. SOIL 2019, 5, 189–204. [Google Scholar] [CrossRef]
  16. Dissanayaka, D.M.S.B.; Wickramasinghe, W.M.K.R.; Marambe, B.; Wasaki, J.U.N. Phosphorus-mobilization strategy based on carboxylate exudation in lupin (Lupinus, Fabaceae): A mechanism facilitating the growth and phopsphorus acquisition of neighboring plants under phosphorus-limited conditions. Exp. Agric 2017, 53, 308–319. [Google Scholar] [CrossRef]
  17. Latati, M.; Blavet, D.; Alkama, N.; Laoufi, H.; Drevon, J.J.; Gérard, F.; Pansu, M.; Ounane, S.M. The intercropping cowpea-maize improves soil phosphorus availability and maize yields in an alkaline soil. Plant Soil 2014, 385, 181–191. [Google Scholar] [CrossRef]
  18. Betencourt, E.; Duputel, M.; Colomb, B.; Desclaux, D.; Hinsinger, P. Intercropping promotes the ability of durum wheat and chickpea to increase rhizosphere phosphorus availability in a low P soil. Soil Biol. Biochem. 2012, 46, 181–190. [Google Scholar] [CrossRef]
  19. O’sullivan, J.B.; Jin, J.; Tang, C. Elevated CO2 promotes the acquisition of phosphorus in crop species differing in physiological phosphorus-acquiring mechanisms. Plant Soil 2020, 455, 397–408. [Google Scholar] [CrossRef]
  20. Ziadi, N.; Whalen, J.K.; Messiga, A.J.; Morel, C. Assessment and Modeling of Soil Available Phosphorus in Sustainable Cropping Systems. Adv. Agron 2013, 122, 85–126. [Google Scholar]
  21. Hedley, M.J.; Stewart, J.; Chauhan, B.S. Changes in Inorganic and Organic Soil Phosphorus Fractions Induced by Cultivation Practices and by Laboratory Incubations. Soil Sci. Soc. Am. J. 1982, 46, 970–976. [Google Scholar] [CrossRef]
  22. Yonathan, R.; Siobhan, S.; Paola, D.; Liliana, G.; Cornelia, R.; María de la Luz, M. Fertilizer P Uptake Determined by Soil P Fractionation and Phosphatase Activity. J. Soil Sci. Plant Nutr. 2019, 19, 166–174. [Google Scholar]
  23. Liu, J.; Yang, J.; Cade-Menun, B.J.; Liang, X.; Hu, Y.; Liu, C.W.; Zhao, Y.; Li, L.; Shi, J. Complementary phosphorus speciation in agricultural soils by sequential fractionation, solution 31P nuclear magnetic resonance, and phosphorus K-edge X-ray absorption near-edge structure spectroscopy. J. Environ. Qual. 2013, 42, 1763–1770. [Google Scholar] [CrossRef]
  24. Bol, R.; Julich, D.; Brödlin, D.; Siemens, J.; Kaiser, K.; Dippold, M.A.; Spielvogel, S.; Zilla, T.; Mewes, D.; von Blanckenburg, F.; et al. Dissolved and colloidal phosphorus fluxes in forest ecosystems—An almost blind spot in ecosystem research. J. Soil Sci. Plant Nutr. 2016, 179, 425–438. [Google Scholar] [CrossRef]
  25. Cabeza, R.A.; Myint, K.; Steingrobe, B.; Stritsis, C.; Schulze, J.; Claassen, N. Phosphorus fractions depletion in the rhizosphere of young and adult maize and oilseed rape plants. J. Soil Sci. Plant Nutr. 2017, 17, 824–838. [Google Scholar] [CrossRef]
  26. Rubio, G.; Faggioli, V.; Scheiner, J.D.; Gutiérrez-Boem, F.H. Rhizosphere phosphorus depletion by three crops differing in their phosphorus critical levels. J. Plant Nutr. 2012, 175, 810–871. [Google Scholar] [CrossRef]
  27. Liao, D.; Zhang, C.; Lambers, H.; Zhang, F. Changes in soil phosphorus fractions in response to long-term phosphate fertilization under sole cropping and intercropping of maize and faba bean on a calcareous soil. Plant Soil 2021, 463, 589–600. [Google Scholar] [CrossRef]
  28. Yang, Z.; Zhang, Y.; Wang, Y.; Zhang, H.; Zhu, Q.; Yan, B.; Fei, J.; Xiangmin, R.; Peng, J.; Luo, G. Intercropping regulation of soil phosphorus composition and microbially-driven dynamics facilitates maize phosphorus uptake and productivity improvement. Field Crop. Res. 2022, 287, 108666. [Google Scholar] [CrossRef]
  29. Presti, E.L.; Badagliacca, G.; Romeo, M.; Monti, M. Does Legume Root Exudation Facilitate Itself P Uptake in Intercropped Wheat? J. Soil Sci. Plant Nutr. 2021, 21, 3269–3283. [Google Scholar] [CrossRef]
  30. Zhu, Y.-A.; He, J.; Yu, Z.; Zhou, D.; Li, H.; Wu, X.; Dong, Y.; Tang, L.; Zheng, Y.; Xiao, J. Wheat and Faba Bean Intercropping Together with Nitrogen Modulation Is a Good Option for Balancing the Trade-Off Relationship between Grain Yield and Quality in the Southwest of China. Agronomy 2022, 12, 2984. [Google Scholar] [CrossRef]
  31. Wright, A.L.; Hons, F.M.; Lemon, R.G.; McFarland, M.L.; Nichols, R.L. Microbial activity and soil C sequestration for reduced and conventional tillage cotton. Appl. Soil Ecol. 2008, 38, 168–173. [Google Scholar] [CrossRef]
  32. Ding, L.; Wu, J.; Xiao, H.; Zhou, P.; Syers, J.K. Mobilisation of inorganic phosphorus induced by rice straw in aggregates of a highly weathered upland soil. J. Sci. Food Agric. 2012, 92, 1073–1079. [Google Scholar] [CrossRef] [PubMed]
  33. Xu, B.; Xu, W.; Wang, Z.; Chen, Z.; Palta, J.A.; Chen, Y. Accumulation of N and P in the legume Lespedeza davurica in controlled mixtures with the grass Bothriochloa ischaemum under varying water and fertilization conditions. Front. Plant Sci. 2018, 9, 165. [Google Scholar] [CrossRef] [PubMed]
  34. Suzuki, L.E.A.S.; Reinert, D.J.; Fenner, P.T.; Secco, D.; Reichert, J.M. Prevention of additional compaction in eucalyptus and pasture land uses, considering soil moisture and bulk density. J. South Am. Earth Sci. 2022, 120, 104113. [Google Scholar] [CrossRef]
  35. Watanabe, F.S.; Olsen, S.R. Test of an Ascorbic Acid Method for Determining Phosphorus in Water and NaHCO3 Extracts from Soil. Soil Sci. Soc. Am. J. 1965, 29, 677–678. [Google Scholar] [CrossRef]
  36. Murphy, J.A.; Riley, J.P. A modified single solution method for the determination of phosphate in natural waters. Anal. Chim. Acta 1962, 27, 678–681. [Google Scholar] [CrossRef]
  37. Moir, J.; Tiessen, H. Characterization of Available P by Sequential Extraction. In Soil Sampling and Methods of Analysis; Informa UK Limited: London, UK, 1993; Volume 7, pp. 5–229. [Google Scholar]
  38. Shi, L.-L.; Shen, M.-X.; Lu, C.-Y.; Wang, H.-H.; Zhou, X.-W.; Jin, M.-J.; Wu, T.-D. Soil phosphorus dynamic, balance and critical P values in long-term fertilization experiment in Taihu Lake region, China. J. Integr. Agric. 2015, 14, 2446–2455. [Google Scholar] [CrossRef]
  39. Rao, M.R.; Willey, R.W. Evaluation of yield stability in intercropping: Studies on Sorghum/Pigeonpea. Exp. Agric. 1980, 16, 105–116. [Google Scholar] [CrossRef]
  40. Zamuner, E.C.; Díez, A.B.; Picone, L.I. Effect of long-term phosphorus fertilization on soil phosphorus fractions. Span. J. Soil Sci. 2012, 2, 50–61. [Google Scholar] [CrossRef]
  41. Tang, X.; Xia, M.; Guan, F.; Fan, S. Spatial Distribution of Soil Nitrogen, Phosphorus and Potassium Stocks in Moso Bamboo Forests in Subtropical China. Forests 2016, 7, 267. [Google Scholar] [CrossRef]
  42. Rosseel, Y.; Loh, W.W. A structural after measurement approach to structural equation modeling. Psychol. Methods 2022. [Google Scholar] [CrossRef] [PubMed]
  43. Mndzebele, B.; Ncube, B.; Fessehazion, M.; Mabhaudhi, T.; Amoo, S.; du Plooy, C.; Venter, S.; Modi, A. Effects of cowpea-amaranth intercropping and fertiliser application on soil phosphatase activities, available soil phosphorus, and crop growth response. Agronomy 2020, 10, 79. [Google Scholar] [CrossRef]
  44. Wang, B.; Liu, H.; Wang, X.H.; Li, J.M.; Ma, Y.B.; Ma, X.W. Soil phosphorus accumulation model for an arid area of north-western China with 3-year rotation of wheat, maize and cotton. J. Agric. Sci. 2015, 153, 1247–1256. [Google Scholar] [CrossRef]
  45. An, R.; Yu, R.-P.; Xing, Y.; Zhang, J.-D.; Bao, X.-G.; Lambers, H.; Li, L. Intercropping efficiently utilizes phosphorus resource in soil via different strategies mediated by crop traits and species combination. Plant Soil 2023, 497, 705–725. [Google Scholar] [CrossRef]
  46. Li, S.M.; Li, L.; Zhang, F.S.; Tang, C. Acid Phosphatase Role in Chickpea/Maize Intercropping. Ann. Bot. 2004, 94, 297–303. [Google Scholar] [CrossRef]
  47. Xiao, L.; Chen, G.; Wang, H.; Li, Y.; Li, C.; Cheng, L.; Wenge, W.; Xiao, X.; Zhu, Y. Improvement of P use efficiency and P balance of rice-wheat rotation system according to the long term field experiments in the Yangze River Delta. Front. Environ. Sci. 2022, 10, 979. [Google Scholar] [CrossRef]
  48. Bowman, R.A.; Cole, C.V. Transformations of organic phosphorus substrates in soils as evaluated by NaHCO3 extraction. Soil Sci. 1978, 125, 49–54. [Google Scholar] [CrossRef]
  49. Yang, X.; Post, W.M. Phosphorus transformations as a function of pedogenesis: A synthesis of soil phosphorus data using Hedley fractionation method. Biogeosciences 2011, 8, 2907–2916. [Google Scholar] [CrossRef]
  50. Gao, X.; Shi, D.; Lv, A.; Wang, S.; Yuan, S.; Zhou, P.; An, Y. Increase phosphorus availability from the use of alfalfa (Medicago sativa L.) green manure in rice (Oryza sativa L.) agroecosystem. Sci. Rep. 2016, 6, 36981. [Google Scholar] [CrossRef]
  51. Sharpley, A.N. Phosphorus Cycling in Unfertilized and Fertilized Agricultural Soils. Soil Sci. Soc. Am. J. 1985, 49, 905–911. [Google Scholar] [CrossRef]
  52. Zhou, L.; Su, L.; Zhao, H.; Wang, S.; Zheng, Y.; Tang, L. Maize/soybean intercropping promoted activation of soil organic phosphorus fractions by enhancing more phosphatase activity in red soil under different phosphorus application rates. Plant Soil 2023, 1–20. [Google Scholar] [CrossRef]
  53. Liao, D.; Zhang, C.; Lambers, H.; Zhang, F. Adding intercropped maize and faba bean root residues increases phosphorus bioavailability in a calcareous soil due to organic phosphorus mineralization. Plant Soil 2022, 476, 201–218. [Google Scholar] [CrossRef]
  54. Granzow, S.; Kaiser, K.; Wemheuer, B.; Pfeiffer, B.; Daniel, R.; Vidal, S.; Wemheuer, F. The effects of cropping regimes on fungal and bacterial communities of wheat and faba bean in a greenhouse pot experiment differ between plant species and compartment. Front. Microbiol. 2017, 8, 216435. [Google Scholar] [CrossRef] [PubMed]
  55. Li, H.; Shen, J.; Zhang, F.; Clairotte, M.; Drevon, J.J.; Le Cadre, E.; Hinsinger, P. Dynamics of phosphorus fractions in the rhizosphere of common bean (Phaseolus vulgaris L.) and durum wheat (Triticum turgidum durum L.) grown in monocropping and intercropping systems. Plant Soil 2008, 312, 139–150. [Google Scholar] [CrossRef]
  56. Liu, Y.; Zhang, G.; Luo, X.; Hou, E.; Zheng, M.; Zhang, L.; He, X.; Shen, W.; Wen, D. Mycorrhizal fungi and phosphatase involvement in rhizosphere phosphorus transformations improves plant nutrition during subtropical forest succession. Soil Biol. Biochem. 2021, 153, 108099. [Google Scholar] [CrossRef]
  57. Zhu, Y.; Wu, F.; He, Z.; Guo, J.; Qu, X.; Xie, F.; Giesy, J.P.; Liao, H.; Guo, F. Characterization of Organic Phosphorus in Lake Sediments by Sequential Fractionation and Enzymatic Hydrolysis. Environ. Sci. Technol. 2013, 47, 7679–7687. [Google Scholar] [CrossRef] [PubMed]
  58. Li, G.; Li, H.; Leffelaar, P.A.; Shen, J.; Zhang, F. Dynamics of phosphorus fractions in the rhizosphere of fababean (Vicia faba L.) and maize (Zea mays L.) grown in calcareous and acid soils. Crop. Pasture Sci. 2015, 66, 1151–1160. [Google Scholar] [CrossRef]
  59. Liao, D.; Zhang, C.; Li, H.; Lambers, H.; Zhang, F. Changes in soil phosphorus fractions following sole cropped and intercropped maize and faba bean grown on calcareous soil. Plant Soil 2020, 448, 587–601. [Google Scholar] [CrossRef]
  60. Cross, A.F.; Schlesinger, W.H. A literature review and evaluation of the. Hedley fractionation: Applications to the biogeochemical cycle of soil phosphorus in natural ecosystems. Geoderma 1995, 64, 197–214. [Google Scholar] [CrossRef]
  61. Hinsinger, P. Bioavailability of soil inorganic P in the rhizosphere as affected by root-induced chemical changes: A review. Plant Soil 2001, 237, 173–195. [Google Scholar] [CrossRef]
  62. Duchene, O.; Vian, J.-F.; Celette, F. Intercropping with legume for agroecological cropping systems: Complementarity and facilitation processes and the importance of soil microorganisms. A review. Agric. Ecosyst. Environ. 2017, 240, 148–161. [Google Scholar] [CrossRef]
  63. Wang, Y.; Zhang, W.; Müller, T.; Lakshmanan, P.; Liu, Y.; Liang, T.; Wang, L.; Yang, H.; Chen, X. The distribution of phosphorus from recycled fertilizers to different soil fractions determines the phosphorus availability in soil. SOIL 2021, 2021, 1–26. [Google Scholar]
  64. Hou, E.; Chen, C.; Kuang, Y.; Zhang, Y.; Heenan, M.; Wen, D. A structural equation model analysis of phosphorus transformations in global unfertilized and uncultivated soils. Glob. Biogeochem. Cycles 2016, 30, 1300–1309. [Google Scholar] [CrossRef]
Figure 1. Diagram of planting patterns in the field experiments. Note: Agronomy 14 01121 i001 soil sampling sites.
Agronomy 14 01121 g001
Figure 2. Crop P uptake under different cropping patterns and P levels. Note: **, p < 0.01; ns, no significance. MW, MF, IW, and IF represent monocropped wheat, monocropped faba beans, intercropped wheat, and intercropped faba beans, respectively. Panel (a), P uptake by MW and IW; panel (b), P uptake by MF and IF; panel (c), the P uptake LER under different P levels (p < 0.05). Different letters indicate differences among treatments in each panel (p < 0.05).
Agronomy 14 01121 g002
Figure 3. Soil P apparent balance under different cropping patterns and P levels. Note: ***, p < 0.001; **, p < 0.01; ns, no significance. MW, MF, and W//F represent monocropped wheat, monocropped faba beans, and wheat and faba bean intercropping, respectively. Different letters indicate differences among treatments (p < 0.05).
Agronomy 14 01121 g003
Figure 4. Soil available P stock under different cropping patterns and P levels. Note: PL, PP, and PL×PP represent the P level, planting pattern, and P level × planting pattern, respectively. ***, p < 0.001; **, p < 0.01; *, p < 0.05; ns, no significance. MW, MF, W//F, and It represent monocropped wheat, monocropped faba beans, wheat and faba bean intercropping, and the weighted average of monocropped wheat and faba bean, respectively. Different lowercase letters in each bar indicate a significant difference in soil available P stock under different cropping patterns and P levels (p < 0.05) in the same year. ns in the bar chart indicates no difference between W//F and It, and * in the bar chart indicates a significant difference between W//F and It (p < 0.05).
Agronomy 14 01121 g004
Figure 5. Soil P pool under different cropping patterns and P levels. Note: MW, MF, W//F, and It represent monocropped wheat, monocropped faba beans, wheat and faba bean intercropping, and the weighted average of monocropped wheat and faba beans, respectively. *, p < 0.05; ns, no significance. Panels (ac), soil labile P stock in 2020, 2021, and 2022, respectively; panels (df), soil moderately labile P stock in 2020, 2021, and 2022, respectively; panels (gi), soil non-labile P stock in 2020, 2021, and 2022, respectively. Different letters indicate significant differences among treatments in each panel (p < 0.05).
Agronomy 14 01121 g005
Figure 6. Proportion of different P fractions within the soil labile P pool under different cropping patterns and P levels. Note: MW, MF, and W//F represent monocropped wheat, monocropped faba beans, and wheat and faba bean intercropping, respectively. Panels (ac), different P fractions within the soil labile P pool at P0, P1, and P2 levels, respectively, in 2020, 2021, and 2022, respectively; in each panel, different letters indicate significant differences among MW, MF, and W//F under different P levels for each P fraction (p < 0.05).
Agronomy 14 01121 g006
Figure 7. Proportion of different P fractions within the soil moderately labile P pool under different cropping patterns and P levels. Note: MW, MF, and W//F represent monocropped wheat, monocropped faba beans, and wheat and faba bean intercropping, respectively. Panels (ac), different P fractions within soil moderately labile P pool at P0, P1, and P2 levels in 2020, 2021, and 2022, respectively. In each panel, different letters indicate significant differences among MW, MF, and W//F under different P levels for each P fraction (p < 0.05).
Agronomy 14 01121 g007
Figure 8. Proportion of different P fractions within the soil non-labile P pool under different cropping patterns and P levels. Note: MW, MF, and W//F represent monocropped wheat, monocropped faba beans, and wheat and faba bean intercropping, respectively. Panels (ac), different P fractions within the soil non-labile P pool at P0, P1, and P2 levels in 2020, 2021, and 2022, respectively. In each panel, different letters indicate significant differences among MW, MF, and W//F under different P levels for each P fraction (p < 0.05).
Agronomy 14 01121 g008
Figure 9. Co-relationships among crop P uptake, soil available P, and soil P fractions. Note: Panel (a), Pearson correlation analysis among P uptake, soil available P, and soil P fractions; panel (b), correlation analysis among P uptake, soil available P, and soil P fractions based on the structural equation model; panels (c,d), the random forest models for P uptake and P fractions in the MW and W//F systems, respectively. *, p < 0.05; **, p < 0.01; ***, p < 0.001; ns, no significance. In panel (b), the thick solid red arrows represent significant positive correlations, and the thin solid red arrows represent positive correlations; the blue arrows represent significant negative correlations. Model fit results: χ2 = 8.583, df = 5, p = 0.129, GFI = 0.982, RMSEA = 0.094.
Agronomy 14 01121 g009
Table 1. Soil P fractions stocks under different planting patterns and P levels (Two-way ANOVA analysis).
Labile PModerately Labile PNon-Labile P
The Year 2020The Year 2021The Year 2022The Year 2020The Year 2021The Year 2022The Year 2020The Year 2021The Year 2022
P level*********************ns**
Planting patternsns*******ns**********
P level × Planting patterns*********nsns*****ns***
Note: *, p < 0.05; **, p < 0.01; ***, p < 0.001; ns, no significance.
Table 2. Soil labile P fractions under different planting patterns and P levels (Two-way ANOVA analysis).
Resin-PNaHCO3-PiNaHCO3-Po
The Year 2020The Year 2021The Year 2022The Year 2020The Year 2021The Year 2022The Year 2020The Year 2021The Year 2022
P level************************
Planting patterns***************************
P level × Planting patterns*************************
Note: *, p < 0.05; **, p < 0.01; ***, p < 0.001.
Table 3. Soil moderately labile P fractions under different planting patterns and P levels (Two-way ANOVA analysis).
NaOH-PiNaOH-PoDil. HCl-Pi
The Year 2020The Year 2021The Year 2022The Year 2020The Year 2021The Year 2022The Year 2020The Year 2021The Year 2022
P levelns***nsnsnsns***ns**
Planting patterns******ns************ns**
P level × Planting patterns**ns**********ns******
Note: **, p < 0.01; ***, p < 0.001; ns, no significance.
Table 4. Soil non-labile P fractions under different planting patterns and P levels (Two-way ANOVA analysis).
Conc. HCl-PResidual-P
The Year 2020The Year 2021The Year 2022The Year 2020The Year 2021The Year 2022
P level**********
Planting patterns******nsns******
P level × Planting patternsnsns**********
Note: *, p < 0.05; **, p < 0.01; ***, p < 0.001; ns, no significance.
Disclaimer/Publisher’s Note: The statements, opinions and data contained in all publications are solely those of the individual author(s) and contributor(s) and not of MDPI and/or the editor(s). MDPI and/or the editor(s) disclaim responsibility for any injury to people or property resulting from any ideas, methods, instructions or products referred to in the content.

