Article

Banana Bunch Weight Estimation and Stalk Central Point Localization in Banana Orchards Based on RGB-D Images

by
Lei Zhou
1,2,
Zhou Yang
3,
Fuqin Deng
1,
Jianmin Zhang
1,
Qiong Xiao
4,
Lanhui Fu
1,* and
Jieli Duan
3,*
1
School of Electronics and Information Engineering, Wuyi University, Jiangmen 529020, China
2
Guangdong Laboratory of Artificial Intelligence and Digital Economy (SZ), Shenzhen 518132, China
3
College of Engineering, South China Agricultural University, Guangzhou 510642, China
4
Jiangmen Electrical Power Transmission and Substation Engineering Co., Ltd., Jiangmen 529030, China
*
Authors to whom correspondence should be addressed.
Agronomy 2024, 14(6), 1123; https://doi.org/10.3390/agronomy14061123
Submission received: 29 March 2024 / Revised: 9 May 2024 / Accepted: 22 May 2024 / Published: 24 May 2024
(This article belongs to the Collection Advances of Agricultural Robotics in Sustainable Agriculture 4.0)

Abstract

:
Precise detection and localization are prerequisites for intelligent harvesting, while fruit size and weight estimation are key to intelligent orchard management. In commercial banana orchards, it is necessary to manage the growth and weight of banana bunches so that they can be harvested in time and prepared for transportation according to their different maturity levels. In this study, in order to reduce management costs and labor dependence, and obtain non-destructive weight estimation, we propose a method for localizing and estimating banana bunches using RGB-D images. First, the color image is detected through the YOLO-Banana neural network to obtain two-dimensional information about the banana bunches and stalks. Then, the three-dimensional coordinates of the central point of the banana stalk are calculated according to the depth information, and the banana bunch size is obtained based on the depth information of the central point. Finally, the effective pixel ratio of the banana bunch is presented, and the banana bunch weight estimation model is statistically analyzed. Thus, the weight estimation of the banana bunch is obtained through the bunch size and the effective pixel ratio. The R2 value between the estimated weight and the actual measured value is 0.8947, the RMSE is 1.4102 kg, and the average localization error of the central point of the banana stalk is 22.875 mm. The results show that the proposed method can provide bunch size and weight estimation for the intelligent management of banana orchards, along with localization information for banana-harvesting robots.

1. Introduction

Like other fresh fruit industries around the world, the banana industry is grappling with labor shortages, rising labor costs, and worker safety issues. The effective control and management of banana orchards is crucial to produce bananas of appropriate quality to meet the growing market demand. As precision agriculture technology gradually matures in the production of many fruits and vegetables, the combination of intelligent robots and fruit and vegetable operations improves the accuracy of agricultural tasks and reduces resource consumption, while helping farmers make production decisions through intelligent management. Therefore, the intelligent development of banana orchards is the core issue that determines the sustainable development of the banana industry. However, the unstructured banana orchard environment has characteristics such as uneven lighting and random occlusion, which pose challenges to the development and application of intelligent banana orchard equipment.
In intelligent research in the agricultural field, many researchers make full use of various visual sensors to address the impact of non-structured orchard environments [1,2,3]. Depth sensors are widely used in intelligent management tasks, such as fruit and vegetable detection, localization, and evaluation of fruit and vegetable shape and volume [4]. Based on accurate detection, estimation of the localization, size, and weight of the object fruit is very important in intelligent management, because it provides the geometric attributes of each fruit, thereby helping to judge fruit maturity, manage harvest time, and assess yield forecasting and reliable harvesting.
There are three main sensing technologies for obtaining three-dimensional information on fruits and vegetables: passive binoculars, TOF (time of flight), and structured light. Passive binoculars use the parallax of two cameras to collect images to calculate the distance between the object and the camera. Before the emergence of commercial depth cameras based on TOF and structured light, most research was based on passive binocular technology. Until now, research on passive binocular technology still occupied an important position. Font et al. [5] used color features and binocular cameras to estimate the position of pears and pick them in a laboratory environment. Si et al. [6] designed an apple-harvesting robot that uses binocular vision. Ji et al. [7] proposed a binocular stereo vision localization method based on morphology to extract the characteristic skeleton of apple branches. Xiong et al. [8] used binocular vision to segment and locate lychee clusters. Wang et al. [9] provided a matching and positioning method based on window zooming-based matching under a binocular vision system. Passive binocular technology has lower hardware costs because it does not require a projected light source, but it relies on natural light and has poor accuracy in low-light environments.
TOF sensing technology emits light pulses through infrared, uses a receiver to receive the light pulses reflected back from the object, and calculates the distance between the camera and the object based on the round-trip flight time of the light pulses. In recent years, a large number of studies have used TOF technology to detect and locate fruits and vegetables. The Kinect v2 depth camera is a frequently used TOF camera and was adopted by scholars for broccoli size detection [10], mango localization [11] and quality estimation [12], apple detection [13], lychee localization [14], guava point cloud acquisition [15], localization of the cut-off points of banana male flower clusters [16], and counting of banana hands [17]. The combination of two Kinect v2 depth cameras was used by Gené-Molaa et al. [18] to detect and locate Fuji apples. In addition, the combination of the Camcube 3.0 depth camera and a color camera was used for apple detection [19] and size estimation [20]. The TOF camera is an active measurement method that can be used in low-light environments. It has high real-time performance but low resolution. Since the laser is fully irradiated and emits high-frequency modulated pulses, it consumes high power.
Structured light technology actively projects infrared light with certain structural characteristics onto the target object, and then uses one or more infrared cameras to collect the reflected structured light image. Since the received pattern is deformed due to the shape of the object, the depth information can be calculated based on the degree of deformation of the pattern and the principle of triangulation; examples are Microsoft’s Kinect v1 and Intel’s Realsense series. Milella et al. [21] utilized four deep learning algorithms to detect grape RGB-D images and estimate grape volume based on the RealSense R200 depth camera. Ge et al. [22] applied RealSenseD415 and D435 depth cameras to obtain strawberry RGB-D images, and compared the detection results of strawberries with different maturity levels using the DCNN deep network. Kang et al. [23] proposed an improved deep neural network, DASNet-V2, using RGB cameras and RealSense D435 depth cameras to detect and instance segment apples and their branches. Rong et al. [24] developed a greenhouse mushroom-harvesting robot that combines improved SSD algorithm detection and RGB-D images collected in real time using a RealSense D435i to achieve mushroom detection and localization. Structured light camera technology is mature and has relatively high accuracy in low-light environments. Since structured light only illuminates the structural pattern area and does not require high-frequency modulation, it has higher resolution and lower power consumption than TOF cameras. Therefore, structured light technology has received widespread attention in the latest research.
In addition to using three-dimensional information for localization, 2D machine vision technology is used in several works to obtain fruit location, size, volume, and weight information. A few studies have used satellite images [25] and radar technology [26,27,28] to obtain images of red dates and apples. Most research is still based on RGB cameras to obtain and analyze fruit and vegetable images. Gené-Mola et al. [29] used a monocular camera to segment apple fruits based on mask RCNN instances, used structure-from-motion (SfM) to generate point clouds, and mapped from 2D to 3D to achieve apple localization. Yu et al. [30] described a strawberry pose estimator called R-YOLO, which used a monocular camera and fiber optic sensors to complete the detection and positioning of strawberries. Yu et al. [31] designed a camera and ultrasonic detection system to locate tree trunks in orchards. Wu et al. [32] proposed a method to segment peach point clouds by combining color HSV and 3D geometric features (viewpoint feature histogram features). Apolo-Apolo et al. [33] used a wooden ruler and the pixel comparison of the fruit to estimate the size of citrus fruits as a method of orchard production estimation. Wittstruck et al. [34] estimated the volume and weight of pumpkins by analyzing the relationship between the volume and weight of pumpkin UAV image pixels. However, the disadvantage of these sensors is that they only provide 2D information and their measurements are easily affected by lighting conditions.
To the best of our knowledge, there is currently no research on estimating banana bunch weight based on machine vision technology. The existing work on banana visual inspection includes banana stalk detection [35,36], banana inflorescence axis detection [37], banana inflorescence axis cutting point localization [16], and banana pseudo-stem detection [38]. The aim of banana weight estimation research is to establish the relationship between plant parameters and weight [39]. For example, Woomer et al. [40] estimated the weight of a banana bunch from the volume of the banana bunch and the volume of banana fingers. The conclusion was that although the estimation accuracy of the fruit finger volume was relatively high, the volume of the banana bunch is more suitable for estimating the yield of large banana orchards. Rodríguez et al. [41] analyzed the relationship between the number of banana leaves and the weight of banana bunches. Joyce et al. [42] built a linear regression model between banana bunch weight and stalk length, rachis weight, bunch length, bunch weight, number of fingers per bunch, and number of living leaves. Stevens et al. [43] studied parameters such as days to flowering, pseudo-stem volume at flowering, and the number of flowers, hands, and fingers in three growth periods of banana, and analyzed the relationship between each parameter and bunch weight. These studies are based on manual statistical analysis of data to guide farmers in their work.
In view of the above, depth-sensing technology based on structured light has good performance in fruit and vegetable localization research. It is based on the binocular vision measurement theory and introduces structured light to obtain richer object surface feature information. It also solves the problem of difficulty in matching areas with weak textures in binocular stereo vision. Therefore, based on the previous work using the YOLO-Banana neural network [44], this article proposes a method to estimate the weight of orchard banana bunches and conduct stalk central point localization using structured light technology. The main contributions of this study are as follows:
(1)
We present a method for detecting and localizing banana bunches and stalks in orchards based on a neural network and structured light technology to provide location information for banana-harvesting robots.
(2)
We propose a banana bunch weight estimation model. The size and weight of banana bunches are estimated from RGB-D image data. Intelligent monitoring of banana growth information can help farmers implement harvest decisions.
The remainder of this article is structured as follows. Section 2 introduces the orchard banana detection and localization algorithm, and the banana bunch weight estimation model. Section 3 presents the experimental results and comparative discussion. In Section 4, a summary and plans for future work are provided.

2. Materials and Methods
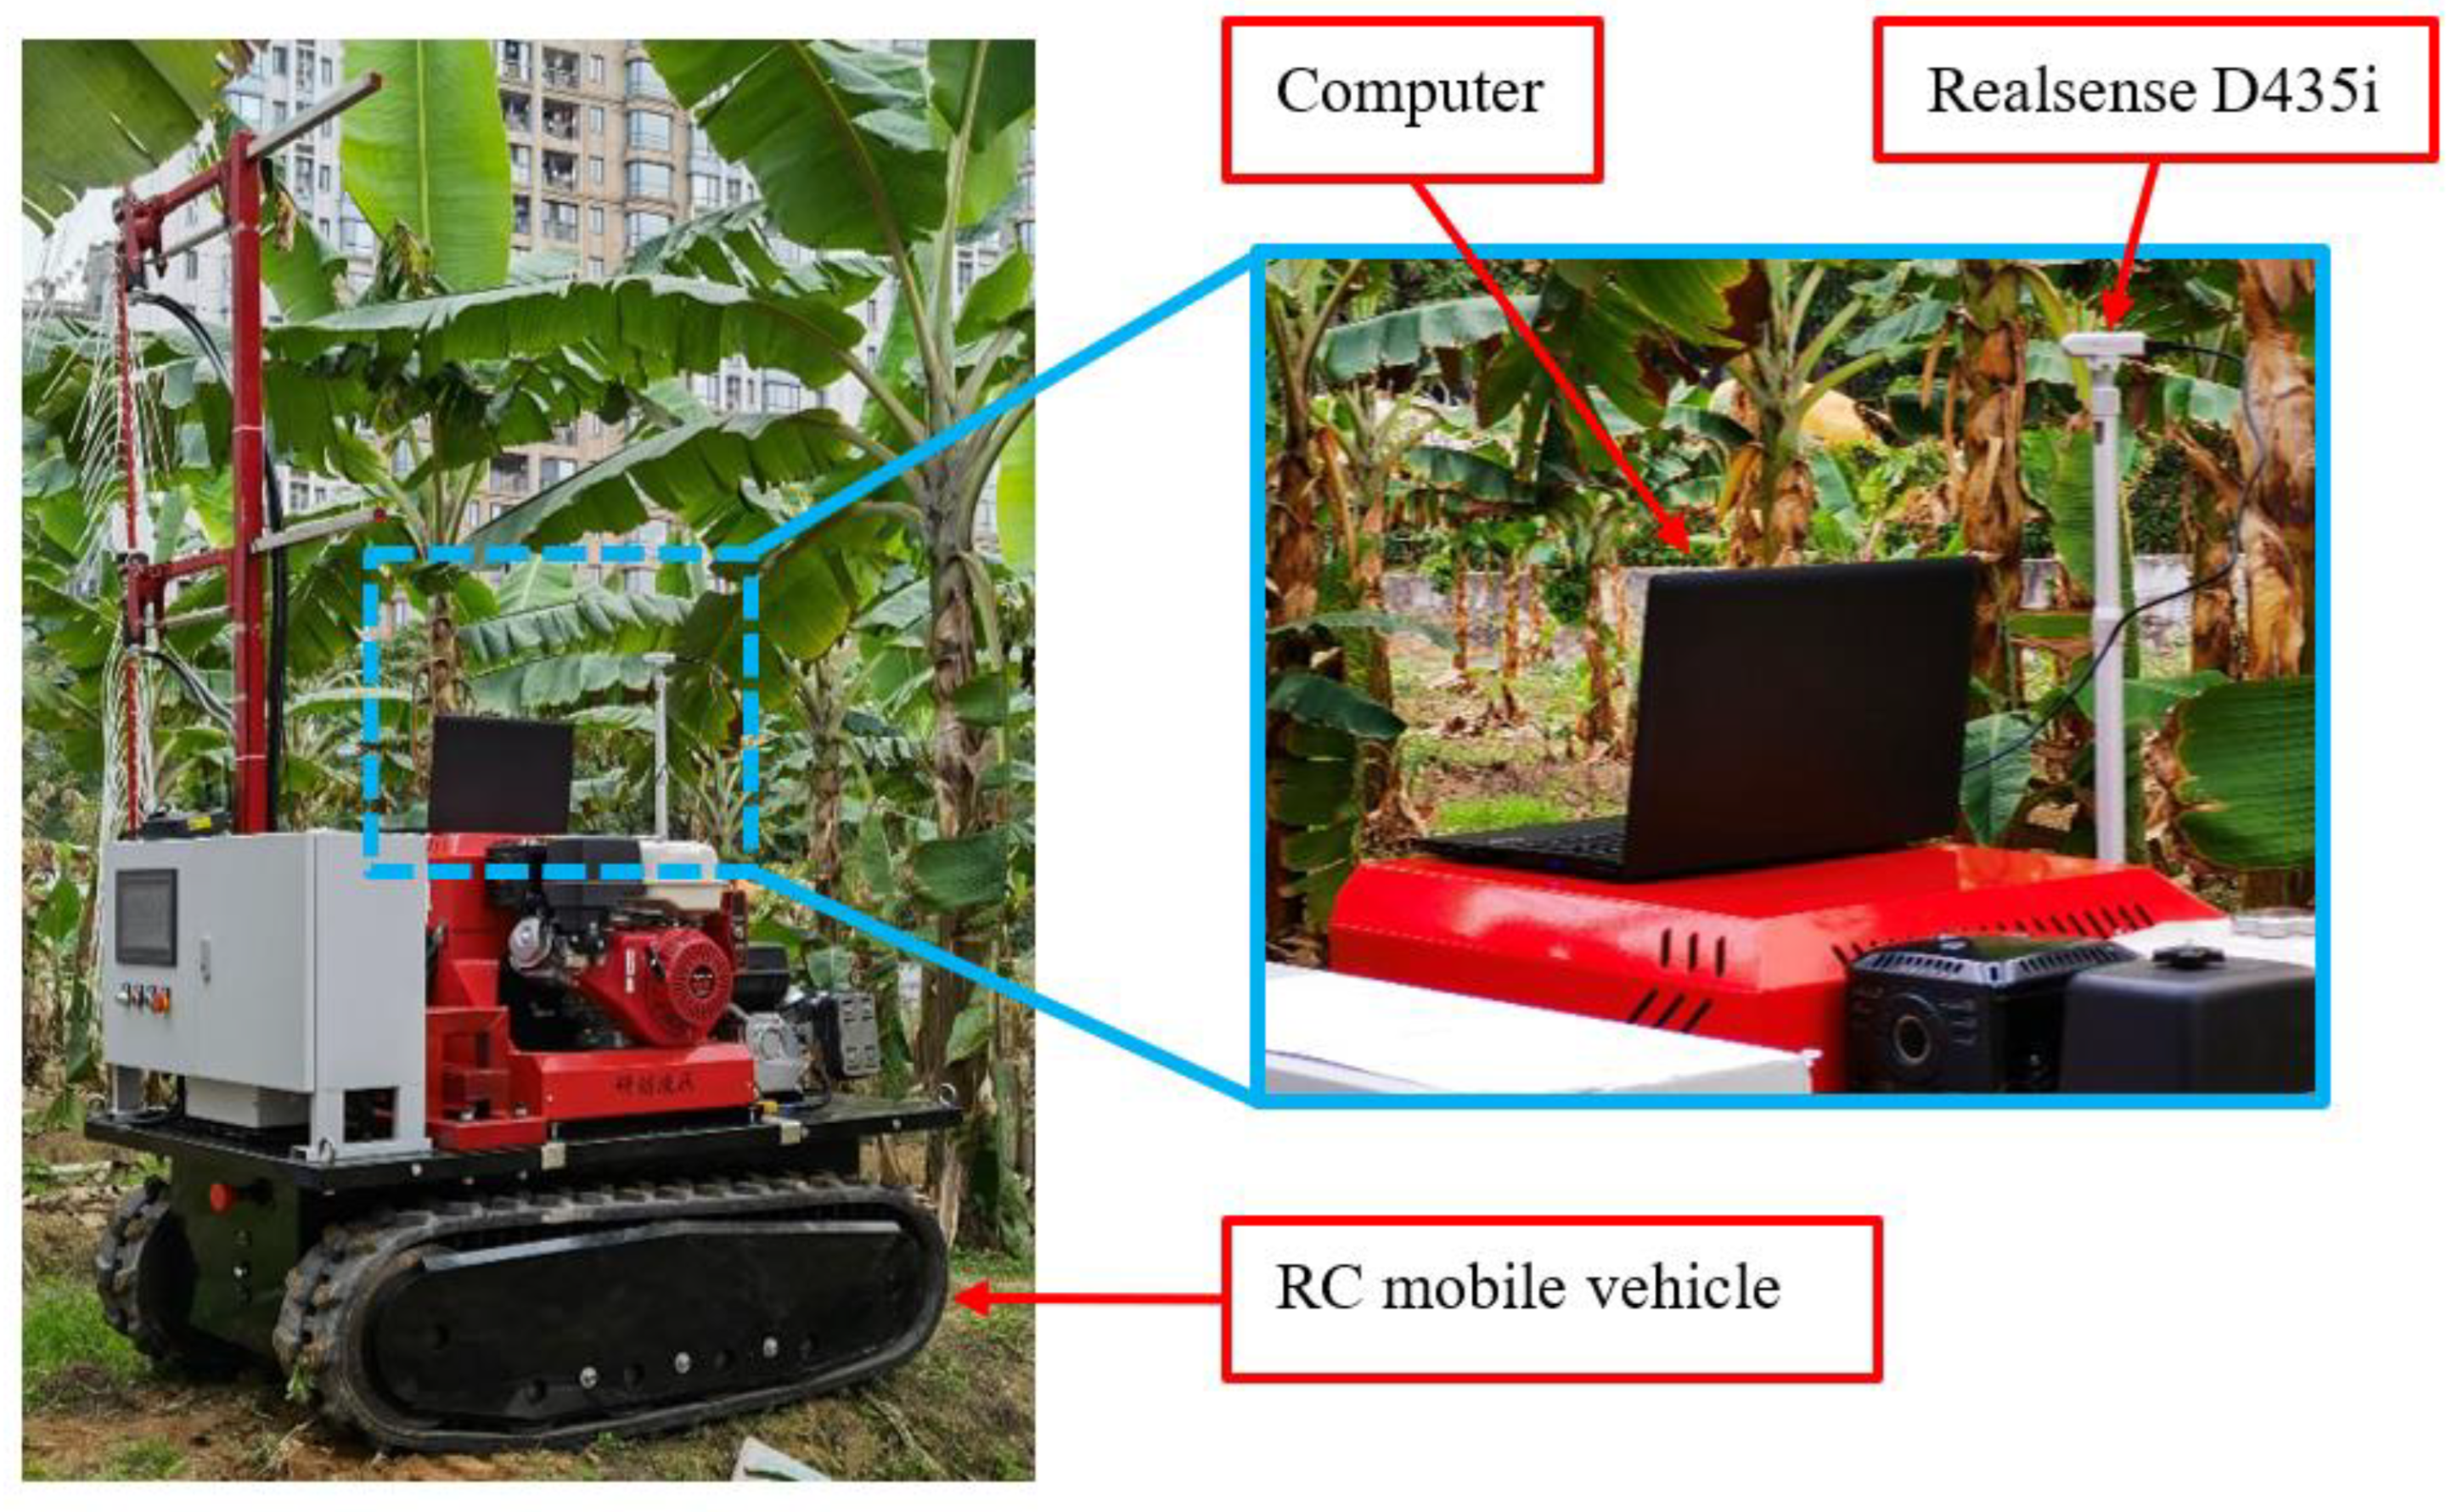
2.1. Sensor System

The machine vision system proposed in this article was installed on a remote-controlled mobile vehicle in a banana orchard to provide non-contact measurements of banana bunches and stalks, as shown in Figure 1. The Intel Realsense D435i depth camera was chosen to obtain images because of its stable performance and low price. The Realsense D435i camera uses two stereo infrared cameras and a color camera. The two infrared cameras capture two infrared images at the same time, obtain the depth image according to the triangulation principle, and use the left infrared camera coordinate system as the depth camera coordinate system. The camera is powered via USB and has a ranging range of 0.28~3 m. The RGB image resolution was set to 1280 × 720 pixels and the depth image resolution was set to 848 × 480. Visual Studio 2019 was used to implement the algorithm in this article, on a laptop with an Intel(R) Core (TM) i7-9750H processor @2.6 GHz 2.59 GHz, 16.0 GB RAM, and an NVIDIA GeForce RTX 2070 with Max-Q Design.
The process of the banana orchard bunch weight estimation and stalk localization algorithm is shown in Figure 2. The Realsense D435i camera acquires RGB images and depth images. The camera first aligns the depth image with the RGB image to generate an RGB-D image with both color information and depth information. Then, based on the YOLO-Banana deep neural network algorithm, the banana bunch and stalk on the color image are detected to obtain banana bunch and stalk detection bounding box information; furthermore, the three-dimensional coordinates of the central point of the stalk detection bounding box in the RGB-D image are obtained, which is also the central point of the stalk. At the same time, the length and width of the banana bunch are calculated from the vertical plane where the central point of the bunch detection bounding box is located. Finally, a banana bunch weight estimation model is built using the effective pixel ratio within the bunch detection bounding box.

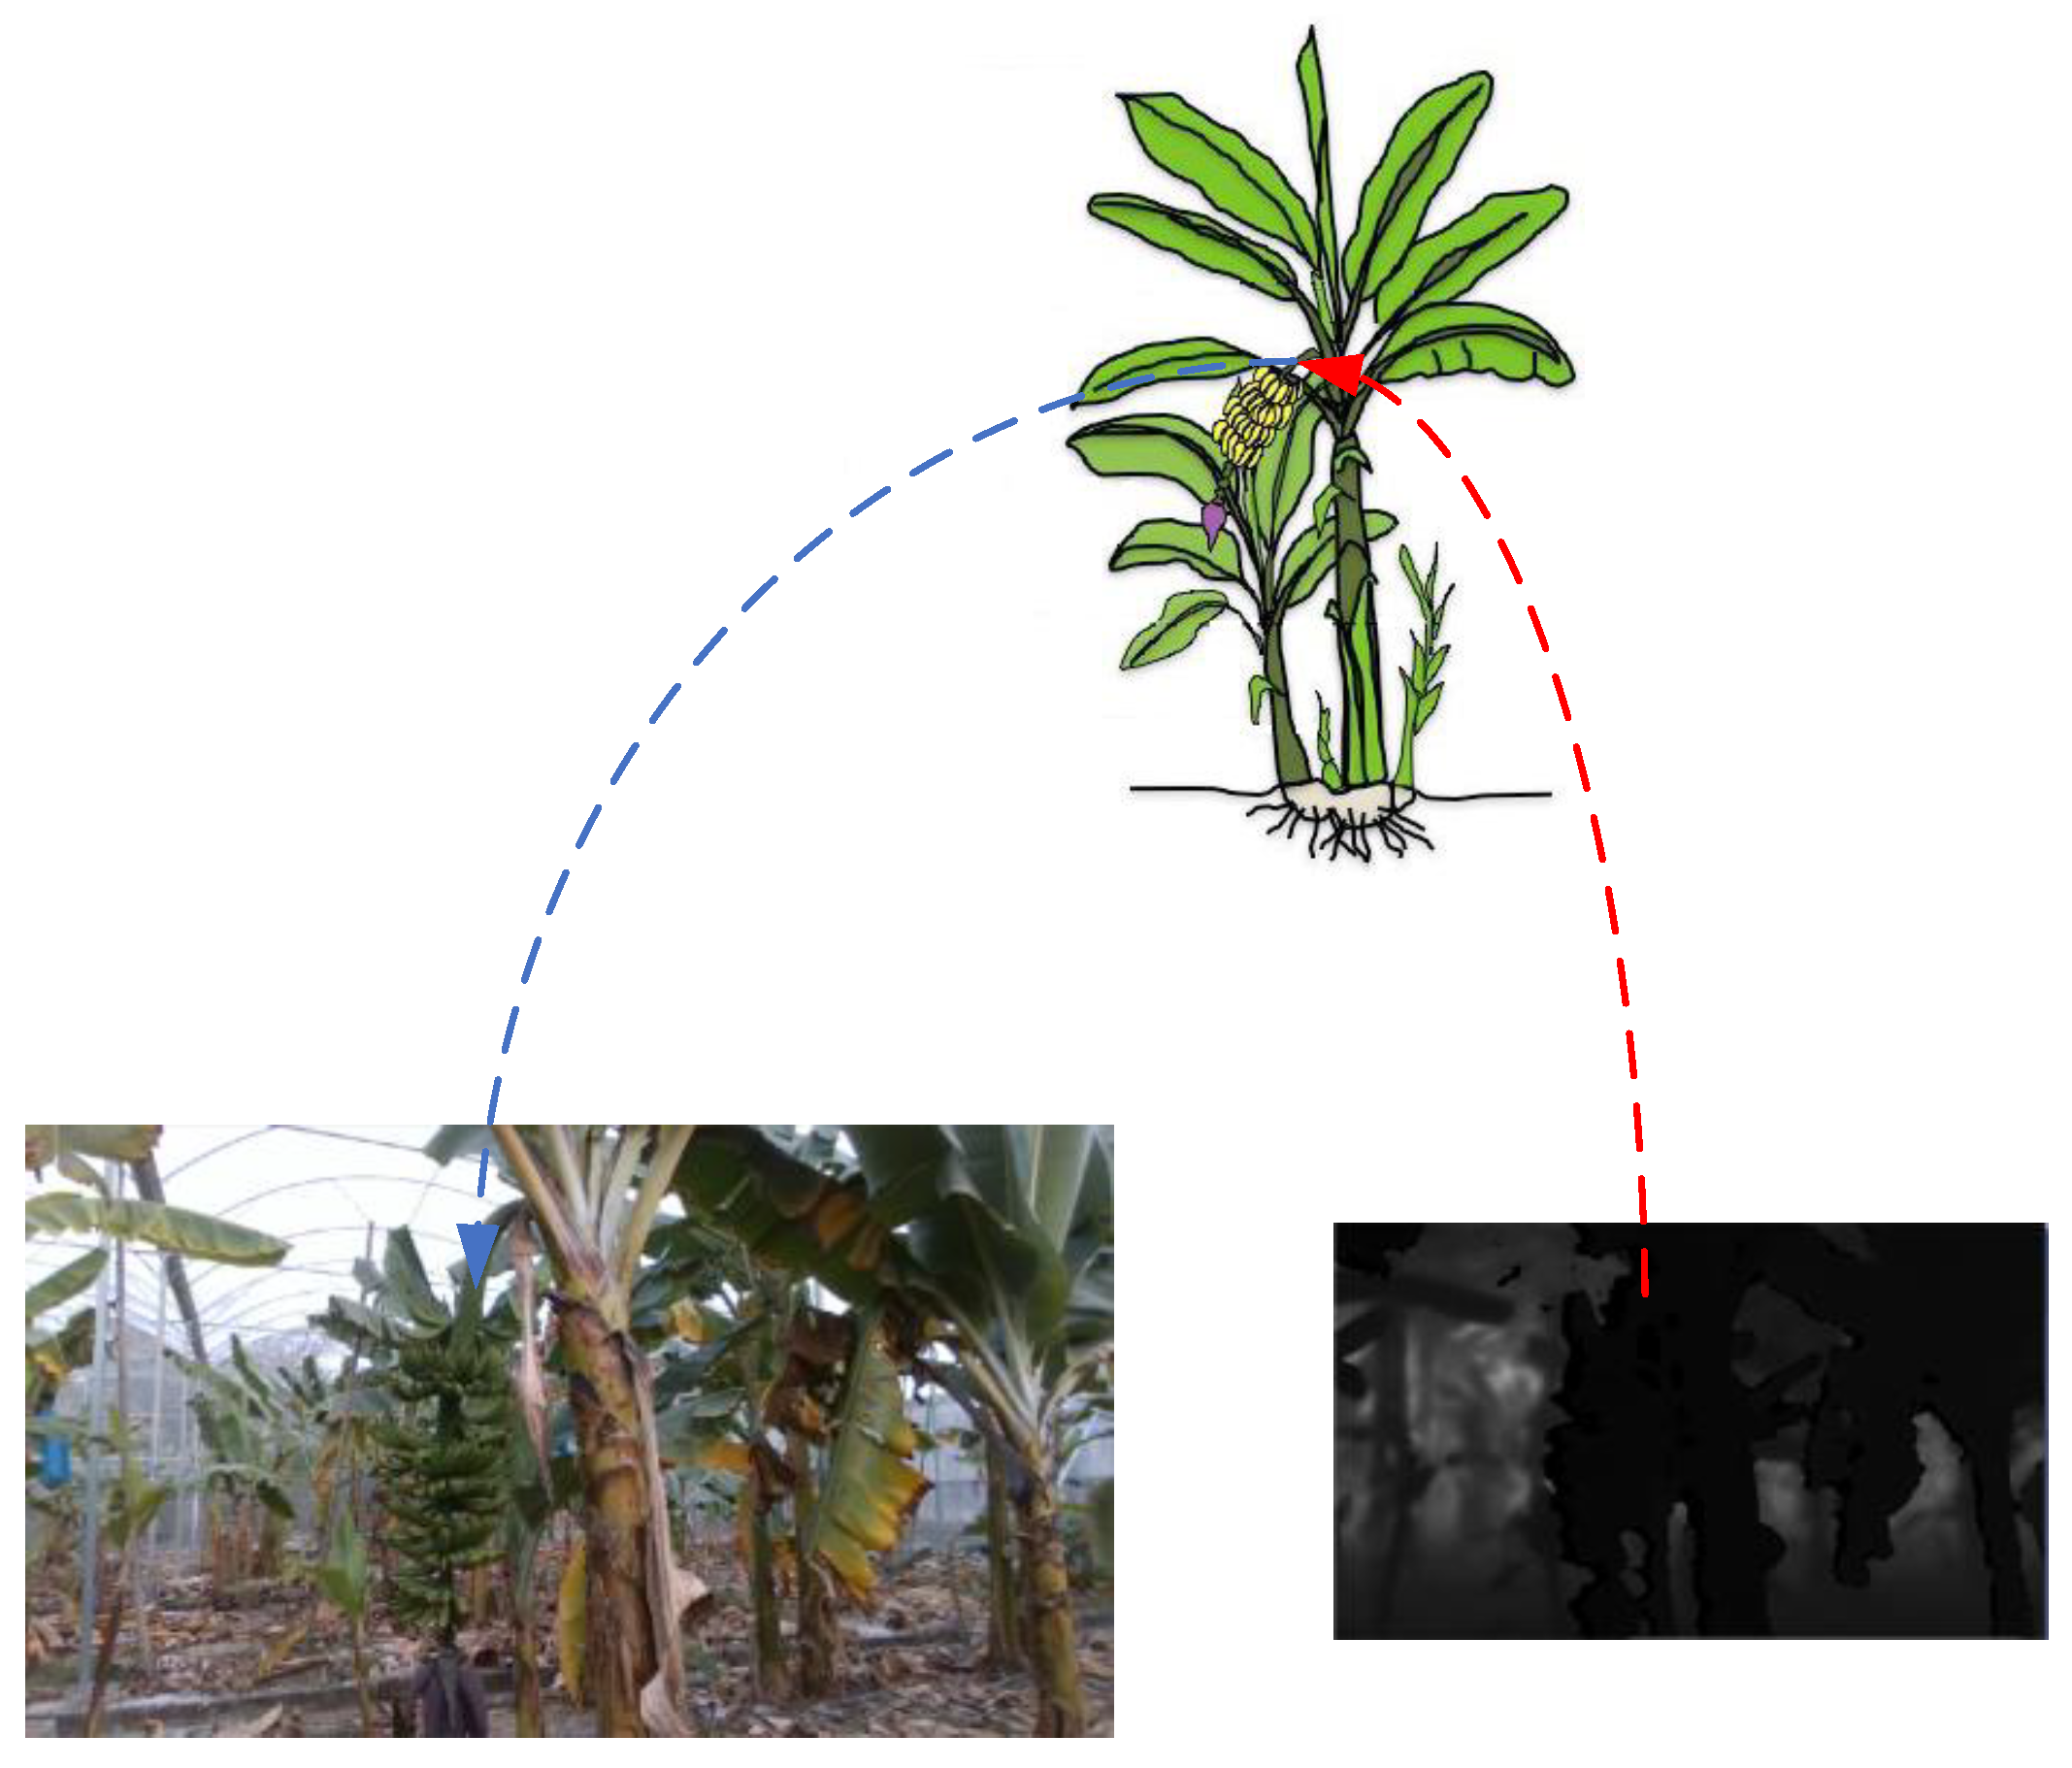
2.2. Image Alignment

Since the depth image and the RGB image have different resolutions, and the depth values corresponding to the pixels in the color image are expected to be obtained, an RGB-D image is required with both color information and depth information. Therefore, it is necessary to align the pixels of the depth image and the color image. Alignment is a process of mapping from two dimensions to three dimensions and then to two dimensions, as shown in Figure 3. The alignment process is divided into the following four steps:
(1) Restore the pixel coordinates q u , v d of the depth map to the coordinate value P d c in the depth camera coordinate system,
z d c [ q u , v d 1 ] = I d P d c
where I d is the internal parameter of the depth camera and z d c is the depth value of the point in the depth coordinate system.
(2) Convert the coordinate value P d c in the depth camera coordinate system to the coordinate value P W in the world coordinate system,
P d c = R w 2 d P W + T w 2 d
where R w 2 d and T w 2 d are the rotation matrix and translation matrix of the world coordinate system relative to the depth camera coordinate system, respectively.
(3) Convert the coordinate value P W in the world coordinate system to the coordinate value P c c in the color camera coordinate system,
P c c = R w 2 c P W + T w 2 c
where R w 2 c and T w 2 c are the rotation matrix and translation matrix of the world coordinate system relative to the color camera coordinate system, respectively.
(4) Map the coordinate value P c c in the color camera coordinate system to the pixel coordinates q u , v c of the color image,
z c c [ q u , v c 1 ] = I c P c c
where I c is the internal parameter of the color camera and z c c is the depth value of the point in the color coordinate system.
I d , I c , R w 2 d , T w 2 d , R w 2 c , and T w 2 c can be obtained through camera calibration [45]. P W , z d c , z c c , P d c , and P c c can be eliminated during the calculation process. After the above four steps, each pixel q u , v d in the depth map corresponds to a pixel q u , v c in the color map. Through the alignment of the depth map and the color map, an information channel containing depth values is added to the color image, which results in the RGB-D image.

2.3. Detection Method

In the obtained RGB-D image, the color information needs to be detected first. This study uses the lightweight detection model YOLO-Banana, which was presented in previous work to detect and obtain the coordinate information of banana bunches and stalks in color images. The YOLO-Banana model simplifies the network structure of YOLOv4, retains the backbone structure of YOLOv4, discards the SPP module, and simplifies the number of redundant convolutions in the FPN and PAN structures. The YOLO-Banana model structure and the banana orchard detection results under different occlusion and illumination conditions were introduced in detail in the previous work [44], and are not detailed here.

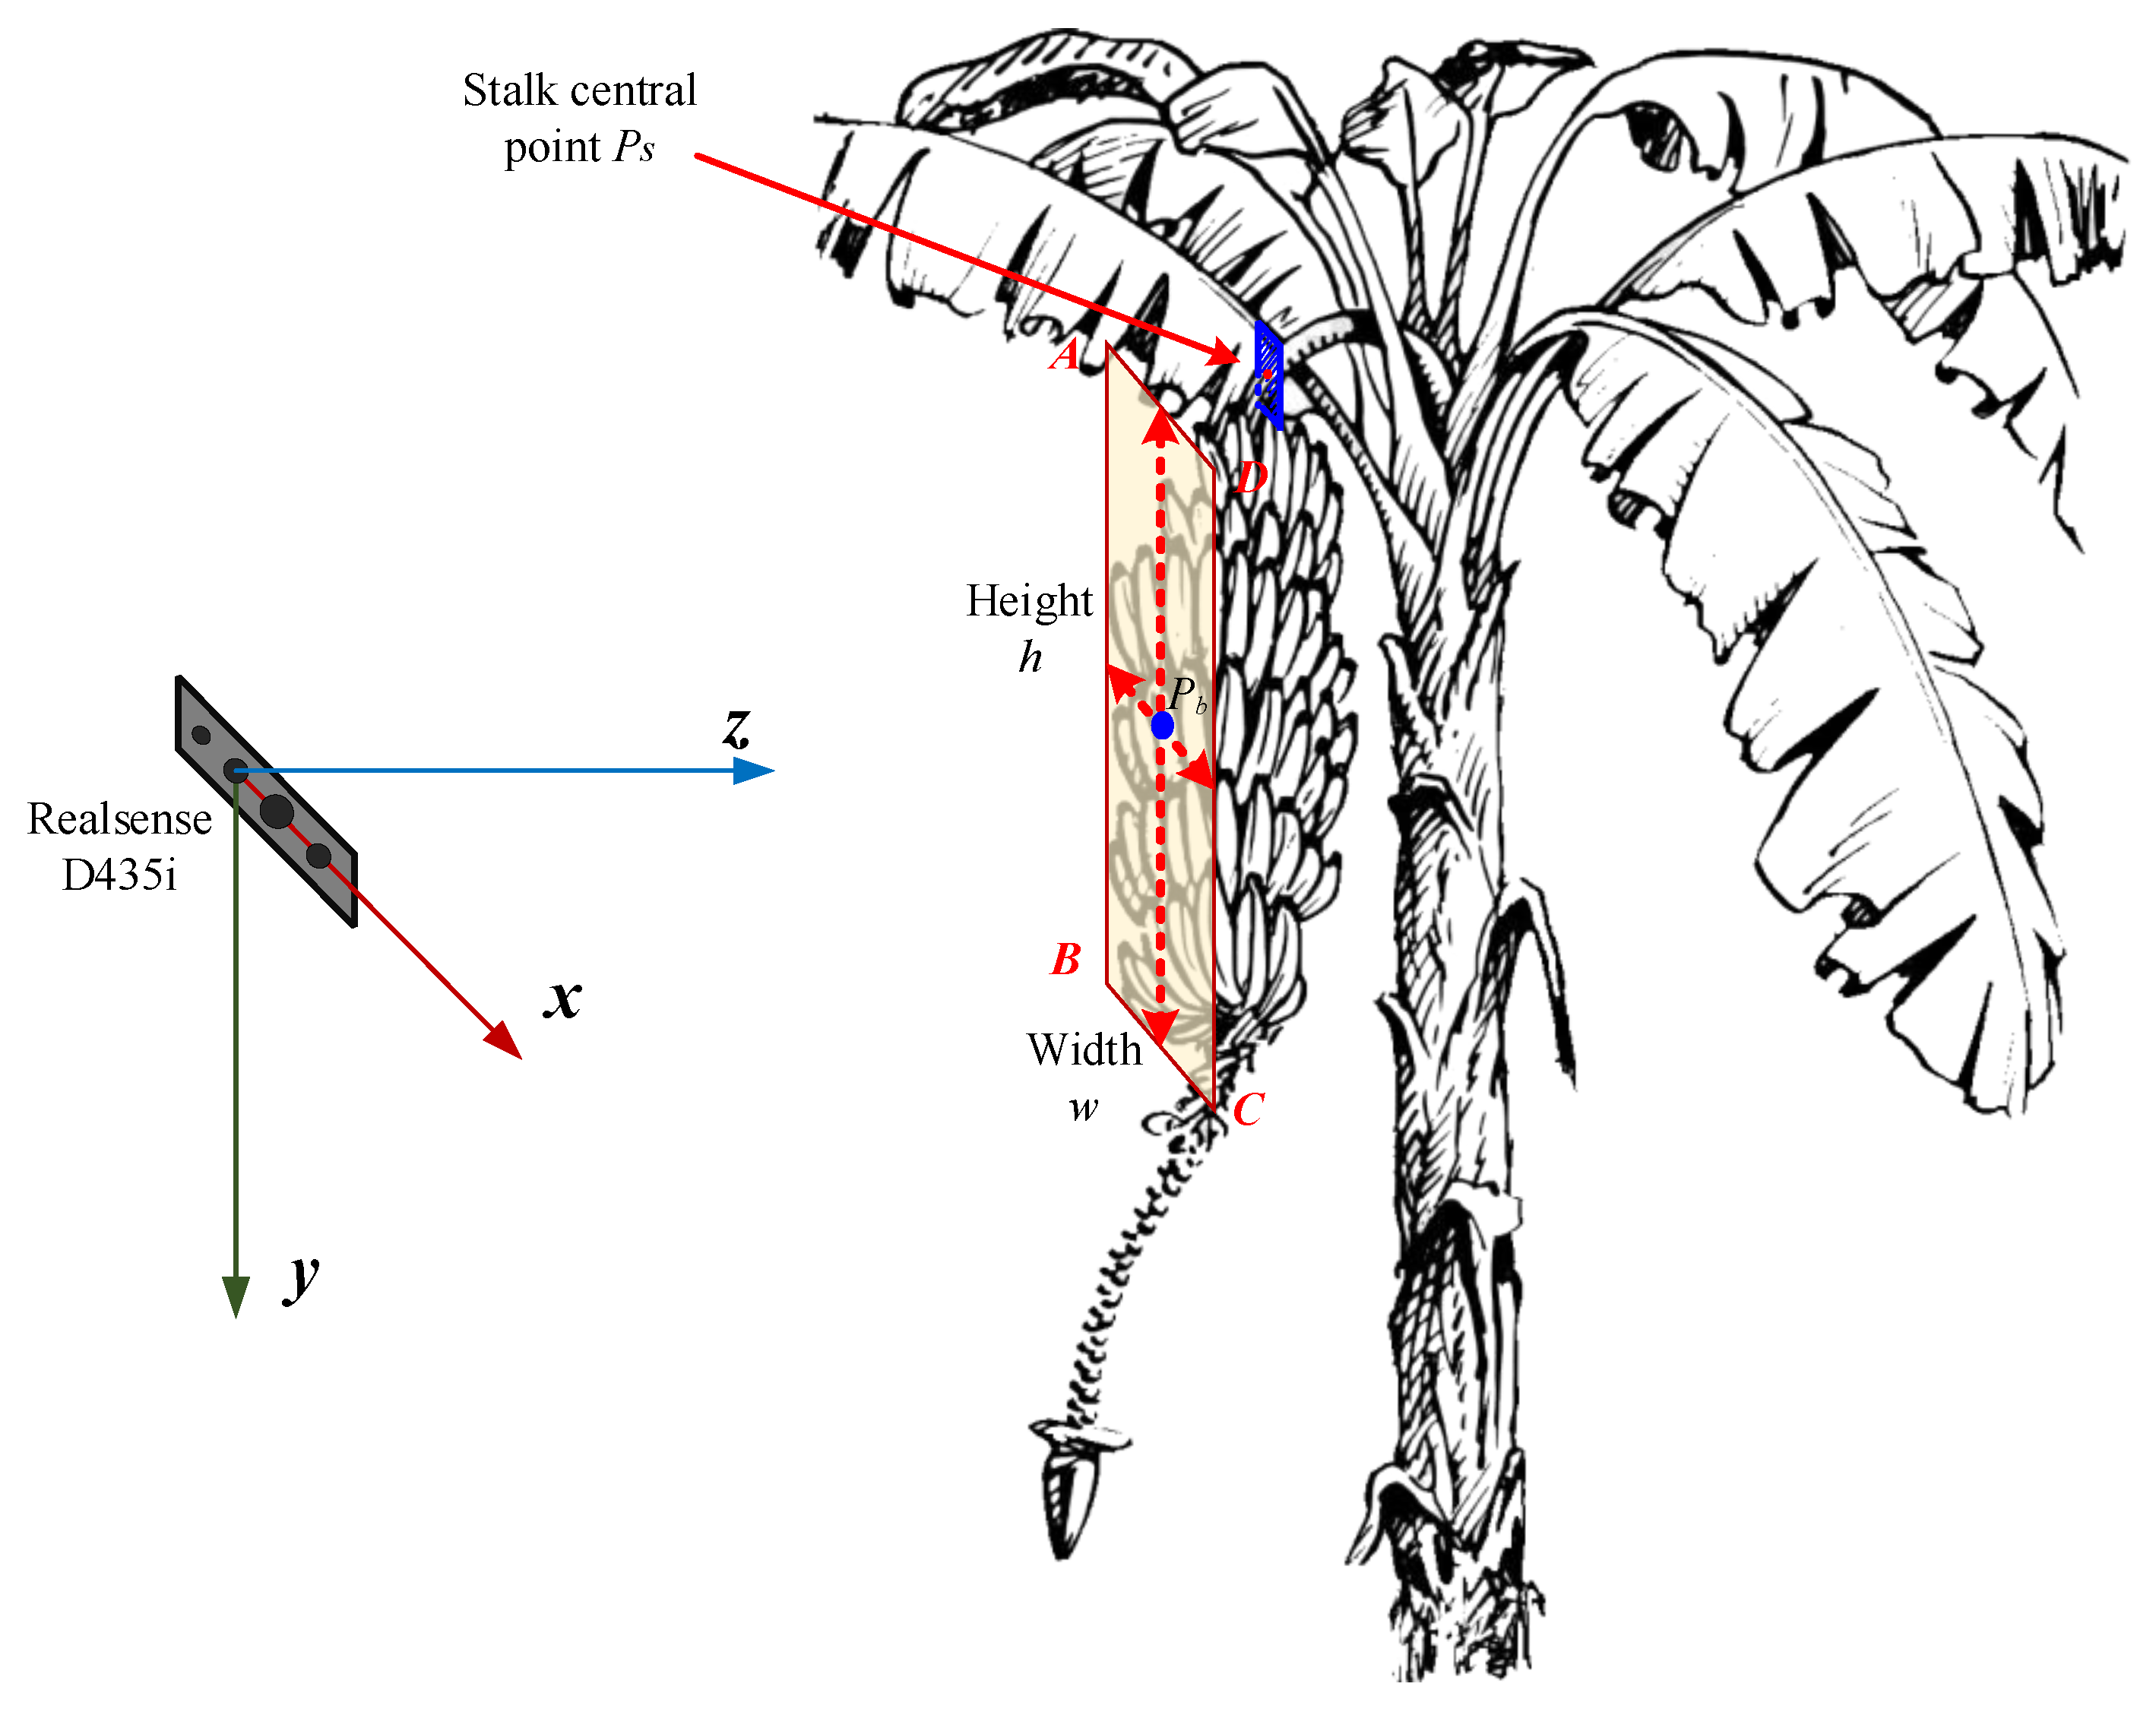
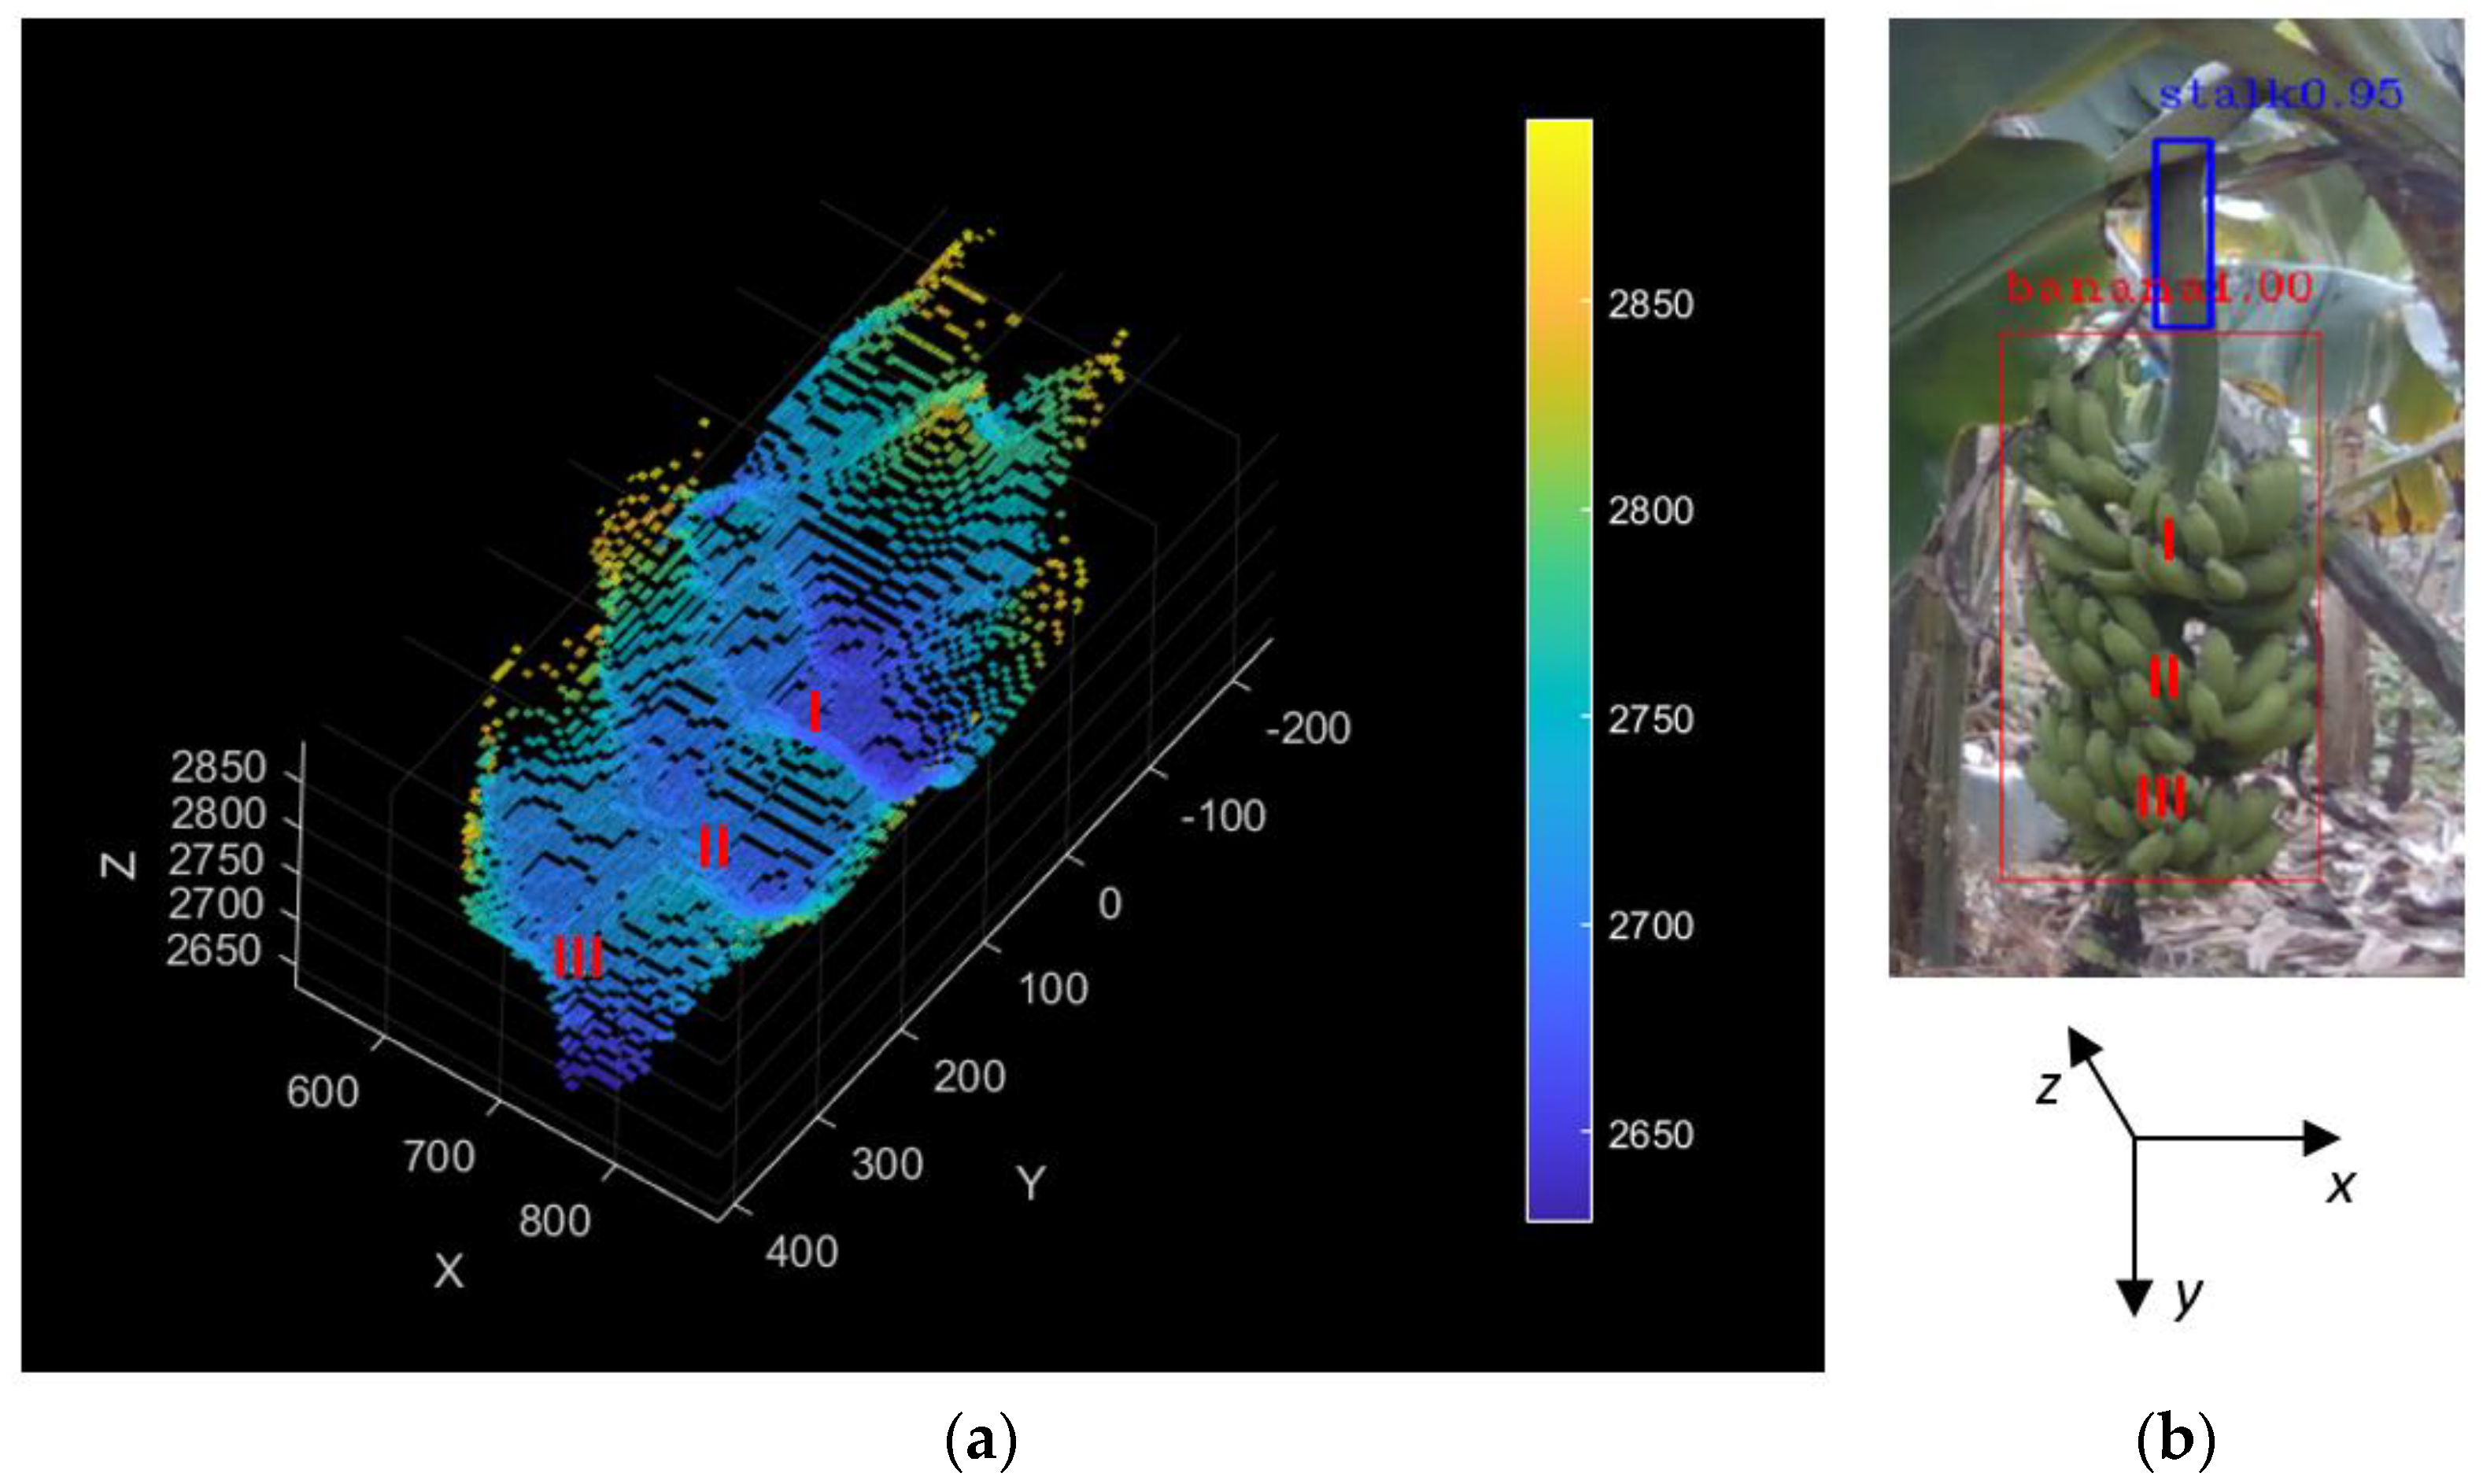
2.4. The Localization of the Banana Stalk Central Point and the Bunch Size Acquisition

For any point q u , v c detected in the RGB image, the corresponding q u , v d can be obtained in the aligned depth map. The three-dimensional coordinate P d c is calculated in the depth camera coordinate system based on Formula (1) and the depth value of the point. At the same time, the origin of the world coordinate system is set to the origin of the depth camera coordinate system, and then the world coordinate values of the object point are obtained.
First, the coordinates of the central point of the banana stalk are calculated. According to the detection results of the banana stalk detection bounding box, the two-dimensional coordinate information of the stalk’s central point in the RGB image is calculated. The above steps are followed to obtain the corresponding three-dimensional coordinate value to realize the localization of the stalk central point. As shown in Figure 4, the blue rectangle is the stalk detection bounding box and the red point Ps is the central point of the banana stalk. In the figure, the banana tree vector image comes from [46]. The Realsense D435i depth camera is positioned to face the banana plant. The z-axis of the depth camera coordinate system points to the direction of the banana plant, the x-axis is parallel to the forward direction of the vehicle, and the y-axis points downward to the ground.
Similarly, the three-dimensional coordinates of the central point of the banana bunch are calculated, which is the blue point Pb in the red detection bounding box ABCD in Figure 4. The vertical plane where the point is located is set as the object plane. On this plane, the depth value of all points from the depth camera is equal to the depth value of Pb. Then, the three-dimensional coordinates of the four vertices A, B, C, and D of the red detection bounding box according to Formula (1) are calculated. Finally, the height h and the width w of the banana bunch are calculated from the distance between point A and point B, and the distance between point B and point C, respectively.

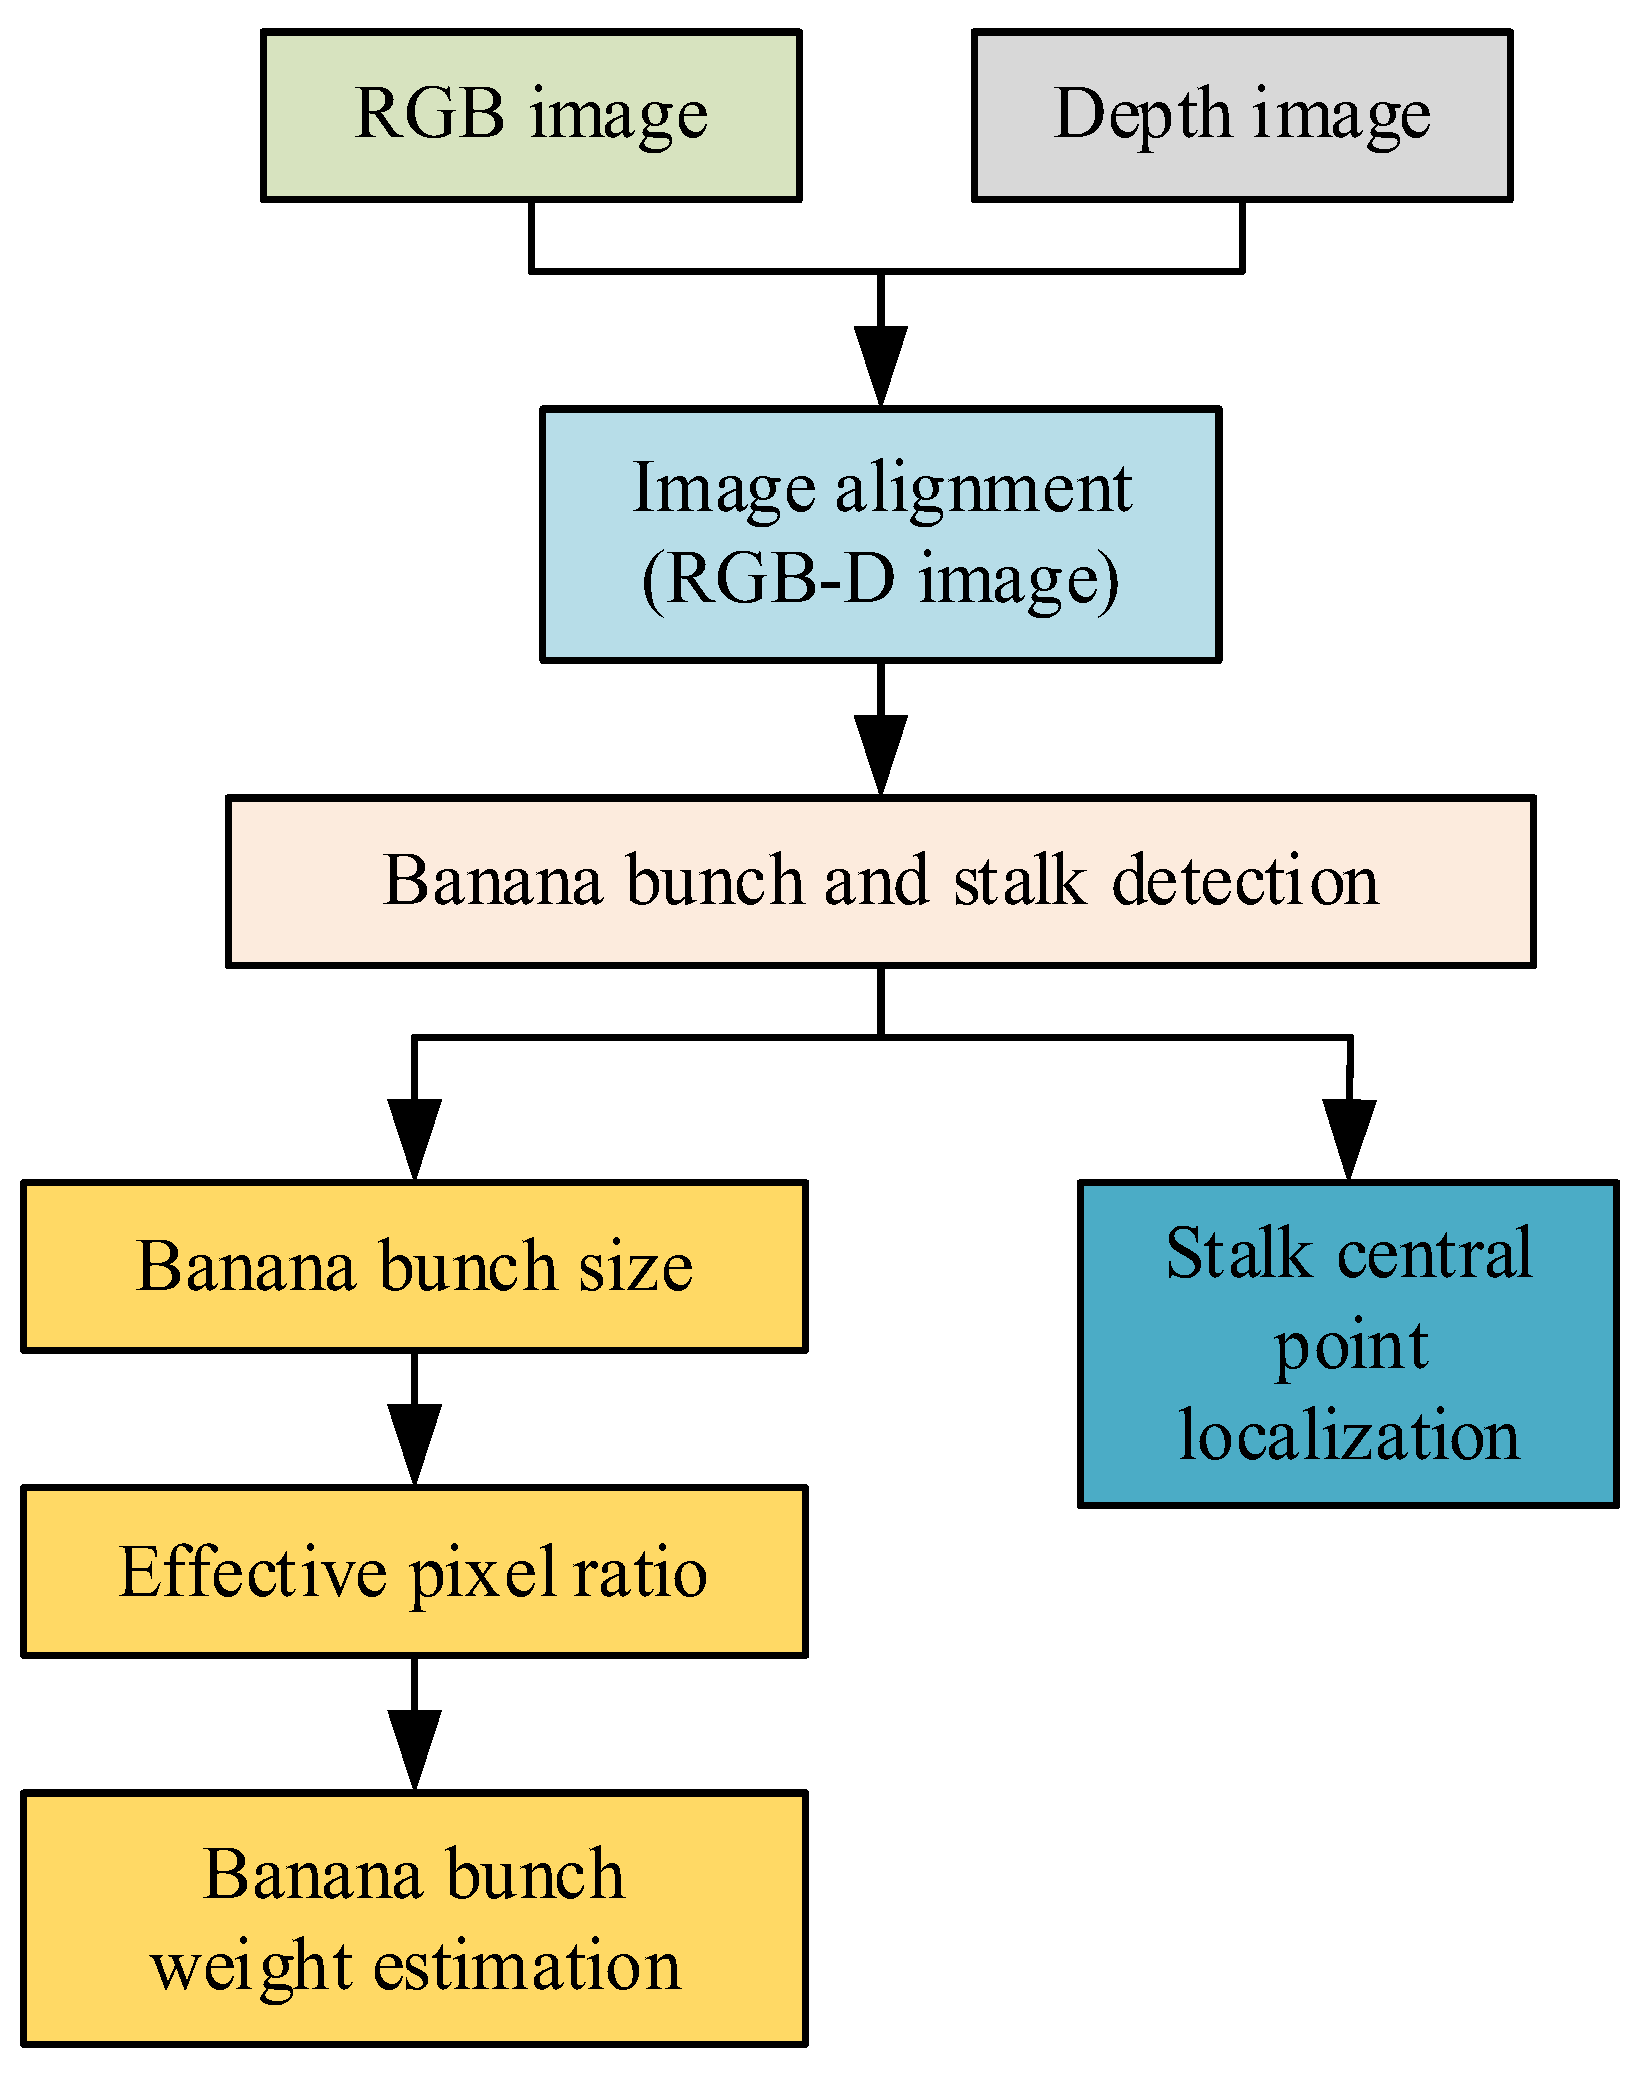
2.5. Banana Bunch Weight Estimation

2.5.1. Effective Pixel Ratio

Based on the banana bunch height and width obtained through visual detection, the relationship between size and weight is established by constructing the bunch envelope. In the visual system, the front information of the banana bunch is obtained. Assuming that the information on the back of the bunch is symmetrical to the front information, a cuboid and cylinder surrounding the banana bunch could be considered, as shown in Figure 5a,b. In Figure 5a, w is the side length of the base rectangle and h is the height of the cuboid. In Figure 5b, w is the diameter of the cylinder, h is the height of the cylinder, and the radius of the cylinder is r = 0.5   w . Since banana bunches are not completely perpendicular to the horizontal plane, as the slope of the banana bunches becomes larger, there will be more non-banana areas in the envelope; thus, the weight estimation error will increase. In order to reduce the weight estimation error and further approximate the banana area, a definition of the effective pixel ratio P is proposed, that is, the ratio of the sum of banana bunch pixels to the bunch detection bounding box area in the RGB image. The calculation formula is (5),
P = p i x e l B a n a n a c h × c w × 100 %
where p i x e l B a n a n a is the sum of the pixels of the banana bunch in the two-dimensional image, and c h and c w are the height and width of the banana bunch in the color image, respectively.
In order to determine p i x e l B a n a n a , the depth value is used to distinguish the banana bunch pixels from the background pixels in the bunch detection bounding box. Due to the gaps between banana fingers, when the fingers are dense, the central point of the bounding box may fall on the banana fingers (midpoint pf in Figure 5b); when the fingers are sparse, the central point may fall on the stalk inside the bunch (pm in Figure 5b).
In this work, the special situation where the central point falls on the background due to extremely sparse fingers is not considered. Therefore, the bunch central point is located between pf and pm. The situation at both endpoints is analyzed. When the central point is pm, the banana bunch depth value is within [pm + r, pmr] (indicated by the blue two-way arrow); when the bunch central point is pf, a depth value within [pf + r, pfr] is adopted to search for the banana bunch in the field of view (indicated by the red two-way arrow). This is because the information on the back of the banana bunch is almost impossible to capture. In other words, for any point between pf and pm, a search is conducted within the range of the distance r before and after the point to obtain the three-dimensional point cloud, which is regarded as the banana bunch depth information, as shown in Figure 6a. The red detection bounding box in Figure 6b shows the RGB information of a banana bunch. For ease of observation of this figure, the banana bunch is marked as three regions: I, II, and III. Finally, the sum of the searched pixels is p i x e l B a n a n a .

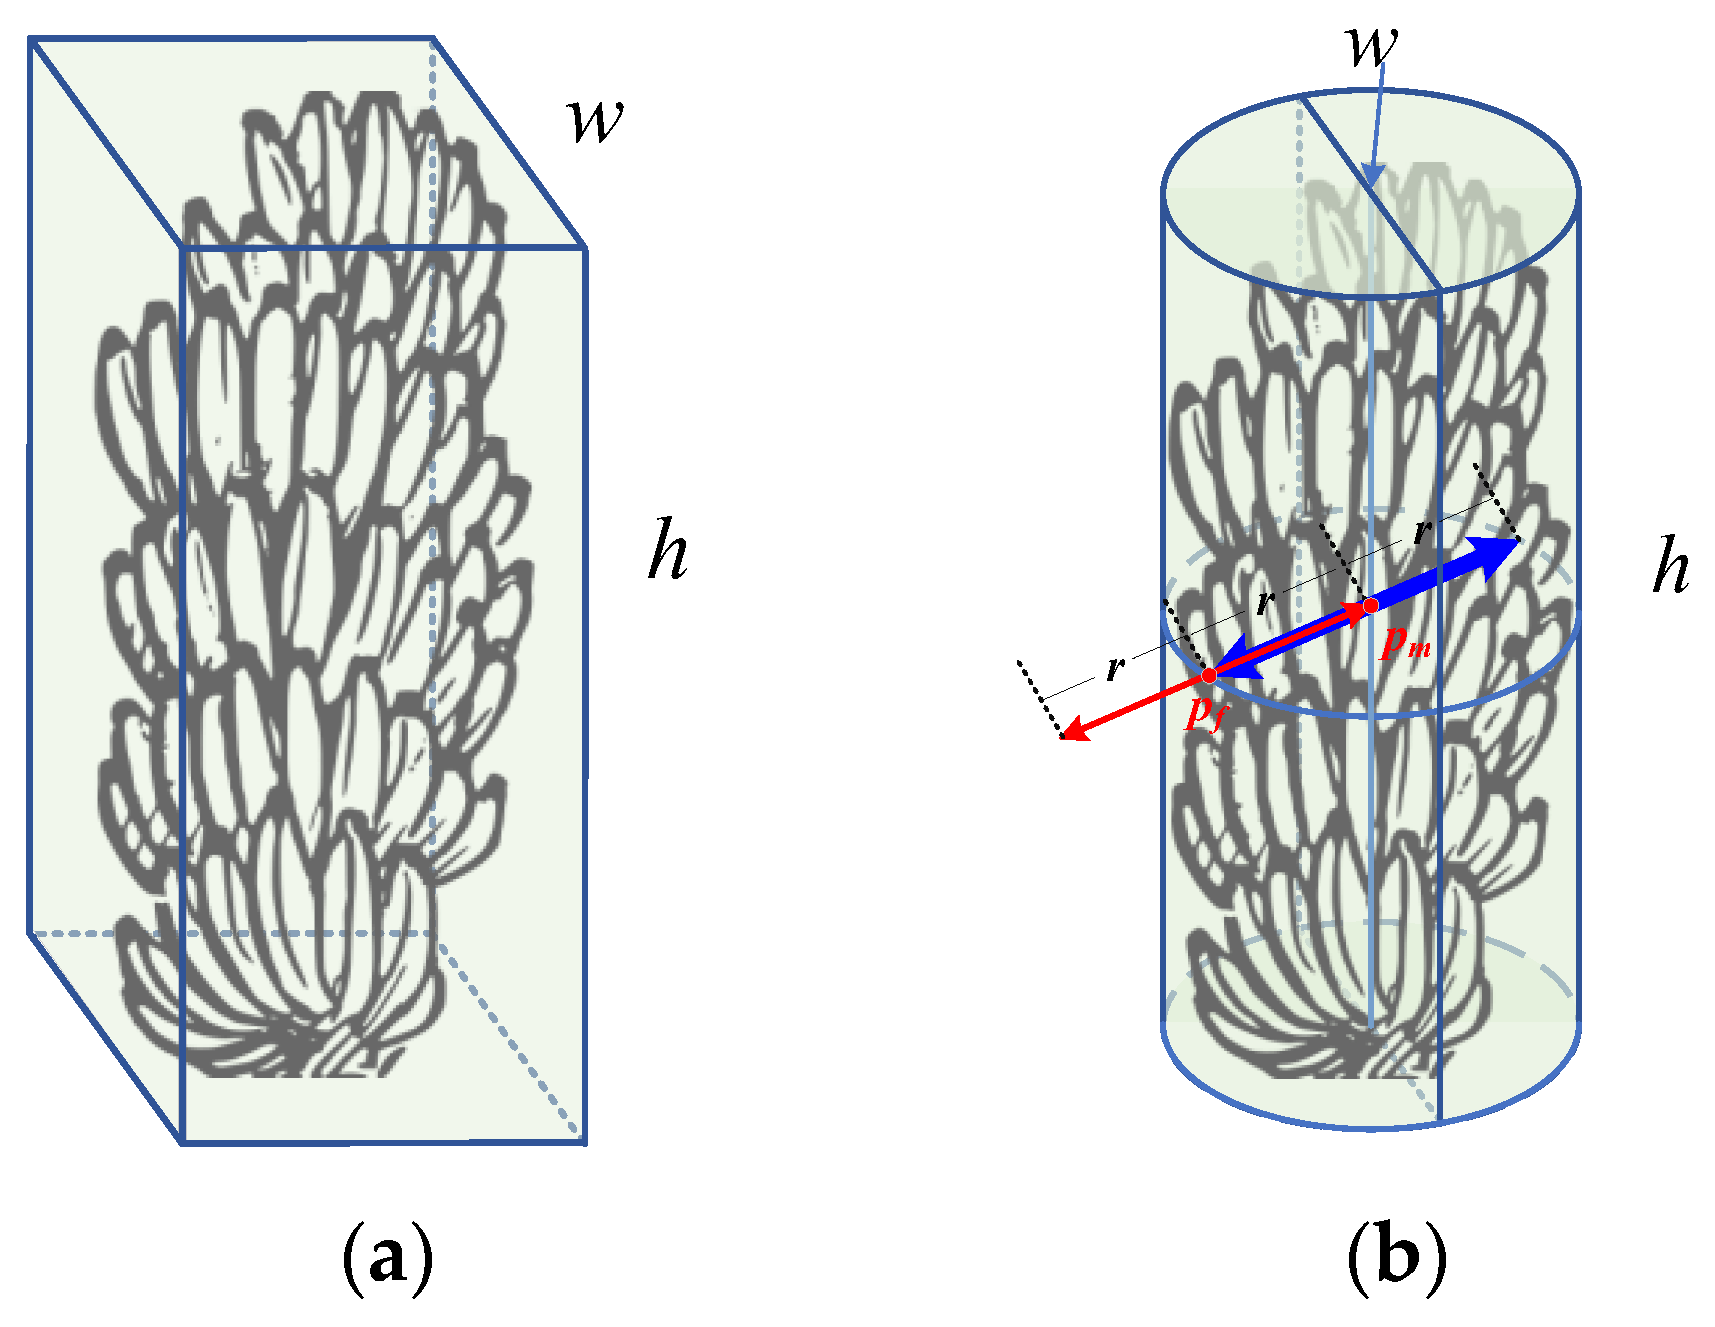
2.5.2. Analysis of Banana Bunch Weight Parameters

Table 1 lists all parameters considered in the banana bunch weight analysis. Based on the effective pixel ratio and the size of the banana bunch, the surface area Sp of the banana bunch area within the field of view is,
S p = w × h × P
Compared with Sc, which is the curved surface area of the half cylinder, Sp more accurately describes the real area of the banana bunch in the field of view. For estimating the volume of the banana bunch, the relationship between Sc and the cylinder volume Vc is,
V c = 0.5 × w × S c = 0.25 π × w 2 × h
Then, the relationship between banana bunch volume Vp and Sp is estimated,
V p = 0.5 × w × S p
Next, we analyze the role of different indicators in weight estimation through data fitting, and compare the results to obtain the optimal model for banana bunch weight estimation. The linear regression coefficient of determination R2 and the root mean square error (RMSE) were selected as evaluation indicators to evaluate the weight estimation model. The calculation formulas are (9) and (10), respectively:
R 2 = 1 i = 1 n ( z i z ^ i ) 2 i = 1 n ( z i z ¯ i ) 2
R M S E = 1 n i = 1 n ( z i z ^ i ) 2
where z i is the manually measured weight of the banana bunch, z ^ i is the weight of the banana bunch estimated by the visual system, and z ¯ i is the mean value of z i .
It can be found in Table 1 that the front rectangular area S of the cuboid and the curved surface area Sc of the half cylinder have a linear relationship. Similarly, the cuboid volume V and the cylinder volume Vc have a linear relationship. For two sets of parameters with a linear relationship, after fitting with the true values, the deviations between the fitted values and the true values are the same. Therefore, the cuboid model and the cylindrical model constructed using the effective pixel ratio for fitting analysis are selected, that is, the relationship between the parameters w, h, S, V, Sp, and Vp and the banana bunch weight measurements is analyzed to calculate the optimal banana bunch weight estimation model.

3. Experimental Results and Discussion

Localization and weight estimation experiments were carried out in the banana orchard of the Guangdong Academy of Agricultural Sciences and the banana orchard of South China Agricultural University under cloudy and sunny conditions, respectively. There were equal numbers of banana trees under sunny front light conditions and sunny backlight condition in the sunny environment. A total of 56 banana trees were selected as experimental objects; the bunch weights of 45 banana trees were selected to establish the weight estimation model and the remaining 11 banana trees were used for weight estimation verification. Verification of stalk localization was performed on all banana trees.

3.1. Results of the Banana Stalk Central Point Localization

Localization accuracy is affected by detection accuracy, calibration accuracy, and verification accuracy. Measuring localization accuracy is not easy and may require very expensive equipment for verification. In this work, since the average diameter of a banana stalk is about 70 mm, the requirements for localization accuracy do not need to be too stringent to meet the purpose of banana labeling or harvesting. Therefore, a laser rangefinder (distance error ±3 mm, horizontal angle error ±0.3°) and a digital angle finder (angle error ±0.2°) were used to analyze the localization results of the central point of the banana stalk. The origin of the world coordinate system was set to the origin of the depth camera coordinate system, and the length of the origin from the camera front glass was 4.2 mm. Therefore, a verification coordinate system o x y z was established during verification. There is a translation relationship in the z-axis direction between the two coordinate systems, as shown in Figure 7. The coordinates of the central point of the banana stalk in the depth camera coordinate system and the verification coordinate system are p and p′, respectively, and the relationship between them is as follows,
p = p + T
where T = [0, 0, 4.2]T. The coordinates of p′ are,
{ x = l cos α cos β y = l sin α z = l cos α sin β
where l is the distance from the central point coordinates to the origin in the verification coordinate system, α is the angle between op′ and the horizontal plane, and β is the angle between the forward direction and the projection of op′ on the horizontal plane. l and α were obtained by using the laser rangefinder, and β was obtained by using the digital angle finder. For each banana stalk central point coordinate, there is a set of (l, α, β) for verification. The verified stalk central point coordinate p can be calculated through Formulas (11) and (12). By comparing the verification coordinates and detection coordinates of the 56 banana stalk central points, the Euclidean distance between the two points was calculated as the localization error, as shown in Figure 8. In the localization verification of the central point of the banana stalk, the average localization error was 22.875 mm, which proves that the banana stalk localization method proposed in this work can provide a position reference for the intelligent management and harvesting of banana orchards during the growth period and the harvest period.

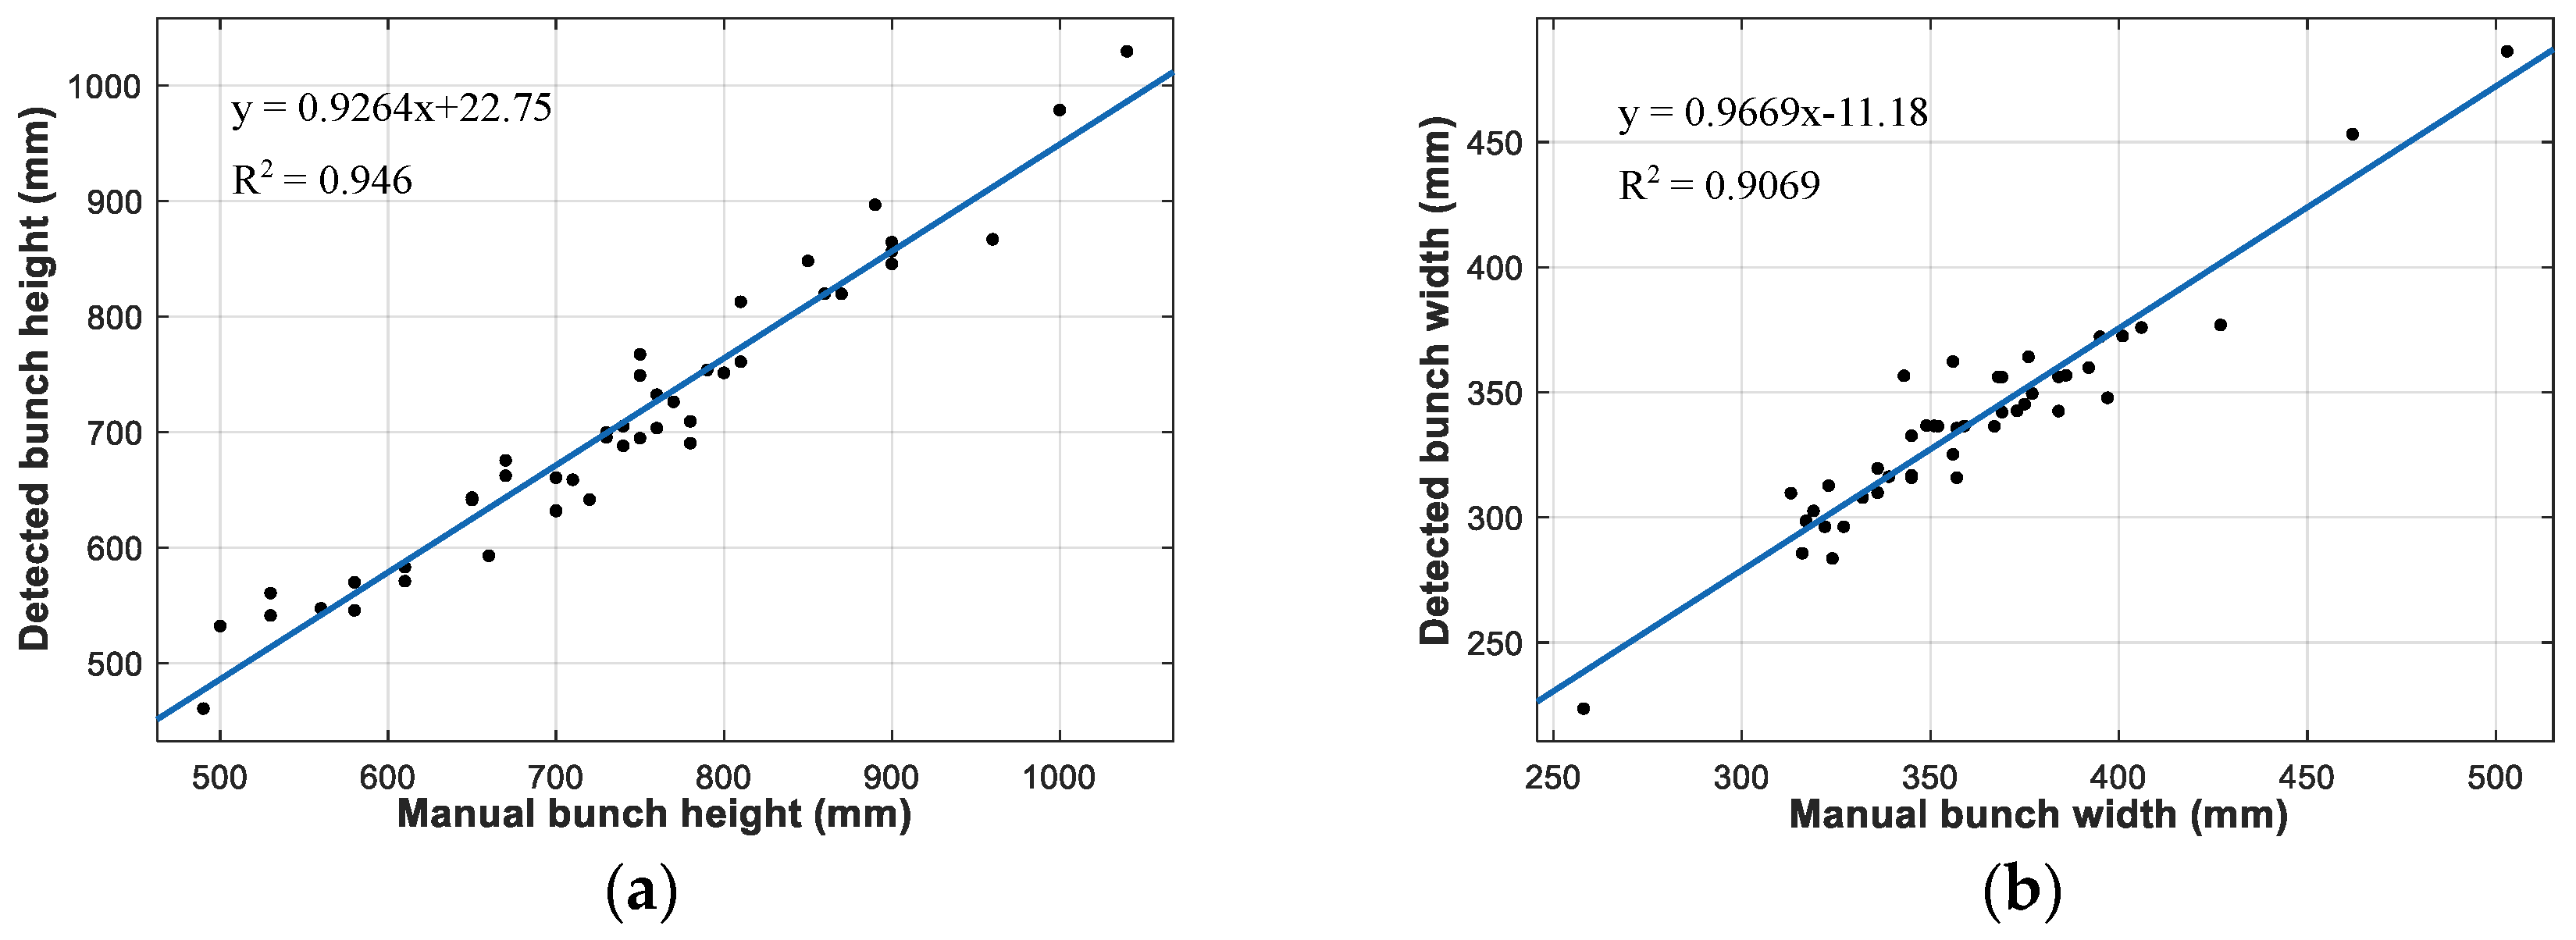
3.2. Results of the Bunch Size Estimation

The detected banana bunch size was compared with the manually measured size. For the manual measurement of the size of banana bunches, two rulers and a tape measure were used. Two rulers were placed close to the far left and right sides of the banana bunch, and the tape measure was used to calculate the maximum width. Measurements were taken three times and the average was taken as the manual measurement value of the width of the banana bunch. Similarly, two rulers were placed close to the upper end of the top banana fingers and the bottom of the banana bunch. The tape measure was used to calculate the maximum height. Three measurements were taken and the average was taken as the manual measurement value of the banana bunch height. The comparison results are shown in Figure 9. The R2 of banana bunch height estimation is 0.946 and the RMSE is 28.91 mm; the R2 of banana bunch width estimation is 0.9069 and RMSE is 12.74 mm. Comparing the R2 values of height and width, the banana bunch height estimation accuracy is higher than the width estimation accuracy.
From the fitting results, the height prediction has a positive bias and the width prediction has a negative bias. After analyzing these results, the prediction results are considered to be related to the following aspects: (a) The characteristics of the banana bunch structure are irregular. When the width is measured manually, the banana fingers from the leftmost border to the rightmost border are not at the same height, making the manually measured width greater than the width of the detection frame. (b) The height of the banana bunches in the orchard is inconsistent, and elevation detection is easy. The bottom hand of the banana bunch enlarges the height of the detection frame because of the inclination angle. However, manual measurement is based on the length from the bottom to the top, so the predicted value has a positive bias compared with the manual measurement value. (c) Finally, other reasons for the prediction results are the detection box labeling error, the error between the machine-obtained image angle and the manual measurement angle, the circumference asymmetry of the banana bunches, the sparsity of the banana fingers, etc.

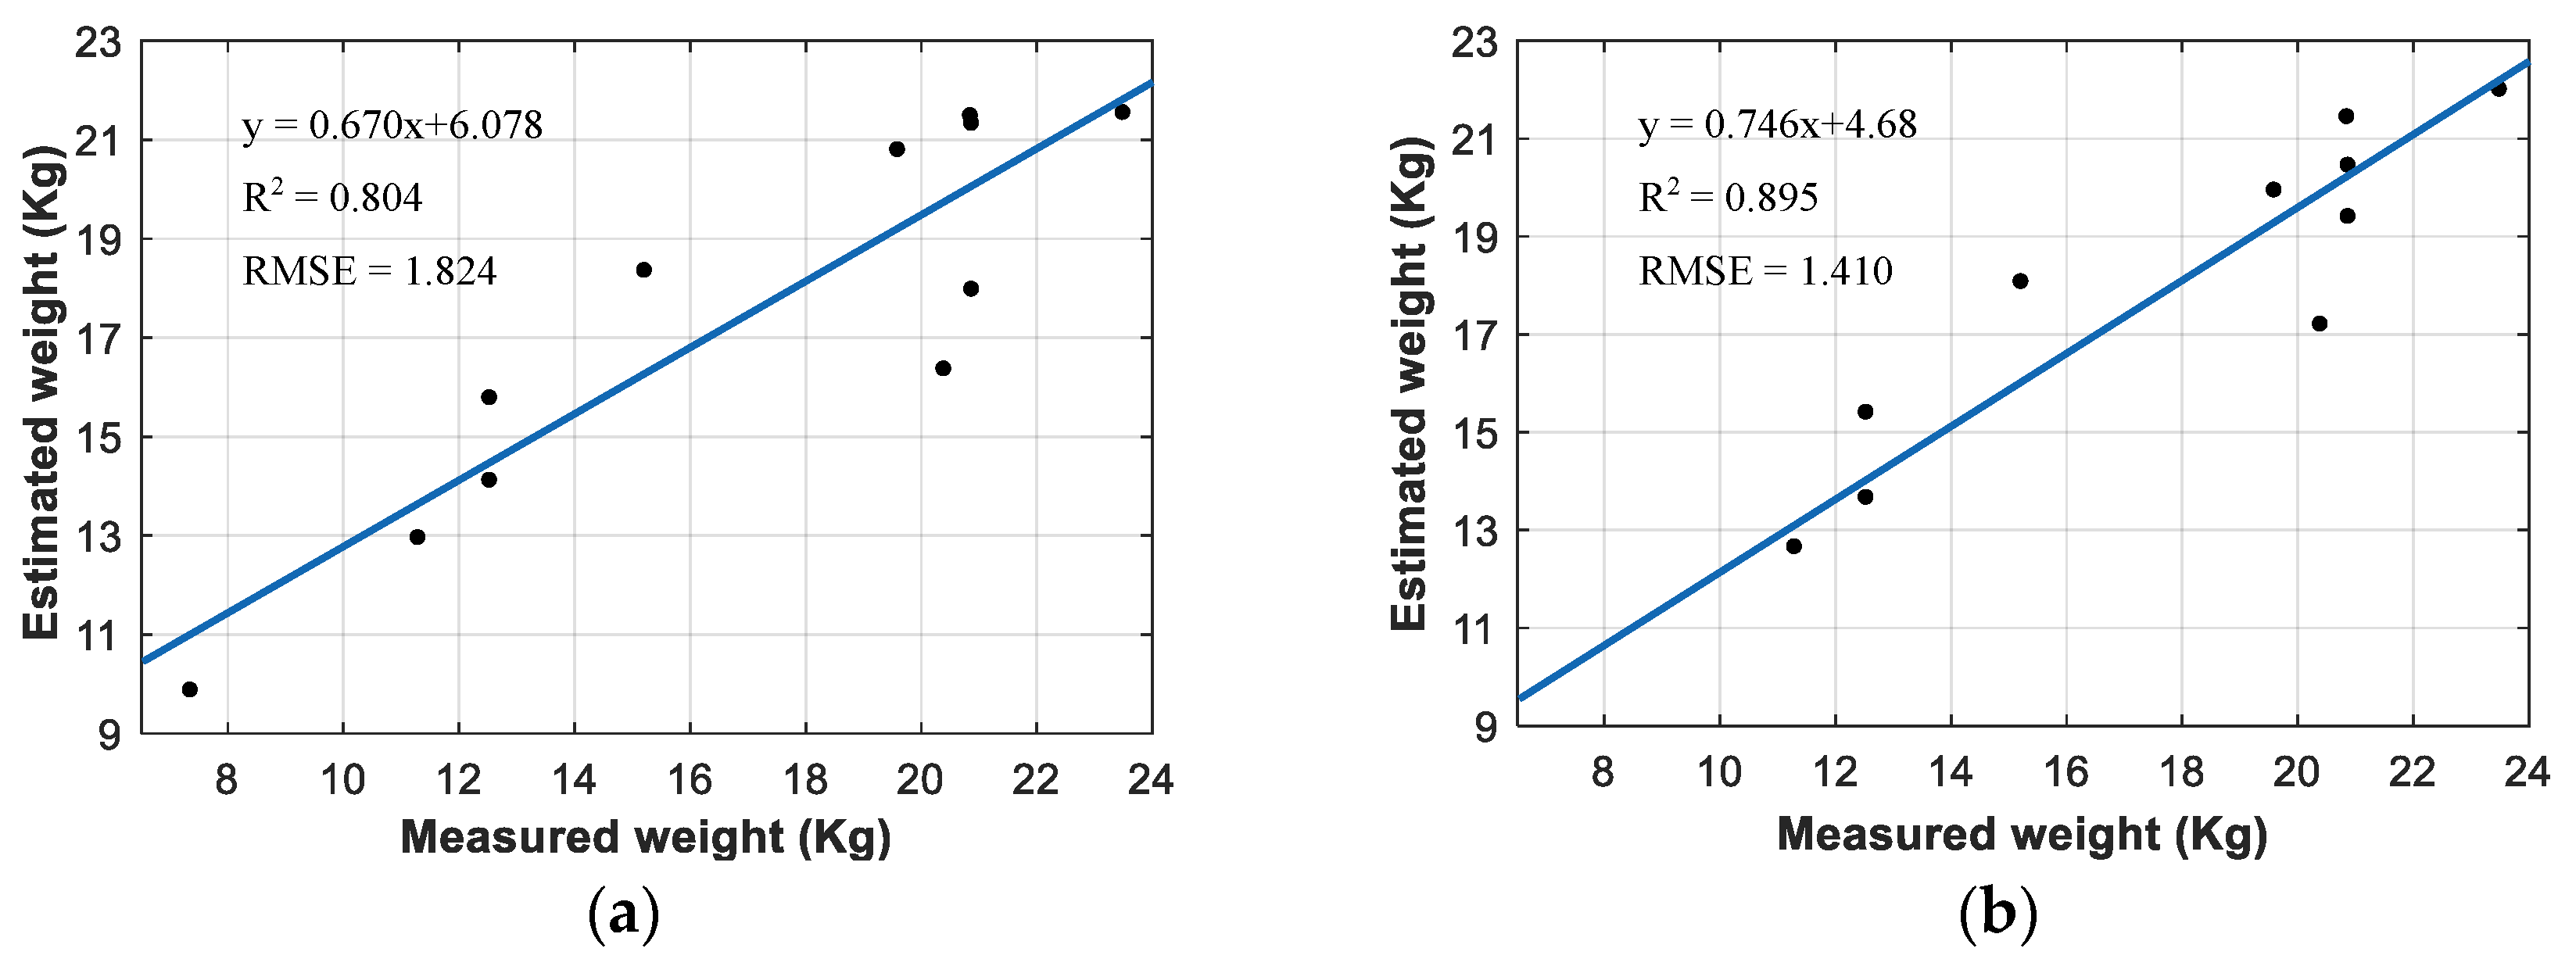
3.3. Results of the Bunch Weight Estimation

For the manual measurement of the banana bunch weight, a ruler was put close to the upper end of the top banana fingers, and the vertical intersection line with the banana stalk was taken as the cutting line. After the banana bunch was cut from the tree, it was weighed on an electronic scale. The weighed value was used as a manual measurement of the banana bunch weight. The impact of univariate and bivariate parameters on the estimated model was considered. First, a regression analysis was performed on the univariate parameters w, h, S, V, Sp, and Vp, and the weight measurements of banana bunches, as shown in Table 2.
By sorting the R2 values of the valuation models based on different variables, h > Sp > S > Vp > V > w was obtained. Analyzing the results, the R2 of the h model is 0.7865, which is the highest among all parameters and is higher than those of the area and volume parameters. The R2 values of the Sp model and S model are 0.6965 and 0.6824, respectively, and the R2 values of the Vp model and V model are 0.5344 and 0.5124, respectively. Thus, the introduction of an effective pixel ratio improves the accuracy of weight estimation. The R2 of the w model is 0.1408, which is the lowest among all parameters, indicating that there is no linear correlation between bunch weight and width.
From the vision-based univariate weight estimation model, it can be seen that the height of the banana bunch has the greatest impact on weight. Based on the height parameter, the weight estimation results for the variable pairs h + S, h + V, h + Sp, and h + Vp were further analyzed as shown in Table 3. By similarly sorting the R2 values of the four models, the order h + Vp > h + V > h + Sp > h + S was obtained. The R2 value of the h + Vp model is 0.8143, which is the highest among all models. The R2 values of the bivariate estimation model are higher than the R2 value from using the h variable alone. The weight distribution between the two variables adds more information about the banana bunch based on the h single-variable estimation, thereby improving the weight estimation accuracy.
Based on the above analysis, the bivariate weight estimation model h + Vp was used as the final weight estimation model of the banana bunch, and the calculation formula for the weight of the banana bunch W b a n a n a is:
W b a n a n a = 2.301 + 0.0233 h + 5.331 × 10 8 V p
The weight estimation model was used to estimate the weight of 11 banana bunches, and the estimation results of the h variable weight estimation model were compared, as shown in Figure 10. The h + Vp weight estimation model result is R2 = 0.8947, RMSE = 1.4102 kg; the h weight estimation model result is R2 = 0.804, RMSE = 1.8242 Kg. It can be seen from the verification results that the h + Vp bivariate estimation model is closer to the measured value. Therefore, the h + Vp bivariate estimation model can help orchard managers to evaluate orchard yields. Compared with labor costs and empirical errors, the estimation method proposed in this work based on machine vision is more promising.
In the results for the univariate banana bunch weight estimation models, it was found that the banana bunch volume parameter does not have an advantage over the height or area parameters when used alone. The main reason for this is that there is an error in estimating the volume through the visual size of the bunch. The banana fingers are unevenly distributed, and the information on the back of the bunch is not completely symmetrical with the information on the front. However, the introduction of an effective pixel ratio is necessary, because the tilt of different banana bunches and the sparseness of the banana fingers produce significantly different weight values in a bounding box of the same size. The effective pixel ratio filters the background and the gap between the fingers in the bounding box to a certain extent, reflecting the bunch information more realistically. Therefore, in the bivariate banana bunch weight estimation model, when the volume parameter and the height parameter are combined to estimate the bunch weight, the model not only considers the size of the bunch, but also adds factors for the sparseness of the bunch, thereby improving the estimation accuracy.

4. Conclusions

The size and weight of the banana bunch are important indicators during the growth process, and the localization of the banana stalk is the key to intelligent harvesting in banana orchards. According to our survey, the current weight estimation error in the banana orchard varies depending on the farmer’s experience, and it is difficult to obtain a unified standard. This study proposed a visual detection method based on RGB-D images to estimate the weight of banana bunches and locate the central point of the banana stalk in banana orchards. The following conclusions can be drawn:
(1)
A method based on depth cameras and deep learning algorithms was described to detect and locate banana bunches and stalks in the natural environment. The average localization error was 22.875 mm, showing the method’s ability to provide information for intelligent banana harvesting.
(2)
A machine vision method was presented to obtain the size information of banana bunches. The R2 values for predictions from the of height and width against measured values were 0.946 and 0.9069, respectively. This method can be used for bunch weight estimation, and it is useful for intelligent management in the banana growth period.
(3)
A weight estimation model of banana bunches was established, and an effective pixel ratio was proposed to characterize the fruit morphology and obtain more accurate three-dimensional information about banana bunches. Through experimental comparison, it was found that the weight estimation model based on the parameters h + Vp is suitable for estimating the weight of banana bunches in orchards. The R2 of the banana bunch weight estimation model was 0.8947 and the RMSE was 1.4102 kg.
Future work will focus on improvements in the weight estimation accuracy, the analysis of weight estimation errors under different occlusion and illumination conditions, and the counting of banana bunches to provide technical support for standardized planting, harvesting, and transportation methods in the banana industry.

Author Contributions

Conceptualization, Z.Y.; data curation, L.Z.; formal analysis, L.F.; funding acquisition, L.F. and J.D.; investigation, L.F.; methodology, L.Z. and J.Z.; project administration, J.D.; resources, J.D.; software, L.Z.; supervision, Z.Y.; validation, F.D. and Q.X.; visualization, F.D. and J.Z.; writing–original draft, L.Z.; writing–review and editing, Q.X. and L.F. All authors have read and agreed to the published version of the manuscript.

Funding

This research was funded by the National Natural Science Foundation of China, grant number 32271996; the Ph.D. Research Start-Up Fund of Wuyi University, grant number BSQD2222; the China Agriculture Research System of MOF and MARA, grant number CARS-31-11; and the Open competition program of top ten critical priorities of Agricultural Science and Technology Innovation for the 14th Five-Year Plan of Guangdong Province, grant number 2022SDZG03; and the China Scholarship Council.

Data Availability Statement

Dataset available on request from the authors.

Conflicts of Interest

Author Qiong Xiao was employed by the company Jiangmen Electrical Power Transmission and Substation Engineering Co., Ltd. The remaining authors declare that the research was conducted in the absence of any commercial or financial relationships that could be construed as a potential conflict of interest.

References

  1. Tang, Y.; Chen, M.; Wang, C.; Luo, L.; Li, J.; Lian, G.; Zou, X. Recognition and localization methods for vision-based fruit picking robots: A review. Front. Plant Sci. 2020, 11, 510. [Google Scholar] [CrossRef] [PubMed]
  2. Gongal, A.; Amatya, S.; Karkee, M.; Zhang, Q.; Lewis, K. Sensors and systems for fruit detection and localization: A review. Comput. Electron. Agric. 2015, 116, 8–19. [Google Scholar] [CrossRef]
  3. Tang, Y.; Qiu, J.; Zhang, Y.; Wu, D.; Cao, Y.; Zhao, K.; Zhu, L. Optimization strategies of fruit detection to overcome the challenge of unstructured background in field orchard environment: A review. Precis. Agric. 2023, 24, 1–37. [Google Scholar] [CrossRef]
  4. Fu, L.; Gao, F.; Wu, J.; Li, R.; Karkee, M.; Zhang, Q. Application of consumer RGB-D cameras for fruit detection and localization in field: A critical review. Comput. Electron. Agric. 2020, 177, 105687. [Google Scholar] [CrossRef]
  5. Font, D.; Pallejà, T.; Tresanchez, M.; Runcan, D.; Moreno, J.; Martínez, D.; Teixidó, M.; Palacín, J. A Proposal for automatic fruit Harvesting by Combining a low cost Stereovision Camera and a Robotic Arm. Sensors 2014, 14, 11557–11579. [Google Scholar] [CrossRef] [PubMed]
  6. Si, Y.; Liu, G.; Feng, J. Location of apples in trees using stereoscopic vision. Comput. Electron. Agric. 2015, 112, 68–74. [Google Scholar] [CrossRef]
  7. Ji, W.; Meng, X.; Qian, Z.; Xu, B.; Zhao, D. Branch localization method based on the skeleton feature extraction and stereo matching for apple harvesting robot. Int. J. Adv. Robot. Syst. 2017, 14, 256010465. [Google Scholar] [CrossRef]
  8. Xiong, J.; He, Z.; Lin, R.; Liu, Z.; Bu, R.; Yang, Z.; Peng, H.; Zou, X. Visual positioning technology of picking robots for dynamic litchi clusters with disturbance. Comput. Electron. Agric. 2018, 151, 226–237. [Google Scholar] [CrossRef]
  9. Wang, C.; Luo, T.; Zhao, L.; Tang, Y.; Zou, X. Window zooming–based localization algorithm of fruit and vegetable for harvesting robot. IEEE Access 2019, 7, 103639–103649. [Google Scholar] [CrossRef]
  10. Kusumam, K.; Krajník, T.; Pearson, S.; Duckett, T.; Cielniak, G. 3D-vision based detection, localization, and sizing of broccoli heads in the field. J. Field Robot. 2017, 34, 1505–1518. [Google Scholar] [CrossRef]
  11. Koirala, A.; Walsh, K.B.; Wang, Z.; McCarthy, C. Deep learning for real-time fruit detection and orchard fruit load estimation: Benchmarking of ‘MangoYOLO’. Precis. Agric. 2019, 20, 1107–1135. [Google Scholar] [CrossRef]
  12. Wang, Z.; Walsh, K.; Verma, B. On-tree mango fruit size estimation using RGB-D images. Sensors 2017, 17, 2738. [Google Scholar] [CrossRef] [PubMed]
  13. Fu, L.; Majeed, Y.; Zhang, X.; Karkee, M.; Zhang, Q. Faster R–CNN–based apple detection in dense-foliage fruiting-wall trees using RGB and depth features for robotic harvesting. Biosyst. Eng. 2020, 197, 245–256. [Google Scholar] [CrossRef]
  14. Yu, L.; Xiong, J.; Fang, X.; Yang, Z.; Chen, Y.; Lin, X.; Chen, S. A litchi fruit recognition method in a natural environment using RGB-D images. Biosyst. Eng. 2021, 204, 50–63. [Google Scholar] [CrossRef]
  15. Lin, G.; Tang, Y.; Zou, X.; Wang, C. Three-dimensional reconstruction of guava fruits and branches using instance segmentation and geometry analysis. Comput. Electron. Agric. 2021, 184, 106107. [Google Scholar] [CrossRef]
  16. Wu, F.; Duan, J.; Ai, P.; Chen, Z.; Yang, Z.; Zou, X. Rachis detection and three-dimensional localization of cut off point for vision-based banana robot. Comput. Electron. Agric. 2022, 198, 107079. [Google Scholar] [CrossRef]
  17. Wu, F.; Yang, Z.; Mo, X.; Wu, Z.; Tang, W.; Duan, J.; Zou, X. Detection and counting of banana bunches by integrating deep learning and classic image-processing algorithms. Comput. Electron. Agric. 2023, 209, 107827. [Google Scholar] [CrossRef]
  18. Gené-Mola, J.; Vilaplana, V.; Rosell-Polo, J.R.; Morros, J.; Ruiz-Hidalgo, J.; Gregorio, E. Multi-modal deep learning for Fuji apple detection using RGB-D cameras and their radiometric capabilities. Comput. Electron. Agric. 2019, 162, 689–698. [Google Scholar] [CrossRef]
  19. Silwal, A.; Davidson, J.R.; Karkee, M.; Mo, C.; Zhang, Q.; Lewis, K. Design, integration, and field evaluation of a robotic apple harvester. J. Field Robot. 2017, 34, 1140–1159. [Google Scholar] [CrossRef]
  20. Gongal, A.; Karkee, M.; Amatya, S. Apple fruit size estimation using a 3D machine vision system. Inf. Process. Agric. 2018, 5, 498–503. [Google Scholar] [CrossRef]
  21. Milella, A.; Marani, R.; Petitti, A.; Reina, G. In-field high throughput grapevine phenotyping with a consumer-grade depth camera. Comput. Electron. Agric. 2019, 156, 293–306. [Google Scholar] [CrossRef]
  22. Ge, Y.; Xiong, Y.; From, P.J. Instance segmentation and localization of strawberries in farm conditions for automatic fruit harvesting. IFAC-PapersOnLine 2019, 52, 294–299. [Google Scholar] [CrossRef]
  23. Kang, H.; Chen, C. Fruit detection, segmentation and 3D visualisation of environments in apple orchards. Comput. Electron. Agric. 2020, 171, 105302. [Google Scholar] [CrossRef]
  24. Rong, J.; Wang, P.; Yang, Q.; Huang, F. A field-tested harvesting robot for oyster mushroom in greenhouse. Agronomy 2021, 11, 1210. [Google Scholar] [CrossRef]
  25. Bai, T.; Zhang, N.; Mercatoris, B.; Chen, Y. Improving jujube fruit tree yield estimation at the field scale by assimilating a single landsat remotely-sensed LAI into the WOFOST model. Remote Sens. 2019, 11, 1119. [Google Scholar] [CrossRef]
  26. Gené-Mola, J.; Gregorio, E.; Auat Cheein, F.; Guevara, J.; Llorens, J.; Sanz-Cortiella, R.; Escolà, A.; Rosell-Polo, J.R. Fruit detection, yield prediction and canopy geometric characterization using LiDAR with forced air flow. Comput. Electron. Agric. 2020, 168, 105121. [Google Scholar] [CrossRef]
  27. Gené-Mola, J.; Gregorio, E.; Guevara, J.; Auat, F.; Sanz-Cortiella, R.; Escolà, A.; Llorens, J.; Morros, J.; Ruiz-Hidalgo, J.; Vilaplana, V.; et al. Fruit detection in an apple orchard using a mobile terrestrial laser scanner. Biosyst. Eng. 2019, 187, 171–184. [Google Scholar] [CrossRef]
  28. Blok, P.M.; van Boheemen, K.; van Evert, F.K.; IJsselmuiden, J.; Kim, G. Robot navigation in orchards with localization based on Particle filter and Kalman filter. Comput. Electron. Agric. 2019, 157, 261–269. [Google Scholar] [CrossRef]
  29. Gené-Mola, J.; Sanz-Cortiella, R.; Rosell-Polo, J.R.; Morros, J.; Ruiz-Hidalgo, J.; Vilaplana, V.; Gregorio, E. Fruit detection and 3D location using instance segmentation neural networks and structure-from-motion photogrammetry. Comput. Electron. Agric. 2020, 169, 105165. [Google Scholar] [CrossRef]
  30. Yu, Y.; Zhang, K.; Liu, H.; Yang, L.; Zhang, D. Real-time visual localization of the picking points for a ridge-planting strawberry harvesting robot. IEEE Access 2020, 8, 116556–116568. [Google Scholar] [CrossRef]
  31. Yu, Z.; Wang, S.; Zhang, B. A camera/ultrasonic sensors based trunk localization system of semi-structured orchards. In Proceedings of the 2021 IEEE/ASME International Conference on Advanced Intelligent Mechatronics (AIM), Delft, The Netherlands, 12–16 July 2021. [Google Scholar]
  32. Wu, G.; Li, B.; Zhu, Q.; Huang, M.; Guo, Y. Using color and 3D geometry features to segment fruit point cloud and improve fruit recognition accuracy. Comput. Electron. Agric. 2020, 174, 105475. [Google Scholar] [CrossRef]
  33. Apolo-Apolo, O.E.; Martínez-Guanter, J.; Egea, G.; Raja, P.; Pérez-Ruiz, M. Deep learning techniques for estimation of the yield and size of citrus fruits using a UAV. Eur. J. Agron. 2020, 115, 126030. [Google Scholar] [CrossRef]
  34. Wittstruck, L.; Kühling, I.; Trautz, D.; Kohlbrecher, M.; Jarmer, T. UAV-based RGB imagery for hokkaido pumpkin (cucurbita max.) detection and yield estimation. Sensors 2021, 21, 118. [Google Scholar] [CrossRef]
  35. Fu, L.; Duan, J.; Zou, X.; Lin, J.; Zhao, L.; Li, J.; Yang, Z. Fast and accurate detection of banana fruits in complex background orchards. IEEE Access 2020, 8, 196835–196846. [Google Scholar] [CrossRef]
  36. Chen, T.; Zhang, R.; Zhu, L.; Zhang, S.; Li, X. A method of fast segmentation for banana stalk exploited lightweight multi-feature fusion deep neural network. Machines 2021, 9, 66. [Google Scholar] [CrossRef]
  37. Wu, F.; Duan, J.; Chen, S.; Ye, Y.; Ai, P.; Yang, Z. Multi-target recognition of bananas and automatic positioning for the inflorescence axis cutting point. Front. Plant Sci. 2021, 12, 705021. [Google Scholar] [CrossRef]
  38. Cai, L.; Liang, J.; Xu, X.; Duan, J.; Yang, Z. Banana pseudostem visual detection method based on improved YOLOV7 detection algorithm. Agronomy 2023, 13, 999. [Google Scholar] [CrossRef]
  39. Chen, M.; Tang, Y.; Zou, X.; Huang, K.; Huang, Z.; Zhou, H.; Wang, C.; Lian, G. Three-dimensional perception of orchard banana central stock enhanced by adaptive multi-vision technology. Comput. Electron. Agric. 2020, 174, 105508. [Google Scholar] [CrossRef]
  40. Woomer, P.L.; Bekunda, M.A.; Nkalubo, S.T. Estimation of banana yield based on bunch phenology. Afr. Crop Sci. J. 1999, 7, 341–348. [Google Scholar] [CrossRef]
  41. Rodríguez González, C.; Cayón Salinas, D.G.; Mira Castillo, J.J. Effect of number of functional leaves at flowering on yield of banana Grand Naine (Musa AAA Simmonds). Rev. Fac. Nac. Agron. 2012, 65, 6591–6597. [Google Scholar]
  42. Joyce, D.R.S.; Moacir, P.; Filipe, A.R.; Willian, S.L.; Sergio, L.R.D.; Sebastião, D.O.E.S.; Crysttian, A.P. Correlation between morphological characters and estimated bunch weight of the Tropical banana cultivar. Afr. J. Biotechnol. 2012, 11, 10682–10687. [Google Scholar]
  43. Stevens, B.; Diels, J.; Brown, A.; Bayo, S.; Ndakidemi, P.A.; Swennen, R. Banana biomass estimation and yield forecasting from non-destructive measurements for two contrasting cultivars and water regimes. Agronomy 2020, 10, 1435. [Google Scholar] [CrossRef]
  44. Fu, L.; Yang, Z.; Wu, F.; Zou, X.; Lin, J.; Cao, Y.; Duan, J. YOLO-Banana: A lightweight neural network for rapid detection of banana bunches and stalks in the natural environment. Agronomy 2022, 12, 391. [Google Scholar] [CrossRef]
  45. Zhang, Z. A flexible new technique for camera calibration. IEEE Trans. Pattern Anal. 2000, 22, 1330–1334. [Google Scholar] [CrossRef]
  46. Michael, G. Banana Tree SVG Vector. Available online: https://svg-clipart.com/cartoon/kT9FxQS-banana-tree-clipart (accessed on 13 November 2021).
Figure 1. Banana bunch weight estimation and stalk localization system in the orchard.
Agronomy 14 01123 g001
Figure 2. The flowchart of the algorithm.
Agronomy 14 01123 g002
Figure 3. Alignment of the depth map and color map.
Agronomy 14 01123 g003
Figure 4. Banana bunch size and stalk central point localization (blue rectangle: the stalk detection bounding box; red point Ps: the central point of the banana stalk; red rectangle: the banana bunch detection bounding box; blue point Pb: the central point of the banana bunch).
Agronomy 14 01123 g004
Figure 5. Two banana bunch envelopes: (a) cuboid; (b) cylinder (red two-way arrow: the depth value of the search range when the central point of the bounding box falls on the banana fingers; blue two-way arrow: the depth value of the search range when the central point of the bounding box falls on the stalk).
Agronomy 14 01123 g005
Figure 6. The three-dimensional information of a banana bunch: (a) the point cloud and the depth information of the banana bunch; (b) RGB information of the banana bunch and its coordinate system in the detection result (three regions of the bunch are marked to facilitate mapping of figures (a,b)).
Agronomy 14 01123 g006
Figure 7. Verification coordinate system and depth camera coordinate system.
Agronomy 14 01123 g007
Figure 8. The positional error between the validation results and the detection results.
Agronomy 14 01123 g008
Figure 9. Detection and manual measurement of the banana bunch: (a) height; (b) width.
Agronomy 14 01123 g009
Figure 10. Validation of the weight estimation: (a) h model; (b) h + Vp model.
Agronomy 14 01123 g010
Table 1. Parameters used for banana bunch weight estimation model analysis.
ParameterExplanation
wThe width of the banana bunch
hThe height of the banana bunch
PEffective pixel ratio
SArea of front rectangle of cuboid (w × h)
VVolume of cuboid (w2 × h)
ScCurved surface area of the half cylinder (0.5Π × w × h)
VcCylinder volume
SpArea estimation of the banana bunch in the field of view
VpBanana bunch volume estimation
Table 2. Regression analysis of banana weight estimation based on a single variant.
No.VariableRegression EquationR2RMSE
1wWbanana = 0.0345 w + 4.2010.1413.501
2hWbanana = 0.0269 h − 2.3930.7871.745
3SWbanana = 7.181 × 10⁻⁵S + 1.7220.6822.128
4SpWbanana = 4.921 × 10⁻⁵Sp + 9.4390.6972.081
5VWbanana = 8.137 × 10⁻⁸V + 8.6150.5122.637
6VpWbanana = 2.471 × 10⁻⁷Vp + 7.2450.5342.577
Table 3. Regression analysis of banana weight estimation based on double variants.
No.VariableRegression EquationR2RMSE
1h + SWbanana = −2.584 + 0.0224 h + 1.459 × 10⁻⁵S0.8111.661
2h + VWbanana = −2.11 + 0.0235 h + 1.699 × 10⁻⁸V0.8131.653
3h + SpWbanana = −2.163 + 0.0219 h + 1.081 × 10⁻⁵Sp0.8121.658
4h + VpWbanana = −2.301 + 0.0233 h + 5.331 × 10⁻⁸Vp0.8141.647
Disclaimer/Publisher’s Note: The statements, opinions and data contained in all publications are solely those of the individual author(s) and contributor(s) and not of MDPI and/or the editor(s). MDPI and/or the editor(s) disclaim responsibility for any injury to people or property resulting from any ideas, methods, instructions or products referred to in the content.

