
Evaluation of the Coupled Coordination of the Water–Energy–Food–Ecology System Based on the Sustainable Development Goals in the Upper Han River of China


Abstract
1. Introduction
2. Materials and Methods
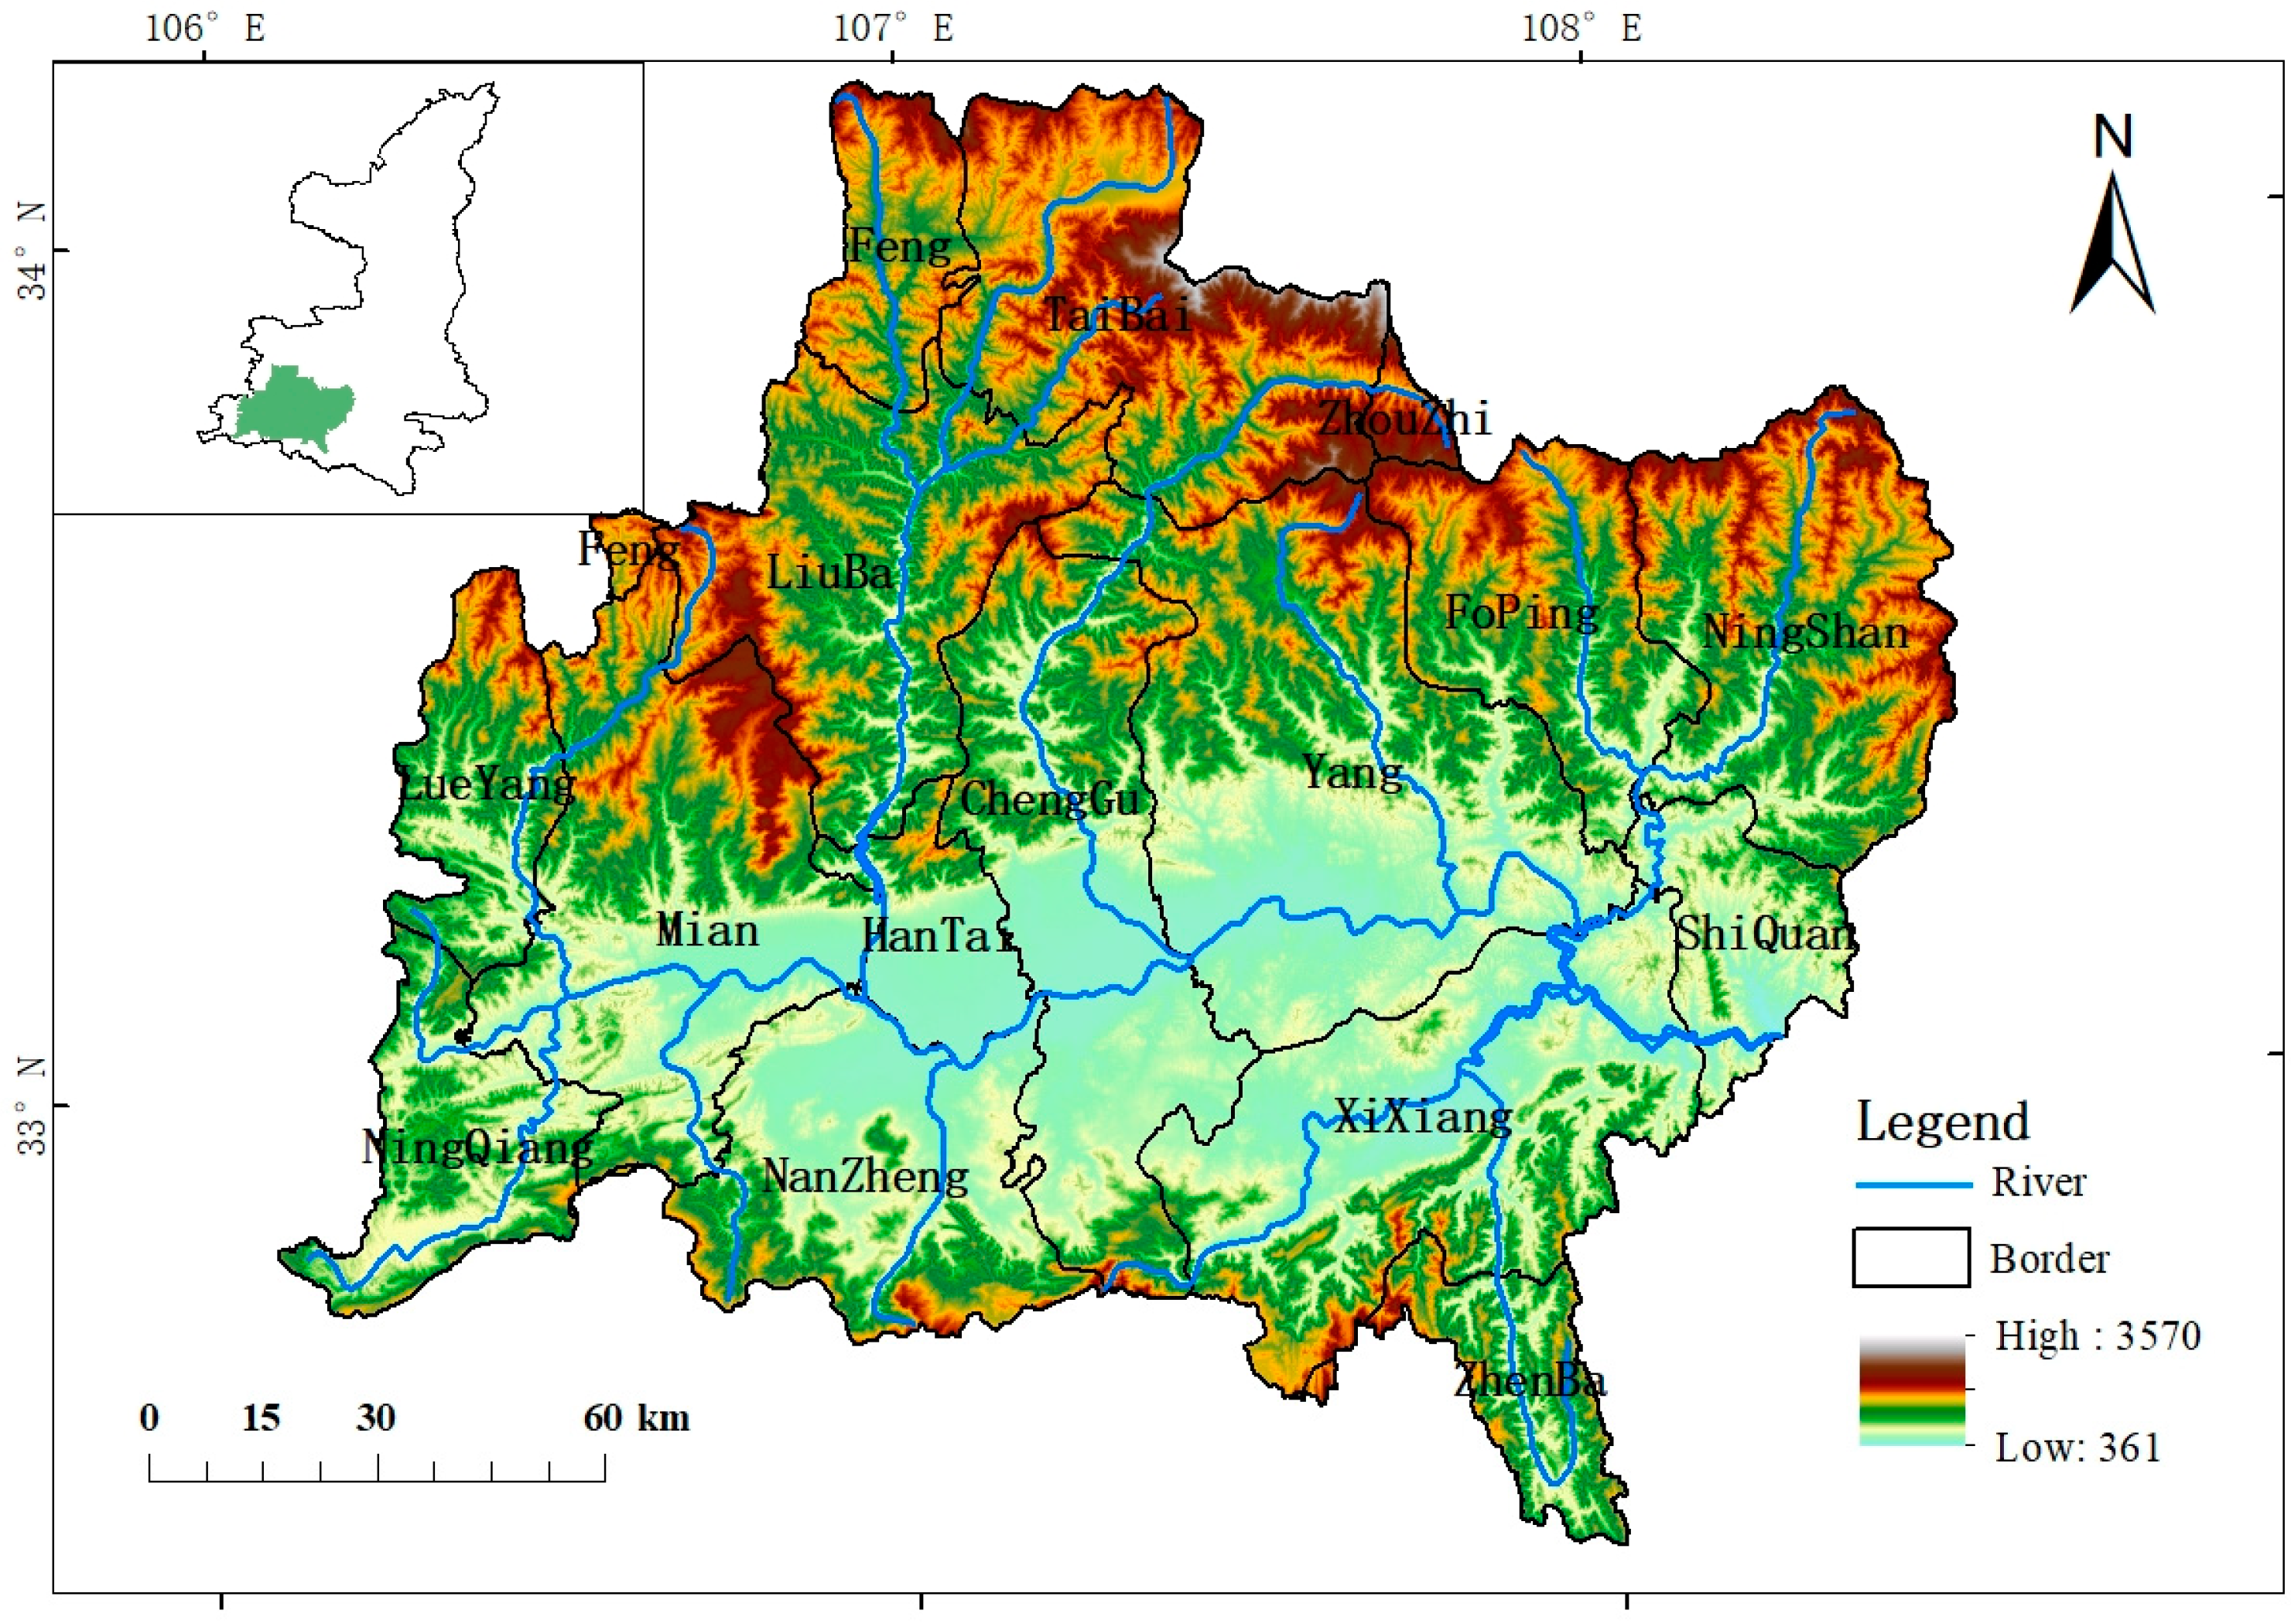
2.1. Study Area
2.2. Data
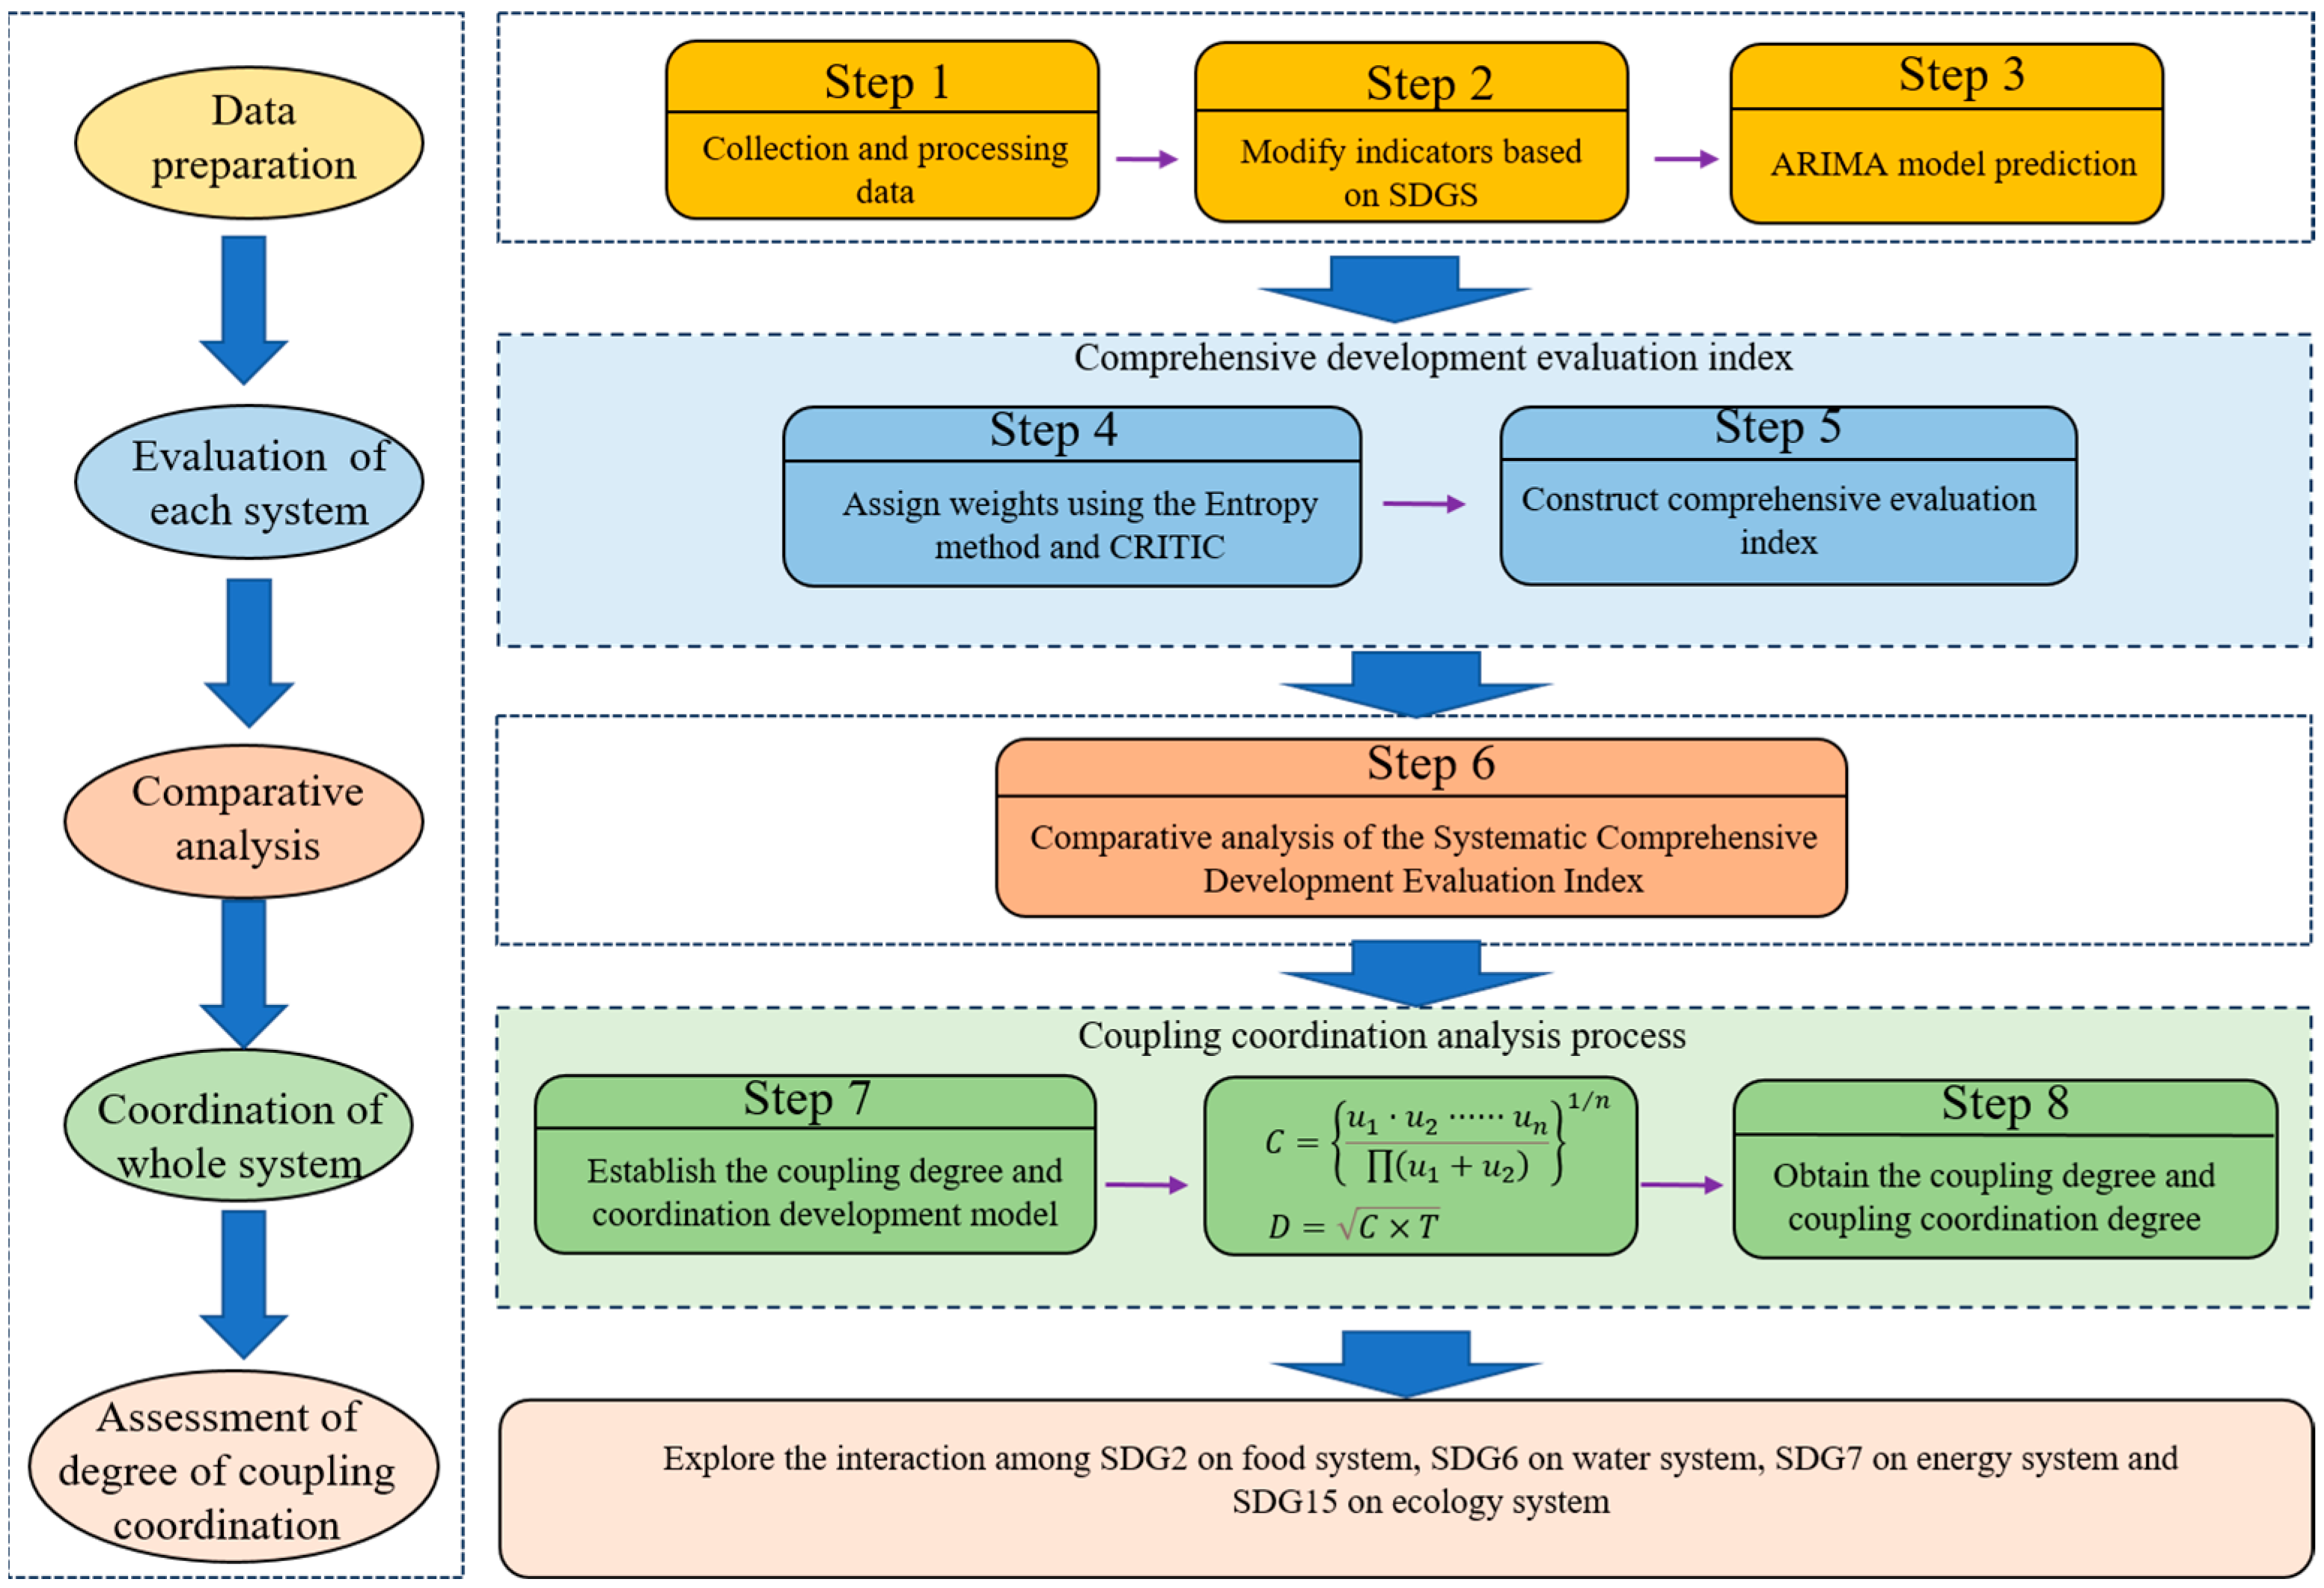
2.3. Methodology
2.3.1. Localization of the Indicators of the System
2.3.2. Entropy and CRITIC Weighting Methods
2.3.3. Comprehensive Development Evaluation Index Model
2.3.4. Coupled Coordination Degree Model and Classification Criteria
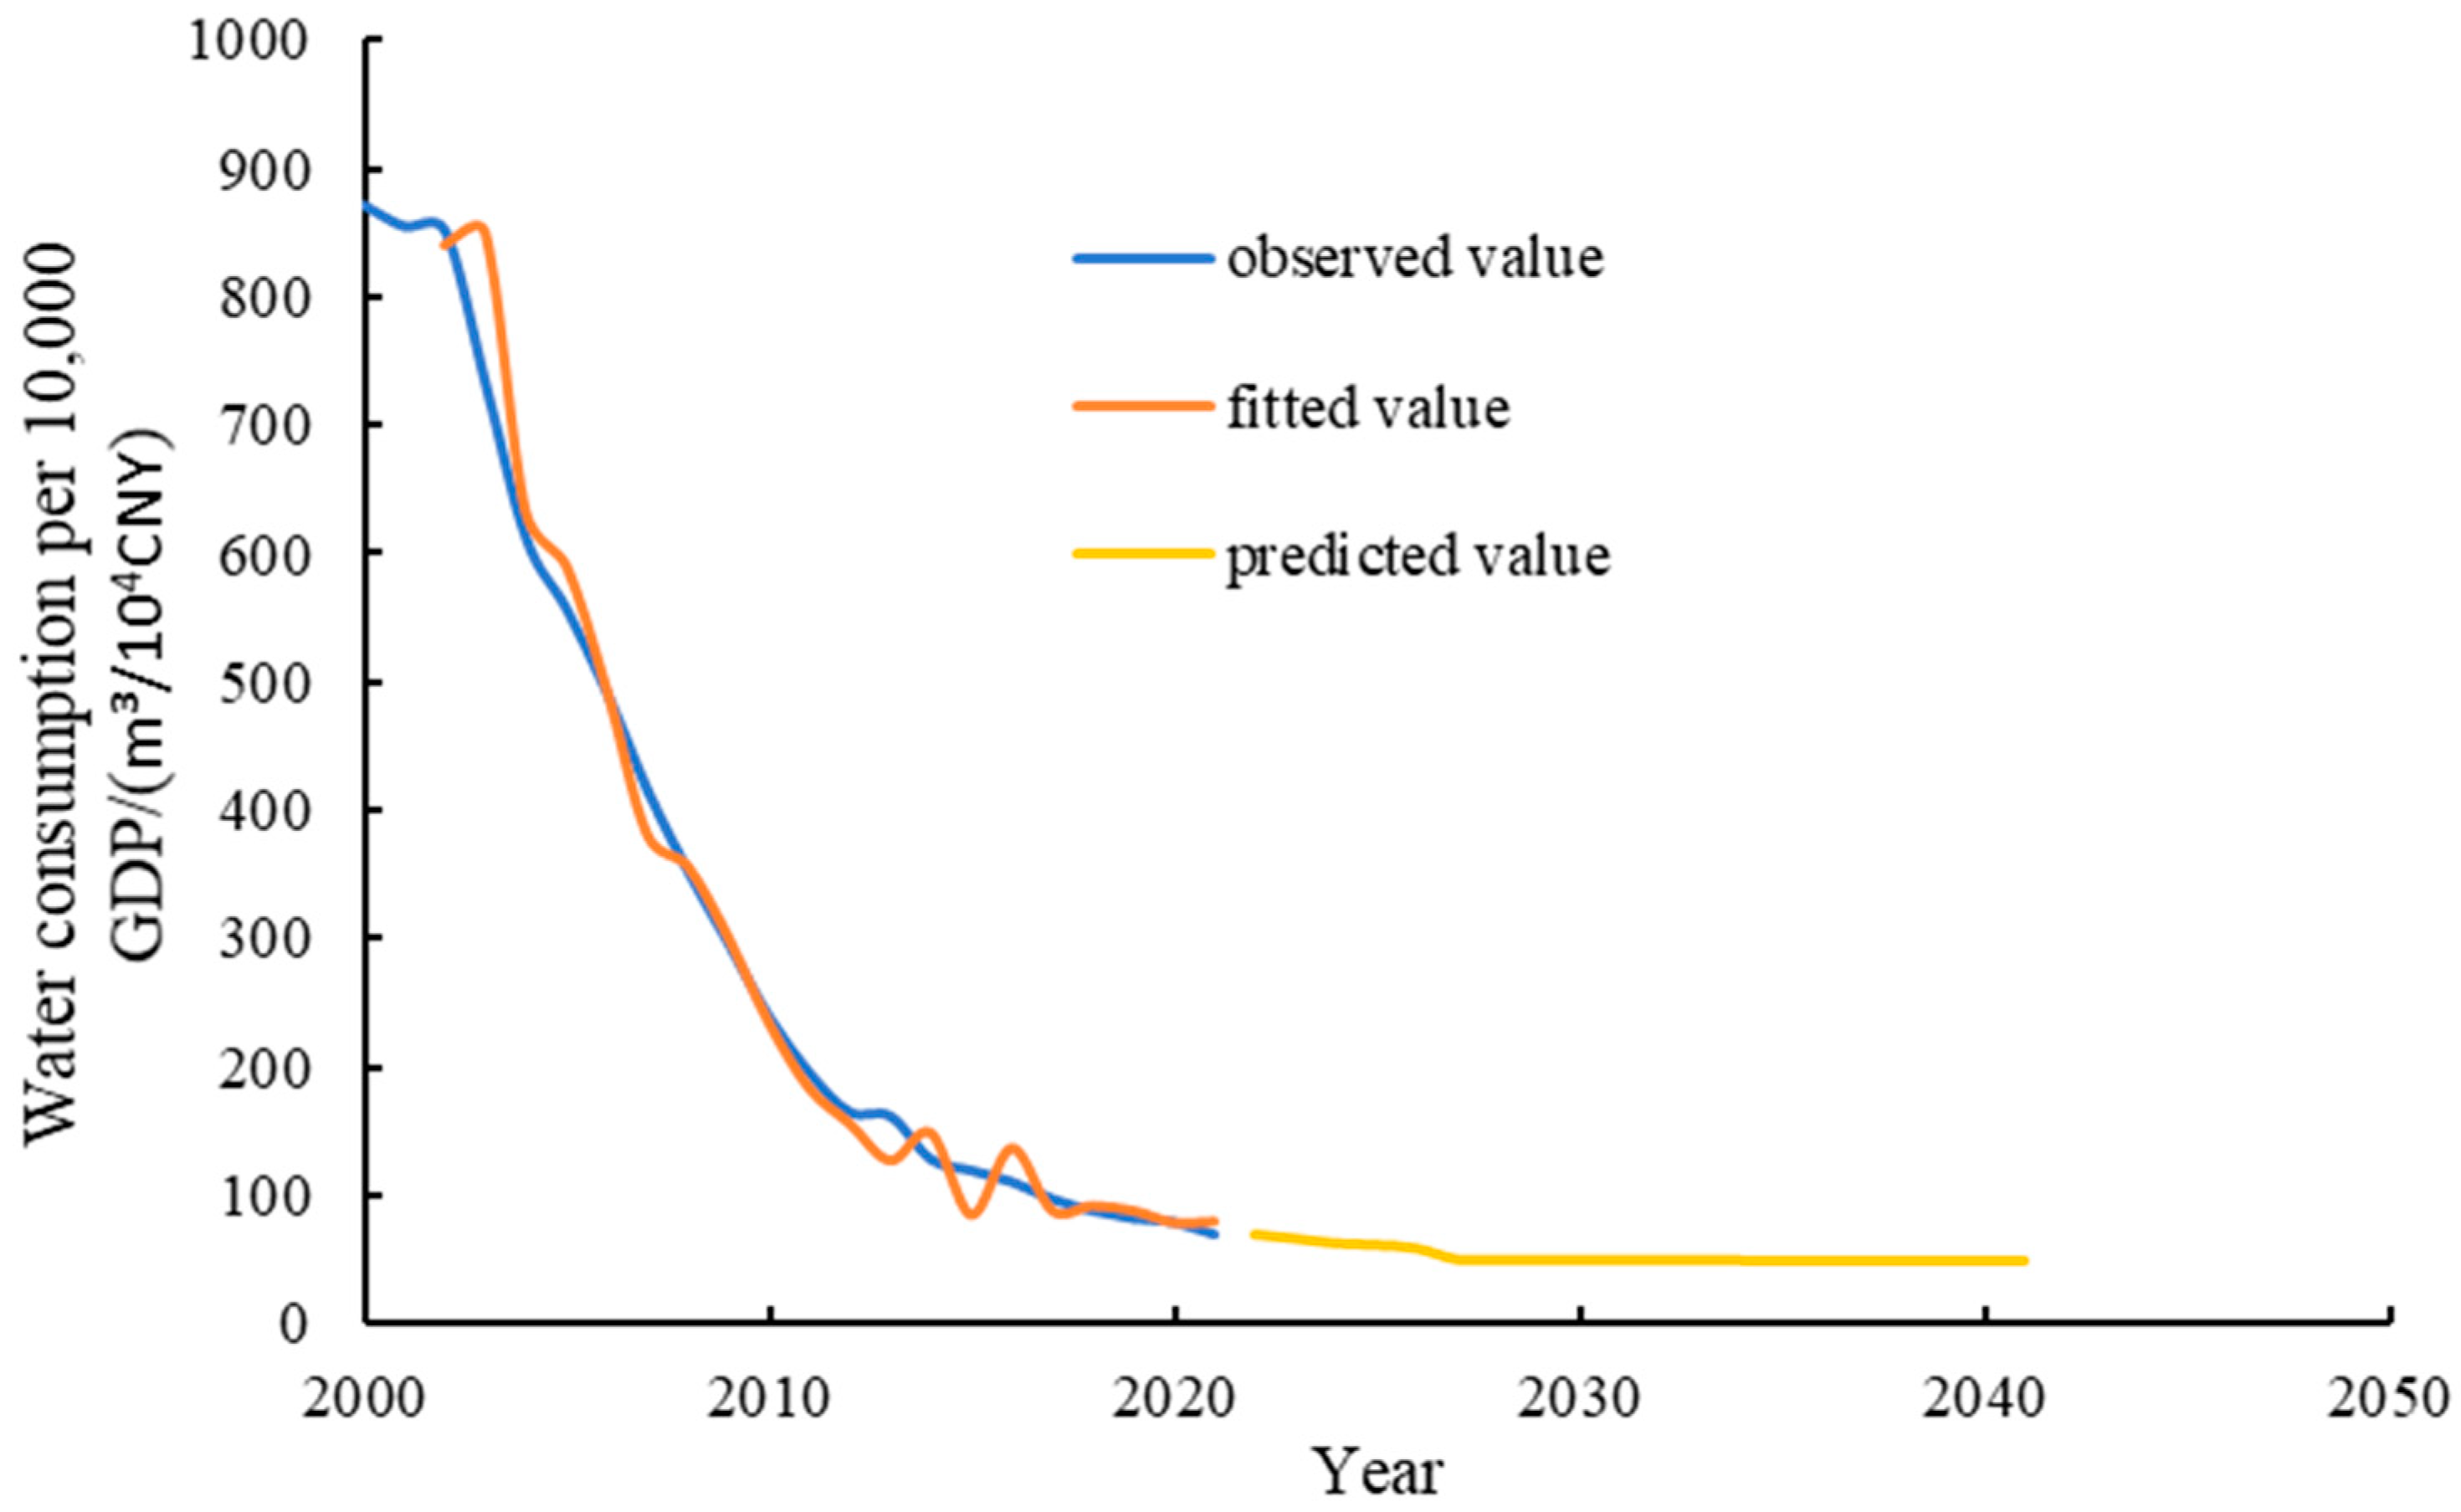
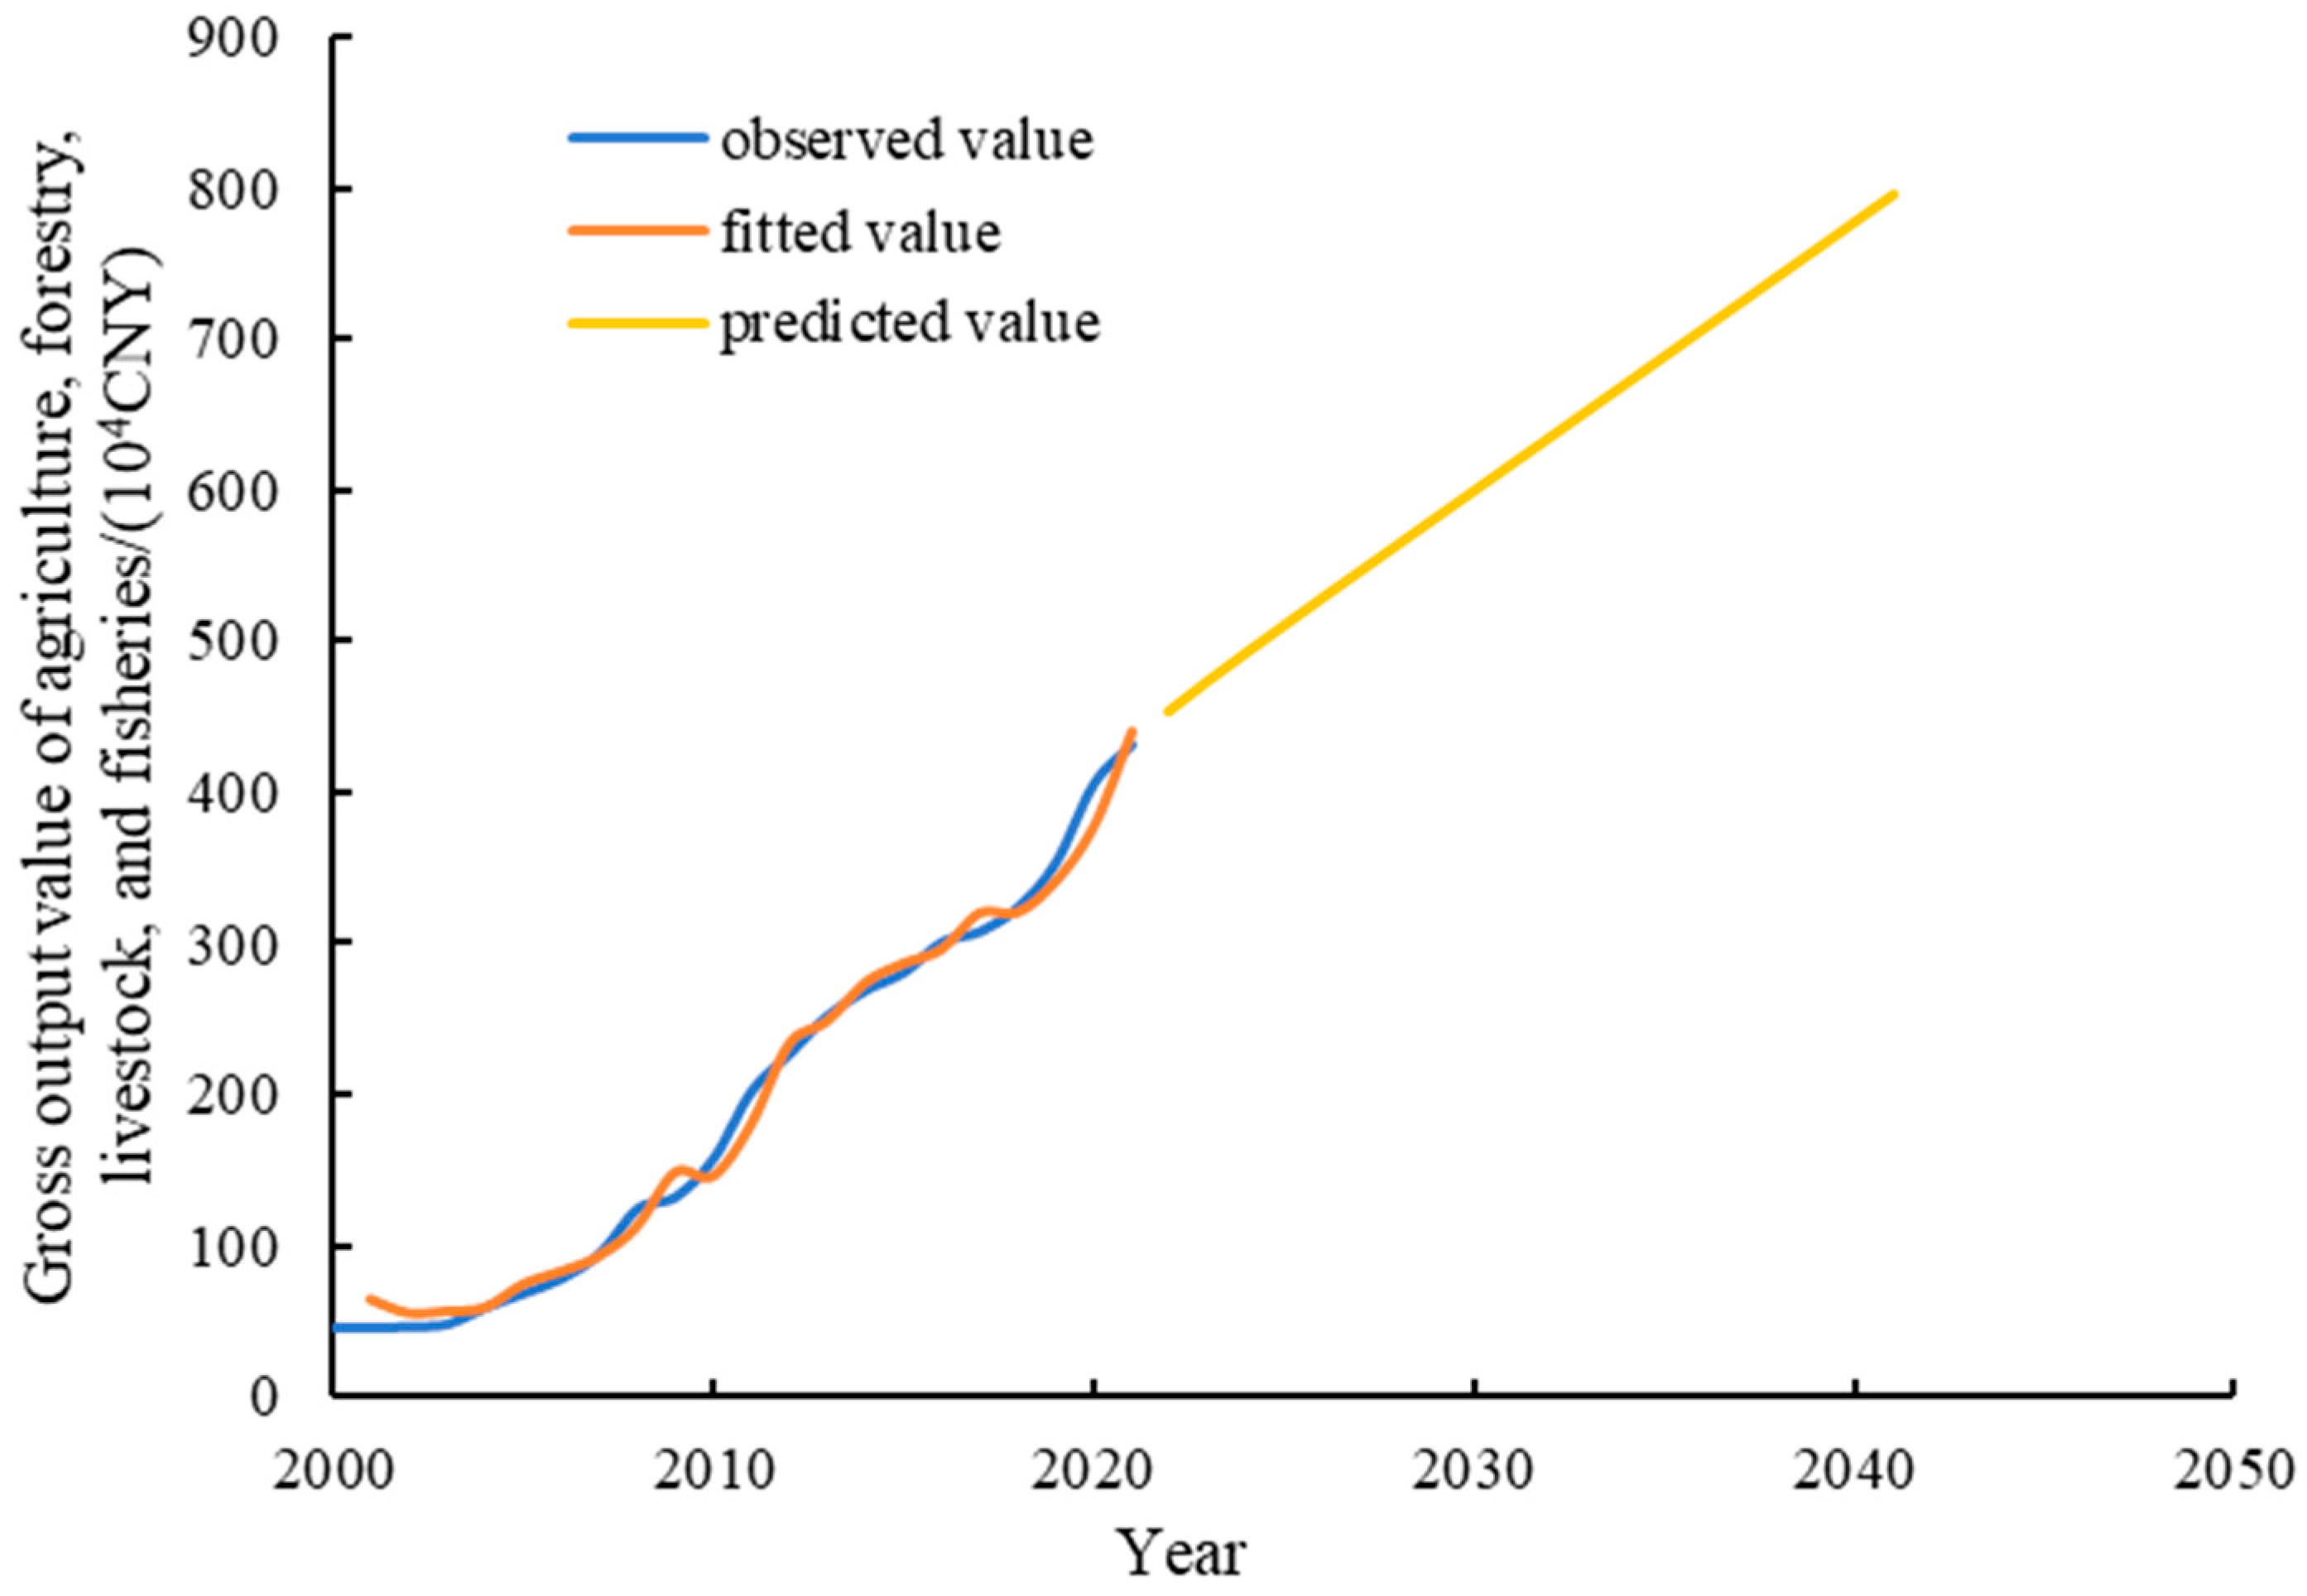
2.3.5. ARIMA Forecasting Model
2.3.6. Comparative Analysis Method of Evaluation Index of Systematic Comprehensive Development
3. Results
3.1. Evaluation Index System for the Degree of Coupling and Coordination in the WEFC System in the Upper Han River
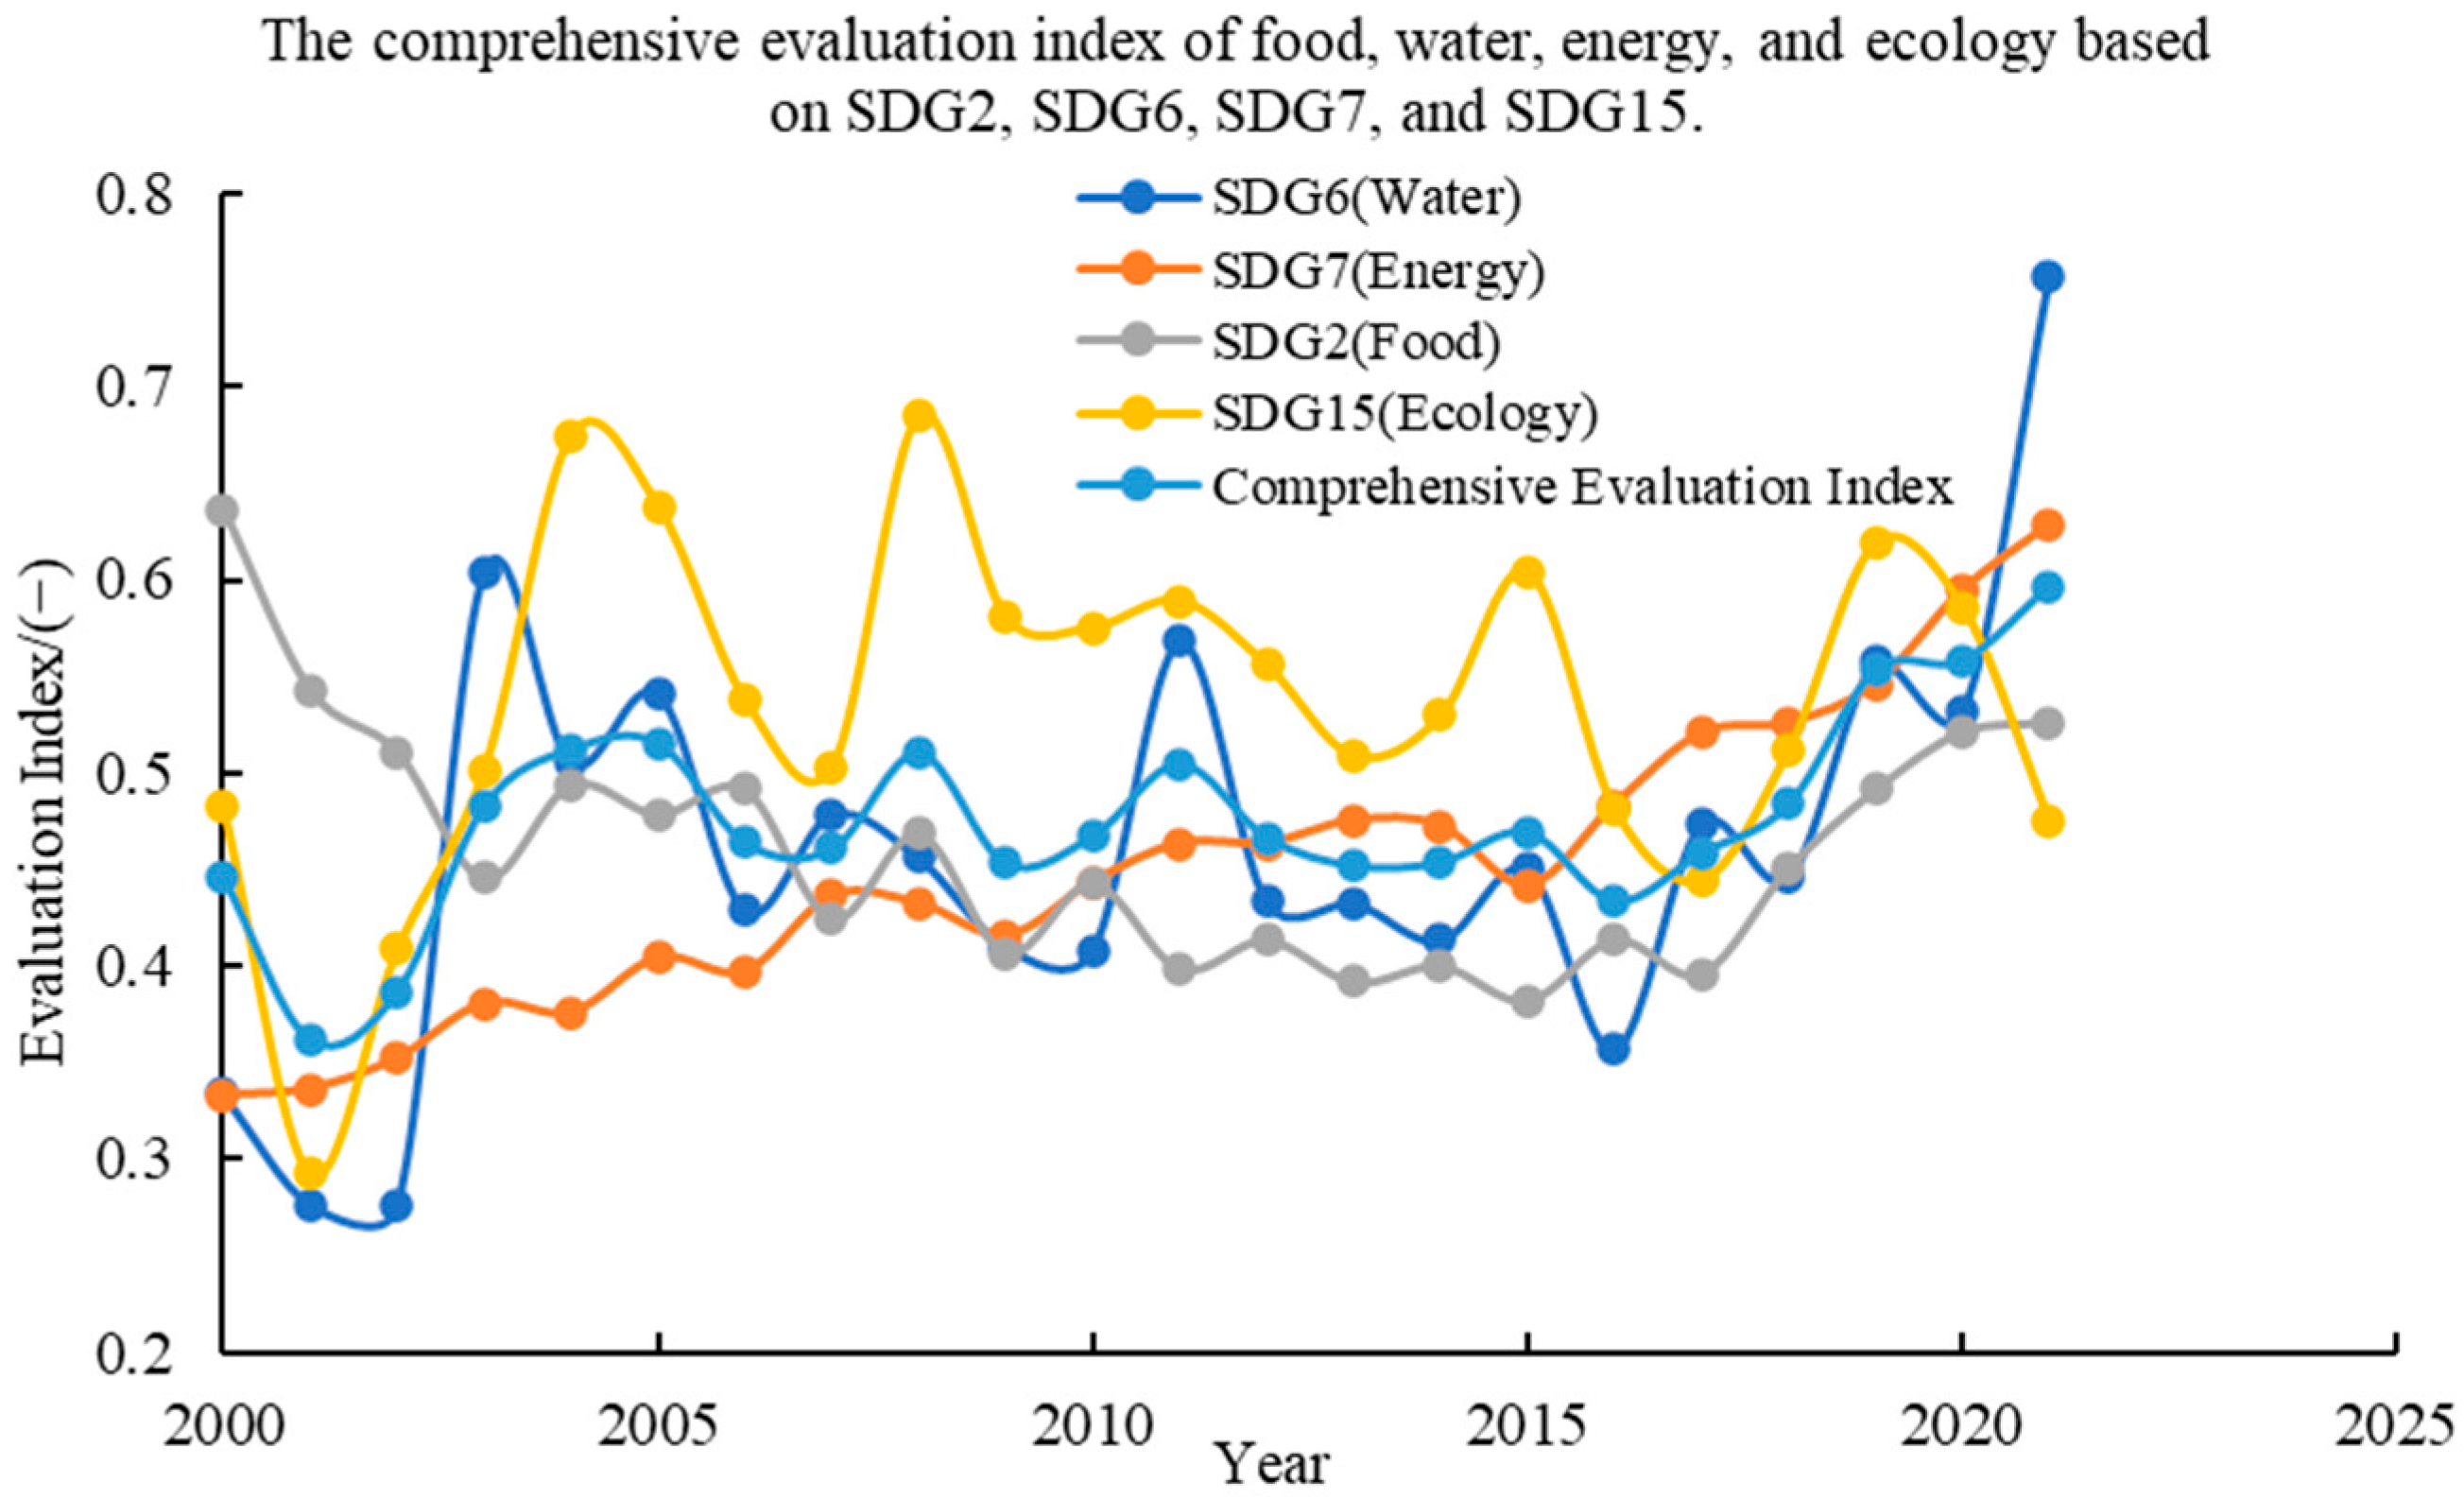
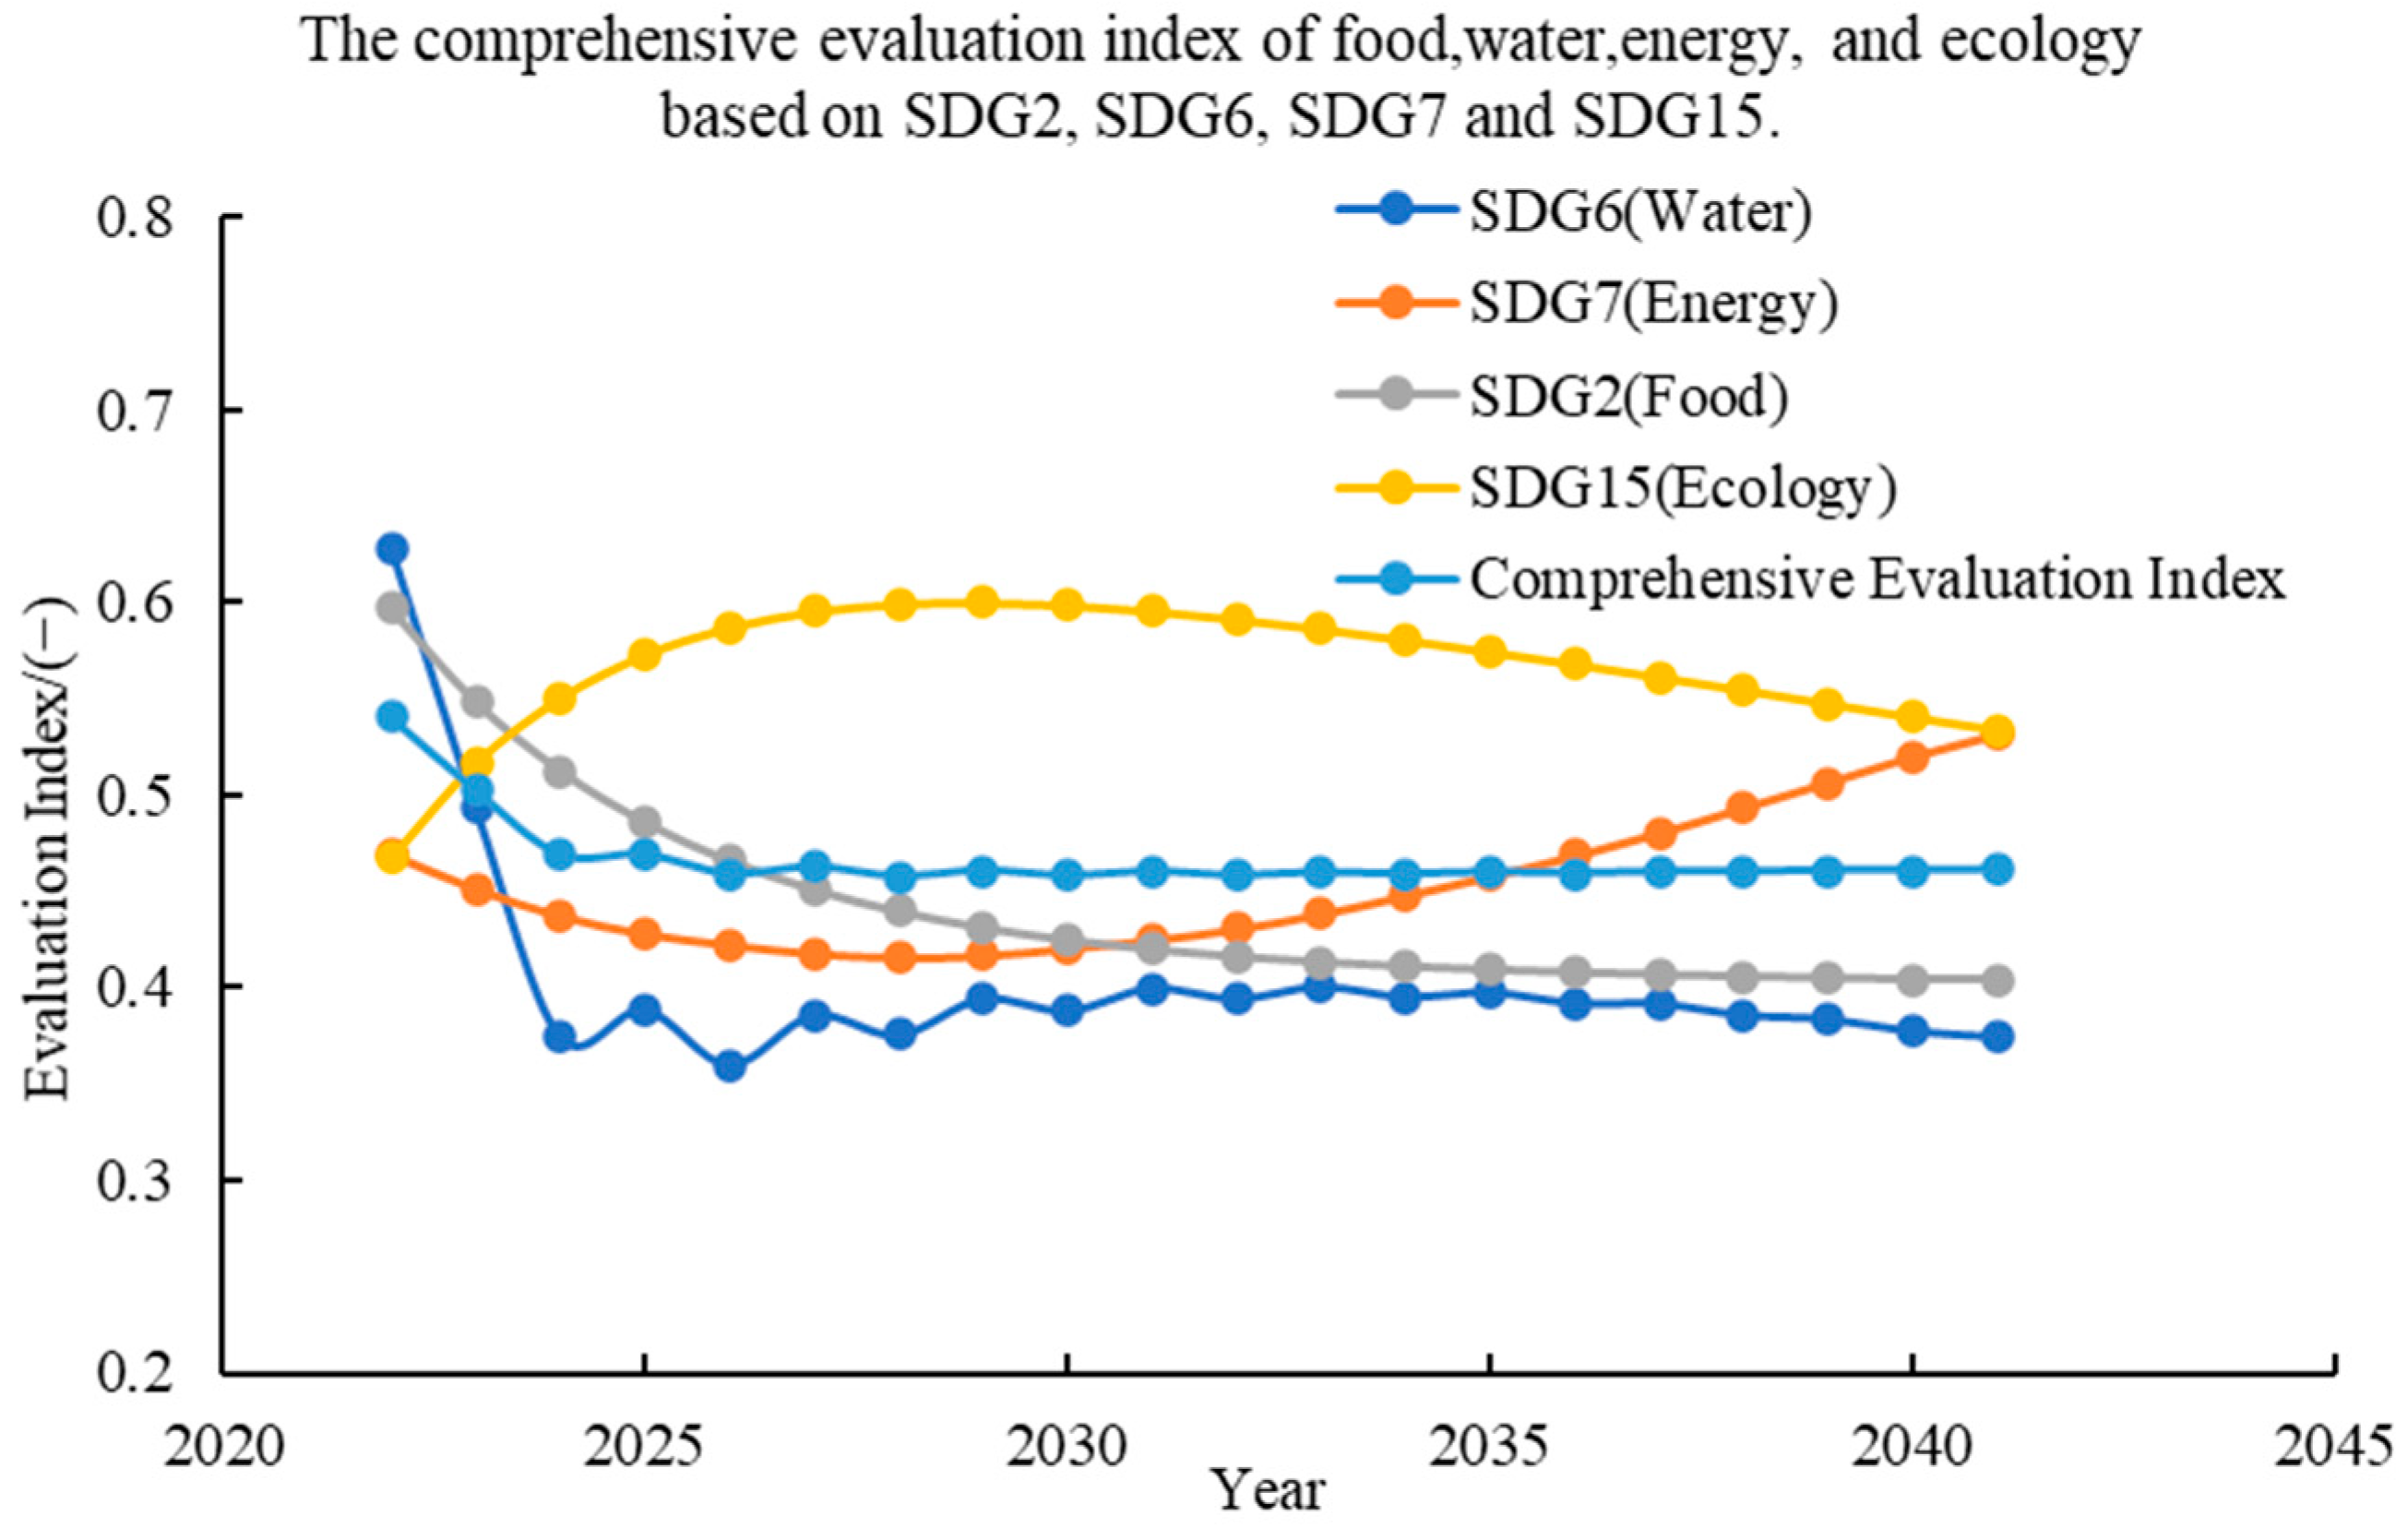
3.2. Analysis of the Comprehensive Development Evaluation Index for the WEFC System
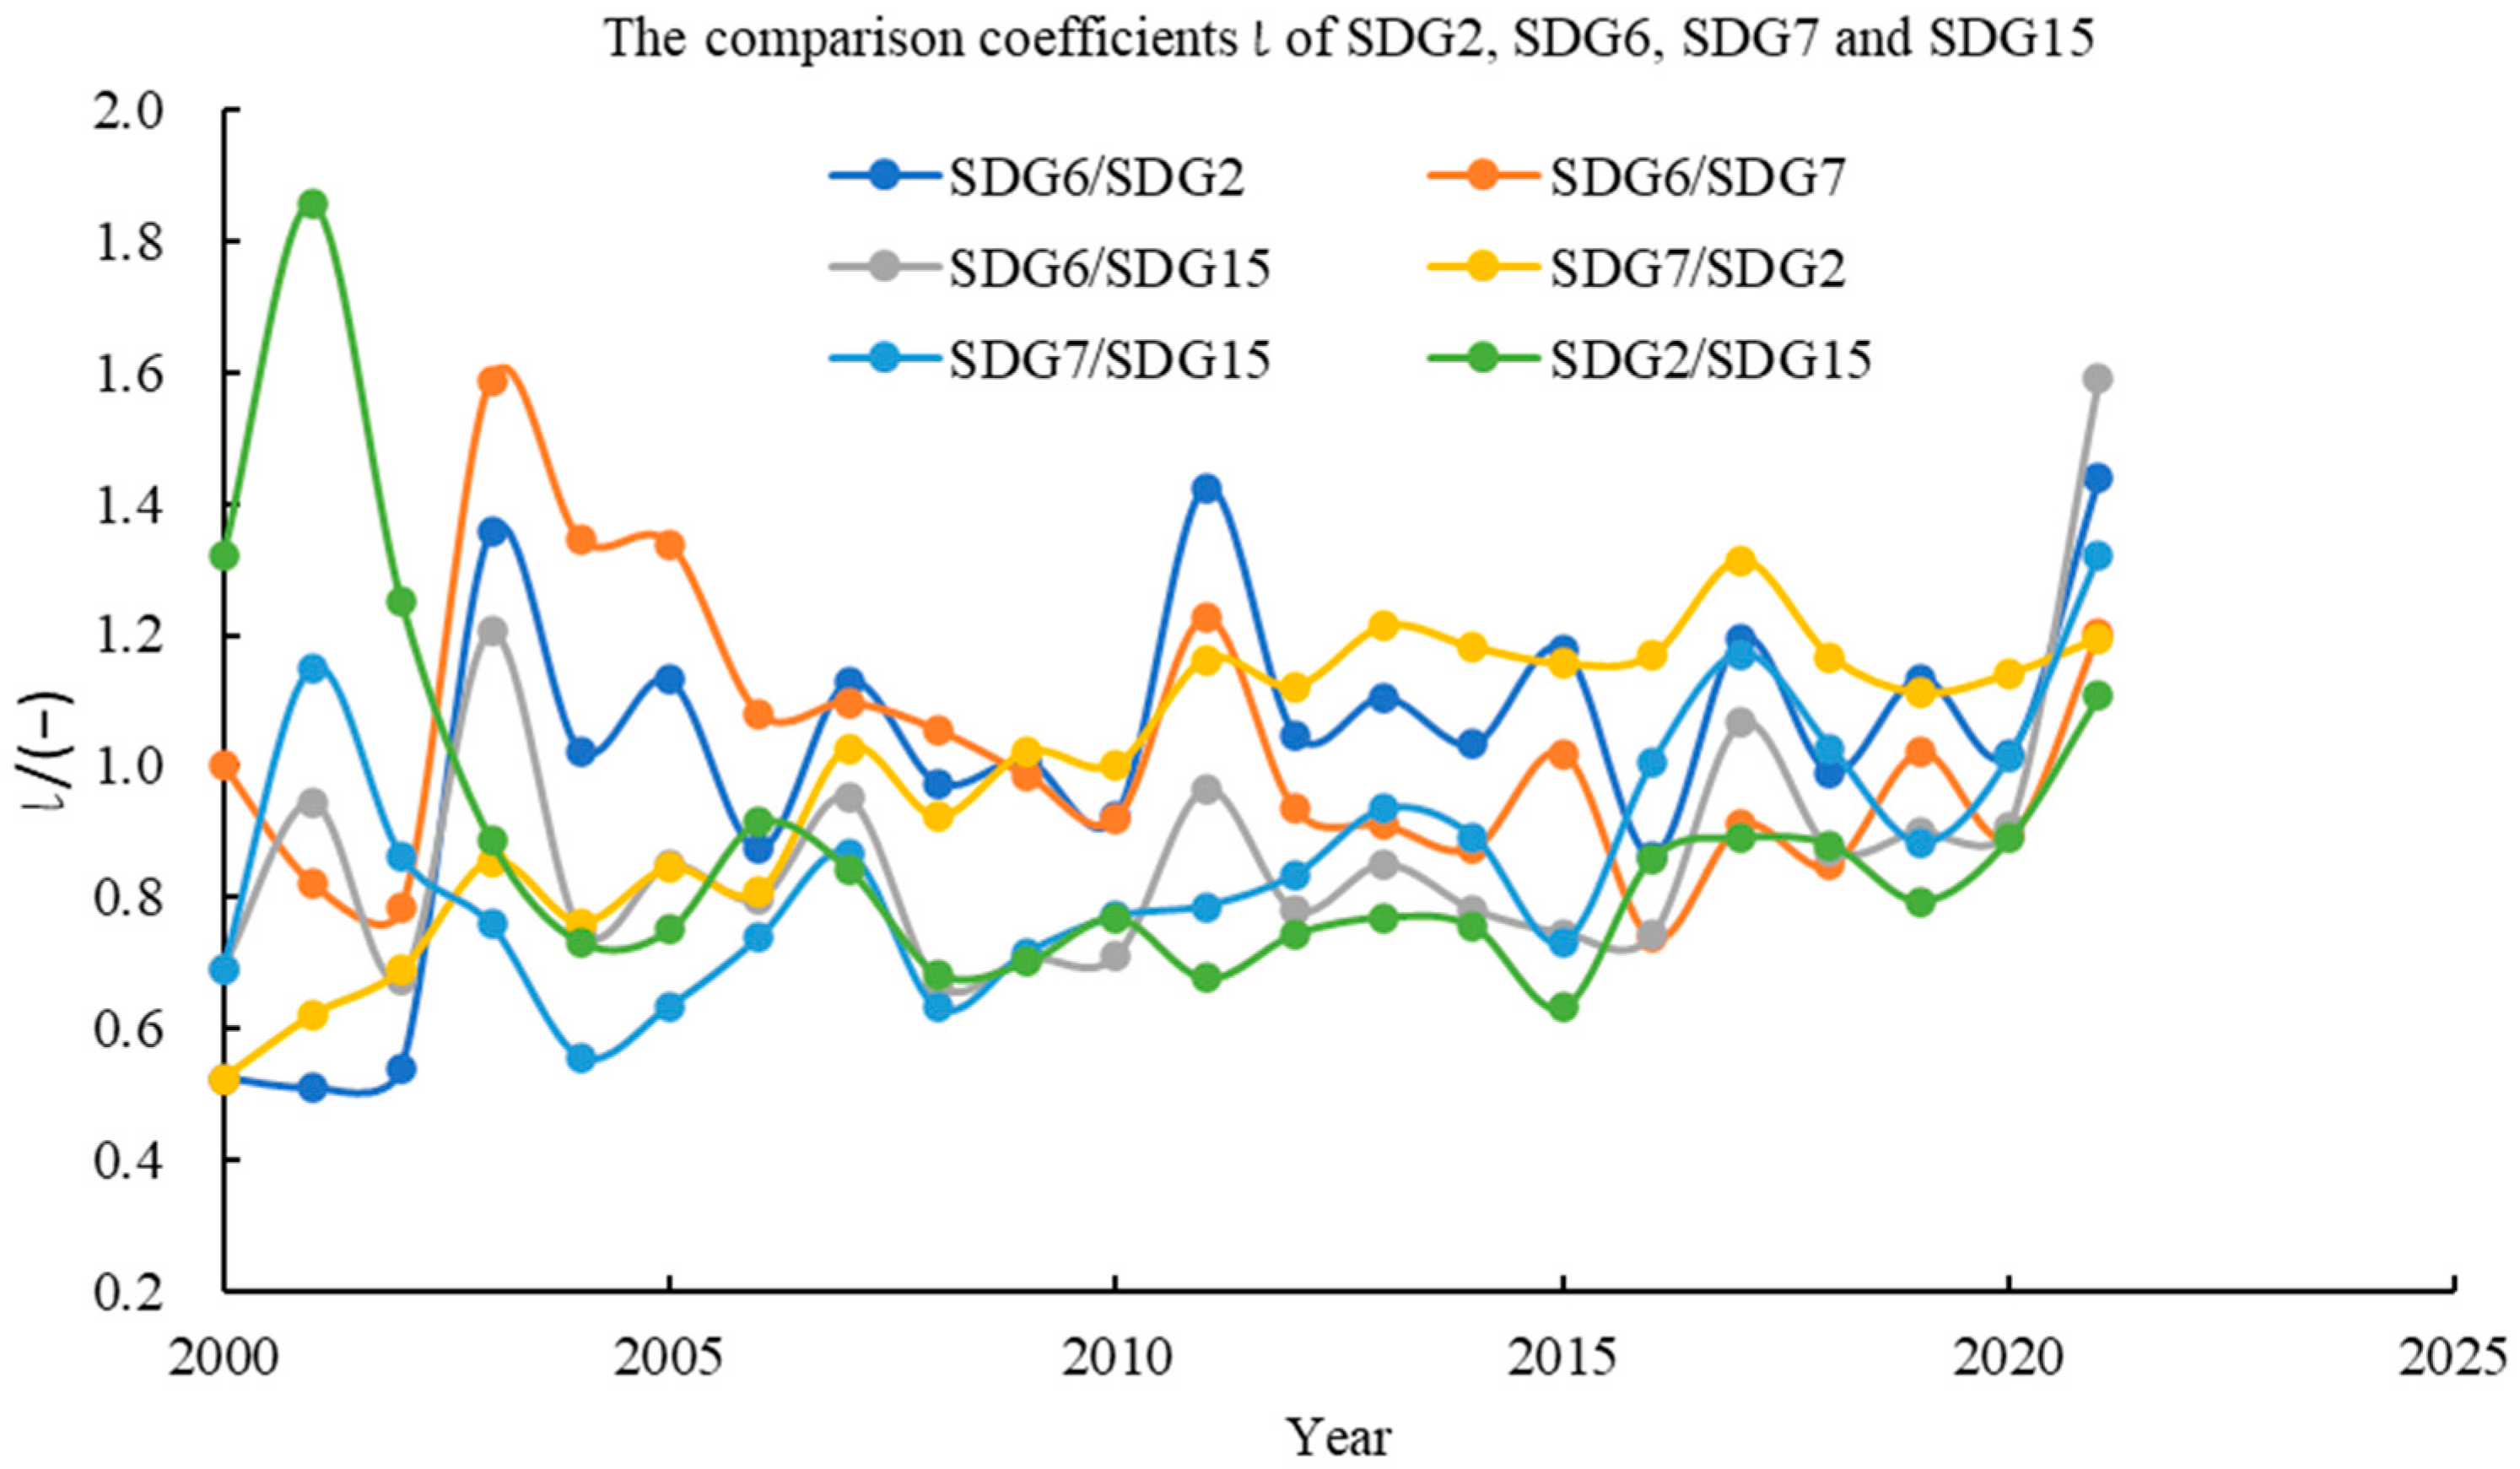
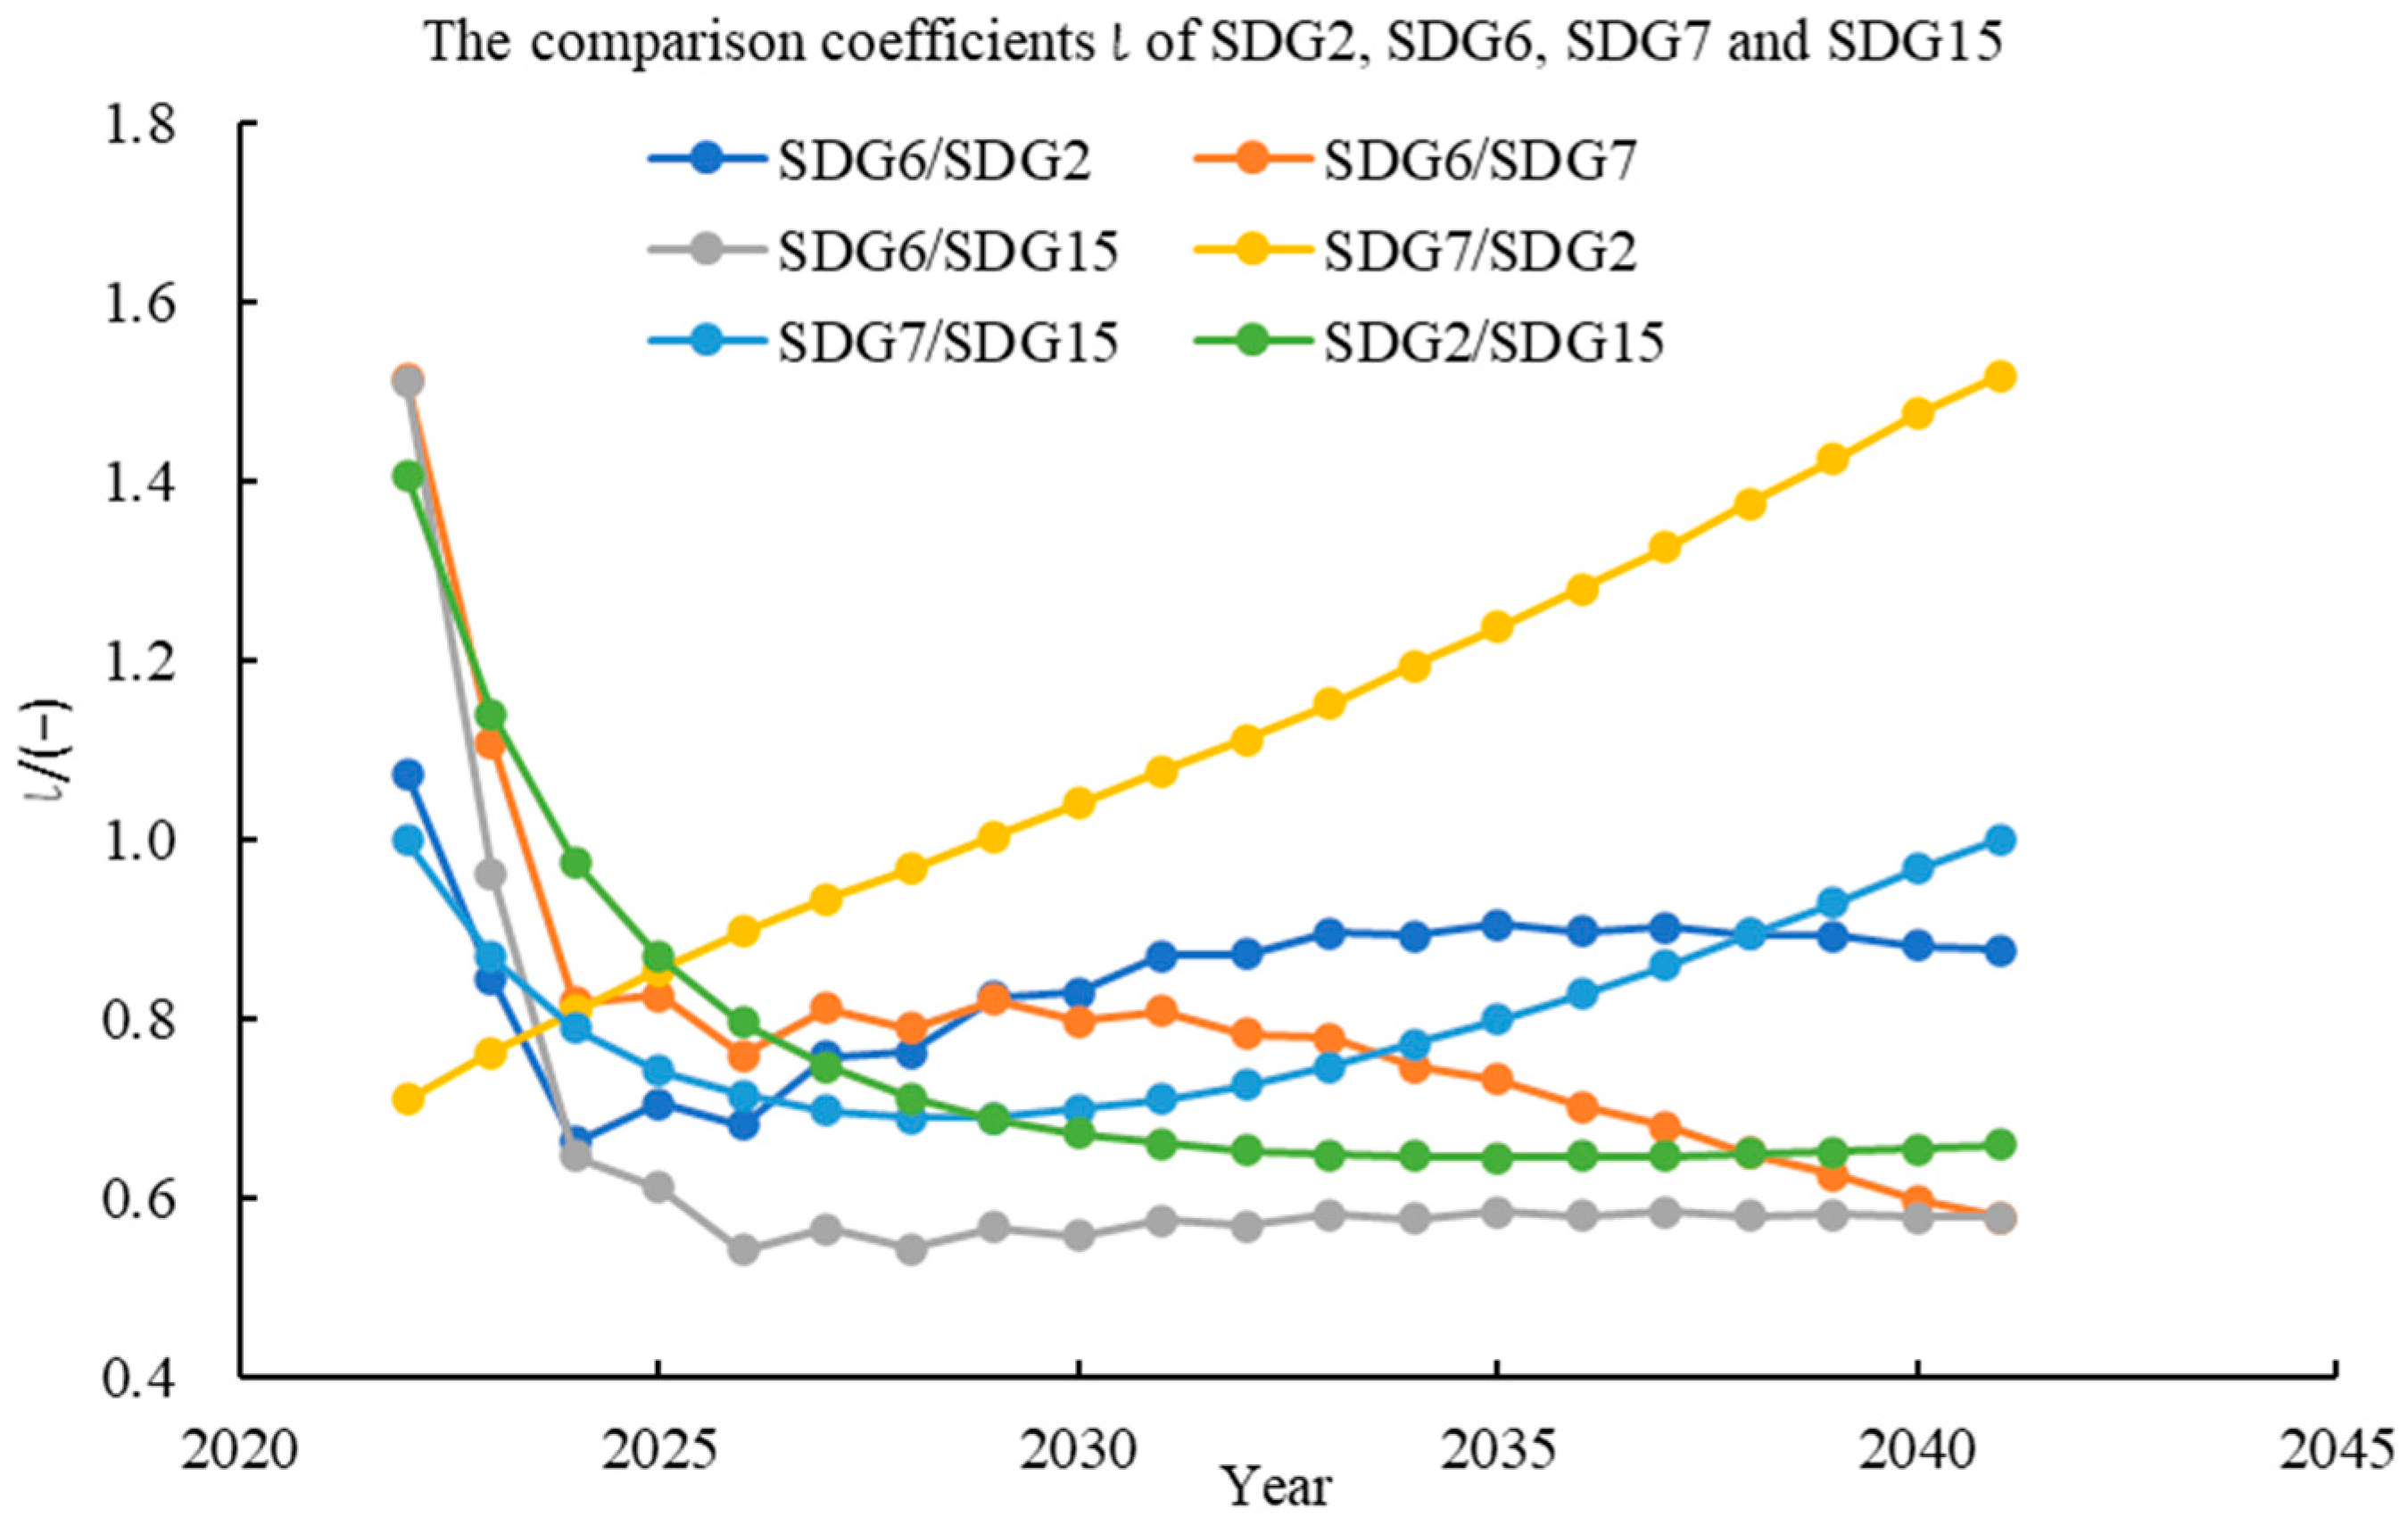
3.3. Comparative Analysis of the Systematic Comprehensive Development Evaluation Index
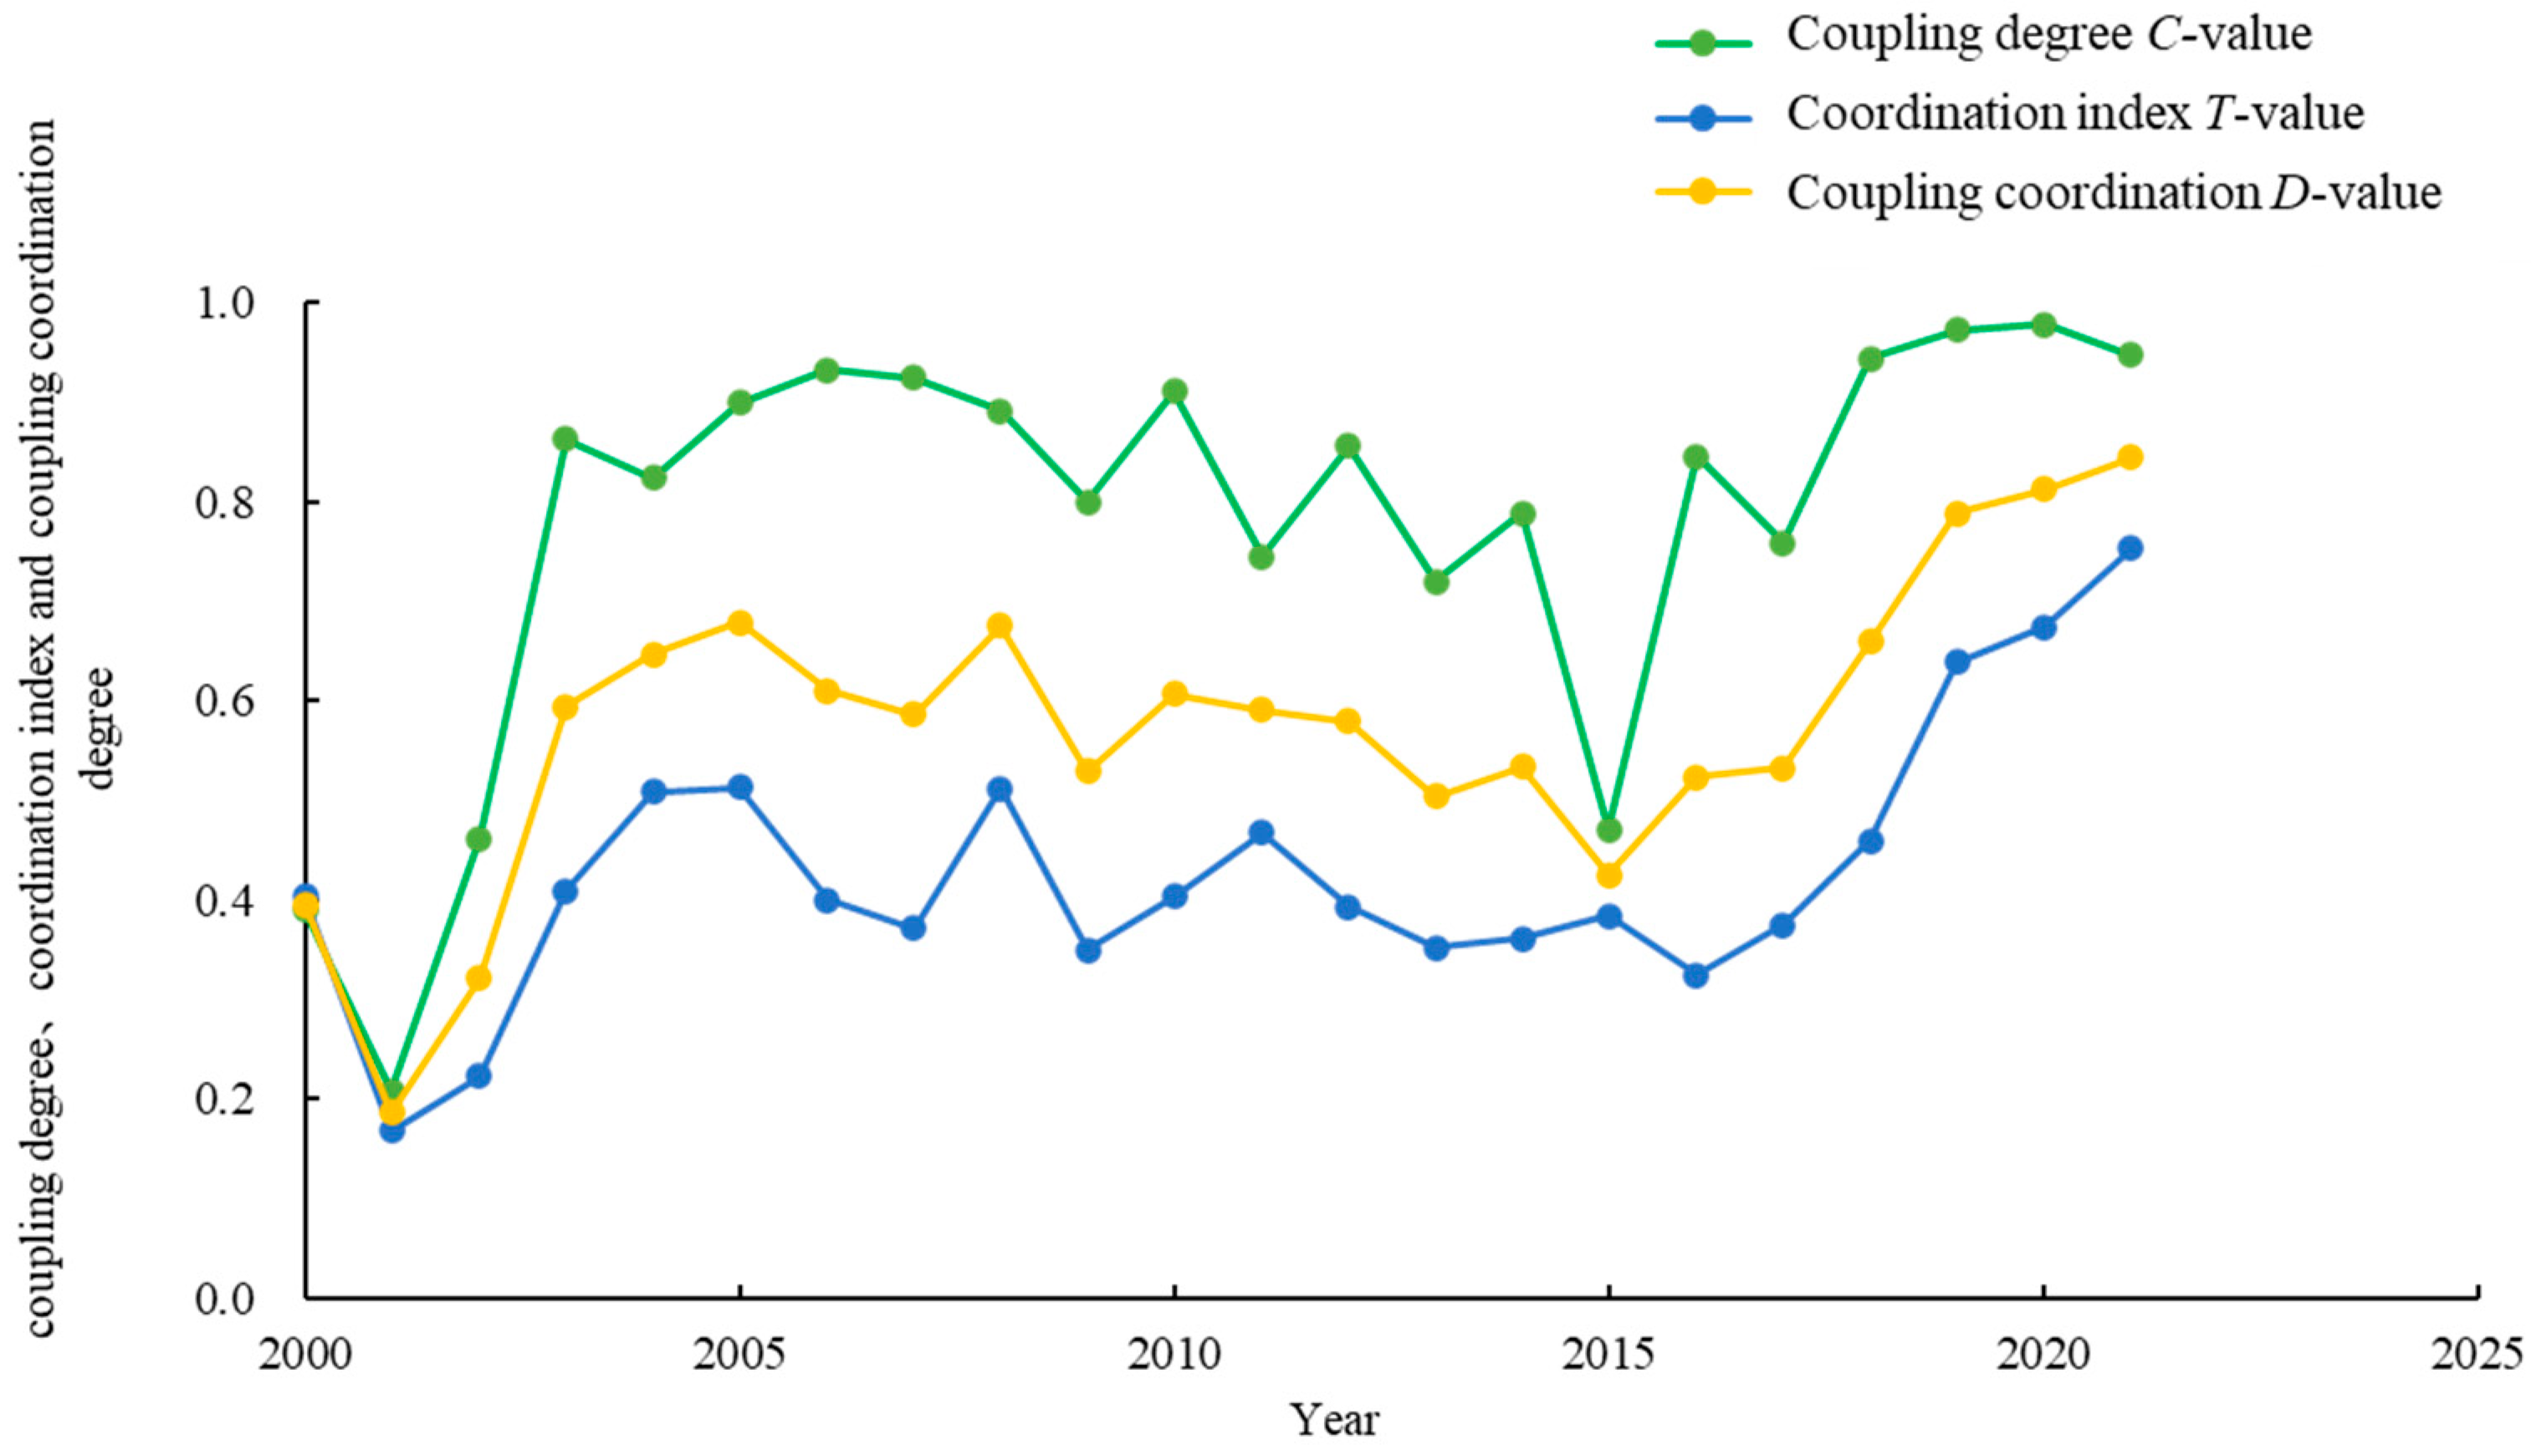
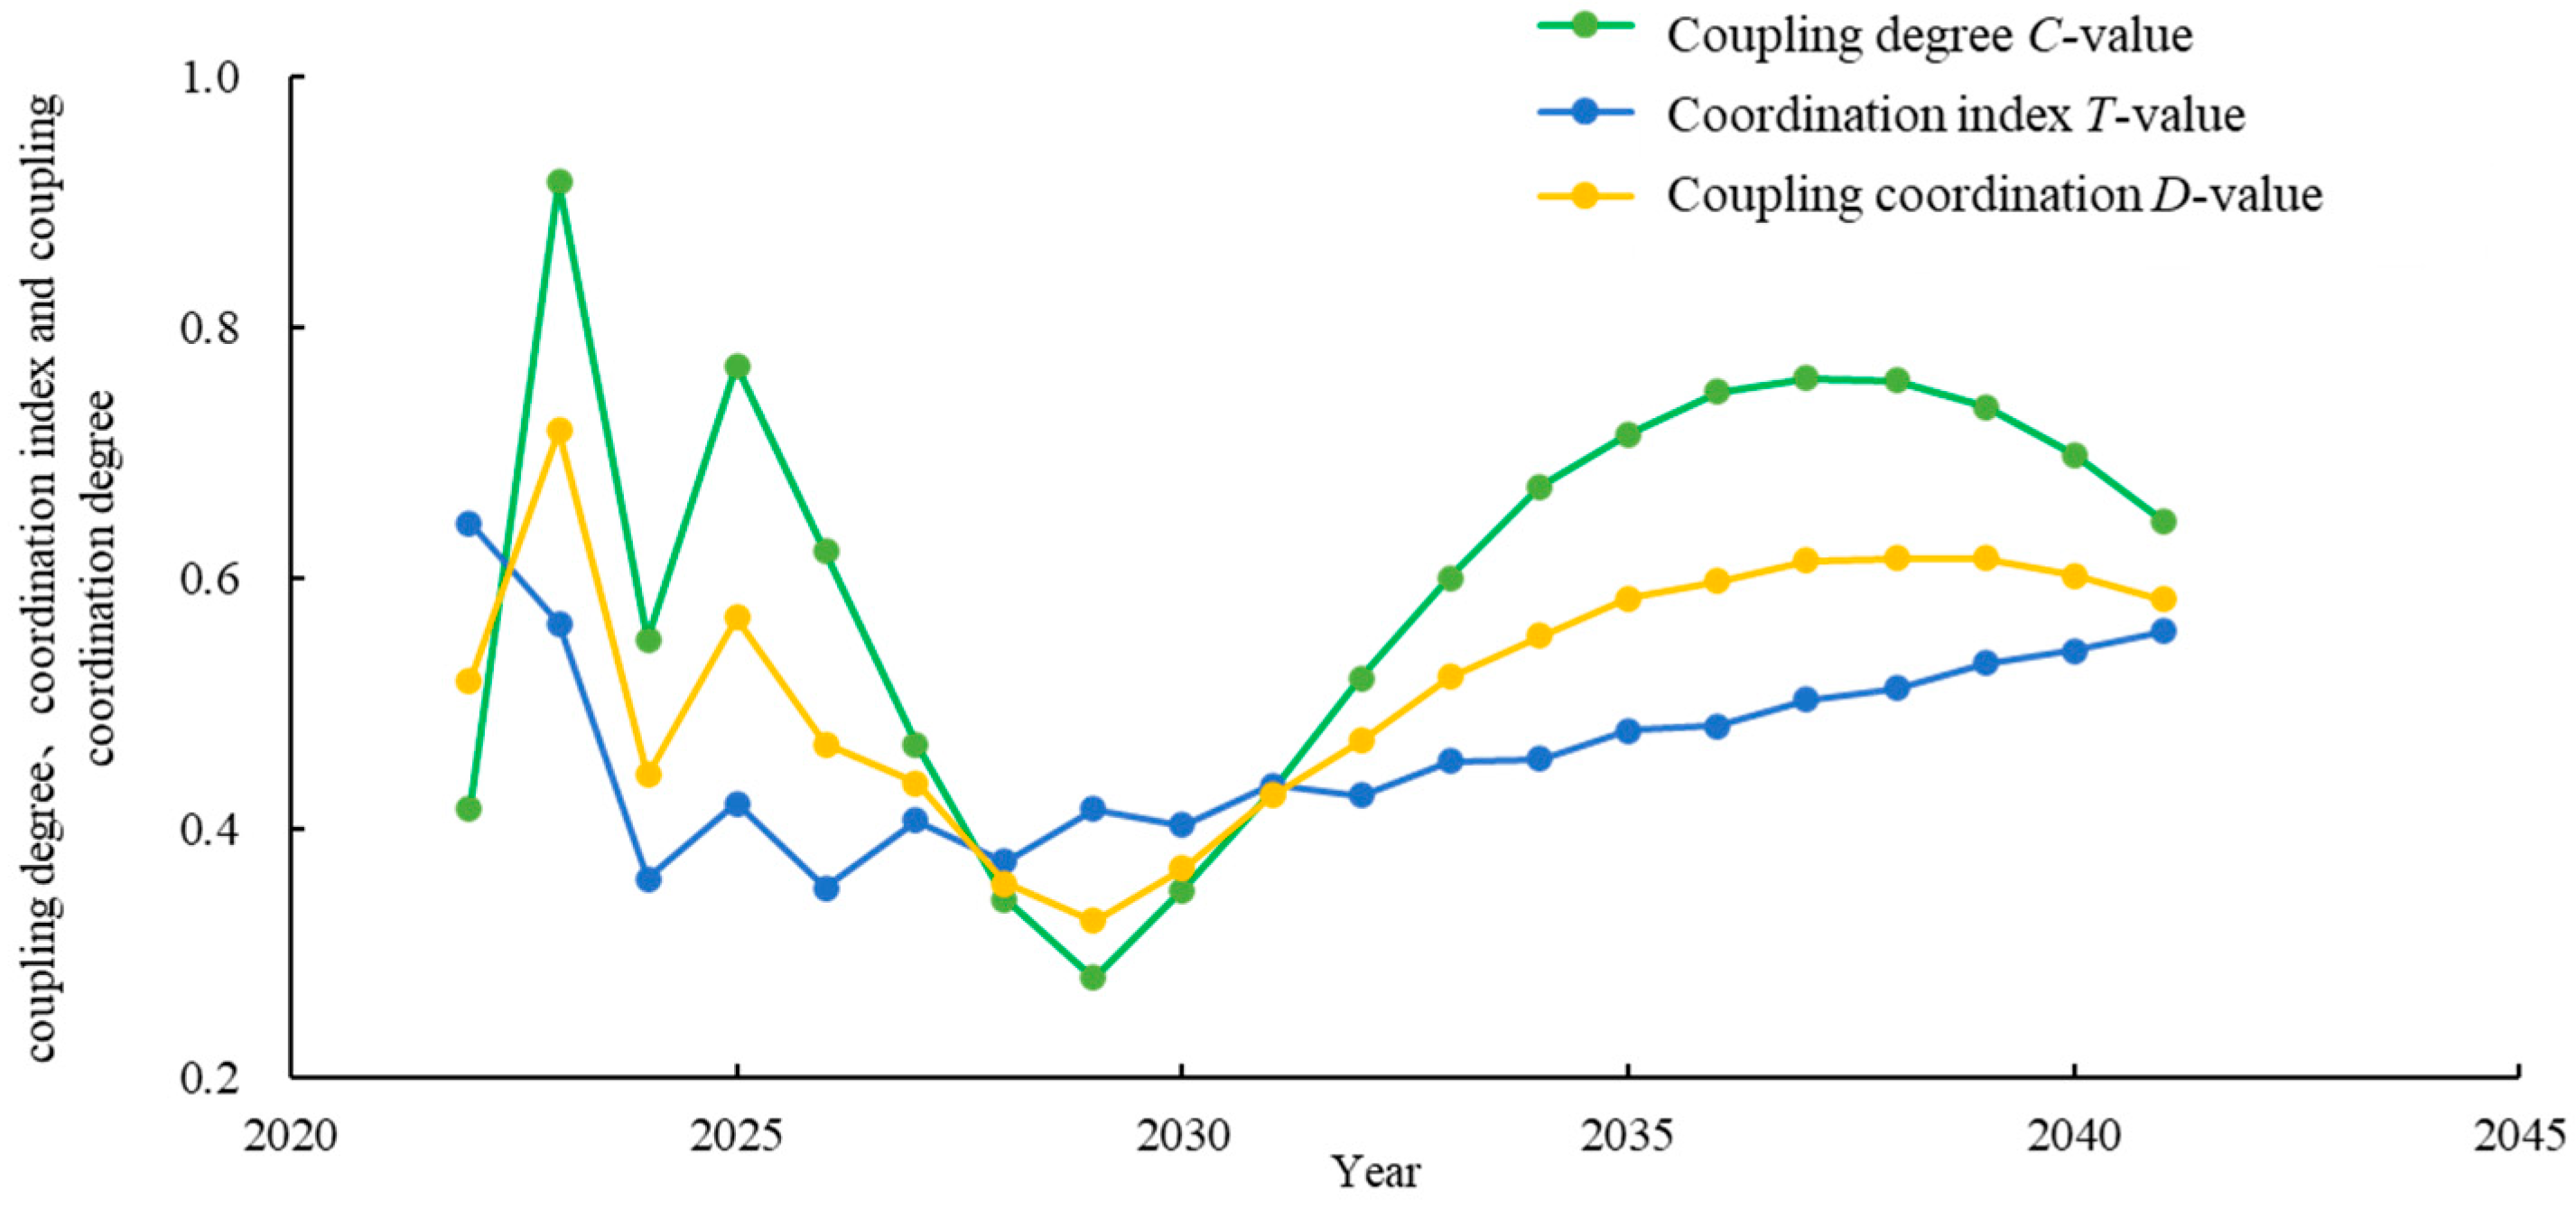
3.4. Analysis of the Degree of System Coupling and Coupling Coordination
4. Discussion
5. Conclusions
Author Contributions
Funding
Data Availability Statement
Conflicts of Interest
References
- Wang, H.; Fang, L. Spatial-temporal coupling coordination relationship between the security level of water-energy-food nexus system and total factor productivity in China. Water Resour. Prot. 2023, 39, 150–157. [Google Scholar]
- Liu, J.; Liu, C.; Li, X.; Wang, G.; Bao, Z. Security evaluation of water-energy-food nexus system in China. Hydro-Sci. Eng. 2020, 4, 24–32. [Google Scholar]
- Hanes, R.J.; Gopalakrishnan, V.; Bakshi, B.R. Including nature in the food-energy-water nexus can improve sustainability across multiple ecosystem services. Resour. Conserv. Recycl. 2018, 137, 214–228. [Google Scholar] [CrossRef]
- Liao, X.; Lin, Z.; Li, M. New-Type Urbanization on pollution and carbon reduction impact mechanism and co-benefits analysis. Environ. Sci. Pollut. Res. 2023. [Google Scholar] [CrossRef] [PubMed]
- Bazilian, M.; Rogner, H.; Howells, M.; Hermann, S.; Arent, D.; Gielen, D.; Steduto, P.; Mueller, A.; Komor, P.; Tol, R.S.J.; et al. Considering the energy, water and food nexus: Towards an integrated modelling approach. Energy Policy 2011, 39, 7896–7906. [Google Scholar] [CrossRef]
- Isiordia, G.E.D.; Lizárraga, A.R.; Weihs, G.A.F.; Sánchez, J.Á. Comparación de métodos de descarga para vertidos de salmueras, provenientes de una planta desalinizadora en Sonora, México. Rev. Int. De Contam. Ambient. 2017, 33, 45–54. [Google Scholar] [CrossRef]
- De Keyser, J.; Hayes, D.S.; Marti, B.; Siegfried, T.; Seliger, C.; Schwedhelm, H.; Anarbekov, O.; Gafurov, Z.; Fernandez, R.M.L.; Diez, I.R.; et al. Integrating Open-Source Datasets to Analyze the Transboundary Water-Food-Energy-Climate Nexus in Central Asia. Water 2023, 15, 3482. [Google Scholar] [CrossRef]
- Fasel, M.; Brethaut, C.; Rouholahnejad, E.; Lacayo-Emery, M.A.; Lehmann, A. Blue water scarcity in the Black Sea catchment: Identifying key actors in the water-ecosystem-energy-food nexus. Environ. Sci. Policy 2016, 66, 140–150. [Google Scholar] [CrossRef]
- Hu, X.; Ma, C.; Huang, P.; Guo, X. Ecological vulnerability assessment based on AHP-PSR method and analysis of its single parameter sensitivity and spatial autocorrelation for ecological protection—A case of Weifang City, China. Ecol. Indic. 2021, 125, 107464. [Google Scholar] [CrossRef]
- Garcia, D.J.; Lovett, B.M.; You, F. Considering agricultural wastes and ecosystem services in Food-Energy-Water-Waste Nexus system design. J. Clean. Prod. 2019, 228, 941–955. [Google Scholar] [CrossRef]
- Kattelus, M.; Rahaman, M.M.; Varis, O. Myanmar under reform: Emerging pressures on water, energy and food security. Nat. Resour. Forum 2014, 38, 85–98. [Google Scholar] [CrossRef]
- Radmehr, R.; Ghorbani, M.; Ziaei, A.N. Quantifying and managing the water-energy-food nexus in dry regions food insecurity: New methods and evidence. Agric. Water Manag. 2021, 245, 106588. [Google Scholar] [CrossRef]
- Endo, A.; Tsurita, I.; Burnett, K.; Orencio, P.M. A review of the current state of research on the water, energy, and food nexus. J. Hydrol. -Reg. Stud. 2017, 11, 20–30. [Google Scholar] [CrossRef]
- Hák, T.; Janoušková, S.; Moldan, B. Sustainable Development Goals: A need for relevant indicators. Ecol. Indic. 2016, 60, 565–573. [Google Scholar] [CrossRef]
- Cheng, Y.; Wang, J.; Shu, K. The coupling and coordination assessment of food-water-energy systems in China based on sustainable development goals. Sustain. Prod. Consum. 2023, 35, 338–348. [Google Scholar] [CrossRef]
- Janouskova, S.; Hak, T.; Moldan, B. Global SDGs Assessments: Helping or Confusing Indicators? Sustainability 2018, 10, 1540. [Google Scholar] [CrossRef]
- Vogliano, C.; Murray, L.; Coad, J.; Wham, C.; Maelaua, J.; Kafa, R.; Burlingame, B. Progress towards SDG 2: Zero hunger in melanesia—A state of data scoping review. Glob. Food Secur.-Agric. Policy Econ. Environ. 2021, 29, 100519. [Google Scholar] [CrossRef]
- Kh’ng, X.Y.; Teh, S.Y.; Koh, H.L.; Shuib, S. Sea level rise undermines SDG2 and SDG6 in Pantai Acheh, Penang, Malaysia. J. Coast. Conserv. 2021, 25, 9. [Google Scholar] [CrossRef]
- Nkiaka, E.; Bryant, R.G.; Okumah, M.; Gomo, F.F. Water security in sub-Saharan Africa: Understanding the status of sustainable development goal 6. Wiley Interdiscip. Rev.-Water 2021, 8, e1552. [Google Scholar] [CrossRef]
- Berger, M.; Campos, J.; Carolli, M.; Dantas, I.; Forin, S.; Kosatica, E.; Kramer, A.; Mikosch, N.; Nouri, H.; Schlattmann, A.; et al. Advancing the Water Footprint into an Instrument to Support Achieving the SDGs—Recommendations from the “Water as a Global Resources” Research Initiative (GRoW). Water Resour. Manag. 2021, 35, 1291–1298. [Google Scholar] [CrossRef]
- Wang, S.; Yin, C.; Yang, X.; Richel, A. Barter mode: The institutional innovation for affordable and clean energy (SDG7) in rural China. Biomass Bioenergy 2023, 170, 106725. [Google Scholar] [CrossRef]
- Reyers, B.; Selig, E.R. Global targets that reveal the social-ecological interdependencies of sustainable development. Nat. Ecol. Evol. 2020, 4, 1011–1019. [Google Scholar] [CrossRef] [PubMed]
- Luan, J.; Liu, D. Analysis of the Affecting Factors of Vegetation Index Change in the Upper Reach of Hanjiang River Basin. J. North China Univ. Water Resour. Electr. Power 2019, 40, 46–54. [Google Scholar]
- Wei, X.; Liu, D. Analysis on the Change Law of Socioeconomy-Ecology-Hydrology in the Upper Basins of Huangjin Gorge in Hanjiang River. J. North China Univ. Water Resour. Electr. Power 2019, 40, 39–47+88. [Google Scholar]
- Zhao, X.; Liu, D.; Wei, X.; Ma, L.; Lin, M.; Meng, X.; Huang, Q. Analysis of Socio-Hydrological Evolution Processes Based on a Modeling Approach in the Upper Reaches of the Han River in China. Water 2021, 13, 2458. [Google Scholar] [CrossRef]
- Wei, X.; Liu, D.; Luan, J. Analysis of the Changing Laws and Influencing Factors of Social and Economic Indicators in the Upper Reach of Han River Basin. Univers. J. Geosci. 2018, 6, 55–64. [Google Scholar] [CrossRef][Green Version]
- Sabater, M. ERA5-Land monthly averaged data from 1950 to present. Copernic. Clim. Change Serv. (C3S) Clim. Data Store (CDS) 2019, 13, 4349–4383. [Google Scholar] [CrossRef]
- Chen, F.H.; Dong, G.H.; Zhang, D.J.; Liu, X.Y.; Jia, X.; An, C.B.; Ma, M.M.; Xie, Y.W.; Barton, L.; Ren, X.Y.; et al. Agriculture facilitated permanent human occupation of the Tibetan Plateau after 3600 BP. Science 2015, 347, 248–250. [Google Scholar] [CrossRef] [PubMed]
- Yosef, A.; Shnaider, E.; Schneider, M.; Gurevich, M. Normalization of Large-Scale Transcriptome Data Using Heuristic Methods. Bioinform. Biol. Insights 2023, 17, 11779322231160397. [Google Scholar] [CrossRef] [PubMed]
- Wang, S.; Fu, D.; Chen, J.; Cai, F.; Zhang, X. Determination of Weights of Subjective Evaluation Indexes of Automobile Dynamic Performance Based on Entropy Method. J. Highw. Transp. Res. Dev. 2015, 32, 153–158. [Google Scholar]
- Li, Y. The differentiation degree measurement and weight design of index system based on entropy theory [D]. Ph.D. Thesis, Nanjing University of Aeronautics and Astronautics, Nanjing, China, 2009. [Google Scholar]
- Jiang, Y.; Wang, J.; Teng, H.; Li, H. Coupling coordination analysis of the quality evaluation of cultivated land and soil erosion in typical black soil areas using TOPSIS method. Trans. Chin. Soc. Agric. Eng. 2023, 39, 82–94. [Google Scholar]
- Zhang, L.; Li, L. Stand structure optimization and adjustment of natural forest in Changbai Mountains based on AHP-CRITIC combination weight method. J. Beijing For. Univ. 2023, 45, 74–83. [Google Scholar]
- Chen, X.; Li, X.; Wang, F.; Chen, W.; Liu, X. Research on the difference in eutrophication state and indicator threshold value determination among lakes in the Southern Jiangsu Province, China. Acta Ecol. Sin. 2014, 34, 390–399. [Google Scholar]
- Cong, X. Expression and Mathematical Property of Coupling Model, and Its Misuse in Geographical Science. Econ. Geogr. 2019, 39, 18–25. [Google Scholar]
- Huang, J.; Yu, G.; Hu, D. The integrated and coordinated development of agricultural modernization and agricultural insurance: A case study of Xinjiang. Res. Agric. Mod. 2019, 40, 197–205. [Google Scholar]
- Yan, X. Using ARIMA Model to Predict Green Area of Park. Comput. Sci. 2020, 47, 531–534+556. [Google Scholar]
- Yang, H.; Zhao, X.; Wang, L. Review of Data Normalization Methods. Comput. Eng. Appl. 2023, 59, 13–22. [Google Scholar] [CrossRef]
- Xian, W.; Zhang, S.; Qiu, T. Emergy Evaluation of the Ecological Impacts of Hydropower Stations on the Tibetan Plateau. J. Hydroecology 2023, 44, 1–9. [Google Scholar]
- Wang, B. Study on the comprehensive quality evaluation and coupled coordination relationship of soil and water resources in Heilonggang area. Ph.D. Thesis, Chinese Academy of Geological Sciences, Beijing, China, 2012. [Google Scholar]
- Yao, L.; Li, X.; Li, Q.; Wang, J. Temporal and Spatial Changes in Coupling and Coordinating Degree of New Urbanization and Ecological-Environmental Stress in China. Sustainability 2019, 11, 1171. [Google Scholar] [CrossRef]
- Mu, L.; Zheng, F.; Tao, R.; Zhang, Q.; Kapelan, Z. Hourly and Daily Urban Water Demand Predictions Using a Long Short-Term Memory Based Model. J. Water Resour. Plan. Manag. 2020, 146, 05020017. [Google Scholar] [CrossRef]


| Goal | System | Connotation | Original Indicators | Methods | Transformed Indicators |
|---|---|---|---|---|---|
| Goal 6 | Water | Ensuring security of water supply | 6.1.1 Proportion of population using safely managed drinking water services | E | Residential water consumption |
| E | Per capita water consumption | ||||
| 6.4.2 Level of water stress: freshwater withdrawal as a proportion of available freshwater resources | M | Annual precipitation | |||
| M | Total water resources | ||||
| 6.3.2 Proportion of bodies of water with good ambient water quality | A | Total water usage | |||
| Improving water-use efficiency | 6.5.1 Degree of implementation of integrated water resource management | M | Average acre-foot water use for irrigated farmland | ||
| 6.4.1 Change in water-use efficiency over time | A | Water consumption per 10,000 GDP | |||
| Improving water quality | 6.3.1 Proportion of domestic and industrial wastewater flows that are safely treated | A | Centralized wastewater treatment plant rate | ||
| A | Industrial wastewater emissions | ||||
| Goal 7 | Energy | Optimizing the energy mix | 7.1.1 Proportion of population with access to electricity | M | Night light data |
| E | Energy consumption | ||||
| E | Electricity consumption | ||||
| Improving energy efficiency | 7.2.1 Renewable energy share in the total final energy consumption | E | Energy consumption | ||
| E | Energy utilization efficiency | ||||
| 7.3.1 Energy intensity measured in terms of primary energy and GDP | E | Per capita GDP | |||
| A | Gross output value of agriculture, forestry, livestock, and fisheries | ||||
| A | Gross domestic production | ||||
| E | Per capita net income of rural residents | ||||
| M | Comprehensive utilization rate of general industrial solid waste | ||||
| Goal 2 | Food | Increasing food production | 2.1.2 Prevalence of moderate or severe food insecurity in the population based on the Food Insecurity Experience Scale | M | Food production |
| M | Pesticide usage | ||||
| A | Area affected by crops | ||||
| E | Agricultural fertilizer use | ||||
| Improving food productivity | 2.4.1 Proportion of agricultural area under productive and sustainable agricultural use | M | Area sown for food | ||
| E | Cropland irrigated area | ||||
| E | Engel’s coefficient for rural inhabitants | ||||
| 2.3.1 Volume of production per labor unit by class of farming/pastoral/forestry enterprise size | E | Gross power of agricultural machinery | |||
| M | Total value of primary sector | ||||
| M | Food production per capita | ||||
| Goal 15 | Ecology | Conservation of biodiversity | 15.1.2 Proportion of total water resources used, annual change in forest area, and land under cultivation | M | Zooplankton density |
| M | Zooplankton biomass | ||||
| M | Dominant species | ||||
| A | Shannon–Wiener index | ||||
| A | Species richness index | ||||
| A | Species evenness index | ||||
| 15.4.1 [Indicator of the conservation of mountain ecosystems]—to be developed | E | Yearly average temperature | |||
| E | NDVI | ||||
| Curbing biodiversity loss | 15.5.1 Red List Index | M | Chemical Composite Pollution Index | ||
| E | Degree of variability in river flow processes |
| Interval of D-Values for Coupling Coordination | Harmonization Levels | Degree of Coupling Harmonization |
|---|---|---|
| 0.0–0.2 | 1 | Severe disorder |
| 0.2–0.4 | 2 | Mild disorder |
| 0.4–0.6 | 3 | General coordination |
| 0.6–0.8 | 4 | Medium coordination |
| 0.8–1.0 | 5 | High-quality coordination |
| Standardized Layer | Indicator Layer | Wj1 | Wj2 | Wj | Directions | Units |
|---|---|---|---|---|---|---|
| Water (Goal 6) | Precipitation | 0.1225 | 0.0794 | 0.1010 | + | mm |
| Total water resources | 0.1300 | 0.0756 | 0.1028 | + | billion m3 | |
| Residential water consumption | 0.0872 | 0.1021 | 0.0947 | − | billion m3 | |
| Water consumption per capita | 0.2268 | 0.1268 | 0.1768 | − | m3/person | |
| Water consumption per 10,000 GDP | 0.0962 | 0.1413 | 0.1188 | − | m3/10,000 yuan | |
| Average acre-foot water use for irrigated farmland | 0.0382 | 0.0793 | 0.0588 | − | m3/acre | |
| Centralized wastewater treatment plant rate | 0.0715 | 0.1263 | 0.0989 | + | % | |
| Industrial wastewater emissions | 0.1299 | 0.1335 | 0.1317 | − | 10 kt | |
| Total water consumption | 0.0977 | 0.1356 | 0.1167 | − | billion m3 | |
| Energy (Goal 7) | Gross domestic production | 0.1532 | 0.0918 | 0.1225 | + | 108 CNY |
| Gross output value of agriculture, forestry, livestock, and fisheries | 0.1455 | 0.0883 | 0.1169 | + | 104 CNY | |
| Per capita GDP | 0.1489 | 0.1053 | 0.1271 | + | CNY | |
| Per capita net income for rural residents | 0.1833 | 0.0905 | 0.1369 | + | CNY | |
| Nighttime lighting data | 0.031 | 0.074 | 0.0525 | + | — | |
| Energy consumption | 0.0783 | 0.1628 | 0.1206 | − | million tons of coal equivalents | |
| Energy efficiency | 0.0963 | 0.136 | 0.1162 | + | tons of coal equivalents/10 yuan | |
| Electricity consumption | 0.1077 | 0.1751 | 0.1414 | − | kw·h | |
| Comprehensive utilization rate of general industrial solid waste | 0.0558 | 0.0761 | 0.0660 | + | % | |
| Food (Goal 2) | Total power of agricultural machinery | 0.106 | 0.1104 | 0.1082 | + | W·kW |
| Food production | 0.0704 | 0.0684 | 0.0694 | + | 10 kt | |
| Food production per capita | 0.0597 | 0.1032 | 0.0815 | + | kg/person | |
| Total value of primary industry | 0.1535 | 0.1216 | 0.1376 | + | 108 CNY | |
| Agricultural fertilizer applications | 0.1208 | 0.1103 | 0.1156 | − | 10 KT | |
| Pesticide usage | 0.1292 | 0.1128 | 0.1210 | − | t | |
| Food cultivation area | 0.1101 | 0.0671 | 0.0886 | + | k·hm2 | |
| Irrigated area of cultivated land | 0.1101 | 0.0671 | 0.0886 | + | k·hm2 | |
| Engel’s coefficient for rural residents | 0.0903 | 0.1317 | 0.1110 | − | % | |
| Crop-affected area | 0.0498 | 0.1074 | 0.0786 | − | k·hm2 | |
| Ecosystem (Goal 15) | Average temperature per year | 0.3841 | 0.3850 | 0.3846 | + | °C |
| NDVI | 0.3434 | 0.3031 | 0.3233 | + | — | |
| Degree of variability in river flow processes | 0.2725 | 0.3019 | 0.2872 | − | — |
| Subsystem Comparison | Comparison Coefficient | Comparison of Association Types |
|---|---|---|
| Water system, energy system | SDG6/SDG7 < 0.6 | Extreme water impairment energy development mode |
| 0.6 ≤ SDG6/SDG7 < 0.8 | Severe water impairment energy development mode | |
| 0.8 ≤ SDG6/SDG7 < 1 | Water supply scarcity energy development mode | |
| 1 ≤ SDG6/SDG7 < 1.5 | Adequate water supply energy development mode | |
| 1.5 ≤ SDG6/SDG7 | Particularly abundant water resources energy development mode | |
| Water system, food system | SDG6/SDG2 < 0.6 | Extreme water impairment food development mode |
| 0.6 ≤ SDG6/SDG2 < 0.8 | Severe water resource impairment food development mode | |
| 0.8 ≤ SDG6/SDG2 < 1 | Water supply scarcity food development mode | |
| 1 ≤ SDG6/SDG2 < 1.5 | Adequate water supply food development mode | |
| 1.5 ≤ SDG6/SDG2 | Particularly water sufficient food development mode | |
| Water system, ecosystem | SDG6/SDG15 < 0.6 | Extreme water impairment eco-development mode |
| 0.6 ≤ SDG6/SDG15 < 0.8 | Severe water impairment eco-development mode | |
| 0.8 ≤ SDG6/SDG15 < 1 | Water supply shortage eco-development mode | |
| 1 ≤ SDG6/SDG15 < 1.5 | Water resource adequacy eco-development mode | |
| 1.5 ≤ SDG6/SDG15 | Particularly water sufficient eco-development mode | |
| Energy system, food system | SDG7/SDG2 < 0.6 | Extreme energy impairment food development mode |
| 0.6 ≤ SDG7/SDG2 < 0.8 | Severe energy impairment food development mode | |
| 0.8 ≤ SDG7/SDG2 < 1 | Energy supply shortage food development mode | |
| 1 ≤ SDG7/SDG2 < 1.5 | Adequate energy supply food development mode | |
| 1.5 ≤ SDG7/SDG2 | Particularly energy sufficient food development mode | |
| Energy system, ecosystem | SDG7/SDG15 < 0.6 | Extreme energy impairment eco-development mode |
| 0.6 ≤ SDG7/SDG15 < 0.8 | Severe energy impairment eco-development mode | |
| 0.8 ≤ SDG7/SDG15 < 1 | Energy supply shortage eco-development mode | |
| 1 ≤ SDG7/SDG15 < 1.5 | Energy resource adequacy eco-development mode | |
| 1.5 ≤ SDG7/SDG15 | Particularly energy sufficient eco-development mode | |
| Food system, ecosystem | SDG2/SDG15 < 0.6 | Extreme food impairment eco-development mode |
| 0.6 ≤ SDG2/SDG15 < 0.8 | Severe food impairment eco-development mode | |
| 0.8 ≤ SDG2/SDG15 < 1 | Food supply shortage eco-development mode | |
| 1 ≤ SDG2/SDG15 < 1.5 | Food resource adequacy eco-development mode | |
| 1.5 ≤ SDG2/SDG15 | Particularly food sufficient eco-development mode |
Disclaimer/Publisher’s Note: The statements, opinions and data contained in all publications are solely those of the individual author(s) and contributor(s) and not of MDPI and/or the editor(s). MDPI and/or the editor(s) disclaim responsibility for any injury to people or property resulting from any ideas, methods, instructions or products referred to in the content. |
© 2024 by the authors. Licensee MDPI, Basel, Switzerland. This article is an open access article distributed under the terms and conditions of the Creative Commons Attribution (CC BY) license (https://creativecommons.org/licenses/by/4.0/).
Share and Cite
Fu, N.; Liu, D.; Liu, H.; Pan, B.; Ming, G.; Huang, Q. Evaluation of the Coupled Coordination of the Water–Energy–Food–Ecology System Based on the Sustainable Development Goals in the Upper Han River of China. Agronomy 2024, 14, 706. https://doi.org/10.3390/agronomy14040706
Fu N, Liu D, Liu H, Pan B, Ming G, Huang Q. Evaluation of the Coupled Coordination of the Water–Energy–Food–Ecology System Based on the Sustainable Development Goals in the Upper Han River of China. Agronomy. 2024; 14(4):706. https://doi.org/10.3390/agronomy14040706
Chicago/Turabian StyleFu, Nan, Dengfeng Liu, Hui Liu, Baozhu Pan, Guanghui Ming, and Qiang Huang. 2024. "Evaluation of the Coupled Coordination of the Water–Energy–Food–Ecology System Based on the Sustainable Development Goals in the Upper Han River of China" Agronomy 14, no. 4: 706. https://doi.org/10.3390/agronomy14040706
APA StyleFu, N., Liu, D., Liu, H., Pan, B., Ming, G., & Huang, Q. (2024). Evaluation of the Coupled Coordination of the Water–Energy–Food–Ecology System Based on the Sustainable Development Goals in the Upper Han River of China. Agronomy, 14(4), 706. https://doi.org/10.3390/agronomy14040706