Article

ODN-Pro: An Improved Model Based on YOLOv8 for Enhanced Instance Detection in Orchard Point Clouds

College of Engineering, South China Agriculture University, Guangzhou 510070, China
*
Authors to whom correspondence should be addressed.
These authors contributed equally to this work.
Agronomy 2024, 14(4), 697; https://doi.org/10.3390/agronomy14040697
Submission received: 26 February 2024 / Revised: 24 March 2024 / Accepted: 26 March 2024 / Published: 28 March 2024
(This article belongs to the Section Precision and Digital Agriculture)

Abstract

:
In an unmanned orchard, various tasks such as seeding, irrigation, health monitoring, and harvesting of crops are carried out by unmanned vehicles. These vehicles need to be able to distinguish which objects are fruit trees and which are not, rather than relying on human guidance. To address this need, this study proposes an efficient and robust method for fruit tree detection in orchard point cloud maps. Feature extraction is performed on the 3D point cloud to form a two-dimensional feature vector containing three-dimensional information of the point cloud and the tree target is detected through the customized deep learning network. The impact of various feature extraction methods such as average height, density, PCA, VFH, and CVFH on the detection accuracy of the network is compared in this study. The most effective feature extraction method for the detection of tree point cloud objects is determined. The ECA attention module and the EVC feature pyramid structure are introduced into the YOLOv8 network. The experimental results show that the deep learning network improves the precision, recall, and mean average precision by 1.5%, 0.9%, and 1.2%, respectively. The proposed framework is deployed in unmanned orchards for field testing. The experimental results demonstrate that the framework can accurately identify tree targets in orchard point cloud maps, meeting the requirements for constructing semantic orchard maps.

1. Introduction

According to the latest statistics from China’s Ministry of Agriculture and Rural Development, China’s total agricultural area is about 1.35 billion mu (approximately 90 million hectares) [1,2,3,4,5]. Among the many crops grown, apples, citrus (e.g., oranges and tangerines), pears, peaches, and walnuts have the largest acreage, with apple orchards covering about 2.2 million hectares with an annual output of about 41 million tons and citrus fruits growing on about 2.3 million hectares [6,7]. This data highlights the importance of fruit tree cultivation in China’s agricultural industry [1,8,9,10]. However, current robotic technologies still face challenges in their application on large-scale farms, mainly due to their over-reliance on manual control, which is inefficient and labor-intensive [11]. If an autonomous vehicle seeks to navigate independently across diverse orchard types, such as unmanned and precision agriculture orchards, a significant bottleneck hindering robotic autonomy and automation within these settings is their lack of human-like intuition in understanding and perceiving objects within point cloud maps [12,13]. Consequently, there is a pressing need to devise methodologies that enhance robots’ perceptual capabilities in orchard point cloud maps [14,15,16].
In tree instance detection methods, there are primarily three approaches: analysis based on remote sensing technology, machine vision recognition methods, and LiDAR technology. In recent years, hyperspectral imaging technology has been widely applied in tree detection. For instance, Jane [17] successfully differentiated trees from other land cover types by analyzing hyperspectral images and identifying the high reflectance characteristics of vegetation in the near-infrared band. However, these methods often require complex preprocessing steps, cannot meet the requirements of real-time mapping in autonomous driving, and are limited by data availability. With the advancement in computer vision technology, deep learning methods, particularly convolutional neural networks (CNNs), have become powerful tools for detecting objects in images. Object detection models like YOLO have been applied by Chen [18] and Wang [19] to directly detect the positions of trees from aerial images. Cao [20] used YOLOv7 for tree-shaped object detection and achieved semantic segmentation of trees. Kenta [21] employed a 360° camera and YOLOv2 for tree detection and real-time digital mapping. These deep learning methods have demonstrated superior performance in handling large-scale datasets but training these models requires a significant amount of annotated data. Additionally, visual recognition is susceptible to various environmental interferences such as lighting conditions, visibility, and blurring during platform movement, leading to weak generalization ability [22,23,24,25,26,27].
LiDAR technology provides an effective means of capturing three-dimensional information of the Earth’s surface and objects [28,29,30,31,32]. Currently, there are two main types of classification networks specialized in using point cloud data for object detection.
The first method directly utilizes three-dimensional point cloud data. Although this method does not suffer from information loss, the computational cost is often high due to the complexity of 3D data [33]. For example, Luke [34] identified trees from LiDAR data by constructing a canopy height model (CHM), which accurately measures tree height and volume. Point cloud classification further expands the application of LiDAR data. John [35] classified point clouds, accurately distinguishing trees from building roof models. Guan [36] achieved accurate tree classification by combining LiDAR data with deep learning. LiDAR data analysis provides high-precision tree detection capabilities but direct processing of 3D point clouds is computationally complex and cannot be effectively used on mobile platforms with limited computing power.
The second type of method reduces computational complexity by processing point clouds into two-dimensional data. There are several methods for processing point clouds into two-dimensional data. The method of Jansen [37] is to represent the 3D point cloud by using several 2D perspective views. In the data preprocessing stage, point cloud images are captured from 64 different angles with the image center as the origin, rotating at a fixed radius. This approach helps reduce information loss to some extent by introducing additional rotations to the scene and utilizing multiple instances in the classification process. Others, like Li [38], project the point cloud onto a cylinder and represent it as a two-dimensional point map to retain as much information as possible. They utilize a single two-dimensional end-to-end fully convolutional network to simultaneously predict object confidence and bounding boxes.
Similar to the approach described in this article, BirdNet+ [39] is an enhancement of the object detection framework BirdNet [40]. BirdNet+ offers an end-to-end solution for 3D object detection based on LiDAR data. It utilizes a bird’s-eye view representation, a 2D structure with three channels converted from LiDAR point clouds, and employs a two-stage architecture to obtain 3D-oriented boxes.
However, this method is designed for detecting single-frame LiDAR point clouds. Single-frame LiDAR point clouds are sparse and cover a large range, resulting in numerous empty pixels and few target pixels in the extracted two-dimensional feature view. Consequently, the second-stage network detection component may encounter unnecessary performance losses while processing empty pixels. Moreover, sparse target pixels may lead to reduced accuracy in detecting small objects. These limitations render this method unsuitable for testing on tree objects in orchard point cloud maps.
In our previous work [
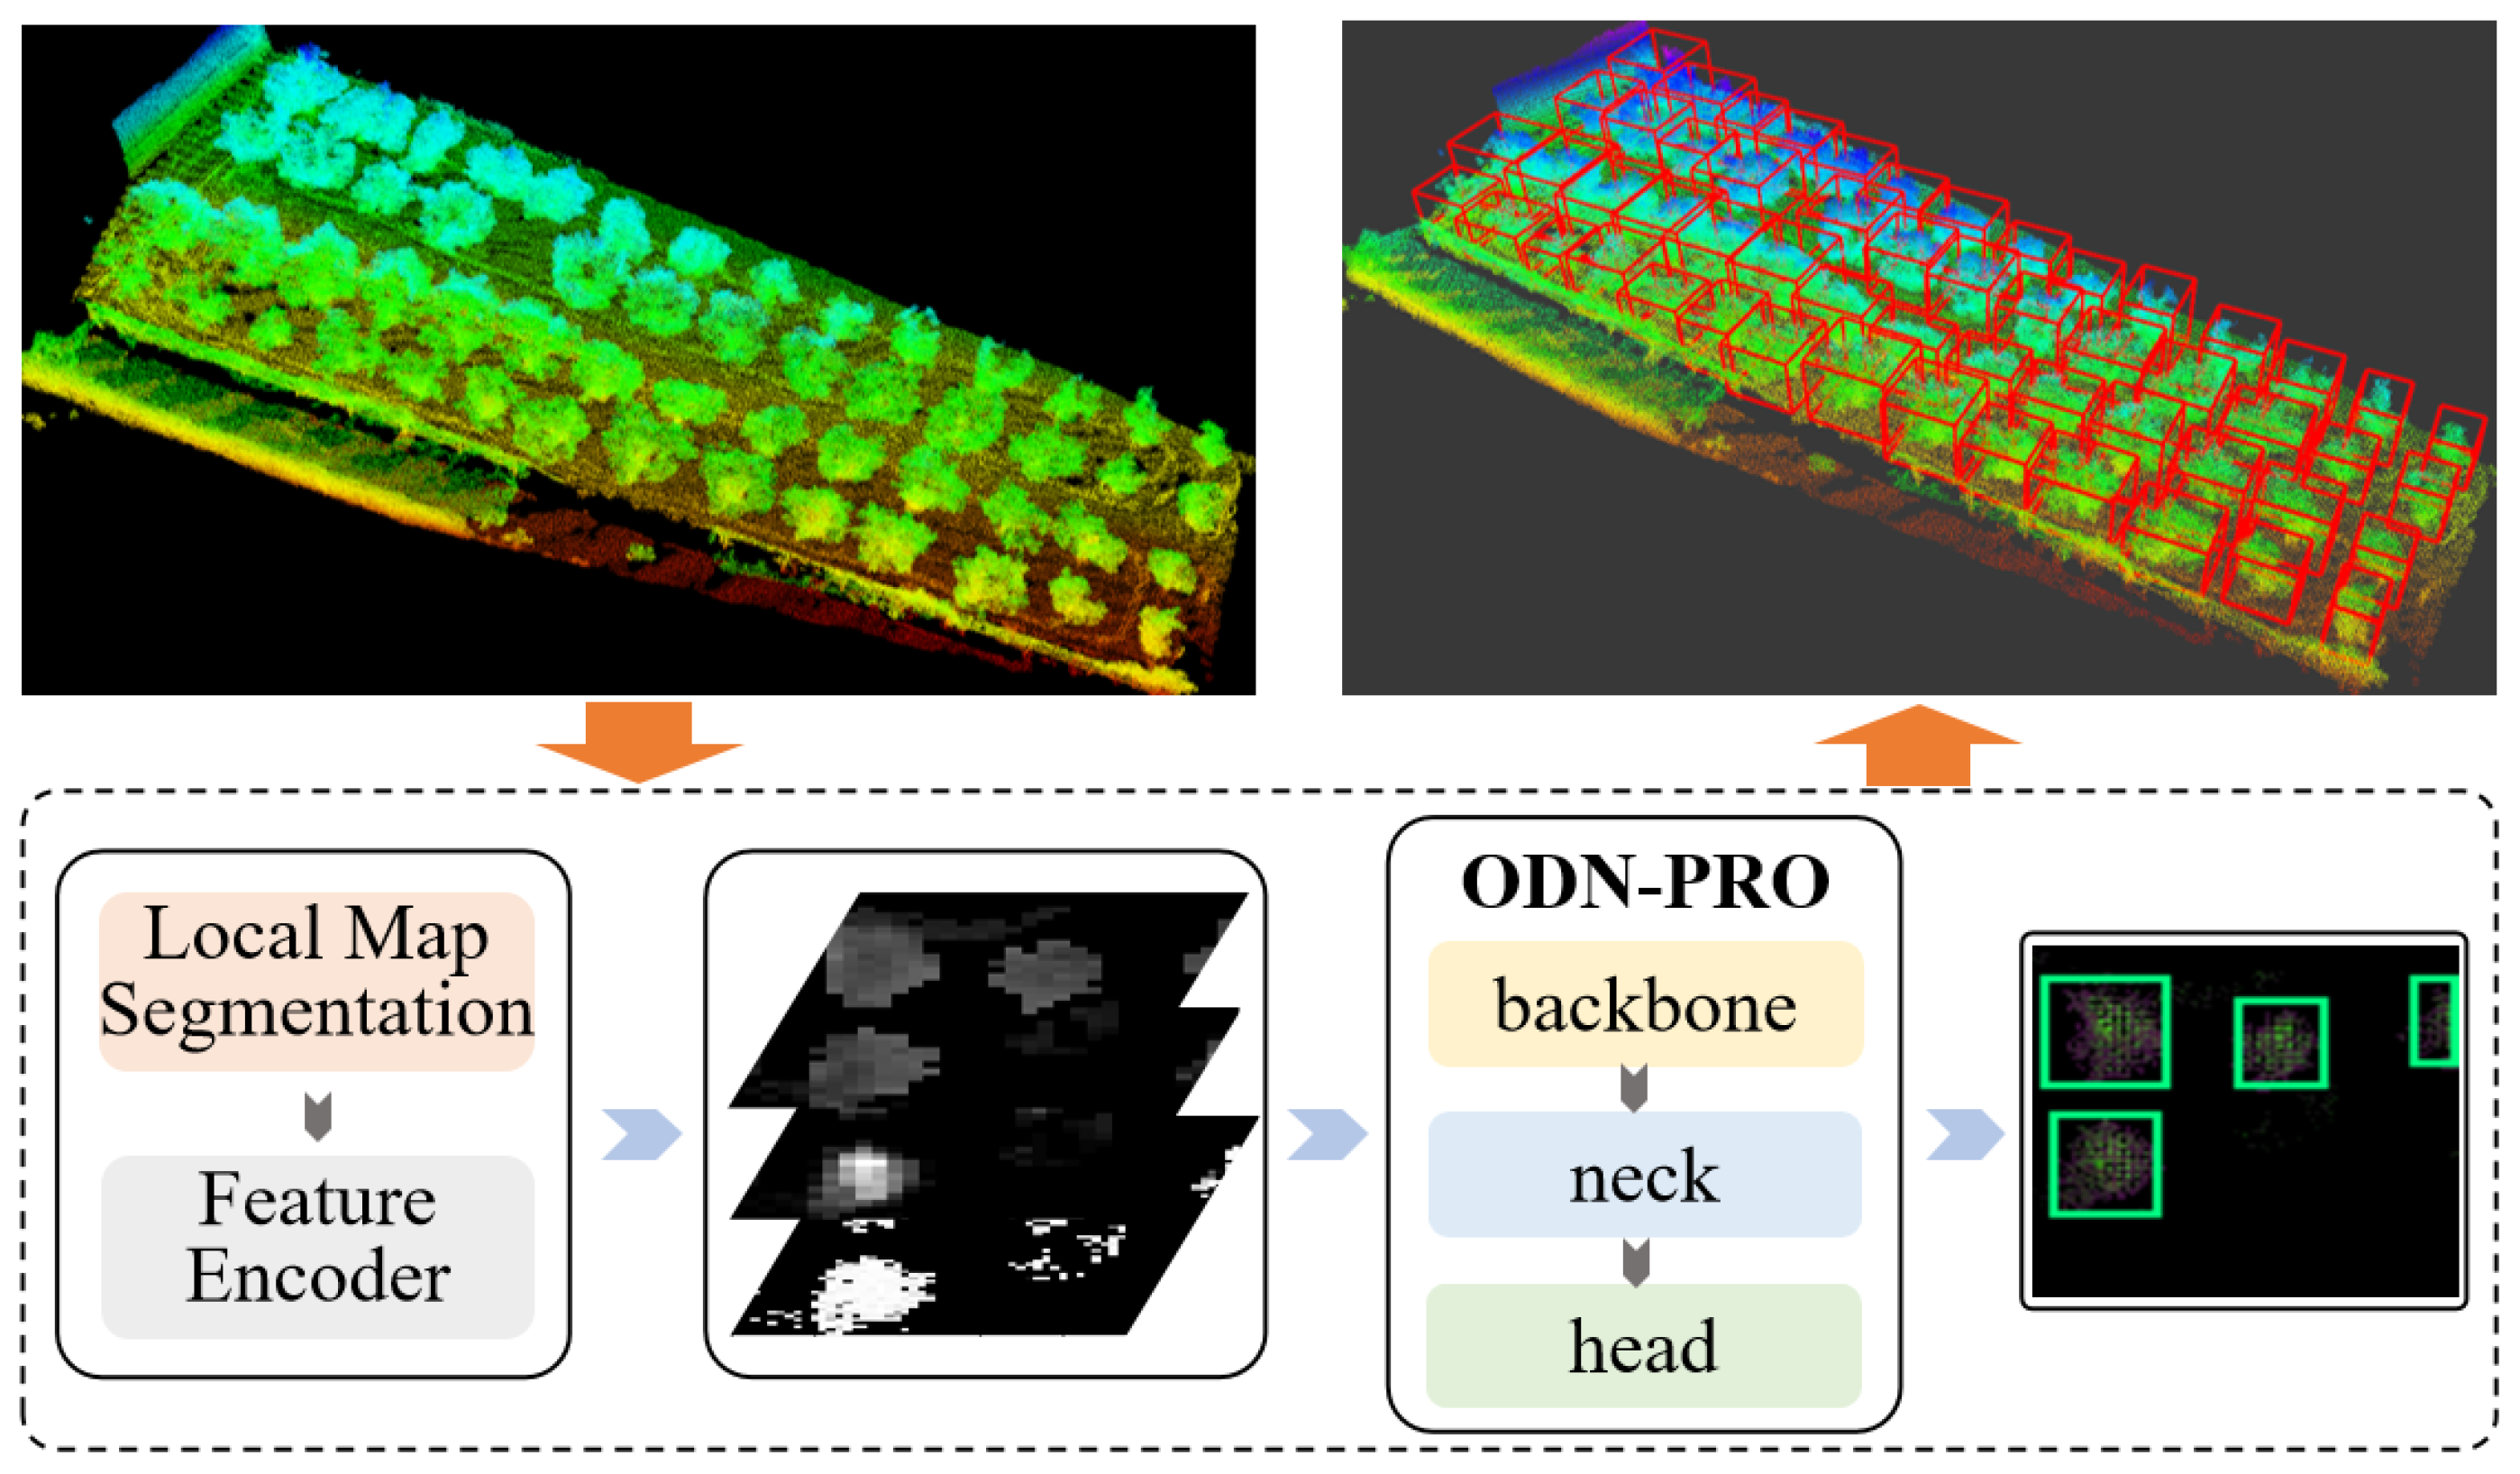
41], we introduced a method for detecting modeled point cloud maps. To further enhance the robot’s ability to perceive tree instances in orchard maps, this study proposes an improved method. Our method focuses on extracting local graphs from orchard point cloud maps to tackle challenges arising from the abundance of empty pixels and sparse target pixels in the two-dimensional feature views derived from large-scale laser point cloud frames. By directly detecting tree point clouds following orchard modeling, we mitigate clustering errors in target prediction frames generated from single-frame laser point clouds. The contributions of this study are outlined as follows:
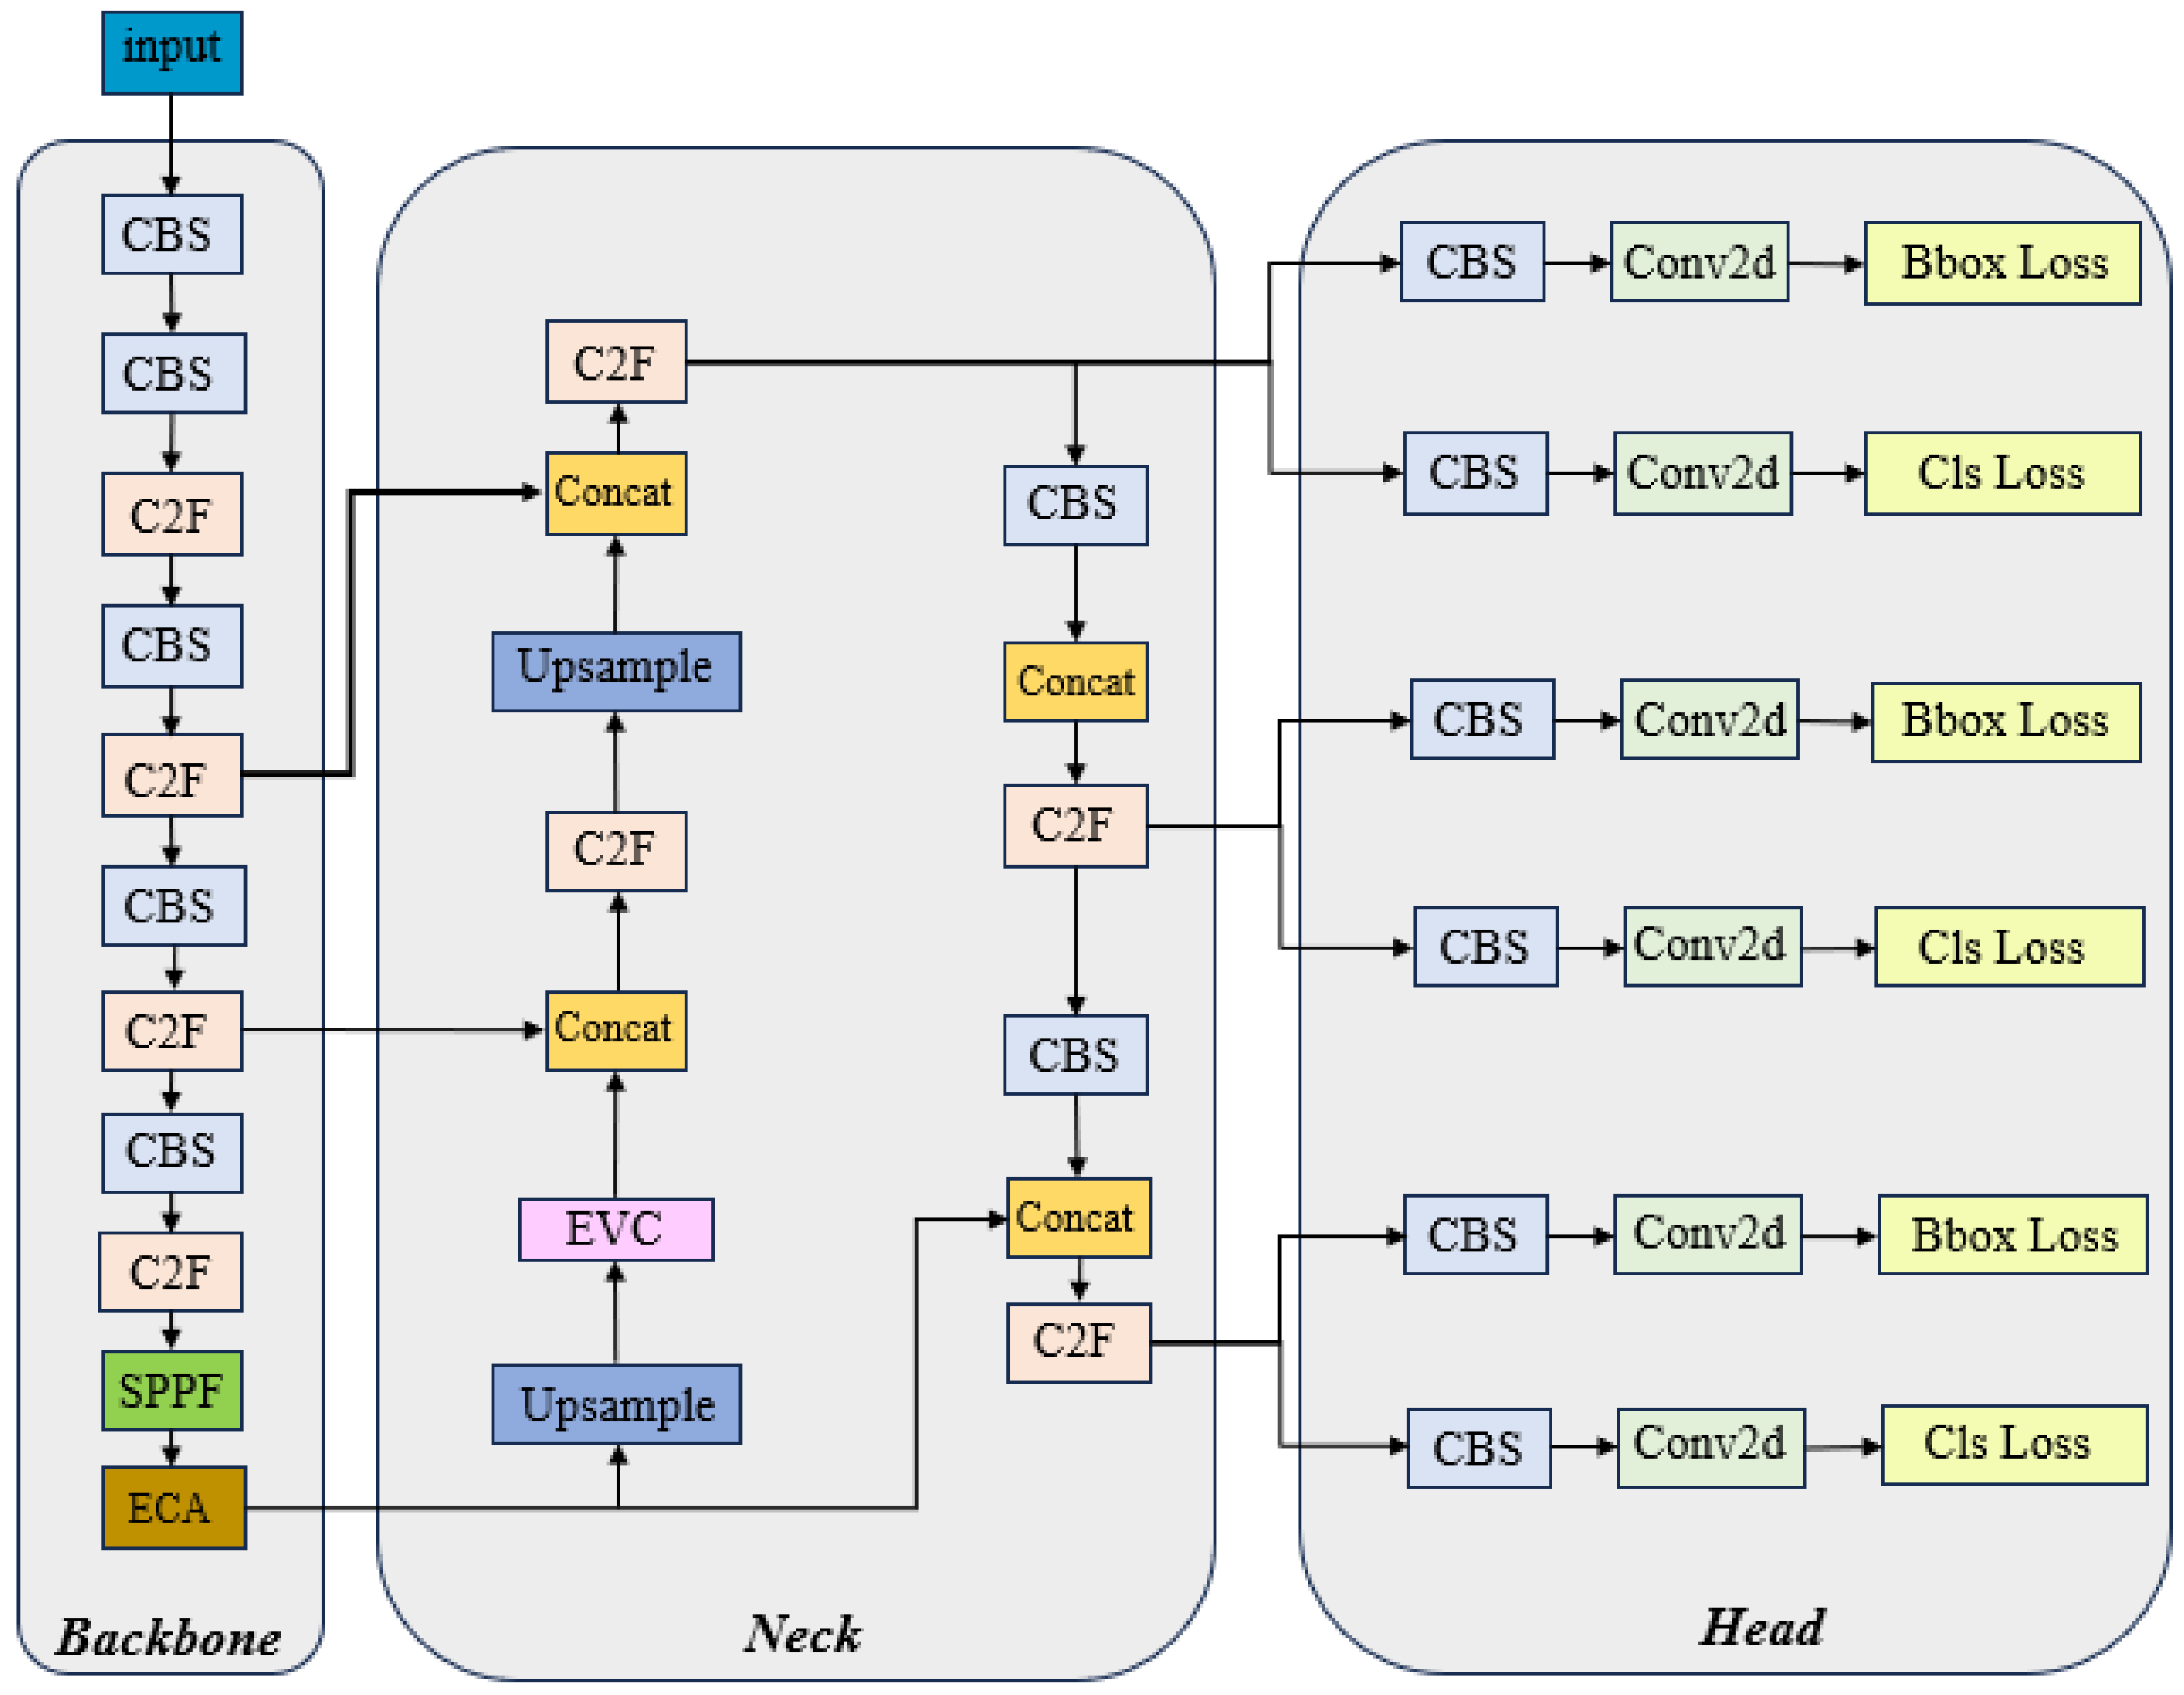
  • An improved end-to-end orchard point cloud object detection framework called ODN-Pro has been proposed;
  • Testing of multiple feature extraction methods to determine which feature extraction layer is best for network detection;
  • Testing of multiple deep learning network components for the optimal feature extraction method to obtain the optimal detection effect.

2. Materials and Methods

2.1. Data Acquisition

Due to the structural similarities between other types of arboreal orchards and fruit orchards, we added other types of orchards to enhance the model’s generalization capability. The data collection comprised three orchards: a lychee orchard and two tree orchards at South China Agricultural University in Guangzhou, Guangdong, China, as shown in Figure 1. The plants in these orchards are in the growth period of their phenological stages, with sizes and spacing typically ranging from 2 to 3 m. The primary soil type is red soil. The terrain is primarily hilly, with significant undulations. The local climate falls under the subtropical monsoon climate category, characterized by hot and humid summers, mild and dry winters, abundant annual precipitation, ample sunshine, and favorable conditions for plant growth. Proper management practices are required for these orchards, including regular pruning, weeding, and fertilizing, to maintain healthy plant growth and ensure good yields. The AGX-HUNTER was employed as a mobile platform (as depicted in Figure 2) to gather sensor data using a ring 32-line LiDAR, RS-Helios-5515 (RoboSense, Shenzhen, China), and a 9-axis IMU (HIPNUC, Guangzhou, China) sensor, with the data saved in rosbag format. Rosbag is a command-line tool and a set of APIs in the Robot Operating System (ROS) for recording and replaying ROS message data. The RS-Helios-5515 collected data at 10 Hz, while the 9-axis IMU collected data at 400 Hz. To ensure thorough scanning, the mobile platform was manually controlled to traverse each row in the orchard and return to the starting point to close the loop.
Subsequent to running the rosbag, the single-frame LiDAR data and IMU data were utilized as inputs to the LIO-SAM algorithm [42] to generate global point cloud maps of the orchards. Furthermore, a solid-state-like LiDAR was employed for data acquisition to enhance the proposed method’s compatibility with different types of LiDAR. LiDAR frames were obtained using the Livox-Avia LiDAR (Livox Technology, Shenzhen, China), with IMU data from Livox-Avia’s built-in 200 Hz six-axis IMU and color image data from the Realsense-D435 (Intel RealSense, Santa Clara, CA, USA). Color mapping was executed using R3LIVE [43]. Through the use of LIO-SAM and R3LIVE, we ultimately generated three orchard point cloud maps in XYZD and three in XYZRGB formats. These maps were then segmented into local point cloud maps for the model training and inference. For each global point cloud map, points were randomly generated within the map, considered as the center of the local maps, and segmented. Ultimately, we extracted 100 local maps from each point cloud map, resulting in a total of 600 local point cloud maps.

2.2. Data Augmentation

Data diversity contributes to better model robustness. To enhance the robustness and generalization of the model, this study employs data augmentation on the training dataset to improve the learning process. Various techniques are applied to the point cloud dataset, including the following:
  • Random Point Sampling: We utilized the Random Sample Consensus (RANSAC) filter from the Point Cloud Library (PCL) to retain a fixed number of 100,000 points from the original dataset. This quantity was determined by statistically analyzing the average number of points in local maps. By applying this technique, we aim for the model to perform well even in cases of incomplete modeling;
  • Random Point Cloud Transformation: We apply a two-step random transformation process to the point cloud. Initially, we rotate the point cloud by a random angle α , β , and γ along the X, Y, and Z axes, respectively, where α , β , and γ are chosen uniformly from the range [ π / 6 , π / 6 ] . Subsequently, we scale the point cloud by a random factor s, selected from the range [0.75, 1], to alter its size. This procedure aims to enhance the robustness of the model against variations in object orientation and scale;
  • Point Cloud Clipping: To simulate the effect of partial visibility and occlusions, we randomly clip sections of the point cloud. A virtual clipping plane is defined by a random normal vector and a distance from the origin, both of which are selected based on a uniform distribution. This clipping plane then intersects the point cloud and points on one side of the plane (chosen randomly) are discarded. This technique mimics realworld scenarios where entire objects are seldom fully captured;
  • Noise Addition: To mimic the inaccuracies inherent in realworld data collection, we introduce Gaussian noise to the point cloud by adding 1000 noise points. These noise points are generated from a Gaussian distribution with a mean μ = 0 and a standard deviation σ , specifically applied as 1% of each point’s distance from the point cloud’s center. This process of adding noise points simulates the sensor inaccuracies and environmental factors that affect data quality.
These methods diversify the data, enhancing the effectiveness of the learning process and contributing to improved model robustness and generalization. The visualization of data augmentation is depicted in Figure 3. We applied the above enhancement methods to each local map in the dataset. In the end, we obtained 3000 enhanced local maps.

2.3. Methodology

2.3.1. System Overview

The orchard point cloud instance detection framework proposed in this study is illustrated in Figure 4, which displays the process of detecting tree instances in a lychee orchard’s global point cloud map. This framework directly takes the global point cloud map of the orchard as input, segments the global map into local maps, and extracts information through the feature extractor designed in this study. This information forms a feature map that serves as the input for the ODN-PRO model based on YOLOv8. The network model perceives tree information in the information feature map and projects the prediction boxes onto the three-dimensional global point cloud map, thereby achieving the perception and localization of tree instance objects.

2.3.2. Feature Encoder

To process point cloud information using a 2D detection network, it is necessary to pseudo-2Dize the point cloud, as shown in Figure 5. This process entails viewing the point cloud from a directly overhead perspective and creating an x–y plane that is evenly subdivided into a grid [44]. Within each grid cell, a cylindrical structure is created in the z-direction to accommodate the point cloud data associated with local geometric features.
The metrics for geometric features include barycenter height ( Z ¯ ), density ( ρ ), and the minimum angle θ between the main vector and the z-axis. During this process, we filter out grids with very few points and empty grids. In this study, grids with fewer than 100 points were excluded. After these operations, we transform a 3D point cloud map into a 2D pseudo image suitable for a 2D detection network. The calculation of the mentioned metrics is as follows:
Z ¯ = 1 n i = 1 n Z i
Here, Z ¯ represents the average Z value, Z i represents the Z value of the i-th point, and n is the total number of points in the same grid.
ρ = V grid n
Here, V grid represents the volume of the grid and n is defined the same as in Equation (1), representing the number of point cloud points in the same grid.
The minimum angle θ between the lines containing these vectors is given by
θ = min arccos ( cos ( α ) ) , π arccos ( cos ( α ) )
where α is the angle between the vectors, v 1 is the main direction of the point cloud points within the same grid, and v 2 is the direction of the world coordinate system’s z-axis.
α = arccos v 1 · v 2 v 1 v 2

2.3.3. Sliding Windows

In our practical experiments, we have observed that due to the unstructured nature of point clouds, our generated two-dimensional feature maps exhibit a significant number of gaps or holes. This phenomenon can lead to the network erroneously recognizing one tree as multiple trees. To address this issue, we drew inspiration from the concept of a sliding window [45,46]. A sliding window is a fixed-size window that slides over the data sequence from beginning to end in certain steps. At each position, the window captures a portion of the data in the sequence for processing. To calculate each statistical value at a pixel in the two-dimensional feature map, we employ a sliding window approach with various window sizes.
As an example, we illustrate the method using a 3 × 3 window, where we incorporate the surrounding eight grids of the corresponding point cloud raster into the calculation. This approach helps reduce the occurrence of gaps or holes in the two-dimensional feature map. The schematic diagram of our approach is illustrated in Figure 6.

2.3.4. YOLOV8

YOLOV8 is a deep learning model developed based on Ultralytics and used for tasks such as object detection, image classification, and instance segmentation [47]. As the latest version of YOLO, it introduces new features and improvements to enhance performance and flexibility, as shown in Figure 7.
Its network structure consists of the following three main parts. The backbone of YOLOv8 consists of a series of convolutional and deconvolutional layers to extract features. It also incorporates residual connections and bottleneck structures to reduce network size and improve performance. This part utilizes the C2f module as the basic building unit. The neck section employs multi-scale feature fusion techniques to merge feature maps from different stages of the backbone, enhancing feature representation capabilities. Specifically, the neck part of YOLOv8 includes an SPPF module, a PAA module, and two PAN modules. Responsible for the final object detection and classification tasks, the head consists of a detection head and a classification head. The detection head comprises a series of convolutional and deconvolutional layers to generate detection results, while the classification head uses global average pooling to classify each feature map. Overall, YOLOV8 adopts a decoupled head structure, separating classification and detection heads. It no longer has an objectness branch, only decoupled classification and regression branches. Additionally, it employs an anchor-free strategy, abandoning anchor boxes used in YOLOV7, which reduces the number of box predictions and improves the speed of Non-Maximum Suppression (NMS). In the backbone network and Neck, YOLOV8 uses the C2f structure with better gradients to support different model scales by adjusting the number of channels. This aligns with YOLO’s focus on improving generalization and is relevant to this study’s context. For loss computation, YOLOV8 uses the Task Aligned Assigner positive sample assignment strategy. It employs BCE Loss for the classification branch and Distribution Focal Loss (DFL) and CIoU Loss for loss computation in the regression branch.YOLOV8 requires decoding the integral representation of bbox forms in Distribution Focal Loss, using Softmax and Conv calculations to transform them into conventional 4-dimensional bboxes. The head section outputs features maps at 6 different scales. The predictions from the classification and bbox branches at three different scales are concatenated and dimensionally transformed. For future convenience, the original channel dimension is permuted to the end, resulting in shapes for the class prediction branch and bbox prediction branch as (b, 8400, and 80) and (b, 8400, and 4), respectively. The final output includes three feature maps at scales of 80 × 80, 40 × 40, and 20 × 20.

2.3.5. Convolutional Block Attention Mechanism

Convolutional Block Attention Module (CBAM) is an attention mechanism used in deep convolutional neural networks (CNNs) to enhance the model’s ability to model input features [48], as shown in Figure 8. It is usually utilized enhance the model’s perceptual capability of features. It integrates both the Channel Attention Module and Spatial Attention Module, which focus on the inter-channel correlations and spatial positional correlations, respectively. This integration enhances the representational capacity of features. It achieves this by combining both the channel attention and spatial attention components.
The Channel Attention Module is designed to learn the relationships between different channels within the feature map. It starts by applying global average pooling to the input feature map, extracting global information for each channel. This global information is then processed through a multi-layer perceptron (MLP). The MLP’s output represents the correlations between different channels, indicating the weight relationships among the channels. These learned weights are subsequently used to scale the features of each channel, emphasizing important channels while suppressing irrelevant ones. The Spatial Attention Module focuses on learning relationships between different spatial positions within the feature map. It begins by applying multiple convolution operations in different directions to capture spatial features in various orientations. These spatial features are then integrated into an information packet, which is passed through an MLP. The MLP scales the features of each pixel, highlighting important pixel positions and suppressing irrelevant ones, effectively creating spatial attention.
The combination of the channel attention and spatial attention modules in CBAM allows the network to adaptively focus on both channel-wise and spatial-wise information [49]. This enhances the modeling capabilities of deep CNNs, making it particularly valuable for tasks involving complex and diverse visual data.

2.3.6. Efficient Channel Attention Mechanism

Efficient Channel Attention (ECA) is an efficient channel attention module designed for deep convolutional neural networks (CNNs), as shown in Figure 9. This module generates channel attention through a rapid one-dimensional convolution, with the kernel size adaptively determined based on a non-linear mapping of the number of channels [50,51]. This adaptive approach avoids dimensionality reduction and effectively captures information related to cross-channel interactions.
The ECA attention mechanism can dynamically learn channel weights that adapt to different tasks and datasets, enhancing the model’s flexibility and performance. By improving the relevance of channel features, the ECA helps enhance the overall performance of the model while maintaining relatively low computational costs.
In summary, ECA is a valuable component in deep CNNs as it efficiently captures channel-wise information, adaptively learns channel weights, and enhances model performance without significantly increasing computational overhead.

2.3.7. Explicit Visual Center

The Explicit Visual Center (EVC) consists of two parallel connected blocks designed to capture global long-term dependencies and preserve local angular region information, as shown in Figure 10 [52]. The Multilayer Perceptron (MLP) portion adopts a lightweight structure, including residual modules based on deep convolution and channel-based MLP.
The module based on deep convolution receives the output of the stem module, undergoes deep convolution and group normalization, and then undergoes channel scaling, DropPath operation, and residual connection. On the other hand, the module based on channel MLP undergoes channel scaling, DropPath operation, and residual connection after group normalization and Channels MLP.

2.3.8. ODN-Pro

Figure 11 illustrates the ODN-Pro structure, highlighting the methods adopted to enhance the detection accuracy of the YOLOv8 model [53,54,55]. The YOLOv8’s backbone and neck are enhanced by introducing the ECA block and the EVC block, respectively. This integration leads to improved detection performance. The ECA block learns the importance of the weights of different channels, representing the significance of features within each channel for the final task. By enhancing the representation of important features and suppressing less important ones, ECA helps the network allocate resources more effectively to process information that has a greater impact on the results, thereby enhancing the expressiveness and accuracy of the model. Additionally, ECA avoids the complex spatial transformations and expensive matrix multiplications typical in traditional attention mechanisms, achieving channel attention solely through one-dimensional convolution operations. This significantly reduces computational complexity and model parameters. Consequently, ECA enhances model performance while maintaining efficient computational efficiency, making it particularly suitable for resource-constrained environments. The introduction of EVC aims to capture global spatial contextual information, which is crucial for understanding objects in images and their relationships. To leverage the spatial weights obtained through EVC across all layers, it is necessary to upsample the top-level features to the same spatial scale as the lower-level features. This step is achieved through upsampling operations, followed by concatenating the upsampled deep features with the corresponding shallow features along the channel dimension. Therefore, we place EVC in the neck section immediately after the first upsampling operation. Through this approach, each layer of the feature pyramid explicitly incorporates global spatial weights, thereby enhancing the richness and discriminability of feature representation. Moreover, it efficiently propagates global spatial information downward, optimizing the computation flow of cross-layer feature normalization and avoiding the redundant computations and overhead associated with independently calculating EVC at each layer.

2.4. Evaluation Metrics

To evaluate the performance of the model, precision (P), recall (R), and mean average precision (mAP) are used [56]. These above metrics are calculated as follows:
P = T P T P + F P
R = T P T P + F N
A P = 0 1 P ( R ) d R
m A P = i = 1 n A P i n
T P is the number of positive samples predicted to be positive class, F P is the number of negative samples predicted to be positive class, F N is the number of positive samples predicted to be negative class, A P is the area below the PR curve, and m A P is the mean A P value for each category. The n represents the number of categories in object detection. In this study, n = 1. We used the 3000 augmented local maps mentioned earlier as our dataset, splitting them into 80% for training and 20% for validation.

2.5. Training Parameters and Experimental Environment

The training parameters used in the experiments are detailed in Table 1.
The GPU of the computer is an NVIDIA GeForce RTX3090. The operating system was Windows 10 and PyTorch 1.70, Python version 3.8, and CUDA version 11 were used.

3. Results

3.1. Comparison of Feature Encoding Methods

In order to identify the most suitable feature encoding method for the approaches employed in this study, we conducted comparative experiments on the calculation methods of feature values and the size of the sliding window. We recorded the execution time and mAP under different methods. In this experimental section, we consistently utilized the original YOLOv8 network as the detection model. Due to the VFH and CVFH feature extraction methods yielding 308 feature values, the network’s input was accordingly modified to accommodate a 308-channel feature map input.
We split the global orchard map into 10 m × 10 m local maps and the local maps were used for testing and divided the local point cloud map into grids of 128 × 128 in the x and y directions. Different sizes of sliding windows were designed and the time of the feature extraction part of the model runtime and the predicted mAP were counted; the results are shown in Table 2. As can be seen from Table 2, the time to extract features increases as the window size increases. This is because the increase in the number of point cloud points leads to an increase in computation. From our comparison of Test 1 and Test 2, the addition of the sliding window method is able to improve the mAP. From the comparison of Test 2 and Test 3, it is found that the increase in the size of the sliding window does not have a significant effect on the improvement in the mAP. However, the increase in the number of point cloud points per computation brings a huge computational overhead.
We also performed an experimental comparison of the feature extraction methods. The experimental results are shown in Table 3. From Table 2, we know that the sliding window size of 3 × 3 has both speed and accuracy. For this reason, in this experiment, we use the 3 × 3 sliding window strategy for all groups. Test 2 and Test 3 are the control groups of the experiment. As can be seen from Table 3, although the VFH and CVFH feature descriptors can have better mAP, the computation time also increases to an unacceptable 2.13 s and 9.21 s. It is thus clear that the proposed method in this study is able to balance both speed and accuracy.
To compare with specialized deep learning networks for point cloud semantic segmentation, we contrasted the detection performance of the proposed method with that of PointNet++ [57]. Because of the different network types, we unified the evaluation criteria by calculating the mIoU between the predictions of PointNet++ and the ground truth. Similarly, we computed the mIoU for the predicted boxes and annotated boxes of the proposed method and recorded the results in Table 4. It is noteworthy that when training and predicting with PointNet++, we configured the feature extraction method to MSG in the PointNet++ parameters and set the number of sampling points to 1000, 2500, and 5000 for testing. The results from Table 4 show that when the number of sampling points is set to 1000, the mIoU is lower. When the number of sampling points is set to 2500 and 5000, the mIoU metrics are higher but they do not have an advantage over the proposed method in terms of prediction time. This indicates that the proposed method can balance efficiency and accuracy.

3.2. Experiments Were Conducted to Evaluate Several Methods Applicable to YOLOv8

In order to enhance the detection performance of the YOLOv8 model, various methods that could potentially impact detection performance were employed. A comparison was made with the original YOLOv8 model to assess the positive effects of these methods on improving the detection performance of YOLOv8. The training and testing were conducted under the same conditions. Figure 12 illustrates the curves depicting the changes in training loss and validation loss.
As shown in Figure 12, during the training of 300 epochs, although the training loss continues to decrease, the validation loss curves for all the mentioned models tend to stabilize. This indicates that the model training has converged. Subsequently, we conducted tests on these trained models and the results are presented in Table 5.
From Table 5, we can draw the following conclusions. Compared to YOLOv8, YOLOv8-ECA shows improvements in mAP by 0.4%. YOLOv8-CBAM exhibits improvements in mAP by 1.1%. YOLOv8-EVC demonstrates improvements in mAP by 1.0%. The introduction of these three methods significantly enhances the detection performance of the YOLOv8 network. Subsequently, these methods will be combined to obtain a method with improved accuracy.

3.3. Ablation Experiments with YOLOv8

Through the experiments in Section 3.2, we observed that introducing ECA, CBAM, and EVC can enhance the performance of the object detection model. Therefore, we conducted ablation experiments to explore different combinations of these methods, aiming to further improve the performance of the YOLOv8 network. Taking the original YOLOv8 as the baseline, we introduced ECA, CBAM, and EVC into the YOLOv8 network. The experimental results are presented in Table 6.
The experimental results in Table 6 indicate that the introduction of EVC leads to a 1.0% improvement in mAP. However, when both CBAM and EVC are introduced simultaneously, the mAP decreases by 0.5% compared to the network with only EVC. On the other hand, introducing both ECA and EVC results in a 0.2% increase in mAP compared to the network with only EVC. Therefore, for subsequent experiments, we will adopt YOLOv8_ECA&EVC, which named ODN-Pro as the network model.

3.4. Cross-Validation

In order to enhance the model’s generalization ability and reduce the risk of overfitting, we conducted K-fold cross-validation on two network models, YOLOv8 and ODN-Pro. Cross-validation involves splitting the dataset into several parts, using one part as the test set and the remaining parts as the training set. This process iterates multiple times, with different parts selected as the test set each time, enabling the model to be trained and tested multiple times. In this study, we performed five iterations of cross-validation. During these five iterations, a different subset was chosen as the test set each time, while the remaining K-1 subsets were merged to form the training set. The results are shown in Table 7:
Based on the data in Table 7, it is evident that the performance of ODN-Pro after cross-validation is significantly superior to the native YOLOv8. The mAP of ODN-Pro after cross-validation is 6.96% higher than that of YOLOv8. Moreover, it only exhibits a 3.08% decrease compared to the training results on the ordinary dataset. Therefore, ODN-Pro demonstrates good generalization ability, capable of handling recognition tasks under various conditions.

3.5. Demonstration

We applied the proposed method to different point cloud maps generated by different types of LiDAR and conducted tree object detection in all areas of the maps. The sliding window size for point cloud feature extraction is set to 3 × 3, the feature encoding method uses our proposed method, and the detection model is our improved network. The results are shown in Figure 13 and Figure 14. In the point cloud map generated by the LIO-SAM algorithm, the large field of view (FOV) of the RS-Helios-5515 plays a crucial role in achieving a more comprehensive scene modeling. As a result, the point cloud map contains a significantly higher number of tree objects. Meanwhile, due to the limited FOV of the Livox-Avia, the number of tree objects in the map generated by the R3LIVE algorithm is correspondingly lower. However, regardless of the type of map, the proposed method can identify tree objects in the map.

4. Discussion

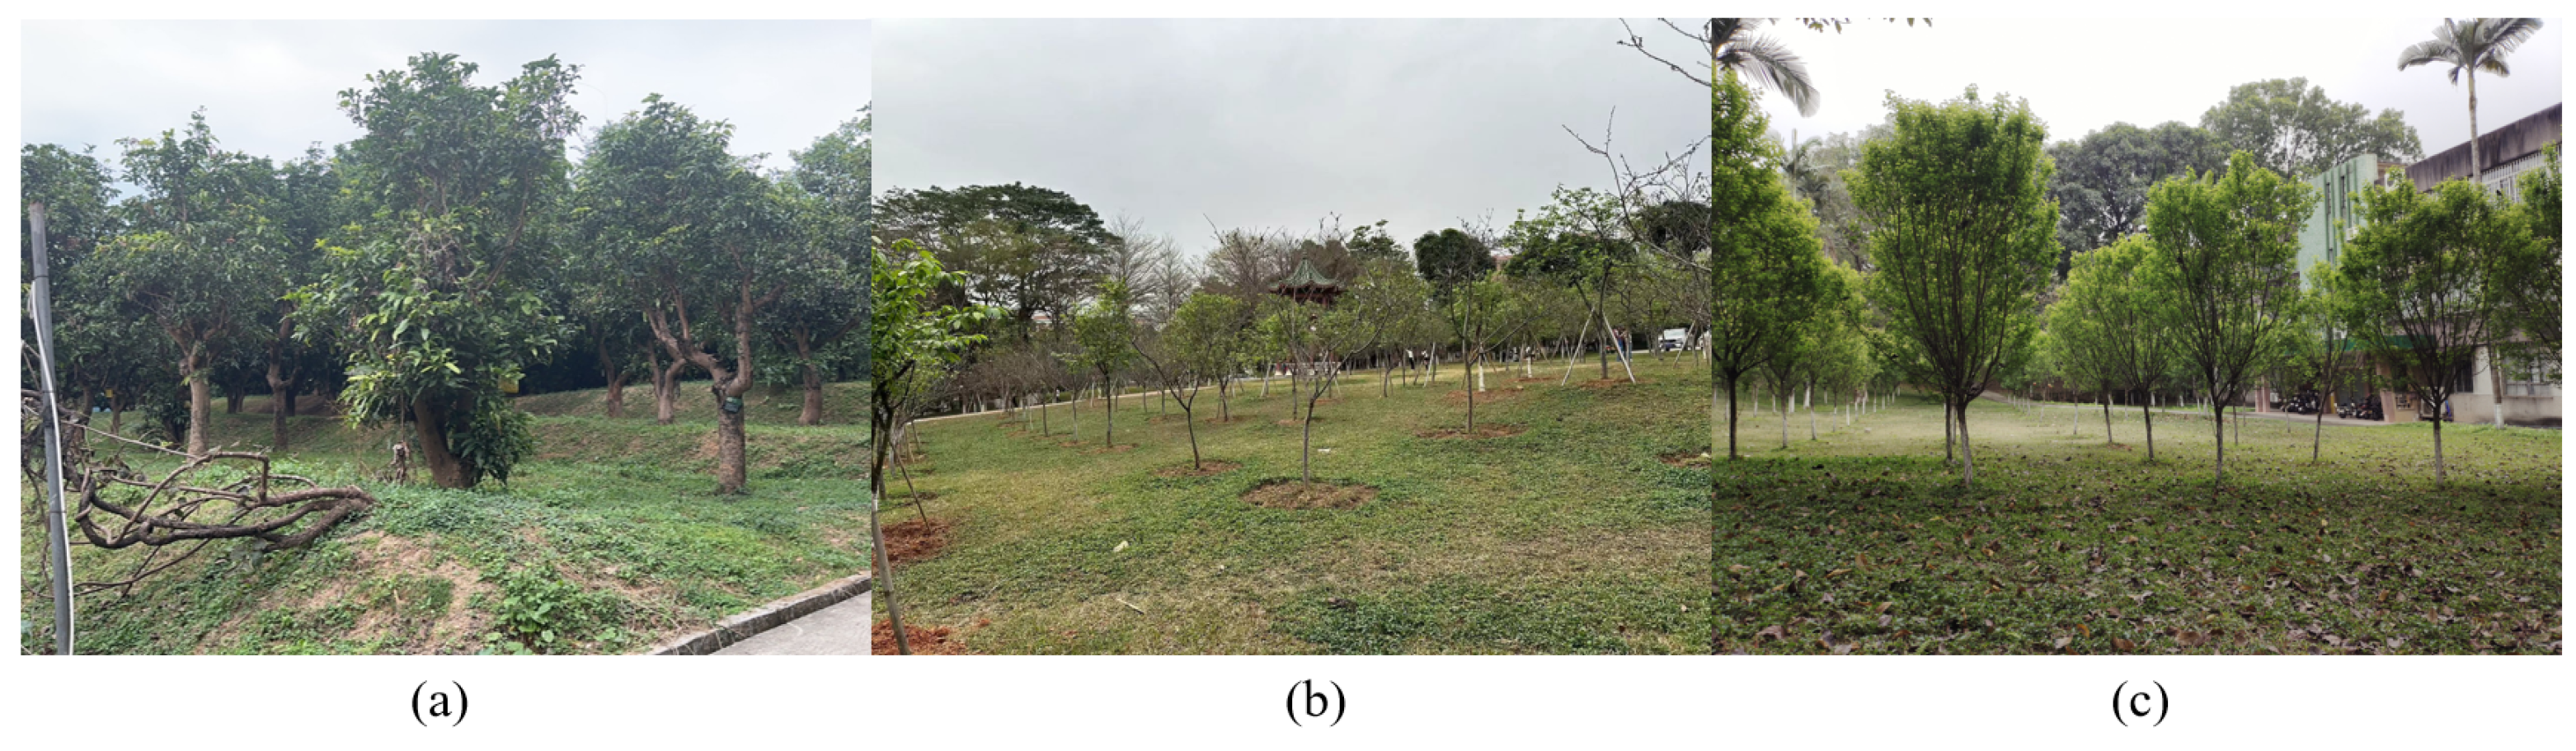
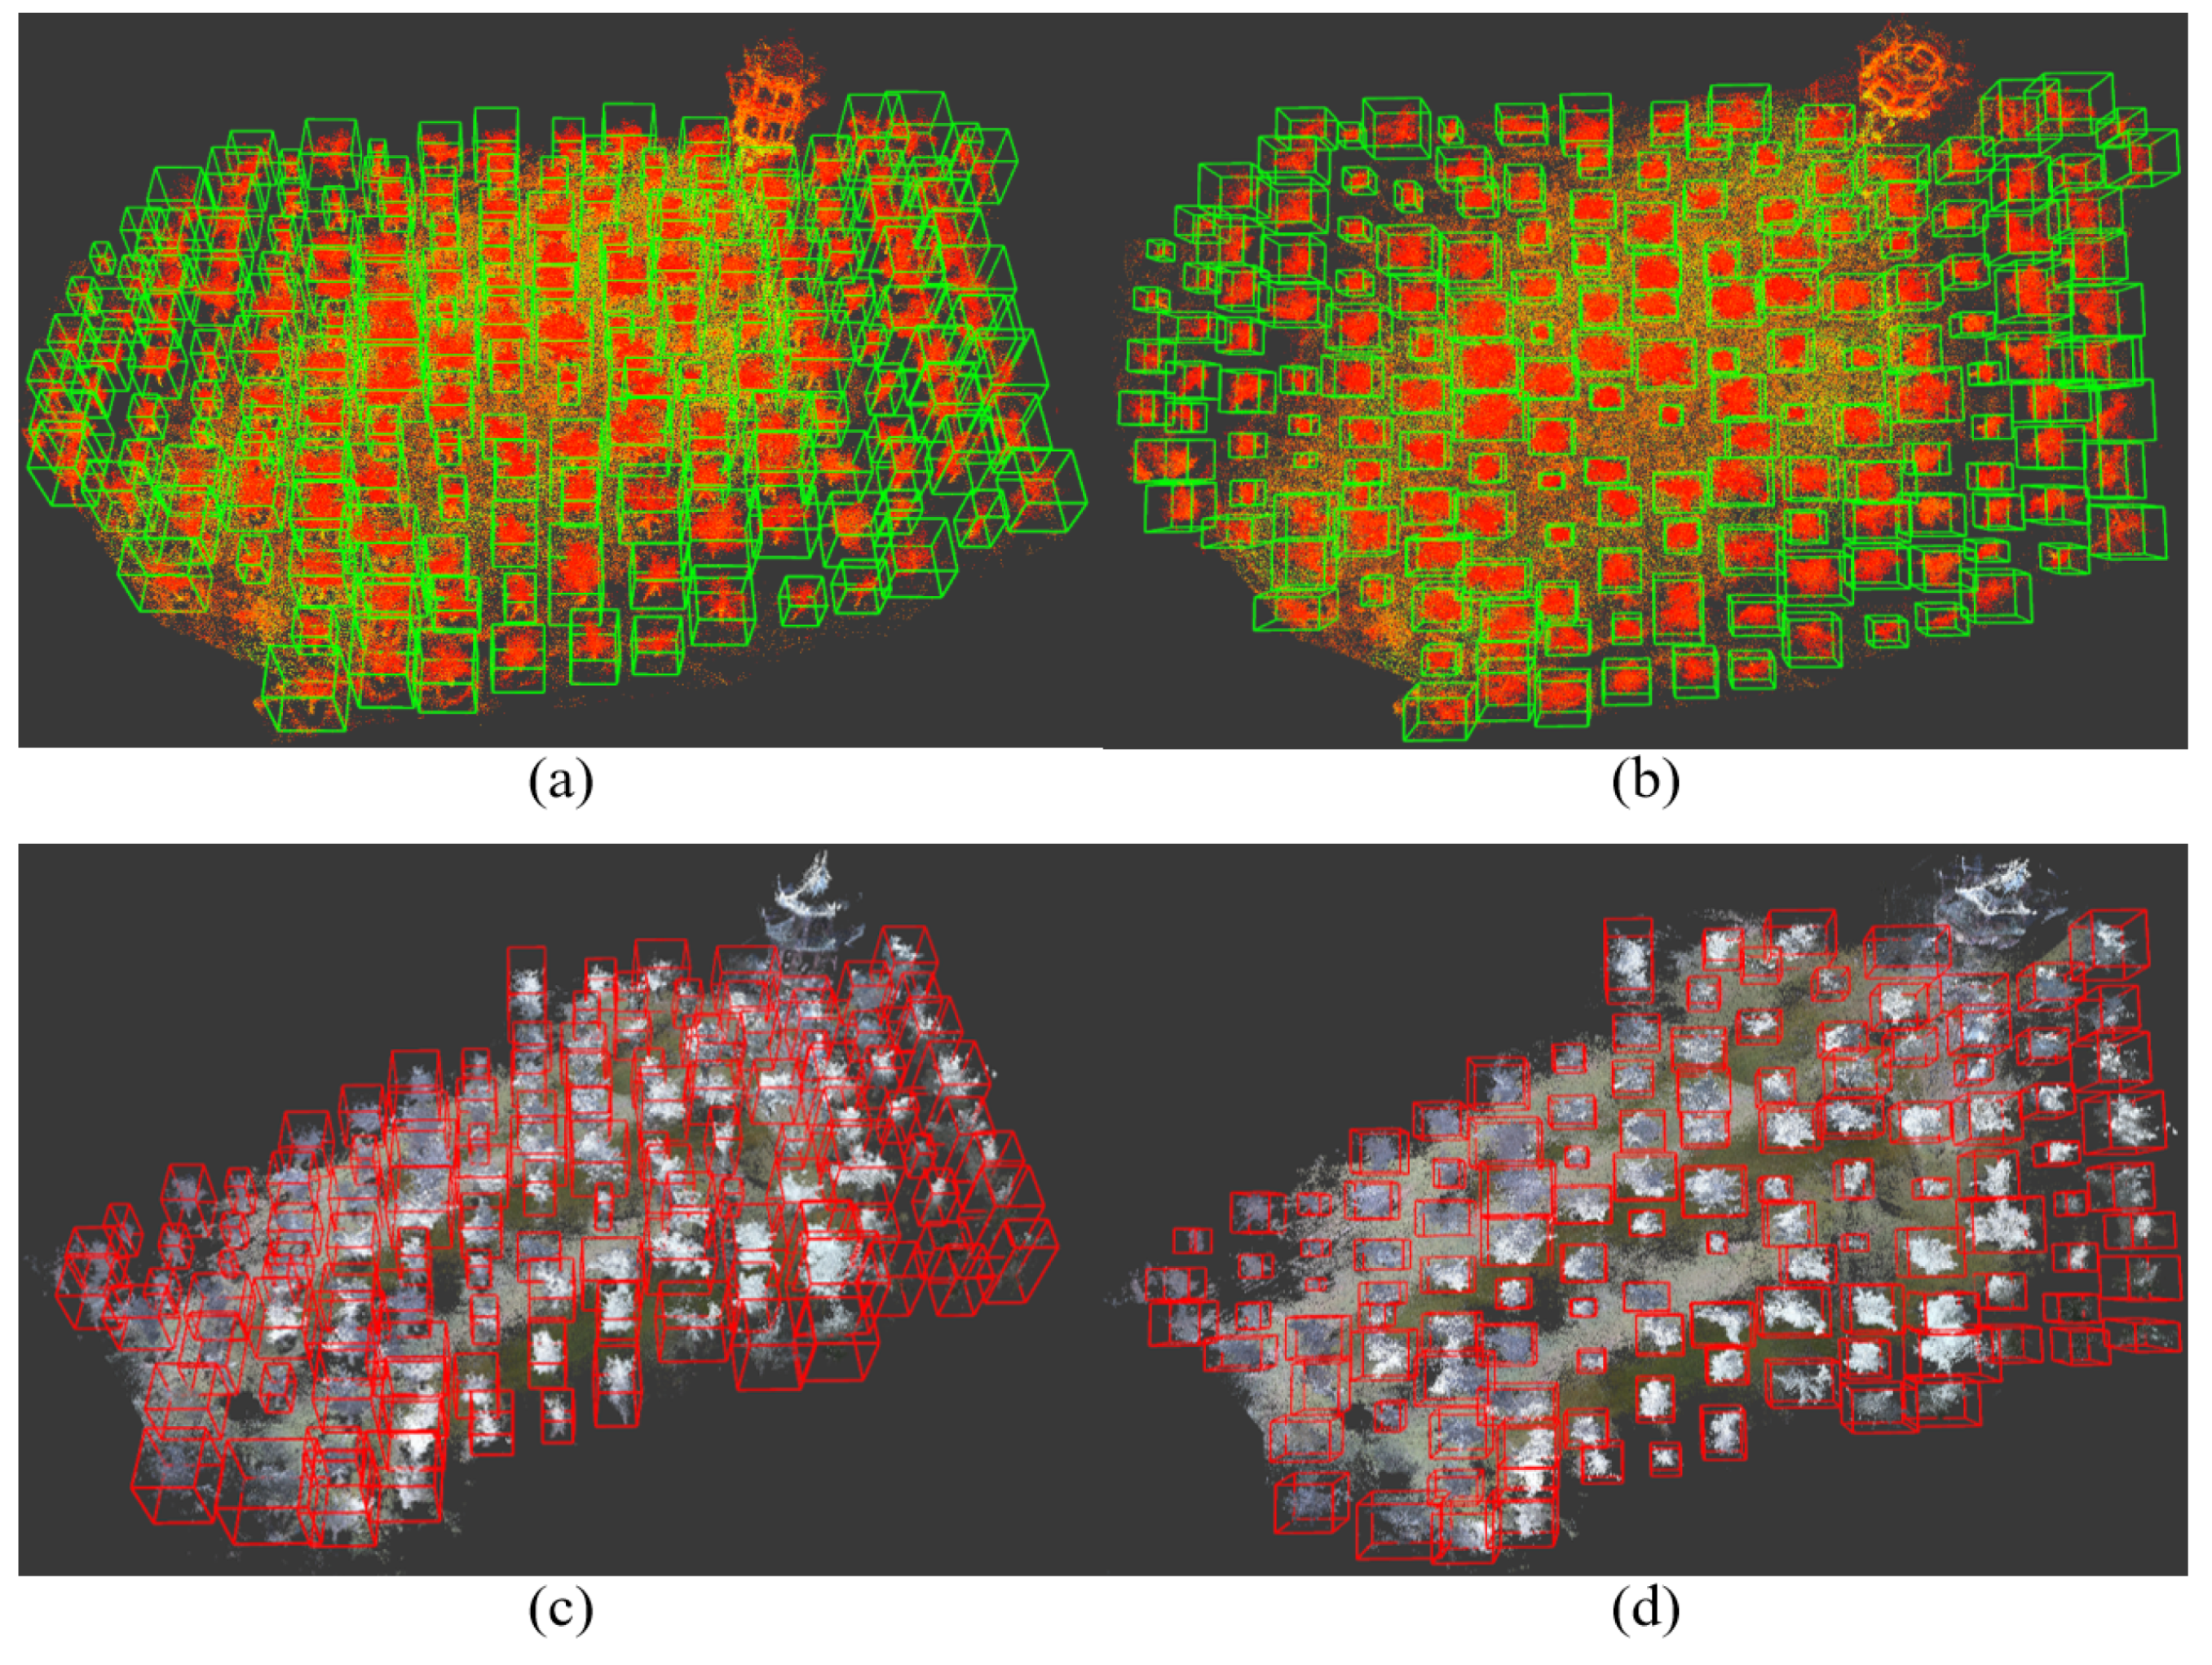
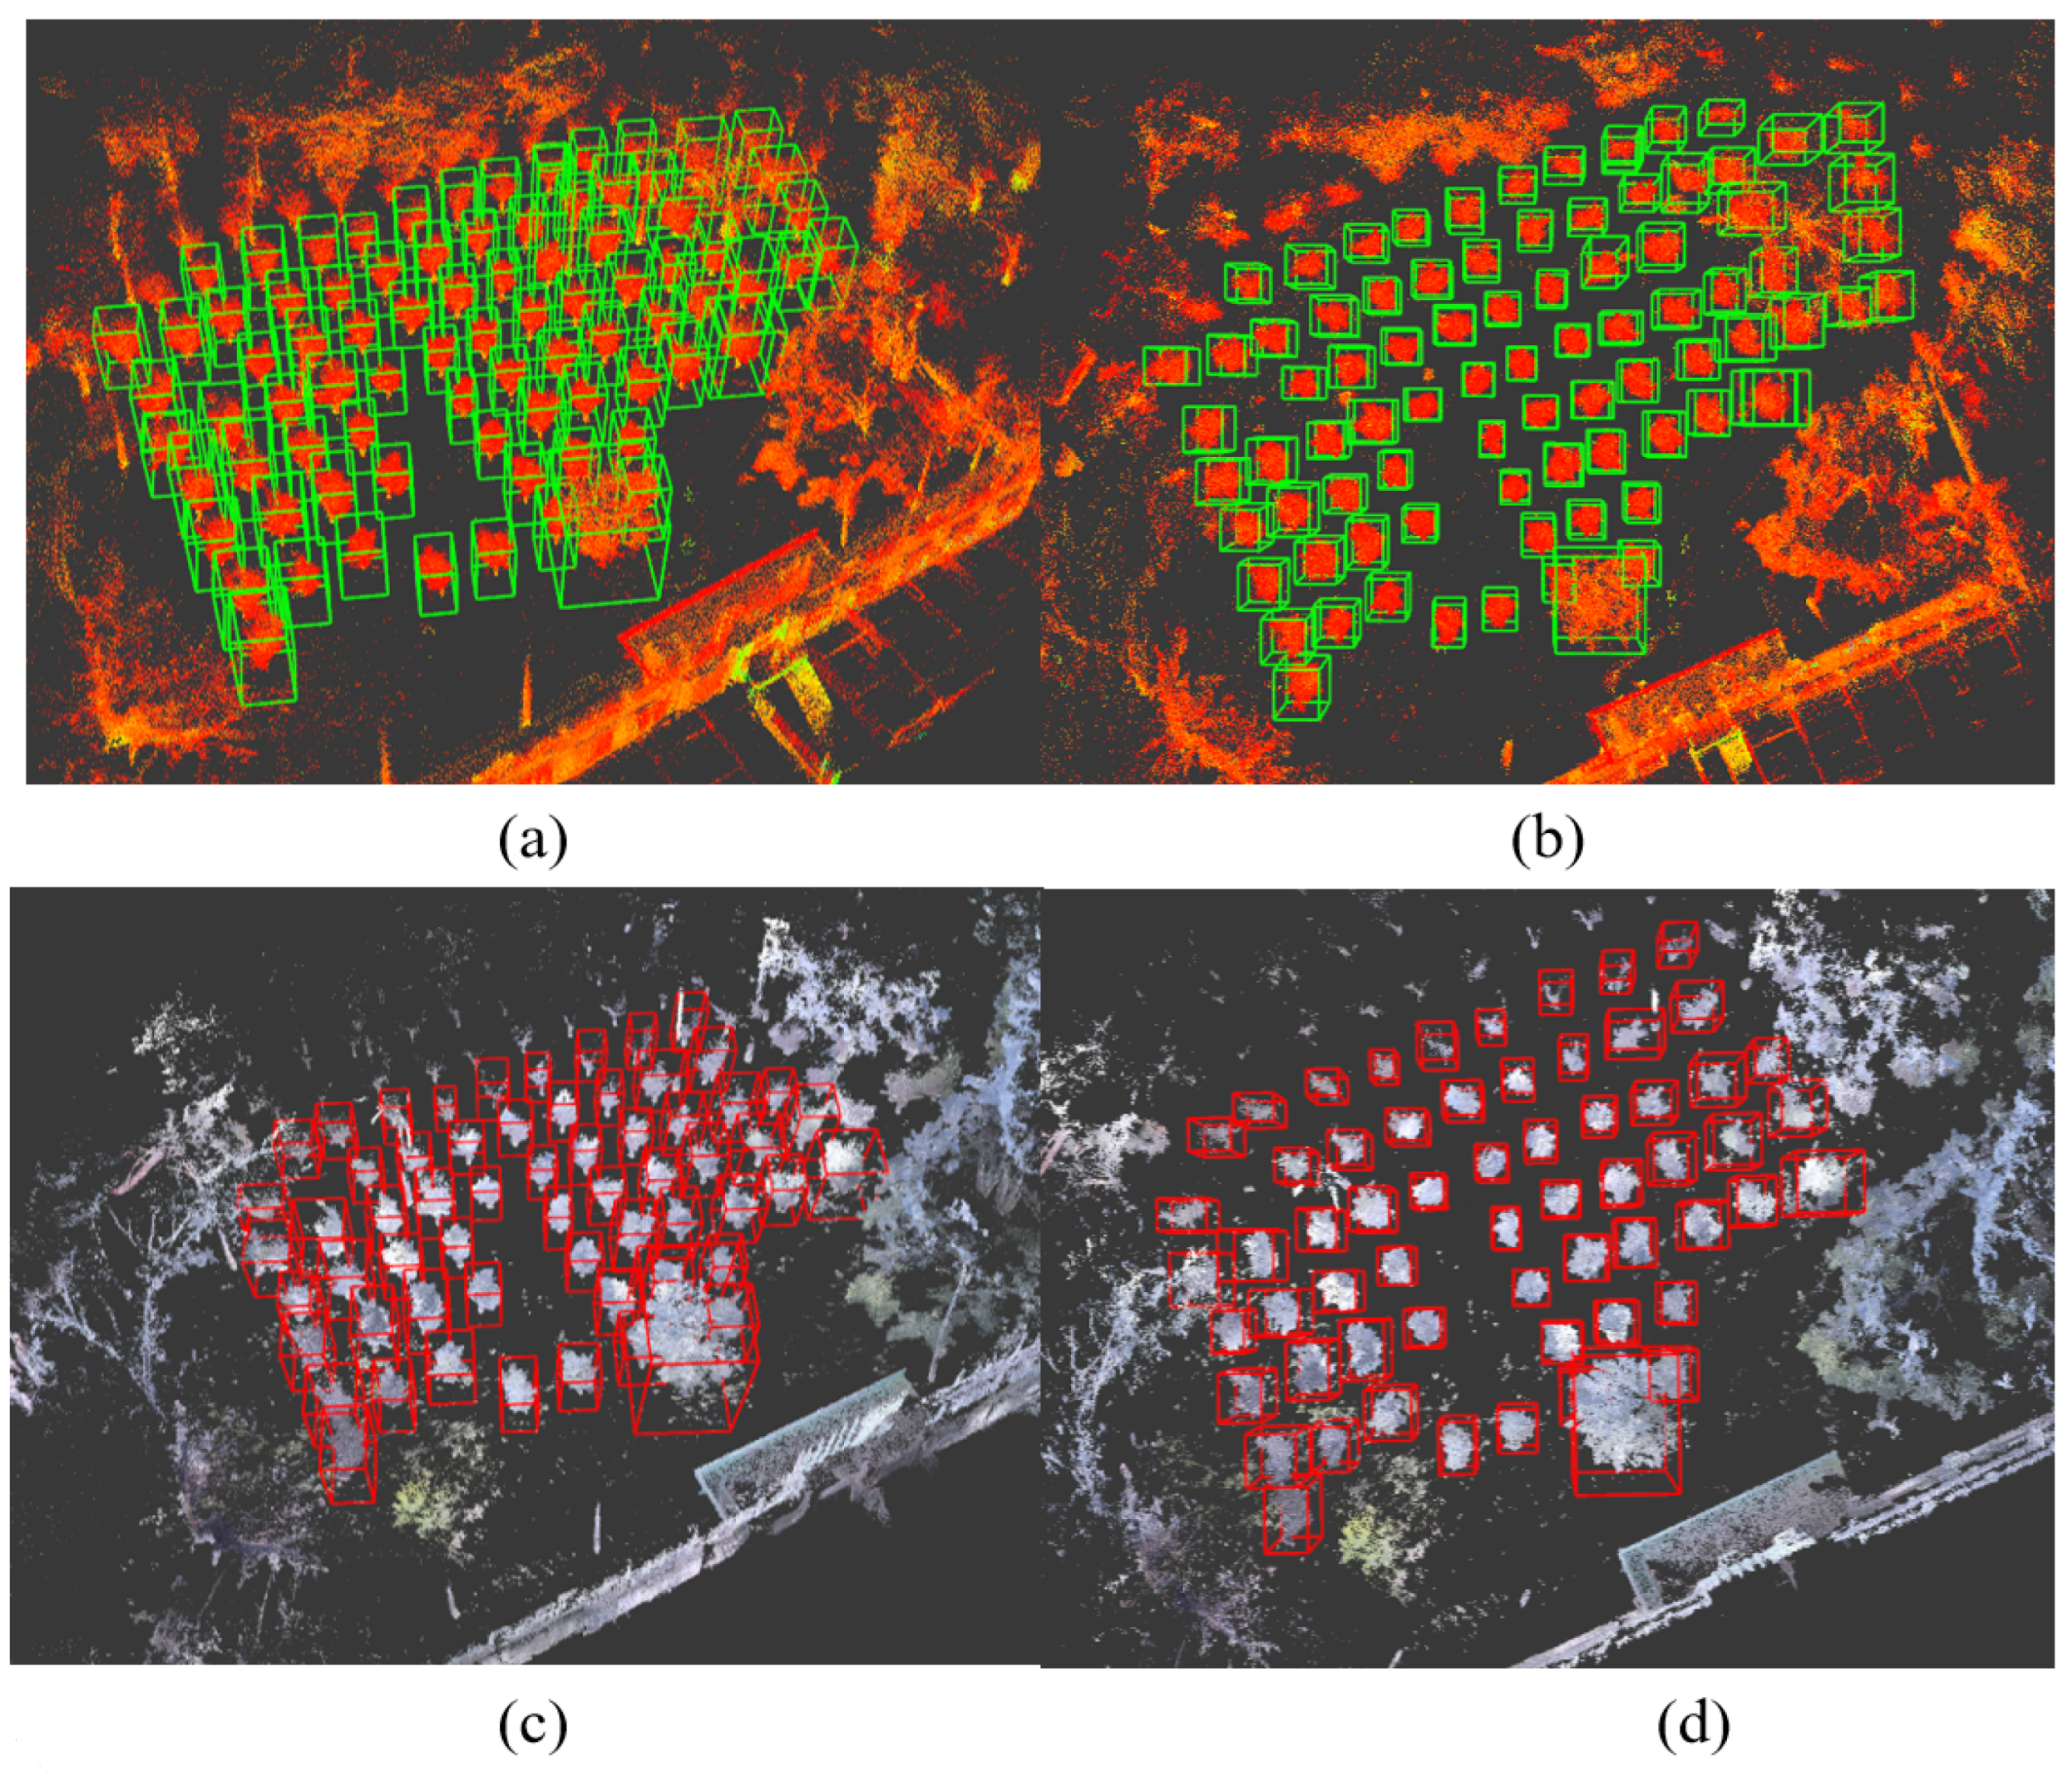
Our study demonstrates that the proposed method can effectively detect fruit trees in point cloud maps generated by different LiDAR sensors with varying point cloud densities. Despite the differences in point cloud densities, our method accurately identifies tree objects in the maps, providing robust assurance for safe navigation of autonomous vehicles in orchards. By effectively recognizing trees, our method enables autonomous vehicles to plan reliable paths within orchards, autonomously navigate through them, and avoid collisions with trees while performing tasks such as planting, irrigation, monitoring, and harvesting. This significantly enhances the efficiency of autonomous vehicle operations in orchards and reduces the risk of accidents, further promoting the development of intelligent and automated orchard management.
To validate the effectiveness of the proposed method, we compared it with the PointNet++ deep learning network for point cloud semantic segmentation. Experimental results show that our method achieves both accuracy and speed without compromising on either aspect.
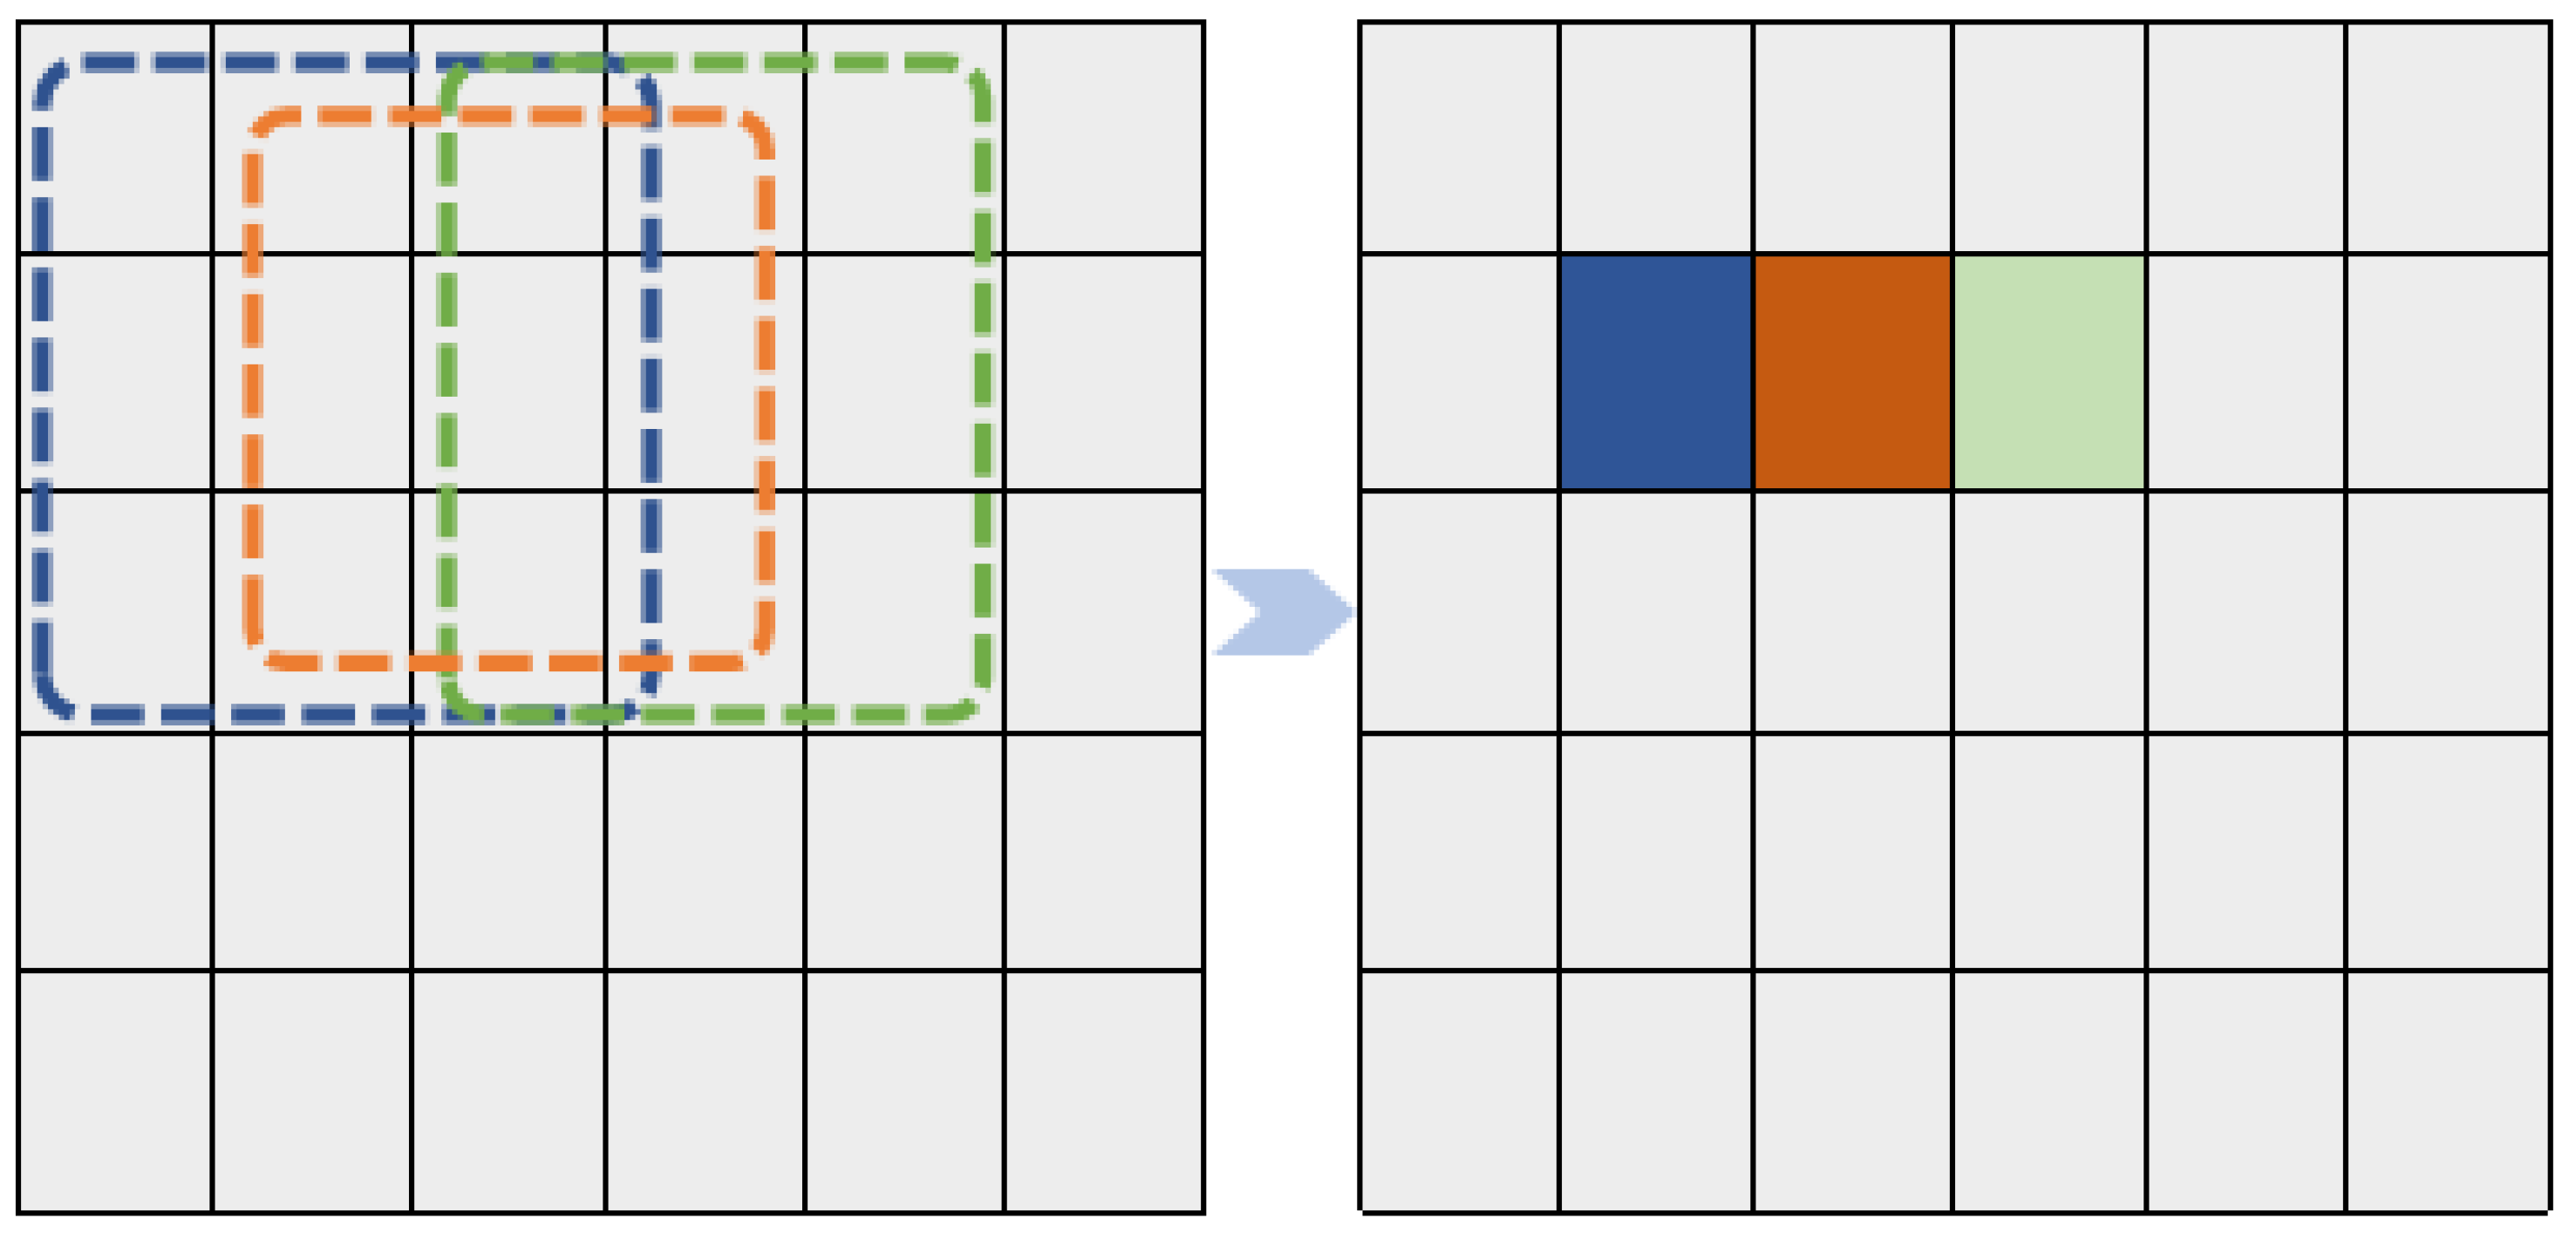
Furthermore, this study introduces a network architecture called ODN-Pro for tree point cloud detection, which utilizes a 3 × 3 sliding window for feature extraction and employs an encoding method to transform three-dimensional point clouds into two-dimensional feature representations. We also conducted K-fold cross-validation on ODN-Pro and its associated dataset. The results demonstrate that these methods contribute to stable and accurate tree object detection across different types of maps.
Despite several significant achievements, it is essential to acknowledge the limitations of our study. For instance, in complex forest scenes, our method may encounter issues such as detection omissions or false alarms due to the challenging structures of point clouds in dense environments. Additionally, when there are significant differences in tree structures, such as between trees with large and small canopies, the network’s performance may degrade. This may require targeted data collection and retraining of the network. Furthermore, like all deep learning networks, our method may face computational complexity issues when processing high-density point clouds. Therefore, in future work, further algorithm optimization is needed to improve detection performance and efficiency, especially in dense forest scenarios, to achieve real-time tree detection.

5. Conclusions

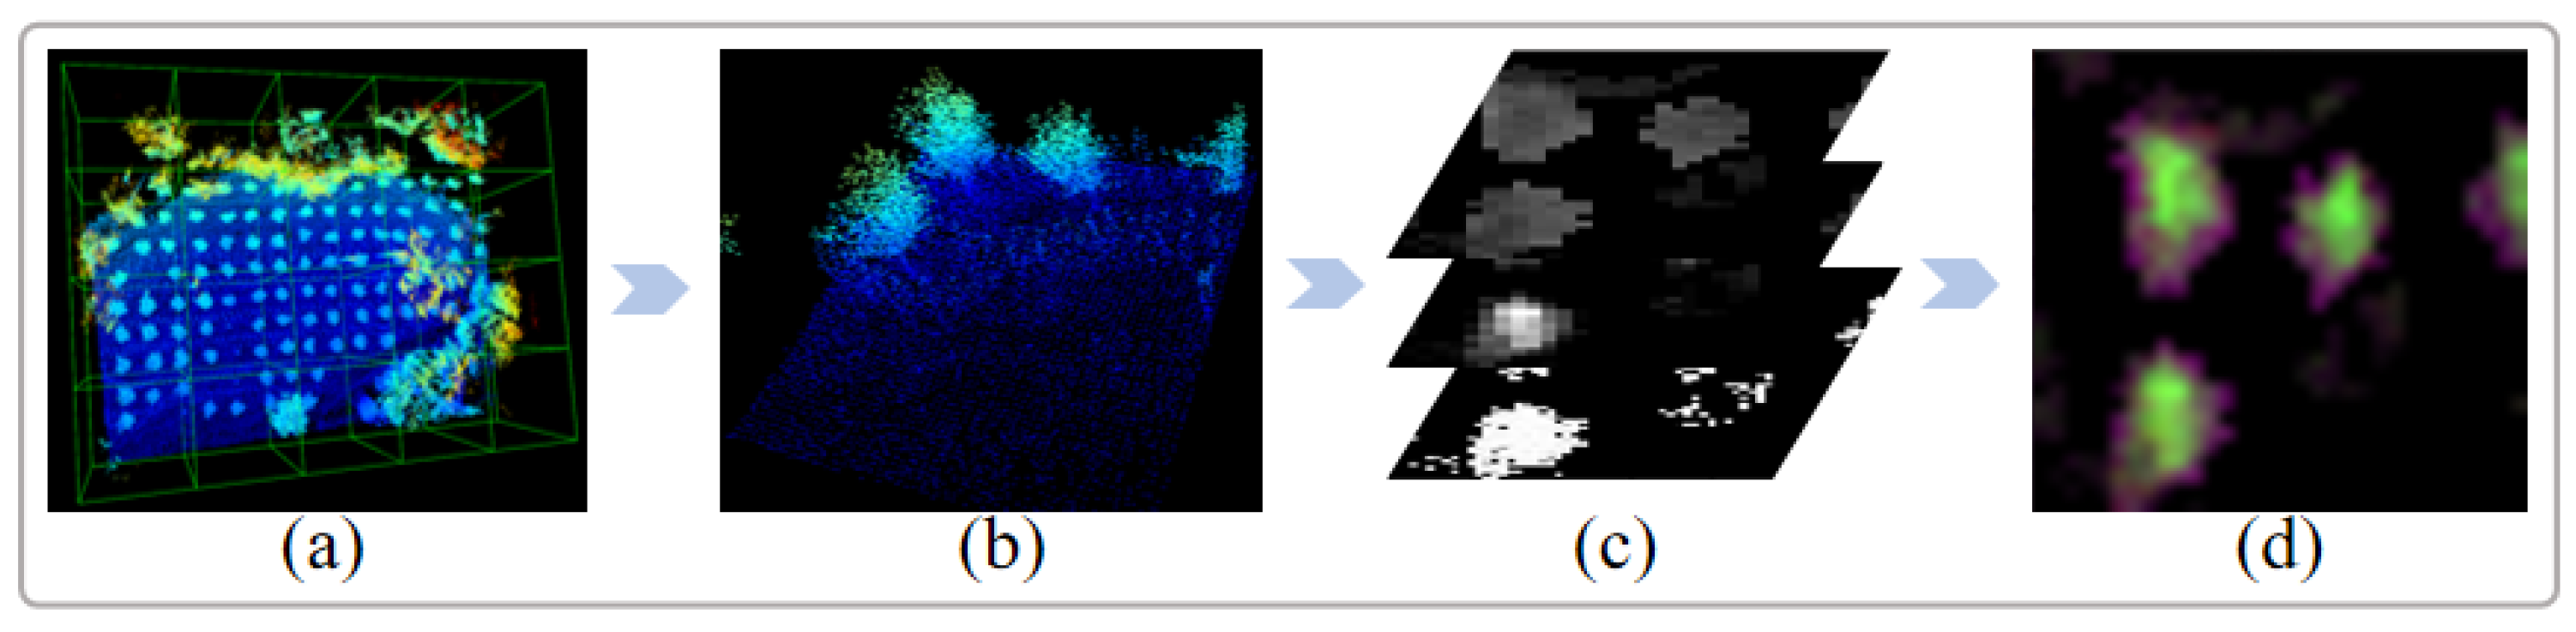
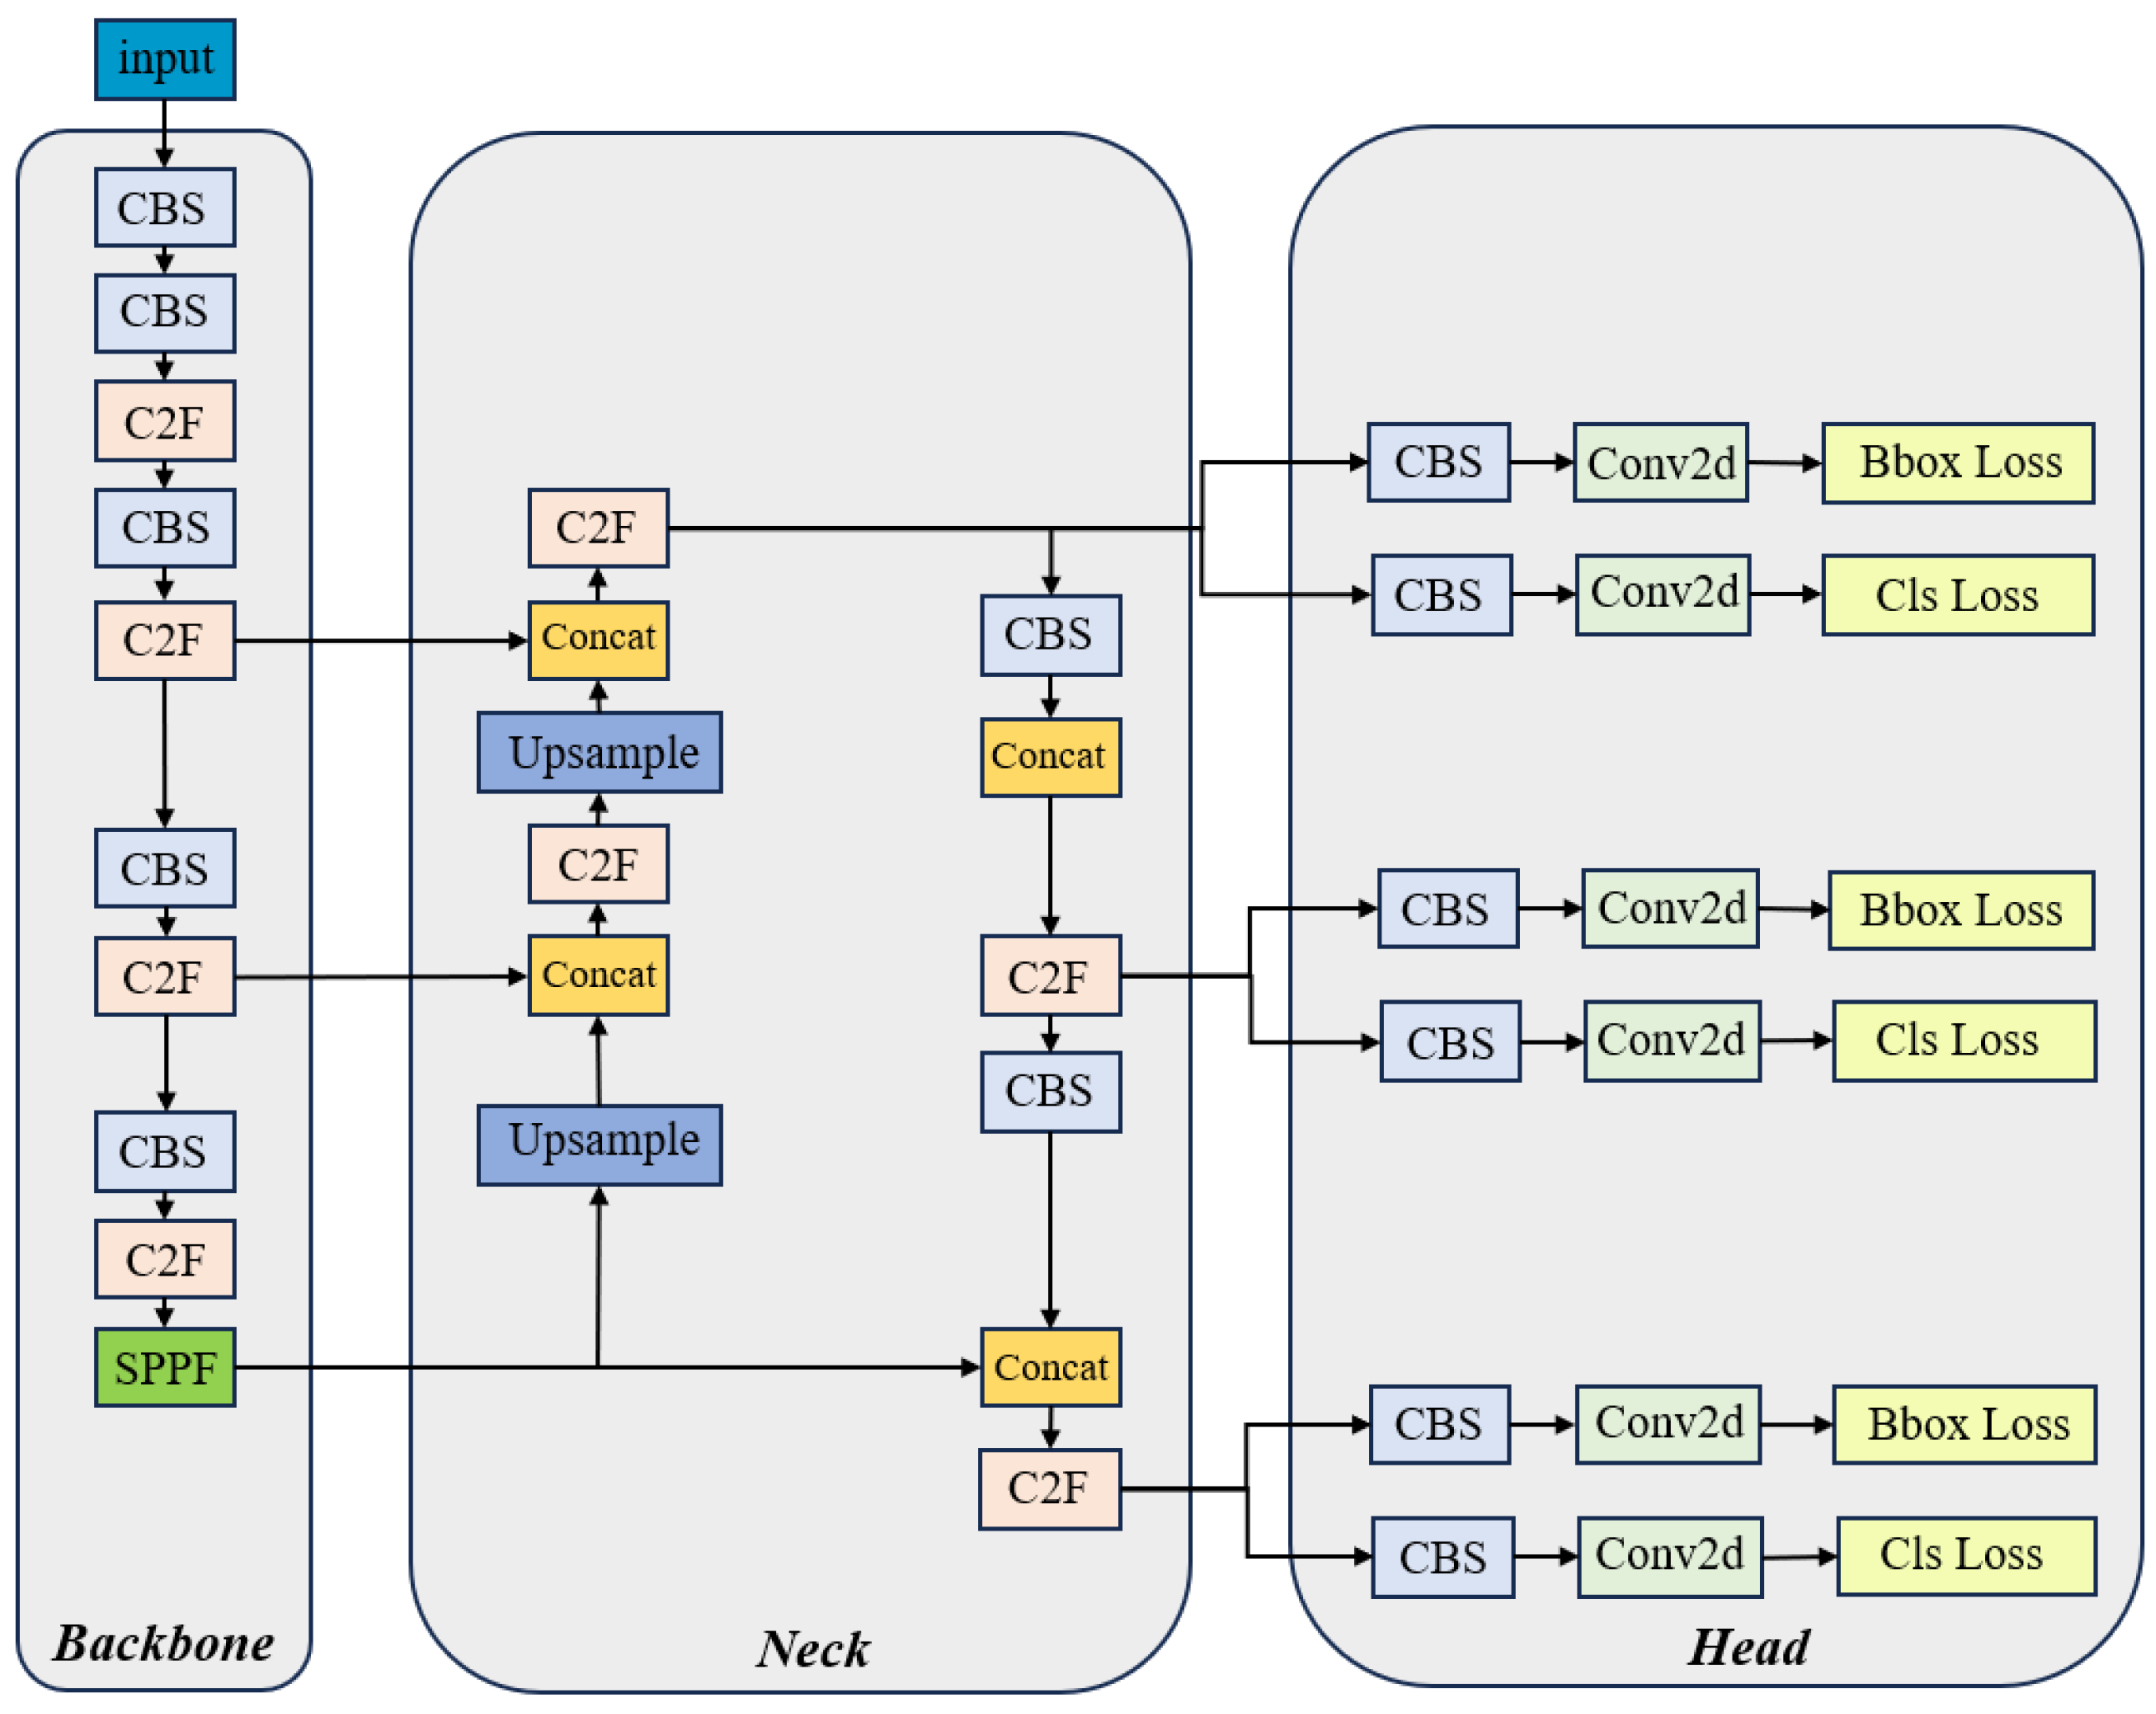
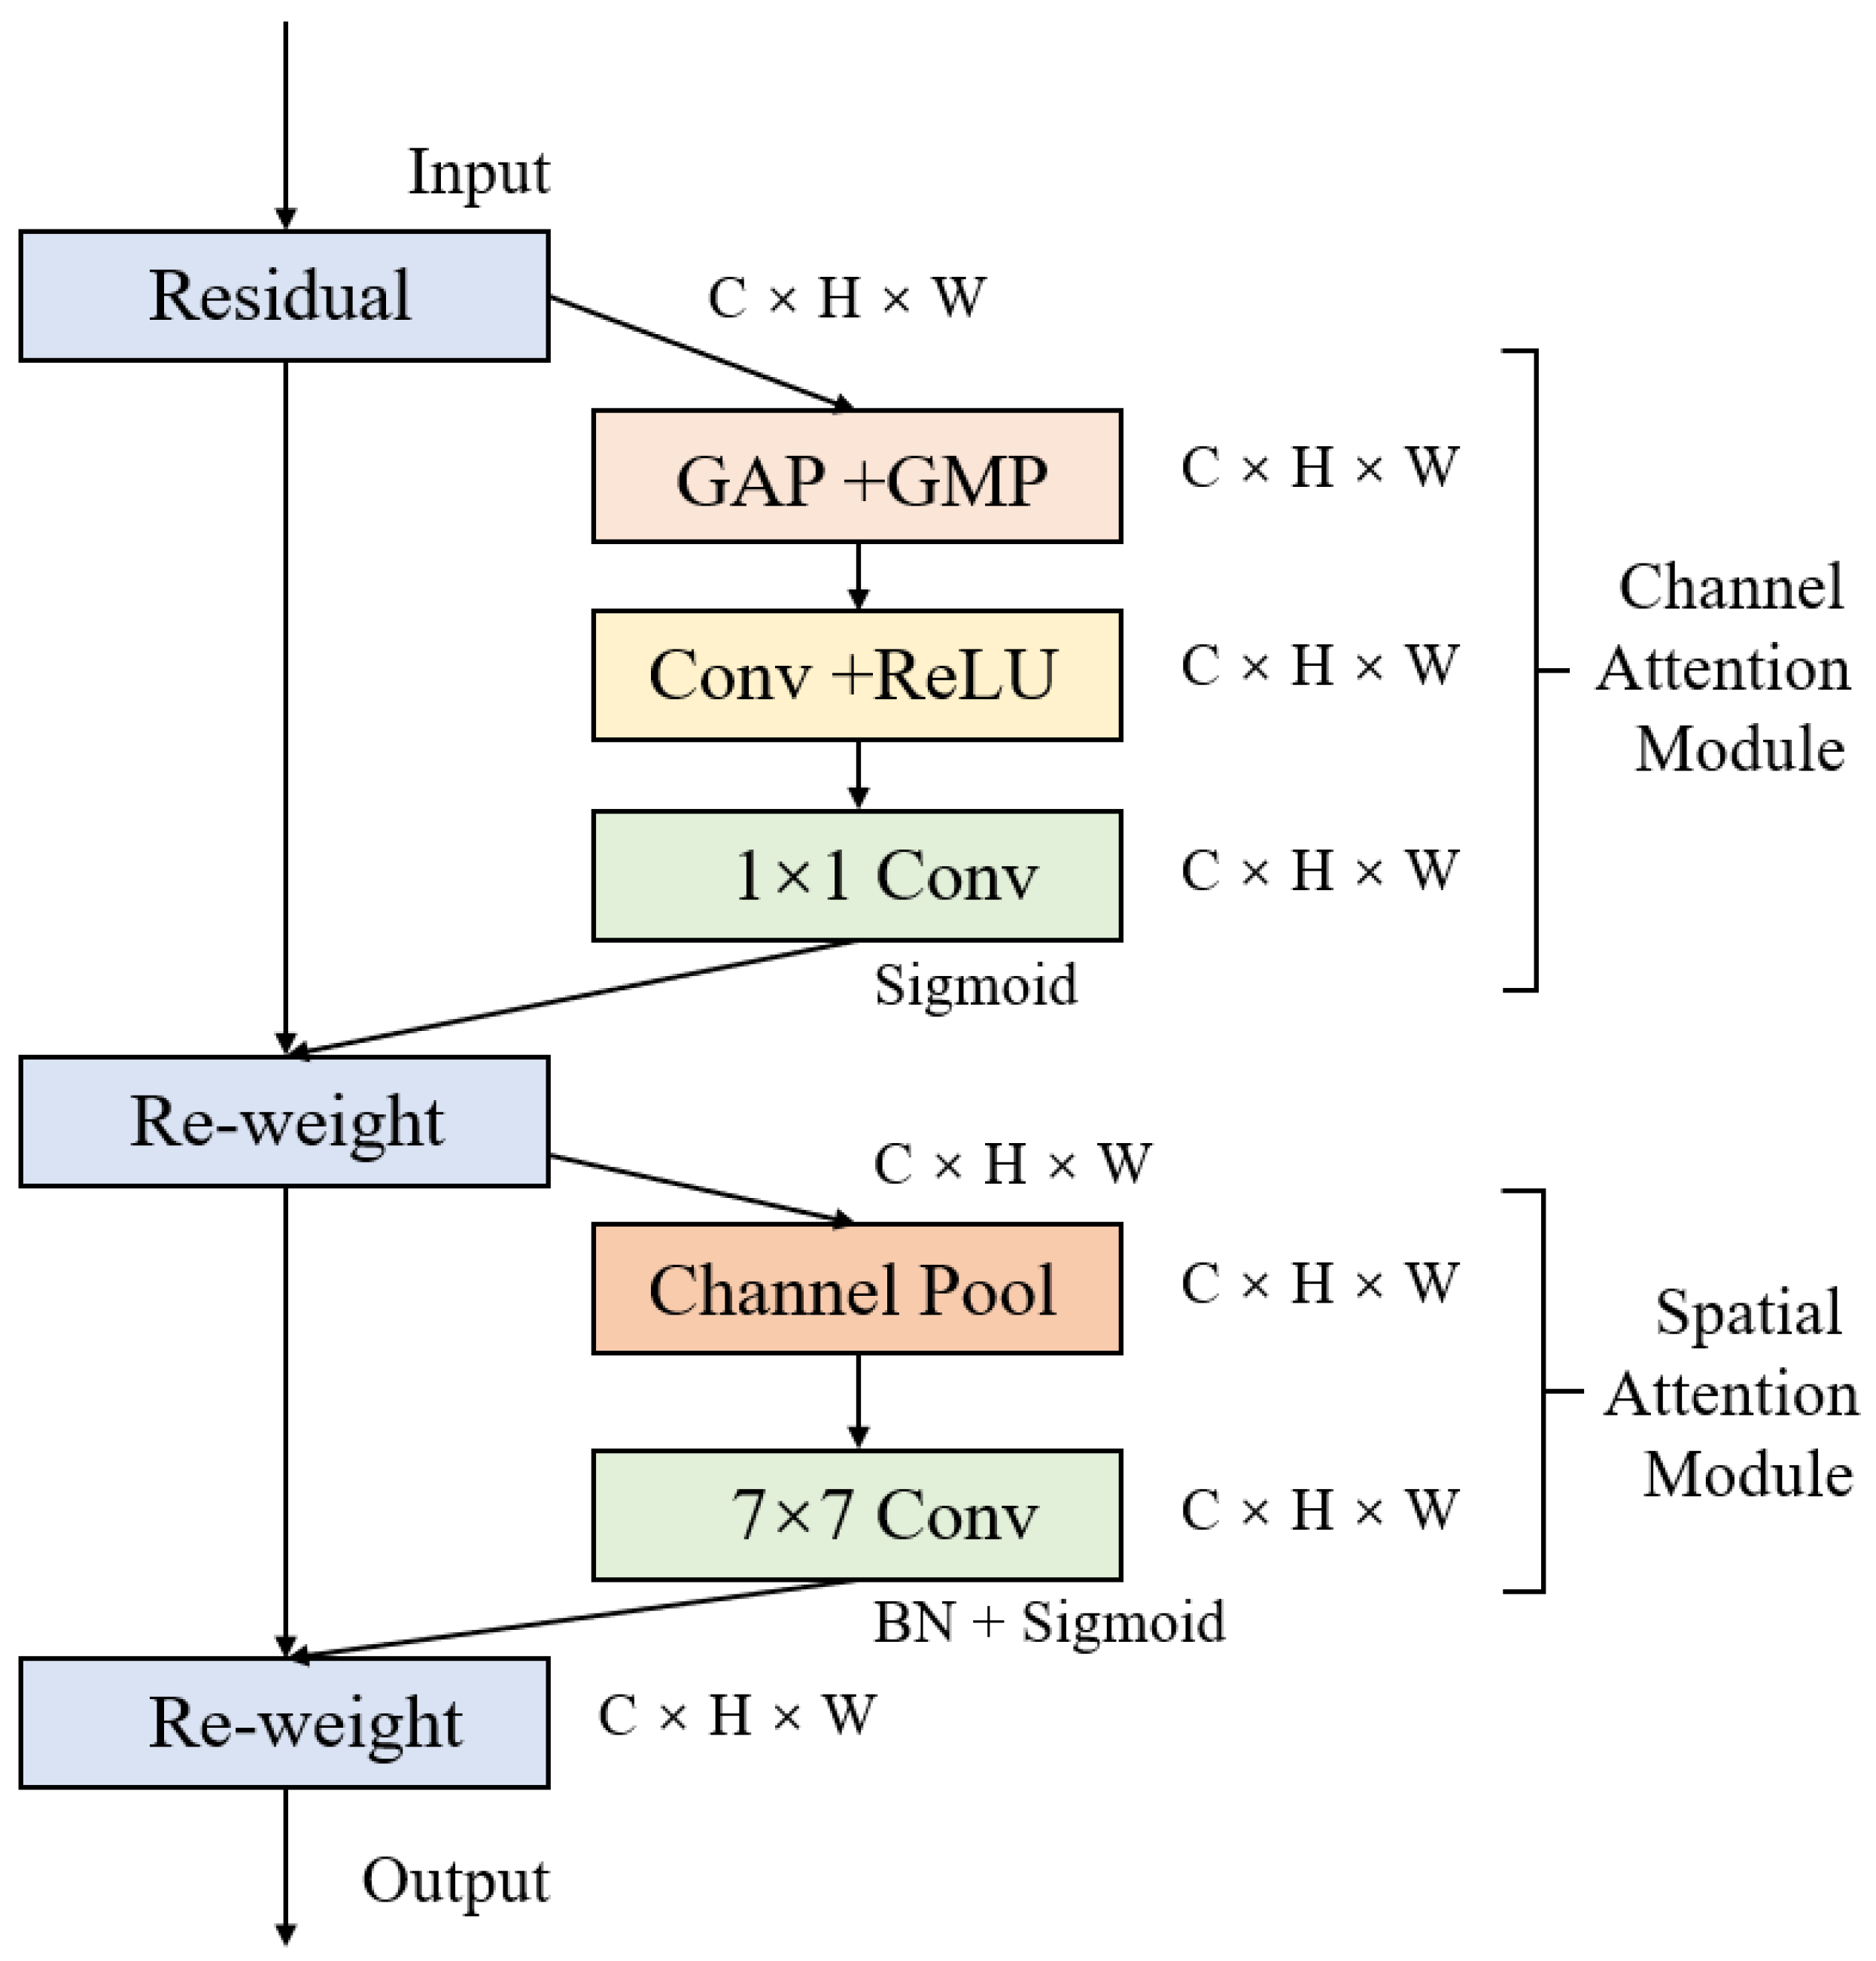
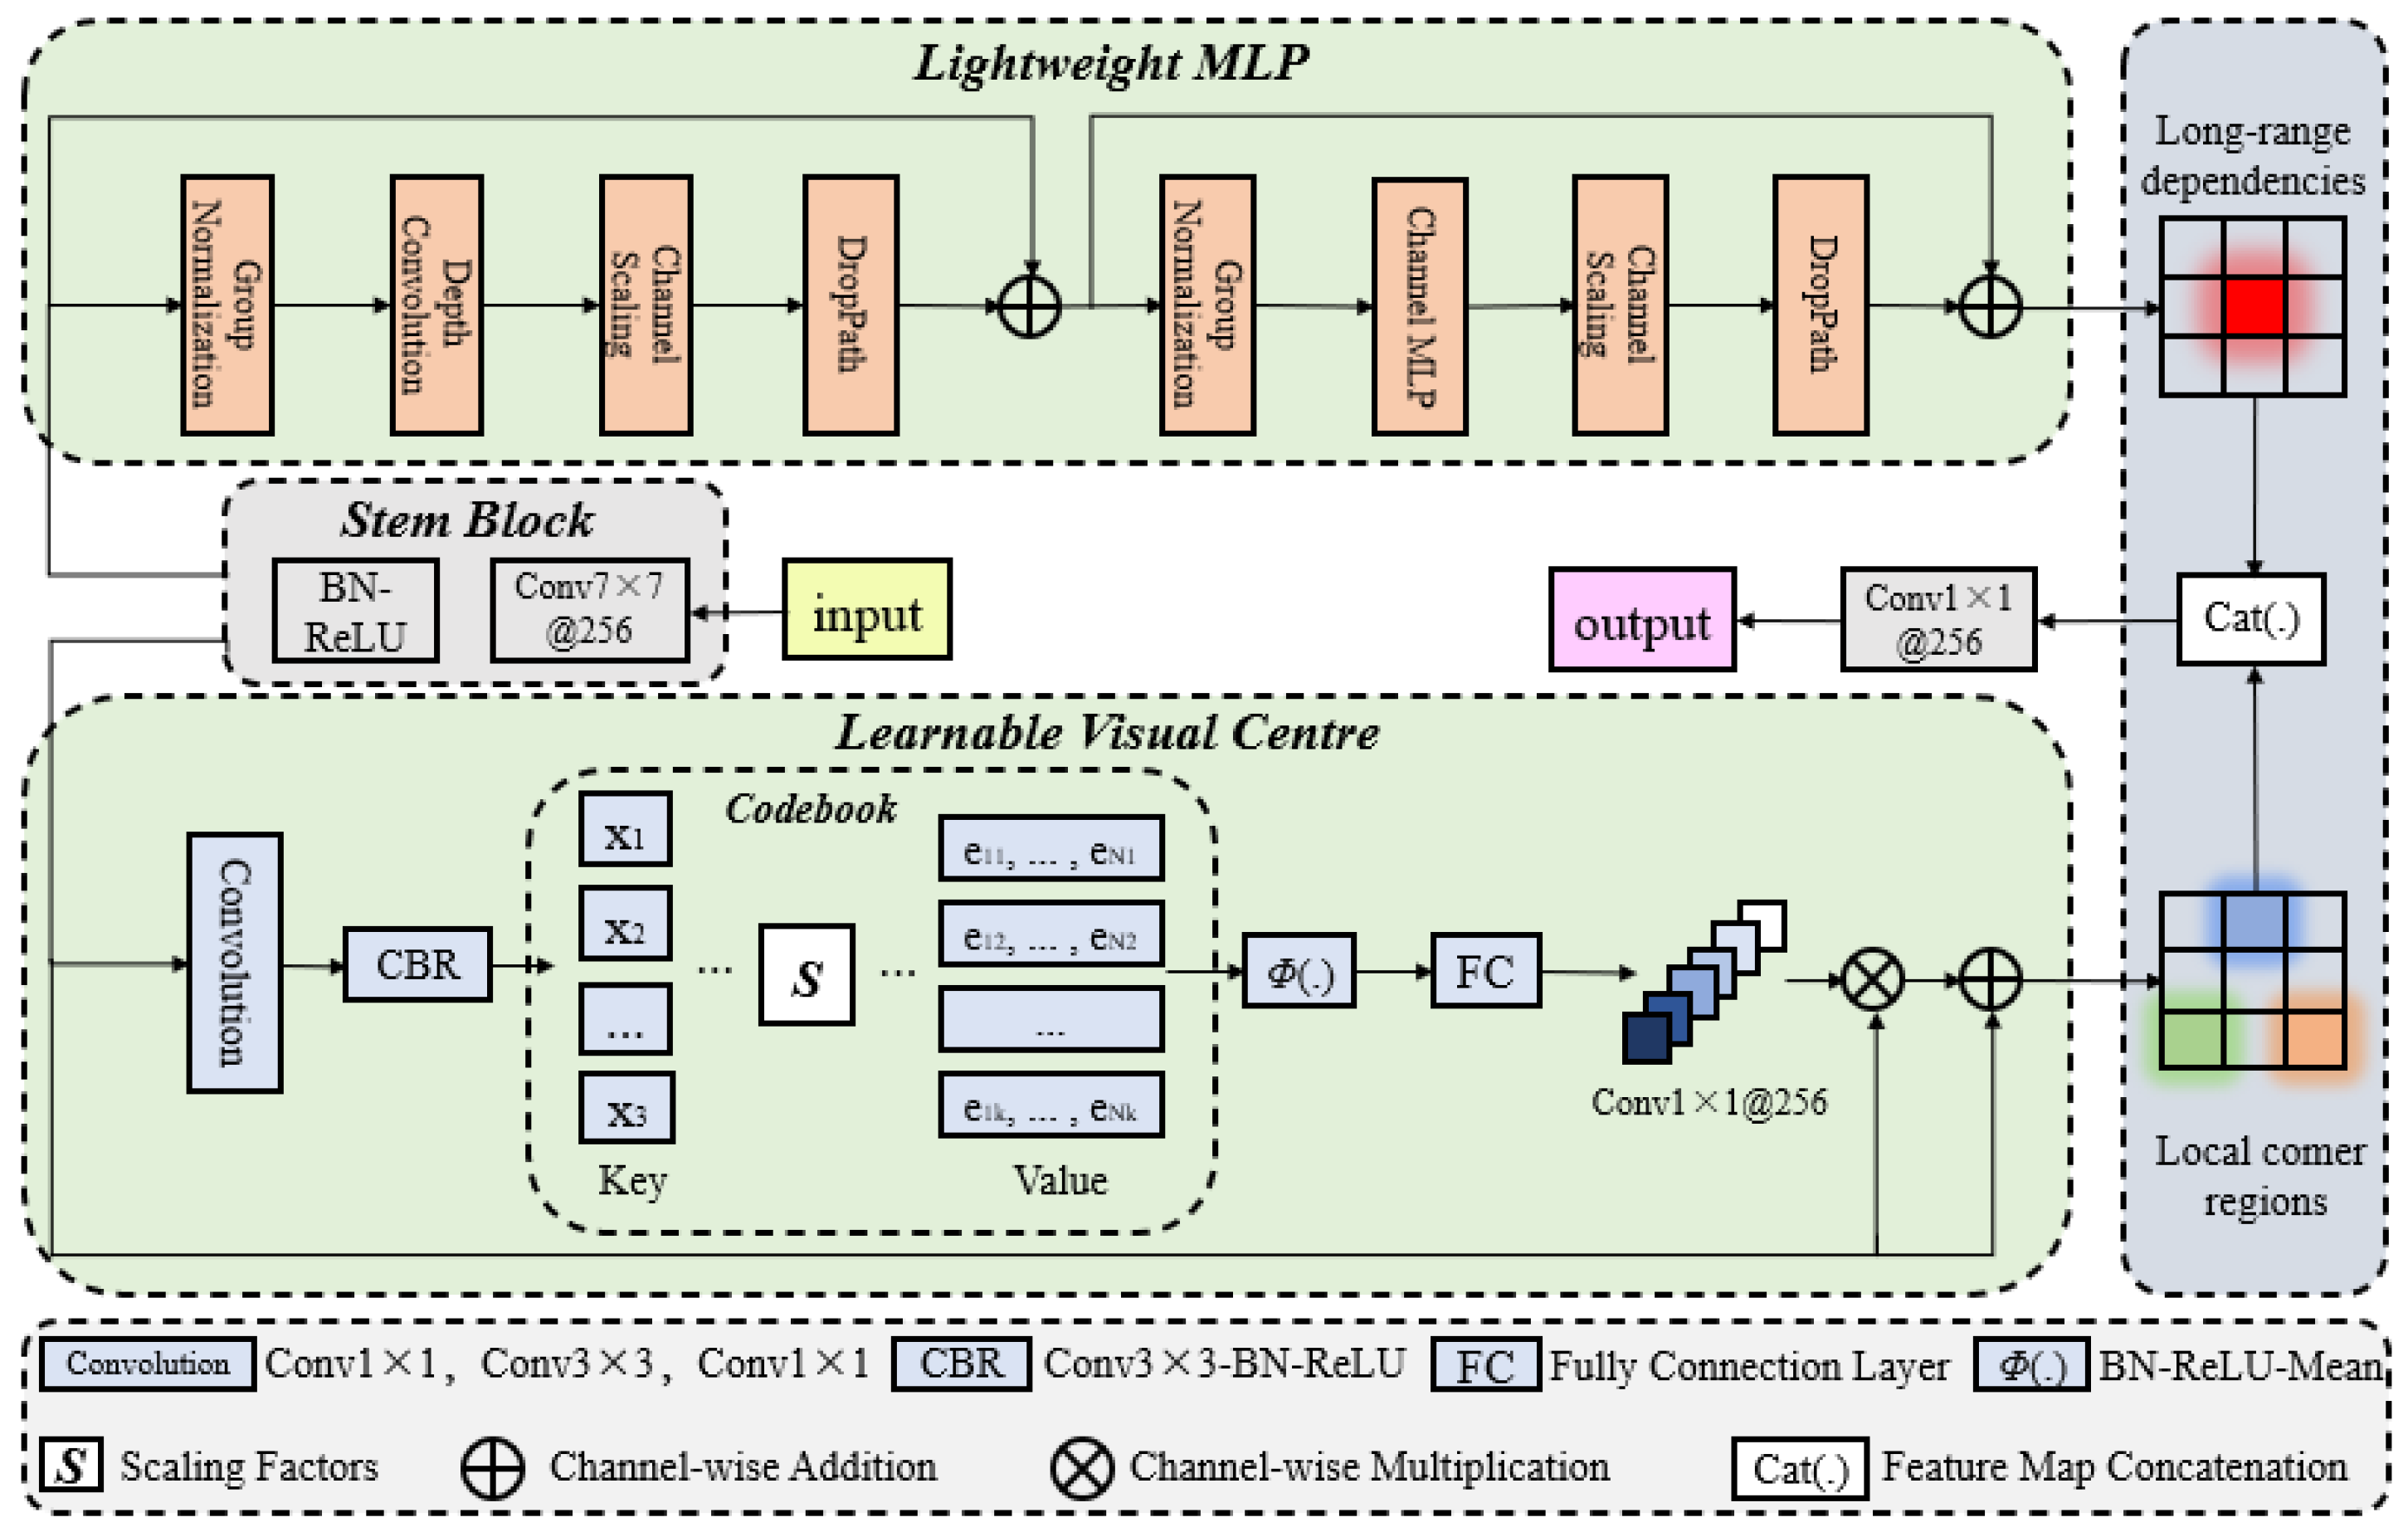
This study proposes a detection method named ODN-Pro, which aims to extract two-dimensional feature vectors containing more accurate three-dimensional point cloud information. We employ various data augmentation techniques on the collected point cloud maps, including random point sampling, random point cloud transformation, point cloud clipping, and noise addition. These augmentation methods help diversify the dataset, thereby enhancing the effectiveness of the learning process and improving the model’s robustness and generalization capability. Our method segments local maps from global point cloud maps, uniformly divides the local maps into grids in the x and y directions, and performs statistical operations on the point clouds within the grids. After comparing with feature extraction operators such as VFH and CVFH, we select the barycenter height ( Z ¯ ), density ( ρ ), and the angle ( θ ) between the main vector and the z-axis as point cloud features and construct a three-channel two-dimensional feature map. After comparing different window sizes for grid selection, we found that a grid resolution of 128 × 128 and a sliding window size of 3 × 3 in a 10 m × 10 m local map strike a balance between accuracy and speed. The processing time for point cloud features is 0.398 s and the mean average precision (mAP) for network detection is 0.844, achieved using the original version of the YOLOv8 network. Furthermore, we introduce the ECA block in the backbone network and the EVC block in the neck network of ODN-Pro, which results in improved detection performance. This enhancement is evidenced by the observed improvements in precision, recall, and mAP by 1.5%, 0.9%, and 1.2%, respectively.

Author Contributions

Methodology, Y.P., X.X., K.H. and H.K.; Software, Y.P. and X.X.; Validation, Y.P. and Y.J.; Formal analysis, K.H.; Data curation, Y.P.; Writing—original draft, Y.C.; Writing—review and editing, X.Z. and Y.C.; Supervision, X.Z.; Project administration, Y.C. All authors have read and agreed to the published version of the manuscript.

Funding

This research was partially funded by National Natural Science Foundation of China project (32171909), 2022 Annual Guangdong Province Basic and Applied Basic Research Fund Foshan City Joint Fund Project (2022A1515140013), and 2022 Annual High-Tech Field Science and Technology Tackling Key Problems Program Project (2022DB004).

Data Availability Statement

The data presented in this study are available on request from the corresponding author.

Conflicts of Interest

The authors declare no conflicts of interest.

References

  1. Maddikunta, P.K.R.; Hakak, S.; Alazab, M.; Bhattacharya, S.; Gadekallu, T.R.; Khan, W.Z.; Pham, Q.V. Unmanned aerial vehicles in smart agriculture: Applications, requirements, and challenges. IEEE Sens. J. 2021, 21, 17608–17619. [Google Scholar] [CrossRef]
  2. Handa, A.; Whelan, T.; McDonald, J.; Davison, A.J. A benchmark for RGB-D visual odometry, 3D reconstruction and SLAM. In Proceedings of the 2014 IEEE International Conference on Robotics and Automation (ICRA), Hong Kong, China, 31 May–7 June 2014; pp. 1524–1531. [Google Scholar]
  3. Anand, T.; Sinha, S.; Mandal, M.; Chamola, V.; Yu, F.R. AgriSegNet: Deep aerial semantic segmentation framework for IoT-assisted precision agriculture. IEEE Sens. J. 2021, 21, 17581–17590. [Google Scholar] [CrossRef]
  4. Ye, L.; Wu, F.; Zou, X.; Li, J. Path planning for mobile robots in unstructured orchard environments: An improved kinematically constrained bi-directional RRT approach. Comput. Electron. Agric. 2023, 215, 108453. [Google Scholar] [CrossRef]
  5. Kang, H.; Zhou, H.; Chen, C. Visual perception and modeling for autonomous apple harvesting. IEEE Access 2020, 8, 62151–62163. [Google Scholar] [CrossRef]
  6. Hu, K.; Chen, Z.; Kang, H.; Tang, Y. 3D vision technologies for a self-developed structural external crack damage recognition robot. Autom. Constr. 2024, 159, 105262. [Google Scholar] [CrossRef]
  7. Tang, Y.; Qi, S.; Zhu, L.; Zhuo, X.; Zhang, Y.; Meng, F. Obstacle Avoidance Motion in Mobile Robotics. J. Syst. Simul. 2024, 36, 1. [Google Scholar]
  8. Salazar-Gomez, A.; Darbyshire, M.; Gao, J.; Sklar, E.I.; Parsons, S. Beyond mAP: Towards practical object detection for weed spraying in precision agriculture. In Proceedings of the 2022 IEEE/RSJ International Conference on Intelligent Robots and Systems (IROS), Kyoto, Japan, 23–27 October 2022; pp. 9232–9238. [Google Scholar]
  9. Wu, F.; Duan, J.; Ai, P.; Chen, Z.; Yang, Z.; Zou, X. Rachis detection and three-dimensional localization of cut off point for vision-based banana robot. Comput. Electron. Agric. 2022, 198, 107079. [Google Scholar] [CrossRef]
  10. Tang, Y.; Chen, M.; Wang, C.; Luo, L.; Li, J.; Lian, G.; Zou, X. Recognition and localization methods for vision-based fruit picking robots: A review. Front. Plant Sci. 2020, 11, 510. [Google Scholar] [CrossRef] [PubMed]
  11. Tang, Y.; Qiu, J.; Zhang, Y.; Wu, D.; Cao, Y.; Zhao, K.; Zhu, L. Optimization strategies of fruit detection to overcome the challenge of unstructured background in field orchard environment: A review. Precis. Agric. 2023, 24, 1183–1219. [Google Scholar] [CrossRef]
  12. Cole, D.M.; Newman, P.M. Using laser range data for 3D SLAM in outdoor environments. In Proceedings of the Proceedings 2006 IEEE International Conference on Robotics and Automation, Orlando, FL, USA, 15–19 May 2006; pp. 1556–1563. [Google Scholar]
  13. Salazar-Gomez, A.; Darbyshire, M.; Gao, J.; Sklar, E.I.; Parsons, S. Towards practical object detection for weed spraying in precision agriculture. arXiv 2021, arXiv:2109.11048. [Google Scholar]
  14. Grisetti, G.; Kümmerle, R.; Stachniss, C.; Burgard, W. A tutorial on graph-based SLAM. IEEE Intell. Transp. Syst. Mag. 2010, 2, 31–43. [Google Scholar] [CrossRef]
  15. Ren, H.; Wu, J.; Lin, T.; Yao, Y.; Liu, C. Research on an Intelligent Agricultural Machinery Unmanned Driving System. Agriculture 2023, 13, 1907. [Google Scholar] [CrossRef]
  16. Chen, M.; Tang, Y.; Zou, X.; Huang, Z.; Zhou, H.; Chen, S. 3D global mapping of large-scale unstructured orchard integrating eye-in-hand stereo vision and SLAM. Comput. Electron. Agric. 2021, 187, 106237. [Google Scholar] [CrossRef]
  17. Jensen, R.R.; Hardin, P.J.; Hardin, A.J. Classification of urban tree species using hyperspectral imagery. Geocarto Int. 2012, 27, 443–458. [Google Scholar] [CrossRef]
  18. Chen, Y.; Xu, H.; Zhang, X.; Gao, P.; Xu, Z.; Huang, X. An object detection method for bayberry trees based on an improved YOLO algorithm. Int. J. Digit. Earth 2023, 16, 781–805. [Google Scholar] [CrossRef]
  19. Wang, X.; Zhao, Q.; Jiang, P.; Zheng, Y.; Yuan, L.; Yuan, P. LDS-YOLO: A lightweight small object detection method for dead trees from shelter forest. Comput. Electron. Agric. 2022, 198, 107035. [Google Scholar] [CrossRef]
  20. Cao, L.; Zheng, X.; Fang, L. The semantic segmentation of standing tree images based on the Yolo V7 deep learning algorithm. Electronics 2023, 12, 929. [Google Scholar] [CrossRef]
  21. Itakura, K.; Hosoi, F. Automatic tree detection from three-dimensional images reconstructed from 360 spherical camera using YOLO v2. Remote Sens. 2020, 12, 988. [Google Scholar] [CrossRef]
  22. Jiao, L.; Zhang, F.; Liu, F.; Yang, S.; Li, L.; Feng, Z.; Qu, R. A survey of deep learning-based object detection. IEEE Access 2019, 7, 128837–128868. [Google Scholar] [CrossRef]
  23. Zhao, Z.Q.; Zheng, P.; Xu, S.T.; Wu, X. Object detection with deep learning: A review. IEEE Trans. Neural Netw. Learn. Syst. 2019, 30, 3212–3232. [Google Scholar] [CrossRef]
  24. Chen, M.Y.; Wu, H.T.; Chiu, W.Y. An Intelligent Agriculture Application Based on Deep Learning. In Proceedings of the 2018 International Conference on System Science and Engineering (ICSSE), New Taipei City, Taiwan, 28–30 June 2018; pp. 1–5. [Google Scholar]
  25. Meng, F.; Li, J.; Zhang, Y.; Qi, S.; Tang, Y. Transforming unmanned pineapple picking with spatio-temporal convolutional neural networks. Comput. Electron. Agric. 2023, 214, 108298. [Google Scholar] [CrossRef]
  26. Tang, Y.; Zhou, H.; Wang, H.; Zhang, Y. Fruit detection and positioning technology for a Camellia oleifera C. Abel orchard based on improved YOLOv4-tiny model and binocular stereo vision. Expert Syst. Appl. 2023, 211, 118573. [Google Scholar] [CrossRef]
  27. Wu, F.; Yang, Z.; Mo, X.; Wu, Z.; Tang, W.; Duan, J.; Zou, X. Detection and counting of banana bunches by integrating deep learning and classic image-processing algorithms. Comput. Electron. Agric. 2023, 209, 107827. [Google Scholar] [CrossRef]
  28. Milioto, A.; Lottes, P.; Stachniss, C. Real-time semantic segmentation of crop and weed for precision agriculture robots leveraging background knowledge in CNNs. In Proceedings of the 2018 IEEE International Conference on Robotics And Automation (ICRA), Brisbane, Australia, 21–25 May 2018; pp. 2229–2235. [Google Scholar]
  29. Guastella, D.C.; Muscato, G. Learning-based methods of perception and navigation for ground vehicles in unstructured environments: A review. Sensors 2020, 21, 73. [Google Scholar] [CrossRef]
  30. Reina, G.; Milella, A. Towards autonomous agriculture: Automatic ground detection using trinocular stereovision. Sensors 2012, 12, 12405–12423. [Google Scholar] [CrossRef]
  31. Roslan, Z.; Awang, Z.; Husen, M.N.; Ismail, R.; Hamzah, R. Deep learning for tree crown detection in tropical forest. In Proceedings of the 2020 14th International Conference on Ubiquitous Information Management and Communication (IMCOM), Taichung, Taiwan, 3–5 January 2020; pp. 1–7. [Google Scholar]
  32. Chen, M.; Tang, Y.; Zou, X.; Huang, K.; Huang, Z.; Zhou, H.; Wang, C.; Lian, G. Three-dimensional perception of orchard banana central stock enhanced by adaptive multi-vision technology. Comput. Electron. Agric. 2020, 174, 105508. [Google Scholar] [CrossRef]
  33. Chen, Y.; Zhang, B.; Zhou, J.; Wang, K. Real-time 3D unstructured environment reconstruction utilizing VR and Kinect-based immersive teleoperation for agricultural field robots. Comput. Electron. Agric. 2020, 175, 105579. [Google Scholar] [CrossRef]
  34. Wallace, L.; Lucieer, A.; Watson, C.S. Evaluating tree detection and segmentation routines on very high resolution UAV LiDAR data. IEEE Trans. Geosci. Remote Sens. 2014, 52, 7619–7628. [Google Scholar] [CrossRef]
  35. Secord, J.; Zakhor, A. Tree detection in urban regions using aerial lidar and image data. IEEE Geosci. Remote Sens. Lett. 2007, 4, 196–200. [Google Scholar] [CrossRef]
  36. Guan, H.; Yu, Y.; Ji, Z.; Li, J.; Zhang, Q. Deep learning-based tree classification using mobile LiDAR data. Remote Sens. Lett. 2015, 6, 864–873. [Google Scholar] [CrossRef]
  37. Jansen, L.; Liebrecht, N.; Soltaninejad, S.; Basu, A. 3d object classification using 2d perspectives of point clouds. In Proceedings of the International Conference on Smart Multimedia, San Diego, CA, USA, 16–18 December 2019; Springer: Berlin/Heidelberg, Germany, 2019; pp. 453–462. [Google Scholar]
  38. Li, B.; Zhang, T.; Xia, T. Vehicle detection from 3d lidar using fully convolutional network. arXiv 2016, arXiv:1608.07916. [Google Scholar]
  39. Barrera, A.; Guindel, C.; Beltrán, J.; García, F. Birdnet+: End-to-end 3d object detection in lidar bird’s eye view. In Proceedings of the 2020 IEEE 23rd International Conference on Intelligent Transportation Systems (ITSC), Rhodes, Greece, 20–23 September 2020; pp. 1–6. [Google Scholar]
  40. Beltrán, J.; Guindel, C.; Moreno, F.M.; Cruzado, D.; Garcia, F.; De La Escalera, A. Birdnet: A 3d object detection framework from lidar information. In Proceedings of the 2018 21st International Conference on Intelligent Transportation Systems (ITSC), Maui, HI, USA, 4–7 November 2018; pp. 3517–3523. [Google Scholar]
  41. Pan, Y.; Cao, H.; Hu, K.; Kang, H.; Wang, X. A novel perception and semantic mapping method for robot autonomy in orchards. arXiv 2023, arXiv:2308.16748. [Google Scholar] [CrossRef]
  42. Shan, T.; Englot, B.; Meyers, D.; Wang, W.; Ratti, C.; Rus, D. Lio-sam: Tightly-coupled lidar inertial odometry via smoothing and mapping. In Proceedings of the 2020 IEEE/RSJ International Conference on Intelligent Robots and Systems (IROS), Las Vegas, NV, USA, 24 October 2020–24 January 2021; pp. 5135–5142. [Google Scholar]
  43. Lin, J.; Zhang, F. R 3 LIVE: A Robust, Real-time, RGB-colored, LiDAR-Inertial-Visual tightly-coupled state Estimation and mapping package. In Proceedings of the 2022 International Conference on Robotics and Automation (ICRA), Philadelphia, PA, USA, 23–27 May 2022; pp. 10672–10678. [Google Scholar]
  44. Simon, M.; Milz, S.; Amende, K.; Gross, H.M. Complex-yolo: Real-time 3d object detection on point clouds. arXiv 2018, arXiv:1803.06199. [Google Scholar]
  45. Datar, M.; Gionis, A.; Indyk, P.; Motwani, R. Maintaining stream statistics over sliding windows. Siam J. Comput. 2002, 31, 1794–1813. [Google Scholar] [CrossRef]
  46. Braverman, V.; Ostrovsky, R.; Zaniolo, C. Optimal sampling from sliding windows. In Proceedings of the Twenty-Eighth Acm Sigmod-Sigact-Sigart Symposium on Principles of Database Systems; UCLA Computer Science: Los Angeles, CA, USA, 2009; pp. 147–156. [Google Scholar]
  47. Jocher, G.; Chaurasia, A.; Qiu, J. Yolo by Ultralytics. Available online: https://github.com/ultralytics/ultralytics (accessed on 2 January 2023).
  48. Woo, S.; Park, J.; Lee, J.Y.; Kweon, I.S. Cbam: Convolutional block attention module. In Proceedings of the European Conference on Computer Vision (ECCV), Tel Aviv, Israel, 23–27 October 2022; pp. 3–19. [Google Scholar]
  49. Fu, H.; Song, G.; Wang, Y. Improved YOLOv4 marine target detection combined with CBAM. Symmetry 2021, 13, 623. [Google Scholar] [CrossRef]
  50. Wang, Q.; Wu, B.; Zhu, P.; Li, P.; Zuo, W.; Hu, Q. ECA-Net: Efficient channel attention for deep convolutional neural networks. In Proceedings of the IEEE/CVF Conference on Computer Vision and Pattern Recognition, Seattle, WA, USA, 14–19 June 2020; pp. 11534–11542. [Google Scholar]
  51. Bello, I.; Zoph, B.; Vaswani, A.; Shlens, J.; Le, Q.V. Attention augmented convolutional networks. In Proceedings of the IEEE/CVF International Conference on Computer Vision, Montreal, BC, Canada, 11–17 October 2021; pp. 3286–3295. [Google Scholar]
  52. Quan, Y.; Zhang, D.; Zhang, L.; Tang, J. Centralized feature pyramid for object detection. IEEE Trans. Image Process. 2023, 32, 4341–4354. [Google Scholar] [CrossRef] [PubMed]
  53. Ma, N.; Zhang, X.; Zheng, H.T.; Sun, J. Shufflenet v2: Practical guidelines for efficient cnn architecture design. In Proceedings of the European Conference on Computer Vision (ECCV), Glasgow, UK, 23–28 August 2020; pp. 116–131. [Google Scholar]
  54. Roy, A.G.; Navab, N.; Wachinger, C. Recalibrating fully convolutional networks with spatial and channel “squeeze and excitation” blocks. IEEE Trans. Med Imaging 2018, 38, 540–549. [Google Scholar] [CrossRef] [PubMed]
  55. Lou, H.; Duan, X.; Guo, J.; Liu, H.; Gu, J.; Bi, L.; Chen, H. DC-YOLOv8: Small-Size Object Detection Algorithm Based on Camera Sensor. Electronics 2023, 12, 2323. [Google Scholar] [CrossRef]
  56. Zhou, J.; Zhang, Y.; Wang, J. RDE-YOLOv7: An improved model based on YOLOv7 for better performance in detecting dragon fruits. Agronomy 2023, 13, 1042. [Google Scholar] [CrossRef]
  57. Qi, C.R.; Yi, L.; Su, H.; Guibas, L.J. Pointnet++: Deep hierarchical feature learning on point sets in a metric space. arXiv 2017, arXiv:1706.02413. [Google Scholar]
Figure 1. The data collection scenes. (a) Lychee orchard. (b) Cherry orchard. (c) Plum blossom orchard.
Agronomy 14 00697 g001
Figure 2. AGX-HUNTER.
Agronomy 14 00697 g002
Figure 3. Data Augmentation. (a) Original point cloud. (b) Random point sampling. (c) Random rotation. (d) Random scaling. (e) Random point cloud clipping. (f) Noise addition.
Agronomy 14 00697 g003
Figure 4. System overview. The green border represents the predicted box in the feature map, while the red border represents the predicted box in the 3D space.
Agronomy 14 00697 g004
Figure 5. Feature encode processing. (a) Global point cloud map. (b) The segmented local map. (c) Different types of feature maps. (d) The merged feature map.
Agronomy 14 00697 g005
Figure 6. Sliding windows illustration. A sliding window is a fixed-size window that slides over the data sequence from beginning to end in certain steps. At each position, the window captures a portion of the data in the sequence for processing.
Agronomy 14 00697 g006
Figure 7. YOLOv8 illustration. Its network structure consists of the following three main parts. The backbone of YOLOv8 comprises a series of convolutional and deconvolutional layers used for feature extraction. It also includes residual connections and bottleneck structures to reduce network size and improve performance. This part utilizes the C2f module as the basic building block. The neck employs a multi-scale feature fusion technique, including an SPPF module, a PAA module, and two PAN modules, to merge feature maps from different stages of the backbone network, thereby enhancing feature representation capability. The head is responsible for the final object detection and classification tasks, consisting of a detection head and a classification head. The detection head comprises a series of convolutional and deconvolutional layers for generating detection results, while the classification head uses global average pooling for classifying each feature map.
Agronomy 14 00697 g007
Figure 8. The structure of the Convolutional Block Attention Module (CBAM). It is an attention mechanism utilized within convolutional neural networks (CNNs) to enhance the model’s perceptual capability of features, thereby improving its performance. It integrates both the Channel Attention Module and Spatial Attention Module, which respectively focus on the inter-channel correlations and spatial positional correlations. This integration enhances the representational capacity of features.
Agronomy 14 00697 g008
Figure 9. The structure of the Efficient Channel Attention (ECA) block consists of two main components: a 1D convolutional layer and a sigmoid activation function.
Agronomy 14 00697 g009
Figure 10. The structure of the EVC block. It consists of two components: the MLP and the LVC.
Agronomy 14 00697 g010
Figure 11. The structure of ODN-Pro.We introduce the ECA block in the backbone network. And the EVC block is introduced into the neck network.
Agronomy 14 00697 g011
Figure 12. The training process of the different methods introduced into YOLOv8. (a) Original YOLOv8 test result. (b) YOLOv8-CBAM test result. (c) YOLOv8-ECA test result. (d) YOLOv8-EVC test result.
Agronomy 14 00697 g012
Figure 13. The object detection results of cherry orchard. (a,b) Detection results of the map generated by LIO-SAM. (c,d) Detection results of the map generated by R3Live.
Agronomy 14 00697 g013
Figure 14. The object detection results of plum blossom orchard. (a,b) Detection results of the map generated by LIO-SAM. (c,d) Detection results of the map generated by R3Live.
Agronomy 14 00697 g014
Table 1. The parameters in the training process.
ParametersValue
Epoch300
Initial learning rate0.01
Batch size16
momentum0.937
Weight decay0.0005
Loss functionBCE, CIoU
Table 2. Comparison results of different sizes of sliding windows.
Window SizeProcessing Time (s)mAP
Test 11 × 10.1680.664
Test 23 × 30.3980.844
Test 35 × 50.6910.848
Table 3. Comparison results of coding methods.
Encoding MethodsProcessing Time (s)mAP
Test 1ours0.3980.844
Test 2VFH2.130.857
Test 3CVFH9.210.860
Table 4. Testing performance of pointnet++.
MethodsParameterPrediction Time (s)mIoU
Test 1ours3 × 30.4100.819
Test 2Pointnet++MSG and 10000.5170.798
Test 3Pointnet++MSG and 25000.9430.824
Test 4Pointnet++MSG and 50001.390.843
Table 5. The parameters in the training process.
MethodsPRmAP
YOLOv80.9530.9750.844
YOLOv8-ECA0.8740.9680.848
YOLOv8-CBAM0.8430.9840.855
YOLOv8-EVC0.8980.9970.854
Table 6. Ablation Experiments of ECA, CBAM, and EVC.
EVCCBAMECAPRmAP
0.9530.9750.844
0.8980.9970.854
0.9110.9860.849
0.9680.9840.856
Table 7. The results of K-fold cross-validation.
MethodsParameterFold 1Fold 2Fold 3Fold 4Fold 5Average
YOLOv8P0.8910.8480.7880.870.8020.8398
R0.8950.8270.9220.860.8890.8786
mAP0.7980.7260.7870.7250.7420.7556
ODN-ProP0.9250.8640.8970.9440.7780.8816
R0.9260.9810.9220.9340.9410.9408
mAP0.8390.8320.8150.8370.8030.8252
Disclaimer/Publisher’s Note: The statements, opinions and data contained in all publications are solely those of the individual author(s) and contributor(s) and not of MDPI and/or the editor(s). MDPI and/or the editor(s) disclaim responsibility for any injury to people or property resulting from any ideas, methods, instructions or products referred to in the content.

