Article

A Method for Analyzing the Phenotypes of Nonheading Chinese Cabbage Leaves Based on Deep Learning and OpenCV Phenotype Extraction

1
College of Horticulture, Fujian Agriculture and Forestry University, Fuzhou 350002, China
2
Key Laboratory of Crop Genetics and Breeding and Comprehensive Utilization, Ministry of Education, Fujian Agriculture and Forestry University, Fuzhou 350002, China
3
Fuzhou Smart Agriculture (Seed Industry) Industry Innovation Center, Fuzhou 350002, China
4
College of Computer and Information Sciences, Fujian Agriculture and Forestry University, Fuzhou 350002, China
5
Fujian Agricultural Machinery Extension Station, Fuzhou 350002, China
*
Authors to whom correspondence should be addressed.
Agronomy 2024, 14(4), 699; https://doi.org/10.3390/agronomy14040699
Submission received: 8 March 2024 / Revised: 23 March 2024 / Accepted: 26 March 2024 / Published: 28 March 2024

Abstract

:
Nonheading Chinese cabbage is an important leafy vegetable, and quantitative identification and automated analysis of nonheading Chinese cabbage leaves are crucial for cultivating new varieties with higher quality, yield, and resistance. Traditional leaf phenotypic analysis relies mainly on phenotypic observation and the practical experience of breeders, leading to issues such as time consumption, labor intensity, and low precision, which result in low breeding efficiency. Considering these issues, a method for the extraction and analysis of phenotypes of nonheading Chinese cabbage leaves is proposed, targeting four qualitative traits and ten quantitative traits from 1500 samples, by integrating deep learning and OpenCV image processing technology. First, a leaf classification model is trained using YOLOv8 to infer the qualitative traits of the leaves, followed by the extraction and calculation of the quantitative traits of the leaves using OpenCV image processing technology. The results indicate that the model achieved an average accuracy of 95.25%, an average precision of 96.09%, an average recall rate of 96.31%, and an average F1 score of 0.9620 for the four qualitative traits. From the ten quantitative traits, the OpenCV-calculated values for the whole leaf length, leaf width, and total leaf area were compared with manually measured values, showing RMSEs of 0.19 cm, 0.1762 cm, and 0.2161 cm2, respectively. Bland–Altman analysis indicated that the error values were all within the 95% confidence intervals, and the average detection time per image was 269 ms. This method achieved good results in the extraction of phenotypic traits from nonheading Chinese cabbage leaves, significantly reducing the personpower and time costs associated with genetic resource analysis. This approach provides a new technique for the analysis of nonheading Chinese cabbage genetic resources that is high-throughput, precise, and automated.

1. Introduction

Nonheading Chinese cabbage (Brassica campestris L.), also known as bok choy, pakchoi, and coleseed, is one of the most important vegetable crops in the Brassicaceae family, originating from the middle and lower reaches of the Yangtze River in China. It ischaracterized by a short growth cycle, high cropping index, rapid renewal of good varieties, and rich germplasm resources [1,2,3]. widely cultivated in East Asian countries such as China, Korea, and Japan, and in recent years, it has been extensively introduced to countries in Europe and America, gradually becoming an important vegetable worldwide. With the continuous development of the nonheading Chinese cabbage industry, there is a need to breed new varieties that are of high quality, high yield, and resistant to multiple stresses [4]. The precise, intelligent, and high-throughput identification of germplasm resource phenotypes is the foundation for smooth progress in genetic breeding. Moreover, phenotypic identification of a large number of population materials during the breeding process is one of the most important steps [5]. The morphological characteristics of leaves, structures directly affected by the physiological and genetic traits of nonheading Chinese cabbage, including shape and size, are key indicators for assessing their adaptability to the environment. A detailed study of the phenotypes of nonheading Chinese cabbage leaves not only provides crucial information for a deep understanding of genetic diversity and evolution but also aids in revealing the mechanisms of response to specific environmental stresses, such as drought, disease resistance, and cold adaptability, which is critical for selecting varieties with better adaptability in breeding [6]. Additionally, variations in the phenotype of nonheading leaves are important indicators of plant health status and pest and disease detection. Therefore, the quantitative identification and automated analysis of nonheading Chinese cabbage leaf phenotypes not only play an important role in improving crop quality and increasing yield but are also key to advancing genetic improvement and breeding efforts.
Traditional phenotyping identification techniques for nonheading Chinese cabbage are relatively outdated, with trait data collection primarily conducted manually. Not only is the collection process time-consuming and costly in terms of human resources [7], manual judgments are subject to subjective factors, leading to variability in assessments by the same individual at different times due to factors such as fatigue, and traditional methods such as the grid system suffer from a lack of precision, all of which contribute to the low accuracy of the results obtained. With the continuous development of phenomics technology, the level of germplasm resource identification and evaluation has further improved. High-throughput sequencing and genomics technologies have led to revolutionary breakthroughs in gene discovery and application, leading to a new phase of molecular crop breeding. However, compared to the rapid development of genomics technologies, the development of crop phenotypic high-throughput detection technology and the integrated analysis technology of multiomics big data are still lagging significantly. Phenotypic detection technology has become an obstacle to the rapid development of modern breeding technologies [8]. In recent years, numerous scholars have conducted extensive research on plant phenotypes. Wei et al. [9] studied plant diseases using the lab color space model for leaf segmentation and feature extraction and finally used a kernel function-based support vector machine multiclassification method to detect four types of diseases, with the highest recognition accuracy reaching 89.50%. Deng et al. [10] proposed a method for writing a detection and identification program for large-leaf privet leaves based on OpenCV. The results confirmed that the feature object detection method based on OpenCV is feasible and relatively simple for detecting large-leaf privet leaves in complex-background video images. Gong et al. [11] developed a winter wheat leaf morphology measurement algorithm based on machine vision and designed software on the basis of the image processing libraries of VB.net and OpenCV on the NT platform. The software can perform distortion calibration of digital images and simultaneously measure the length, width, and area of multiple leaves. Xu et al. [12] proposed a nondestructive measurement method for cucumber seedling phenotypes using an RGB-D camera. The test results show that the system has good quantity and accuracy and can effectively replace manual measurement methods. JAISAKTHI et al. [13] used the global thresholding method to extract diseased parts of grape leaves and then classified grape leaf images using a support vector machine, achieving an accuracy of 93.04% on test images.
Deep learning technology can automatically learn the intrinsic connections and patterns among data using labeled datasets. A well-trained deep learning model can extract deep features from images and use these features to classify images or identify targets within them, boasting high accuracy and fast recognition capabilities [14]. In recent years, deep learning has gradually become an important research tool for crop phenotypic analysis that is capable of improving the management efficiency of crop production. Yang et al. [15] proposed a method for detecting corn leaf phenotypes based on computer vision technology and deep learning methods, establishing a corn leaf phenotype regression detection model. Yang et al. [16]. conducted a case study on the classification of lemon leaf images using deep learning-based computer vision technology. The results indicate that mobile networks have more promising prospects in practice, and computer vision shows potential application prospects in precision agriculture. Chang et al. [17] applied the YOLOv5 network model based on the PyTorch framework to train a leaf dataset and tested leaf images with the trained model, achieving an average precision of 93% in leaf recognition, with good results in terms of both recognition speed and accuracy. Liu et al. [18] used the DCNSE-YOLOv7 algorithm to detect pests and diseases on cucumber leaves. The experimental results showed that the accuracy of the improved model was 96.02%, with a detection speed of 52.04/s and an average precision of 94.25%. Miao et al. [19] proposed an improved method for detecting the ripeness of cherry tomatoes using a lightweight YOLO v7 model. This study indicated that the improved YOLO v7 model can provide technical support for the automated harvesting of cherry tomato fruits. Wang et al. [20], based on a fully convolutional neural network, optimized the model architecture and key functions to achieve high-throughput segmentation of plant leaf images. The morphological parameters extracted from the segmentation results can be used in studies related to crop growth monitoring and other research areas.
Previous studies have shown clear limitations in the acquisition of phenotypic data, mostly detecting single traits, being unable to simultaneously obtain multiple phenotypic traits, or relying on a single processing method, in turn leading to large calculation errors and not meeting the actual production needs. This study integrates the YOLOv8 classification model and OpenCV image processing technology as part of a comprehensive algorithm. This method can obtain four qualitative traits and ten quantitative traits from a single image of nonheading Chinese cabbage leaves, providing a new high-throughput, precise, automated technology for the analysis of nonheading Chinese cabbage genetic resources.

2. Materials and Methods

2.1. Construction of Test Materials and Datasets

The sample plants for this study were sourced from the green leafy vegetable base of the New Variety Display and Evaluation Base (Langqi) of the Fujian Provincial Seed Industry Innovation Center. A total of 150 varieties were selected, with 10 plants randomly selected for each variety, resulting in 1500 samples in total. For each sample, 3 to 4 mature leaves were randomly collected, resulting in 5500 leaf images with an original resolution of 3604 × 4986 pixels. The collected leaves were placed against a uniform-color background and photographed using an HT-GE1000C-T-CL industrial camera (HuaTeng Vision, Shenzhen, China). During photography, two variables were strictly controlled: the camera level was maintained at the level of the leaves to avoid angle errors that could increase calculation errors, and the shooting distance was controlled to ensure that all the leaves were of similar size to minimize the impact of size on classification.
Considering that an insufficient training sample size during model training could lead to overfitting, a series of data augmentation measures were implemented to expand the sample size and enhance the model’s generalizability and robustness [21,22,23]. This study utilized random combinations of data augmentation techniques such as mirroring, brightness adjustment, Gaussian blur, contrast adjustment, and perspective transformation [24,25], with some of the data-augmented samples shown in Figure 1. The dataset size was effectively expanded, ultimately resulting in a total of 26,450 images that had been enhanced.
To maximize the model’s learning efficiency and prediction accuracy, the enhanced images were allocated and divided into training and test sets at a ratio of 8:2. The training set was used for the model’s initial learning and parameter adjustment; the test set was used to evaluate the model’s performance on new data.

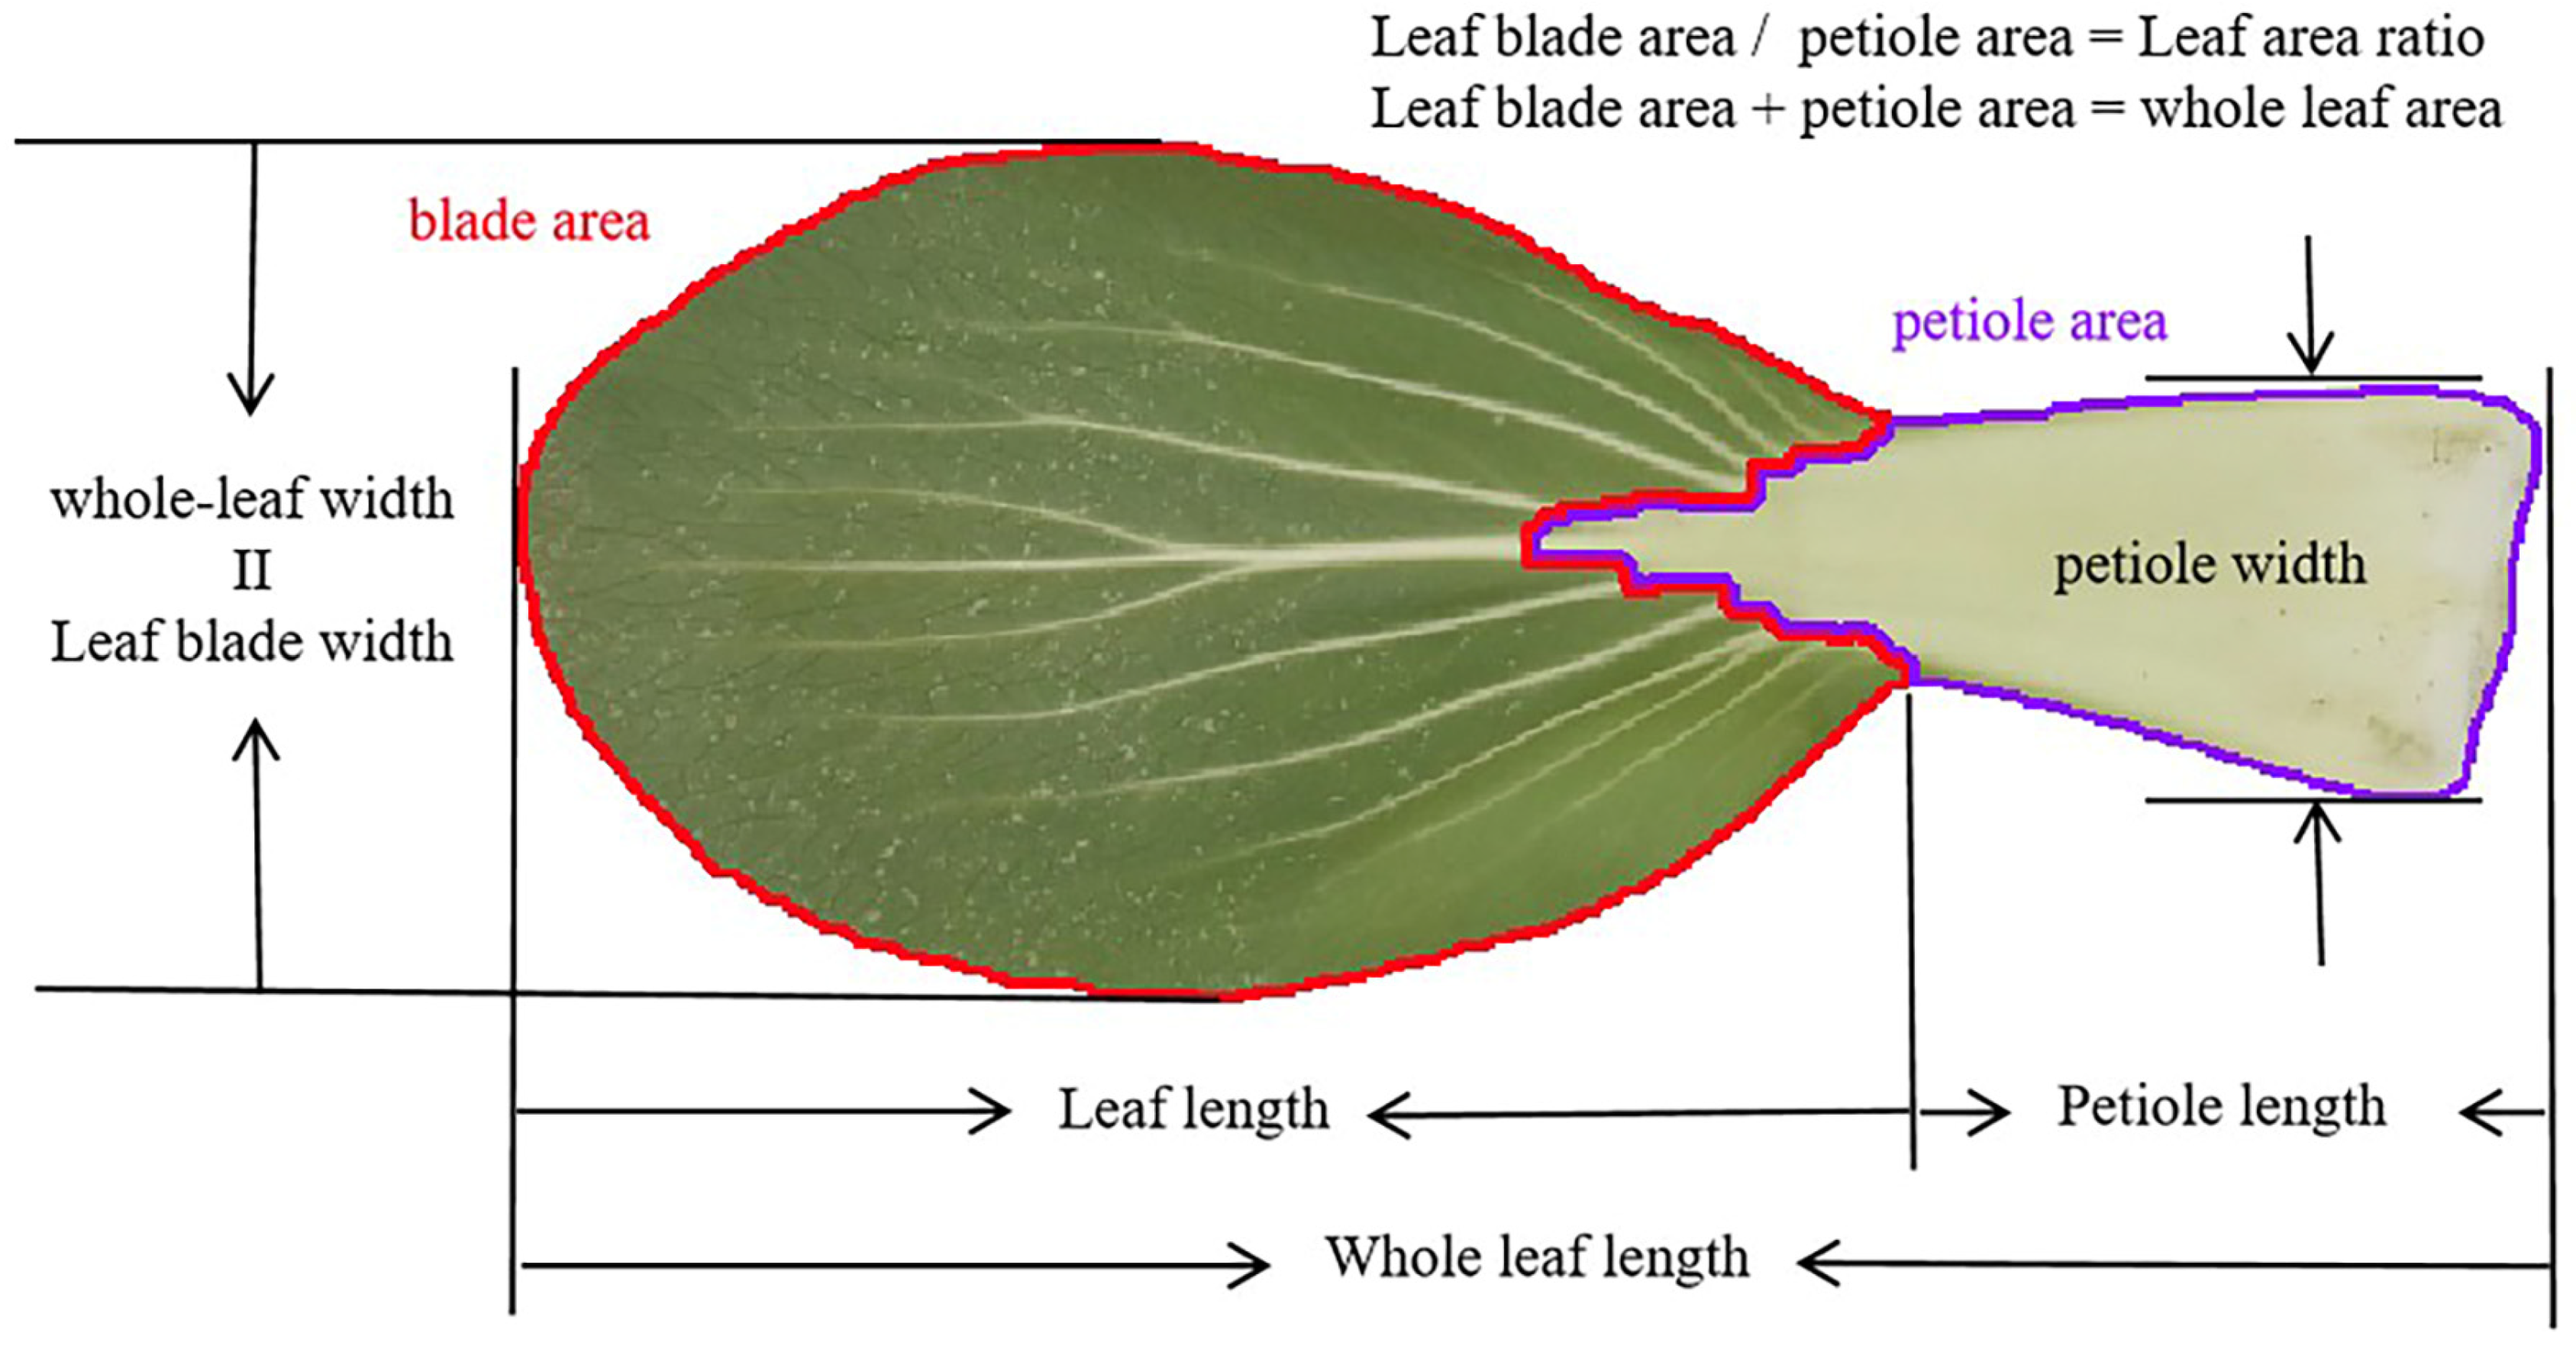
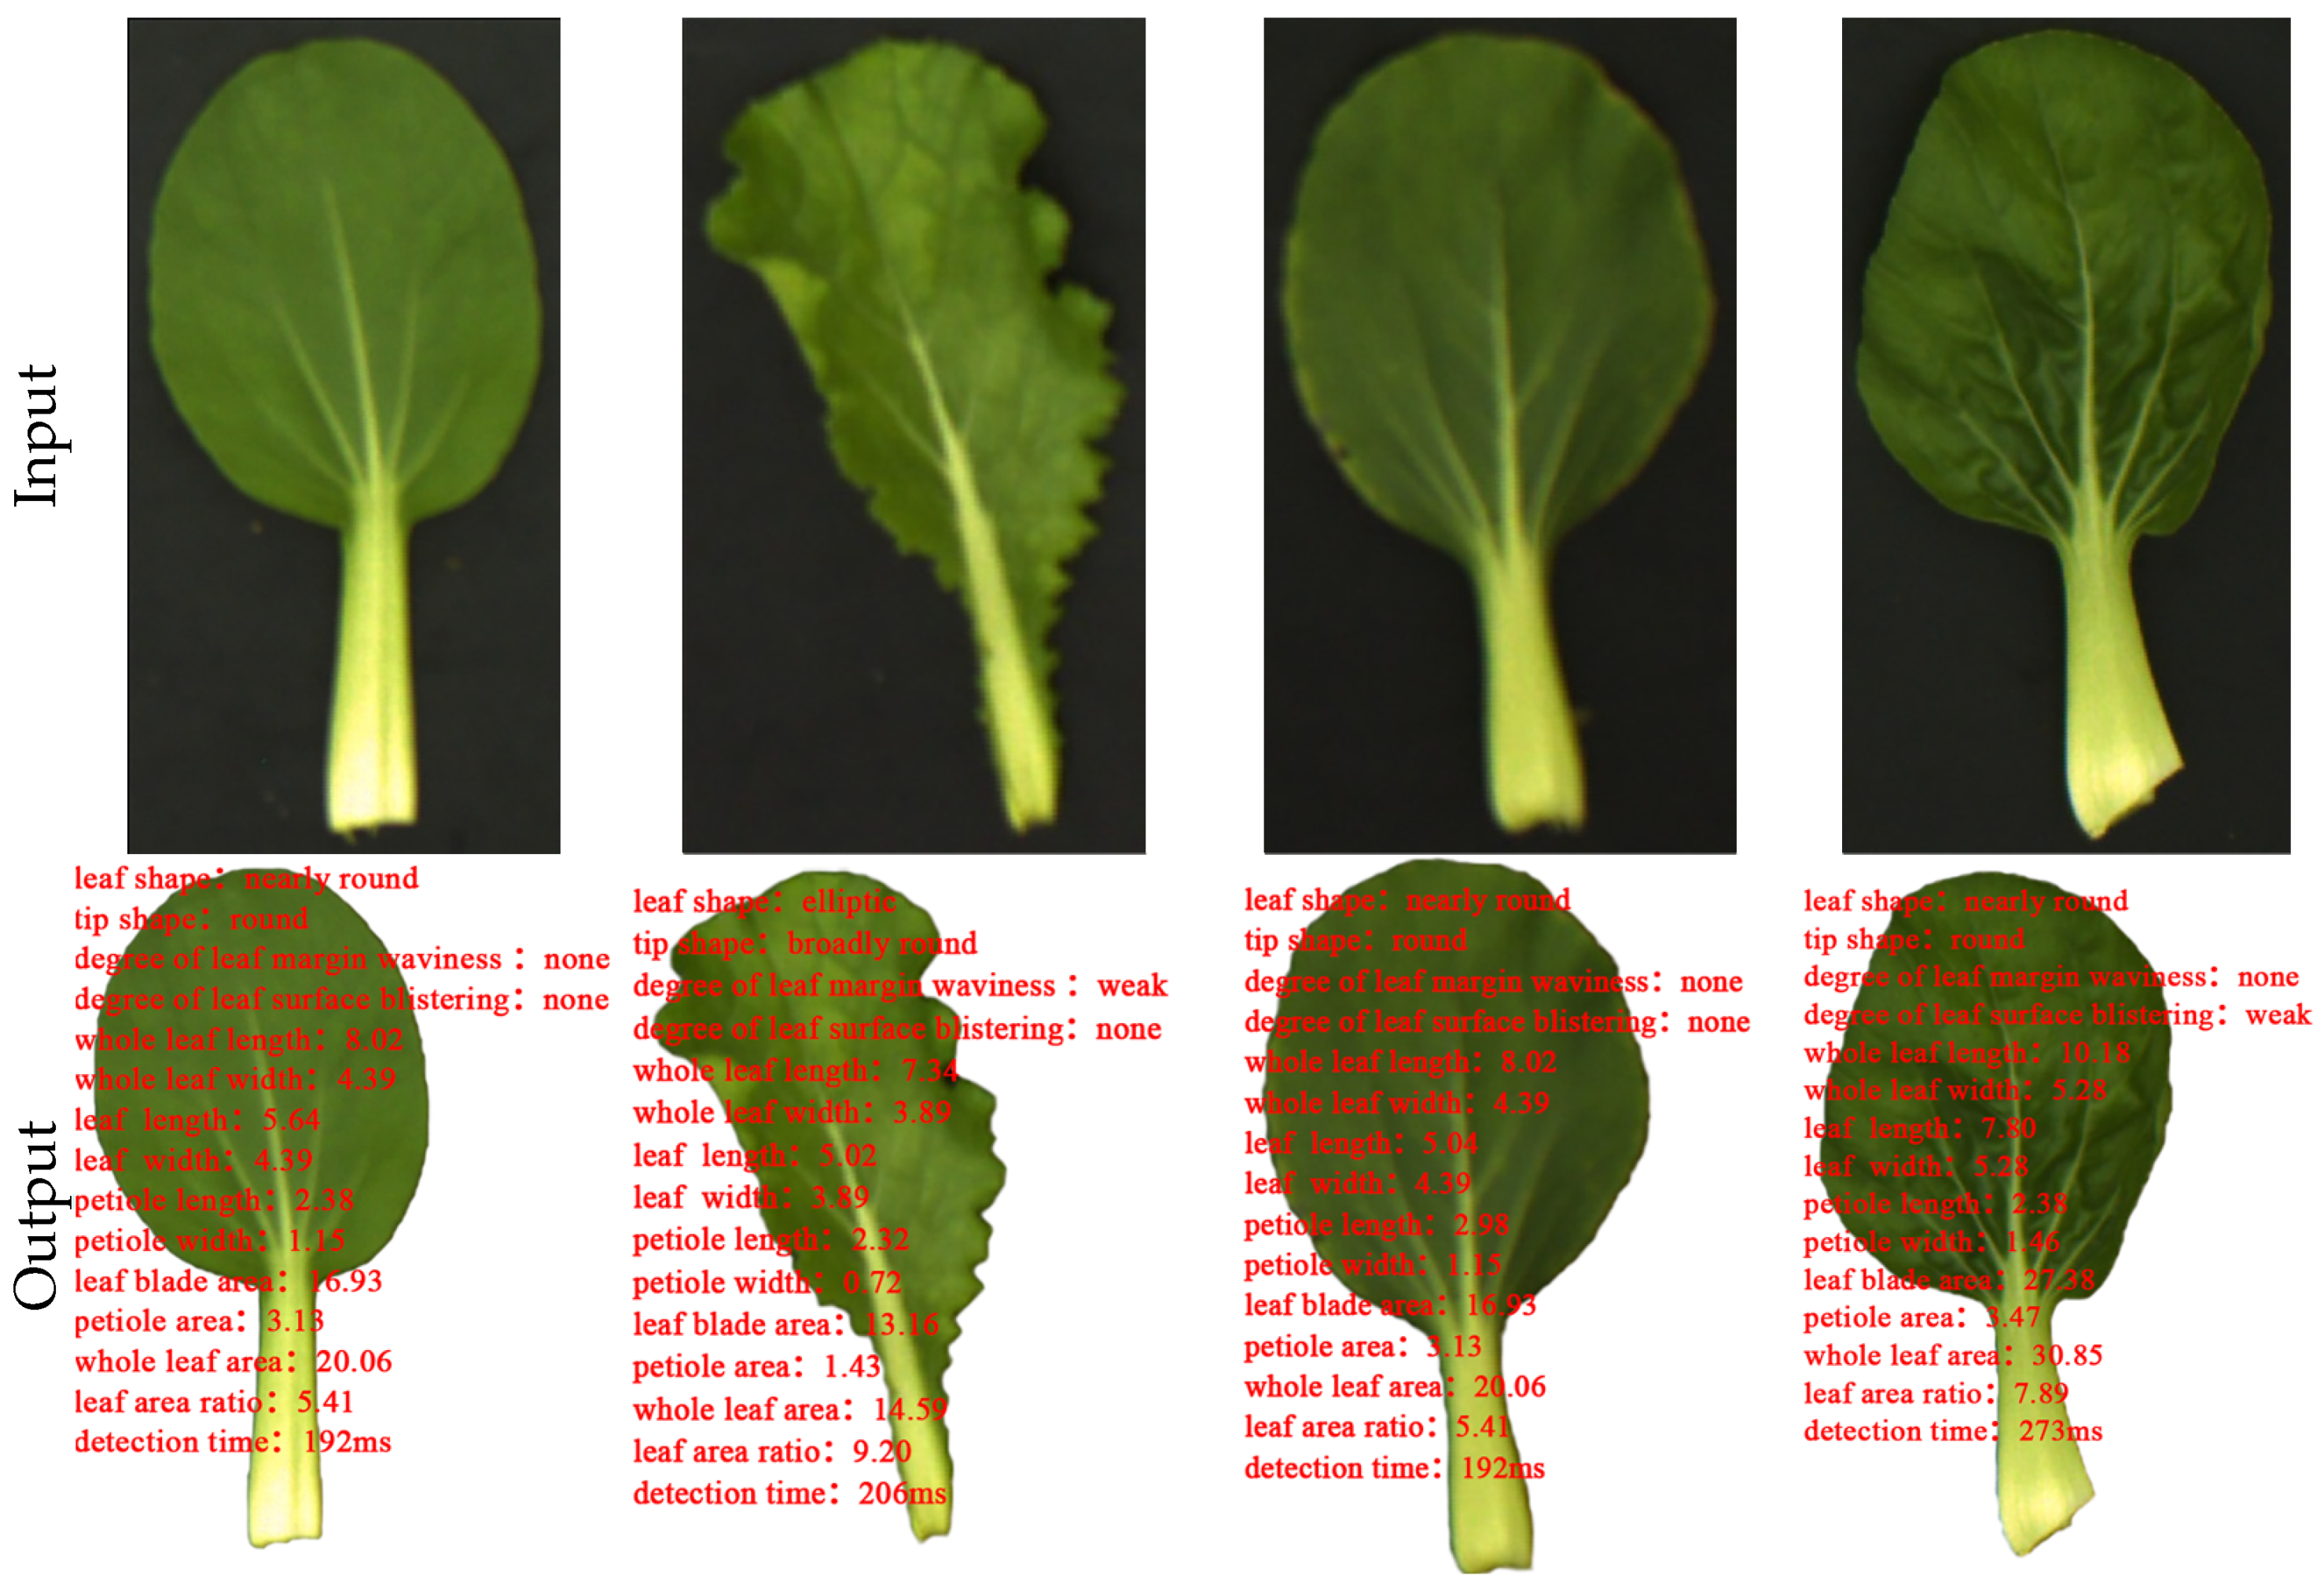
2.2. Phenotypic Traits of Nonheading Chinese Cabbage Leaves

Based on the Chinese agricultural industry standard NY/T 2223-2012 “Guidelines for the Testing of Distinctness, Uniformity, and Stability in New Plant Varieties of Nonheading Chinese Cabbage” [26], this study extracted 14 traits from the sample leaves, including 4 qualitative traits and 10 quantitative traits. The 4 qualitative traits were divided into 18 categories, including leaf shape (lanceolate, ovate, narrow elliptic, elliptic, broad elliptic, suborbicular), tip shape (acute, obtuse, round, broadly round), degree of leaf surface blistering (none, weak, medium, strong), and degree of leaf margin waviness (none, weak, medium, strong) (Figure 2). The 10 quantitative traits included whole leaf length, whole leaf width, leaf length, leaf width, petiole length, petiole width, whole leaf area, leaf blade area, petiole area, and leaf area ratio (Figure 3).

2.3. Extraction Algorithm for Leaf Phenotypic Traits

This study proposes a comprehensive algorithm that integrates deep learning and OpenCV image processing techniques to simultaneously quantify the quality and quantity traits of nonheading Chinese cabbage leaves. As shown in Figure 4, upon inputting nonheading Chinese cabbage image data, the model trained with deep learning first infers the quality traits of the leaves, yielding four quality trait indicators; subsequently, OpenCV image processing technology is utilized to perform color channel conversion, threshold masking, grayscale conversion, filtering noise reduction, binarization, contour detection, and pixel calculation on the images of nonheading Chinese cabbage leaves, resulting in ten quantitative trait indicators. This algorithm can overcome the need for separate, repetitive, and cumbersome processes for different traits, enabling the one-time acquisition of 14 phenotypic trait indicators for nonheading Chinese cabbage leaves.

2.3.1. Selection of the Deep Learning Model

To select a suitable deep learning model for this study, in the initial phase, 50 images were extracted from each trait and trained using five models: EfficientNet, ResNet, SWIN Transformer, YOLOv8, and Vision Transformer. A comprehensive comparison was made based on the performances of three key metrics—accuracy, detection speed, and model size—to evaluate their performance on the experimental dataset used in this study. As shown in Table 1, EfficientNet had the highest accuracy at 94.2%, while ResNet had the lowest at 83.4%. In terms of detection speed, YOLOv8 was the fastest at 12.9 ms, with ResNet being the slowest at 162.6 ms. Regarding model size, YOLOv8 was the most compact at 2.7 M, while Vision Transformer was the largest at 91.3 M.
Considering the above metrics, YOLOv8, while maintaining a high accuracy (90.7%), outperformed the other methods in terms of detection speed and model size, facilitating high-throughput, rapid acquisition of nonheading Chinese cabbage leaf phenotypes. Therefore, YOLOv8 was chosen as the model for this study to achieve classification detection of four types of quality traits in nonheading Chinese cabbage leaves.

2.3.2. OpenCV Image Processing Technology

After assessing leaf quality traits through deep learning, a series of postprocessing steps were applied to nonheading Chinese cabbage leaf images using OpenCV image processing technology. These steps included color transformation, image segmentation, and edge detection to accurately calculate ten quantitative traits, such as leaf length, width, and area. The specific algorithmic steps are as follows:
(1)
The image is converted from the RGB channel to the HSV channel, simplifying color identification through hue, saturation, and brightness components. This aids in selecting specific color ranges during subsequent background replacement, with the specific formula as follows:
H = 0 ° ,   i f   m a x = m i n 60 ° × g b m a x m i n + 0 ° ,   i f   m a x = r   a n d   g b   60 ° × g b m a x m i n + 360 ° ,   i f   m a x = r   a n d   g < b 60 ° × b r m a x m i n + 120 ° ,   i f   m a x = g     60 ° × r g m a x m i n + 240 ° ,   if   max = b  
S = 0 ,   i f   m a x = 0 m a x m i n m a x = 1 m i n m a x ,   o t h e r w i s e
V = max
In the formula, (r, g, b) represent the red, green, and blue coordinates of a color, respectively, with their values being real numbers between 0 and 1. Max is the greatest of r, g, and b, while min is the least.
(2)
Analyzing the pixel value characteristics of the leaf overall and the background in the image, it was found that there was a significant difference in the hue component between the leaf overall and the background, while the differences in the saturation and brightness components were smaller. Therefore, by setting maximum and minimum values for the three channels, an ROI mask is created, and the background is entirely blackened to eliminate its impact on leaf edge detection. After threshold adjustment tests, the entire leaf can be extracted at a mask threshold of Min ( 0 , 0 , 46 ) Max ( 180 , 255 , 255 ) , leaf parts can be segmented at Min ( 36 , 43 , 46 ) Max ( 110 , 255 , 255 ) , and petiole parts can be segmented at Min ( 0 , 30 , 100 ) Max ( 110 , 255 , 255 ) . Three masking thresholds were applied to process the HSV channel images, resulting in images that preserve the whole leaf, the leaf blade, and the petiole while darkening the background, as shown in Figure 5.
(3)
The images with darkened backgrounds of three different parts are then converted into the lab color space to enhance the image, providing better brightness and color invariance for subsequent processing.
(4)
Median filtering is used to remove salt-and-pepper noise from the three images.
g ( x , y ) = med ( x i , y i ) ,   ( i , j ) S
Here, g(x,y) and f(x,y) represent pixel grayscale values, and S denotes the template window.
(5)
The three images are converted into a binary image. The image is thresholded, setting pixel values below the threshold to 0 (black) and those above the threshold to 255 (white). After repeated testing, a threshold of 10 is selected, resulting in an image with a black background and a white subject.
(6)
Edge detection algorithms are used to extract the coordinates of the edge contour pixels of the subject, leaves, and petioles from the three images of different parts, and save them as arrays. By using the array, the coordinates of the top left and bottom right corners of the contour are obtained, the length, width, and height of each part are calculated, and the area information of each part is obtained based on the number of pixels within the contour.

3. Experiments and Result Analysis

The training and testing of this research model were performed on a computer equipped with an Intel Core i7-9700KF CPU, running at a frequency of 3.6 GHz, with 64 GB of RAM and a Windows 10 (64-bit) operating system, and accelerated with a GeForce RTX 2060 Super GPU with 6 GB of VRAM. The programming language used was Python3.8, the deep learning framework was PyTorch 1.2.0, and the OpenCV version was 4.8.

3.1. Classification Model Training

3.1.1. Parameter Setting

To optimize the performance of leaf detection and classification, the training parameters were adjusted. The initial learning rate was set to 0.001 to balance the convergence speed and learning efficiency of the model, avoiding instability caused by excessively rapid convergence. Additionally, a momentum decay strategy was employed, with its value set to 0.937, to accelerate the learning process and avoid becoming stuck in local minima. Finally, to enhance the model’s generalization ability, a weight decay of 0.0005 was set, which helped reduce the risk of overfitting.

3.1.2. Evaluation Indicators

This study uses the accuracy, precision, recall, and F1 score as the model evaluation metrics. The accuracy of the model is the ratio of all correctly predicted samples to the total number of samples; the precision is the proportion of correct predictions among all predictions made by the model; and the recall is the proportion of correct predictions among all positive samples. The F1 score is the harmonic mean of precision and recall, which measures the model’s balance between positive and negative samples [27]. The specific formulas are as follows:
A c c u r a c y = T P + T N T P + T N + F P + F N × 100 %
P r e c i s i o n = T P T P + F P × 100 %
R e c a l l = T P T P + F N × 100 %
F 1 = 2 × P r e c i s i o n × R e c a l l ( P r e c i s i o n + R e c a l l )
TP (true positives) represents the number of actual positive samples predicted as positive; FP (false positives) represents the number of actual negative samples predicted as positive; and FN (false negatives) represents the number of actual positive samples predicted as negative. TN (true negatives) represents the number of actual negative samples predicted as negative.

3.1.3. Model Training

Training parameters are set in the model configuration file, with an initial training iteration cycle of 50. The results of the training are analyzed, and the performance of the model on the validation set is observed. The number of iterations is increased by 50 each time for repeated training to ensure sufficient learning of data features without causing overfitting. Figure 6 is a graph showing the changes in metrics during the training process of the four quality trait classification models when the number of iterations increased to 400. As the number of iterations increased, the accuracy continued to improve, and the accuracy curves of the leaf shape model, tip shape model, leaf margin waviness model, and leaf surface blistering model tended to stabilize at 225, 280, 280, and 300 iterations, respectively. Meanwhile, the loss curves for the training and validation sets changed consistently, with the validation set loss always greater than that of the training set.
After training and validation, the classification models for the four quality traits showed good performance. The model with the best performance is the leaf margin waviness model, with an accuracy, precision, recall rate, and F1 value of 96.88%, 98.81%, 98.75%, and 0.9878, respectively. The tip shape model has lower performance due to smaller differences in shapes, with 92.5%, 92.56%, 92.5%, and 0.9253, respectively (Table 2). Although there are some differences in the evaluation metrics of the four models, all metrics are above 92%, meeting the requirements for practical application. A comprehensive evaluation of four models was conducted, with an average accuracy of 95.25%, average precision of 96.09%, average recall of 96.31%, and average F1 score of 0.9620. The high accuracy and precision indicate that the models trained in this study can effectively identify the leaf quality traits of nonheading Chinese cabbage, while the high recall rate also indicates that the models have maintained the misclassification rate at a very low level.

3.2. Quantitative Traits

In this study, to ensure the accuracy and reliability of the leaf parameters of nonheading Chinese cabbage obtained through OpenCV calculations, three quantitative trait parameters—leaf length, leaf width, and total leaf area—were selected as validation indicators for rigorous verification and error analysis. A random sample of 466 leaf specimens was taken, and precise manual measurements of leaf length, leaf width, and total leaf area were conducted, where length and width were measured with a Vernier caliper, and area was measured using the traditional grid method. The manual measurement results were used as the gold standard and compared with the results calculated by OpenCV.
The magnitude of the error between the two measurement methods was quantified by calculating the mean absolute error (MAE) and the root mean square error (RMSE) [28]. As shown in Table 3, the MAE for both leaf length and leaf width is 0.1 cm, with RMSEs of 0.19 cm and 0.1762 cm, respectively; for area, the MAE is 0.02 cm2, with an RMSE of 0.2161 cm2. These error metrics reflect a high degree of consistency between the automatic measurement results and the manual measurement results in this study.
Furthermore, this study also conducted a Bland–Altman analysis comparing manual measurement results with OpenCV calculation results. As shown in Figure 7, for leaf length, leaf width, and total leaf area, the average error within the 95% confidence interval was −0.03 cm, with a range from −0.4 cm to 0.34 cm. Moreover, the error values for all three indicators were distributed within the 95% confidence intervals, further confirming that the method used in this study exhibited minimal error in the calculation of quantitative traits, indicating a high level of reliability and accuracy in the study’s computational approach.

3.3. Leaf Phenotype Extraction Analysis Based on Deep Learning and OpenCV Fusion

By integrating the classification model with OpenCV, the new algorithm framework proposed in this study was developed, achieving batch and automated calculations for nonheading Chinese cabbage leaf images. Using the algorithm proposed in this study, not only were the quality traits of the leaves accurately identified and classified, but the quantitative traits were also measured with high accuracy, and a high-speed detection process was achieved, with an average detection speed of 269 ms per image. The calculation results clearly displayed the classification results of the leaf quality traits, the specific parameters of the quantitative traits, and the detection time used (Figure 8).

4. Discussion

In the field of germplasm improvement and new variety development for nonheading Chinese cabbage, leaf phenotypic characteristics such as leaf length, leaf width, and leaf area ratio are considered key traits. These traits are of decisive importance for the evaluation of germplasm resources and selection processes in breeding because they directly affect the appearance quality of the final product. However, traditional phenotypic trait assessment relies on manual measurements by practitioners, which is time-consuming and labor-intensive [29,30], thus creating a significant workload for breeders. Thus, there is an urgent need to develop accurate, fast, and intelligent phenotypic trait collection technologies. In light of this, this study combines the YOLOv8 classification model and OpenCV image processing technology to propose a comprehensive algorithm based on their integration, innovatively analyzing four quality traits and ten quantitative traits of nonheading Chinese cabbage leaves. While ensuring rapid detection, the accurate judgment of the quality traits and precise calculation of the quantitative traits of nonheading Chinese cabbage leaves were also ensured. The development of this technology can not only effectively reduce the workload of breeders and improve the efficiency of the breeding process but also enhance the accuracy and reliability of phenotypic trait analysis.
The phenotypic characterization of nonheading Chinese cabbage leaves has always relied on manual observation and measurement. Traditional methods such as grid and scale are only suitable for leaves with simple shapes, and their accuracy decreases as the complexity of the leaves increases. The application of machine vision in plant phenotyping, however, can identify and calculate more precise and reproducible data. The comprehensive algorithm proposed in this study demonstrates that deep learning not only achieves significant results in the classification of quality traits of nonheading Chinese cabbage leaves but also reveals the great potential of deep learning in accurately identifying and classifying plant phenotypic characteristics, highlighting its potential applications in fields that require fast and precise analysis of large volumes of image data. Moreover, the precise quantification of leaf size and morphology through OpenCV image processing technology provides an objective and repeatable method for understanding intraspecific morphological diversity, genetic variation, and environmental adaptability. It has significant scientific value and application prospects for accelerating the process of variety improvement and enhancing the precision and efficiency of variety improvements. Furthermore, this innovative phenotyping collection technique is not only suitable for the precise measurement of nonheading Chinese cabbage leaves but can also be widely applied to the breeding selection of other crops through the adjustment and improvement of algorithms, such as the identification and measurement of tomato fruit shapes, providing strong technical support for the variety improvement of diversified crops. In addition to assisting in breeding improvements, this technology can also be used in agricultural robots for crop detection and quality sorting after crop harvesting.
However, despite significant progress in the analysis of the phenotypic characteristics of nonheading Chinese cabbage leaves, this study also has several limitations. First, our method largely depends on image quality and the conditions under which the leaves are produced. Second, although the YOLOv8 model has shown efficient recognition capabilities, it still struggles to identify leaves in extreme cases, such as those with extremely similar or unique shapes. This may require the use of multiple deep learning networks for comparison of recognition performance. Furthermore, this study primarily focused on the morphological characteristics of nonheading Chinese cabbage leaves, which may not fully capture all key aspects of plant phenotypes, such as physiological or biochemical properties. Finally, our research was conducted under specific environmental conditions and may require further validation and adjustment in different growth environments or with other plant varieties. Considering the achievements and limitations of this study in the analysis of phenotypic characteristics of nonheading Chinese cabbage leaves, future research will employ more neural network models or modify current deep learning networks to address the existing limitations of the algorithms.

5. Conclusions

Traditional manual measurements of nonheading Chinese cabbage leaf phenotypic traits face issues such as high workload, time consumption, and low accuracy, while current object detection network models are large, slow in terms of detection speed, and have low accuracy in extracting and analyzing phenotypic traits of nonheading Chinese cabbage leaves in various complex scenarios. This study introduces a detection method combining the YOLOv8 model and OpenCV image processing techniques, achieving an average analysis time of 269 ms for 14 phenotypic traits of nonheading Chinese cabbage leaves, with an average precision and accuracy of 96.09% and 95.25%, respectively, fully meeting practical application requirements. This approach significantly reduces the labor and time costs associated with genetic resource analysis. It provides a high-throughput, precise, and automated new technology for the analysis of nonheading Chinese cabbage genetic resources, not only demonstrating the immense potential of combining deep learning with traditional image processing technology theoretically but also providing an efficient and reliable leaf phenotypic data analysis tool for the agricultural science field in practice.

Author Contributions

Conceptualization, methodology, software, investigation, formal analysis, data curation, validation, writing—original draft, H.X.; writing—original draft, visualization, investigation, writing—review and editing, L.F.; resources, supervision, validation, J.L.; supervision, writing—review and editing, X.L. and L.C.; conceptualization, funding acquisition, resources, supervision, writing—review and editing, F.Z. and M.H. All authors have read and agreed to the published version of the manuscript.

Funding

This research was funded by the following grants: Facilities suitable for mechanized harvesting green leafy vegetables introduction, screening and demonstration promotion (2022-P-001); The Seed Industry Innovation and Industrialization Project in Fujian Province (zycxny2021009) and the Fujian Modern Agricultural Vegetable Industry System Construction Project (2019-897).

Data Availability Statement

Since the project under this research topic has not yet concluded, the experimental data will not be disclosed for the time being. Should readers require any supporting information, they may contact the corresponding author via email.

Conflicts of Interest

The authors declare no conflicts of interest. The funders had no role in the design of the study; in the collection, analyses, or interpretation of data; in the writing of the manuscript; or in the decision to publish the results.

References

  1. Shao, G.; Cao, P.; Zhu, B.; Lin, X.; Fang, Y.; Wang, S.; Ma, S.; Zhong, F. Genetic analysis of agronomic traits in distantcrosses between non-bearing cabbage and seedling cabbage. Fujian J. Agric. 2023, 38, 1047–1053. [Google Scholar]
  2. Zhao, M.; Han, R.; Wang, Z.; Ren, Y. Diversity analysis of agronomic traits in 20 Brassica napus varieties introductory trials. South. J. Agric. 2020, 51, 1960–1969. [Google Scholar]
  3. Hou, X.; Li, Y.; Liu, T. Advances in genetic breeding and molecular biology of non-heading Chinese cabbage. Nanjing Nongye Daxue Xuebao (J. Nanjing Agric. Univ.) 2022, 45, 864–873. [Google Scholar]
  4. Liu, X.; Jin, J.; Wang, G.; Herbert, S.J. Soybean yield physiology and development of high-yielding practices in Northeast China. Field Crops Res. 2008, 105, 157–171. [Google Scholar] [CrossRef]
  5. Araus, J.L.; Cairns, J.E. Field high-throughput phenotyping: The new crop breeding frontier. Trends Plant Sci. 2014, 19, 52–61. [Google Scholar] [CrossRef] [PubMed]
  6. Guo, Y.; Zhang, S.; Li, Y.; Zang, X.; Wang, Y.; Wang, G. Study on the diversity of leaf phenotypic traits in Yanshan chestnut germplasm resources. J. Hortic. 2022, 49, 1673–1688. [Google Scholar]
  7. Singh, A.; Jones, S.; Ganapathysubramanian, B.; Sarkar, S.; Mueller, D.; Sandhu, K.; Nagasubramanian, K. Challenges and opportunities in machine-augmented plant stress phenotyping. Trends Plant Sci. 2021, 26, 53–69. [Google Scholar] [CrossRef] [PubMed]
  8. Zhang, H.; Fang, R.; Chen, X.; Zhou, K.; Yuan, X.; Lei, G.; Huang, Y. Identification of phenotypic traits and evaluation of yellow wilt resistance in eggplant germplasm. J. Nucl. Agric. 2020, 34, 31–40. [Google Scholar]
  9. Wei, L.; Jun, Y.; Li, Z.; Kou, G.; Qu, H. Multiclassification detection method for plant leaf diseases based on kernel function support vector machine. J. Agric. Mach. 2017, 48, 166–171. [Google Scholar]
  10. Deng, H.; Zhao, D.; Zheng, C. Video image detection of large-leaved boxwood leaf featuresbased on OpenCV. Guangdong Agric. Sci. 2014, 41, 173–175+237. [Google Scholar]
  11. Gong, Z.; Dong, C.; Yu, H.; Liu, B.; Li, C.; Liu, T.; Li, J. Development of machine vision-based softwarefor leaf morphology measurement in winter wheat. China Agric. Meteorol. 2022, 43, 935–944. [Google Scholar]
  12. Xu, S.; Li, L.; Tong, H.; Wang, C.; Bie, Z.; Huang, Y. Research on 3D phenotypic high-throughput measurement system of cucumber seedlings based on RGB-D camera. J. Agric. Mach. 2023, 54, 204–213+281. [Google Scholar]
  13. Jaisakthi, S.M.; Mirunalini, P.; Thenmozhi, D. Grape leaf disease identification using machine learning techniques. In Proceedings of the 2019 International Conference on Computational Intelligence in Data Science (ICCIDS), Chennai, India, 21–23 February 2019; IEEE: New York, NY, USA, 2019; pp. 1–6. [Google Scholar]
  14. Dara, S.; Tumma, P. Feature extraction by using deep learning: A survey. In Proceedings of the 2018 Second International Conference on Electronics, Communication and Aerospace Technology(ICECA), Coimbatore, India, 29–31 March 2018; IEEE: New York, NY, USA, 2018; pp. 1795–1801. [Google Scholar]
  15. Yang, L.; Wang, J.; Bei, S.; Bai, Z.; Chang, J.; He, X.; Li, W.; Shi, J. Research on maize leaf phenotype detection method based on computer vision. Jiangsu Agric. Sci. 2023, 51, 195–202. [Google Scholar]
  16. Yuan, Y. Computer Vision and Deep Learning for Precise Agriculture: A Case Study of Lemon Leaf Image Classification. J. Phys. Conf. Ser. 2023, 2547, 012024. [Google Scholar] [CrossRef]
  17. Chang, L.; Ding, X.; Yang, X.; Sun, P.; Cai, X.; Dong, G. Plant leaf recognition based on lightweight YOLO model. Intell. Comput. Appl. 2023, 13, 118–122. [Google Scholar]
  18. Liu, S.; Hu, B.; Zhao, C. Detection and identification of cucumber leaf pests and diseases based on improved YOLOv7. J. Agric. Eng. 2023, 39, 163–171. [Google Scholar]
  19. Miao, R.; Li, Z.; Wu, J. A lightweight cherry tomato ripening detection method based on improved YOLOv7. J. Agric. Mach. 2023, 54, 225–233. [Google Scholar]
  20. Wang, H.; Cao, L. Automatic segmentation and phenotypic analysis of plant leaves based on full convolutional neural network. Chin. J. Agric. Mech. Chem. 2021, 42, 161–168. [Google Scholar]
  21. Li, B.; Fan, J. Rice pest classification based on YOLOv5. Jiangsu Agric. Sci. 2024, 52, 175–182. [Google Scholar]
  22. Zhang, L.; Bayin, T.; Zeng, Q. Early disease detection method for grapevine leaves based on StyleGAN2-ADA and improved YOLOv7. J. Agric. Mach. 2024, 55, 241–252. [Google Scholar]
  23. Han, X.; Xu, Y.; Feng, R.; Liu, T.; Bai, J.; Lan, Y. Early identification of crop diseases based on infrared thermography and improved YOLOv5. J. Agric. Mach. 2023, 54, 300–307+375. [Google Scholar]
  24. Liu, Q.; Yang, X.; Jiang, H.; Sun, S.; Liang, Z. YOLOv7 rice seed detection based on fusion GhostNetV2. J. Agric. Mach. 2023, 54, 253–260+299. [Google Scholar]
  25. Li, L.; Lu, S.; Ren, H.; Xu, G.; Zhou, Y. A method for recognizing and locating mulberry branches and trunks in complex environments based on improved YOLO v5. J. Agric. Mach. 2024, 55, 249–257. [Google Scholar]
  26. NY/T 2223-2012; Guidelines for Testing the Specificity, Consistency and Stability of Newplant Varieties of Cabbage without Nodules. Chinese Standard: Beijing, China, 2012.
  27. Yan, Z.; Chen, L.; Liu, W.; Lai, H.; Ye, S. A YOLOGFFD-based method for recognizing fruit varieties and freshness. Food Mach. 2024, 40, 115–121. [Google Scholar]
  28. Che, G.; Liu, W.; Wan, L.; Yi, S.; Liu, H.; Wang, Q.; Lu, B. Design and test of automatic leveling system for rice seedling bed precision leveling machine. J. Agric. Eng. 2023, 39, 9–17. [Google Scholar]
  29. Liu, J.; Wang, X. Tomato diseases and pests detection based on improved Yolo V3 convolutional neural network. Front. Plant Sci. 2020, 11, 898. [Google Scholar] [CrossRef] [PubMed]
  30. Zhang, J.; Wang, X.; Liu, J.; Zhang, D.; Lu, Y.; Zhou, Y.; Sun, L.; Hou, S.; Fan, X.; Shen, S.; et al. Multispectral Drone Imagery and SRGAN for Rapid Phenotypic Mapping of Individual Chinese Cabbage Plants. Plant Phenomics 2022, 2022, 0007. [Google Scholar] [CrossRef] [PubMed]
Figure 1. Data enhanced image. (a) Original image; (b) mirror flip; (c) brightness adjustment; (d) Gaussian blur; (e) contrast adjustment.
Agronomy 14 00699 g001
Figure 2. Quality Trait Schematic. (a) Leaf shape; (b) tip shape; (c) leaf margin waviness; (d) leaf surface blistering degree.
Agronomy 14 00699 g002
Figure 3. Quantitative trait schematic.
Agronomy 14 00699 g003
Figure 4. Schematic diagram of the algorithm execution process.
Agronomy 14 00699 g004
Figure 5. Segmentation effects on different parts of the leaf. (a) Whole leaf; (b) leaf blade; (c) petiole.
Agronomy 14 00699 g005
Figure 6. Quality trait model metrics variation. (a) Leaf shape model; (b) tip shape model; (c) leaf margin waviness model; (d) leaf surface blistering model.
Agronomy 14 00699 g006
Figure 7. Bland-Altman scatter plot. (a) Leaf length; (b) leaf width; (c) total leaf area.
Agronomy 14 00699 g007
Figure 8. Calculation results of the study’s algorithm.
Agronomy 14 00699 g008
Table 1. Performance of different models.
Accuracy/%Detection Speed/msModel Size/M
EfficientNet94.256.121.4
ResNet83.4162.646.3
SWIN Transformer92.1124.687.6
YOLOv890.712.92.7
Vision Transformer92.373.691.3
Table 2. Evaluation metrics for four quality trait models.
Accuracy/%Precision/%Recall/%F1 Score
Leaf shape model95.5696.2096.180.9619
Tip shape model92.5092.5692.500.9253
Leaf margin waviness model96.8898.8198.750.9878
Leaf surface blistering model96.0596.7897.820.9730
Average95.2596.0996.310.9620
Table 3. Accuracy evaluation of OpenCV calculation results.
Manual Measurement
Average Value
OpenCV Calculation Average ValueMAERMSE
Leaf length11.0311.070.010.19
Leaf width5.655.640.010.1762
Area35.1335.110.020.2161
Disclaimer/Publisher’s Note: The statements, opinions and data contained in all publications are solely those of the individual author(s) and contributor(s) and not of MDPI and/or the editor(s). MDPI and/or the editor(s) disclaim responsibility for any injury to people or property resulting from any ideas, methods, instructions or products referred to in the content.

