
Integrated Effects of Straw Incorporation and N Application on Rice Yield and Greenhouse Gas Emissions in Three Rice-Based Cropping Systems

 ,
, 
 ,
,  and
and 
Abstract
1. Introduction
2. Materials and Methods
2.1. Site Description
2.2. Experimental Design
2.3. Gas Sampling and Measurement
2.4. Yield Determination
2.5. Soil Sample Determination in Rice Paddy Soils
2.6. Statistical Analysis
3. Results
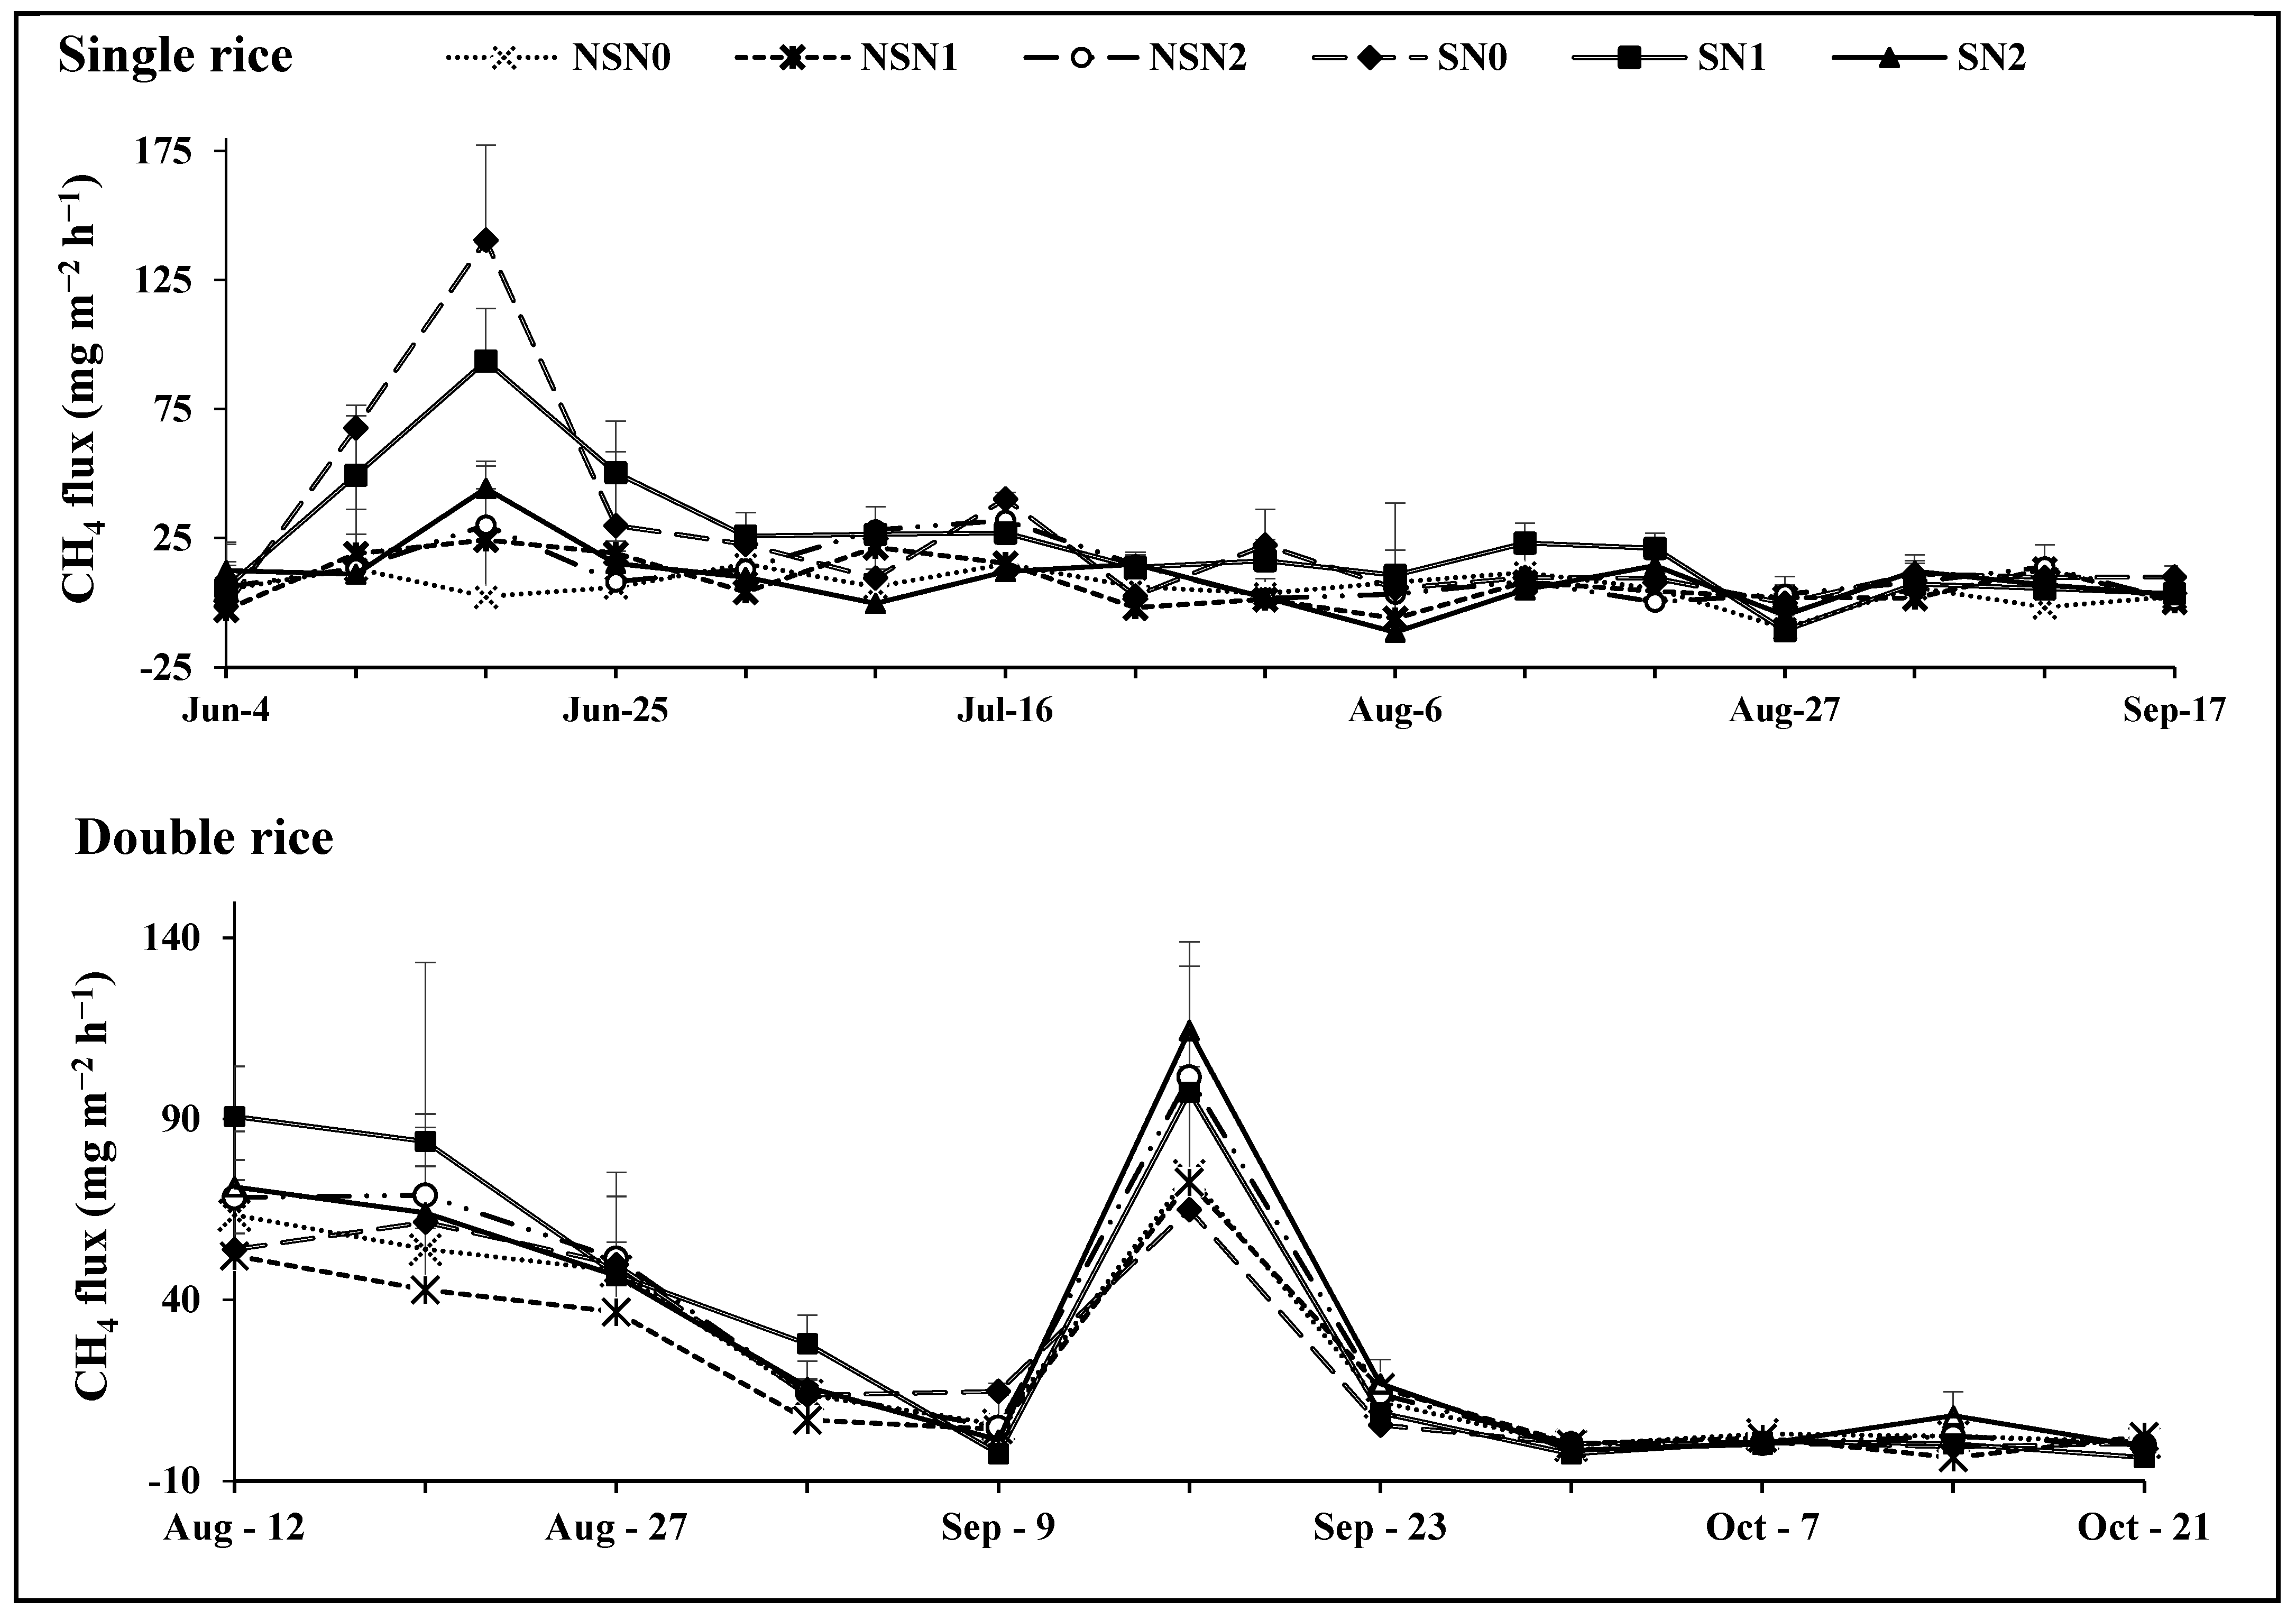
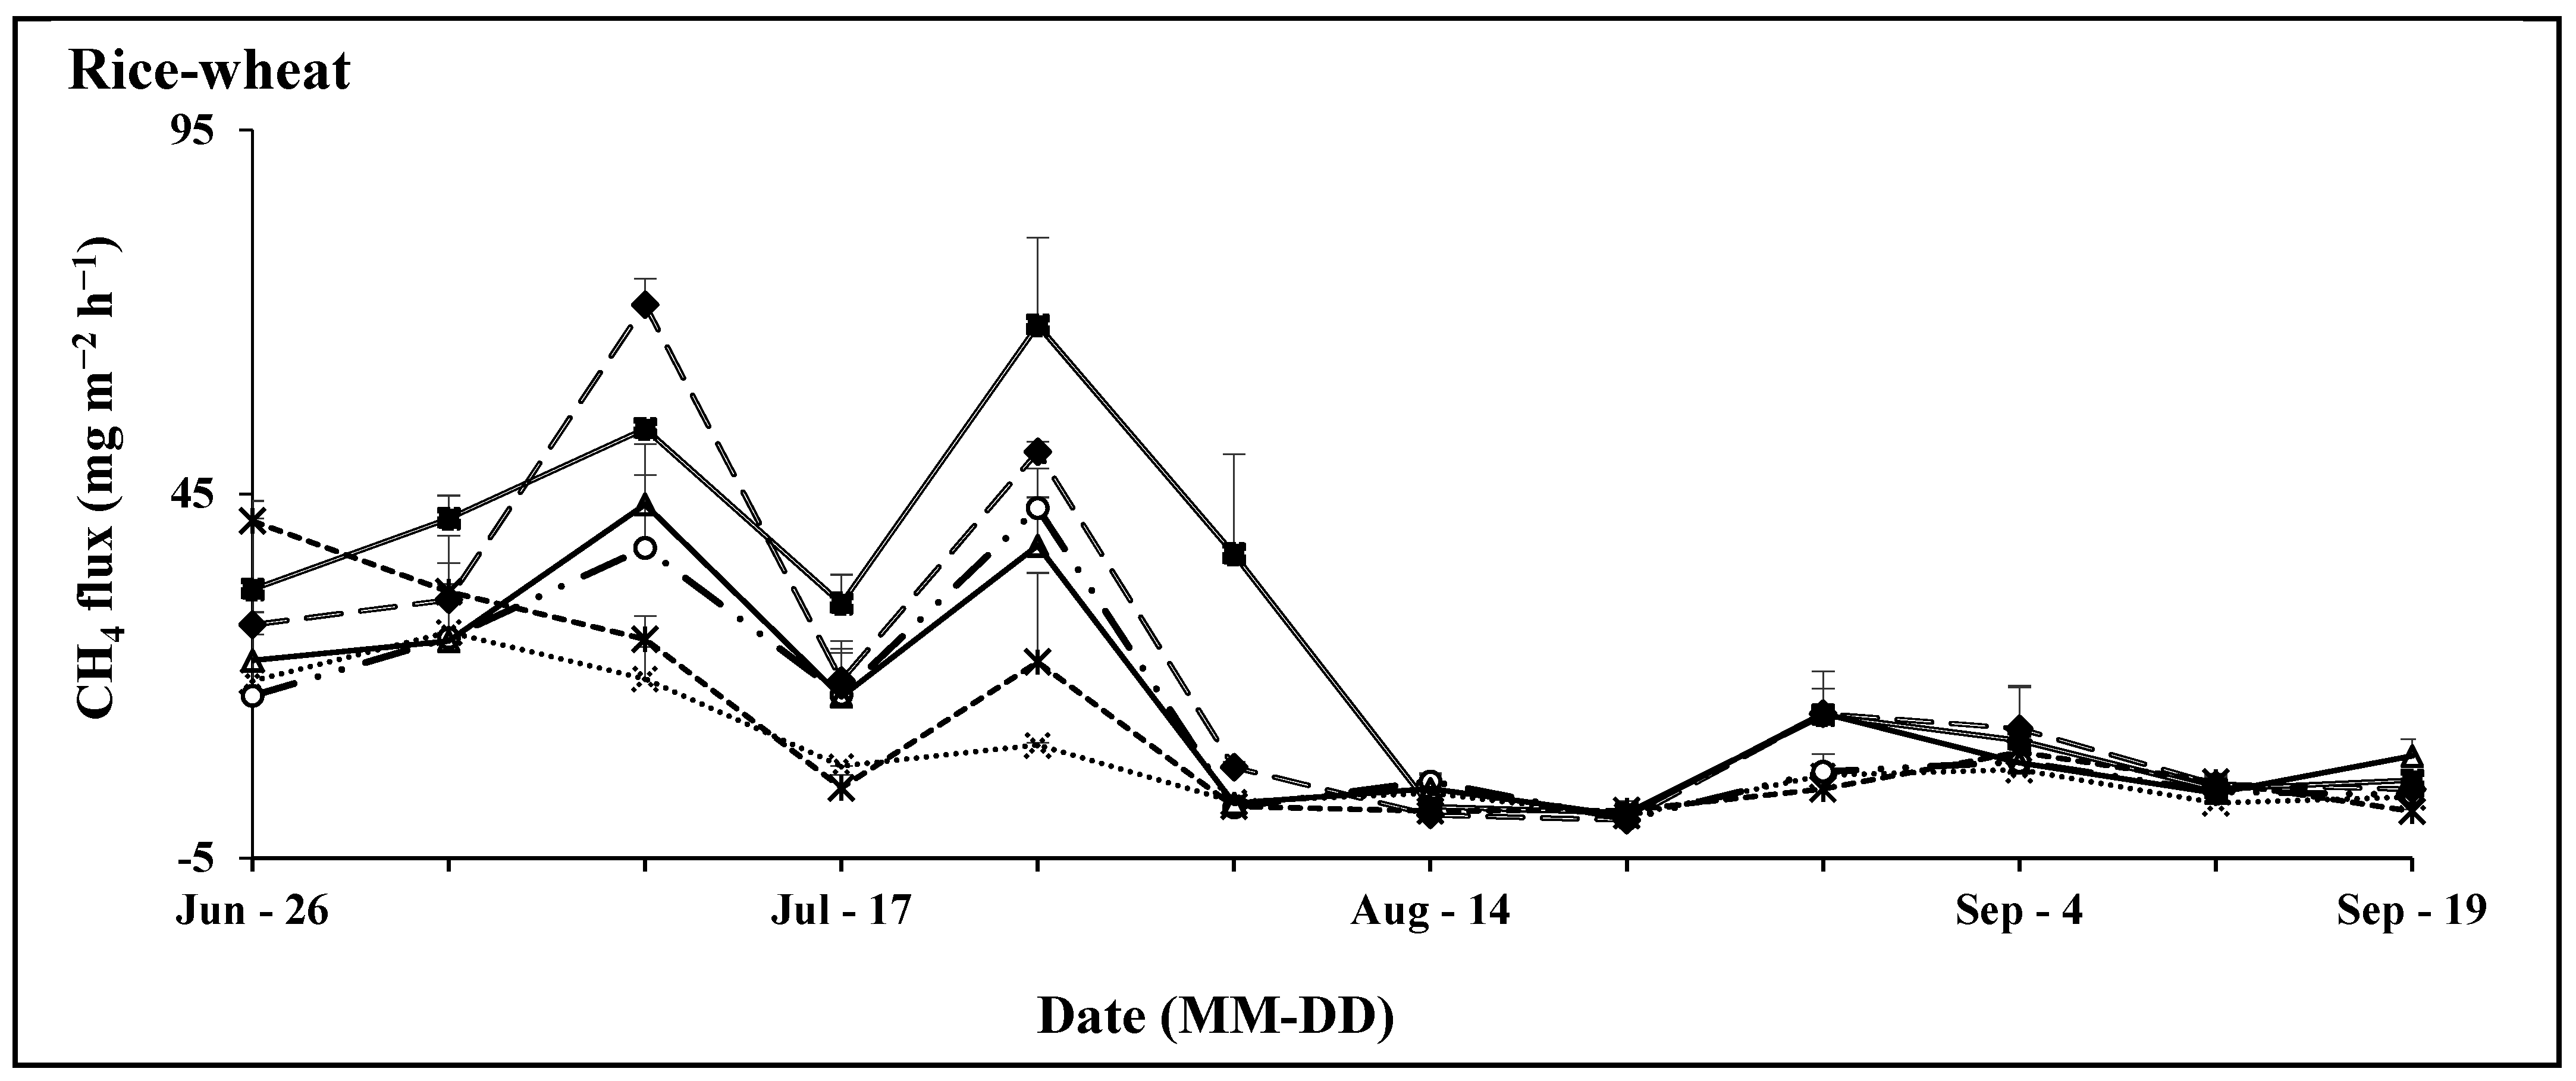
3.1. CH4 Emissions
3.2. N2O Emissions
3.3. Rice Yield
3.4. Total Greenhouse Gas and Yield-Scaled Emissions
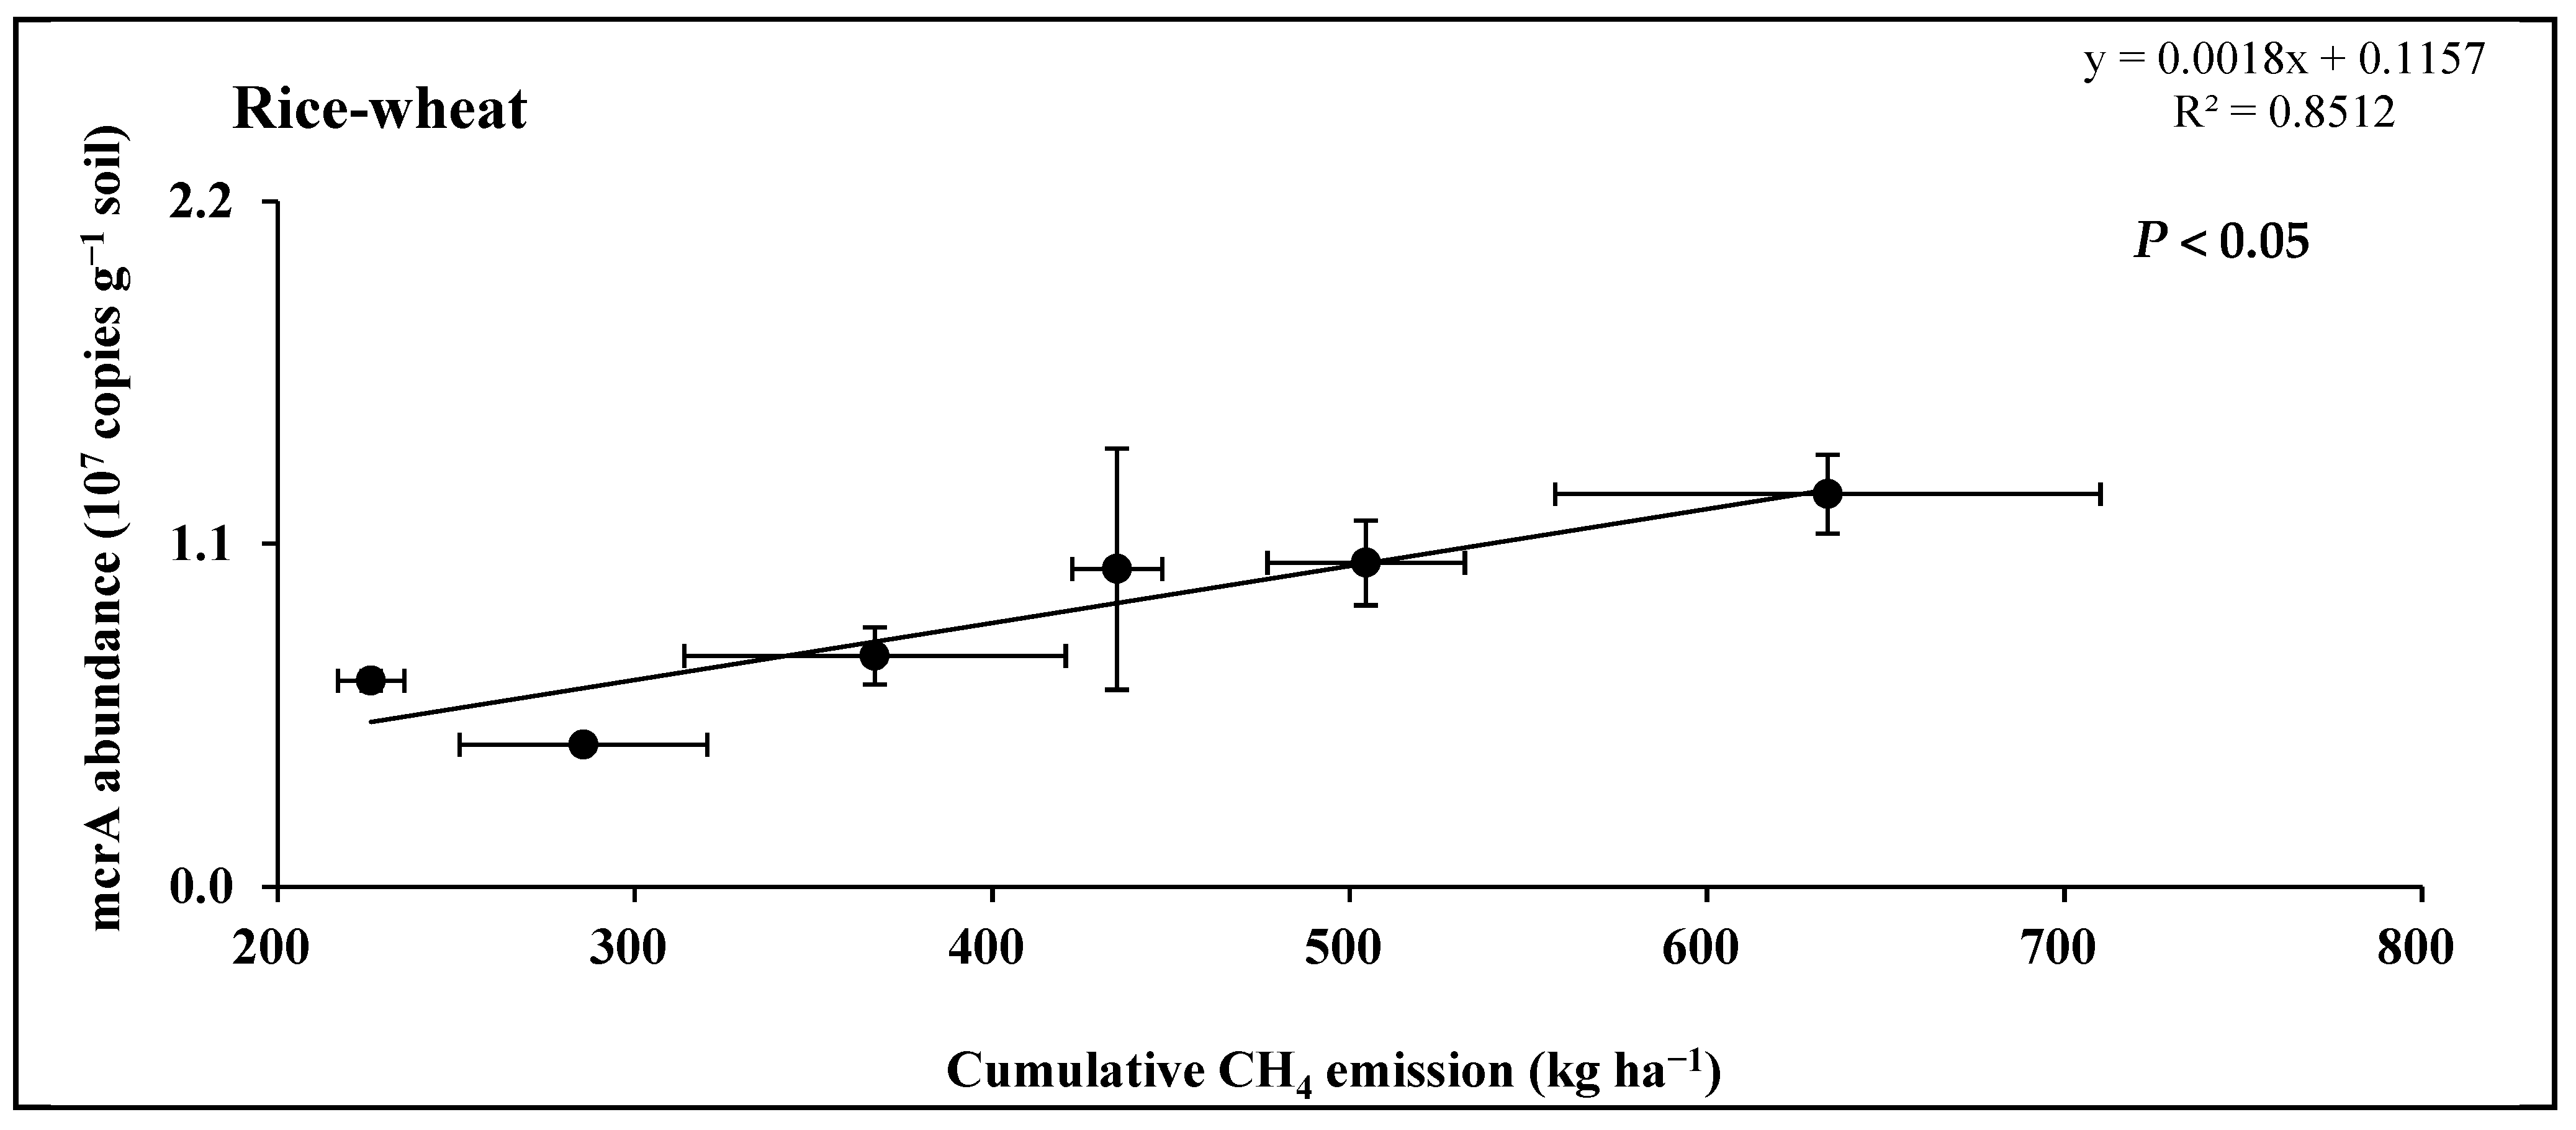
3.5. Methanogens and Methanotroph Abundance
4. Discussion
5. Conclusions
Author Contributions
Funding
Data Availability Statement
Acknowledgments
Conflicts of Interest
References
- FAO (Food and Agriculture Organization). World Food and Agriculture-Statistical Yearbook; FAO-Food & Agriculture Organization of the United Nations: Rome, Italy, 2020. [Google Scholar] [CrossRef]
- Samal, P.; Babu, S.C.; Mondal, B.; Mishra, S.N. The global rice agriculture towards 2050: An inter-continental perspective. Outlook Agric. 2022, 51, 164–172. [Google Scholar] [CrossRef]
- Deng, N.; Grassini, P.; Yang, H.; Huang, J.; Cassman, K.G.; Peng, S. Closing yield gaps for rice self-sufficiency in China. Nat. Commun. 2019, 10, 1725. [Google Scholar] [CrossRef] [PubMed]
- Huang, M.; Chen, J.; Cao, F. Estimating the expected planting area of double and single season rice in the Hunan-Jiangxi region of China by 2030. Sci. Rep. 2022, 12, 6207. [Google Scholar] [CrossRef] [PubMed]
- Sun, D.; Ge, Y.; Zhou, Y. Punishing and rewarding: How do policy measures affect crop straw use by farmers? An empirical analysis of Jiangsu Province of China. Energy Policy 2019, 134, 110882. [Google Scholar] [CrossRef]
- Li, H.; Cao, Y.; Wang, X.; Ge, X.; Li, B.; Jin, C. Evaluation on the production of food crop straw in China from 2006 to 2014. Bioenergy Res. 2017, 10, 949–957. [Google Scholar] [CrossRef]
- Wang, W.; Chen, C.; Wu, X.; Xie, K.; Yin, C.; Hou, H.; Xie, X. Effects of reduced chemical fertilizer combined with straw retention on greenhouse gas budget and crop production in double rice fields. Biol. Fertil. Soils 2019, 55, 89–96. [Google Scholar] [CrossRef]
- Marschner, P.; Umar, S.; Baumann, K. The microbial community composition changes rapidly in the early stages of decomposition of wheat residue. Soil Biol. Biochem. 2011, 43, 445–451. [Google Scholar] [CrossRef]
- Li, M.; Tang, C.; Chen, X.; Huang, S.; Zhao, W.; Cai, D.; Wu, Z.; Wu, L. High performance bacteria anchored by nano clay to boost straw degradation. Materials 2019, 12, 1148. [Google Scholar] [CrossRef]
- Huang, J.; Nie, T.; Li, T.; Chen, P.; Zhang, Z.; Zhu, S.; Sun, Z.; Lihua, E. Effects of Straw Incorporation Years and Water-Saving Irrigation on Greenhouse Gas Emissions from Paddy Fields in Cold Region of Northeast China. Agriculture 2022, 12, 1878. [Google Scholar] [CrossRef]
- Qin, X.; Wang, H.; Liu, C.; Li, J.; Wan, Y.; Gao, Q.; Fan, F.; Liao, Y. Long-term effect of biochar application on yield-scaled greenhouse gas emissions in a rice paddy cropping system: A four-year case study in south China. Sci. Total Environ. 2016, 569, 1390–1401. [Google Scholar] [CrossRef]
- Pan, F.F.; Yu, W.T.; Ma, Q.; Zhou, H.; Jiang, C.M.; Xu, Y.G.; Ren, J.F. Influence of 15N-labeled ammonium sulfate and straw on nitrogen retention and supply in different fertility soils. Biol. Fertil. Soils 2017, 53, 303–313. [Google Scholar] [CrossRef]
- Zhan, Y.; Liu, W.; Bao, Y.; Zhang, J.; Petropoulos, E.; Li, Z.; Lin, X.; Feng, Y. Fertilization shapes a well-organized community of bacterial decomposers for accelerated paddy straw degradation. Sci. Rep. 2018, 8, 7981. [Google Scholar] [CrossRef]
- Chen, R.; Senbayram, M.; Blagodatsky, S.; Myachina, O.; Dittert, K.; Lin, X.; Evgenia, B.; Kuzyakov, Y. Soil C and N availability determine the priming effect: Microbial N mining and stoichiometric decomposition theories. Glob. Change Biol. 2014, 20, 2356–2367. [Google Scholar] [CrossRef]
- Berthrong, S.T.; Yeager, C.M.; Gallegos-Graves, L.; Steven, B.; Eichorst, S.A.; Jackson, R.B.; Kuske, C.R. Nitrogen fertilization has a stronger effect on soil nitrogen-fixing bacterial communities than elevated atmospheric CO2. Appl. Environ. Microbiol. 2014, 80, 3103–3112. [Google Scholar] [CrossRef] [PubMed]
- Yan, X.; Yagi, K.; Akiyama, H.; Akimoto, H. Statistical analysis of the major variables controlling methane emission from rice fields. Glob. Change Biol. 2005, 11, 1131–1141. [Google Scholar] [CrossRef]
- Jiang, Y.; Qian, H.; Wang, L.; Feng, J.; Huang, S.; Hungate, B.A.; van Kessel, C.; Horwath, W.R.; Zhang, X.; Qin, X.; et al. Limited potential of harvest index improvement to reduce methane emissions from rice paddies. Glob. Change Biol. 2019, 25, 686–698. [Google Scholar] [CrossRef] [PubMed]
- Yang, T.; Yang, Z.; Xu, C.; Li, F.; Fang, F.; Feng, J. Greenhouse gas emissions from double-season rice field under different tillage practices and fertilization managements in Southeast China. Agronomy 2023, 13, 1887. [Google Scholar] [CrossRef]
- Cai, Y.; Ding, W.; Luo, J. Nitrous oxide emissions from Chinese maize-wheat rotation systems: A 3-year field measurement. Atmos. Environ. 2013, 65, 112–122. [Google Scholar] [CrossRef]
- IPCC. Climate Change 2013. Working Group Contribution of the IPCC Fifth Assessment Report: The Physical Science Basis; Cambridge University Press: Cambridge, UK, 2013. [Google Scholar]
- Luton, P.E.; Wayne, J.M.; Sharp, R.J.; Riley, P.W. The mcrA gene as an alternative to 16S rRNA in the phylogenetic analysis of methanogen populations in landfills. Microbiology 2002, 148, 3521–3530. [Google Scholar] [CrossRef] [PubMed]
- Costello, A.M.; Lidstrom, M.E. Molecular characterization of functional and phylogenetic genes from natural populations of methanotrophs in lake sediments. Appl. Environ. Microbiol. 1999, 65, 5066–5074. [Google Scholar] [CrossRef]
- Cowan, N.; Bhatia, A.; Drewer, J.; Jain, N.; Singh, R.; Tomer, R.; Kumar, V.; Kumar, O.; Prasanna, R.; Ramakrishnan, B.; et al. Experimental comparison of continuous and intermittent flooding of rice in relation to methane, nitrous oxide and ammonia emissions and the implications for nitrogen use efficiency and yield. Agric. Ecosyst. Environ. 2021, 319, 107571. [Google Scholar] [CrossRef]
- Mboyerwa, P.A.; Kibret, K.; Mtakwa, P.; Aschalew, A. Greenhouse gas emissions in irrigated paddy rice as influenced by crop management practices and nitrogen fertilization rates in eastern Tanzania. Front. Sustain. Food Syst. 2022, 6, 868479. [Google Scholar] [CrossRef]
- Zhang, X.; Chen, T.; Qi, Y.; Yang, R.; Deng, A.; Wang, T.; Zheng, C.; Zhang, W. Optimization of Rice-Based Double-Cropping System with Conservation Practice Mitigates Carbon Emission While Ensuring Profitability. Agronomy 2022, 12, 924. [Google Scholar] [CrossRef]
- Wang, Z.; Xing, A.; Shen, H. Effects of nitrogen addition on the combined global warming potential of three major soil greenhouse gases: A global meta-analysis. Environ. Pollut. 2023, 12, 1848. [Google Scholar] [CrossRef]
- Guo, T.; Zhang, Q.; Ai, C.; Liang, G.; He, P.; Zhou, W. Nitrogen enrichment regulates straw decomposition and its associated microbial community in a double-rice cropping system. Sci. Rep. 2018, 8, 1847. [Google Scholar] [CrossRef]
- Linquist, B.A.; Adviento-Borbe, M.A.; Pittelkow, C.M.; van Kessel, C.; van Groenigen, K.J. Fertilizer management practices and greenhouse gas emissions from rice systems: A quantitative review and analysis. Field Crops Res. 2012, 135, 10–21. [Google Scholar] [CrossRef]
- Sun, B.F.; Zhao, H.; Lu, Y.Z.; Fei, L.U.; Wang, X.K. The effects of nitrogen fertilizer application on methane and nitrous oxide emission/uptake in Chinese croplands. J. Integr. Agric. 2016, 15, 440–450. [Google Scholar] [CrossRef]
- Tang, J.; Zhang, R.; Li, H.; Zhang, J.; Chen, S.; Lu, B. Effect of the applied fertilization method under full straw return on the growth of mechanically transplanted rice. Plants 2020, 9, 399. [Google Scholar] [CrossRef] [PubMed]
- Zhang, J.; Hang, X.; Lamine, S.M.; Jiang, Y.; Afreh, D.; Qian, H.; Feng, X.; Zheng, C.; Deng, A.; Song, Z.; et al. Interactive effects of straw incorporation and tillage on crop yield and greenhouse gas emissions in double rice cropping system. Agric. Ecosyst. Environ. 2017, 250, 37–43. [Google Scholar] [CrossRef]
- Li, D.; He, H.; Zhou, G.; He, Q.; Yang, S. Rice Yield and Greenhouse Gas Emissions Due to Biochar and Straw Application under Optimal Reduced N Fertilizers in a Double Season Rice Cropping System. Agronomy 2023, 13, 1023. [Google Scholar] [CrossRef]
- Gupta, K.; Kumar, R.; Baruah, K.K.; Hazarika, S.; Karmakar, S.; Bordoloi, N. Greenhouse gas emission from rice fields: A review from Indian context. Environ. Sci. Pollut. Res. 2021, 28, 30551–30572. [Google Scholar] [CrossRef]
- Benckiser, G.; Eilts, R.; Linn, A.; Lorch, H.J.; Sümer, E.; Weiske, A.; Wenzhöfer, F. N2O emissions from different cropping systems and from aerated, nitrifying and denitrifying tanks of a municipal waste water treatment plant. Biol. Fertil. Soils 1996, 23, 257–265. [Google Scholar] [CrossRef]
- Kay, B.D.; VandenBygaart, A.J. Conservation tillage and depth stratification of porosity and soil organic matter. Soil Tillage Res. 2002, 66, 107–118. [Google Scholar] [CrossRef]
- Miller, L.T.; Griffis, T.J.; Erickson, M.D.; Turner, P.A.; Deventer, M.J.; Chen, Z.; Yu, Z.; Venterea, R.T.; Baker, J.M.; Frie, A.L. Response of nitrous oxide emissions to individual rain events and future changes in precipitation. J. Environ. Qual. 2022, 51, 3. [Google Scholar] [CrossRef]
- Millar, N.; Doll, J.E.; Robertson, G.P. Management of Nitrogen Fertilizer to Reduce Nitrous oxide (N2O) Emissions from Field Crops. Climate Change and Agriculture Fact Sheet Series, Michigan State University East Lansing. 2014. Available online: https://www.canr.msu.edu/uploads/resources/pdfs/Management_of_Nitrogen_Fertiler_(E3152).pdf (accessed on 19 February 2024).
- Zhang, W.; Yu, Y.; Huang, Y.; Li, T.; Wang, P. Modeling methane emissions from irrigated rice cultivation in China from 1960 to 2050. Glob. Change Biol. 2011, 17, 3511–3523. [Google Scholar] [CrossRef]
- Zhang, H.L.; Bai, X.L.; Xue, J.F.; Chen, Z.D.; Tang, H.M.; Chen, F. Emissions of CH4 and N2O under different tillage systems from double-cropped paddy fields in southern China. PLoS ONE 2013, 8, e65277. [Google Scholar] [CrossRef] [PubMed]
- Jiang, Y.; van Groenigen, K.J.; Huang, S.; Hungate, B.A.; van Kessel, C.; Hu, S.; Zhang, W. Higher yields and lower methane emissions with new rice cultivars. Glob. Change Biol. 2017, 23, 4728–4738. [Google Scholar] [CrossRef] [PubMed]
- Launio, C.C.; Asis, C.A.; Manalili, R.G.; Javier, E.F. Economic analysis of rice straw management alternatives and understanding farmers’ choices. In Cost-Benefit Studies of Natural Resource Management in Southeast Asia; Springer: Singapore, 2015; pp. 93–111. [Google Scholar] [CrossRef]
- Raheem, A.; Wang, T.; Huang, J.; Danso, F.; Bankole, O.O.; Deng, A.; Gao, J.; Zhang, J.; Zhang, W. Leguminous green manure mitigates methane emissions in paddy field by regulating acetoclastic and hydrogenotrophic methanogens. Eur. J. Soil Biol. 2022, 108, 103380. [Google Scholar] [CrossRef]
- Shrestha, M.; Shrestha, P.M.; Frenzel, P.; Conrad, R. Effect of nitrogen fertilization on methane oxidation, abundance, community structure, and gene expression of methanotrophs in the rice rhizosphere. ISME J. 2010, 4, 1545–1556. [Google Scholar] [CrossRef] [PubMed]
- Ahn, J.H.; Song, J.; Kim, B.Y.; Kim, M.S.; Joa, J.H.; Weon, H.Y. Characterization of the bacterial and archaeal communities in rice field soils subjected to long-term fertilization practices. J. Gen. Microbiol. 2012, 50, 754–765. [Google Scholar] [CrossRef] [PubMed]
- Conrad, R. Importance of hydrogenotrophic, acetoclastic and methylotrophic methanogenesis for methane production in terrestrial, aquatic and other anoxic environments: A mini-review. Pedosphere 2020, 30, 25–39. [Google Scholar] [CrossRef]
- Li, S.; Chen, L.; Han, X.; Yang, K.; Liu, K.; Wang, J.; Chen, Y.; Liu, L. Rice Cultivar Renewal Reduces Methane Emissions by Improving Root Traits and Optimizing Photosynthetic Carbon Allocation. Agriculture 2022, 12, 2134. [Google Scholar] [CrossRef]


| Cropping Systems | Crop Straw Incorporation | Total NPK Fertilizer Application Rate (kg ha−1) | Fertilizer Application Ratio in Different Stages (kg−1 plot−1) | |||||||||
|---|---|---|---|---|---|---|---|---|---|---|---|---|
| N | P2O5 | K2O | ||||||||||
| Straw | No Straw | N | P2O5 | K2O | Basal | Tillering | Panicle | Flowering | Basal | Basal | Panicle | |
| Single rice | SN0 | NSN0 | 0 | 70 | 60 | 0.45 | 0.18 | 0.18 | ||||
| SN1 | NSN1 | 150 | 70 | 60 | 0.21 | 0.25 | 0.25 | 0.10 | ||||
| SN2 | NSN2 | 180 | 70 | 60 | 0.29 | 0.29 | 0.29 | 0.12 | ||||
| Double rice | SN0 | NSN0 | 0 | 75 | 75 | 1.87 | 0.19 | 0.19 | ||||
| SN1 | NSN1 | 165 | 75 | 75 | 0.54 | 0.21 | 0.32 | |||||
| SN2 | NSN2 | 195 | 75 | 75 | 0.64 | 0.25 | 0.38 | |||||
| Rice-Wheat | SN0 | NSN0 | 0 | 67.5 | 67.5 | 2.47 | 0.25 | 0.25 | ||||
| SN1 | NSN1 | 240 | 67.5 | 67.5 | 0.69 | 0.37 | 0.55 | 0.69 | ||||
| SN2 | NSN2 | 270 | 67.5 | 67.5 | 0.77 | 0.41 | 0.62 | 0.77 | ||||
| Cropping Systems | Treatments | Cumulative CH4 (kg ha−1) | Cumulative N2O kg ha−1 | Total Greenhouse Gas kg CO2-eq ha−1 | Yield (t ha−1) | Yield-Scaled Emission kg CO2-eq kg−1 |
|---|---|---|---|---|---|---|
| Single rice | NSN0 | 173.4 ± 80.6 c | 0.2 ± 0.1 a | 4904.5 ± 2219.0 c | 7.6 ± 0.2 b | 0.7 ± 0.3 b |
| NSN1 | 230.6 ± 75.0 c | 0.4 ± 0.1 a | 6541.5 ± 2099.8 c | 10.9 ± 0.2 a | 0.6 ± 0.1 b | |
| NSN2 | 351.0 ± 85.4 abc | 0.4 ± 0.3 a | 9904.3 ± 1544.2 abc | 10.7 ± 0.1 a | 0.9 ± 0.1 b | |
| SN0 | 700.5 ± 170.4 a | 0.1 ± 0.2 a | 19,571.5 ± 4698.5 a | 7.1 ± 0.4 b | 2.8 ± 0.6 a | |
| SN1 | 661.2 ± 204.0 ab | 0.2 ± 0.4 a | 18,513.0 ± 5713.8 ab | 9.6 ± 0.1 a | 2.0 ± 0.6 ab | |
| SN2 | 288.7 ± 60.3 bc | 0.3 ± 0.1 a | 8139.6 ± 1660.0 bc | 10.2 ± 0.8 a | 0.8 ± 0.1 b | |
| Average | 400.9 ± 65.1 B | 0.3 ± 0.1 C | 11,262.1 ± 1810.4 B | 9.3 ± 0.4 A | 1.3 ± 0.2 B | |
| Double rice | NSN0 | 687.4 ± 155.3 a | 1.2 ± 0.8 a | 19,502.5 ± 4572.59 ab | 6.8 ± 0.2 b | 2.9 ± 0.8 a |
| NSN1 | 576.0 ± 93.4 a | 0.9 ± 0.6 a | 16,331.1 ± 2582.40 b | 10.1 ± 0.8 a | 1.6 ± 0.2 a | |
| NSN2 | 839.7 ± 44.3 a | 1.0 ± 0.7 a | 23,702.4 ± 1376.56 ab | 10.7 ± 0.6 a | 2.3 ± 0.2 a | |
| SN0 | 634.7 ± 72.9 a | 1.0 ± 0.4 a | 17,964.7 ± 1376.56 a | 6.3 ± 0.5 b | 2.9 ± 0.5 a | |
| SN1 | 891.0 ± 121.2 a | 1.1 ± 0.7 a | 25,165.9 ± 3174.29 ab | 9.0 ± 0.5 a | 2.8 ± 0.2 a | |
| SN2 | 746.3 ± 136.1 a | 1.8 ± 0.3 a | 21,313.8 ± 3725.70 ab | 9.9 ± 0.9 a | 2.1 ± 0.2 a | |
| Average | 729.2 ± 46.4 A | 1.2 ± 0.2 B | 20,663.4 ± 1302.1 A | 8.8 ± 0.5 A | 2.5 ± 0.2 A | |
| Rice-Wheat | NSN0 | 226.2 ± 9.2 e | 2.5 ± 0.6 a | 6988.0 ± 237.0 d | 7.5 ± 0.2 a | 0.9 ± 0.1 e |
| NSN1 | 285.6 ± 34.6 de | 2.4 ± 0.6 a | 8619.9 ± 787.7 cd | 7.8 ± 0.1 a | 1.1 ± 0.1 de | |
| NSN2 | 367.1 ± 72.1 cd | 2.3 ± 1.0 a | 10,865.5 ± 2273.5 bc | 7.7 ± 0.3 a | 1.4 ± 0.3 cd | |
| SN0 | 504.6 ± 27.6 ab | 1.6 ± 1.4 a | 14,513.0 ± 753.0 b | 6.7 ± 0.2 b | 2.2 ± 0.1 b | |
| SN1 | 633.8 ± 76.2 a | 1.9 ± 0.4 a | 18,190.7 ± 2066.1 a | 6.8 ± 0.2 b | 2.7 ± 0.2 a | |
| SN2 | 434.9 ± 12.5 bc | 1.8 ± 0.6 a | 12,635.7 ± 527.6 b | 7.5 ± 0.1 a | 1.7 ± 0.1 c | |
| Average | 408.6 ± 36.0 B | 2.1 ± 0.3 A | 11,968.8 ± 989.5 B | 7.3 ± 0.1 B | 1.7 ± 0.2 B | |
| Source of variations | ||||||
| Cropping systems (Cs) | 21.76 ** | 10.94 ** | 21.85 ** | 30.99 ** | 96.7 0 ** | |
| Straw incorporation (S) | 17.76 ** | 0.29 NS | 17.46 ** | 11.48 ** | 13.83 ** | |
| Nitrogen (N) | 0.56 NS | 0.12 NS | 0.57 NS | 50.31 ** | 1.66 | |
| Cs × S | 2.42 NS | 0.63 NS | 2.32 NS | 0.03 NS | 4.31 * | |
| Cs × N | 0.92 NS | 0.06 NS | 0.93 NS | 9.06 ** | 2.04 | |
| S × N | 6.37 ** | 0.22 NS | 6.27 ** | 0.76 NS | 3.55 * | |
| Cs × S × N | 1.25 NS | 0.08 NS | 1.29 NS | 0.20 NS | 1.14 NS | |
Disclaimer/Publisher’s Note: The statements, opinions and data contained in all publications are solely those of the individual author(s) and contributor(s) and not of MDPI and/or the editor(s). MDPI and/or the editor(s) disclaim responsibility for any injury to people or property resulting from any ideas, methods, instructions or products referred to in the content. |
© 2024 by the authors. Licensee MDPI, Basel, Switzerland. This article is an open access article distributed under the terms and conditions of the Creative Commons Attribution (CC BY) license (https://creativecommons.org/licenses/by/4.0/).
Share and Cite
Bankole, O.O.; Danso, F.; Zhang, N.; Zhang, J.; Zhang, K.; Dong, W.; Lu, C.; Zhang, X.; Li, G.; Raheem, A.; et al. Integrated Effects of Straw Incorporation and N Application on Rice Yield and Greenhouse Gas Emissions in Three Rice-Based Cropping Systems. Agronomy 2024, 14, 490. https://doi.org/10.3390/agronomy14030490
Bankole OO, Danso F, Zhang N, Zhang J, Zhang K, Dong W, Lu C, Zhang X, Li G, Raheem A, et al. Integrated Effects of Straw Incorporation and N Application on Rice Yield and Greenhouse Gas Emissions in Three Rice-Based Cropping Systems. Agronomy. 2024; 14(3):490. https://doi.org/10.3390/agronomy14030490
Chicago/Turabian StyleBankole, Oluwaseyi Oyewale, Frederick Danso, Nan Zhang, Jun Zhang, Kun Zhang, Wenjun Dong, Changying Lu, Xin Zhang, Gexing Li, Abdulkareem Raheem, and et al. 2024. "Integrated Effects of Straw Incorporation and N Application on Rice Yield and Greenhouse Gas Emissions in Three Rice-Based Cropping Systems" Agronomy 14, no. 3: 490. https://doi.org/10.3390/agronomy14030490
APA StyleBankole, O. O., Danso, F., Zhang, N., Zhang, J., Zhang, K., Dong, W., Lu, C., Zhang, X., Li, G., Raheem, A., Deng, A., Zheng, C., Song, Z., & Zhang, W. (2024). Integrated Effects of Straw Incorporation and N Application on Rice Yield and Greenhouse Gas Emissions in Three Rice-Based Cropping Systems. Agronomy, 14(3), 490. https://doi.org/10.3390/agronomy14030490