Article

Greenhouse Gas Emissions, Carbon Footprint, and Grain Yields of Rice-Based Cropping Systems in Eastern China

1
Institute of Taizhou Agricultural Science, Jiangsu Academy of Agricultural Sciences, Taizhou 225300, China
2
Jiangsu Agricultural Biodiversity Cultivation and Utilization Research Center, Nanjing 210014, China
3
State Key Laboratory of Loess and Quaternary Geology, Institute of Earth Environment, Chinese Academy of Sciences, Xi’an 710061, China
4
Key Laboratory of Agro-Environment in Downstream of Yangze Plain, Ministry of Agriculture and Rural Affairs, Jiangsu Academy of Agricultural Sciences, Nanjing 210014, China
*
Author to whom correspondence should be addressed.
Agronomy 2024, 14(2), 395; https://doi.org/10.3390/agronomy14020395
Submission received: 16 January 2024 / Revised: 7 February 2024 / Accepted: 16 February 2024 / Published: 18 February 2024

Abstract

:
A multiple cropping system is beneficial for utilizing natural resources, while increasing the grain production and economic outputs. However, its impact on greenhouse gas emissions is unclear. The objective of this study was to evaluate the influence of rice-based cropping systems on methane (CH4) and nitrous oxide (N2O) emissions, the carbon footprint (CF), grain yields, and net economic returns in eastern China. Four treatments were applied: rice–fallow (as a control), rice–milk vetch, rice–wheat, and rice–rapeseed. Methane and N2O emissions were measured every 7 days via static chamber and gas chromatography methods from the 2019 rice season to the 2021 non-rice season. The CF was calculated based on the life cycle assessment. The results showed that multiple cropping systems significantly increased the annual grain yield by 1.2–6.4 t ha−1 and the annual CH4 and N2O emissions by 38–101 kg CH4-C ha−1 and 0.58–1.06 kg N2O-N ha−1, respectively. The average annual net returns for rice–wheat and rice–rapeseed were 131–150% greater than those for rice–milk vetch and rice–fallow. The annual CFs increased in the following order: rice–wheat (19.2 t CO2-eq ha−1) > rice–rapeseed (16.6 t CO2-eq ha−1) > rice–milk vetch (13.9 t CO2-eq ha−1) > rice–fallow (11.5 t CO2-eq ha−1). The CH4 emissions contributed to the largest share of the CF (60.4–68.8%), followed by agricultural inputs (27.2–33.7%) and N2O emissions (2.9–5.9%). Moreover, nitrogen fertilizer accounted for 65.6–72.4% of the indirect greenhouse gas emissions from agricultural inputs. No significant difference in the CF per unit grain yield was observed between the four rice-based cropping systems. The CF per net return of rice–wheat and rice–rapeseed significantly decreased by 37–50% relative to that of rice–fallow and rice–milk vetch. These findings suggest the potential to optimize rice-based cropping systems for environmental sustainability and grain security.

1. Introduction

Climate change and associated global warming, together with its potential influence on agricultural production, are a significant challenge. Greenhouse gas (GHG) emissions are closely related to global warming and agricultural production [1]. Agriculture is an important source of atmospheric noncarbon dioxide (CO2) GHG, and the emissions of methane (CH4) and nitrous oxide (N2O) account for approximately 50% and 60%, respectively, of global anthropogenic emissions [2,3]. Crop production is the main part of agriculture. During crop production, direct emissions of CH4 and N2O from farmland soil into the atmosphere occur [2,4,5]; in addition, agricultural inputs, such as the production of fertilizers and pesticides, fuel for agricultural machinery, and irrigation electricity, indirectly lead to GHG emissions [6,7]. Therefore, effective measures for reducing the rate of direct and indirect GHG emissions from crop production are urgently needed.
Methane is produced in anaerobic soil by methanogenic bacteria, while N2O is produced from soils through the microbial processes of nitrification and denitrification [8,9]. The emissions of CH4 and N2O from paddy soils are influenced not only by climate and soil factors but also by agricultural management, such as cropping systems [10,11,12], straw incorporation [13,14,15], soil tillage [5,16], water regimes [2,13,17], and fertilizer management [13,14,17,18]. A study revealed that after introducing rice–wheat or rice–rapeseed systems into permanently flooded rice fields, CH4 emissions decreased by 56.2–59.4%, while N2O emissions increased by 270–350% [19]. Tang et al. [12] reported that double rice systems resulted in significantly greater CH4 emissions but lower N2O emissions than paddy–upland systems. Furthermore, Zhou et al. [20] reported that rice–milk vetch had much higher CH4 emissions than other paddy–upland systems (i.e., rice–wheat, rice–rapeseed, rice–ryegrass, and rice–fallow).
The carbon footprint (CF) is a method of evaluating the intensity of GHG emissions during the lifecycle of a product or activity and has a positive effect on optimizing the effectiveness of human activities in environmental protection measures [21]. Previous studies evaluating the impact of crop production on CF have focused mostly on crop products such as maize [7,22], rice [22,23], wheat [21,22], cotton [24], soybeans [7], and rapeseed [25]. Other studies have analyzed the CF of different cropping systems in dry land [26,27] and paddy land [11,28,29]. Chen et al. [28] showed that the CF per unit area of a rice–wheat system was 8.83 t CO2-eq ha−1; the CF was negatively correlated with farm size. In addition, Hu et al. [29] reported that the CF of a rice–wheat system under wheat straw incorporation was 7.66–11.79 t CO2-eq ha−1 and noted that CH4 emissions were the main source of the CF. However, previous studies have rarely included grain yield or economic output in CF analysis. Moreover, crop production has obvious regional characteristics, meaning that agricultural inputs and crop productivity vary in different regions, which may lead to differences in the results of different studies evaluating CFs.
Multiple cropping systems are beneficial for utilizing natural resources such as light, heat, water, and soil and increasing the grain production and economic output of cropland. Eastern China, which is dominated by rice-based cropping systems, is the main region producing rice, wheat, and rapeseed in China. In recent years, how to reduce agricultural carbon emissions and increase economic output while ensuring food security has been an urgent problem that needs to be solved in this region. The balance between biomass input and output under different cropping systems in paddy fields determines the carbon and nitrogen nutrient balance of the ecosystem and thereby has multiple influences on CH4 and N2O emissions, crop yield, and economic output. However, these influences have rarely been studied simultaneously in previous studies. We hypothesized that multiple cropping systems would increase CH4 and N2O emissions and CF. To test this hypothesis, we conducted a two-year field measurement of CH4 and N2O emissions from four rice-based cropping systems under rice–milk vetch, rice–wheat, rice–rapeseed, and rice–fallow (as a control). Indicators of CF, CF per unit grain yield, and CF per net return were calculated based on the life cycle assessment method [28,30]. Our objectives in this study were to determine the influence of different rice-based cropping systems on GHG emissions, CF, grain yields, and net economic returns.

2. Materials and Methods

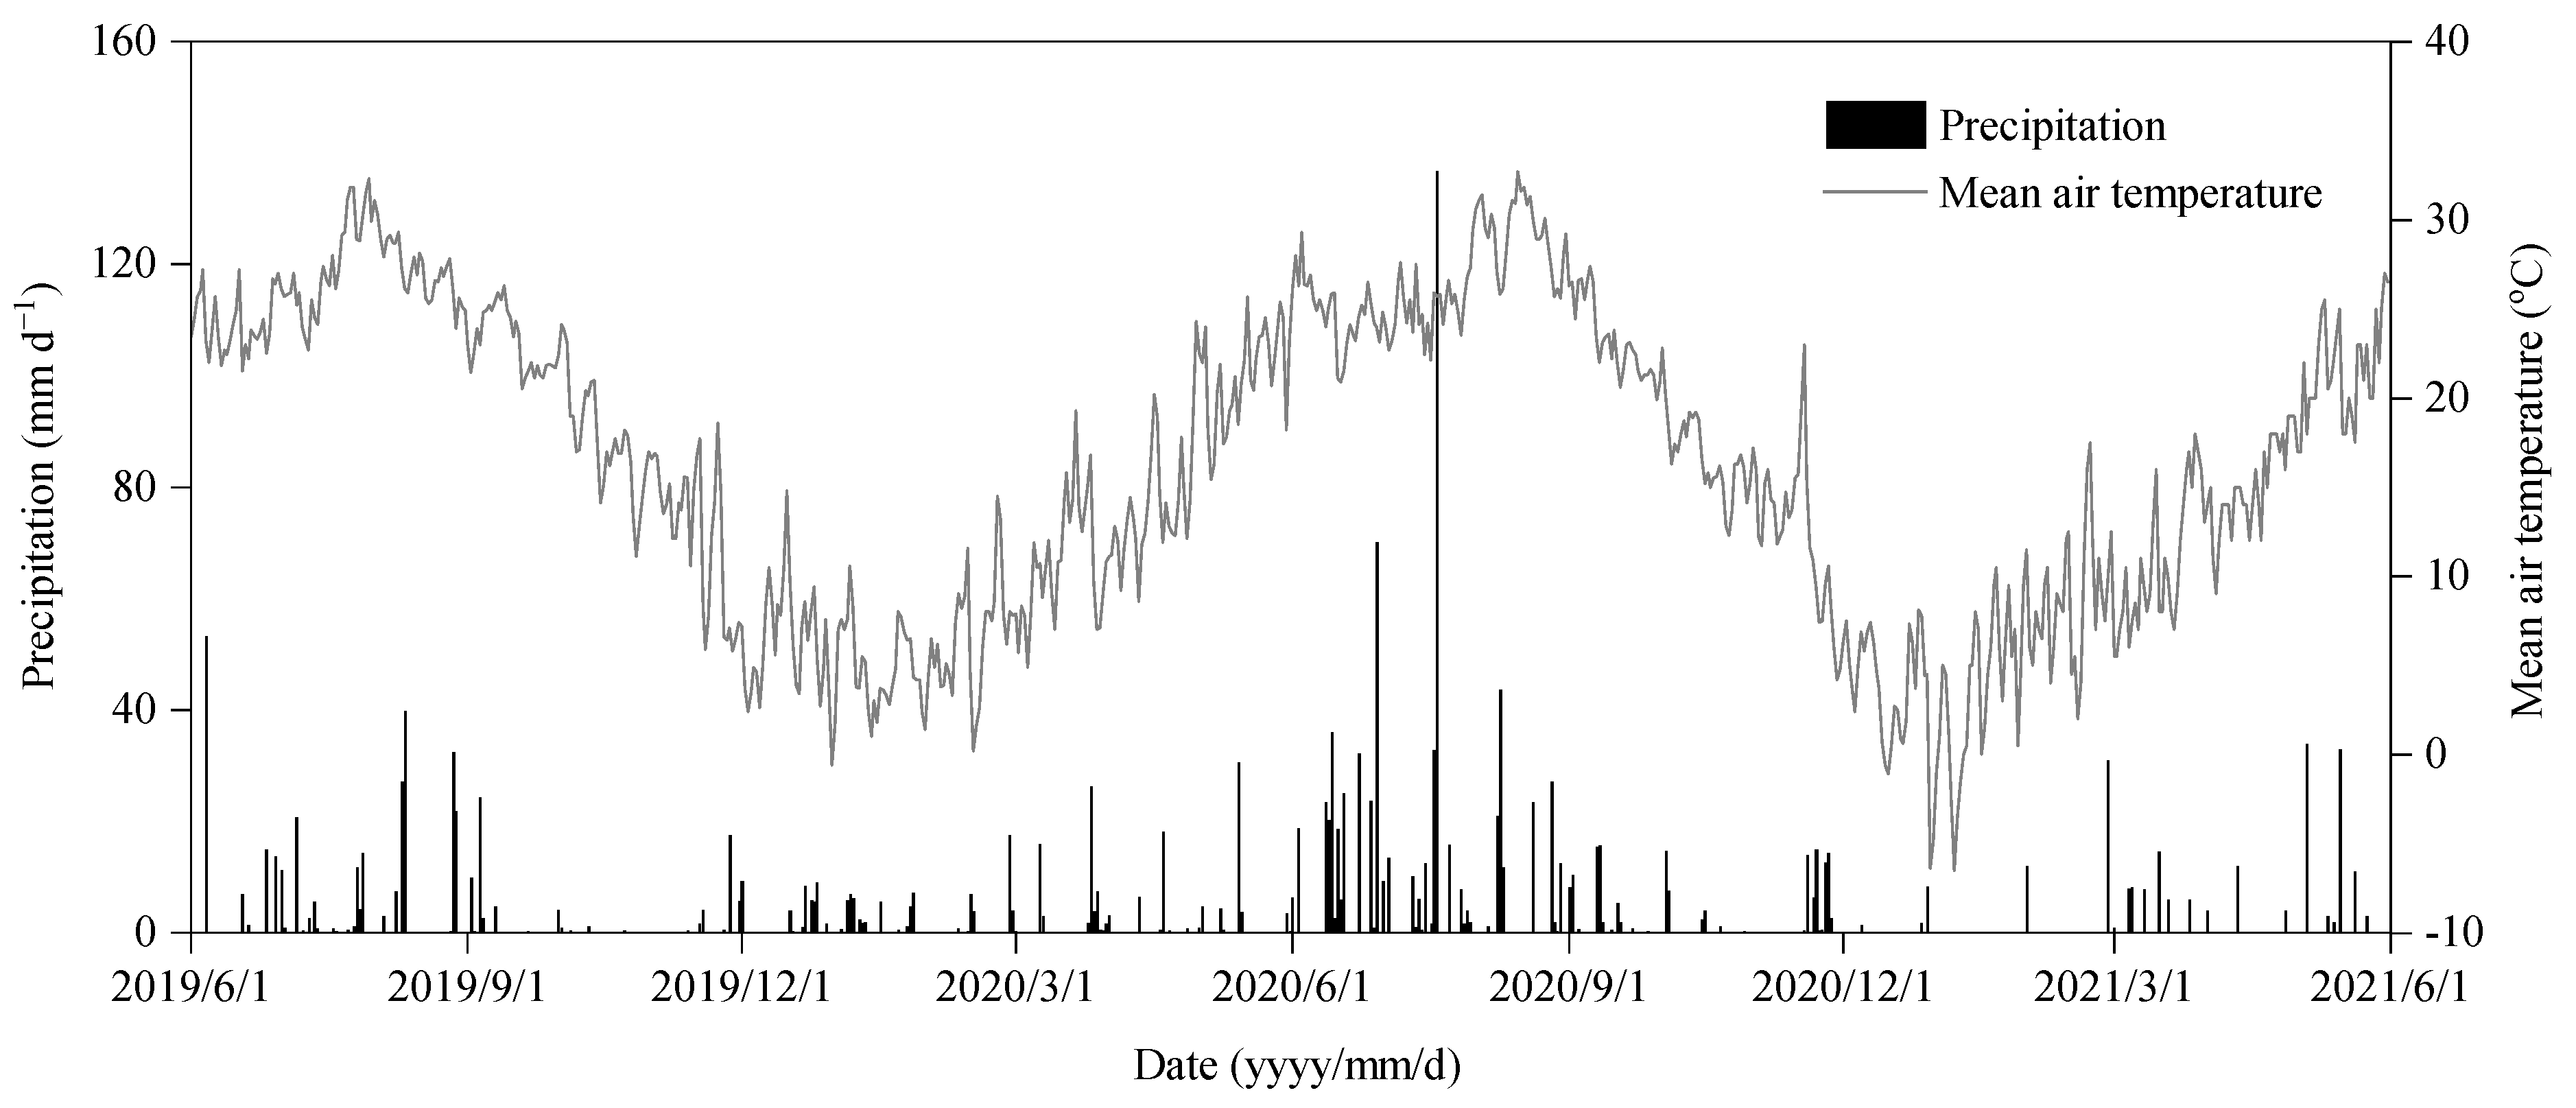
2.1. Experimental Site

The study was conducted at Taizhou Experimental Station (32°32′23″ N, 119°59′38″ E) in Jiangsu Province, eastern China. This region has a northern subtropical humid monsoon climate. The experimental paddy field soil was clay loam soil. Before the experiment, the topsoil (0–20 cm) contained 31.2 g kg−1 organic carbon, 1.8 g kg−1 total nitrogen, 6.8 mg kg−1 Olsen-P, and 101.7 mg kg−1 NH4OAc-K. The soil had a bulk density of 1.4 g cm−3 and a pH value of 6.5. Annually, the region receives 2235 sunshine hours and 1051 mm of precipitation. The annual average temperature is 14.5 °C, and the frostless period is 219 days. The daily precipitation and mean air temperature during the experiment were recorded from 2019 to 2021 (Figure 1).

2.2. Experimental Details and Management

The experiment was initiated in October 2016. Four rice-based cropping systems were established using a completely randomized block design with three replicates (4 m × 5 m for each replicate plot). The treatments included rice–milk vetch, rice–wheat, rice–rapeseed, and rice–fallow (as a control). Agricultural management, such as fertilizer application, water regime, pesticides, disease, and herbicide control, almost always followed local recommended management practices for high yields.
The rice cultivar Nanjing 9108 was used in this study. In the middle of June, 18-day-old rice plants were manually transplanted with 25 cm × 13.3 cm hill spacing at a density of 90 plants/m2. The rates of nitrogen, phosphorus, and potassium fertilizer use during the rice season in the four treatments were the same: 270 kg N ha−1, 75 kg P2O5 ha−1, and 75 kg K2O ha−1, respectively (Table 1). Nitrogen fertilizer in the form of urea was applied three times: 40% as the basal fertilizer, 30% as the tillering fertilizer, and 30% as the panicle initiation fertilizer. Phosphorus fertilizer in the form of calcium superphosphate was used as the basal fertilizer at one time, while potassium fertilizer in the form of potassium chloride was used as the basal fertilizer and panicle initiation fertilizer in equal amounts. Consistent with local farmers’ practices for obtaining high yields [31], after the rice was transplanted, all the experimental plots were submerged in a water layer of approximately 3–5 cm for approximately 35 days. Subsequently, the fields were then drained, and midseason drainage was maintained for approximately 10 days. The plots were then reflooded, followed by alternate wet and dry irrigation until 10 days before the rice harvest in October.
During the non-rice season, the cultivars used for milk vetch, wheat, and rapeseed were Xinzi 1, Ningmai 13, and Fengyou 737, respectively. In late October, milk vetch seeds were broadcast sown at a density of 2400 seeds m−2. Wheat seeds were sown in 25 cm-wide rows with a density of 375 seeds m−2. Thirty-day-old rapeseed seedlings were manually transplanted with 50 cm × 16.5 cm hill spacing at a density of 12 plants m−2. The soil tillage methods used in each experimental plot were the same. After harvesting the previous rice crop, straw was uniformly incorporated into each plot using a rotary tiller (1ZSD-180; Jiangyan Xinke Machinery Co., Ltd., Taizhou, China). In milk vetch, fertilizer was applied two times at the same rates as the basal fertilizer (11.25 kg N ha−1, 11.25 kg P2O5 ha−1, and 11.25 kg K2O ha−1) before rotary tillage and topdressing in early February. In the wheat plots, basal fertilizers (144 kg N ha−1, 45 kg P2O5 ha−1, and 45 kg K2O ha−1) were applied via surface broadcasting before rotary tillage and topdressing at the jointing stage (96 kg N ha−1, 45 kg P2O5 ha−1, and 45 kg K2O ha−1) in late February. The rates of nitrogen, phosphorus, and potassium fertilizer applied for rapeseed were 210 kg N ha−1, 90 kg P2O5 ha−1, and 90 kg K2O ha−1, respectively; these fertilizers were applied three times—50% as basal fertilizer—and two topdressings were applied in late December (20%) and late February (30%). No plots were irrigated during the non-rice season.

2.3. GHG Sampling and Measurements

Using static chamber and gas chromatography methods [15], CH4 and N2O emissions were measured from June 2019 to May 2021. Two polyvinyl chloride frames with a groove filled with water were inserted into each field plot for gas sampling. The static polyvinyl chloride chambers (length 50 cm; width 50 cm; height 120 cm) were covered with a layer of sponge and aluminum foil to minimize solar heating. Two 12-V battery-driven fans were installed inside the chamber to ensure complete gas mixing. In most cases (except for the Chinese NewYear holiday), gas samples were collected 1–2 times every 7 days from 8:00 to 10:00 in the morning. To measure the fluxes of CH4 and N2O, four gas samples were collected at 10 min intervals during a half-hour sampling process. Fifty milliliters of gas was collected from the chamber using a plastic syringe and stored in one hundred milliliter pre-evacuated gas bags (LB-301-0.1; Dalian Delin Gas Packaging Co., Ltd., Dalian, Liaoning, China). Afterward, the gas samples were sent to the laboratory for analysis within 24 h.
The gas samples were analyzed by gas chromatography (7890A; Agilent Technologies, Santa Clara, CA, USA) equipped with a Porapak Q 80-100 separation column, a flame ionization detector, and a 63Ni electron capture detector for CH4 and N2O, respectively. The two detectors and the oven were operated at 300 °C and 60 °C, respectively. The CH4 and N2O fluxes were calculated from the slope of the mixing ratio of four sequential samples [18]. The cumulative CH4 and N2O emissions were calculated according to previous studies [5,32].
CH 4   or   N 2 O   emission = i = 1 n ( F i + F i + 1 ) / 2 × 24 × ( t i + 1 t 1 )
where n is the number of total measurements; i is the ith measurement; F is the CH4 and N2O flux (mg m−2 h−1); and ti + ti+1 is the difference between two adjacent measurements (d).

2.4. Crop Yield Measurements and Economic Analysis

Crop yields were determined by harvesting 3 m2 areas in the middle of each experimental plot at maturity. The crop yields of rice, wheat, and rapeseed were adjusted to 14.5%, 13%, and 14%, respectively, of the moisture content. The net economic return (CNY ha−1) was calculated using the formula described by [30]:
Net return = Yield gains − Input costs
The yield gains were calculated from the crop grain price and crop yield. Input costs included the cost of agricultural inputs (Table 1) and land rent. The prices of agricultural inputs (seeds, pesticides, fertilizers, diesel fuel, irrigation, human labor) were based on the China Agricultural Inputs Network (http://www.ampcn.com/, accessed on 22 October 2023).

2.5. Carbon Footprint Calculation

The CF of a rice-based cropping system consists of direct and indirect GHG emissions. Here, direct GHG emissions refer to CH4 and N2O emissions from agroecosystems, while indirect GHG emissions refer to agricultural inputs, such as seeds, pesticides, fertilizers, agricultural machinery fuels, and irrigation electricity. The CF was calculated in carbon dioxide equivalents (CO2-eq) as follows [7,28]:
CF = CH 4 × 34 + N 2 O × 298 + i = 1 n ( θ i × C i )
CF y = CF yield
CF e = CF R net
where CF is the C footprint per unit of area (t CO2-eq ha−1); θi and Ci are the agricultural input and its GHG emission factors, respectively (Table 1) [7,28]; CFy is the CF per unit grain yield (t CO2-eq t−1); CFe is the CF per net return (kg CO2-eq CNY−1); and Rnet is the net economic return (CNY ha−1). The IPCC factors (34 for CH4 and 298 for N2O, as given by the IPCC, 2021) [3] were adopted to calculate the direct GHG emissions.

2.6. Statistical Analysis

Statistical analysis was conducted using the SPSS 13.0 software package (SPSS, Inc., Chicago, IL, USA). Two-way analysis of variance (ANOVA) in conjunction with Duncan’s multiple range test was used to determine the significance of the effects of treatment and sampling year, and their interaction on GHG emissions, grain yield, and net return, CFy and CFe.

3. Results

3.1. Grain Yield and Net Return

For the rice-based cropping systems, significant differences in grain yield and net economic return are shown in Table 2. Averaged over the two years, the annual grain yields were 9.9, 11.1, 16.3, and 13.3 t ha−1 for rice–fallow, rice–milk vetch, rice–wheat, and rice–rapeseed, respectively. Compared to those of rice–fallow rice, the annual grain yields of rice–milk vetch, rice–rapeseed, and rice–wheat significantly increased by 1.2, 3.4, and 6.4 t ha−1, respectively. Compared to those of the rice–fallow treatment (5469 CNY ha−1), the rice–rapeseed treatment (13,478 CNY ha−1) and rice–wheat treatment (13,684 CNY ha−1) significantly increased the average annual net returns by 146% and 150%, respectively, whereas no significant difference was observed between the rice–fallow and rice–milk vetch treatments (5841 CNY ha−1).

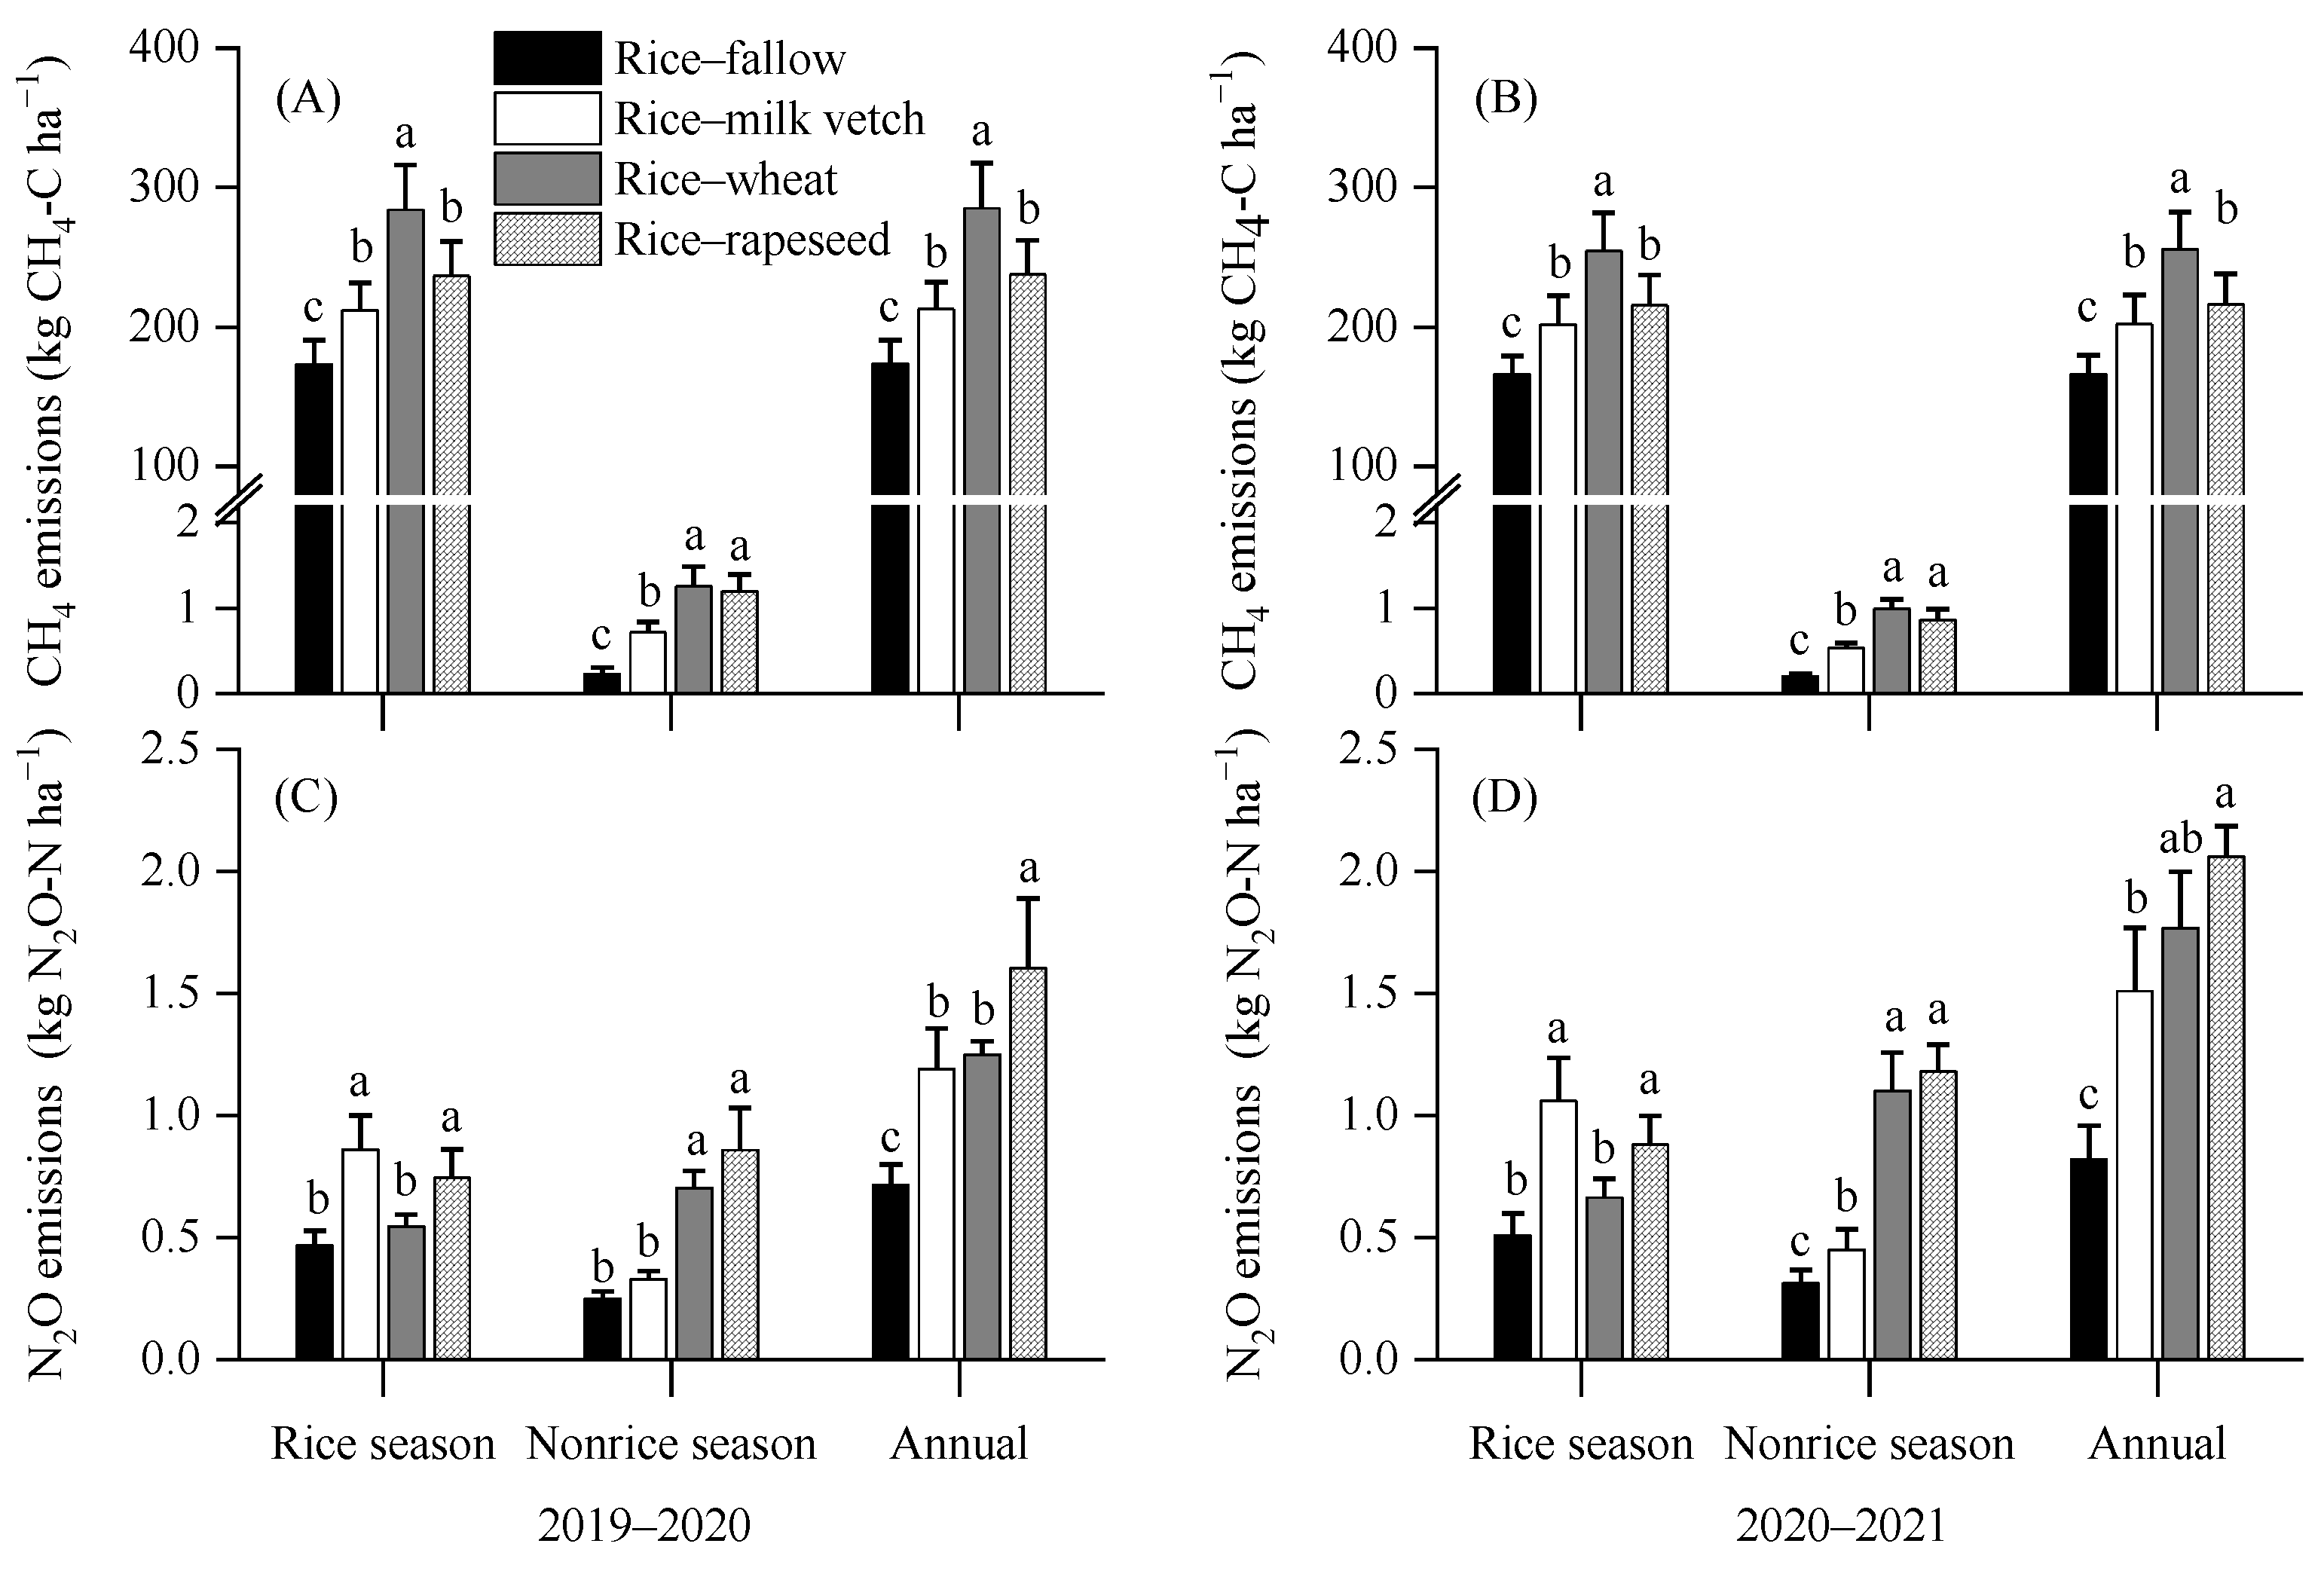
3.2. Methane and Nitrous Oxide Emissions

As shown in Figure 2A,B, CH4 emissions were significantly influenced by the rice-based cropping system. For all the cropping systems, higher CH4 emissions were recorded in the rice season than in the non-rice season. During the rice season, the CH4 emissions increased in the following order: rice–wheat > rice–rapeseed > rice–milk vetch > rice–fallow. The annual CH4 emissions of the rice–based cropping systems were 174–285 kg CH4-C ha−1 and 166–256 kg CH4-C ha−1 in the two years. Averaged over the two years, the annual CH4 emissions of rice–fallow, rice–milk vetch, rice–wheat, and rice–rapeseed were 170, 208, 271, and 227 kg CH4-C ha−1, respectively. Compared to those of the rice–fallow cropping system, the multiple cropping systems (i.e., rice–milk vetch, rice–wheat and rice–rapeseed) significantly increased the CH4 emissions by 38–101 kg CH4-C ha−1 (22–59%). Compared with those of rice–wheat, the CH4 emissions of rice–milk vetch and rice–rapeseed significantly decreased by 23% and 16%, respectively (averaged over two years).
The seasonal N2O emissions varied significantly among the rice-based cropping systems (Figure 2C,D). In general, rice–milk vetch and rice–rapeseed yielded higher N2O emissions than rice–wheat and rice–fallow in the rice season, whereas rice–rapeseed and rice–wheat yielded higher N2O emissions than rice–milk vetch and rice–fallow in the non-rice season. In 2019–2020 and 2020–2021, the annual N2O emissions of all the cropping systems ranged from 0.72 to 1.60 kg N2O-N ha−1 and from 0.82 to 2.06 kg N2O-N ha−1, respectively. On average, the annual N2O emissions were significantly greater from rice–rapeseed (1.83 kg N2O-N ha−1) than from rice–fallow (0.77 kg N2O-N ha−1), rice–milk vetch (1.35 kg N2O-N ha−1) and rice–wheat (1.51 kg N2O-N ha−1). Compared to the rice–fallow, the rice–milk vetch, rice–wheat, and rice–rapeseed significantly increased the annual N2O emissions by 0.58, 0.74, and 1.06 kg N2O-N ha−1, respectively. Although the annual N2O emissions were lower for rice–milk vetch than for rice–wheat, this effect was not statistically significant.

3.3. Indirect GHG Emissions from Agricultural Inputs

The annual agricultural inputs contributed 3423, 3816, 6214, and 5468 kg CO2-eq ha−1 to the indirect GHG emissions for rice–fallow, rice–milk vetch, rice–wheat, and rice–rapeseed, respectively (Table 3). The largest contribution came from synthetic fertilizers (74.5–81.7%), especially nitrogen fertilizer. Moreover, greater indirect GHG emissions from nitrogen fertilizer were observed for rice–wheat and rice–rapeseed than for rice–fallow and rice–milk vetch. After fertilizer, diesel fuel for agricultural machinery was the next most important agricultural input contributing to the indirect GHG emissions in different rice-based cropping systems. In addition, the indirect GHG emissions from fungicides, pesticides, herbicides, and labor were lower than those of the other systems, accounting for only 0.2–1.5% of the total indirect emissions of the different cropping systems. The indirect GHG emissions from agricultural inputs were always greater for rice–wheat and rice–rapeseed than for rice–fallow and rice–milk vetch, largely due to the greater amounts of applied nitrogen fertilizer.

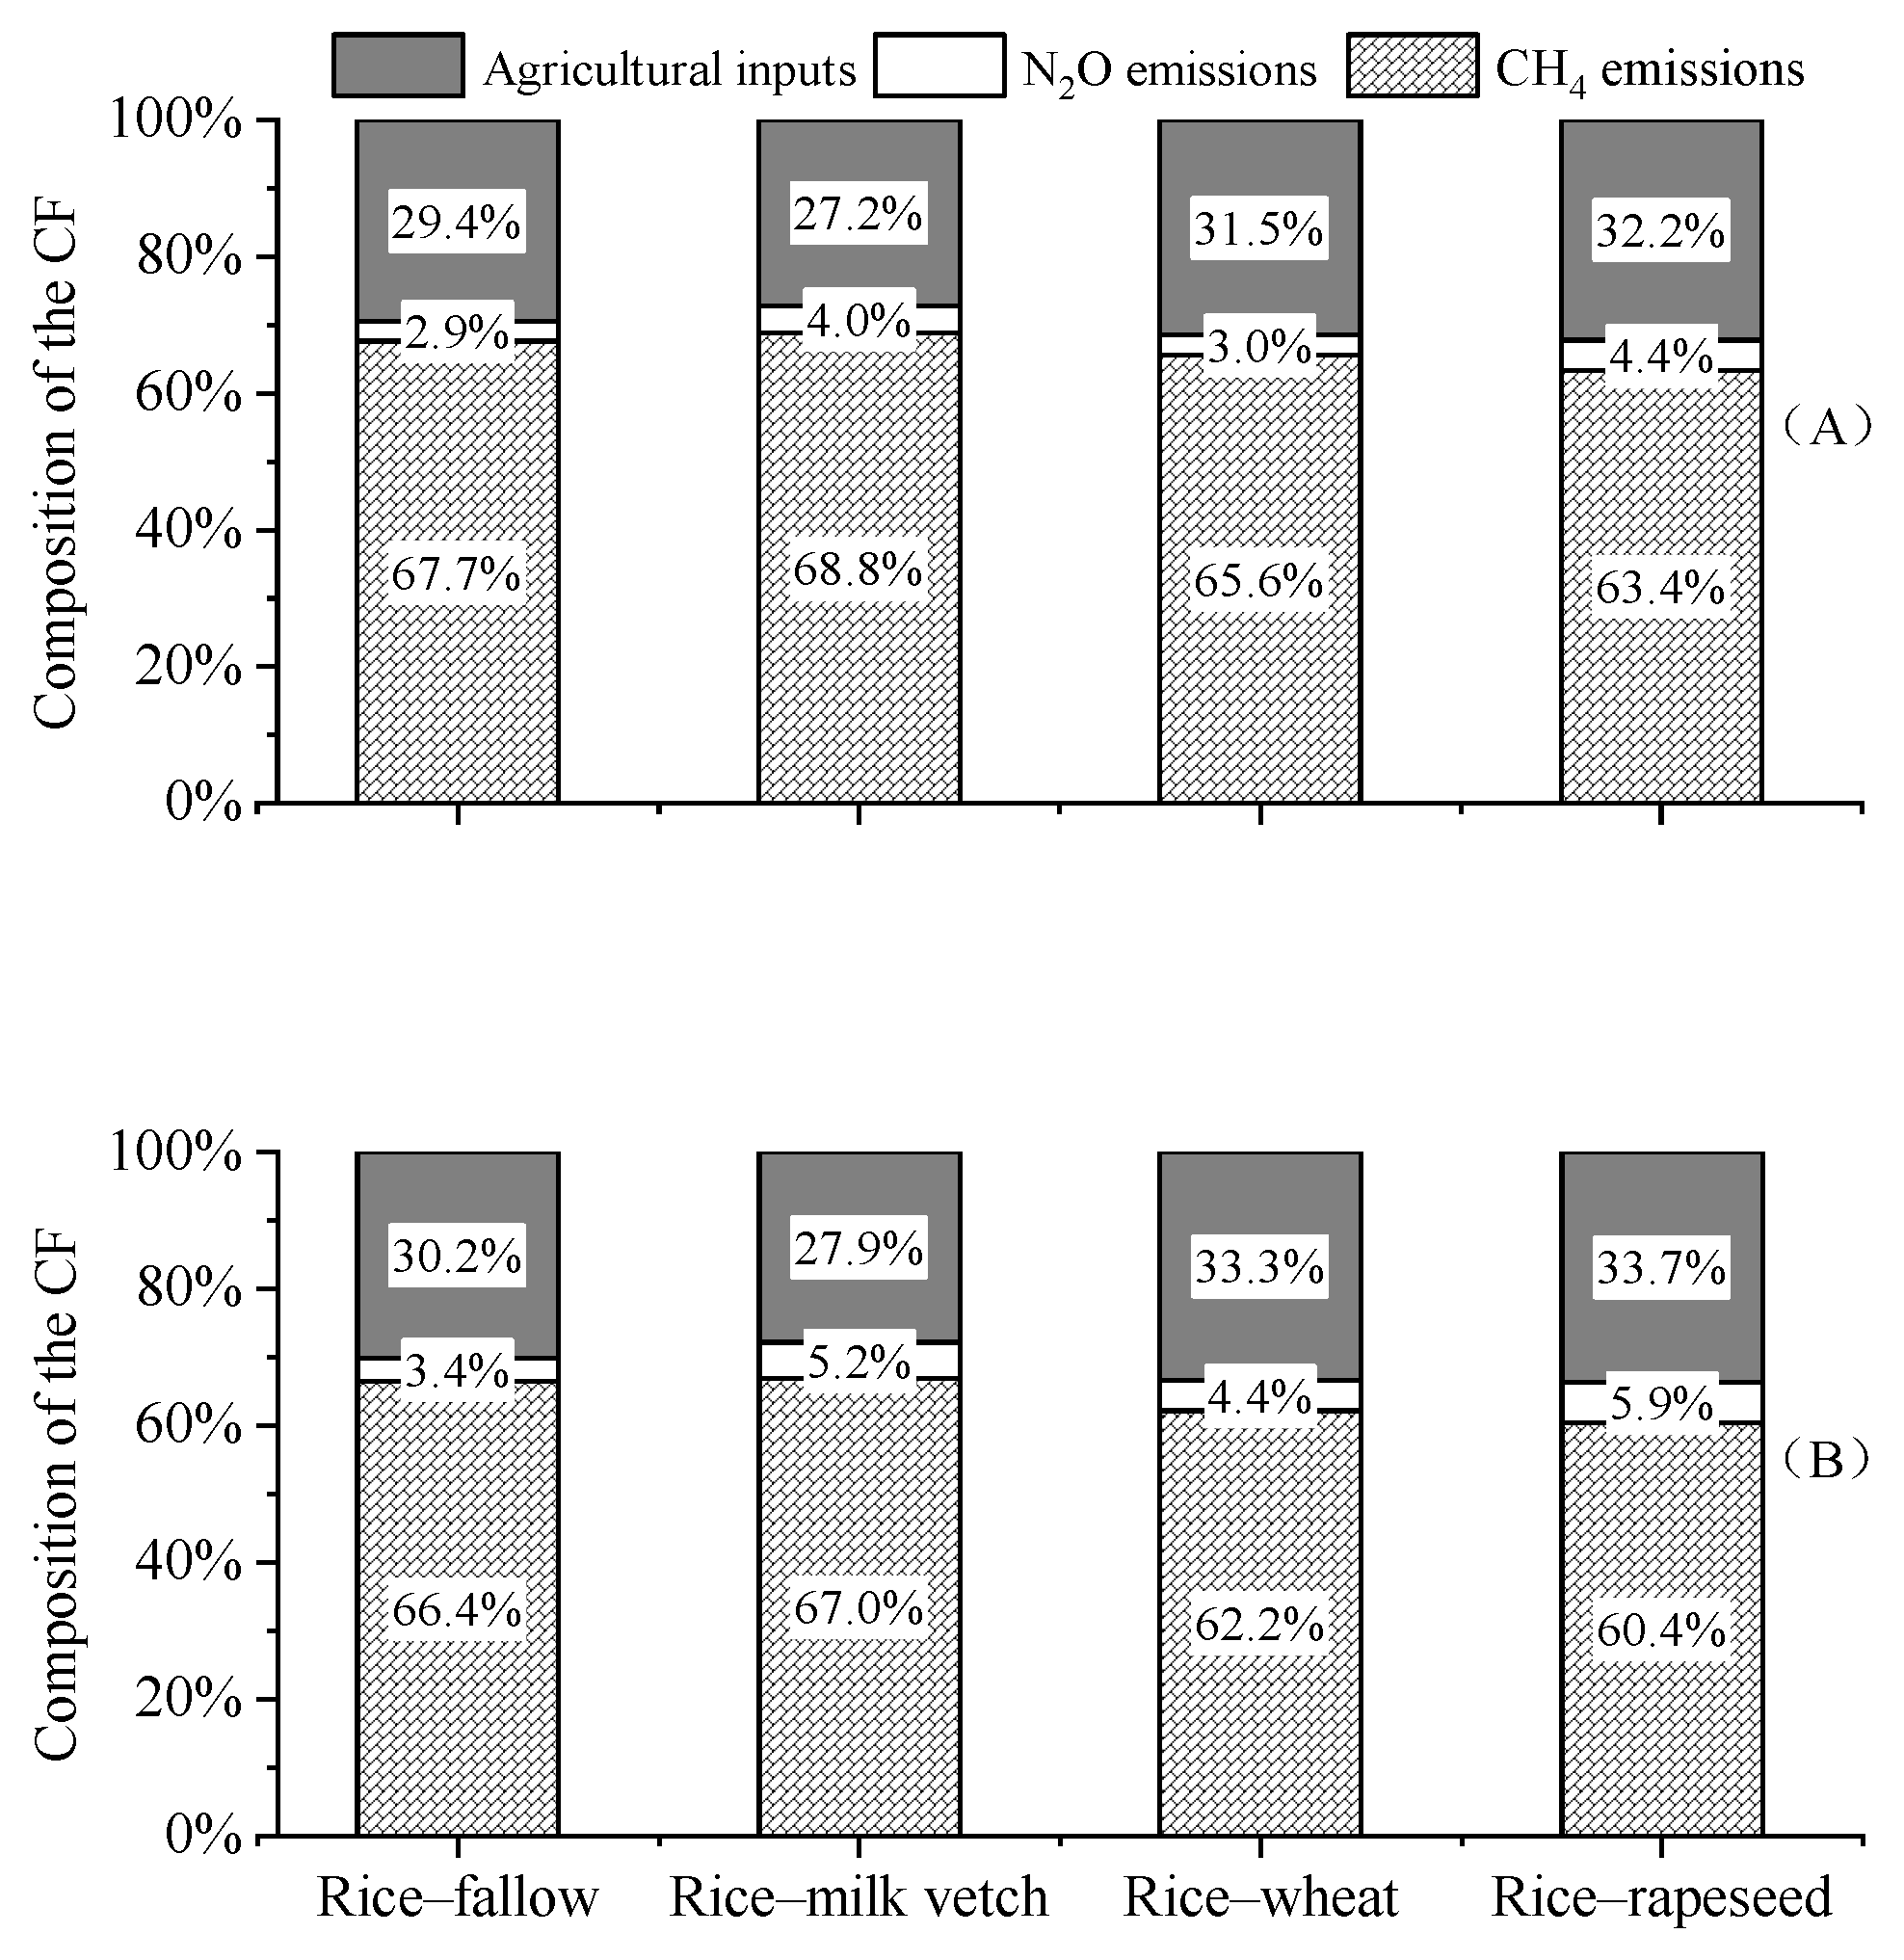
3.4. Carbon Footprint

Combining GHG emissions from CH4 and N2O emissions and agricultural inputs, the total CFs of the different rice-based cropping systems are shown in Table 4 and Figure 3. The annual CF varied greatly between the cropping systems, ranging from 11.3 to 19.7 t CO2-eq ha−1 over the two years. Rice–wheat had the highest average annual CF (19.2 t CO2-eq ha−1), followed by rice–rapeseed (16.6 t CO2-eq ha−1), rice–milk vetch (13.9 t CO2-eq ha−1), and rice–fallow (11.5 t CO2-eq ha−1). Compared to those under rice–fallow cultivation, the annual CFs under rice–wheat, rice–rapeseed and rice–milk vetch cultivation significantly increased by 67%, 45% and 21%, respectively. Similarly, compared with rice–milk vetch, rice–wheat and rice–rapeseed significantly increased the annual CF by 38% and 20%, respectively. A greater seasonal CF was found in the rice season than in the non-rice season. The CF in the rice season represented 82.0–98.9% of the total annual CF (Table 4). For all four rice-based cropping systems in the study (Figure 3), CH4 emissions accounted for the largest share of the total CF (60.4–68.8%), followed by agricultural inputs (27.2–33.7%) and N2O emissions (2.9–5.9%).
In the two years of the study, the CF per unit grain yield of the different rice-based cropping systems ranged from 1.14 to 1.26 t CO2-eq t−1 (Table 4). No significant difference in the CF per unit grain yield was observed between the four cropping systems. Averaged over the two years, the annual CF per net return was 2.29, 2.50, 1.44, and 1.25 kg CO2-eq CNY−1 for rice–fallow, rice–milk vetch, rice–wheat, and rice–rapeseed, respectively. The cropping system significantly influenced the CF per net return. Compared to the rice–fallow, the rice–wheat and rice–rapeseed significantly decreased CF per net return by 37% and 45%, respectively. However, compared with those of rice–milk vetch, the rice–wheat and rice–rapeseed decreased CF per net return by 42% and 50%, respectively.

4. Discussion

4.1. Effects of Cropping Systems on CH4 and N2O Emissions

In this two-year field study, the annual CH4 and N2O emissions of all four cropping systems ranged from 166 to 285 kg CH4-C ha−1 and from 0.72 to 2.06 kg N2O-N ha−1, respectively (Figure 2). These values agreed well with most previous extensive measurements conducted in this area [5,10,15,20,29,33]. As expected, relative to those of the rice–fallow cropping system, the multiple cropping systems (i.e., rice–milk vetch, rice–wheat, and rice–rapeseed) significantly increased the annual CH4 and N2O emissions by 22–59% and 75–138%, respectively, in the two years. Two potential reasons may explain the higher CH4 emissions observed under the multiple cropping systems. First, the incorporation of straw from milk vetch, wheat and rapeseed may have provided sufficient carbon substrate for CH4 production in the subsequent rice season [12,13,14,15,33]. Second, straw incorporation can potentially increase soil organic carbon storage, subsequently increasing the rate of CH4 formation in rice fields, especially during the rice season [15,18]. Our results were consistent with previous nitrogen rate field studies [13,34] showing that high rates of nitrogen fertilization lead to increasing rates of N2O emissions from agricultural fields. A high nitrogen application rate may be the most practical means for maximizing crop yield. The recommended annual nitrogen fertilizer rates in the study region were 270, 292.5, 510, and 480 kg N ha−1 for rice–fallow, rice–milk vetch, rice–wheat, and rice–rapeseed, respectively (Table 1). Moreover, previous studies [15,35] have shown that N2O production during the middle and late cropping seasons may increase in response to subsequent nitrogen release from straw decomposition. However, Yadvinder-Singh and Sidhu [36] reported that the nitrogen application rate during the rice season could decrease by 30 kg ha−1 (25%), with no significant yield change after three years of straw incorporation. We therefore speculate that the nitrogen fertilizer rate could be adjusted to mitigate N2O emissions under long-term straw incorporation. Possible tradeoffs between decreased N2O emissions and decreased grain yields need to be closely monitored through field experiments.
Overall, for rice-based cropping systems, effective GHG mitigation methods include reducing CH4 emissions in the rice season and/or reducing N2O emissions in the non-rice season. Methane was the most important GHG and should be mitigated first in rice-based systems. Since the 1990s, many agricultural practices have been explored to mitigate CH4 emissions from rice paddies without compromising yield in China [37]. However, comprehensive practices that systematically integrate various effective GHG mitigation management practices require further study to identify the most environmentally friendly management practices for sustainable crop production in Chinese rice-based cropping systems.

4.2. Effects of Cropping System on Carbon Footprint

Researchers have recently proposed that multiple cleaner production technologies should be developed to lower the CF in agroecosystems [21,38]. However, studies related to the CF of cropping systems are rare. The CF of the four rice-based cropping systems in this study varied from 11.3 to 19.7 t CO2-eq ha−1 over the two years. These values are less than the rice–rice results (39.2 t CO2-eq ha−1) reported by Ling et al. [11] but greater than the results reported by most previous studies related to rice–rice (10.3 t CO2-eq ha−1) [23,28], rice–wheat (7.7 t CO2-eq ha−1) [29] and maize–wheat (4.2–5.8 t CO2-eq ha−1) [28,38]. The differences in the CF of the same cropping system were attributed to differences in regional agricultural inputs of crop productivity, except for direct GHG emissions from cropland. In addition, scholars may have different system boundaries and emission factors for agricultural inputs [23]. Furthermore, most CF studies [7,28,39] have been based on farm survey data, and there are significant differences in the source and quality of the data collected. For example, Yan et al. [7] revealed that the CF of both wheat and maize on large farms was 22–28% lower than that on small household farms in eastern China. However, in Punjab, India, no significant difference was found between the CFs of wheat and rice on different farm sizes [39]. In this study, the CF of rice–wheat rice was significantly greater than that of rice–rapeseed, rice–milk vetch, and rice–fallow rice and greater than the CF of rice–wheat evaluated by other studies [28,29]. This phenomenon might be caused primarily by the rate of straw incorporation. The present two-year experiment was conducted in Jiangsu Province, China. The annual rate of straw incorporation was 16 t ha−1 in rice–wheat, which was much greater than that in the same area (5 t ha−1) [29]. Straw incorporation is now a common agricultural practice in this area due to the Straw Burning Prohibition of 2015. In a previous paper, we reported that CH4 emissions were significantly positively correlated with the rate of straw incorporation [15]. In this study, CH4 emissions contributed to the largest share of the total CF (60.4–68.8%), followed by agricultural inputs and N2O emissions. Our results confirmed previous findings [11,23,28,29] that CH4 emissions are the most important contributor to the CF of rice-based cropping systems, especially under straw incorporation. Therefore, agricultural management that can mitigate CH4 emissions should be a priority for reducing the CF of paddy fields. Recently, Bastviken et al. [40] indicated that plants had a major indirect influence on global emissions of CH4; therefore, choosing suitable crop varieties may have enormous potential for reducing CH4 emissions [41]. Our findings also implied that the CF of rice-based cropping systems could be reduced by reducing the nitrogen fertilizer rate under straw incorporation and in the long term by reducing the CF of agricultural inputs and nitrous oxide emissions.
Relative to the rice–fallow in the present study, the rice–milk vetch, rice–rapeseed, and rice–wheat significantly increased annual grain yields by 13–64%, while rice–rapeseed and rice–wheat increased annual net returns by 146–150% (Table 1). These results implied that the low-carbon cropping systems are implemented at the cost of grain yield. However, grain security is very important and must be considered for a developing country with a large population. In the two years of the study, no significant difference in the CF per unit grain yield was observed between the four cropping systems. The CF per net return of rice–wheat and rice–rapeseed significantly decreased by 37–45% relative to that of rice–fallow but decreased by 42–50% relative to that of rice–milk vetch. It is apparent that different cropping systems can be implemented for different problems. The extension of rice–fallow and rice–milk vetch can alleviate environmental problems in eastern China, but these cropping systems require agricultural subsidies.

5. Conclusions

In this study, we provided a comprehensive evaluation of the potential effects of different rice-based cropping systems on both CF and system productivity in eastern China. In both years, multiple cropping systems (rice–wheat, rice–rapeseed, and rice–milk vetch) increased annual grain yields, CH4 and N2O emissions, and the CF. The net economic returns were significantly greater for rice–wheat and rice–rapeseed than for rice–fallow and rice–milk vetch. Methane emissions accounted for the largest share of the CF, followed by agricultural inputs and N2O emissions. No significant difference in the CF per unit grain yield was observed between the four cropping systems. Rice–wheat and rice–rapeseed significantly decreased the CF per net return relative to that of rice–fallow and rice–milk vetch. Our results revealed that the more crops are cultivated, the more agricultural inputs are needed, and the more direct and indirect GHG emissions there are. The low-carbon cropping systems, i.e., rice–fallow and rice–milk vetch, were implemented at the cost of grain yield. Obviously, different cropping systems can be implemented for environmental sustainability and grain security. Considering the CF, grain yield, and net economic return, rice–wheat and rice–rapeseed might be recommended for regional farmers in eastern China. Further studies should focus on developing effective strategies for methane and nitrogen fertilizer reduction to reduce the CF of rice production systems.

Author Contributions

Conceptualization, Y.Z.; formal analysis, Z.H. and L.C.; funding acquisition, X.W.; methodology, J.C.; supervision, J.S. and J.Z.; visualization, D.Y.; investigation, Z.H.; writing—original draft, Z.H., D.Y., H.L. and X.W.; writing—review and editing, Y.Z. and J.C. All authors have read and agreed to the published version of the manuscript.

Funding

This study was supported by the Suzhou Science and Technology Program (ST202228), Fengcheng Young Elite Scientists Sponsorship Program of Taizhou (2022), and the National Key Research and Development Program of China (2016YFD0300206).

Data Availability Statement

No new data were created or analyzed in this study. Data sharing is not applicable to this article.

Conflicts of Interest

The authors declare no conflicts of interest.

References

  1. Robertson, G.P.; Paul, E.A.; Harwood, R.R. Greenhouse gases in intensive agriculture: Contribution of individual gases to the radiative forcing of the atmosphere. Science 2000, 289, 1922–1925. [Google Scholar] [CrossRef]
  2. Smith, P.; Martino, D.; Cai, Z.; Gwary, D.; Janzen, H.; Kumar, P.; McCarl, B.; Ogle, S.; O’Mara, F.; Rice, C.; et al. Greenhouse gas mitigation in agriculture. Philos. Trans. R. Soc. B. 2008, 363, 789–813. [Google Scholar] [CrossRef]
  3. IPCC. Contribution of Working Group I to the Sixth Assessment Report of the Intergovernmental Panel on Climate Change 2021; Cambridge University Press: Cambridge, UK, 2021. [Google Scholar]
  4. Linquist, B.; Groenigen, K.J.; Adviento-Borbe, M.A.; Pittelkow, C.; Kessel, C. An agronomic assessment of greenhouse gas emissions from major cereal crops. Glob. Chang. Biol. 2012, 18, 194–209. [Google Scholar] [CrossRef]
  5. Zhang, Y.; Sheng, J.; Wang, Z.; Chen, L.; Zheng, J. Nitrous oxide and methane emissions from a Chinese wheat–rice cropping system under different tillage practices during the wheat-growing season. Soil Tillage Res. 2015, 146, 261–269. [Google Scholar] [CrossRef]
  6. Fang, K.; Heijungs, R.; de Snoo, G.R. Theoretical exploration for the combination of the ecological, energy, carbon, and water footprints: Overview of a footprint family. Ecol. Indic. 2014, 36, 508–518. [Google Scholar] [CrossRef]
  7. Yan, M.; Cheng, K.; Luo, T.; Yan, Y.; Pan, G.; Rees, R.M. Carbon footprint of grain crop production in China e based on farm survey data. J. Clean. Prod. 2015, 104, 130–138. [Google Scholar] [CrossRef]
  8. Le Mer, J.; Roger, P. Production, oxidation, emission and consumption of methane by soils: A review. Eur. J. Soil Biol. 2001, 37, 25–50. [Google Scholar] [CrossRef]
  9. Conrad, R. Soil microorganisms as controllers of atmospheric trace gases (H2, CO, CH4, OCS, N2O, and NO). Microbiol. Rev. 1996, 60, 609–640. [Google Scholar] [CrossRef] [PubMed]
  10. Zhang, G.; Ma, J.; Yang, Y.; Yu, H.; Song, K.; Dong, Y.; Lv, S.; Xu, H. Achieving low methane and nitrous oxide emissions with high economic incomes in a rice–based cropping system. Agric. For. Meteorol. 2018, 259, 95–106. [Google Scholar] [CrossRef]
  11. Ling, L.; Shuai, Y.; Xu, Y.; Zhang, Z.; Wang, B.; You, L.; Sun, Z.; Zhang, H.; Zhan, M.; Li, C.; et al. Comparing rice production systems in China: Economic output and carbon footprint. Sci. Total Environ. 2021, 791, 147890. [Google Scholar]
  12. Tang, H.; Huang, Y.; Yuan, J.; Hassan, M.U.; Liu, N.; Yang, B. Effects of typical cropping patterns of paddy–upland multiple cropping rotation on rice yield and greenhouse gas emissions. Agronomy 2023, 13, 2384. [Google Scholar] [CrossRef]
  13. Zou, J.; Huang, Y.; Jiang, J.; Zheng, X.; Sass, R.L. A 3-year field measurement of methane and nitrous oxide emissions from rice paddies in China: Effects of water regime, crop residue, and fertilizer application. Glob. Biogeochem. Cycles 2005, 19, 2004GB002401. [Google Scholar] [CrossRef]
  14. Bhattacharyya, P.; Roy, K.S.; Neogi, S.; Adhya, T.K.; Rao, K.S.; Manna, M.C. Effects of rice straw and nitrogen fertilization on greenhouse gas emissions and carbon storage in tropical flooded soil planted with rice. Soil Tillage Res. 2012, 124, 119–130. [Google Scholar] [CrossRef]
  15. Wang, H.; Shen, M.; Hui, D.; Chen, J.; Sun, G.; Wang, X.; Lu, C.; Sheng, J.; Chen, L.; Luo, Y.; et al. Straw incorporation influences soil organic carbon sequestration, greenhouse gas emission, and crop yields in a Chinese rice (Oryza sativa L.)–wheat (Triticum aestivum L.) cropping system. Soil Tillage Res. 2019, 195, 104377. [Google Scholar] [CrossRef]
  16. Pandey, D.; Agrawal, M.; Bohra, J.S. Greenhouse gas emissions from rice crop with different tillage permutations in rice–wheat system. Agric. Ecosyst. Environ. 2012, 159, 133–144. [Google Scholar] [CrossRef]
  17. Cai, Z.; Xing, G.; Yan, X.; Xu, H.; Tsuruta, H.; Yagi, K.; Minami, K. Methane and nitrous oxide emissions from rice paddy fields as affected by nitrogen fertilisers and water management. Plant Soil 1997, 196, 7–14. [Google Scholar] [CrossRef]
  18. Shang, Q.; Yang, X.; Gao, C.; Wu, P.; Liu, J.; Xu, Y.; Shen, Q.; Zou, J.; Guo, S. Net annual global warming potential and greenhouse gas intensity in Chinese double rice-cropping systems: A 3-year field measurement in long-term fertilizer experiments. Glob. Chang. Biol. 2011, 17, 2196–2210. [Google Scholar] [CrossRef]
  19. Jiang, C.S.; Wang, Y.S.; Zheng, X.H.; Zhu, B.; Huang, Y. Effects of tillage-cropping systems on methane and nitrous oxide emissions from permanently flooded rice fields in a central Sichuan hilly area of Southwest China. Environ. Sci. 2006, 27, 207–213. [Google Scholar]
  20. Zhou, W.; Zhang, Y.F.; Zhu, P.P.; Sheng, J.; Cheng, L.G.; Zheng, J.C. Effects of different cropping patterns on greenhouse gases emissions from rice fields in the lower reaches of Yangtze River. Jiangsu J. Agric. Sci. 2017, 33, 340–345. [Google Scholar]
  21. Gan, Y.; Liang, C.; Chai, Q.; Lemke, R.L.; Campbell, C.A.; Zentner, R.P. Improving farming practices reduces the carbon footprint of spring wheat production. Nat. Commun. 2014, 5, 5012. [Google Scholar] [CrossRef]
  22. Xu, C.; Chen, Z.; Ji, L.; Lu, J. Carbon and nitrogen footprints of major cereal crop production in China: A study based on farm management surveys. Rice Sci. 2022, 29, 288–298. [Google Scholar] [CrossRef]
  23. Xue, J.F.; Pu, C.; Liu, S.L.; Zhao, X.; Zhang, R.; Chen, F.; Xiao, X.P.; Zhang, H.L. Carbon and nitrogen footprint of double rice production in Southern China. Ecol. Indic. 2016, 64, 249–257. [Google Scholar] [CrossRef]
  24. Huang, W.; Wu, F.; Han, W.; Li, Q.; Han, Y.; Wang, G.; Feng, L.; Li, X.; Yang, B.; Lei, Y.; et al. Carbon footprint of cotton production in China: Composition, spatiotemporal changes and driving factors. Sci. Total Environ. 2022, 821, 153407. [Google Scholar] [CrossRef]
  25. Chen, Z.D.; Xu, C.C.; Ji, L.; Fang, F.P. Spatial and temporal changes in carbon footprint for oilseed rape production in the middle and lower reaches of Yangtze River during. Chin. J. Eco-Agric. 2019, 27, 1105–1114. [Google Scholar]
  26. Yang, X.; Gao, W.; Zhang, M.; Chen, Y.; Sui, P. Reducing agricultural carbon footprint through diversified crop rotation systems in the North China Plain. J. Clean. Prod. 2014, 76, 131–139. [Google Scholar] [CrossRef]
  27. Pang, R.Y.; Wang, M.H.; Kong, J.; Li, N.; Wang, M.L.; Zou, X.X. Carbon and nitrogen footprint of different peanut rotation systems in Hubei Province, China. Chin. J. Appl. Ecol. 2021, 32, 3997–4003. [Google Scholar]
  28. Chen, Z.; Xu, C.; Ji, L.; Feng, J.; Li, F.; Zhou, X.; Fang, F. Effects of multi-cropping system on temporal and spatial distribution of carbon and nitrogen footprint of major crops in China. Glob. Ecol. Conserv. 2020, 22, e00895. [Google Scholar] [CrossRef]
  29. Hu, N.J.; Shi, H.; Zhu, L.Q. Effects of different straw returning modes on carbon footprint in a rice–wheat rotation system. Resour. Environ. Yangtze Basin 2018, 27, 2775–2783. [Google Scholar]
  30. Li, Z.; Sui, P.; Yang, X.; Dai, H.; Wang, X.; Long, P.; Yan, L.; Chen, Y. Balancing GHG mitigation and food security through agricultural recycling systems: Case studies in the North China Plain. J. Clean. Prod. 2017, 157, 222–231. [Google Scholar] [CrossRef]
  31. Zhang, Y.; Liu, H.; Guo, Z.; Zhang, C.; Sheng, J.; Chen, L.; Luo, Y.; Zheng, J. Direct-seeded rice increases nitrogen runoff losses in southeastern China. Agric. Ecosyst. Environ. 2018, 251, 149–157. [Google Scholar] [CrossRef]
  32. Danso, F.; Bankole, O.O.; Zhang, N.; Dong, W.; Zhang, K.; Lu, C.; Shang, Z.; Li, G.; Deng, A.; Song, Z.; et al. Plough tillage maintains high rice yield and lowers greenhouse gas emissions under straw incorporation in three rice–based cropping systems. Agronomy 2023, 13, 880. [Google Scholar] [CrossRef]
  33. Xia, L.; Wang, S.; Yan, X. Effects of long-term straw incorporation on the net global warming potential and the net economic benefit in a rice–wheat cropping system in China. Agric. Ecosyst. Environ. 2014, 197, 118–127. [Google Scholar] [CrossRef]
  34. Hoben, J.P.; Gehl, R.J.; Millar, N.; Grace, P.R.; Robertson, G.P. Nonlinear nitrous oxide (N2O) response to nitrogen fertilizer in on-farm corn crops of the US Midwest. Glob. Chang. Biol. 2011, 17, 1140–1152. [Google Scholar] [CrossRef]
  35. Wu, J.; Guo, X.; Wang, Y.; Xu, Z.; Lu, J. Decomposition characteristics of rapeseed and wheat straws under different Rice cultivations and straw mulching models. Sci. Agric. Sin. 2011, 44, 3351–3360. [Google Scholar]
  36. Singh, Y.; Sidhu, H.S. Management of cereal crop residues for sustainable rice-wheat production system in the indo-gangetic plains of India. Proc. Indian Nat. Sci. Acad. 2014, 80, 95–114. [Google Scholar] [CrossRef]
  37. Cai, Z.C.; Xu, H.; Ma, J. Methane and Nitrous Oxide Emissions from Rice–Based Ecosystems; China Science and Technology University Press: Anhui, China, 2009. [Google Scholar]
  38. Zhao, Y.; Wang, L.; Lei, X.; Wang, B.; Cui, J.; Xu, Y.; Chen, Y.; Sui, P. Reducing carbon footprint without compromising grain security through relaxing cropping rotation system in the North China Plain. J. Clean. Prod. 2021, 318, 128465. [Google Scholar] [CrossRef]
  39. Kashyap, D.; Agarwal, T. Carbon footprint and water footprint of rice and wheat production in Punjab, India. Agric. Syst. 2021, 186, 102959. [Google Scholar] [CrossRef]
  40. Bastviken, D.; Treat, C.C.; Pangala, S.R.; Gauci, V.; Enrich-Prast, A.; Karlson, M.; Gålfalk, M.; Romano, M.B.; Sawakuchi, H.O. The importance of plants for methane emission at the ecosystem scale. Aquat. Bot. 2023, 184, 103596. [Google Scholar] [CrossRef]
  41. Qian, H.; Zhu, X.; Huang, S.; Linquist, B.; Kuzyakov, Y.; Wassmann, R.; Minamikawa, K.; Martinez-Eixarch, M.; Yan, X.; Zhou, F.; et al. Greenhouse gas emissions and mitigation in rice agriculture. Nat. Rev. Earth Environ. 2023, 4, 716–732. [Google Scholar] [CrossRef]
Figure 1. Daily precipitation and mean air temperature during the experiment from 2019 to 2021.
Agronomy 14 00395 g001
Figure 2. CH4 (A,B) and N2O (C,D) emissions in different rice-based cropping systems. Significant differences among the cropping systems are indicated by lowercase letters at p < 0.05 (LSD). Error bars represent standard deviation (n = 3).
Agronomy 14 00395 g002
Figure 3. Composition of the carbon footprint (CF) in different rice-based cropping systems in 2019–2020 (A) and 2020–2021 (B).
Agronomy 14 00395 g003
Table 1. Inventory list of agricultural inputs for crop production.
ItemsRiceMilk VetchWheatRapeseedUnitsGHG Emission Factors
ValueUnits
Rice seed60606060kg ha−11.84kg CO2-eq kg−1
Milk vetch seed 60 kg ha−10.83kg CO2-eq kg−1
Wheat seed 150 kg ha−10.58kg CO2-eq kg−1
Rapeseed seed 7.5kg ha−10.83kg CO2-eq kg−1
Nitrogen fertilizer (N)27022.5240210kg ha−17.76kg CO2-eq kg−1
Phosphorus fertilizer (P2O5)7522.59090kg ha−12.33kg CO2-eq kg−1
Potassium fertilizer (K2O)7522.59090kg ha−10.66kg CO2-eq kg−1
Fungicides2.7 2.31.2kg ha−110.57kg CO2-eq·kg−1
Pesticides3.2 2.41.6kg ha−116.61kg CO2-eq·kg−1
Herbicides0.8 0.60.5kg ha−110.15kg CO2-eq kg−1
Diesel97.531.56324kg ha−12.98kg CO2-eq kg−1
Electricity305.7 36KWh ha−10.59kg CO2-eq KWh−1
Film42.7 kg ha−12.77kg CO2-eq kg−1
Labor38.3923.347.3d p ha−10.86kg CO2-eq d−1 p−1
Note: d p ha−1, 8 h of working days per person per day were used.
Table 2. Grain yield and net return in different rice-based cropping systems.
Cropping SystemGrain Yield (t ha−1 yr−1)Net Return (CNY ha−1 yr−1)
2019–20202020–20212019–20202020–2021
Rice–fallow10.3 ± 0.44 d9.5 ± 0.50 d6481 ± 190 b4457 ± 214 b
Rice–milk vetch11.3 ± 0.50 c11.0 ± 0.60 c6151 ± 215 b5531 ± 258 b
Rice–wheat16.7 ± 0.91 a15.9 ± 0.85 a14,707 ± 430 a12,662 ± 362 a
Rice–rapeseed13.5 ± 0.62 b13.1 ± 0.41 b14,114 ± 351 a12,843 ± 138 a
Note: Mean ± SD (n = 3); different letters within the same column indicate significant differences among the cropping systems (p < 0.05).
Table 3. Indirect GHG emissions and percentage contribution by individual emission components in different rice-based cropping systems from 2019 to 2021.
ItemsRice–FallowRice–Milk VetchRice–WheatRice–Rapeseed
Total Emissions (kg CO2-eq ha−1)3422.53815.86213.65468.3
seed110.4 (3.2%)160.2 (4.2%)240.9 (3.9%)116.2 (2.1%)
Nitrogen fertilizer (N)2327.7 (68.0%)2502.3 (65.6%)4422.6 (71.2%)3957.1 (72.4%)
Phosphorus fertilizer (P2O5)174.9 (5.1%)227.4 (6.0%)384.8 (6.2%)349.8 (6.4%)
Potassium fertilizer (K2O)99.0 (2.9%)113.9 (3.0%)178.2 (2.9%)158.4 (2.9%)
Fungicides28.9 (0.8%)28.9 (0.8%)67.9 (1.1%)54.6 (1.0%)
Pesticides52.3 (1.5%)52.3 (1.4%)76.1 (1.2%)64.5 (1.2%)
Herbicides7.6 (0.2%)7.6 (0.2%)13.7 (0.2%)12.7 (0.2%)
Diesel290.3 (8.5%)384.1 (10.1%)477.9 (7.7%)361.8 (6.6%)
Electricity180.2 (5.3%)180.2 (4.7%)180.2 (2.9%)201.5 (3.7%)
Film118.3 (3.5%)118.3 (3.1%)118.3 (1.9%)118.3 (2.2%)
Labor32.9 (1.0%)40.6 (1.1%)52.9 (0.9%)73.5 (1.3%)
Note: The value for a given cropping system was the average of that system from 2019 to 2021; values in parentheses indicate the percentage contribution to the total GHG emissions for each cropping system.
Table 4. Carbon footprint in different rice-based cropping systems.
YearCropping SystemCarbon Footprint (t CO2-eq ha−1)CFy
(t CO2-eq t−1)
CFe
(kg CO2-eq CNY−1)
Rice SeasonNon-Rice SeasonAnnual
2019–2020Rice–fallow11.5 ± 0.82 c0.1 ± 0.01 d11.6 ± 0.82 d1.14 ± 0.13 a1.85 ± 0.46 b
Rice–milk vetch13.4 ± 0.83 b0.6 ± 0.02 c14.0 ± 0.81 c1.25 ± 0.02 a2.34 ± 0.40 a
Rice–wheat16.6 ± 1.47 a3.2 ± 0.04 a19.7 ± 1.50 a1.19 ± 0.14 a1.38 ± 0.31 c
Rice–rapeseed14.5 ± 1.13 b2.5 ± 0.08 b17.0 ± 1.12 b1.26 ± 0.11 a1.23 ± 0.24 c
2020–2021Rice–fallow11.2 ± 0.66 c0.2 ± 0.03 d11.3 ± 0.68 d1.19 ± 0.08 a2.72 ± 0.86 a
Rice–milk vetch13.1 ± 0.86 b0.6 ± 0.04 c13.7 ± 0.83 c1.24 ± 0.07 a2.66 ± 0.91 a
Rice–wheat15.3 ± 1.21 a3.4 ± 0.07 a18.6 ± 1.19 a1.17 ± 0.04 a1.50 ± 0.23 b
Rice–rapeseed13.6 ± 1.02 b2.6 ± 0.06 b16.2 ± 0.97 b1.24 ± 0.04 a1.27 ± 0.09 b
Note: Mean ± SD (n = 3); CFy is the CF per unit grain yield, CFe is the CF per net return; different letters within the same column indicate significant differences among the cropping systems (p < 0.05).
Disclaimer/Publisher’s Note: The statements, opinions and data contained in all publications are solely those of the individual author(s) and contributor(s) and not of MDPI and/or the editor(s). MDPI and/or the editor(s) disclaim responsibility for any injury to people or property resulting from any ideas, methods, instructions or products referred to in the content.

