Article

Key Stage and Its Optimum Meteorological Conditions Affecting the Nutritional Quality of Maize

1
Collaborative Innovation Center on Forecast and Evaluation of Meteorological Disasters (CIC-FEMD), Nanjing University of Information Science & Technology, Nanjing 210044, China
2
State Key Laboratory of Severe Weather, Chinese Academy of Meteorological Sciences, Beijing 100081, China
3
CMA-CAU Jointly Laboratory of Agriculture Addressing Climate Change, Beijing 100081, China
4
Hebei Gucheng Agricultural Meteorology National Observation and Research Station, Baoding 072656, China
*
Author to whom correspondence should be addressed.
Agronomy 2024, 14(3), 420; https://doi.org/10.3390/agronomy14030420
Submission received: 22 January 2024 / Revised: 12 February 2024 / Accepted: 13 February 2024 / Published: 22 February 2024
(This article belongs to the Section Soil and Plant Nutrition)

Abstract

:
The impact of changing meteorological conditions on crop quality has become a trending topic in current agriculture research. In this study, we analyzed the combined effects of both meteorological conditions and key stages on the nutritional quality of maize based on the data of field-staged sowing trials from 2018 to 2022. The results are as follows: (1) The key stage of meteorological conditions affecting the content of major nutritional qualities of maize is from 6 d before to 35 d after flowering. (2) The maximum temperature from 6 d before to 8 d after flowering, average temperature from 5 d before to 20 d after flowering, and minimum temperature from 9–20 d after flowering have significant positive effects on protein, fat, and essential amino acids, respectively; the daily difference in temperature from 9 to 35 d and 24 to 35 d after flowering have a significant negative effect on crude fiber and essential amino acids, respectively, and the daily difference in temperature from 24 to 35 d and the minimum temperature from 5 d before to 35 d after flowering have a significant effect on non-essential amino acids. (3) When the maximum temperature during the key stage of nutritional quality is 31.2 °C, the average temperatures are 24.9 °C and 22.4 °C, the minimum temperature is 18.9 °C, and the daily difference in temperature is 15.0 °C, the contents could reach the optimal values of 9.66% (protein), 4.80% (fat), 4.97% (crude fiber), 40.39 g·kg−1 (essential amino acids), and 58.96 g·kg−1 (non-essential amino acids), respectively. The findings provide a basis for adjusting the sowing period to improve the nutritional quality of maize in the context of climate change.

1. Introduction

Maize (Zea mays L.) is an important grain crop in China, with a total production level among the highest in the world [1]. The total production has reached 2.89 × 10¹¹ kg. As the population increases, so does corn consumption; thus, the nutritional quality of maize is receiving increasing attention. The protein, starch, fat, and crude fiber contents of maize kernels are vital indicators of the nutritional quality of maize and an important basis for measuring maize cultivation technology [2]. Changes in meteorological conditions, such as temperature, precipitation, and radiation, are expected to affect crop production in the future due to climate change and the increasing frequency of extreme weather events [3,4,5,6].
Environmental factors, as critical external conditions, directly affect the formation of crop kernel quality [7,8,9]. Meteorological conditions during the growth period may affect kernel quality significantly more than the variety [10], which is the main determinant of maize quality. As a typical C4 crop, insufficient light during the reproductive period seriously affects maize quality [11]. Increasing the average daily sunshine hours after flowering can enhance the protein content of kernels. Insufficient light reduces the number and volume of endosperm cells, significantly reduces the starch content, and increases the protein and fat content in kernels [12]. Temperature is fundamental to the development and growth of maize; it affects nutrient transport and distribution, affecting kernel nutritional quality characteristics. High-temperature stress during the maize growth period inhibits starch accumulation by decreasing starch synthase activity [13], and increases crude protein content by increasing glutamate synthase activity. Yang et al. [14] found that increased temperatures in the pre- and mid-filling period can elevate the starch accumulation rate, which increases the starch content of the kernel. Appropriately low temperatures favor corn crude fat content [15]. Although studies have shown that maize nutritional quality is significantly affected by meteorological conditions, the mechanism of nutritional quality response to these conditions remains unclear, and there is a lack of research on the integrated effects of meteorological conditions, which prevents an accurate assessment of climate change and extreme events affecting crop seed quality.
The North China Plain is a vital maize production base in China, possessing approximately 12–15% of China’s total grain crop-planting area, and 6.9% of China’s total maize production [16]. Since 1960, the North China Plain has been characterized by significant climate change [17], making it a “natural laboratory” for studying the change in maize nutritional quality according to meteorological conditions. Based on the data of field-staged sowing trials at the Hebei Gucheng Agro-meteorological Field Scientific Research Station from 2018 to 2022, this study aims to (1) identify the key stages affecting the major nutritional qualities of maize; (2) elucidate the combined effects of the meteorological conditions during the key stages on major nutritional qualities; and (3) explore the optimal meteorological conditions for the major nutritional qualities of maize and meteorological control countermeasures, to provide a basis for the enhancement of maize nutritional qualities.

2. Materials and Methods

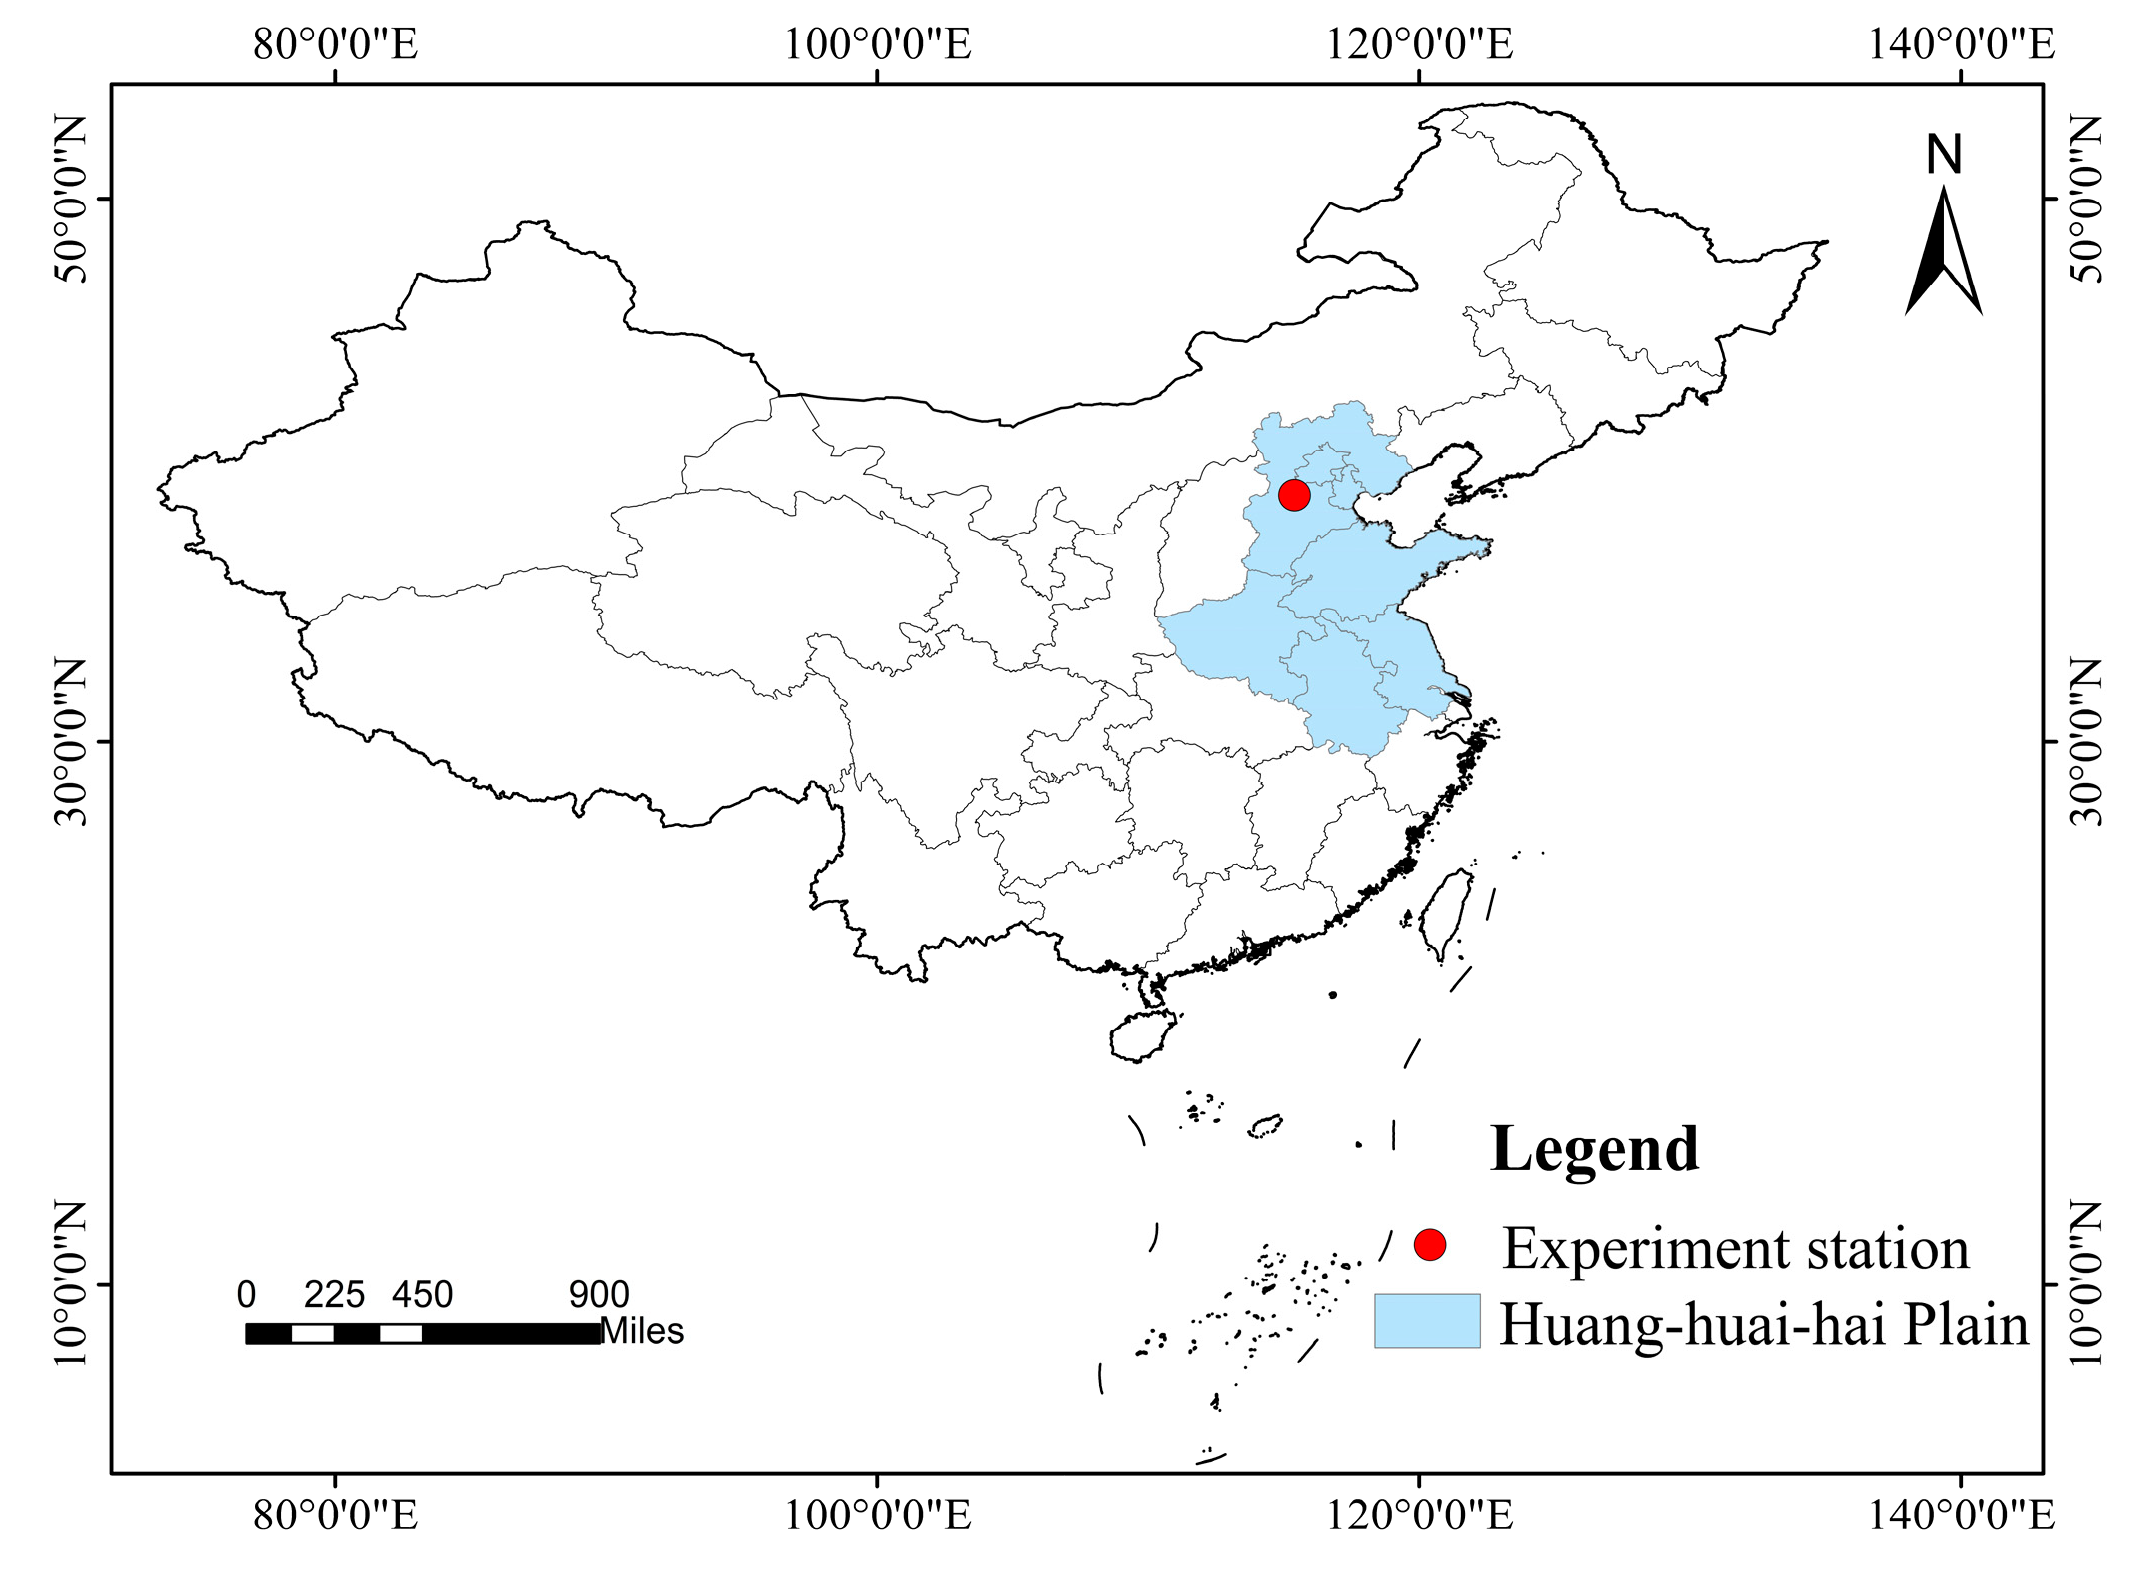
2.1. The Trial Design and Protocol

The trial was conducted during 2018–2022 at the Hebei Gucheng Agro-meteorological Field Scientific Research Station (Gucheng) (39°8′ N, 115°40′ E, 15.2 m asl.), in Dingxing County, Hebei Province (Figure 1). It is located in the north of the North China Plain, with a typical warm continental monsoon climate, rain, and heat over the same period, with a mean annual temperature of 12.2 °C, mean annual maximum temperature of 19.0 °C, mean annual minimum temperature of 6.45 °C and mean annual precipitation of 501.9 mm. The soil type is primarily sandy loam with pH 8.19, a soil bulk density (BD) of 1.37 g·cm−3, and major nutrients of N, P, and K with contents of 0.98 g·kg−1, 1.02 g·kg−1 and 17.26 g·kg−1, respectively [18]. In this region, the main cropping pattern system comprised winter wheat and summer maize rotation.
The variety of maize, “Lianyu 1”, used in our field study was the main cultivar in the region, which can grow on substrates in moderately fertile loams, with a suitable density between 60,000 and 63,000 plant·ha−1. We designed four sowing dates, 10 d in advance (S1), 0 d in regular (S2), 10 d in delay (S3), and 20 d in delay (S4), to represent different growing environments, for which the specific dates were 8 June, 18 June, 28 June, and 8 July, respectively. The area of each plot of 30 m2 was sown via artificial seeding at a 30 cm depth, the row spacing was 50 cm, the plant spacing was about 33.3 cm, and the sowing density was 6.0 plant m−2. The total N fertilizer application rate in each plot was 2.5 kg (N, P2O5 and K2O: 26%, 14% and 5%). To ensure the emergence of seedlings, flood irrigation for 3 h immediately after sowing was performed. Spraying irrigation was carried out in a timely manner according to meteorological conditions to ensure that maize was not subjected to water stress during growth. Other agricultural management measures followed the local field measures, and we sprayed pesticides during the growth process to prevent and control pests and diseases. No effects of pests or diseases were found in our trial.

2.2. Data Sources

Meteorological data were monitored at a weather station located nearly 20 m from the experimental field, including daily average temperature, daily minimum temperature, daily maximum temperature, sunshine duration, precipitation, etc. We also determined solar radiation according to data on sunshine duration measured by Angstrom’s empirical equation [19].
The growth periods were found to be in line with the Agricultural Meteorological Observation Standard [20], mainly including the sowing stage, jointing stage, heading stage, flowering stage, maturity stage, and so on.
The grains dried naturally after maturity, with a moisture content of about 13%, and quality tests and analyses were carried out. There were 20 groups of samples taken from 2018 to 2022. The nitrogen content of grain was measured via the semi-micro Kjeldahl method, in which the protein content of a sample was calculated according to the conversion coefficient of 6.25 (total nitrogen content × 6.25). The Soxhlet extraction residue method was used to measure the fat content. The anthrone colorimetry method was used to measure the starch content. The crude fiber content was evaluated according to the filtration method. We also measured the contents of amino acid using high-performance liquid chromatography (HPLC), including aspartate (Asp), glutamic acid (Glu), cystine (Cys-Cys), serine (Ser), glycine (Gly), alanine (Ala), proline (Pro), tyrosine (Tyr), histidine (His), arginine (Arg), threonine (Thr), valine (Val), methionin (Met), isoleucine (Ile), leucine (Leu), phenylalanine (Phe) and lysine (Lys).

2.3. Data Analysis

2.3.1. Standardized Data

Due to the possible differences in test conditions between years, the nutritional quality of maize was standardized and calculated as follows,
R X i = X i X 0
where RXi is the relative value expressing the change in nutrient quality content at a certain sowing date relative to the regular sowing date (S2). Xi is the original value of maize nutritional quality at each sowing date, and X0 is the original value of the maize nutritional quality of S2.

2.3.2. Partial Least-Squares Method

The partial least-squares (PLS) method is a multivariate statistical method that is suitable for use in problems where there are multiple variables in the model and multicollinearity between variables, which has been widely used in agricultural research [21]. In this study, the flowering date was denoted as zero point (0 d), the days 1 d or 2 d before flowering were denoted as −1 d and −2 d, respectively, and the days after flowering were denoted as 1 d and 2 d respectively. We calculated the Variable Important for Projection (VIP) of partial least-squares (PLS); VIP can describe the explanatory power of the independent variable in relation to the dependent variable. When VIP > 0.8, the independent variable has strong explanatory power for the dependent variable, and when VIP < 0.5, the explanation of the dependent variable by the independent variable is almost meaningless. The meteorological factors and key growth periods that had significant effects on the main nutritional quality contents of maize were determined.
V I P j = p h = 1 m k R 2 ( y k , t h ) w h j 2 h = 1 m k R 2 ( y k , t h )
where p is the number of independent variables and m is the number of extracted components; k is the number of dependent variables. th is the hth component of the independent variable, R2(yk, th) is the square of the correlation coefficient between yk and th, and whj2 is the contribution of the independent variable xj to the th component.

2.3.3. Coefficient of Variation

The coefficient of variation (CV) is the ratio of the standard deviation to the mean, which indicates the degree of dispersion of the different observed series. The magnitude of the coefficient of variation determines the stability of the elements, and a larger coefficient of variation indicates that the element is unstable and unevenly distributed.
C V = 1 n i = 1 n ( x i x ¯ ) 2 x ¯
where CV is the coefficient of variation, which indicates the variation in the main quality factors between years. n is the sample size of the quality factor, is the average value of a quality factor over many years, and xi is the actual value of a quality factor in year i.

2.3.4. Evaluation Indexes

Root mean square error (RMSE) and normalized root mean square error (nRMSE) can be used to reflect the magnitude of the simulation error. In this study, the data from 2018 to 2021 were used as modeling data, and the experiment data of 2022 were used to test and confirm the accuracy of the integrated model.
RMSE = 1 n i = 1 n ( Y i X i ) 2
nRMSE = 100 1 n i = 1 n ( Y i X i ) 2 1 n X i
where n is the number of samples, and Yi and Xi are the simulated and measured values, respectively.

2.3.5. Data Statistics and Analysis

This study used Matlab 2021b, R language, SPSS 16.0 data processing and data analysis, and Lingo 18.0 software to optimize the conditions of maize quality.

3. Results and Analysis

3.1. Nutritional Quality of Maize in Different Years and Sowing Dates

The adjustment of the sowing date had significant effects on the protein, fat, and crude fiber contents of maize kernels (Table 1). The contents of protein and fat in maize at S1 were significantly higher than at other sowing dates, and decreased with a delay of the sowing date. The changes in crude fiber content with the delay of the sowing date were not obvious, and the content of starch was not affected by the sowing date. Significant interannual variations could be seen in the main nutritional quality contents (p < 0.01); the protein contents in different years could be ranked 2018 > 2019 > 2020 > 2021 > 2022, the fat content was 2020 > 2018 > 2021 > 2022 > 2019, and the contents of crude fiber were 2018 > 2021 > 2022 > 2020 > 2019. But the contents of starch were significantly different only among years (p < 0.05), ranking 2018 > 2021 > 2019 > 2020 > 2022. In addition, the interaction between years and sowing dates showed that there were significant differences in nutrient quality (p < 0.01). The CV of each nutrient quality was significantly different, and could be ranked as starch (1.36%) < fat (7.4%) < protein (9.91%) < crude fiber (15.10%), indicating that environmental change could not easily increase starch content and had limited potential, while crude fiber content showed a wide variation range and had a greater scope to increase than other nutritional qualities. The changes in the amino acid contents of maize were different under the influence of sowing date; except for glycine, all amino acids were significantly affected by sowing date (p < 0.05) (Figure 2). The aspartic content of non-essential amino acids was the highest, with an average of 12.85 g·kg−1; the glutamic content was the second, with an average of 9.57 g·kg−1, and all contents showed a decreasing trend with the delay of sowing date (Figure 2a). The leucine content of essential amino acid was the highest, with an average of 5.97 g·kg−1, which decreased first and then increased with the delay of the sowing date, while the content of methionine was the lowest with an average of 0.98 g·kg−1, which increased first and then decreased with the delay of sowing date (Figure 2b). Overall, the essential amino acid content decreased as the sowing date was delayed. However, the content of essential amino acids decreased with the advance or delay of sowing dates and was the highest at S2. The results show that the early sowing date had the potential to improve the nutritional quality of maize, while the late sowing was not conducive to the formation of the nutritional quality of maize.

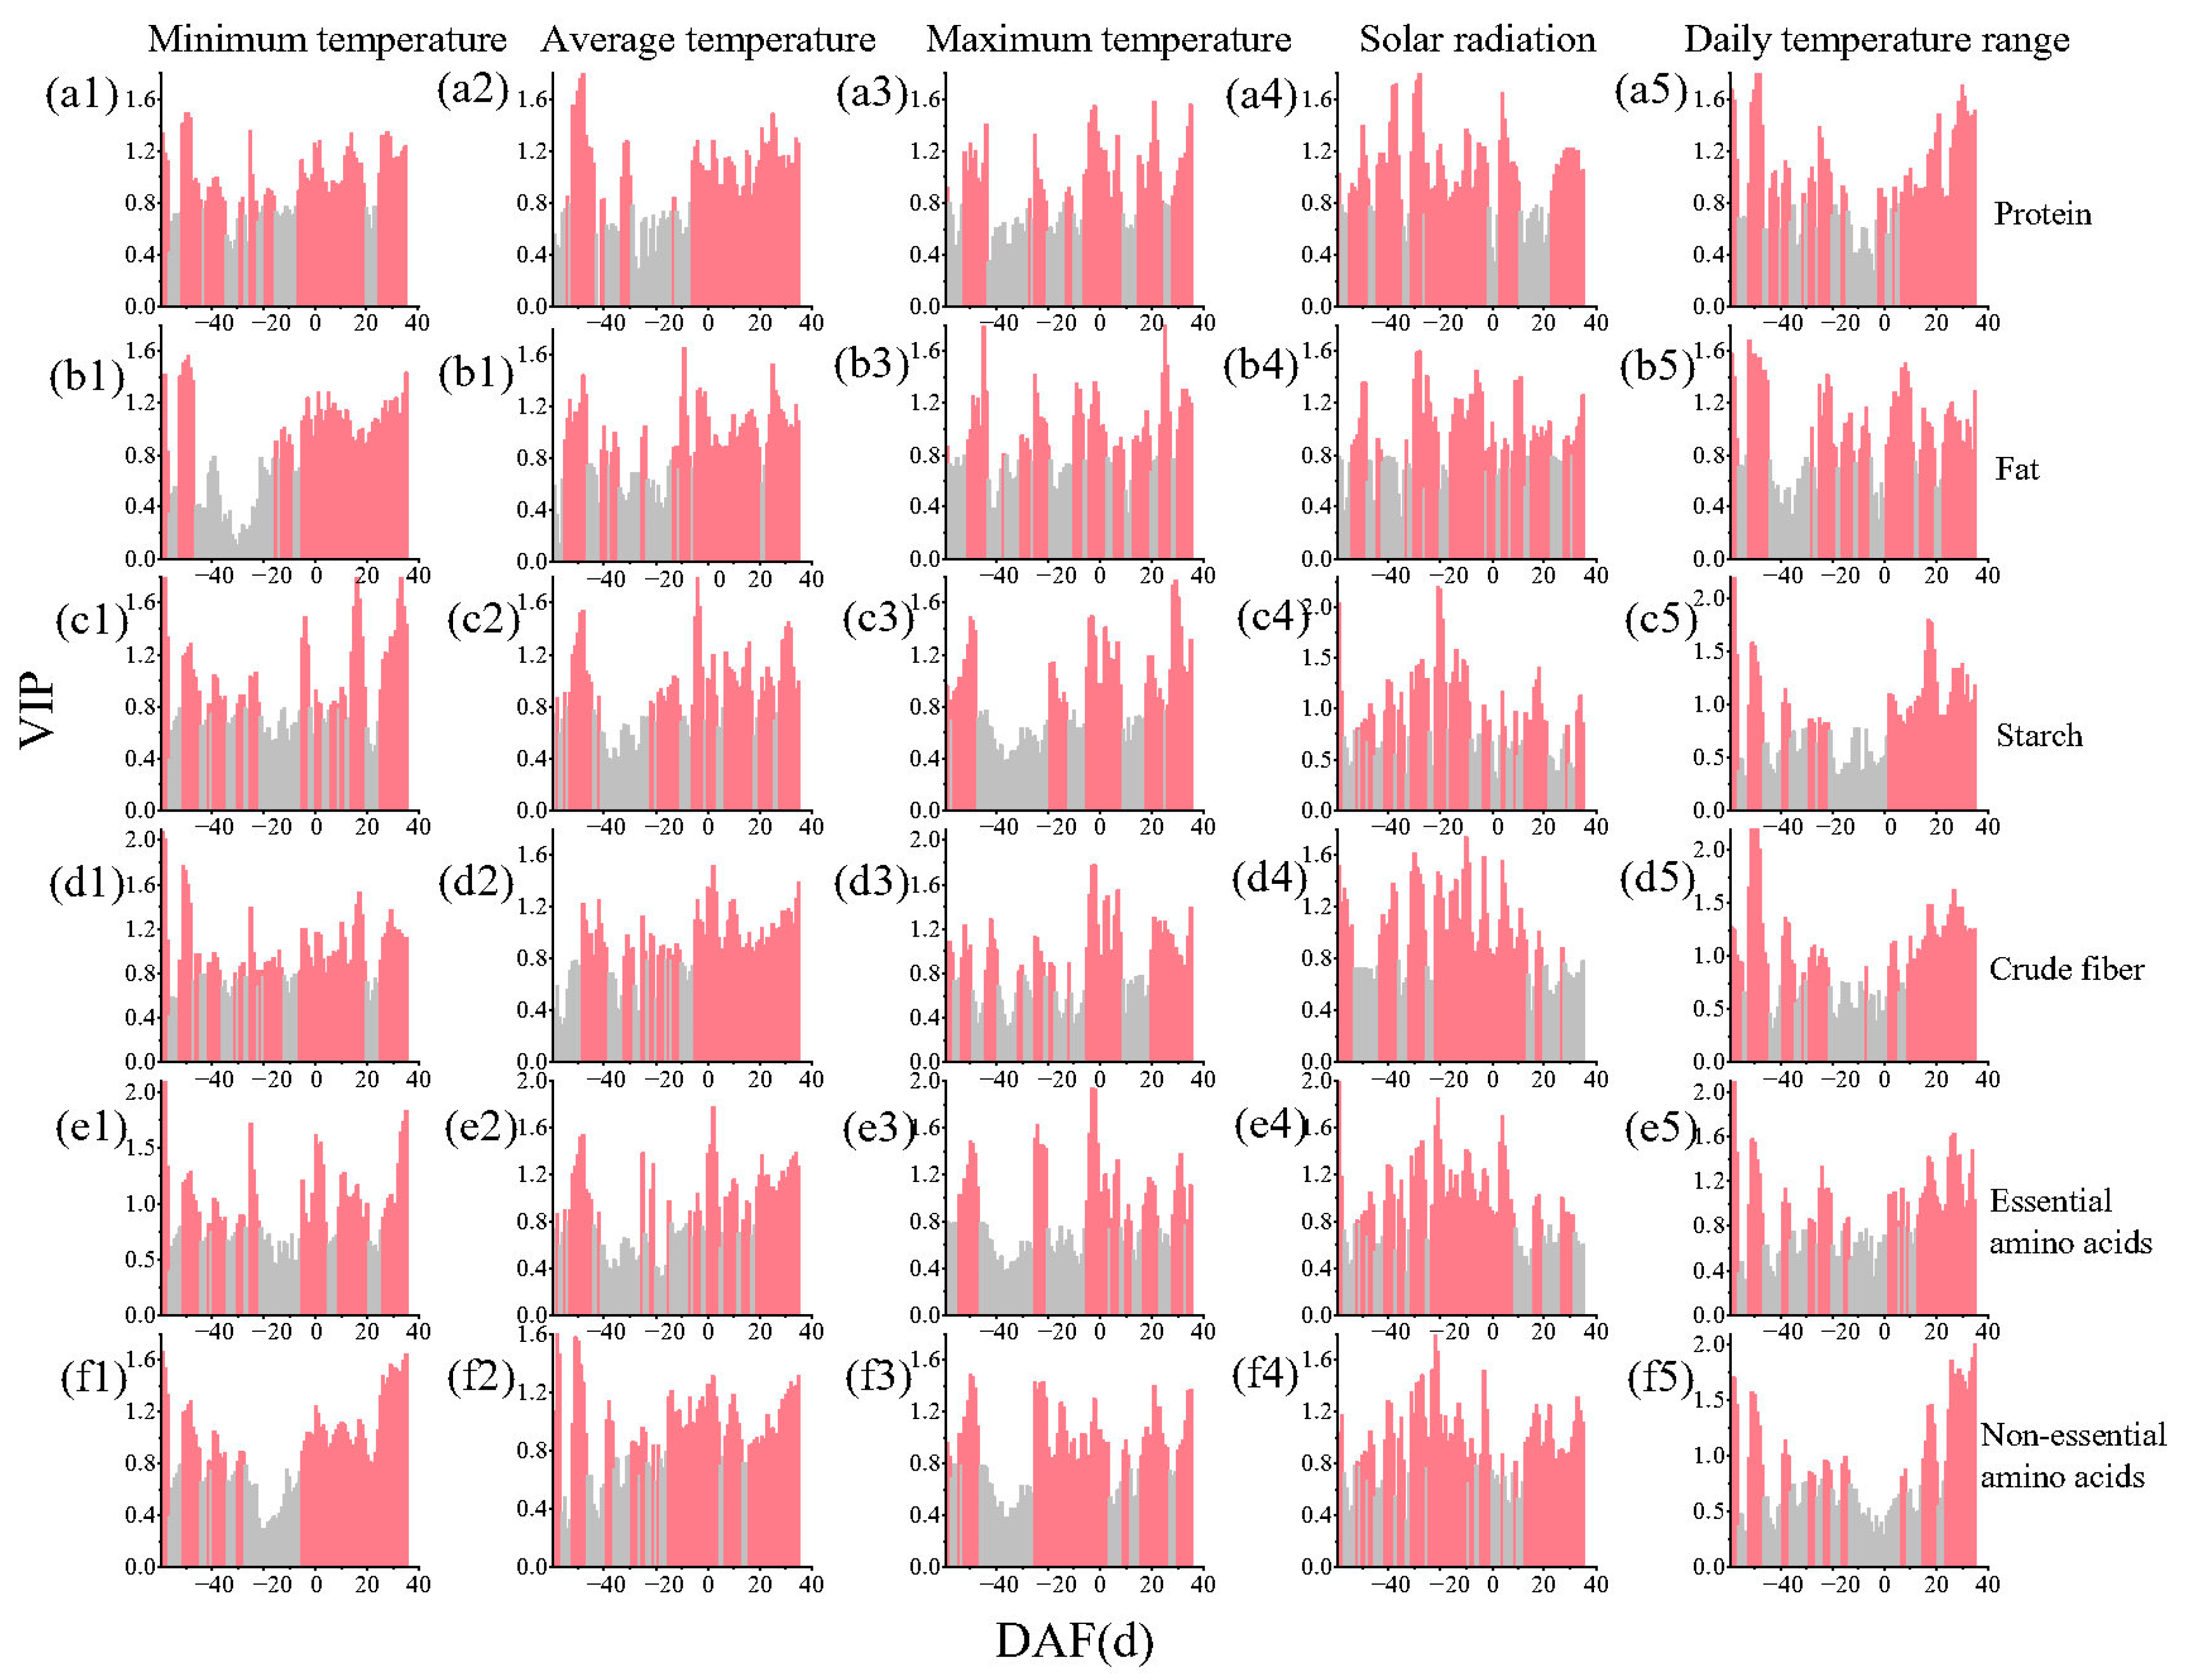
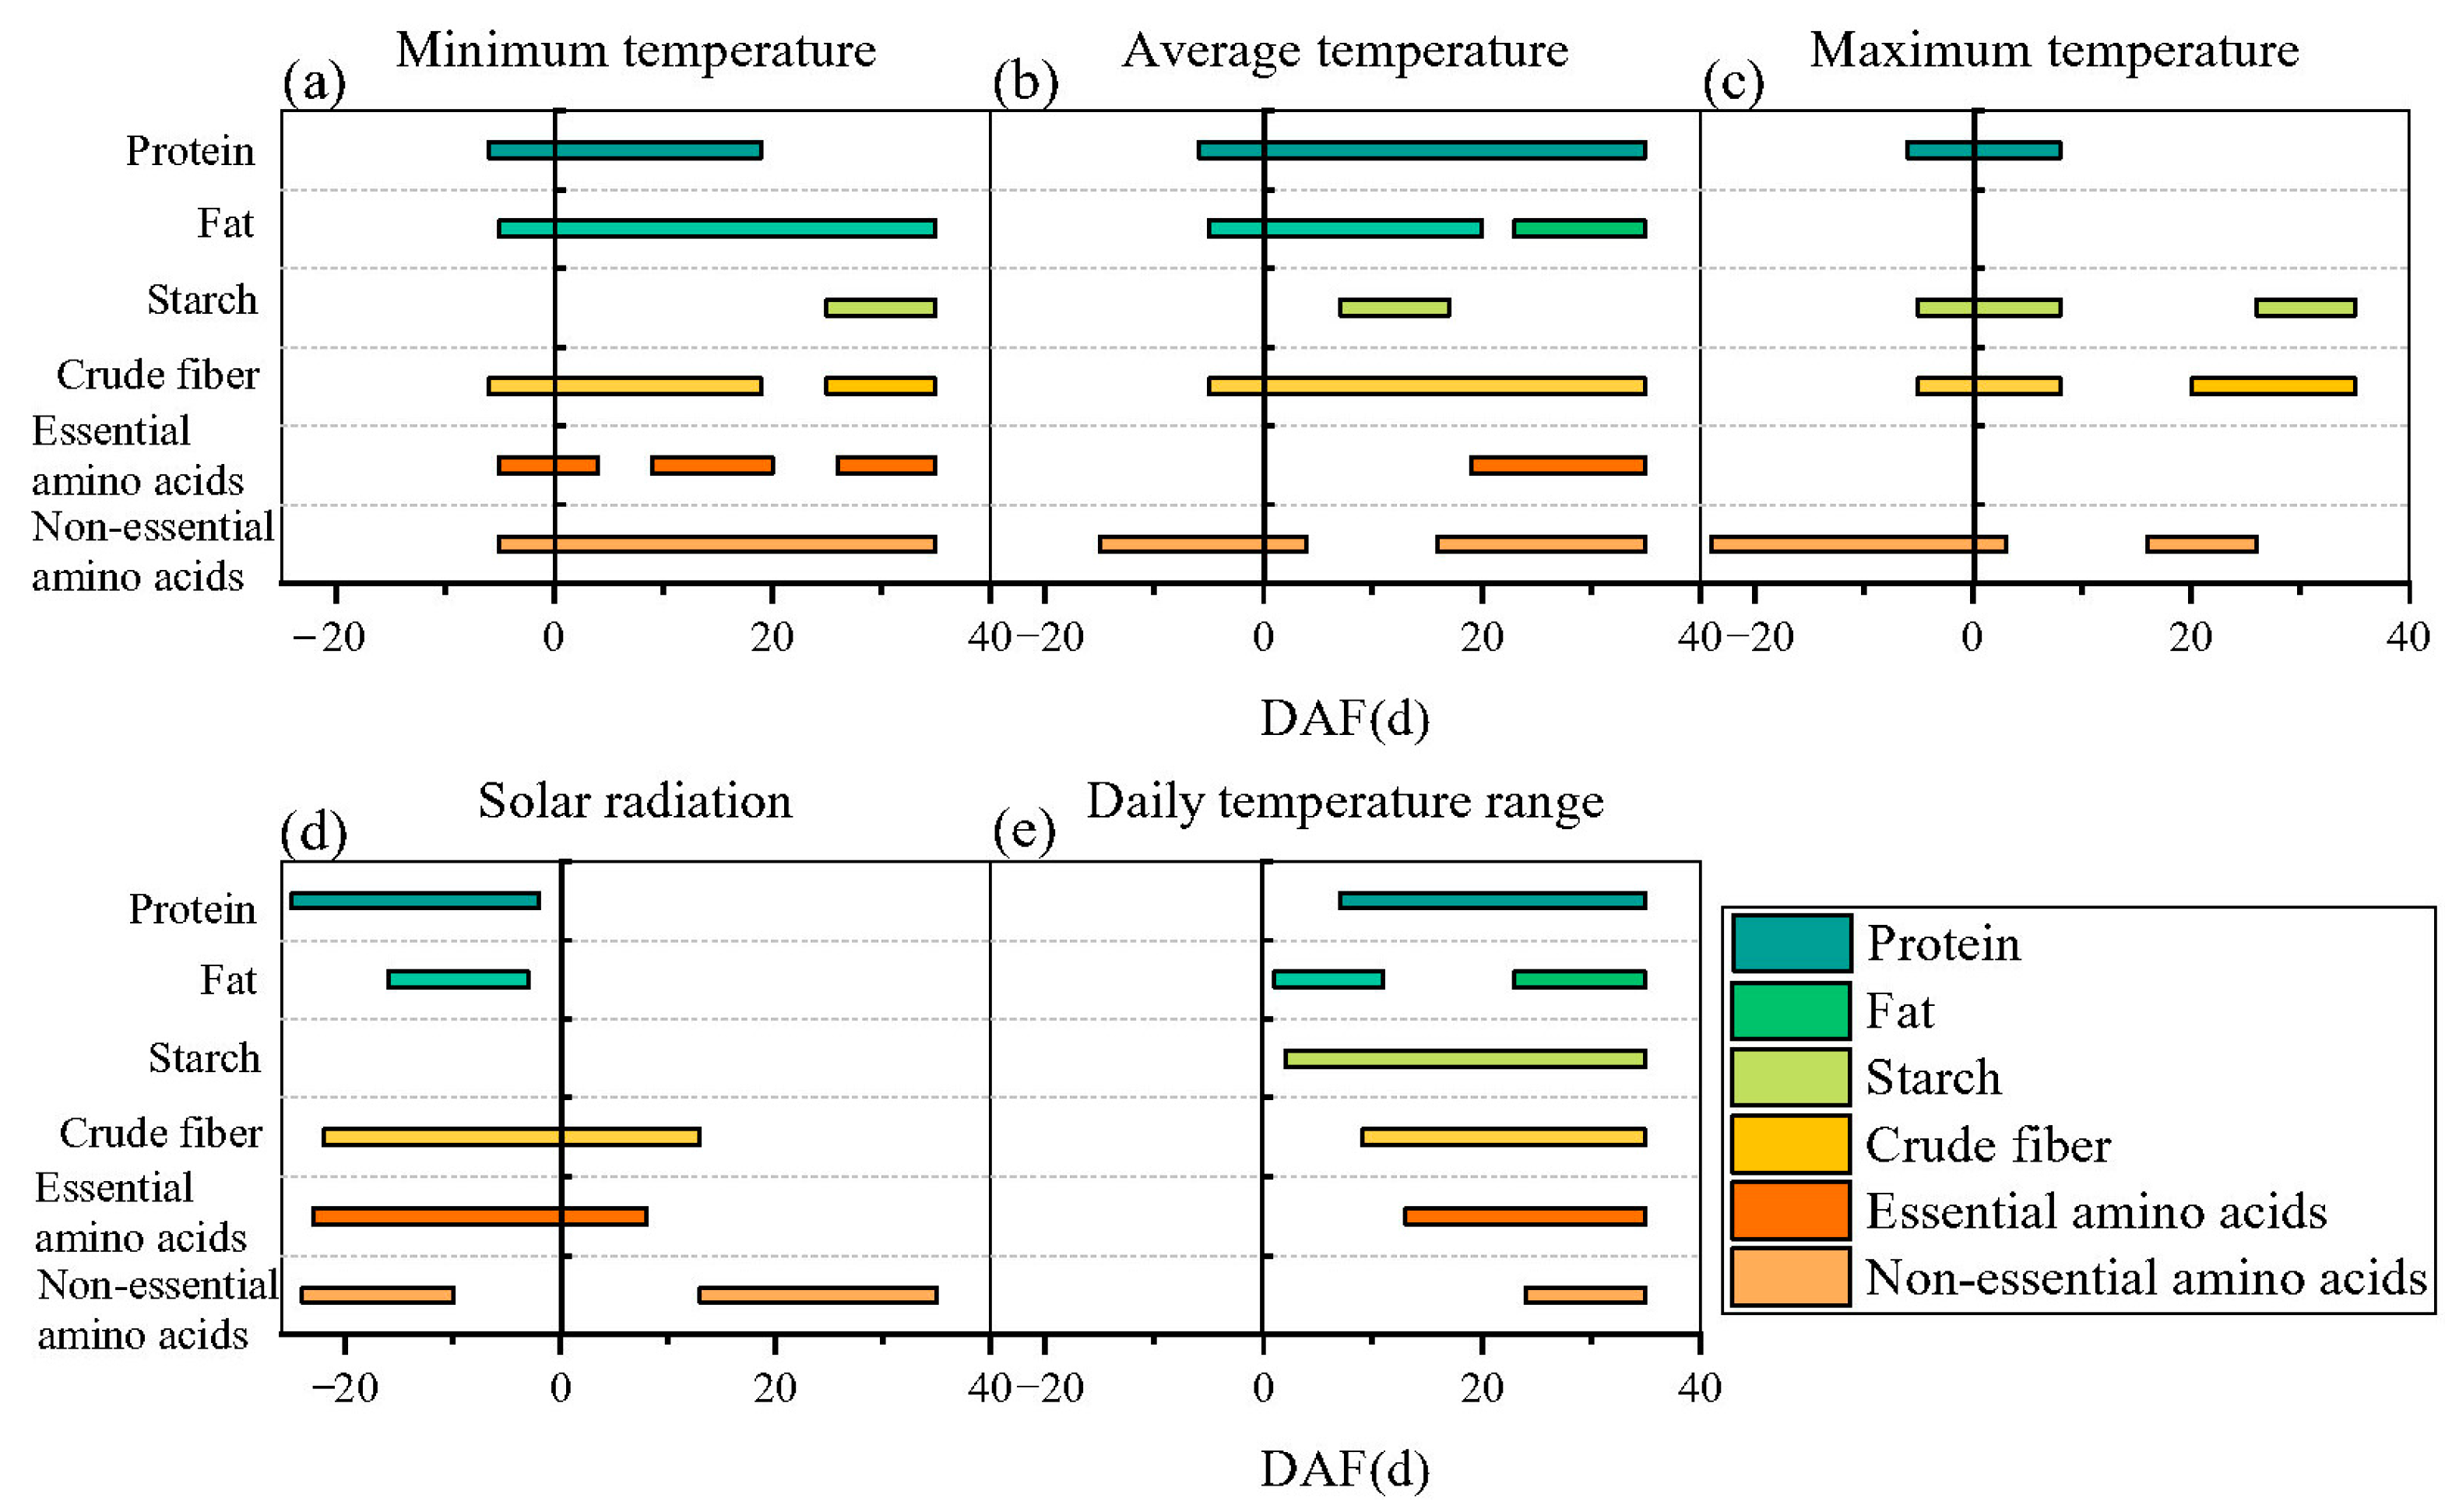
3.2. Key Stage and Meteorological Factors Affecting Nutritional Quality of Maize

In our study, PLS regression analysis was performed on the daily main meteorological factors and the main nutritional quality of maize during the whole growth period, and VIP values of the corresponding independent variables were obtained (Figure 3). The results show that the key growth period and the key factors affecting the main nutritional quality of maize were different under different meteorological conditions. A VIP greater than 0.8 was used as a criterion of extraction, and we screened out the period when the VIP value of different nutritional quality elements was greater than 0.8 for more than 10 consecutive days (Figure 4). We found that the responses of nutrient qualities to temperature were mainly concentrated from 6 d before flowering to 35 d after flowering, but there was a difference in the duration of the key stage. The key stage of protein, fat, and crude fiber response to average and minimum temperatures was longer, and the key stage of starch response to temperature daily range was longer. Interestingly, the non-essential amino acids showed different characteristics, responding significantly to average and maximum temperatures around 20 days before flowering. However, the effect of solar radiation on the quality was mainly concentrated before flowering. Except for starch, we found that the other quality elements had obvious key stages similar to those of the solar radiation before flowering.
The responses of maize nutrition quality to meteorological factors in the key growth stage are shown in Figure 5. In a key stage, the protein content was positively correlated with temperature (Figure 5(a1–a3)), while the solar radiation and temperature daily range had negative effects on the protein content (Figure 5(a4,a5)). There was a significant positive correlation between fat content and the mean and minimum temperature during the key stage (Figure 5(b1,b2)), and a conic relationship with solar radiation, especially when the relative solar radiation was less than 0.95. The fat content decreased with the increase in solar radiation and increased with the increase in solar radiation when the relative solar radiation was more than 0.95 (Figure 5(b4)). Moreover, we also found that fat responded differently to temperature daily range at different key stages (Figure 5(b5)), with a negative correlation with daily differences in temperature 1–11 d after flowering and a quadratic curve relationship with temperature daily range 23–35 d after flowering. During the key stage, the response of starch content to temperature was different (Figure 5(c1–c3)), which was negatively correlated with daily temperature difference, but the coefficient of determination was low and was not significantly affected by solar radiation. The response of crude fiber to meteorological factors in different key stages mainly shows a curve relationship (Figure 5(d1–d5)), and in some key stages it is a linear relationship; for example, the minimum temperature from 25 to 35 days after flowering and the maximum temperature from 20 to 35 days after flowering had negative effects on crude fiber content, and the temperature daily range from 9 to 35 days after flowering had positive effects on crude fiber content. Although there were differences in the responses of amino acids to meteorological factors, it is undeniable that the influence of meteorological factors in each key stage is obvious. The non-essential amino acid was positively correlated with the key stage temperature. The effects of meteorological factors were different and complex in different key stages for essential amino acids. Therefore, the main nutritional qualities of maize grains responded differently to different meteorological factors, and the quality effects of the same meteorological factor were different in different growth stages.

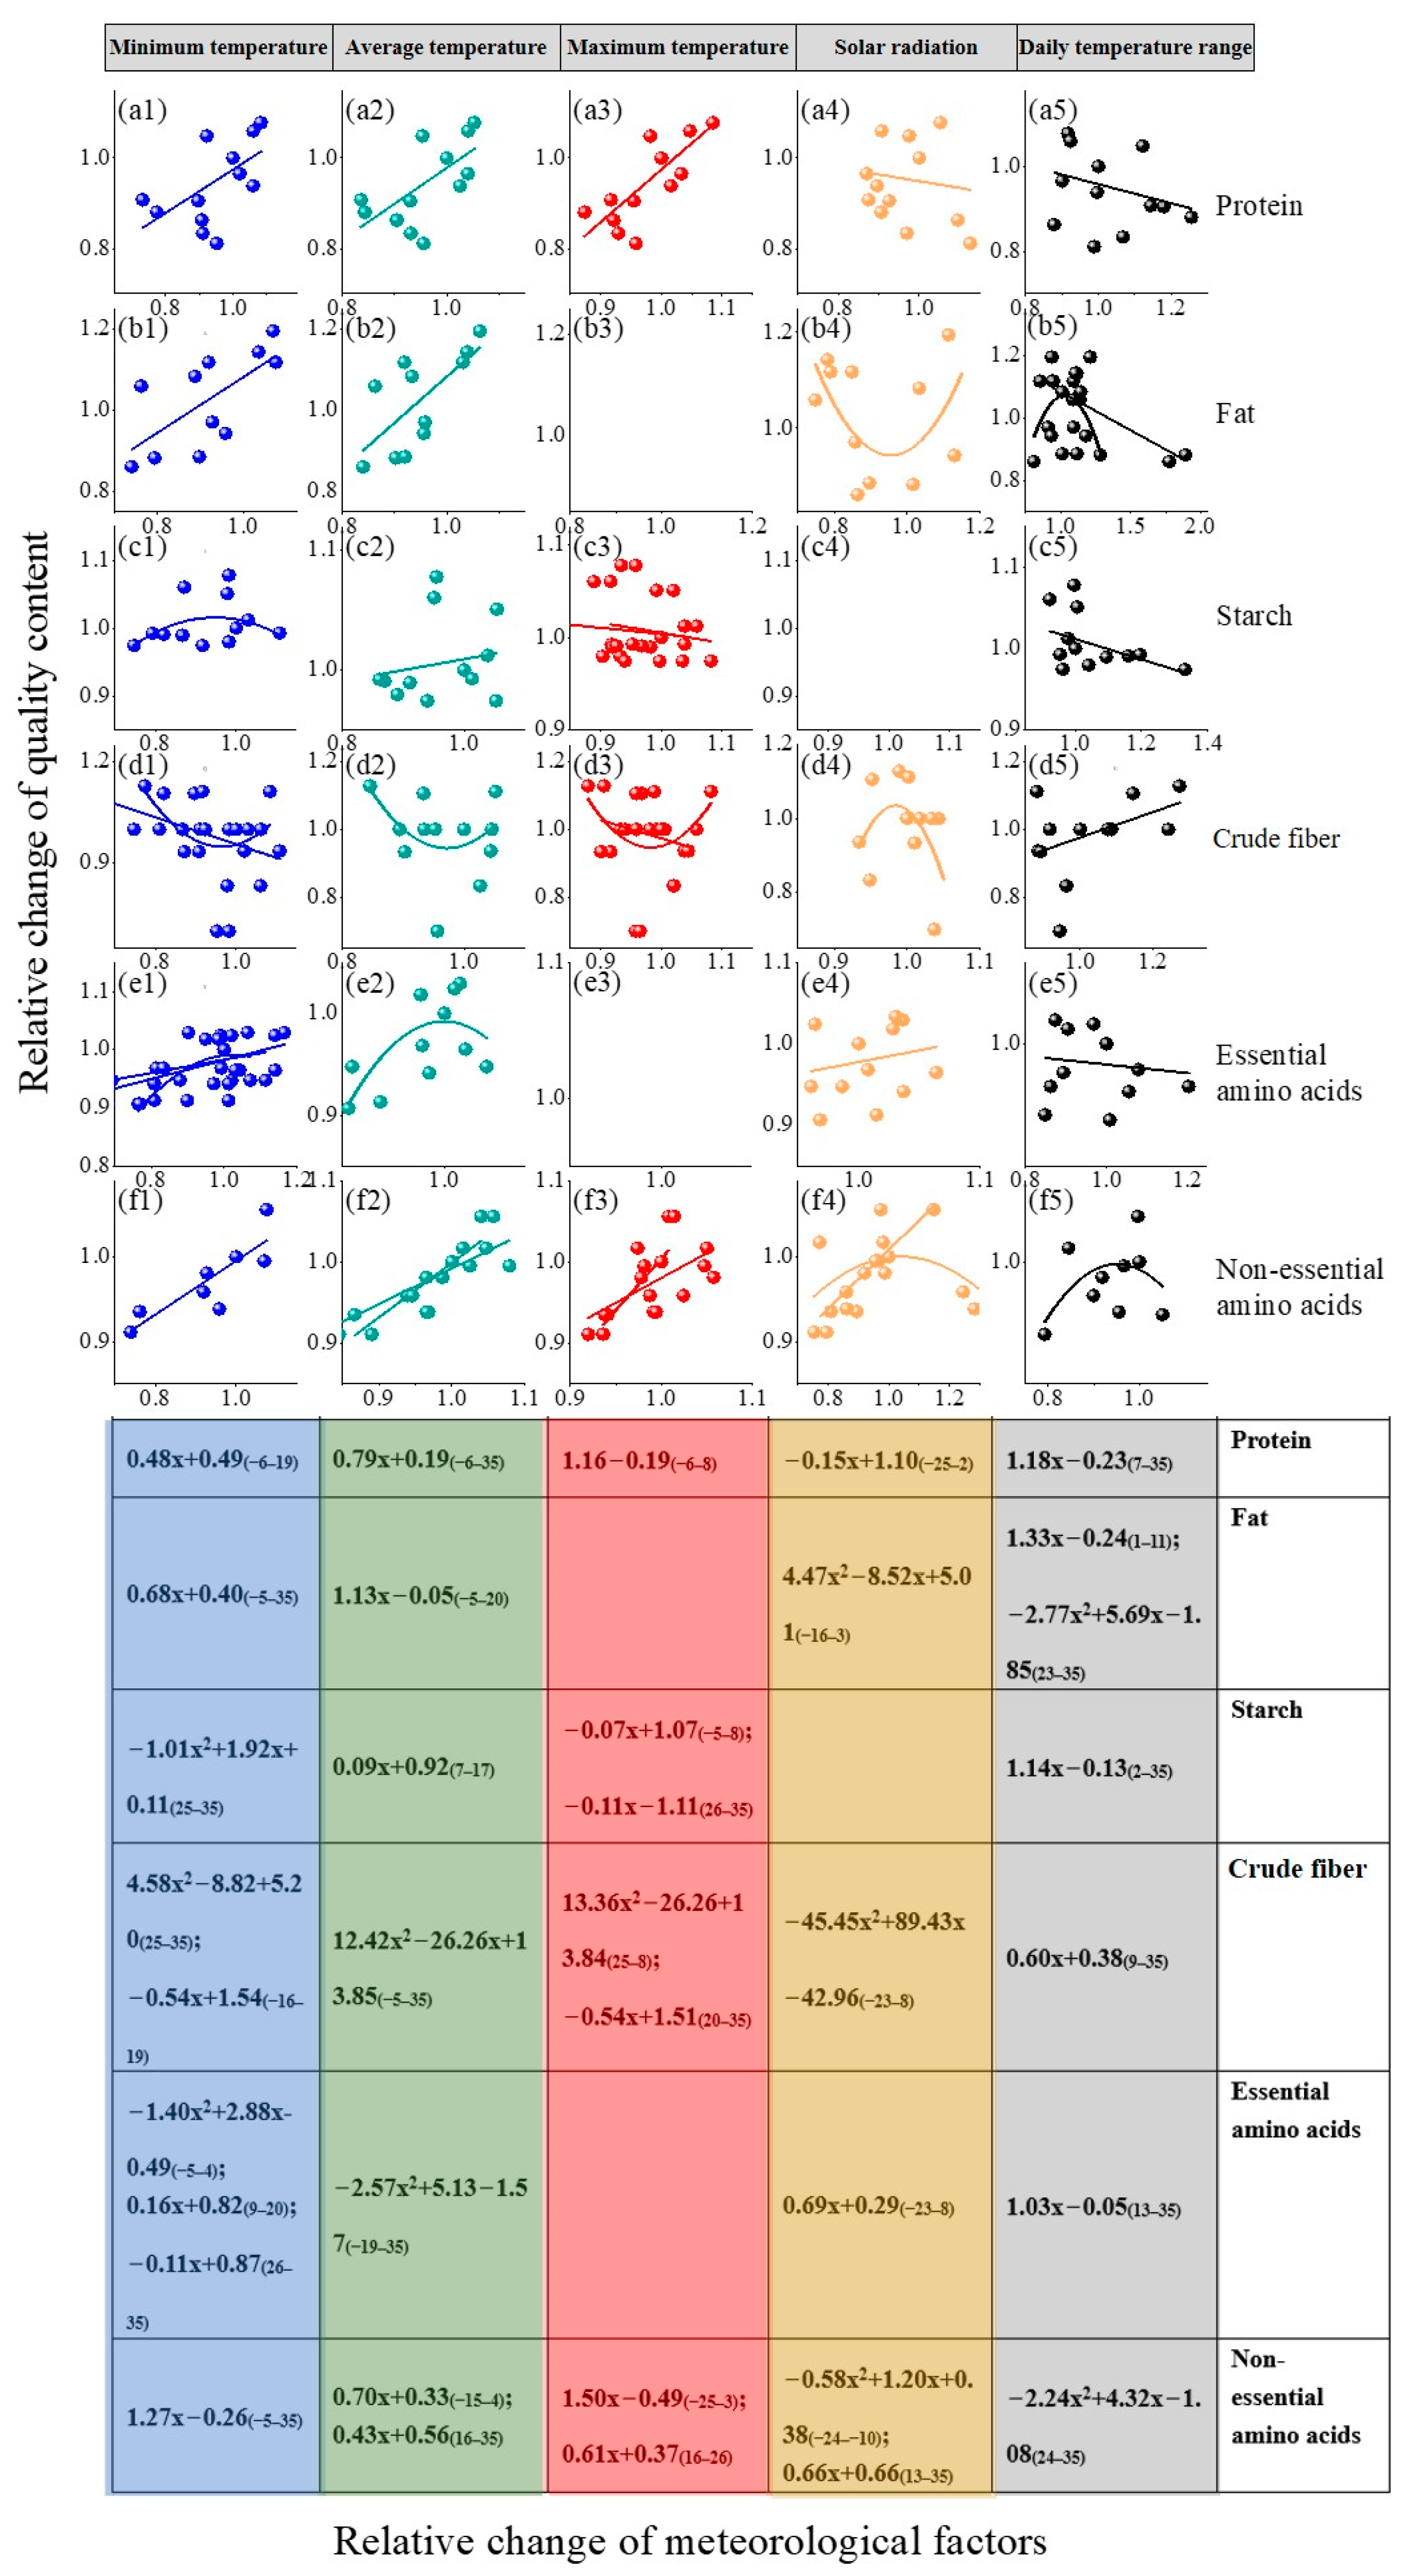
3.3. Comprehensive Effects of Both Key Stage and Corresponding Meteorological Factors on Nutritional Quality

The key stage of each quality factor responding to meteorological factors and its corresponding relationship is set as Y= a1x12 + a2x22 + a3x32 + …+anxn2 + a1x1 + a2x2 + a3x3 + …anxn + c, where x1 to xn represent the meteorological factors, a1 to an represent the corresponding coefficient, and c is the constant term. A comprehensive meteorological model of each nutrient quality factor was established (Table 2).
For all factors except starch, a comprehensive model containing a significance test could be established. Temperature is one of the most important indexes affecting the main nutritional quality. Except for starch, all nutritional quality aspects are affected by temperature. The model showed a good fit with R2 of 0.60–0.89. Protein is only affected by the maximum temperature; the fat and essential amino acids are not affected by the maximum temperature; the crude fiber and amino acid are affected by many key meteorological factors. The effects of solar radiation on nutritional quality during the key stage were mainly curvilinear, and the temperature daily range had a significant positive effect on essential amino acids. Based on the measured data from field experiments and meteorological data for 2022, we simulated the main nutritional quality content in 2022 using the established comprehensive model of nutritional quality; the results of the statistical evaluation of each quality factor simulation are shown in Table 3. The results of the t-test show that there was no significant difference between the simulated and measured values of each quality factor (p > 0.5). The ranges of R2 and nRMSE were 0.47–0.88 and 5.3–34.93%, respectively. The simulated values for protein, crude fiber, and essential amino acid content were higher than the measured values. Overall, the test results of the simulated models of each quality factor are in the acceptable range, and can reflect the change in quality content accurately.

3.4. Optimization of Both Key Stage and Corresponding Meteorological Conditions Affecting Nutritional Quality of Maize

In this study, the minimum value of the quality test results over 5 years was taken as the lower bound of the constraint value, and the minimum value of meteorological conditions during the key growth stage was taken as the lower limit of different meteorological factors. The maximum of meteorological conditions during the key growth stage was taken as the upper limit of different meteorological factors, and a set of nonlinear programming equations was established to solve the optimal value of the main nutrient quality content.
The results are presented in Table 4, in which the optimum value of protein was 9.66% when the maximum temperature of the key stage was 31.2 °C. The optimal value of fat content was 4.80% when the average temperature was 24.9 °C, and it was 4.97% for crude fiber content when the average temperature was 22.4 °C and the maximum temperature was 27.1 °C. The optimization results of minimum temperature, total solar radiation, and daily difference in temperature for the key stage were identical, at 12.0 °C, 627.01 MJ m−2, and 8.9 °C, respectively, and the two optimization schemes for the meteorological conditions differed only between the mean and maximum temperatures. When the temperature daily range and minimum temperature were 18.9 °C and 15.0 °C, respectively, the optimum values of essential amino acid were 40.39 g·kg−1 and 58.96 g·kg−1, respectively. Therefore, the minimum temperature and temperature daily range are important determinants of the amino acid content. Collectively, the temperature in key stages is an important indicator that ultimately determines the maize nutrient quality.

4. Discussion

4.1. Nutritional Quality of Maize Was Significantly Affected by Meteorological Conditions after Flowering

The relationship between nutrition quality and the environment is complex. The difference in meteorological factors caused by the sowing date is the main reason for the change in maize grain quality. The grain-filling period is the key stage for maize grain quality, especially for endosperm cells and starch granule formation [22], which is sensitive to environmental adversity [23]. According to the VIP value between meteorological conditions and the main nutritional quality during the whole growing period, it was found that although environmental factors are the key factors affecting grain quality trait, there are differences in the starting point of the key stage and the duration of the key stage (Figure 3). High temperature and sufficient light after anthesis were the key factors used to improve maize grain quality in previous studies [24], as these play an important role in the formation of maize grain quality. The results of the integrated model show that the maximum temperature from −6 to 8 days after anthesis had a significant effect on the protein content, which was consistent with the findings of Luis et al. [25], unless the heat stress occurred at the early stage of grain filling; otherwise, heat stress at the post-anthesis stage would not affect the final protein content of endosperm tissue. There were also studies that proposed that the leaf senescence-accelerated dry matter accumulation was inhibited, and protein and other material transformations were affected, by the high temperature after anthesis [26]. The key stage affecting nutritional quality was after flowering, but it cannot be ignored that temperature about 5 d before flowering had a significant positive effect on protein and crude fiber, and solar radiation 10 d before flowering had a significant effect on amino acids. Possible explanations include both the translocation of pre-anthesis nitrogen accumulation to post-anthesis grain and the lag effect in the nutrition quality of meteorological conditions. Additionally, the responses of the main nutrition qualities to the meteorological factors of key stages may show a quadratic or a linear relationship, due to the possibility of opposite directions of influence, as specified by the PLS method.

4.2. Temperature Is an Important Factor Affecting Grain Nutritional Qualities of Maize

Climate warming significantly affects photosynthesis, nutrient use efficiency, and carbon and nitrogen sink conversion during maize growth [27,28], and constrains maize nutrient quality. As a thermophilic crop, warm conditions favor the nutritional quality of maize. In this study, both the protein and fat contents of maize kernels were positively correlated with temperature during key stages, and the contents of nutrition qualities increased with increasing temperature during the key stage and were more sensitive to temperature than solar radiation. A curvilinear response of crude fiber content to temperature was observed, which first increased and then decreased with increasing temperature during each key stage, while an increase in the difference in daily temperature after 10 d of flowering decreased crude fiber content. Generally, an increase in average temperature increases the availability of N in the soil and its uptake by the crop [29], and converts the available N into protein rather than oil. High temperatures can affect sugar metabolism and starch synthesis [26]. Under high-temperature stress, grain starch content decreases [30], and protein content increases [31]. The meteorological conditions preceding and following the silking stage had significant impacts on pollen viability, pollination, pollen germination, pollen tube growth and fertilization [32]. While these physiological traits were not specifically researched in the present study, our findings align with previous research. For instance, Wang et al. [33] observed that the period most susceptible to heat stress was 5 days prior to silking. In agreement with this study, Huang et al. [34] confirmed the negative effects of high temperatures on grain amino acids during the early-filling period through field experiments. However, the present study further confirmed the positive effects of high temperature on amino acids in the late-filling period, for which no definite conclusion was derived in previous studies. Despite the significant effect of temperature during the key stage on starch content, no comprehensive model related to starch content could be established. Two possible reasons can be considered, one being that there was no water stress in this experiment, as a result of which the negative effect of high temperature on starch was alleviated, and the other being the fact that the influences of other factors on the starch content were greater than those of meteorological factors, including soil type, other environmental factors and geographical changes. These characteristics may pertain to the “Zhengdan 958” genotype, with potential variations in results across different genotypes. While some research indicates that meteorological factors may have a stronger influence on the quality than genotypes [35], other studies have underscored the significance of varietal differences [36], suggesting that using only one variety in this study may have limitations. Unfortunately, field experiments cannot reproduce the effects of daily variations of meteorological conditions on quality, which is one of the research directions to be considered in the future.

4.3. Measures Improving Grain Nutritional Quality of Maize

A substantial increase in maize yield and nutritional quality ensures food security. Adequate nutrition is an important condition of crop production [37], and the appropriate adjustment range and optimization program of maize nutrition quality were clear in this study. In fact, improving the nutritional quality of maize requires not only an increase in protein content, but also a balance of essential amino acids’ contents, such as lysine and tryptophan [38,39]. In this study, it was found that appropriate early sowing in the North China Plain was favorable for nutritional quality. Therefore, according to different nutritional quality objectives and combined with the optimization program of meteorological factors, the sowing date of maize was adjusted [40] to improve the nutritional quality and to make rational use of climate resources, as well as to meet the needs of different nutritional substances. In addition, the improvement of nutritional quality could be achieved through the selection of high-quality cultivars, cultivation density optimization, and scientific fertilization.

5. Conclusions

In the North China Plain, the crude fiber content was affected by the interaction between sowing and year, and showed more potential to increase than other nutritional qualities. The key stages and durations of different qualities affected by meteorological factors were different, mainly from 6 days before anthesis to 35 days after anthesis. Temperature has an important effect on the main nutritional quality of maize, and the temperature in the key stage can determine the contents of different nutritional qualities. Among these, the minimum temperature and the temperature daily range are important determinants of amino acid content; the highest content of each quality element was found when the maximum temperature during the key stage of each quality element was 31.2 °C, the average temperatures were 24.9 °C and 22.4 °C, respectively, the minimum temperature was 18.9 °C, and the temperature daily range was 15.0 °C. The optimum values of protein, fat, and crude fiber content were 9.66%, 4.80%, and 4.97%, respectively, and the optimized values of essential and non-essential amino acids were 40.39 g·kg−1 and 58.96 g·kg−1, respectively. The present study provides meteorological regulatory countermeasures and a theoretical basis for improving nutritional quality under climate change.

Author Contributions

Conceptualization, G.Z. and Y.W.; methodology, G.Z.; software, Y.W.; validation, Y.W. and S.R.; formal analysis, Y.W. and H.Z.; investigation, Y.S. and S.R.; resources, J.G.; data curation, Y.S., J.G., H.Z. and X.S.; writing—original draft preparation, Y.W.; writing—review and editing, G.Z., Y.S., S.R., H.Z. and X.S.; visualization, Y.W., G.Z. and Y.S.; project administration, G.Z.; funding acquisition, G.Z. All authors have read and agreed to the published version of the manuscript.

Funding

This work was supported by the Special Project on National Science and Technology Basic Resources Investigation of China (2021FY100703), the National Natural Science Foundation of China (No. 42130514), the program of China Meteorological Administration (CXFZ2023J053), and the Basic Research Fund of Chinese Academy of Meteorological Sciences (2020Z004, 2022Y015).

Data Availability Statement

Data are contained within the article.

Acknowledgments

The authors would like to thank the editor and reviewers for their assistance and valuable comments.

Conflicts of Interest

The authors declare no conflicts of interest.

References

  1. FAO. World Food and Agricultural 2022. Statistical Yearbook 2022. Available online: https://www.fao.org/faostat/zh/#home (accessed on 10 September 2023).
  2. Jahangirlou, M.R.; Akbari, G.A.; Alahdadi, I.; Soufizadeh, S.; Ludemann, C.; Parsons, D. Phenotypic predictors of dent maize grain quality based on different genetics and management practices. J. Cereal Sci. 2022, 103, 103388. [Google Scholar] [CrossRef]
  3. Lesk, C.; Rowhani, P.; Ramankutty, N. Influence of extreme weather disasters on global crop production. Nature 2016, 529, 7584. [Google Scholar] [CrossRef]
  4. Dhankher, O.P.; Foyer, C.H. Climate resilient crops for improving global food security and safety. Plant Cell Environ. 2018, 41, 877–884. [Google Scholar] [CrossRef]
  5. Varshney, R.K.; Bohra, A.; Roorkiwal, M.; Barmukh, R.; Cowling, W.; Chitikineni, A.; Lam, H.-M.; Hickey, L.T.; Croser, J.; Edwards, D.; et al. Rapid delivery systems for future food security. Nat. Biotechnol. 2021, 39, 1179–1181. [Google Scholar] [CrossRef]
  6. Farooq, M.S.; Uzair, M.; Raza, A.; Habib, M.; Xu, Y.; Yousuf, M.; Yang, S.H.; Khan, M.R. Uncovering the Research Gaps to Alleviate the Negative Impacts of Climate Change on Food Security: A Review. Front. Plant Sci. 2022, 13, 927535. [Google Scholar] [CrossRef]
  7. Chen, X.; Wang, L.; Niu, Z.; Zhang, M.; Li, C.; Li, J. The effects of projected climate change and extreme climate on maize and rice in the Yangtze River Basin, China. Agric. For. Meteorol. 2020, 282, 107867. [Google Scholar] [CrossRef]
  8. Zhao, Y.; Li, Z.; Hu, X.; Yang, G.; Wang, B.; Duan, D.; Fu, Y.; Liang, J.; Zhao, C. Spatial heterogeneity of county-level grain protein content in winter wheat in the Huang-Huai-Hai region of China. Eur. J. Agron. 2022, 134, 126466. [Google Scholar] [CrossRef]
  9. Kong, X.; Hou, R.; Yang, G.; Ouyang, Z. Climate warming extends the effective growth period of winter wheat and increases grain protein content. Agric. For. Meteorol. 2023, 336, 109477. [Google Scholar] [CrossRef]
  10. Kumar, S.; Bhushan, B.; Wakchaure, G.C.; Dutta, R.; Jat, B.S.; Meena, K.K.; Rakshit, S.; Pathak, H. Unveiling the impact of heat stress on seed biochemical composition of major cereal crops: Implications for crop resilience and nutritional value. Plant Stress 2023, 9, 100183. [Google Scholar] [CrossRef]
  11. Shi, K.; Gu, X.; Lu, W.; Lu, D. Effects of weak-light stress during grain filling on the physicochemical properties of normal maize starch. Cabohydrate Polym. 2018, 202, 47–55. [Google Scholar] [CrossRef]
  12. Jia, S.F.; Li, C.F.; Dong, S.T.; Zhang, J.W. Effects of Shading at Different Stages After Anthesis on Maize Grain Weight and Quality at Cytology Level. Agric. Sci. China 2011, 10, 58–69. [Google Scholar] [CrossRef]
  13. Yang, H.; Gu, X.; Ding, M.; Lu, W.; Lu, D. Heat stress during grain filling affects activities of enzymes involved in grain protein and starch synthesis in waxy maize. Sci. Rep. 2018, 8, 15665. [Google Scholar] [CrossRef]
  14. Yang, H.; Shen, X.; Lu, D.L.; Lu, W. Effects of heat stress durations at grain formation stage on grain yield and starch quality of waxy maize. Sci. Agric. Sin. 2017, 50, 2071–2082. (In Chinese) [Google Scholar]
  15. Butts-Wilmsmeyer, C.J.; Seebauer, J.R.; Singleton, L.; Below, F.E. Weather During Key Growth Stages Explains Grain Quality and Yield of Maize. Agronomy 2019, 9, 16. [Google Scholar] [CrossRef]
  16. National Bureau of Statistics of China. China Statistical Yearbook; China Statistic Press: Beijing, China, 2021. Available online: https://www.stats.gov.cn/sj/ndsj/2021/indexch.htm (accessed on 11 October 2023). (In Chinese)
  17. Liu, Z.M.; Li, L.; Li, H.; Liu, N.; Wang, H.X.; Shao, L.W. Changes and influencing factors of crop coefficient of summer maize during the past 40 years in the North China Plain. Chin. J. Eco-Agric. 2023, 31, 1355–1367. (In Chinese) [Google Scholar] [CrossRef]
  18. Zhou, H.; Zhou, G.; He, Q.; Zhou, L.; Ji, Y.; Lv, X. Capability of leaf water content and its threshold values in reflection of soil-plant water status in maize during prolonged drought. Ecol. Indic. 2021, 124, 107395. [Google Scholar] [CrossRef]
  19. Angstrom, A. Solar and terrestrial radiation. Report to the international commission for solar research on actinometric investigations of solar and atmospheric radiation. Q. J. R. Meteorol. Soc. 2010, 50, 121–126. [Google Scholar] [CrossRef]
  20. China Meteorological Administration. Specification for Agrometeorological Observation; China Meteorological Press: Beijing, China, 1993; Volume I. [Google Scholar]
  21. Wang, Z.; Chen, J.; Zhang, J.; Tan, X.; Raza, M.A.; Ma, J.; Zhu, Y.; Yang, F.; Yang, W. Assessing canopy nitrogen and carbon content in maize by canopy spectral reflectance and uninformative variable elimination. Crops J. 2022, 10, 1224–1238. [Google Scholar] [CrossRef]
  22. Guo, J.; Qu, L.; Wang, L.; Lu, W.; Lu, D. Effects of post-silking drought stress degree on grain yield and quality of waxy maize. J. Sci. Food Agric. 2023, 103, 1530–1540. [Google Scholar] [CrossRef]
  23. Cheikh, N.; Jones, R.J. Disruption of Maize Kernel Growth and Development by Heat Stress (Role of Cytokinin/Abscisic Acid Balance). Plant Physiol. 1994, 106, 45–51. [Google Scholar] [CrossRef]
  24. Jahangirlou, M.R.; Morel, J.; Akbari, G.A.; Alahdadi, I.; Soufizadeh, S.; Parsons, D. Combined use of APSIM and logistic regression models to predict the quality characteristics of maize grain. Eur. J. Agron. 2023, 142, 126629. [Google Scholar] [CrossRef]
  25. Ignacio Mayer, L.; Savin, R.; Angel Maddonni, G. Heat Stress during Grain Filling Modifies Kernel Protein Composition in Field-Grown Maize. Crops Sci. 2016, 56, 1890–1903. [Google Scholar] [CrossRef]
  26. Lu, D.; Shen, X.; Cai, X.; Yan, F.; Lu, W.; Shi, Y.-C. Effects of heat stress during grain filling on the structure and thermal properties of waxy maize starch. Food Chem. 2014, 143, 313–318. [Google Scholar] [CrossRef] [PubMed]
  27. Soares, J.C.; Santos, C.S.; Carvalho, S.M.P.; Pintado, M.M.; Vasconcelos, M.W. Preserving the nutritional quality of crop plants under a changing climate: Importance and strategies. Plant Soil 2019, 443, 1–26. [Google Scholar] [CrossRef]
  28. Bheemanahalli, R.; Vennam, R.R.; Ramamoorthy, P.; Reddy, K.R. Effects of Post-Flowering Heat and Drought Stresses on Physiology, Yield, and Quality in Maize (Zea mays L.). Plant Stress 2022, 6, 100106. [Google Scholar] [CrossRef]
  29. Canvin, D.T. The effect of temperature on the oil content and fatty acid composition of the oils from several oil seed crops. Can. J. Bot. 1965, 43, 63–69. [Google Scholar] [CrossRef]
  30. Singletary, G.W.; Banisadr, R.; Keeling, P.L. Heat Stress During Grain Filling in Maize: Effects on Carbohydrate Storage and Metabolism. Aust. J. Plant Physiol. 1994, 21, 829–841. [Google Scholar] [CrossRef]
  31. Gong, S.X. Food Crops and Weather; Beijing Agricultural University Press: Beijing, China, 1987; pp. 245–248. [Google Scholar]
  32. Zhou, L.Z.; Juranić, M.; Dresselhaus, T. Germiline development and fertilization mechanisms in maize. Mol. Plant. 2017, 10, 389–401. [Google Scholar] [CrossRef]
  33. Wang, Y.; Sheng, D.; Zhang, P.; Dong, X.; Yan, Y.; Hou, X.; Wang, P.; Huang, S. High temperature sensitivity of kernel formation in different short periods around silking in maize. Environ. Exp. Bot. 2020, 183, 104343. [Google Scholar] [CrossRef]
  34. Huang, M.; Zhang, H.; Zhao, C.; Chen, G.; Zou, Y. Amino acid content in rice grains is affected by high temperature during the early grain-filling period. Sci. Rep. 2019, 9, 2700. [Google Scholar] [CrossRef]
  35. Chen, M.; Li, Z.; Huang, J.; Yan, Y.; Wu, T.; Bian, M.; Zhou, J.; Wang, Y.; Lyv, Y.; Hu, G.; et al. Dissecting the meteorological and genetic factors affecting rice grain quality in Northeast Chian. Genes Genom. 2021, 43, 975–986. [Google Scholar] [CrossRef] [PubMed]
  36. Huang, Z.; Ming, B.; Hou, L.; Xue, J.; Wang, K.; Xie, R.; Hou, P.; Wang, Z.; Ma, D.; Gao, J.; et al. Improving maize quality from mechanical grain harvesting by matching maize varieties with accumulated temperature in northeast China. J. Sci. Food Agric. 2023, 103, 5061–5069. [Google Scholar] [CrossRef] [PubMed]
  37. Rizwan, M.; Zhu, Y.; Qing, P.; Zhang, D.; Ahmed, U.I.; Xu, H.; Iqbal, M.A.; Saboor, A.; Malik, A.M.; Nazir, A.; et al. Factors Determining Consumer Acceptance of Biofortified Food: Case of Zinc-Fortified Wheat in Pakistan’s Punjab Province. Front. Nutr. 2021, 8, 647823. [Google Scholar] [CrossRef] [PubMed]
  38. Caire-Juvera, G.; Vázquez-Ortiz, F.A.; Grijalva-Haro, M.I. Amino acid composition, score and in vitro protein digestibility of foods commonly consumed in northwest Mexico. Nutr. Hosp. 2013, 28, 365–371. [Google Scholar] [CrossRef]
  39. Wu, Y.; Messing, J. Proteome balancing of the maize seed for higher nutritional value. Front. Plant Sci. 2014, 5, 240. [Google Scholar] [CrossRef]
  40. Deng, F.; Zhang, C.; He, L.; Liao, S.; Li, Q.; Li, B.; Zhu, S.; Gao, Y.; Tao, Y.; Zhou, W.; et al. Delayed sowing date improves the quality of mechanically transplanted rice by optimizing temperature conditions during growth season. Field Crops Res. 2022, 281, 108493. [Google Scholar] [CrossRef]
Figure 1. Location of the experiment site.
Agronomy 14 00420 g001
Figure 2. The average amino acid contents of maize at different sowing dates from 2018 to 2022. (a) Non-essential amino acids, (b) Essential amino acids. The orange, green, purple and yellow bars indicate different sowing dates, including S1, S2, S3 and S4, respectively, and are annotated by the numbers 1–4. Similar letters or letter groups (such as “a” and “ab”) signify that there is no statistically significant difference.
Agronomy 14 00420 g002
Figure 3. VIP of maize nutritional quality and corresponding meteorological factors. The letters a–f indicate protein, fat, starch, crude fiber, essential amino acids, and non-essential amino acids, respectively, and the numbers 1–5 indicate minimum temperature, average temperature maximum temperature, solar radiation, and temperature daily range, respectively. DAF is short for the number of days after flowering. VIP values greater than 0.8 are shown in shades of red, and less than 0.8 are shaded in gray.
Agronomy 14 00420 g003
Figure 4. Key stages of maize nutrient quality response to meteorological conditions. (a) Minimum temperature, (b) Average temperature, (c) Maximum temperature, (d) Solar radiation, (e) Daily temperature range. The bars with varying colors represent different nutrient categories, including protein, fat, starch, crude fiber, essential amino acids and non-essential amino acids, respectively. The abbreviation “DAF” denotes the number of days after flowering.
Agronomy 14 00420 g004
Figure 5. Responses of maize nutritional quality to meteorological factors during key stage. The letters a-f indicate protein, fat, starch, crude fiber, essential amino acids, and non-essential amino acids, respectively, and the numbers 1–5 indicate minimum temperature (blue), average temperature (green), maximum temperature (red), solar radiation (yellow), and temperature daily range (gray), respectively. Figures in the table are corresponding regression coefficients, and the critical period is indicated in parentheses.
Agronomy 14 00420 g005
Table 1. Nutritional quality of maize at different sowing dates from 2018 to 2022.
YearSowing DateProtein (%)Fat (%)Starch (%)Crude Fiber (%)
2018S19.5 ab3.8 a68.4 a4.4 b
S29.9 a3.4 b68.9 a4.7 b
S38.2 c3.8 a67.5 a4.7 b
S48.7 bc3.6 ab70.4 a5.3 a
2019S18.0 a3.2 ab64.7 a2.0 a
S27.4 a3.4 a66.4 a1.8 b
S37.8 a3.3 ab65.7 a1.8 b
S47.9 a3.0 b64.7 a1.8 b
2020S18.5 a4.3 a66.0 a1.9 b
S28.0 ab3.6 b65.2 a1.9 b
S37.2 b3.9 b64.6 a2.1 a
S47.3 b3.1 c64.7 a1.8 b
2021S17.8 ab4 a66.1 a2.5 b
S28.31 a3.5 b62.9 a3 a
S36.74 c3.3 bc67.8 a2.1 c
S47.17 bc3.1 c66.7 a2.8 a
2022S17.94 a3.7 a60.9 a2.7 a
S27.17 b3.2 b60.2 a2.0 b
S36.02 b3.0 b61.2 a2.2 b
S46.81 c3.3 b62.5 a1.8 c
AverageS18.353.7965.222.70
S28.153.4164.722.68
S37.203.4665.362.58
S47.573.2165.802.70
CV (%) 9.917.401.3615.10
Sources of variationS****\**
Y*******
S × Y****\**
Note: Different letters indicate significant differences between nutritional quality at different sowing dates (p < 0.05), the same letters indicate no differences in nutritional quality. Y represents the abbreviation for year, while S denotes the abbreviation for sowing dates, and 1–4 represent different sowing dates, expressed as S1–S4. ** represents significant difference (p < 0.01), * represents significant difference (p < 0.05), \ indicates a null value with no significant difference.
Table 2. Comprehensive response of maize nutritional quality to both key stage and corresponding meteorological factors.
Nutritional QualityMinimum Temperature (°C)Average Temperature (°C)Maximum Temperature
(°C)
Total Solar Radiation
(MJ m−2)
Daily Temperature Range (°C)Constant TermR2
Protein//0.28 (−6–8 d)//−1.110.60
Fat−0.26 (−5–
35 d)
0.37 (−5–20 d)/−0.0000046 (2) (−16–−3 d)−0.001 (1–11 d);
−0.069 (2) (23–35 d)
0.4950.76
Starch///////
Crude fiber−0.025 (2) (23–35 d)0.031 (2) (−5–35 d);−0.015 (2) (−5–8 d)−0.0000087 (2) (−22–13 d);−0.31 (9–35 d)14.400.67
Essential amino acids0.03 (2) (−5–4 d);
0.33 (9–20 d);
0.22 (26–35 d)
−0.05 (19–35 d)/−0.08 (−23–8 d)−0.32 (13–35 d)67.730.72
Non-essential amino acids−1.46 (−5–35 d)10.96 (−15–4 d);
−6.89 (16–35 d)
−1.53 (−25–3 d); 2.46 (16–26 d)−0.000029 (2) (13–35 d)0.44 (24–35 d)−97.540.89
Note: All coefficients passed the 5% significance test; the numbers in parentheses are the duration of key stages, indicating the days after flowering. The “/” indicates null value, and (2) indicates quadratic term.
Table 3. Statistical validation of the nutritional quality of maize in 2022.
Nutritional QualityNMean Simulated Value (%)Mean Measured Value (%)P(t*)αβR2RMSEnRMSE (%)
Protein47.266.990.310.910.410.580.537.53
Fat43.093.290.190.870.610.880.226.57
Crude fiber42.252.210.380.441.210.470.3817.07
Essential amino acids427.4324.760.120.6912.600.582.115.30
Non-essential amino acids439.0439.720.391.81−24.850.613.4714.00
Note: N is the number of samples, P(t*) denotes p-value of student t-test, α denotes model slope, β denotes intercept.
Table 4. Optimization of corresponding meteorological factors at key stages affecting nutritional quality of maize.
Nutritional QualityMinimum Temperature (°C)Average Temperature (°C)Maximum Temperature (°C)Total Solar Radiation (MJ m−2)Temperature Daily Range (°C)Constrained ValueOptimization Value
Protein//31.2//6.749.66
Fat12.024.9/627.018.93.004.80
Starch///////
Crude fiber12.022.427.1627.018.91.804.97
Essential amino acids18.924.9/627.018.919.9940.39
Non-essential amino acids12.024.931.2627.0115.030.6158.96
Min12.018.425.9627.018.9//
Max20.524.931.2916.0015.0//
Disclaimer/Publisher’s Note: The statements, opinions and data contained in all publications are solely those of the individual author(s) and contributor(s) and not of MDPI and/or the editor(s). MDPI and/or the editor(s) disclaim responsibility for any injury to people or property resulting from any ideas, methods, instructions or products referred to in the content.

