Article

Doubled Haploid Lines Derived from a European Maize Flint Landrace Contrast in Recovery from Cold Stress

Institute of Bio- and Geosciences, Plant Sciences (IBG-2), Forschungszentrum Jülich GmbH, 52425 Jülich, Germany
*
Author to whom correspondence should be addressed.
Current address: Agroscope, Plant Production Systems, Cultivation Techniques and Varieties in Arable Farming, Route de Duillier 60, 1260 Nyon, Switzerland.
Agronomy 2024, 14(3), 408; https://doi.org/10.3390/agronomy14030408
Submission received: 19 January 2024 / Revised: 12 February 2024 / Accepted: 17 February 2024 / Published: 20 February 2024
(This article belongs to the Section Farming Sustainability)

Abstract

:
Suboptimal temperatures at sowing and emergence affect the early development of maize, with potentially irreversible effects later in the growing season. We studied recovery from cold stress of an inbred line (B73) and 13 Doubled Haploid lines derived from a European flint maize landrace. After a cold treatment (20–12 °C, day–night) from sowing to seedling establishment, seedlings were transplanted and grown in the greenhouse until the V8 stage (eight leaves fully developed), when we measured agronomically relevant plant traits and spectral indices of mature leaves. Survival rates of transplanted seedlings after cold treatment ranged from 10% to 100%. After a strong delay in early development due to cold, the surviving plants were able to compensate for this delay at later stages of recovery. They reached the V8 stage after only five more growing degree days than plants grown under the control treatment (25–18 °C, day–night). Plants from the most cold-tolerant genotypes (PE0401 and PE0100) accumulated more root and shoot biomass at the end of the recovery phase compared with the same genotypes exposed to the control treatment. The genotypes with the most plastic leaf morphological traits (PE0161 and PE0072) had little reduction in leaf biomass at the end of the recovery phase in comparison with less responsive genotypes such as PE0171. We conclude that genotypes that survived cold treatment with minimal cold damage of seedling leaves can be candidates for further cold recovery studies and breeding. Nevertheless, such studies must take trait acclimation for other suboptimal conditions into consideration.

1. Introduction

The occurrence of unusual low temperatures is among the climate anomalies projected to increase in frequency and severity according to recent climate models [1]. This type of event may compromise crop productivity in some regions of Europe [2]. For example, in Germany, the probability of temperatures dropping below 5 °C remains very high until the end of April, which coincides with the beginning of the maize crop cycle in Northern Europe [3].
Maize originated in the subtropics [4] and exhibits a lower degree of adaptation to low temperatures in comparison with cold-tolerant C4 species such as miscanthus [5]. Early responses to an exposure of 12 °C or lower involve changes in membrane fluidity [6] and in stress signalling processes [7,8,9]. Suboptimal temperatures of 19 °C or lower can decrease maize leaf elongation through reduced cell expansion [10] and cell division [11]. Impaired leaf development and cell cycle progression was also observed at 25 °C day temperature when night temperature was as low as 4 °C [12]. Leaf growth impairment can be accompanied by the downregulation of the genes involved in photosynthesis and chlorophyll biosynthesis [13]. Next to gene expression regulation, low temperature affects photosynthesis in maize through reduced enzyme activity, changes in hormone metabolism, and chloroplast structure [14,15].
Aerial and belowground organs of the same plant can experience different growth conditions, as soil can buffer low atmospheric temperatures to a certain extent [16]. Soil surface temperatures tend to be 1 to 6 °C warmer than those of the air depending on factors such as climatic region, season and land cover [17]. Relatively higher soil temperatures under cold ambient air will not necessarily spare belowground organs from cold stress. A 2 °C decrease in topsoil temperature to 15 °C is sufficient to induce considerable reductions in the operating efficiency of photosystem II and, to a lesser extent, in the chlorophyll content of maize seedlings [18]. Root temperatures of 5.5 °C cause stomatal closure through increased ABA content, reduced water potential, and root hydraulic properties [19]. The ability of plants to recover from cold stress has been observed at the shoot level and is thought to occur via (1) photoprotective mechanisms as well as growth limitation under cold stress, with growth resumption once temperatures increase [13], (2) compensating biomass losses through an extended vegetative period [20], and (3) maintaining a relatively stable chlorophyll content under cold and recovery [21].
Mitigating the risk of low-temperature effects on maize yield requires crop management strategies such as adapting sowing dates and crop cycle duration to the environment and exploiting genetic diversity to improve crop resilience and yield [3]. If suboptimal temperature tolerance at early stages is established, further vegetative and reproductive stages of maize can benefit from a relatively warming temperate climate. For example, the observed increase in maize yield in northwestern Europe has been attributed to higher accumulated temperatures than in the past and to genetic improvement [22,23]. In addition, a large variability in suboptimal temperature tolerance exists among Zea mays subspecies [24]. Flint maize (Zea mays ssp. indurata) has been shown to better withstand low temperatures compared with dent maize (Zea mays ssp. indentata; [25,26,27]). These two subspecies have been crossed in Europe to increase yield (dent trait) while assuring a certain cold tolerance derived from flint maize [27].
Doubled haploid (DH) lines hold a potential in plant breeding and genetics due to the speed and efficiency to reach complete homozygosity compared with conventional inbred lines [28,29]. The study of DH lines developed from early flowering German flint maize landraces could be of particular importance due to the superiority in early cold tolerance of flint landraces compared with hybrids [30] and the ability of flint genotypes to withstand [25,26,27] and recover from cold stress [31].
In this study, 13 DH lines derived from the German flint maize landrace Petkuser Ferdinand Rot [32] were selected, in addition to the dent inbred line B73 as a cold sensitive reference genotype. To our knowledge, previous studies on low-temperature effects on maize focused mainly on (1) stages as early as seed imbibition and germination [6], (2) seedling roots [7], and (3) seedling leaves [9,12]. Moreover, these studies did not cover a wider range of phenotypic traits and their interaction or did not span later developmental stages. Here, we hypothesized that the adverse effects of early low-temperature exposure would persist after the cessation of the stress period when surviving plants are acclimated to suboptimal temperatures. To test this hypothesis, we compared the developmental, morphological, and agronomic traits, leaf spectral indices, and their interactions in these DH lines subjected to cold and control conditions followed by a recovery phase until tassel emergence.

2. Materials and Methods

2.1. Plant Material

The DH lines were derived from the German flint maize landrace Petkuser Ferdinand Rot [32]. The root and shoot traits of two-week-old seedlings from 426 DH lines were evaluated in an earlier study under a temperature regime of 16–12 °C (day–night) for one week after germination using a germination paper-based phenotyping assay [33,34]. The photoperiod was set to 14–10 h (day–night) and light intensity to 400 µmol m−2 s−1. The results of this experiment can be found in the Supplementary Material (Figure S1). Based on this experiment, we selected 13 DH lines with contrasting responses to the cold treatment (Figure S1). The root systems of 6 of the 13 genotypes (PE0161, PE0328, PE0002, PE0100, PE0265, and PE0022) were evaluated for phenotypic traits in Frey et al. (2020, [8]), where they showed contrasting growth rates and cold tolerance levels under 16–12 °C (day–night) for two days. The gene expression levels under a cold treatment of 12 °C for 8 h were also different among these genotypes [8]. We used the inbred line B73 as a cold sensitive reference.

2.2. Growth Conditions

Seeds were sown in 10 trays of 35 plugs with 25 replicates per genotype and treatment in a controlled environment chamber. The seeds were randomized across trays with five repetitions per tray. When the first leaf was fully developed (V1 stage), seedlings were transplanted to 4 L pots filled with substrate (Einheitserde ED73, Einheitserdewerke Werkverband e.V., Sinntal-Altengronau, Germany) and moved to the greenhouse (Forschungszentrum Jülich, Germany, IBG-2: Plant Sciences; 50°55′17.36″ N, 6°21′45.61″ E). The seedlings were grown in the greenhouse (recovery phase) until eight leaves were fully developed (V8 stage). The day length was 16–8 h (day–night) for both phases. All environmental data can be found in the Supplementary Material (Figure S2).
The temperature treatment phase took place in a growth chamber with 20–12 °C (day–night) and 25–18 °C (day–night) for cold and control, respectively. Light intensity, air temperature, and relative humidity were stepwise increased and decreased following a diurnal pattern (Figure S2A). The chamber settings were adapted to reach the target temperature and relative humidity at the substrate level and not the chamber sensor level. Conditions were recorded at 10 min intervals using temperature and relative humidity data loggers (EasyLog, Lascar Electronics, Wiltshire, England; Figure S2A). Light intensity peaked at 290 µmol m−2 s−1 under both treatments and was measured at the substrate level (Figure S2B) using an optometer (Gigahertz X1, Gigahertz-Optik GmbH, Türkenfeld, Germany).
At the V1 stage (first fully developed leaf), 10 and 9 representative seedlings from each genotype from the cold and the control treatment, respectively, were transplanted to the greenhouse for recovery (Figure S3 includes a more detailed experimental design). To allow monitoring plant water use (WU), pots were covered with transparent plastic sheets to minimize evaporation of water from the substrate. The substrate water content in the pots was measured gravimetrically and adjusted to an estimated [35] water potential of −3 kPa by weighing the pots and re-watering two to three times per week. At the V5 stage, the fresh weight of one representative plant per genotype was determined to correct for the required amount of water to be added to keep the soil water content constant.
In the greenhouse, environmental conditions were recorded at plant level using three environmental stations equipped with a temperature and humidity sensor (SHT31-DIS-B, Sensirion, Sensirion AG, Zurich, Switzerland) and a quantum sensor (LI-190, LI-COR, Inc., Lincoln, Nebraska). Their position was continuously adjusted to plant height during the experiments.
The two treatments were performed at different times of the year: between July and September for the cold treatment and between September and December for the control treatment. The recovery period took place in the greenhouse following both treatments. Control plants experienced approximately 3 °C lower average daytime temperatures and ca. 7 mol m−2 d−1 lower daily light integral (DLI) values compared with those experienced by the cold-treated plants in the greenhouse (Figure S2C).

2.3. Phenotyping

We monitored developmental stages from emergence to the V8 stage (eight fully developed leaves). Growth duration was scaled to thermal time (Growing Degree Days, GDD), using the formula from Gilmore Jr. et al. (1958, [36]) with a base temperature of 10 °C.
To assess the cold tolerance level of the genotypes, first we visually ranked them based on their respective seedling leaf appearance after 30 days in the cold. The visual scoring of seedlings included leaf greenness and the level of cold damage to the leaves at the V1 stage: 1 = white leaves and/or leaf necrosis, 5 = green leaves and less pronounced cold damage. Description of the visual scoring is to be found in Figure S4. Subsequently, we defined four cold tolerance categories combining the average colour score per genotype and their respective survival rates (Figures S4 and S5). Survival rates were calculated as the percentage of surviving seedlings from the cold treatment up until two weeks of recovery (Figure S5).
Morphological plant traits were measured at harvest (the V8 stage) using a ruler: plant height (PH, measured from the first internode to the ligule of the youngest leaf; Lbl, blade length; Lshl, sheath length; L8_wd, leaf 8 width; and Il, internode length). Maximum internode diameter (maxID) was measured using a calliper. Leaf area (LA) was measured for the first eight fully emerged leaves using a leaf area meter (LI-COR Model 3100C, LI-COR, Lincoln, Nebraska). Numbers of tillers and visible and initiated leaves were counted at harvest. The fresh weight (FW) of leaves, stems, and tillers was determined at harvest, and root fresh weight was determined after root systems were washed and blotted dry. The dry weight (DW) of all organs was determined after drying in an oven at 65 °C until a constant weight was reached. Specific leaf area (SLA) was defined for the eight fully emerged leaves, excluding plants with three or more missing leaves, mainly due to senescence (Figure S6). Values of SLA are presented separately in Figure S7.
At the V8 stage, indices correlating with anthocyanin (FERARI index; [37]), epidermal flavonol (FLAV index; [38]), chlorophyll (SFR index; [39]), and nitrogen (NBI index; [40]) content were obtained using a Multiplex UV-VIS fluorometer (FORCE-A, Orsay, France).
We determined seed density based on weight and volume measured using the fully automated PhenoSeeder system [41] for at least 28 replicates per genotype.

2.4. Statistical Analysis

Data analysis was performed using RStudio (version 4.2.2, R Core Team 2021). We checked the data distribution for normality using histograms, QQ plots, and the shapiro.test function (‘stats’ package, version 4.2.2; [42]), and used the leveneTest function (‘car’ package, version 3.1.2; [43]) to check for homoscedasticity. We performed a two-way ANOVA (Table S1) to test the effect of the treatment and the genotype on different plant traits and to retrieve the generalized eta squared (ges) effect size. A type III ANOVA test was applied because of the unbalanced design due to the different number of surviving plants, using the anova_test function (‘rstatix’ package, version 0.7.2; [44]). We computed estimated marginal means with a 95% confidence interval using the ‘emmeans’ R package (version 1.9.0; [45]) as a post-hoc test.
Correlations were calculated with a 95% confidence interval (‘Hmisc’ package, version 5.1.1; [46]) and correlation plots were obtained using the ‘corrplot’ package (version 0.92; [47]). Principal component analysis (PCA) was performed using the prcomp function (‘stats’ package, version 4.2.2; [42]).
Genotypes with missing values for all plants for a specific trait, without replicates (B73) or missing observations (PE0328) under a treatment were excluded from the statistical tests.

3. Results

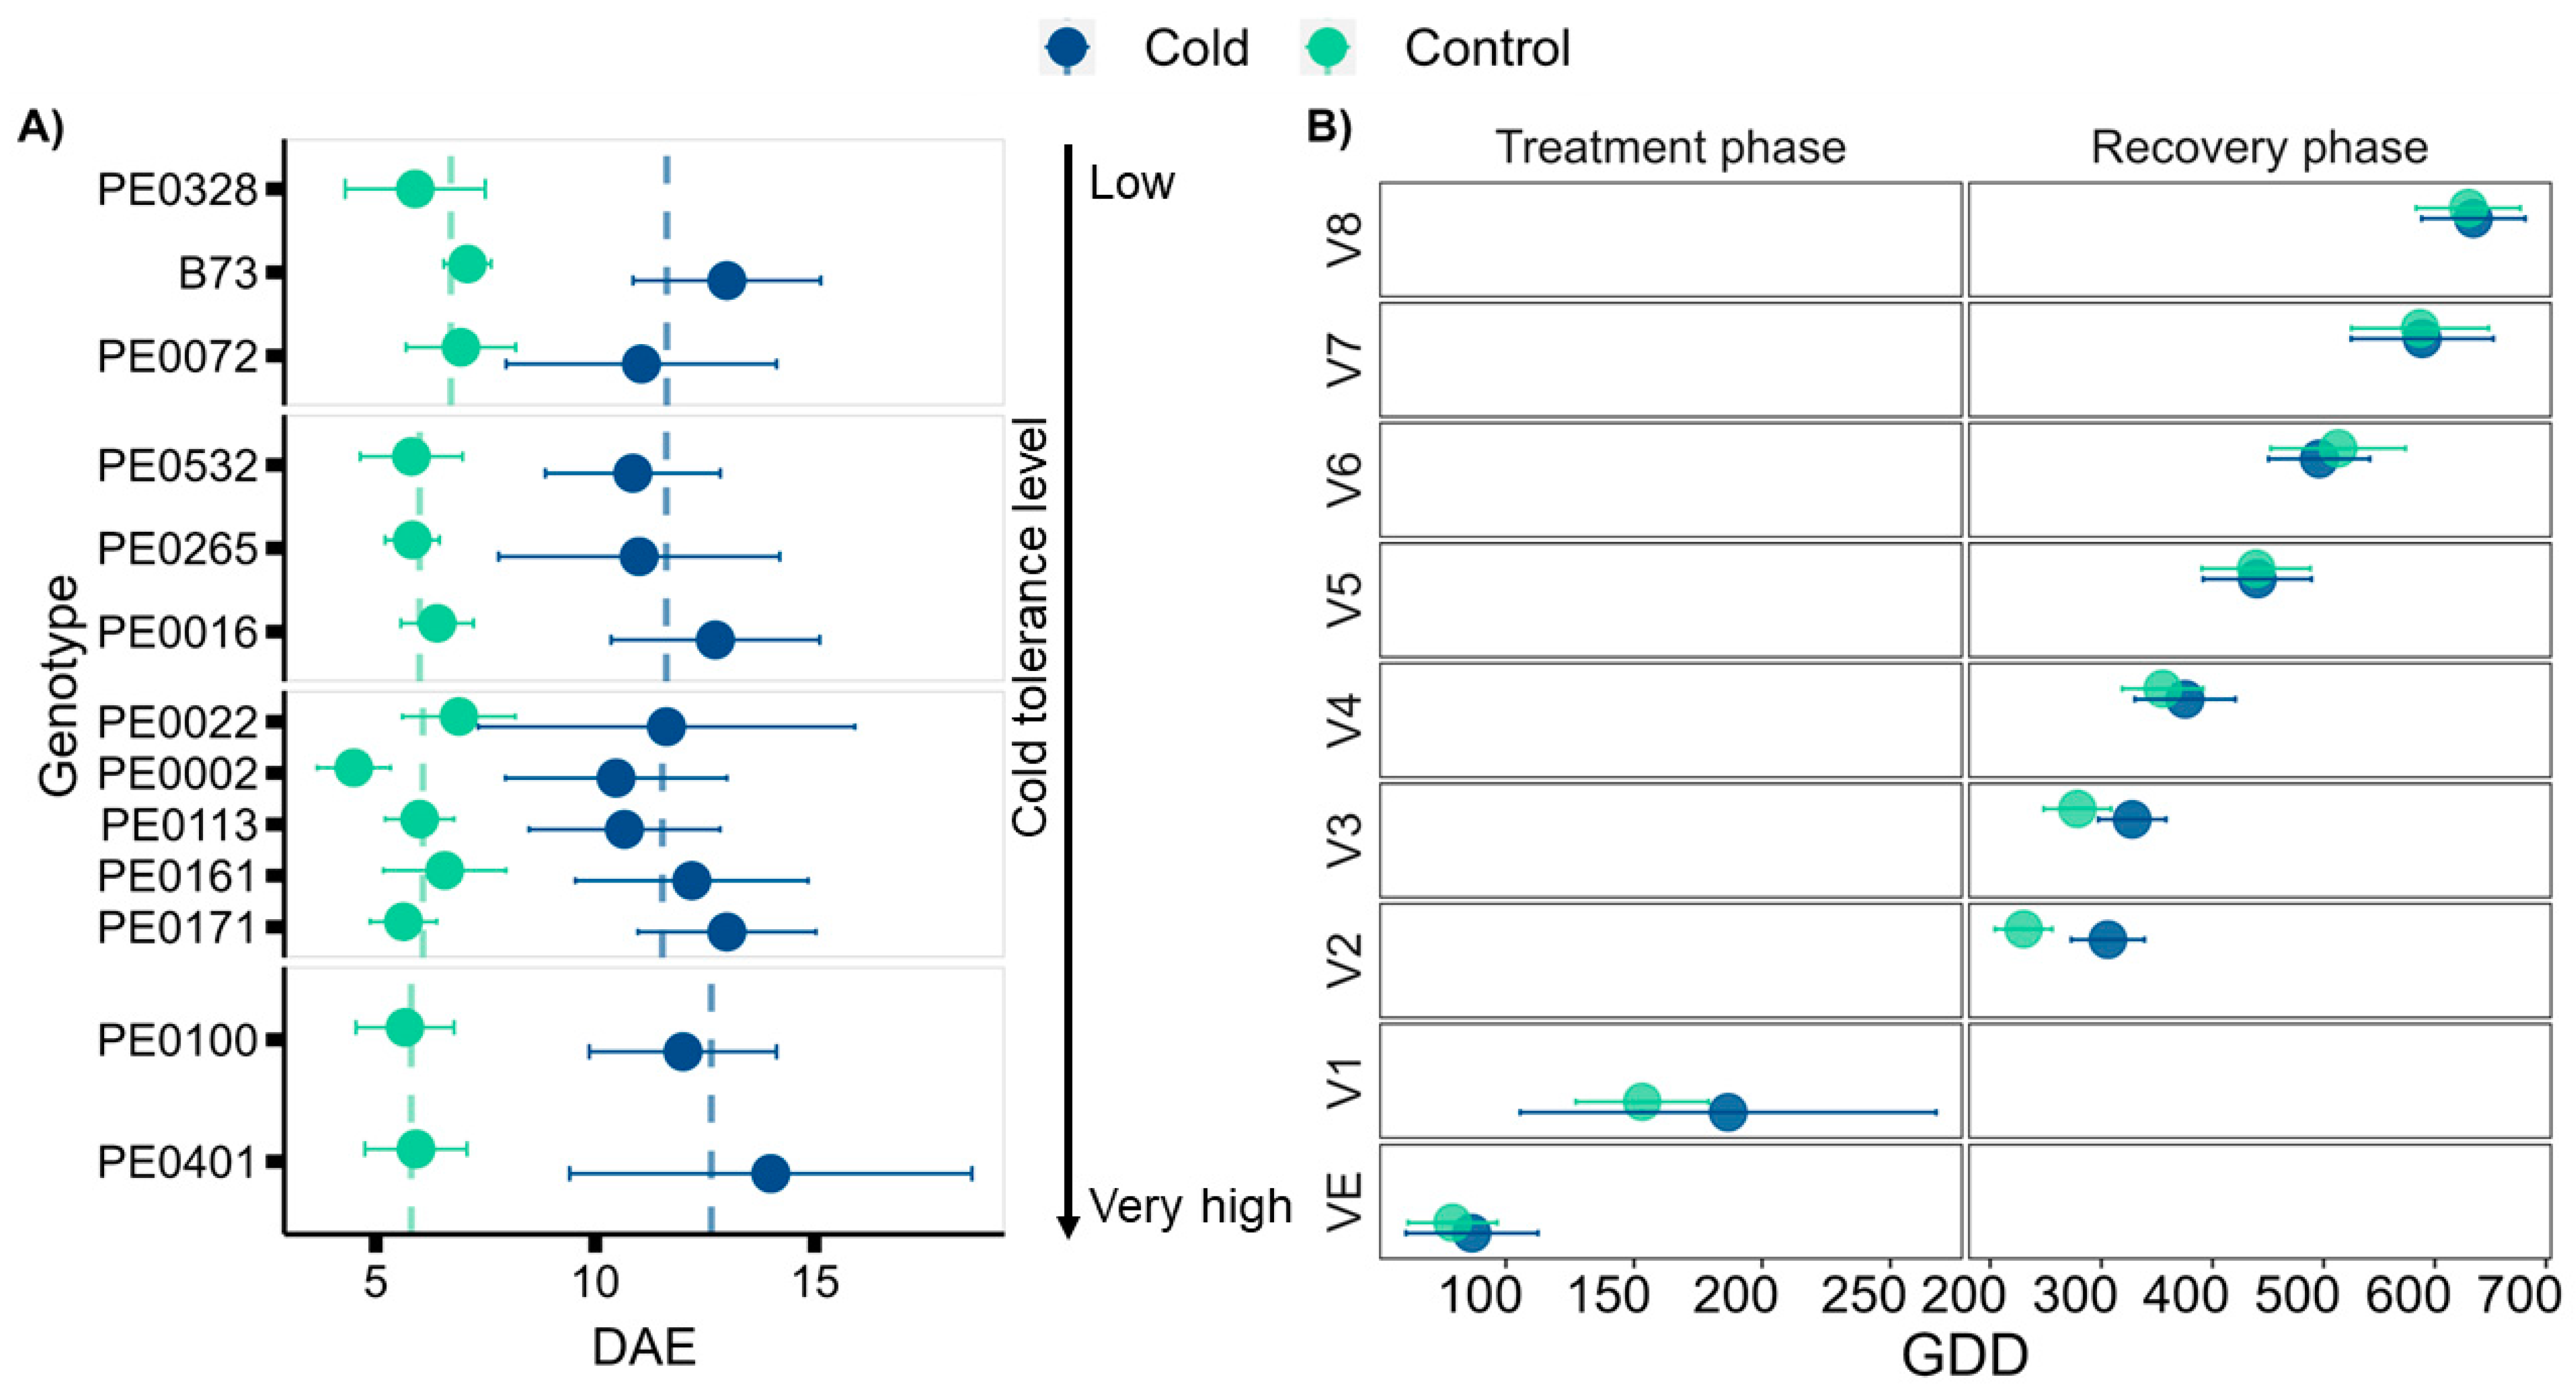
3.1. Seedling Cold Tolerance Depends on the Genotype

The cold treatment affected genotype performance to different extents (Table 1). During the low-temperature treatment, cold stress symptoms on leaves varied among genotypes. After the seedlings were transferred to the greenhouse, seedling death was tracked up until two weeks through the recovery phase and survival rates ranged from 10% to 100%. The cold sensitive dent inbred line B73 confirmed the effectiveness of the cold treatment, with only a single surviving seedling during the recovery period from cold, and severe cold damage to the leaves (Figure S4). The timeline of seedling death following the cold treatment can be found in Figure S5.
Cold tolerance levels are defined as follows; Low: genotypes with survival rates lower than 50% and colour scores = 1–2; Medium: survival rates higher than 50% and lower or equal to 80% with colour scores = 2–3; High: survival rates between 80% and 90% with colour score = 3–5; Very high: 100% survival rate with colour score = 3–5. PE0328 was not transplanted from the cold treatment and PE0085 was not transplanted following both treatments because of the insufficient number of fit seedlings.
We identified two genotypes that were able to withstand the cold treatment, namely PE0401 and PE0100. These genotypes showed little to no cold damage to their leaves (Figure S4), coupled with the survival of all transplanted seedlings following the cold treatment.

3.2. Early Cold Stress Delays Vegetative Development during and after Exposure

Emergence rates ranged between 75% and 100% for all genotypes and were not significantly different between treatments (Figure 1). Cold exposure did however affect leaf development during and following the cold treatment. The V1 stage was reached at comparable DAE under cold conditions for all genotypes, except for the very highly cold-tolerant ones, which required a longer time (Figure 1). Overall, there was an average delay of ca. 34 GDD (six days) after emergence to reach the V1 stage due to low temperatures (ptreatment, pgenotype, ptreatment*genotype < 0.001). The large error bars do, however, indicate a large variability in this response.
During the recovery period in the greenhouse, the first two weeks were decisive for the survival of plants, irrespective of cold tolerance; the time required for seedlings to die was not directly linked to their cold tolerance score, nor to the genotype (Figure S5). Seedlings of the genotypes with “very high” cold tolerance (Table 1), PE0100 and PE0401, were the exception as they all survived.
The development of the second to the fourth leaf at the beginning of the recovery phase after the cold treatment was delayed (Figure 1B). The reason may be that those leaves were already visible at the V1 stage under cold. On the other hand, thermal time to reach the V8 stage at the end of the recovery period was only five GDD longer for cold-treated plants compared with control plants (Figure 1B).
At the V8 stage, all leaves were initiated, and the tassel was visible, which means that floral transition had already occurred at earlier vegetative stages. Tassel size varied among and within genotypes at the same vegetative stage (Figure S8A), except for PE0171 and PE0265, indicating different development among genotypes (p < 0.001; Figure S8B).

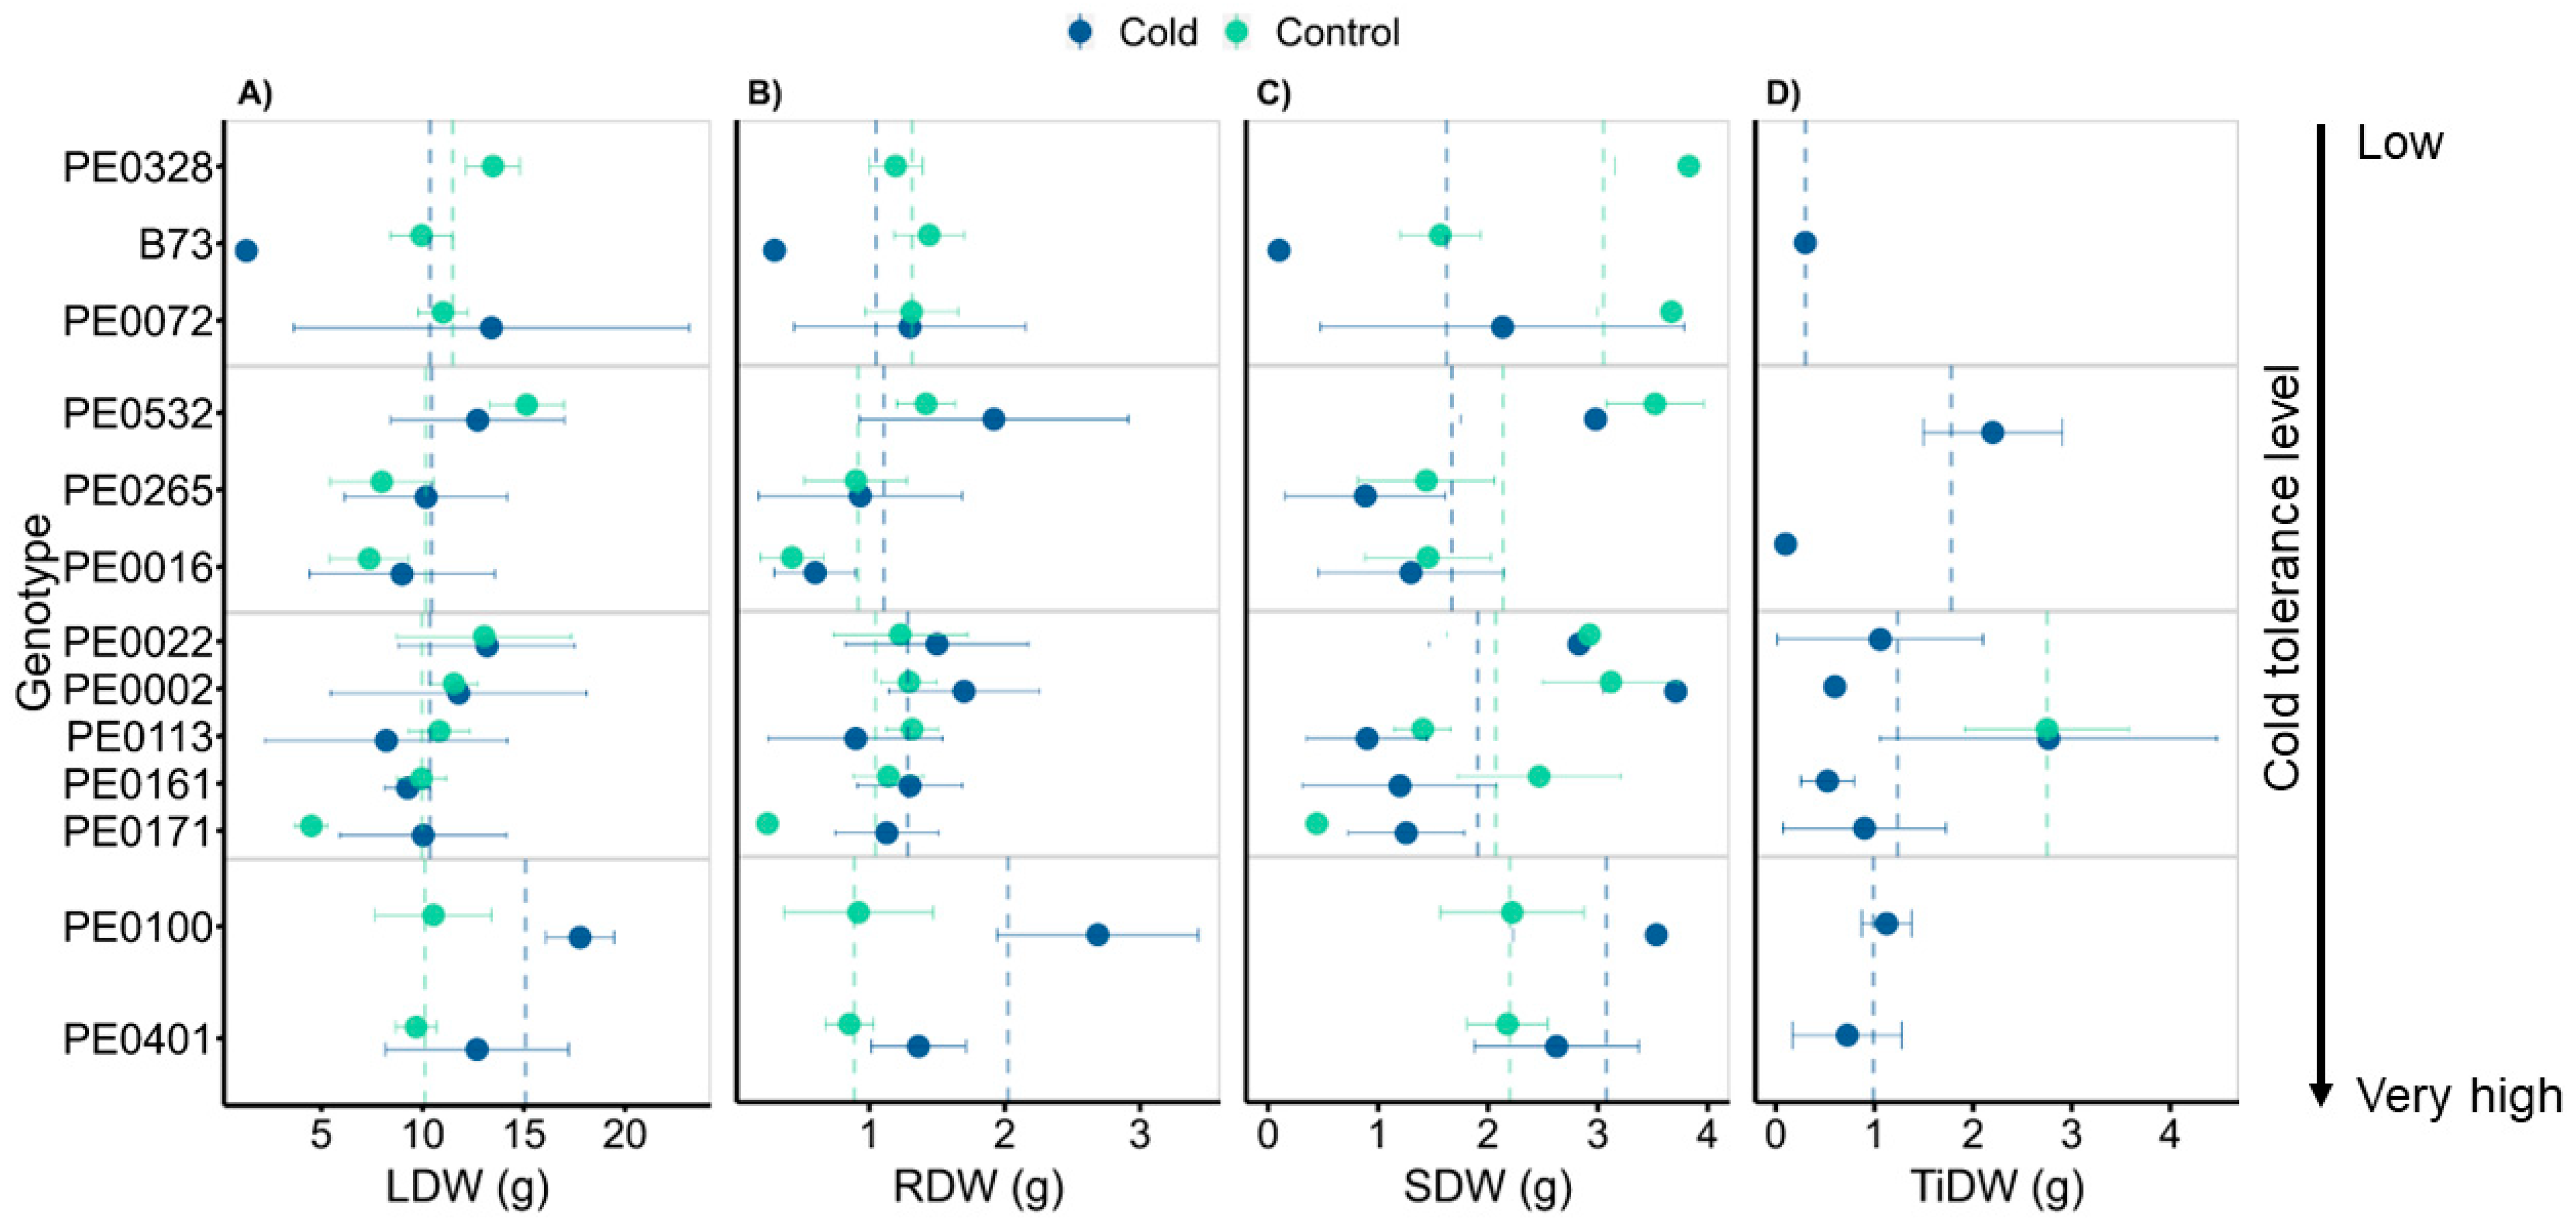
3.3. Genotypes Differed in Biomass following Cold Exposure

Cold-treated plants compensated for the delayed development by reaching the V8 stage at similar GDD values compared with control plants. We assessed whether the effect of early cold exposure on other traits persisted until the V8 stage.
The shoot and root biomass of plants of the two intermediate cold tolerance categories were virtually unaffected by the treatment at the V8 stage. Despite the highly cold-tolerant PE0161 and PE0171 having similar values for root (p > 0.05) and shoot (p > 0.05) biomass during and following the cold treatment, they responded differently to the control treatment. For PE0171, we observed the lowest biomass of all plants following control treatment and 58% and 78% lower shoot and root biomass for cold and control, respectively. PE0161 plants, on the other hand, responded to the control treatment with an increased stem biomass (p < 0.01), while maintaining similar leaf (p > 0.05) and root (p > 0.05) dry matter content.
The dry matter content of all organs was influenced by the environment, with highly significant interactions between the treatment and the genotype factors for leaves (ptreatment*genotype < 0.01), roots, and stems (ptreatment*genotype < 0.001). Reduced biomass following the control treatment was observed for one of the most cold-tolerant genotypes: PE0100 accumulated 50% more leaf and stem biomass and a twofold higher root biomass (p < 0.001) at the end of recovery from cold compared with the control (Figure 2).
Total shoot biomass included leaf, stem, and tillers. Tillering was absent at V8 in the control treatment, except in PE0113 (Figure 2). All genotypes formed tillers upon cold exposure, which increased their shoot biomass (ptreatment = 0.015; pgenotype; ptreatment*genotype < 0.001). In contrast, root mass fraction after cold was either equal or higher than that of the control treatment. Figure S9 includes mass fraction data for all genotypes and treatments.
The cold sensitive genotype, B73, was the most affected by the early cold treatment: biomass of the single surviving plant was 8 and 9 times lower for root and shoot, respectively, compared with control plants (Figure 2).

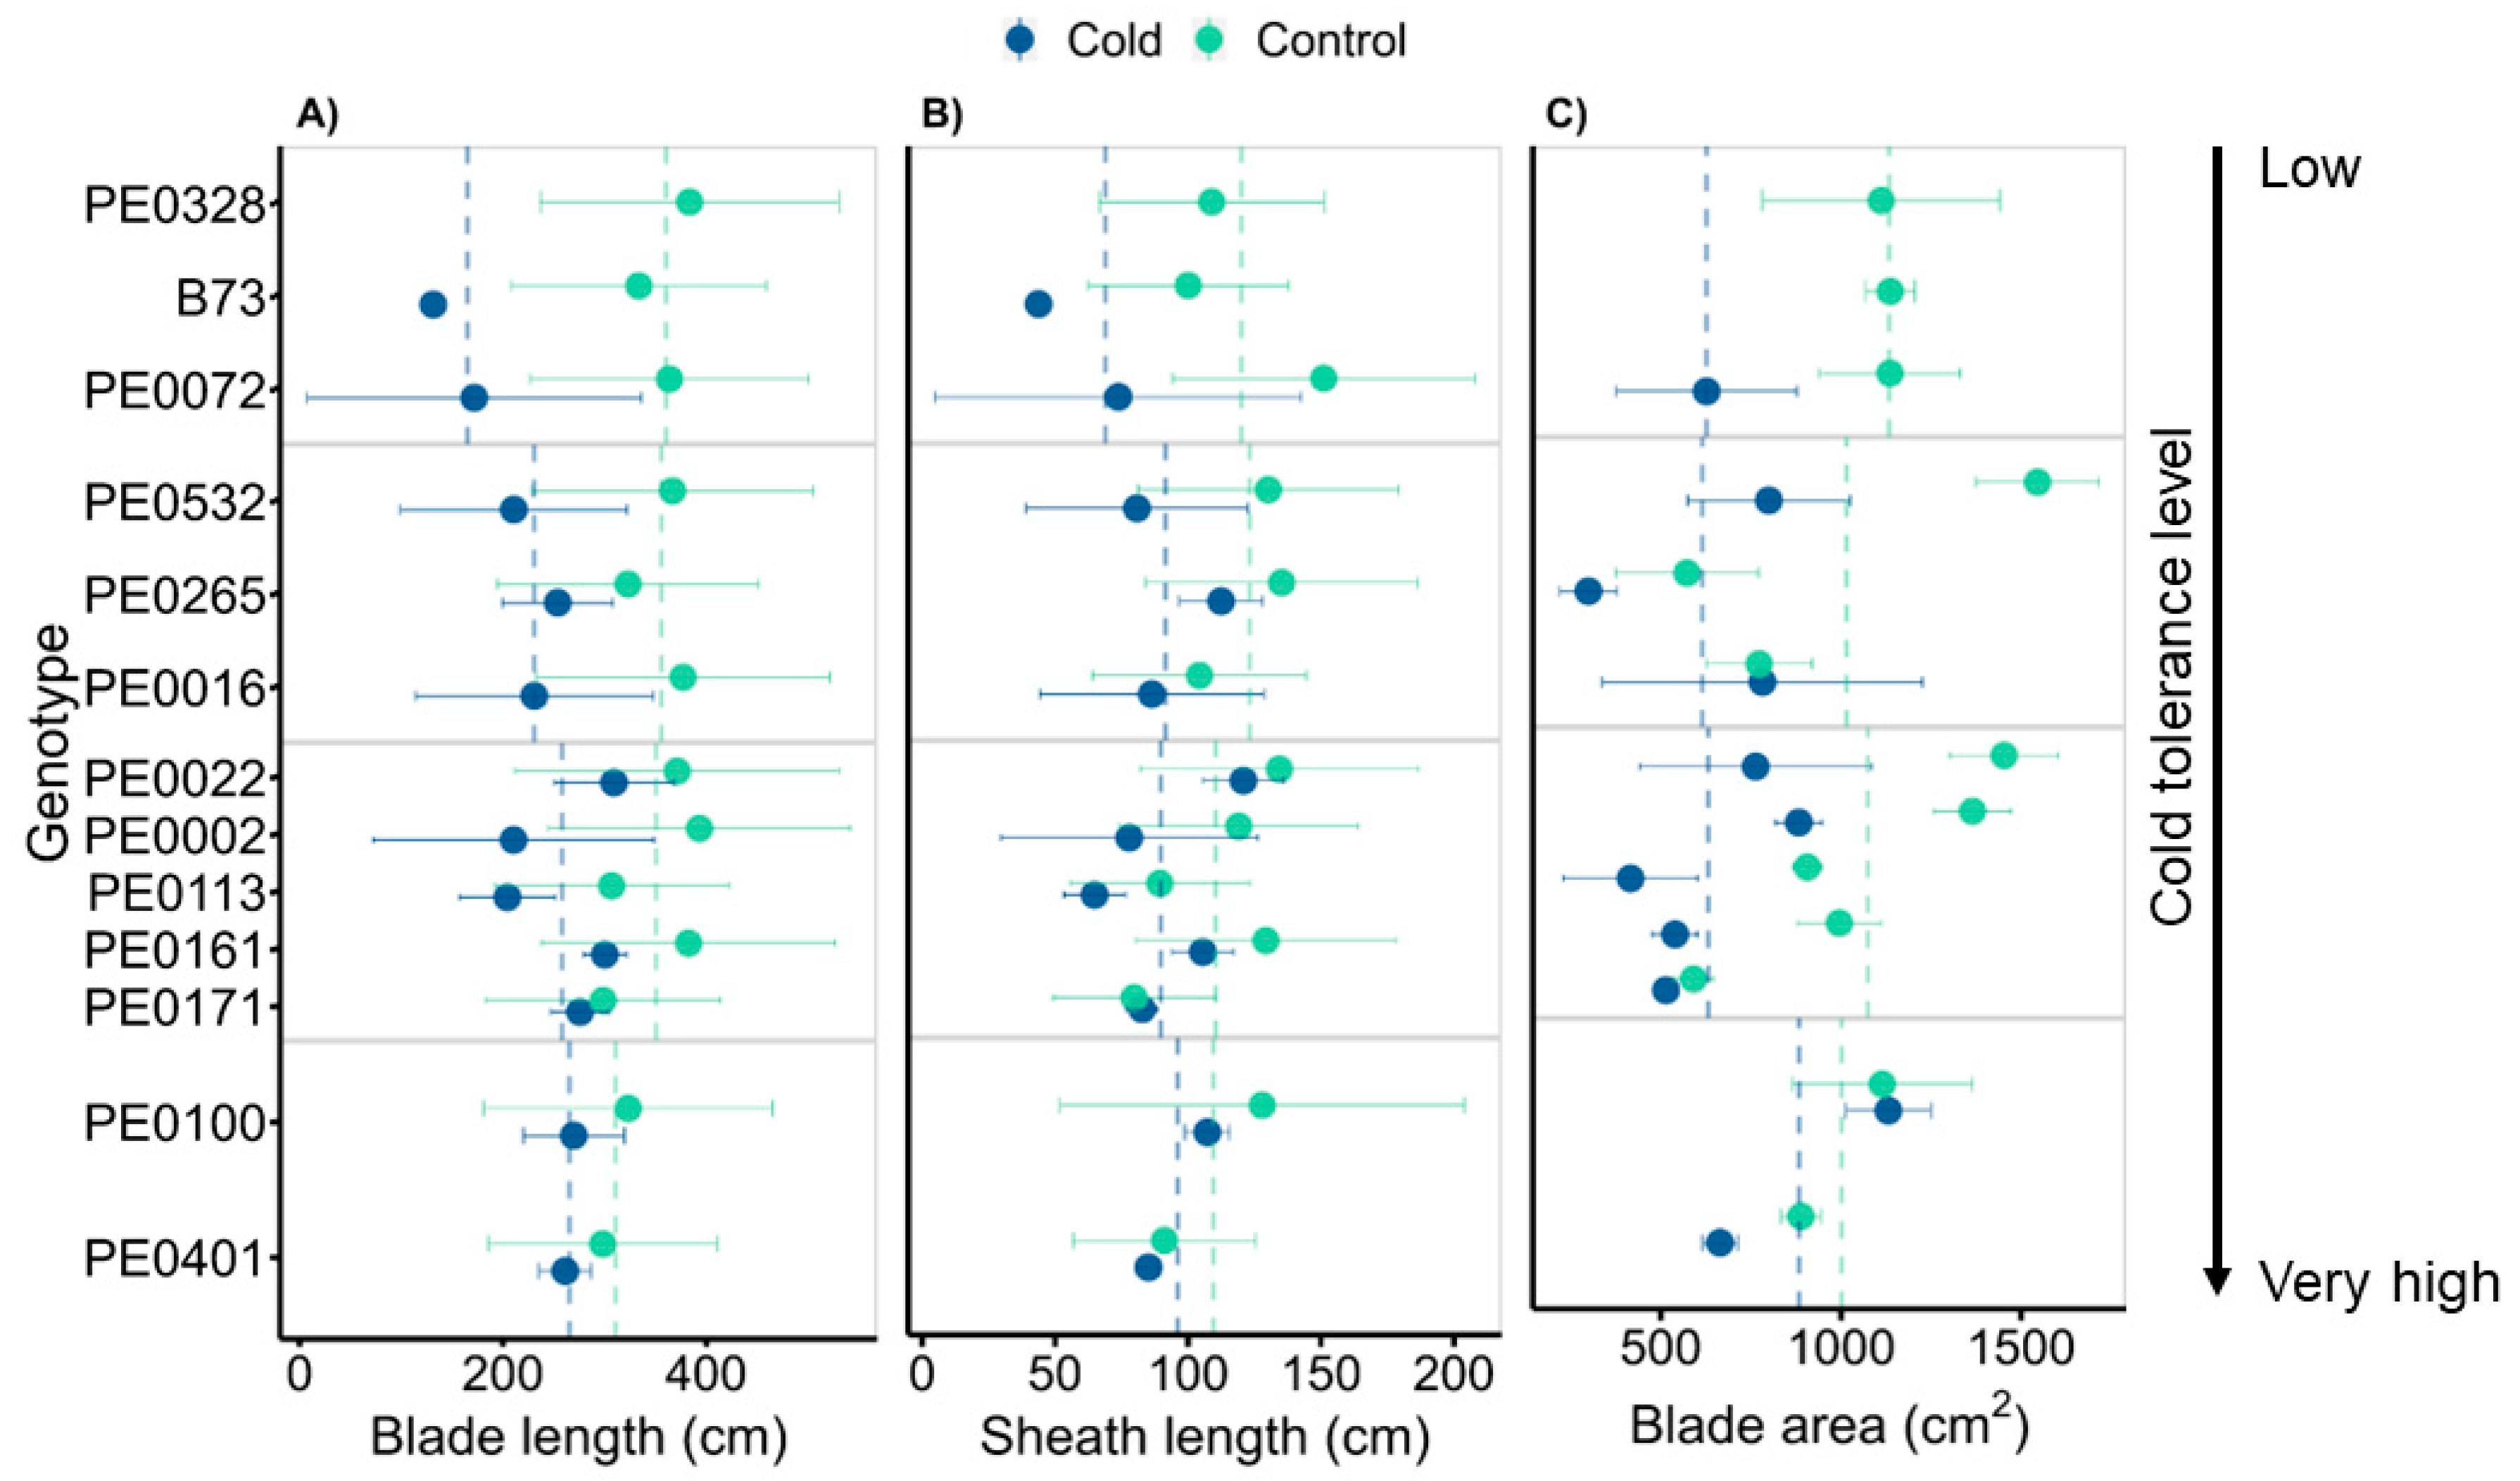
3.4. Genotypes Vary in Leaf Morphology Adjustment

The observed reduction in biomass from cold to control treatment among genotypes was the highest for PE0171 and PE0100 (Figure 2). Leaf length and area of both genotypes were, however, comparable (p > 0.05) under both treatments (Figure 3). By contrast, PE0161 significantly doubled its leaf area (p < 0.001) by the end of the control treatment, which may explain the similar leaf biomass (p > 0.05) between the two treatments for this genotype.
We observed a trend of increasing differences in leaf phenotypes between treatments as cold tolerance decreased. Accordingly, the treatment factor had a significant effect on both blade (ptreatment < 0.001) and sheath length (ptreatment < 0.001) without a significant interaction with the genotype, whereas the genotype factor had no significant effect on leaf blade length (p > 0.05; Table S1). By contrast, a significant interaction (ptreatment*genotype < 0.001) between treatment and genotype factors was observed for leaf area with significant main effects (p < 0.001). Blade area, nevertheless, changed the least for the “very high” cold-tolerant (Table 1) group (PE0100 and PE0401). The specific leaf area of the first eight leaves at harvest (Figure S7) remained larger for cold-treated plants compared with the control, except PE0072.

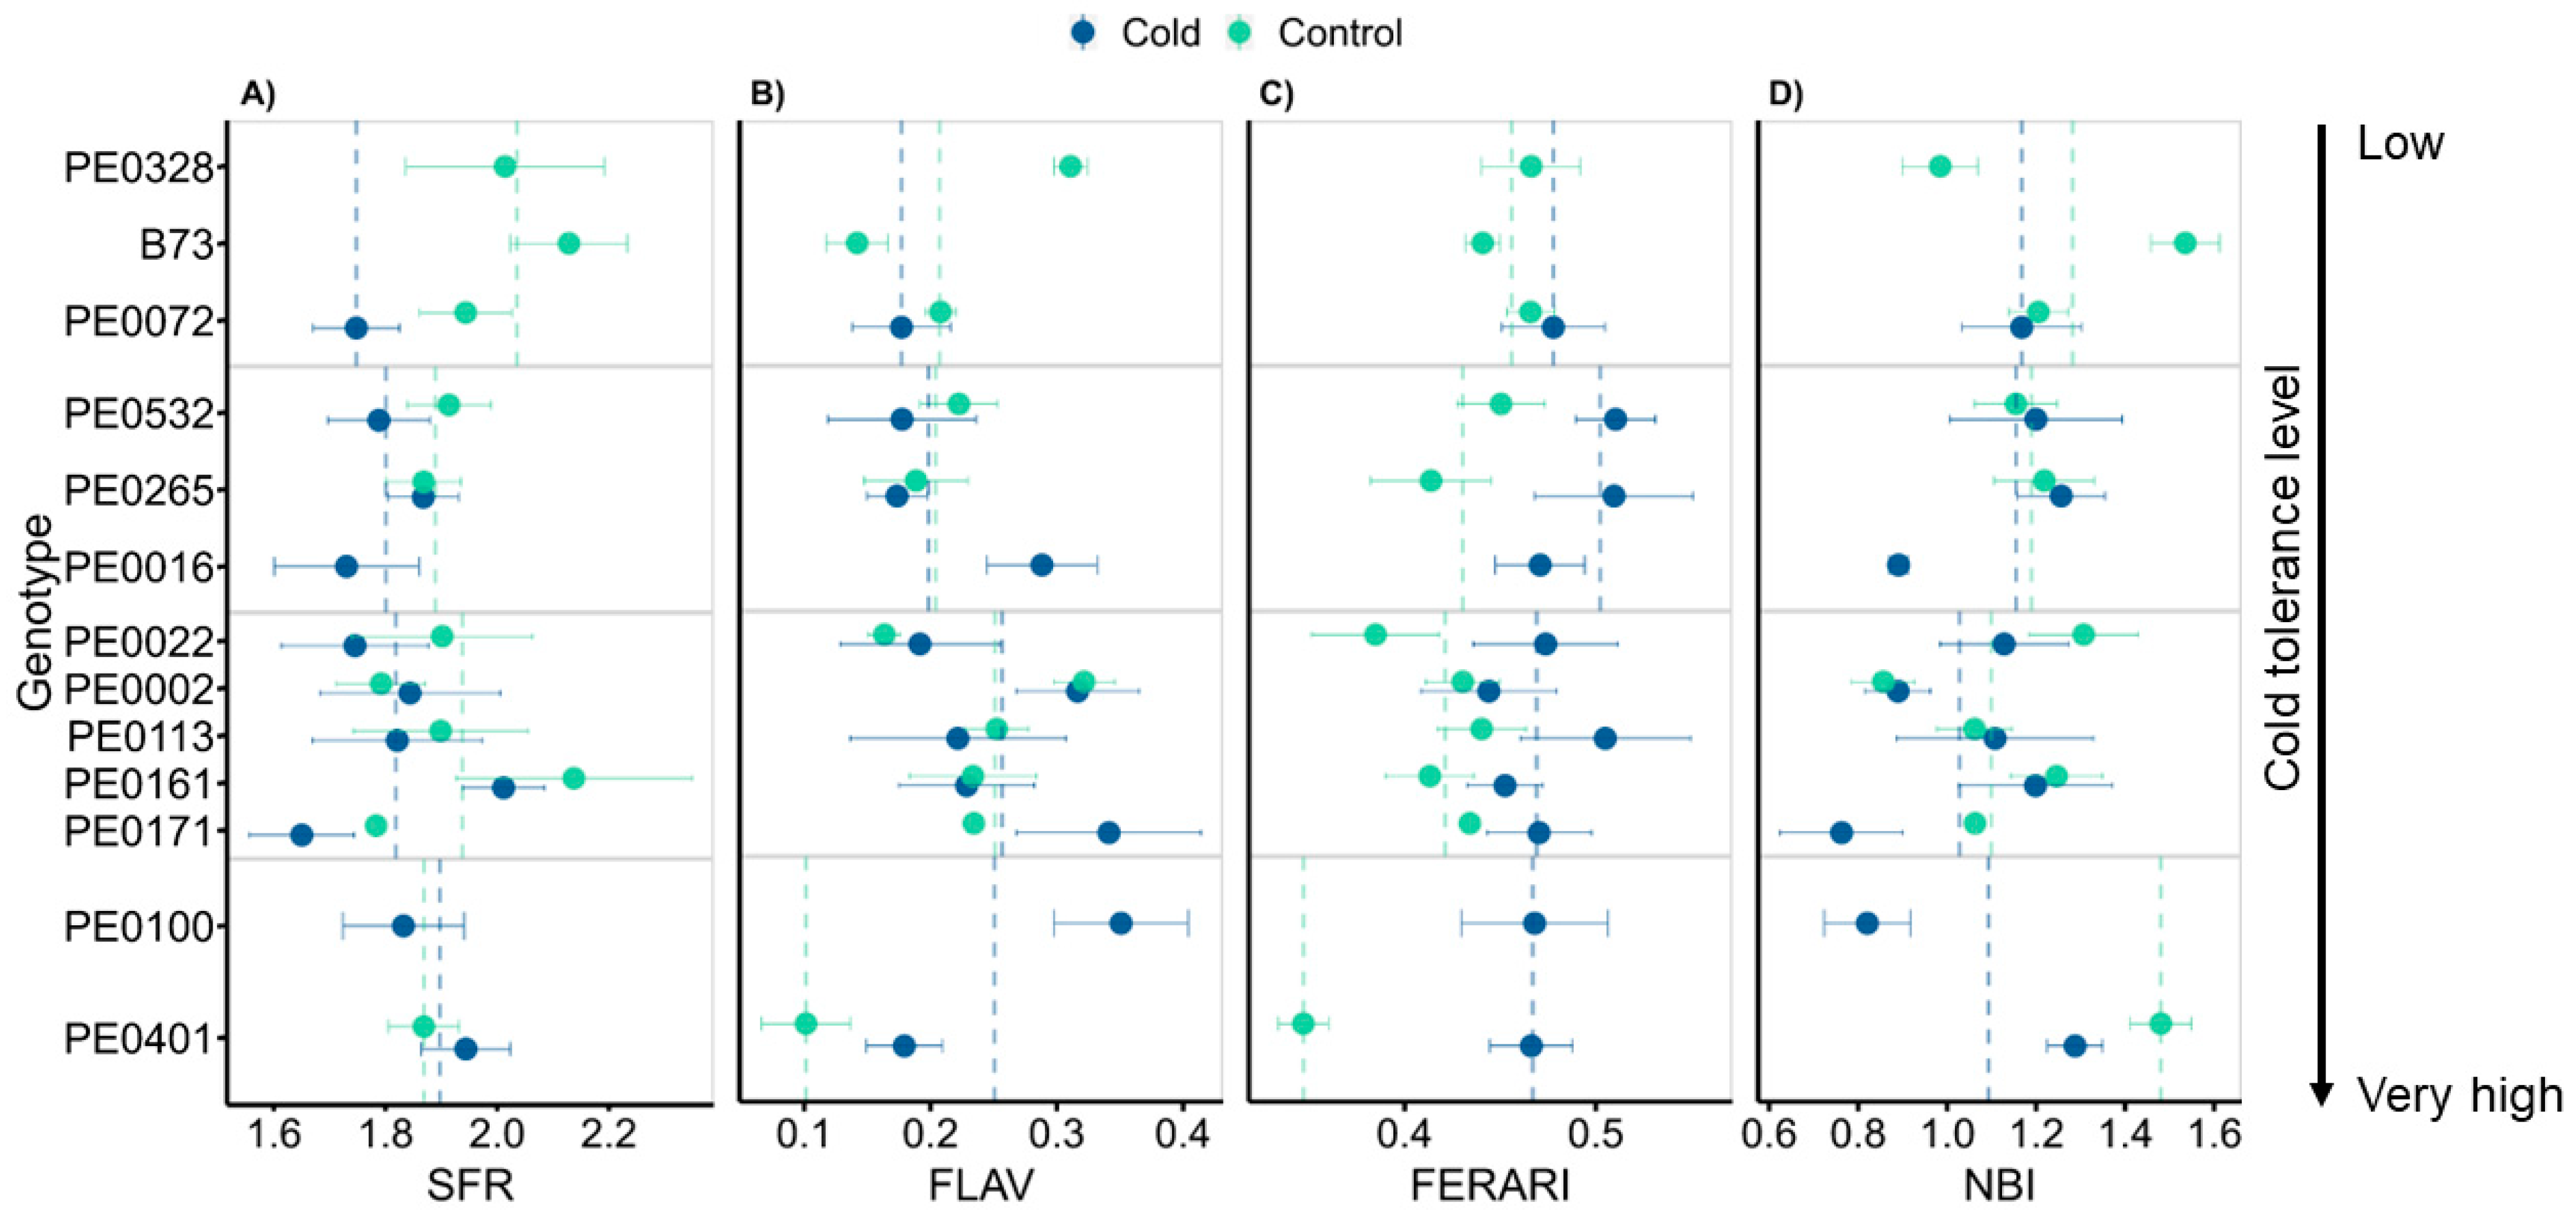
3.5. Leaf Optical Properties Changed Only Marginally between Growth Conditions

We evaluated whether spectral measurements at the level of individual leaves could be used to characterize the recovery from cold exposure. To this end, we measured leaf 8 optical properties (Figure 4).
We did not observe any significant (p > 0.05) interaction between the treatment and genotype factors on the acquired spectral indices, except for the FERARI index (ptreatment*genotype < 0.001). The SFR index, which correlates positively with chlorophyll content [39], was significantly affected by both the genotype (pgenotype < 0.001) and the treatment factors (ptreatment < 0.01). The effect size of the interaction between genotype and treatment on SFR (ges = 0.41) was larger than that of treatment (ges = 0.08), which was observed as a slight increase (albeit not significant) in SFR (PE0401), comparable values (PE0002), or a decrease (PE0072) from cold to control.
Statistical tests only showed a genotype effect on FLAV (pgenotype < 0.001), but not treatment (ptreatment = 0.43). Anthocyanin content may increase in stressed leaves to protect from abiotic or biotic stress and was found to correlate with the FERARI index in grapes [37]. This index was significantly different between the two treatments (ptreatment <0.001) for all genotypes included in the statistical analysis, except for PE0072, PE0171, and PE0002. Overall, plants from the control treatment had lower FERARI index values than cold-treated plants, suggesting lower anthocyanin contents. The difference was particularly large for the “very high” cold-tolerant PE0401 (Table 1), which also had a lower FLAV index (epidermal flavonol) under the control treatment. Other observations for PE0401 already indicated that it was the genotype least influenced by the early cold treatment, which was further supported by high NBI index values following cold. The NBI index, which relates to nitrogen content [48], was significantly affected by treatment (ptreatment = 0.02), and a decreased value (p < 0.05) was observed in cold compared to the control in PE0171 and PE0022. Following the control treatment, B73 had the highest NBI index, followed by the highly cold-tolerant PE0401.

4. Discussion

4.1. Genotype Cold Tolerance

Based on Frey et al. (2020, [8]), we selected six genotypes in our study characterized by a cold tolerance level from “high” to “medium”, as follows: PE0161, PE0328, PE0002, PE0100, PE0265, and PE0022. Remarkably, PE0328 was one of the least cold-tolerant genotypes in our study and plants were not fit to be transplanted after the cold treatment. PE0265 and PE0022 were not the least cold-tolerant, and PE0100 was one of the most cold-tolerant genotypes in our experiments. These discrepancies are likely due to the difference in traits measured to define cold tolerance, namely, the ratio of primary root growth rate under cold and control in Frey et al. (2020, [8]) and damage on seedling leaves and survival rates from cold in our study. Moreover, previous experiments were performed in growth media other than soil substrate and observations were made on younger seedlings. In addition, the daytime temperature treatment applied in Frey et al. (2020, [8]) was lower than in our experiments (16–12 °C versus 20–12 °C (day–night) in our treatment). Consequently, the extended exposure in our study (30 days from sowing until the V 1 stage, versus two days after seedling establishment [8]) resulted in more severe effects, leading to seedling death. The duration of the cold treatment influences the extent to which plants respond to the low-temperature stress [49]. The paper assay experiment (Figure S1) further supports these findings. After a one-week exposure to 16–12 °C (day–night) after emergence, PE0401 was significantly different from PE0016 and PE0171 in shoot dry weight and total root length, respectively. Nonetheless, PE0016 and PE0171 exhibited a higher root and shoot growth, respectively, compared with other genotypes. In our study, these two genotypes ranked average among all genotypes during the cold treatment and recovery period, where we measured root and shoot traits.

4.2. Plant Development

In our findings, survival rates were partially indicative of cold tolerance levels. Suboptimal temperatures reduced survival of maize seedlings [50], yet 100% of the “very high” cold-tolerant PE0100 and PE0401 seedlings in our study survived the cold treatment (Table 1). The development of the first leaf of these two genotypes was nevertheless delayed under cold temperatures.
The vegetative stages subsequent to the cold treatment were delayed, and the thermal time was only comparable between the two treatments from the fifth leaf onwards. Sowiński et al. (2005, [51]) reported a similar response in maize leaf development during recovery from cold. This delay could be partly explained by the emergence of two to four leaves during our cold treatment. Suboptimal temperatures have also been shown to reduce the leaf growth rates of maize mainly via cell cycle impairment, which in turn affects cell and leaf growth [10,11,12,13]. Riva-Roveda et al. (2016, [13]) explained the quick resumption of growth at recovery of cold-stressed maize after a seven-day cold treatment of either 10–4 or 10–7 °C (day–night) by the presence of transcription factors of two genes related to expansins. The authors suggested that cold-stressed maize plants may go into a ‘standby mode’, and that growth can be resumed once recovery conditions were established.
Vegetative and reproductive development were both affected by cold as floral transition of cold-treated plants was delayed, hence the observed positive correlation between tassel fresh weight and both seedling survival after cold exposure and the ratio of visible to initiated leaves (Figure S10). This observation indicates that genotypes with higher cold tolerance were able to accelerate leaf development after cold exposure until reaching the reproductive stage. Heterogeneity in tassel emergence for plants that have experienced cold temperatures because of early sowing was also observed in the field [20].

4.3. Relationship between Leaf Acclimation and Biomass Allocation following Cold and Control Treatments

Our results showed a significant effect of the cold treatment on leaf blade and sheath length, similar to prior findings [13]. In the field, early sowing was concomitant with lower apex temperatures, which resulted in reduced leaf area and sheath and blade length [20].
Leaf morphological adjustment following the control treatment and biomass accumulation seemed related. Even if PE0161 and PE0171 had similar biomass values after the cold treatment, PE0161 accumulated more in the control treatment. In parallel, PE0161 increased leaf length and area following the control treatment, while PE0171 did not.
We observed less differences in leaf morphology between treatments as the cold tolerance level increased. On the other hand, the highest cold-tolerant genotypes that were cold treated had a higher dry matter content at the V8 stage compared with the control. We noted that the recovery conditions from cold were 3 °C warmer and had 7 m−2 d−1 higher DLI, which may have contributed, to a certain extent, to the reduction in biomass at the end of the control treatment. The most pronounced biomass difference between cold and control at the V8 stage was observed in PE0100, which may hint that this genotype is comparatively sensitive to changes in light and temperature. Zheng et al. (2022, [52]) found that low light conditions imposed by high density planting caused a reduction in leaf thickness, thus an increase in SLA, in maize. Nevertheless, reduced temperature and light conditions can induce contrasting responses in plants [53]. The smaller SLA following the control treatment may therefore have been a consequence of comparatively lower temperatures rather than of a lower PPFD. The genotype PE0100 may therefore have been more responsive to a 3 °C drop in air temperature than to an approximate 50% drop in DLI.
Root biomass allocation was also equal or larger for genotypes that were exposed to cold in comparison with the control (Figure S9). This response could be due to a faster resumption of growth of the root compared with that of the shoot once recovery conditions were imposed [51]. Walne and Reddy (2022, [54]) demonstrated that root growth has a lower temperature threshold compared with shoot growth, which results in a higher root mass fraction (RMF) under suboptimal temperatures than under warmer conditions. The authors hypothesize a possible lower demand of the shoot for photoassimilates as growth declines under low temperatures, or dry matter allocation to the roots may increase. The latter may compensate for the cold-induced reduction of water uptake, as previously observed in winter wheat [55].
An element that contributed to higher shoot biomass for plants grown under early cold temperatures is the presence of tillers. Except for PE0113, other plants did not form tillers during the control treatment, which was followed by lower temperature and DLI compared with the cold treatment (Figure S2). As reviewed by Rotili et al. (2021, [56]), tillering can be suppressed by (1) low temperatures reducing carbon allocation to leaf axillary meristems, which lowers secondary shoot growth (tillers), and (2) low light, which triggers shade avoidance syndrome, leading to taller plants, higher SMF, and longer internodes. However, we suggest that tillering after cold treatment may have been a direct response to low-temperature stress.

4.4. Leaf Optical Traits Relate to Cold Recovery

Early exposure of maize to suboptimal temperatures by means of controlled environments or early sowing can decrease leaf nitrogen content [57]. To test if the cold temperature effect on nitrogen content persisted until harvest, we measured the NBI index, which correlates with nitrogen content in leaves [40]. We found comparable NBI index values at the V8 stage between treatments for most genotypes. The highly cold-tolerant genotype PE0100 showed one of the lowest NBI values and the largest rooting system among genotypes, which may signify a higher nitrogen allocation to the belowground organs. Moreover, NBI index values negatively correlated with the FLAV index in our findings (Figure S10). These results are corroborated by Cartelat et al. (2005, [58]), who found a negative correlation between leaf optical properties related to phenolic compounds and those related to nitrogen and chlorophyll content in wheat. On the other hand, we did not observe any significant correlation between chlorophyll (i.e., the SFR index) and the other measured indices. Nevertheless, there was a trend in increasing SFR index with cold tolerance level, with some exceptions. This trend may therefore reflect the ability of cold-tolerant genotypes to survive when their seedlings were greener and healthier under cold stress. The fact that the SFR values for PE0401, one of the most cold-tolerant genotypes, were comparable for both cold and control treatments is consistent with earlier findings [31,59]. Peter et al. (2009, [30]) has linked the ability of maize plants to sustain leaf greenness to seedling early vigour and biomass content during later growth stages.
The FLAV index also correlated negatively with the FERARI index (anthocyanin content) after cold exposure. Anthocyanins are involved in protection from photoinhibition under low temperatures [50] and can increase during cold exposure and recovery in maize leaf blades [60] and leaf sheaths [61]. This may explain why the cold-treated plants in our study showed significantly higher anthocyanin index values at the end of the recovery phase.

4.5. The Effect of Early Low-Temperature Exposure on Plant Performance during Recovery

Starting from seed traits to shoot growth, we observed a negative correlation between seed weight and plant and shoot dry weight following cold exposure. Peter et al. (2009, [30]) found a positive correlation between the seed weight and seedling shoot biomass of Flint Swiss landraces exposed to low temperatures in the field, whereas [59] found a weak relationship between these two traits. Yet the same study reported a negative correlation between thousand kernel weight and emergence rates, which we did not observe in our treatments.
Our genotype cold tolerance classification included survival rates from cold stress. At the V8 stage, the highly cold-tolerant genotypes had the highest root, stem, and leaf biomass compared with other genotypes. This is in contrast to previous studies, in which no substantial correlation was observed between seedling cold tolerance and biomass [26], nor final plant height [62] at harvest.
Flavonol, anthocyanin, and nitrogen content, as estimated by the FLAV, FERARI, and NBI indices, respectively, as well as SLA, were comparable between cold and control at the V8 stage for only one genotype (PE0072). Moreover, this genotype differed in chlorophyll content (i.e., SFR index) at the end of the two treatments. This low adjustment to the environment may be responsible for its classification in the “low” (Table 1) cold-tolerant category, along with B73. These responses are applicable to our results, irrespective of a possible effect of early cold stress on final SLA, because at least four leaves out of the eight included in the measurement had become visible during the recovery period in the greenhouse, and not during the cold treatment. The leaf morphology of PE0171 also did not acclimate to the recovery conditions in the two treatments, which is reflected in the phenotype consistency between the different environments.
An overall increase of over 40% in SLA versus a decrease of 50% in leaf area from cold to control indicates that an adjustment in leaf thickness, rather than in width, occurred in response to the cold treatment compared with the control.

5. Conclusions

We conclude that final dry matter accumulation for maize can be qualitatively projected, to a certain extent, based on seedling performance under a prolonged low-temperature exposure. However, cold tolerance in maize is a complex trait which goes beyond cold survival. Genotypic differences in low-temperature conditions are not only relevant during a cold stress phase, but also during the following recovery period. Other suboptimal environmental factors occurring during recovery may offset the comparatively higher performance of cold-tolerant genotypes at the seedling stage. The selection for high-yielding, cold-tolerant genotypes should take these aspects into account. The highly cold-tolerant genotype PE0401 which we identified in our work also showed a consistent performance under tested conditions. Therefore, it is a suitable candidate for future trials to improve cold stress tolerance.

Supplementary Materials

The following supporting information can be downloaded at: https://www.mdpi.com/article/10.3390/agronomy14030408/s1, Figure S1: Root and shoot traits from a phenotyping experiment of 423 DH lines; Figure S2: Environmental conditions recorded during the treatment in the growth chamber and the recovery in the greenhouse; Figure S3: Description of the experimental steps of the cold and the control treatments; Figure S4: Classification of genotype cold tolerance level based on seedling appearance after exposure to cold temperatures in the growth chamber and survival rates of seedlings upon two weeks under recovery conditions in the greenhouse; Figure S5: Timeline of seedling death during the recovery phase after the cold stress treatment; Figure S6: Number of completely senesced leaves by the time of harvest (V8) for the cold treatment and the control treatment; Figure S7: Specific leaf area of the first eight fully developed leaves calculated at the V8 stage; Figure S8: Tasselling differs among genotypes and between environmental conditions; Figure S9: Mass fractions in percentage of total plant dry weight for different plant parts (TMF: tiller, SMF: stem, LMF: leaf, RMF: root) from the cold and control treatment; Figure S10: Correlation plots of plant traits under cold and control treatment; Figure S11: Principal component analysis and loading scores of its first two axes of measured plant traits under the cold and the control treatments; Figure S12: Seed traits of different genotypes used in this study, in addition to ZEA3683, a Petkuser Ferdinand Rot landrace (Germany); Table S1: Summary of the analysis of variance (ANOVA) test results.

Author Contributions

Conceptualization, N.W., F.F. and K.B.; methodology, K.B.; formal analysis, K.B. and N.W.; investigation, K.B.; resources, K.A.N.; writing—original draft preparation, K.B.; writing—review and editing, K.B., N.W. and F.F.; review and editing, C.W.W., K.A.N., O.M. and U.R.; visualization, K.B. and N.W.; supervision, N.W., F.F., C.W.W., O.M. and U.R. All authors have read and agreed to the published version of the manuscript.

Funding

This study was funded by the Helmholtz Association of German Research Centers and the German Federal Ministry of Education and Research (MAZE Fz. 031B0195G, 031B0882E, 031B1301E). Open access was funded by the Deutsche Forschungsgemeinschaft (DFG, German Research Foundation, 491111487).

Data Availability Statement

Data are available upon request from the corresponding author and/or the co-authors.

Acknowledgments

KWS SAAT SE & Co. KGaA (KWS) and Technical University of Munich (TUM) are gratefully acknowledged for providing the seed material for this study.

Conflicts of Interest

The authors declare no conflicts of interest.

Abbreviations

ATair temperature (°C)
DAEdays after emergence
DHdoubled haploid
DLIdaily light integral (mol m−2 d−1)
ERemergence rates recorded 30 days after sowing under cold and after 2 weeks under control (%)
FERARIFluorescence Excitation Ratio Anthocyanin Relative Index (−log (FRF_R735); [37])
FLAVFlavonol index (log (FRF_R/FRF_UV); [38])
GDDGrowing degree days (°Cd)
Ilinternode length (cm)
L8_wdleaf 8 width (cm)
LAleaf area (cm2)
Lblleaf blade length (cm)
LDWleaf dry weight (g)
LMAleaf dry mass per unit area (g/cm2)
LMFleaf mass fraction (%)
Lshlleaf sheath length (in cm)
maxIDmaximum internode diameter (cm)
NBINitrogen Balance Index (NBI_R = FRF_UV/RF_R, [40])
PDWtotal plant dry weight (g)
PHplant height from the first node to the ligule of leaf 8 (cm)
PPFDphotosynthetic photon flux density (µmol m−2 s−1)
RDWtotal root dry weight (g)
RMFroot mass fraction (%)
SDWtotal stem dry weight (g)
SeDsseed density (g/cm3)
SenescLnumber of senescent leaves
SeWseed weight (g)
SFRSimple chlorophyll Fluorescence Ratio (SFR_R) of far-red emission divided by red emission (SFR_R=FRF_R735/RF_R700; [39])
ShDWtotal shoot dry weight (g)
SLAspecific leaf area (cm2/g)
SMFstem mass fraction (%)
TassFWtassel fresh weight (g)
TiDWtiller dry weight (g)
TiMFtiller mass fraction (%)
WUwater use of the whole plant (g biomass/l water between V1 & V8)

References

  1. Hansen, J.; Sato, M.; Ruedy, R. Perception of climate change. Proc. Natl. Acad. Sci. USA 2012, 109, E2415–E2423. [Google Scholar] [CrossRef] [PubMed]
  2. Trnka, M.; Rötter, R.P.; Ruiz-Ramos, M.; Kersebaum, K.C.; Olesen, J.E.; Žalud, Z.; Semenov, M.A. Adverse weather conditions for European wheat production will become more frequent with climate change. Nat. Clim. Change 2014, 4, 637–643. [Google Scholar] [CrossRef]
  3. Parker, P.S.; Shonkwiler, J.S.; Aurbacher, J. Cause and Consequence in Maize Planting Dates in Germany. J. Agro. Crop Sci. 2017, 203, 227–240. [Google Scholar] [CrossRef]
  4. Rebourg, C.; Chastanet, M.; Gouesnard, B.; Welcker, C.; Dubreuil, P.; Charcosset, A. Maize introduction into Europe: The history reviewed in the light of molecular data. Theor. Appl. Genet. 2003, 106, 895–903. [Google Scholar] [CrossRef] [PubMed]
  5. Long, S.P.; Spence, A.K. Toward cool C(4) crops. Annu. Rev. Plant Biol. 2013, 64, 701–722. [Google Scholar] [CrossRef] [PubMed]
  6. Zhang, H.; Zhang, J.; Xu, Q.; Wang, D.; Di, H.; Huang, J.; Yang, X.; Wang, Z.; Zhang, L.; Dong, L.; et al. Identification of candidate tolerance genes to low-temperature during maize germination by GWAS and RNA-seqapproaches. BMC Plant Biol. 2020, 20, 333. [Google Scholar] [CrossRef] [PubMed]
  7. Xuhui, L.; Weiwei, C.; Siqi, L.; Junteng, F.; Hang, Z.; Xiangbo, Z.; Yongwen, Q. Full-length transcriptome analysis of maize root tips reveals the molecular mechanism of cold stress during the seedling stage. BMC Plant Biol. 2022, 22, 398. [Google Scholar] [CrossRef] [PubMed]
  8. Frey, F.P.; Pitz, M.; Schön, C.-C.; Hochholdinger, F. Transcriptomic diversity in seedling roots of European flint maize in response to cold. BMC Genom. 2020, 21, 300. [Google Scholar] [CrossRef]
  9. Li, M.; Sui, N.; Lin, L.; Yang, Z.; Zhang, Y. Transcriptomic profiling revealed genes involved in response to cold stress in maize. Funct. Plant Biol. 2019, 46, 830–844. [Google Scholar] [CrossRef]
  10. Tardieu, F.; Reymond, M.; Hamard, P.; Granier, C.; Muller, B. Spatial distributions of expansion rate, cell division rate and cell size in maize leaves: A synthesis of the effects of soil water status, evaporative demand and temperature. J. Exp. Bot. 2000, 51, 1505–1514. [Google Scholar] [CrossRef]
  11. Granier, C.; Inzé, D.; Tardieu, F. Spatial distribution of cell division rate can be deduced from that of p34(cdc2) kinase activity in maize leaves grown at contrasting temperatures and soil water conditions. Plant Physiol. 2000, 124, 1393–1402. [Google Scholar] [CrossRef]
  12. Rymen, B.; Fiorani, F.; Kartal, F.; Vandepoele, K.; Inzé, D.; Beemster, G.T.S. Cold nights impair leaf growth and cell cycle progression in maize through transcriptional changes of cell cycle genes. Plant Physiol. 2007, 143, 1429–1438. [Google Scholar] [CrossRef]
  13. Riva-Roveda, L.; Escale, B.; Giauffret, C.; Périlleux, C. Maize plants can enter a standby mode to cope with chilling stress. BMC Plant Biol. 2016, 16, 212. [Google Scholar] [CrossRef]
  14. Leipner, J.; Stamp, P. Chilling Stress in Maize Seedlings. In Handbook of Maize: Its Biology; Bennetzen, J.L., Hake, S.C., Eds.; Springer: New York, NY, USA, 2009; pp. 291–310. ISBN 978-0-387-79417-4. [Google Scholar]
  15. Allen, D.J.; Ort, D.R. Impacts of chilling temperatures on photosynthesis in warm-climate plants. Trends Plant Sci. 2001, 6, 36–42. [Google Scholar] [CrossRef] [PubMed]
  16. Walter, A.; Silk, W.K.; Schurr, U. Environmental effects on spatial and temporal patterns of leaf and root growth. Annu. Rev. Plant Biol. 2009, 60, 279–304. [Google Scholar] [CrossRef]
  17. Molnar, P. Differences between soil and air temperatures: Implications for geological reconstructions of past climate. Geosphere 2022, 18, 800–824. [Google Scholar] [CrossRef]
  18. Hund, A.; Fracheboud, Y.; Soldati, A.; Stamp, P. Cold tolerance of maize seedlings as determined by root morphology and photosynthetic traits. Eur. J. Agron. 2008, 28, 178–185. [Google Scholar] [CrossRef]
  19. Melkonian, J.; Yu, L.-X.; Setter, T.L. Chilling responses of maize (Zea mays L.) seedlings: Root hydraulic conductance, abscisic acid, and stomatal conductance. J. Exp. Bot. 2004, 55, 1751–1760. [Google Scholar] [CrossRef] [PubMed]
  20. Chenu, K.; Fournier, C.; Andrieu, B.; Giauffret, C. An Architectural Approach to Investigate Maize Response to Low Temperature. In Scale and Complexity in Plant Systems Research; Spiertz, J., Struik, P.C., van Laar, H.H., Eds.; Springer: Dordrecht, The Netherlands, 2007; pp. 203–212. ISBN 978-1-4020-5904-9. [Google Scholar]
  21. Aroca, R.; Amodeo, G.; Fernández-Illescas, S.; Herman, E.M.; Chaumont, F.; Chrispeels, M.J. The role of aquaporins and membrane damage in chilling and hydrogen peroxide induced changes in the hydraulic conductance of maize roots. Plant Physiol. 2005, 137, 341–353. [Google Scholar] [CrossRef]
  22. Schils, R.; van den Berg, W.; van der Schoot, J.R.; Groten, J.; Rijk, B.; van de Ven, G.; van Middelkoop, J.C.; Holshof, G.; van Ittersum, M.K. Disentangling genetic and non-genetic components of yield trends of Dutch forage crops in the Netherlands. Field Crops Res. 2020, 249, 107755. [Google Scholar] [CrossRef]
  23. Taube, F.; Vogeler, I.; Kluß, C.; Herrmann, A.; Hasler, M.; Rath, J.; Loges, R.; Malisch, C.S. Yield Progress in Forage Maize in NW Europe-Breeding Progress or Climate Change Effects? Front. Plant Sci. 2020, 11, 1214. [Google Scholar] [CrossRef]
  24. Greaves, J.A. Improving suboptimal temperature tolerance in maize- the search for variation. J. Exp. Bot. 1996, 47, 307–323. [Google Scholar] [CrossRef]
  25. Sowiński, P.; Rudzińska-Langwald, A.; Dalbiak, A.; Sowińska, A. Assimilate export from leaves of chilling-treated seedlings of maize. The path to vein. Plant Physiol. Biochem. 2001, 39, 881–889. [Google Scholar] [CrossRef]
  26. Bhosale, S.U.; Rymen, B.; Beemster, G.T.S.; Melchinger, A.E.; Reif, J.C. Chilling tolerance of Central European maize lines and their factorial crosses. Ann. Bot. 2007, 100, 1315–1321. [Google Scholar] [CrossRef]
  27. Unterseer, S.; Pophaly, S.D.; Peis, R.; Westermeier, P.; Mayer, M.; Seidel, M.A.; Haberer, G.; Mayer, K.F.X.; Ordas, B.; Pausch, H.; et al. A comprehensive study of the genomic differentiation between temperate Dent and Flint maize. Genome Biol. 2016, 17, 137. [Google Scholar] [CrossRef]
  28. Wędzony, M.; Forster, B.P.; Żur, I.; Golemiec, E.; Szechyńska-Hebda, M.; Dubas, E.; Gotębiowska, G. Progress in Doubled Haploid Technology in Higher Plants. In Advances in Haploid Production in Higher Plants; Touraev, A., Forster, B.P., Jain, S.M., Eds.; Springer: Dordrecht, The Netherlands, 2009; pp. 1–33. ISBN 978-1-4020-8854-4. [Google Scholar]
  29. Chaikam, V.; Molenaar, W.; Melchinger, A.E.; Boddupalli, P.M. Doubled haploid technology for line development in maize: Technical advances and prospects. Theor. Appl. Genet. 2019, 132, 3227–3243. [Google Scholar] [CrossRef] [PubMed]
  30. Peter, R.; Eschholz, T.W.; Stamp, P.; Liedgens, M. Swiss Flint maize landraces—A rich pool of variability for early vigour in cool environments. Field Crops Res. 2009, 110, 157–166. [Google Scholar] [CrossRef]
  31. Aroca, R.; Irigoyen, J.J.; Sánchez-Díaz, M. Photosynthetic characteristics and protective mechanisms against oxidative stress during chilling and subsequent recovery in two maize varieties differing in chilling sensitivity. Plant Sci. 2001, 161, 719–726. [Google Scholar] [CrossRef]
  32. Hölker, A.C.; Mayer, M.; Presterl, T.; Bolduan, T.; Bauer, E.; Ordas, B.; Brauner, P.C.; Ouzunova, M.; Melchinger, A.E.; Schön, C.-C. European maize landraces made accessible for plant breeding and genome-based studies. Theor. Appl. Genet. 2019, 132, 3333–3345. [Google Scholar] [CrossRef] [PubMed]
  33. Gioia, T.; Galinski, A.; Lenz, H.; Müller, C.; Lentz, J.; Heinz, K.; Briese, C.; Putz, A.; Fiorani, F.; Watt, M.; et al. GrowScreen-PaGe, a non-invasive, high-throughput phenotyping system based on germination paper to quantify crop phenotypic diversity and plasticity of root traits under varying nutrient supply. Funct. Plant Biol. 2017, 44, 76–93. [Google Scholar] [CrossRef] [PubMed]
  34. Pariyar, S.R.; Nagel, K.A.; Lentz, J.; Galinski, A.; Wilhelm, J.; Putz, A.; Adels, S.; Heinz, K.; Frohberg, C.; Watt, M. Variation in Root System Architecture among the Founder Parents of Two 8-way MAGIC Wheat Populations for Selection in Breeding. Agronomy 2021, 11, 2452. [Google Scholar] [CrossRef]
  35. van Genuchten, M.T. A Closed-form Equation for Predicting the Hydraulic Conductivity of Unsaturated Soils. Soil. Sci. Soc. Am. J. 1980, 44, 892–898. [Google Scholar] [CrossRef]
  36. Gilmore, E.C., Jr.; Rogers, J.S. Heat Units as a Method of Measuring Maturity in Corn1. Agron. J. 1958, 50, 611–615. [Google Scholar] [CrossRef]
  37. Ben Ghozlen, N.; Cerovic, Z.G.; Germain, C.; Toutain, S.; Latouche, G. Non-destructive optical monitoring of grape maturation by proximal sensing. Sensors 2010, 10, 10040–10068. [Google Scholar] [CrossRef] [PubMed]
  38. Agati, G.; Cerovic, Z.G.; Pinelli, P.; Tattini, M. Light-induced accumulation of ortho-dihydroxylated flavonoids as non-destructively monitored by chlorophyll fluorescence excitation techniques. Environ. Exp. Bot. 2011, 73, 3–9. [Google Scholar] [CrossRef]
  39. Gitelson, A.A.; Buschmann, C.; Lichtenthaler, H.K. The Chlorophyll Fluorescence Ratio F735/F700 as an Accurate Measure of the Chlorophyll Content in Plants. Remote Sens. Environ. 1999, 69, 296–302. [Google Scholar] [CrossRef]
  40. Diago, M.-P.; Rey Caramés, C.; Moigne, M.; Fadaili, E.; Tardaguila, J.; Cerovic, Z.G. Calibration of non-invasive fluorescence-based sensors for the manual and on-the-go assessment of grapevine vegetative status in the field: Non-invasive sensing of grapevine vegetative status. Aust. J. Grape Wine Res. 2016, 22, 12228. [Google Scholar] [CrossRef]
  41. Jahnke, S.; Roussel, J.; Hombach, T.; Kochs, J.; Fischbach, A.; Huber, G.; Scharr, H. phenoSeeder - A Robot System for Automated Handling and Phenotyping of Individual Seeds. Plant Physiol. 2016, 172, 1358–1370. [Google Scholar] [CrossRef]
  42. R Core Team. R: A Language and Environment for Statistical Computing; R Foundation for Statistical Computing: Vienna, Austria, 2021; Available online: https://www.R-project.org/ (accessed on 19 January 2024).
  43. Fox, J.; Weisberg, S. An R Companion to Applied Regression, 3rd ed; Sage: Thousand Oaks, CA, USA, 2019; Available online: https://socialsciences.mcmaster.ca/jfox/Books/Companion (accessed on 19 January 2024).
  44. Kassambara, A. rstatix: Pipe-Friendly Framework for Basic Statistical Tests. R package Version 0.7.1. 2022. Available online: https://CRAN.R-project.org/package=rstatix (accessed on 19 January 2024).
  45. Lenth, R.V. emmeans: Estimated Marginal Means, aka Least-Squares Means. R package Version 1.7.2. 2022. Available online: https://CRAN.R-project.org/package=emmeans (accessed on 19 January 2024).
  46. Harrell, F.E., Jr. Hmisc: Harrell Miscellaneous. R package Version 4.7-0. 2022. Available online: https://CRAN.R-project.org/package=Hmisc (accessed on 19 January 2024).
  47. Wei, T.; Simko, V. R package ‘corrplot’: Visualization of a Correlation Matrix (Version 0.92). 2021. Available online: https://github.com/taiyun/corrplot (accessed on 19 January 2024).
  48. Garcia, O.; Debuisson, S.; Morlet, M.; Germain, C.; Panigai, L.; Le Moigne, M.; Fadaili, E.M.; Ghozlen, N.B.; Cerovic, Z.G. Using Multiplex® to manage nitrogen variability in champagne vineyards. In Proceedings of the 11th International Conference on Precision Agriculture (ICPA), Indianapolis, Indiana, 15–18 July 2012; International Society of Precision Agriculture: Monticello, IL, USA, 2012; pp. 15–18. [Google Scholar]
  49. Lainé, C.M.S.; AbdElgawad, H.; Beemster, G.T.S. A meta-analysis reveals differential sensitivity of cold stress responses in the maize leaf. Plant Cell Environ. 2023, 46, 2432–2449. [Google Scholar] [CrossRef]
  50. Rodríguez, V.M.; Butrón, A.; Rady, M.O.A.; Soengas, P.; Revilla, P. Identification of quantitative trait loci involved in the response to cold stress in maize (Zea mays L.). Mol. Breed. 2014, 33, 363–371. [Google Scholar] [CrossRef]
  51. Sowiński, P.; Rudzińska-Langwald, A.; Adamczyk, J.; Kubica, I.; Fronk, J. Recovery of maize seedling growth, development and photosynthetic efficiency after initial growth at low temperature. J. Plant Physiol. 2005, 162, 67–80. [Google Scholar] [CrossRef] [PubMed]
  52. Zheng, B.; Zhao, W.; Ren, T.; Zhang, X.; Ning, T.; Liu, P.; Li, G. Low Light Increases the Abundance of Light Reaction Proteins: Proteomics Analysis of Maize (Zea mays L.) Grown at High Planting Density. Int. J. Mol. Sci. 2022, 23, 3015. [Google Scholar] [CrossRef] [PubMed]
  53. Poorter, H.; Niinemets, U.; Walter, A.; Fiorani, F.; Schurr, U. A method to construct dose-response curves for a wide range of environmental factors and plant traits by means of a meta-analysis of phenotypic data. J. Exp. Bot. 2010, 61, 2043–2055. [Google Scholar] [CrossRef] [PubMed]
  54. Walne, C.H.; Reddy, K.R. Temperature Effects on the Shoot and Root Growth, Development, and Biomass Accumulation of Corn (Zea mays L.). Agriculture 2022, 12, 443. [Google Scholar] [CrossRef]
  55. Windt, C.W.; van Hasselt, P.R. Development of Frost Tolerance in Winter Wheat as Modulated by Differential Root and Shoot Temperature. Plant Biol. 1999, 1, 573–580. [Google Scholar] [CrossRef]
  56. Rotili, D.H.; Sadras, V.O.; Abeledo, L.G.; Ferreyra, J.M.; Micheloud, J.R.; Duarte, G.; Giron, P.; Ermácora, M.; Maddonni, G.A. Impacts of vegetative and reproductive plasticity associated with tillering in maize crops in low-yielding environments: A physiological framework. Field Crops Res. 2021, 265, 108107. [Google Scholar] [CrossRef]
  57. Urrutia, M.; Blein-Nicolas, M.; Prigent, S.; Bernillon, S.; Deborde, C.; Balliau, T.; Maucourt, M.; Jacob, D.; Ballias, P.; Bénard, C.; et al. Maize metabolome and proteome responses to controlled cold stress partly mimic early-sowing effects in the field and differ from those of Arabidopsis. Plant Cell Environ. 2021, 44, 1504–1521. [Google Scholar] [CrossRef] [PubMed]
  58. Cartelat, A.; Cerovic, Z.G.; Goulas, Y.; Meyer, S.; Lelarge, C.; Prioul, J.-L.; Barbottin, A.; Jeuffroy, M.-H.; Gate, P.; Agati, G.; et al. Optically assessed contents of leaf polyphenolics and chlorophyll as indicators of nitrogen deficiency in wheat (Triticum aestivum L.). Field Crops Res. 2005, 91, 35–49. [Google Scholar] [CrossRef]
  59. Hund, A.; Fracheboud, Y.; Soldati, A.; Frascaroli, E.; Salvi, S.; Stamp, P. QTL controlling root and shoot traits of maize seedlings under cold stress. Theor. Appl. Genet. 2004, 109, 618–629. [Google Scholar] [CrossRef]
  60. Szalai, G.; Janda, T.; Páldi, E.; Szigeti, Z. Role of Light in the Development of Post-chilling Symptoms in Maize. J. Plant Physiol. 1996, 148, 378–383. [Google Scholar] [CrossRef]
  61. Christie, P.J.; Alfenito, M.R.; Walbot, V. Impact of low-temperature stress on general phenylpropanoid and anthocyanin pathways: Enhancement of transcript abundance and anthocyanin pigmentation in maize seedlings. Planta 1994, 194, 541–549. [Google Scholar] [CrossRef]
  62. Leipner, J.; Jompuk, C.; Camp, K.-H.; Stamp, P.; Fracheboud, Y. QTL studies reveal little relevance of chilling-related seedling traits for yield in maize. Theor. Appl. Genet. 2008, 116, 555–562. [Google Scholar] [CrossRef] [PubMed]
Figure 1. Early and late development are affected during the cold temperature treatment and recovery. (A) Time required to reach the first fully developed leaf stage (V1) under cold and control temperatures expressed in days after emergence (DAE). The horizontal facets divide genotypes into the four defined cold tolerance levels, from “low” to “very high” (Table 1), from top to bottom. Circles and error bars represent mean and standard deviation, respectively. Vertical lines show weighted means calculated for each cold tolerance category (n ≤ 25). (B) Time to emerge and to reach subsequent vegetative stages in the growth chamber (cold treatment phase; n = 25) and in the greenhouse for surviving plants (recovery phase; n = 1–9), in function of accumulated growing degree days (GDD). Blue: cold treatment; green: control treatment.
Agronomy 14 00408 g001
Figure 2. Dry matter content of the DH lines at the end of the recovery period (the V8 stage) ordered according to cold tolerance level. Panels from left to right: dry weight of (A) leaves (LDW), (B) roots (RDW), (C) stems (SDW), and (D) tillers (TDW). The vertical facets divide genotypes into four cold tolerance levels from ‘low’ to ‘very high’ (Table 1). Circles and error bars represent mean and standard deviation, respectively. Vertical lines show weighted means calculated for each cold tolerance category. Blue: cold treatment (n = 1–9); green: control treatment (n = 8).
Agronomy 14 00408 g002
Figure 3. Leaf traits for the eight first fully emerged leaves measured at the end of the recovery period (V8 stage). Panels from left to right: (A) total leaf blade, (B) sheath length (cm), and (C) total leaf blade area (cm2). Blue: cold treatment (n = 1–9); green: control treatment (n = 8). The vertical facets divide genotypes into four cold tolerance levels from ‘low’ to ‘very high’ (Table 1), from top to bottom. Circles and error bars represent mean and standard deviation, respectively. Vertical lines show weighted means calculated for each cold tolerance category.
Agronomy 14 00408 g003
Figure 4. Leaf optical indices measured at the V8 stage on the fully emerged eighth leaf using a Multiplex optometer. Panels from left to right: (A) SFR, Simple Fluorescence Ratio; (B) FLAV, Epidermal Flavonol Index; (C) FERARI, Fluorescence Excitation Ratio Anthocyanin Relative Index; (D) NBI, Nitrogen Balance Index. On the vertical axis, panels divide genotypes into four cold tolerance levels from ‘low’ to ‘very high’, from top to bottom. Measurements on each leaf were performed three times, excluding the midrib, and data were averaged. Blue: cold treatment (n = 1–9); green: control treatment (n = 8). Values for the genotype PE0328 are missing in the cold treatment because the seedlings were not fit for transplantation; indices for B73, PE0100, and PE0016 in the control treatment are missing as well due to technical difficulties. Circles and error bars represent mean and standard deviation, respectively. Vertical lines show weighted means calculated for each cold tolerance category.
Agronomy 14 00408 g004
Table 1. Ranking of genotype cold tolerance following the cold treatment in function of survival rates and leaf colour score.
GenotypeSurvival Rate (%) Leaf Colour ScoreCold Tolerance Level
PE0328-1Low
B73101Low
PE0072502Low
PE0532602Medium
PE0265703Medium
PE0016803Medium
PE0022804High
PE0002903High
PE0113903High
PE0161905High
PE0171905High
PE01001003Very high
PE04011005Very high
Disclaimer/Publisher’s Note: The statements, opinions and data contained in all publications are solely those of the individual author(s) and contributor(s) and not of MDPI and/or the editor(s). MDPI and/or the editor(s) disclaim responsibility for any injury to people or property resulting from any ideas, methods, instructions or products referred to in the content.

