Article

Spatial Distribution, Source Analysis, and Health Risk Assessment of Heavy Metals in the Farmland of Tangwang Village, Huainan City, China

1
School of Earth and Environment, Anhui University of Science and Technology, Huainan 232001, China
2
The Anhui Province Engineering Laboratory of Water and Soil Resources Comprehensive Utilization and Ecological Protection in High Groundwater Mining Area, Huainan 232001, China
*
Author to whom correspondence should be addressed.
Agronomy 2024, 14(2), 394; https://doi.org/10.3390/agronomy14020394
Submission received: 6 January 2024 / Revised: 7 February 2024 / Accepted: 10 February 2024 / Published: 18 February 2024
(This article belongs to the Section Soil and Plant Nutrition)

Abstract

:
The impacts of heavy metal pollution in arable soil on agricultural production, environmental health, and the wellbeing of urban and rural residents cannot be overlooked. It has become a significant bottleneck in achieving comprehensive rural revitalization. To accurately grasp the characteristics of heavy metal pollution in suburban cultivated soil, Tangwang Village (a suburb of Huainan City) was subjected to scrutiny. The contents of heavy metals (Hg, Cu, Hg, As, Pb, Cr, Cd, and Zn) in the topsoil of cultivated land in this area were detected, and their spatial distribution characteristics were analyzed using inverse distance spatial interpolation. (1) After conducting a comprehensive analysis and thorough examination of the PMF model sources, it was determined that Cu, Cd, and Zn exhibit a direct correlation with agricultural practices, collectively contributing to a cumulative percentage of 21.10%. Meanwhile, Cr is derived from a combination of sources, including both natural parent materials and human activities, accounting for a total proportion of 24.45%. Notably, lead emissions from automobile exhausts constitute a significant source, while arsenic is primarily associated with dispersed factories and their respective operations, contributing to respective proportions of 36.38% and 18.07%. It is evident that agricultural practices, transportation, and industrial activities are the main reasons for heavy metal pollution in arable soil. (2) The evaluation of geological accumulation indicators reveals that the level of soil arsenic accumulation pollution is mild to moderate (1.199). On the other hand, the cumulative pollution level of Cd, Hg, Cr, and Cu was relatively low (0.462→0.186), whereas the levels of Pb and Zn were below the threshold. (3) The assessment of the ecological risk index revealed that the predominant elements posing potential ecological risks in the investigated region were Hg, As, and Cd, with average Ei values of E(Hg) = 86.81, E(As) = 80.67, and E(Cd) = 67.83, respectively. (4) The human health risk assessment revealed significant differences in the single non-carcinogenic risk values of heavy metals generated by different exposure pathways, with oral ingestion > dermal contact > oral nasal inhalation. Children were more susceptible to the toxic effects of heavy metals compared to adults. Both As and Cr caused an increased risk of cancer in both children and adults, which is a matter of great concern. The results of this study contribute to a more accurate description of the sources of heavy metals in farmland soil. This study indicates that the application of PMF for soil source analysis yields clear results that can be further applied. This research also has potential policy significance as it can help to improve the sustainability of ecosystems by coordinating both environmental and human activities.

1. Introduction

The FAO is exploring how the water–energy–food nexus can support food security and sustainable agriculture worldwide [1]. Understanding the complex relationship between water, energy, and food is key to ensuring the integrity of ecosystems [2]. Land resources form the foundation of agriculture and other rural land uses. The interaction between the various components of land resources is essential for determining the productivity and sustainability of agroecosystems [3,4]. The FAO is responding to the need to increase food production from a degraded natural resource base by supporting the restoration of land productivity and ecosystem services [5,6,7]. Timely information on the status of land resources is crucial for decision making by farmers, local and provincial authorities, and national governments. In addition, one of the United Nations’ Sustainable Development Goals (SGDs) is to achieve food security, improve nutrition, and promote sustainable agriculture [8,9,10,11].
Soil is one of the most fundamental natural resources, serving as an important source of food and ecological security as well as a cornerstone of rural revitalization. The quantity and quality of arable land resources are key parameters for food production capacity [12]. With the continuing expansion of industrialization and urbanization, along with the destruction caused by natural disasters, the total amount of arable land in China is decreasing, and the quality of arable land has also declined [13]. In order to safeguard national food security, there is an urgent need to implement the strategy of “storing grain in the ground” [14], which requires ensuring the quantity and quality of arable land. The results of the third national land survey published in 2021 demonstrated that the area of arable land has decreased by 7.53 million hectares nationwide and that the overall condition of arable soil quality is not optimal, with heavy metal soil pollution being found in some areas [15]. Heavy metals that enter the soil can enter the food chain through crops, affecting the quality and safety of these crops and the health of the population that consumes them [16]. Because of this, scientific monitoring tools are needed to obtain the spatial distribution of heavy metals in arable soils and to evaluate their associated health risks.
Currently, scholars have extensively investigated the spatial distribution, origins, and potential health hazards of heavy metals in cultivated land, both domestically and internationally. Previous research has indicated that the heavy metal levels in cultivated soils in numerous regions surpass the acceptable limits, indicating a tendency for pollutants to accumulate. Commonly detected pollutants include copper (Cu), mercury (Hg), arsenic (As), chromium (Cr), cadmium (Cd), lead (Pb), and zinc (Zn) [17,18,19,20]. The primary approaches for assessing heavy metal pollution in arable soils include the single factor pollution index and the Nemero comprehensive pollution index [21]. As for evaluating the health risks associated with soil heavy metal contamination, the prevailing models include the geological accumulation index, the potential ecological risk index, and human health risk assessment [22,23,24]. These methods provide a scientific methodological basis for the analysis and evaluation of heavy metal pollution and the related health risks in cultivated land at different survey sites. In terms of identifying the sources of soil heavy metal pollution, previous studies have mainly used multivariate statistical methods [24], positive matrix factorization (PMF) [25], isotope tracing methods [26], and geospatial analysis methods [27]. The PMF model is regarded as a dependable receptor model used for the analysis of pollution sources. It is widely utilized in the field of environmental pollution source analysis. In this model, the error of each chemical component in particulate matter is calculated by using weights before the main sources of particulate matter, and their contributions are determined by means of the least squares method. Compared with other source analysis methods, it does not require the measurement of source component spectra, the elemental contribution in the decomposition matrix is non-negative [28], it allows for the utilization of the standard deviation of data for optimization, and it is capable of effectively handling missing and inaccurate data [29]. Therefore, the application of this method can significantly contribute to the successful implementation of measures aimed at preventing and controlling heavy metal pollution in arable soils.
Suburban agriculture plays a vital role in ensuring food supply and enhancing the resilience of food systems in urban areas [30]. However, due to the intricate nature of the environment, intensive human activities, and complex land use systems, there is an increased risk of soil heavy metal pollution in suburban cultivated land [31,32,33,34]. Unfortunately, there is currently a lack of comprehensive research on the analysis of pollution sources and the assessment of health risks associated with heavy metals in suburban farmland soil [35]. Therefore, it is imperative to conduct thorough research on the spatial distribution, analysis of pollution sources, and assessment of the health risks posed by heavy metals in suburban farmland soil.
This study conducted an examination of Tangwang village, which is situated on the outskirts of Huainan City, China. The top layer of soil from the arable land in the region was gathered and subjected to analysis in order to identify the presence of various heavy metals, including Hg, Cu, Hg, As, Pb, Cr, Cd, and Zn. Inverse distance spatial interpolation was applied to analyze the metal spatial distribution characteristics, and correlation analysis and PMF modelling were applied to analyze heavy metal sources. The ecological and human health risks of the above heavy metals were evaluated using the geological accumulation index, the potential ecological risk index, and the human health risk evaluation model. The study’s findings provide empirical support for managing heavy metal contamination in agricultural soil in the region, which helps to mitigate soil pollution. Additionally, the study aids in identifying farmland regions that require protection, allowing proactive measures to be taken and ultimately facilitating rural rejuvenation objectives.

2. Materials and Methods
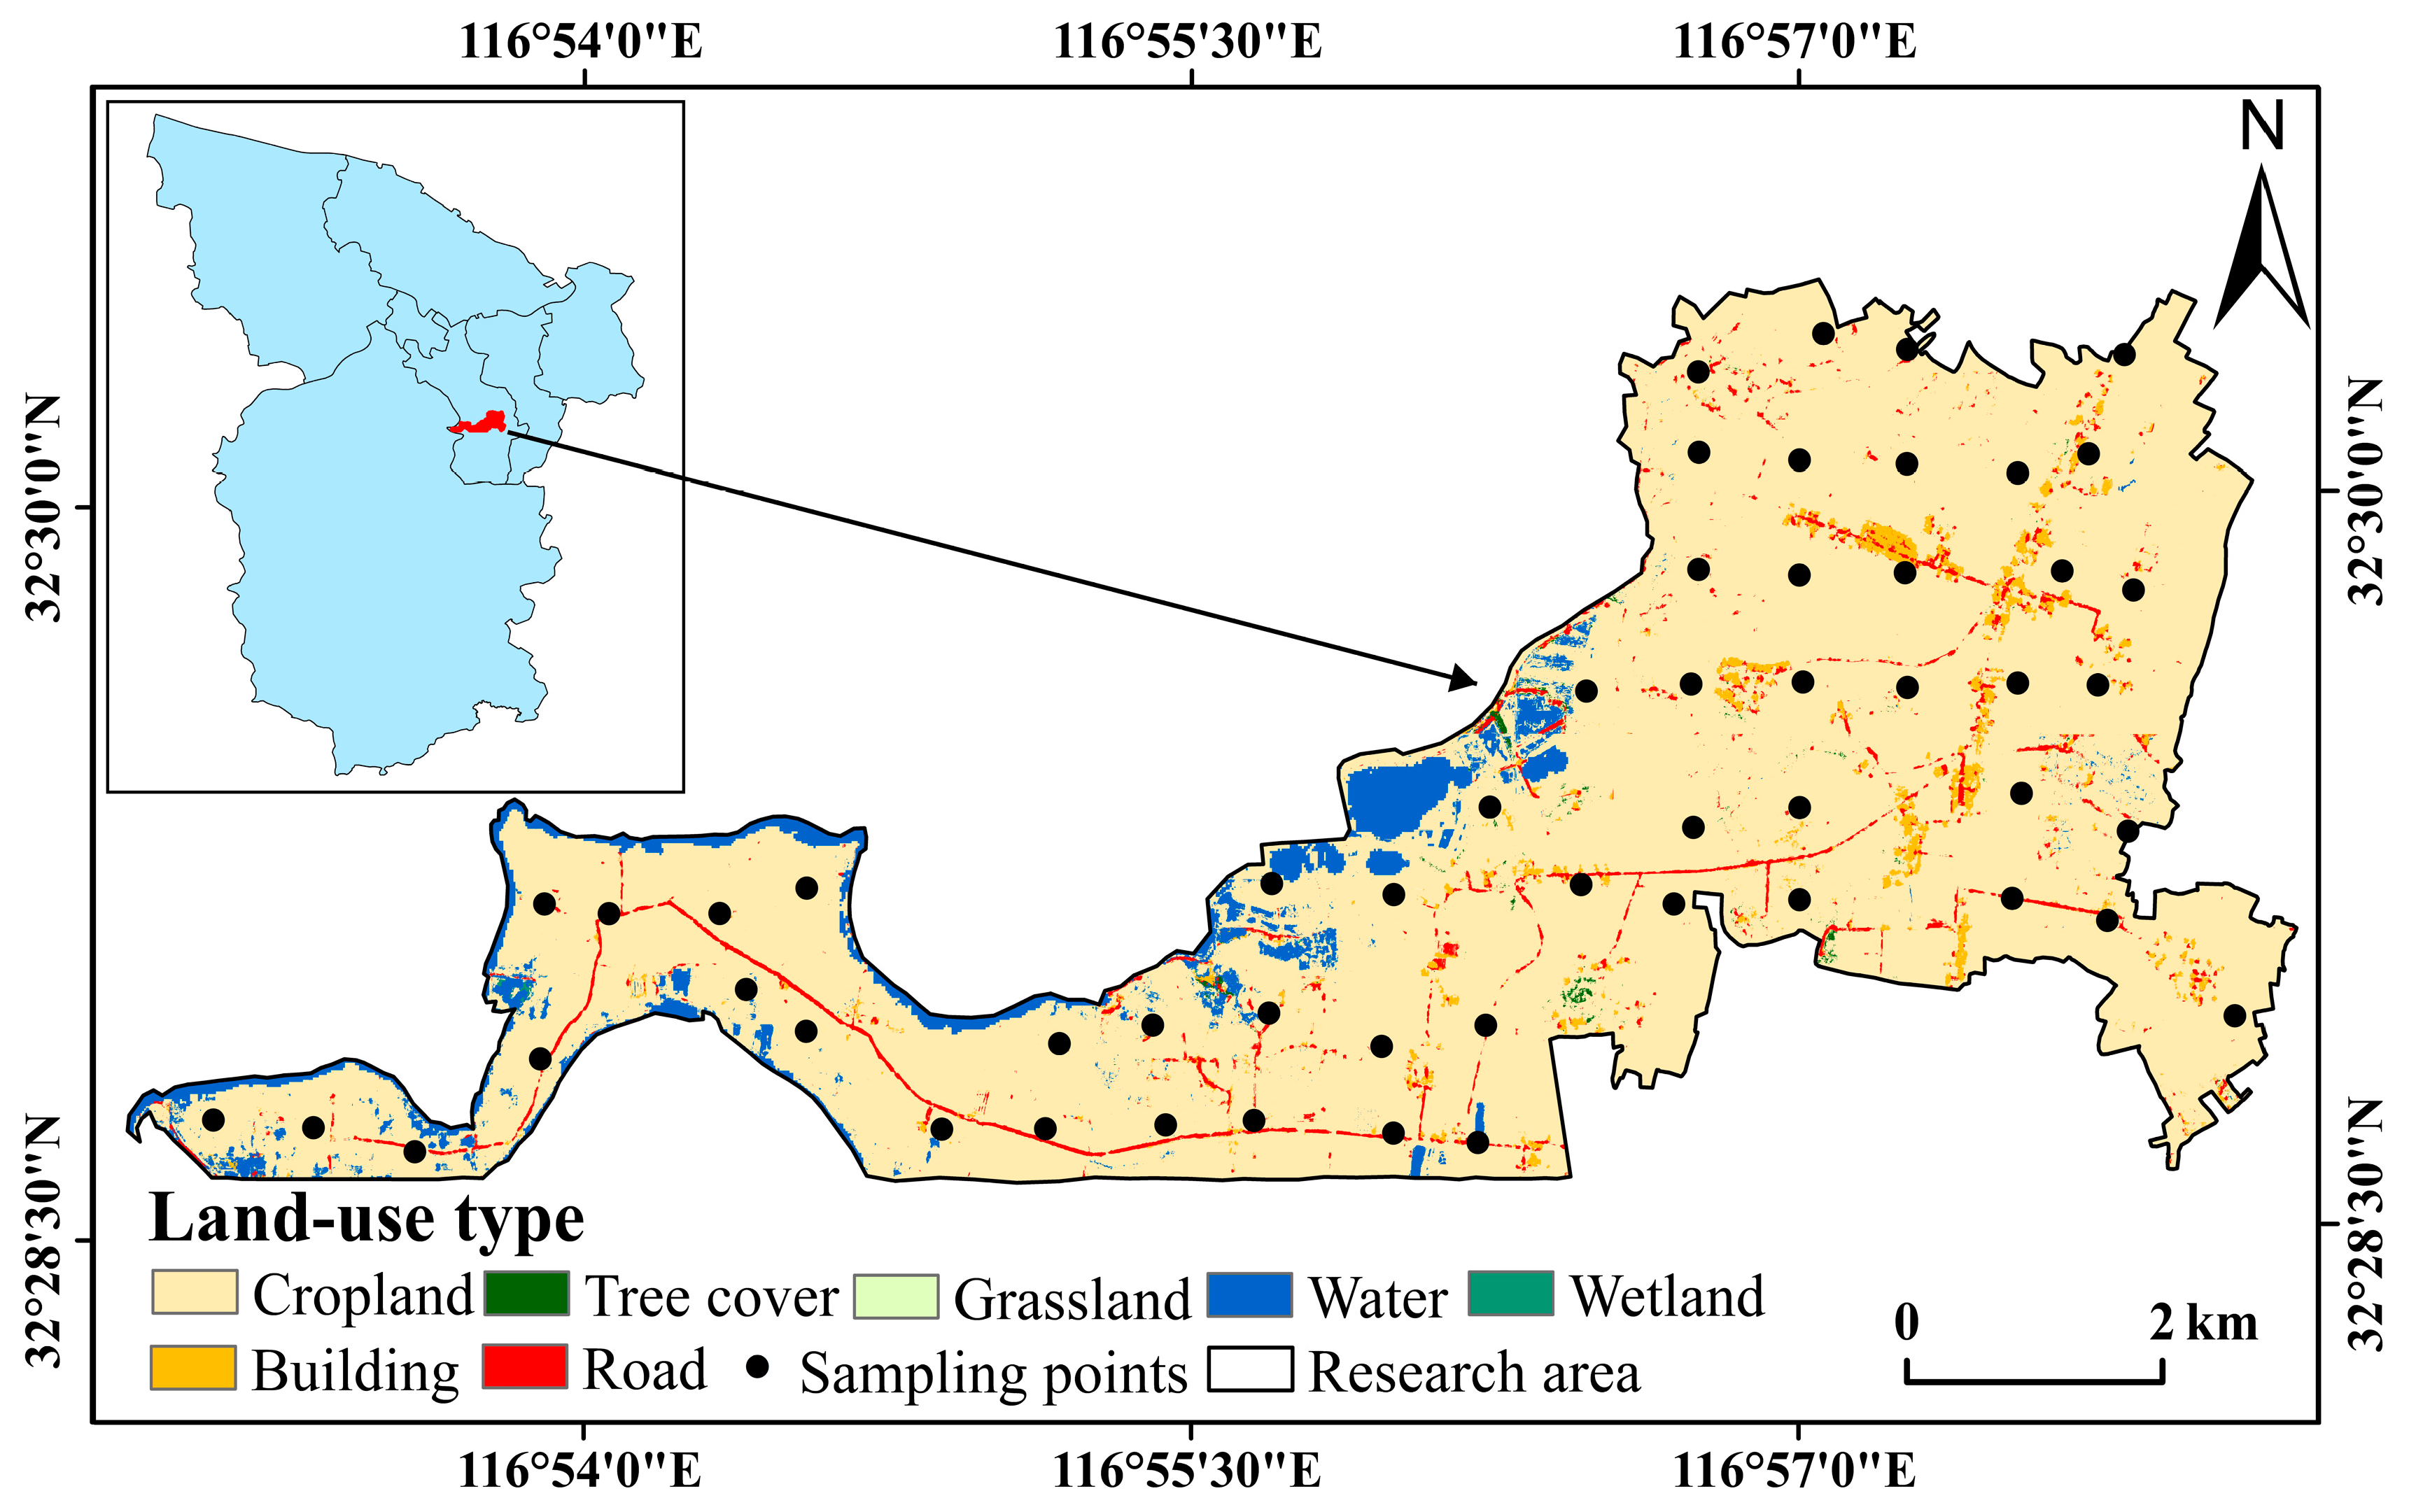
2.1. Study Area

The study area encompasses the geographical coordinates of N 32.478–32.509 and E 116.880–116.971, situated in the north-central region of Anhui Province. Specifically, it is located in the Xiejiaji district, which can be found on the southwestern outskirts of Huainan City. This area consists of 21 village groups, accommodating a population of 3852 individuals. Furthermore, it has an arable land area measuring 4729 mu, as illustrated in Figure 1. In close proximity to the Xiejiaji mining area, the study site boasts an abundance of mineral resources characterized by exceptional quality. The terrain is characterized by gentle slopes, mainly comprising plains and hills, with altitudes spanning from 16 to 47 m. The climate of this region is classified as subtropical, representing the northernmost boundary of the monsoonal humid climate. It is characterized by long winters and summers, as well as shorter spring and autumn seasons, demonstrating distinct seasonal variations. The average annual temperature ranges from 14.8 to 14.9 °C. January experiences the lowest temperatures, while July is the hottest month, resulting in an annual temperature fluctuation of 27.2 °C.

2.2. Sample Collection and Analysis

The 1 m resolution national land cover data of China were downloaded from the Earth System Science Data journal website. The land cover data (SinoLC-1) were obtained using vector boundary cropping of the study area [36] and imported into ArcGIS 10.8 software with a 500 m × 500 m grid placement to present the sampling points for cropland type (Figure 1). Soil samples were collected in late November of 2022, and the geographical coordinates of the sampling points were determined on site using a handheld GPS. Sampling was carried out for areas with more arable land, and each sampling point occupied an area of approximately 20 cm × 20 cm (400 cm2) with a sampling depth of 20 cm. The samples consisted of three sub-samples randomly mixed to form a single sample, resulting in a total of 54 points (Figure 1). The sample collection process followed the Technical Specification for Soil Environmental Monitoring (HJ/T166-2004) [37].
All soil samples were brought back to the laboratory and, after natural drying, were cleared of dead leaves and other debris. The samples were then ground in a mortar and passed through a 100-mesh sieve. The soil samples were sieved and precisely weighed using an analytical balance with an accuracy of 0.0001 g. They were then packed into tubes made from polytetrafluoroethylene (PTFE) and digested with a mixture of 6 mL of 65–68% nitric acid (Shanghai Zhenqi Chemical Reagent Co., Ltd., Shanghai, China), 4 mL of 40% hydrofluoric acid (Yantai Shuangshuang Chemical Co., Ltd., Yantai, China), and 4 mL of 70–72% perchloric acid (Chengdu Jinshan Chemical Reagent Co., Ltd., Chengdu, China). The resultant solution was made up to 25 mL with deionized water, and 10 mL of the supernatant was extracted for testing. The concentrations of Cu, Pb, Zn, Cd, As, Hg, and Cr were determined by means of inductively coupled plasma atomic emission spectrometry (ICP-OES, model Avio550, PerkinElmer, Waltham, MA, USA) and inductively coupled plasma mass spectrometry (ICP-MS, model NexlON300 series, PerkinElmer, Waltham, MA, USA) [38]. Furthermore, we conducted the analysis of the soil samples using certified reference samples and the standard reference substance GBW07401 (GSS-1) to ensure accurate quality control. It is worth noting that the recovery rate of heavy metal elements ranged from 90% to 105%, indicating a high level of precision. Additionally, the relative error of the measurement results remained within ±5%, further confirming the reliability of our findings. The detection limits of soil Cd, Hg, Pb, As, Cr, Cu, and Zn were 0.03, 0.0005, 2.0, 1.0, 5.0, 1.0, and 4.0 mg/kg, respectively. The analytical test results and detection limits of the samples followed the requirements of the Specification for Geochemical Evaluation of Land Quality (DZIT 0295-2016) [39].
Secondly, due to the limited availability of experimental facilities, all soil physical and chemical properties were sent for testing, except for the pH value (pH meter, model FE28, Shanghai, China), moisture content, and particle size (laser particle size analyzer, model RISE-2006, Jinan, China). Among them, the cation exchange capacity (CEC) was determined via the spectrophotometric method (UV-visible spectrophotometer, model 756PC, Shanghai, China). Soil organic matter (SOM) is usually determined using the combustion method (0.005 mol/L sulfuric acid standard solution, Shanghai Macklin Biochemical Technology Co., Ltd., Shanghai, China), while total nitrogen (TN) is determined using the semi-micro Kjeldahl method (0.005 mol/L sulfuric acid standard solution, Shanghai Macklin Biochemical Technology Co., Ltd., Shanghai, China). The testing process was carried out by Jiangsu Huace Standard Testing and Certification Technology Co., Ltd. (Jiangsu, China) and was completed on 27 April 2023. The basic physical and chemical properties of the soil sample to be analyzed are shown in Table 1.

2.3. Source Analysis

The basic principle of the PMF model assumes that environmental sample X is an n × m matrix, with n being the number of samples and m being the chemical composition; X can then be decomposed into a source contribution matrix G (n × p, with p being the number of sources) and a source composition profile matrix F (p × m) [40]. The measured sample concentrations can then be expressed as [25,41,42,43,44,45]:
X = G F + E
or
x i j = k = 1 p g i k f k j + e i j
where xij is the sample concentration matrix X (the concentration of the jth species in the ith sample), p is the number of sources, gik is the contribution of the kth source to the ith sample, fkj is the concentration of the jth species in the kth source, and eij represents the residual [40].
The PMF algorithm determines G and F by continuously minimizing Q. The objective function Q has the following equation [25,41,44,46]:
Q = i = 1 n j = 1 m ( x i j - k = 1 p g i k f k j u i j ) 2 = i = 1 n j = 1 m ( e i j u i j ) 2
where uij is the uncertainty of the heavy metal in the soil.
The uncertainty equation [47] is as follows:
u i j = { 5 6 × M D L , C M D L ( E F × C ) 2 + ( 0.5 × M D L ) 2 , C > M D L
where C is the measured value of the heavy metal (mg/kg), EF is the relative uncertainty (error fraction), and MDL indicates the method detection limit (mg/kg).

2.4. Ecological Assessment

2.4.1. Geological Cumulative Index

The Index of Geological Accumulation (Igeo) method provides a quantitative assessment of heavy metal contamination by comparing the metal content of sampled soils with the background environment. This method was proposed by the German scientist Muller in 1969 based on sedimentological principles [48] and is used as a quantitative indicator to study the extent of heavy metal contamination in sediments and other materials. Igeo not only takes into account the influence of natural geological processes on the background values of heavy metals in soils but can also be used to identify the impact of human activities on the environment, and it is widely used in the evaluation of heavy metal contamination in soils. It was calculated with the following equation [49]:
I g e o = log 2 C i 1.5 B i
where Ci (mg/kg) represents the concentration of element i in the sample, Bi (mg/kg) represents the background value of element i, and 1.5 is a constant. The classification criteria for Igeo evaluation level are shown in Table 2.

2.4.2. Potential Ecological Risk Index (RI)

Hakanson’s study on water pollution introduces the potential ecological hazard index, which operates on the premise of comprehending the behavior of heavy metal transport and alteration in the environment. Subsequently, the assessment of soil heavy metal pollution and its associated ecological hazards is conducted by applying sedimentological principles [51]. Its focus is biotoxicological and is somewhat subjective. It was calculated as follows:
E i = T i F i = T i C i B i
R I = E i
where i is each heavy metal factor, Ei is a single heavy metal risk factor, Fi is a single heavy metal pollution factor, Ci is the actual heavy metal content of the sample (kg/mg), Bi is the background value of heavy metals in the area (kg/mg), and Ti is the single heavy metal toxicity factor, which is used to reflect the level of heavy metal toxicity and the sensitivity of the medium in the environment to heavy metal pollution; the T value in this study referred to the previous literature [52]. RI is the sum of heavy metal risk factors; the graded list is shown in Table 3 [51].

2.5. Health Assessment

Human Health Risk Assessment Model

The human health risk (HHR) model uses risk as an evaluation indicator to quantitatively describe the health risks of environmental pollution by combining environmental pollution with human health. It considers two exposure groups, adults and children, separately [53,54,55]. On this basis, we assessed the health hazards of the study area.
The average daily exposure of soil heavy metals under each pathway was calculated using the following equation [56]:
A D D i n g = C × I n g R × E F × E D B W × A T × 10 6
A D D i n h = C × I n h R × E F × E D P E F × B W × A T
A D D d e r m a l = C × S A × A F × A B S × E F × E D B W × A T × 10 6
where C represents the concentration of heavy metals in soil, measured in mg/kg, ADDing is the average daily exposure by oral ingestion, ADDinh is the average daily exposure by oral nasal inhalation, and ADDdermal is the average daily exposure by dermal contact. The meanings and values of the relevant parameters are given in Table 4.
Non-carcinogenic risk (HQ) was used to calculate the non-carcinogenic effects of potentially toxic elements in soil using the following equation [59]:
H I = H Q i j = A D D i j R f D i
T H I = H I
where HQij is the single non-carcinogenic risk value of heavy metal i in exposure pathway j. HI is the abbreviation for the Hazard Index, which represents the cumulative value of all anticipated HQs (non-carcinogenic risks) resulting from exposure through inhalation, oral ingestion, and dermal contact pathways. THI is the cumulative total of all HI.
Carcinogenic risk (CR) refers to the probability that exposure to certain pollutants will lead to cancer. Similar to THI, the total carcinogenic risk (TCR) was calculated using the following equation [60]:
C R = C R i j = A D D i j × S F i j
T C R = C R
where CRij is the individual carcinogenic risk value for heavy metal i under the jth exposure pathway, CR is the total carcinogenic risk value under the three pathways or the total carcinogenic risk value for all elements under a particular pathway, and TCR is the total carcinogenic risk value. Values for RfD and SF are given in Table 5.
The US EPA defines non-carcinogenic risks as follows: when HI/HQ ≤ 1, the non-carcinogenic risk is within acceptable limits; when HI/HQ > 1, the human body is at high risk of harm; and when HI/HQ ≥ 10, a serious chronic risk exists. The health risks of carcinogens are defined as follows: no significant carcinogenic risk when CR/TCR < 10−6; some carcinogenic risk when 10−6 < CR/TCR < 10−4; and significant carcinogenic risk when CR/TCR > 10−4 [54].

2.6. Statistical and Geostatistical Analysis

(1)
The presence of trait values can result in the fragmentation of continuous surfaces and have a direct impact on the distribution patterns of variables. As a result, domain-based methods are initially employed to identify these trait values, after which data labeled as special values are substituted with standard maximum and minimum values, respectively. The heavy metal content of the arable soils at the sampling sites in the study area was analyzed using SPSS 23 software, employing classical statistical methods for descriptive statistics. The statistical parameters included the range (min–max), mean (mean), standard deviation (SD), and coefficient of variation (CV). Among them, the CV is a normalized measure of the dispersion of a probability distribution. According to the CV classification criteria, CV ≤ 20% is considered low variability, 51% < CV ≤ 100% is considered moderate variability, 20% < CV ≤ 50% is considered high variability, and CV > 100% is considered very high variability.
(2)
The semi-variance function is a valuable tool in the field of geostatistics for effectively characterizing the spatial properties of variables. In order to assess the normality of the data, the K–S method available in the Minitab 21 statistical software was employed. Subsequently, the GS+ version 9 geostatistical software was utilized to fit the model to the data obtained from the previous step and to compute the primary model parameters. The choice of the fitted model was determined by evaluating both the coefficient of determination (R2) and the residuals (RSS). The optimal fitting model was selected based on the principle of maximizing the coefficient of determination and minimizing the residuals.
(3)
The geographical arrangement (latitude and longitude) of heavy metal data points obtained from arable soils was depicted utilizing ArcGIS 10.8 software, while interpolation was performed using the inverse distance weighted (IDW) method. Furthermore, an assessment of the health risks associated with the data was conducted, and all computations were executed using Excel 2019 software. Additionally, all statistical graphs were generated utilizing Origin 2022.

3. Results

3.1. Spatial Distribution

3.1.1. Descriptive Statistical Analysis

As shown in Table 6, the background values of Cu, Hg, As, Pb, Cr, Cd, and Zn in the study area were 24.16, 0.02, 13.81, 30.47, 64.93, 0.06, and 58.35 mg/kg, respectively. The mean concentrations were 42.24, 0.04, 111.41, 28.97, 117.95, 0.14, and 37.27 mg/kg, respectively. The mean values of Cu, Hg, As, Pb, Cr, and Cd in the soil were higher than the background values of soil elements in Huainan, and were 1.75, 2.17, 8.07, 1.01, 2.02, and 2.29 times higher than the background values, respectively. The mean values of Zn content did not exceed the background value, indicating that most of the heavy metals were enriched by anthropogenic influences, with only some local enrichment of Zn. According to Table 1, the pH value of soils in the Huainan region is typically around 5.422 (acidic). According to the soil risk screening value standard [66], except for As, which had a maximum value higher than the risk screening value, the contents of Cu, Hg, Pb, Cr, Cd and Zn were all lower than the risk screening value. This indicated that although there is a certain degree of heavy metal accumulation in the soils of the study area, the extent of accumulation poses a manageable risk level to the growth of local crops and the quality and safety of agricultural products.
According to the CV classification criteria [69], the magnitudes of the coefficients of variation for the seven heavy metal elements in the arable soils of the study area were ranked as follows: As > Hg > Cd > Cr > Pb > Cu > Zn. As and Hg had a CV above 51%, indicating high variability, while Cd, Cr, Pb, Cu, and Zn had a within the range of 20–50%, signifying medium variability. In general, this indicates that human activities had a greater influence on As and Hg and a lesser influence on Cd, Cr, Pb, Cu, and Zn.

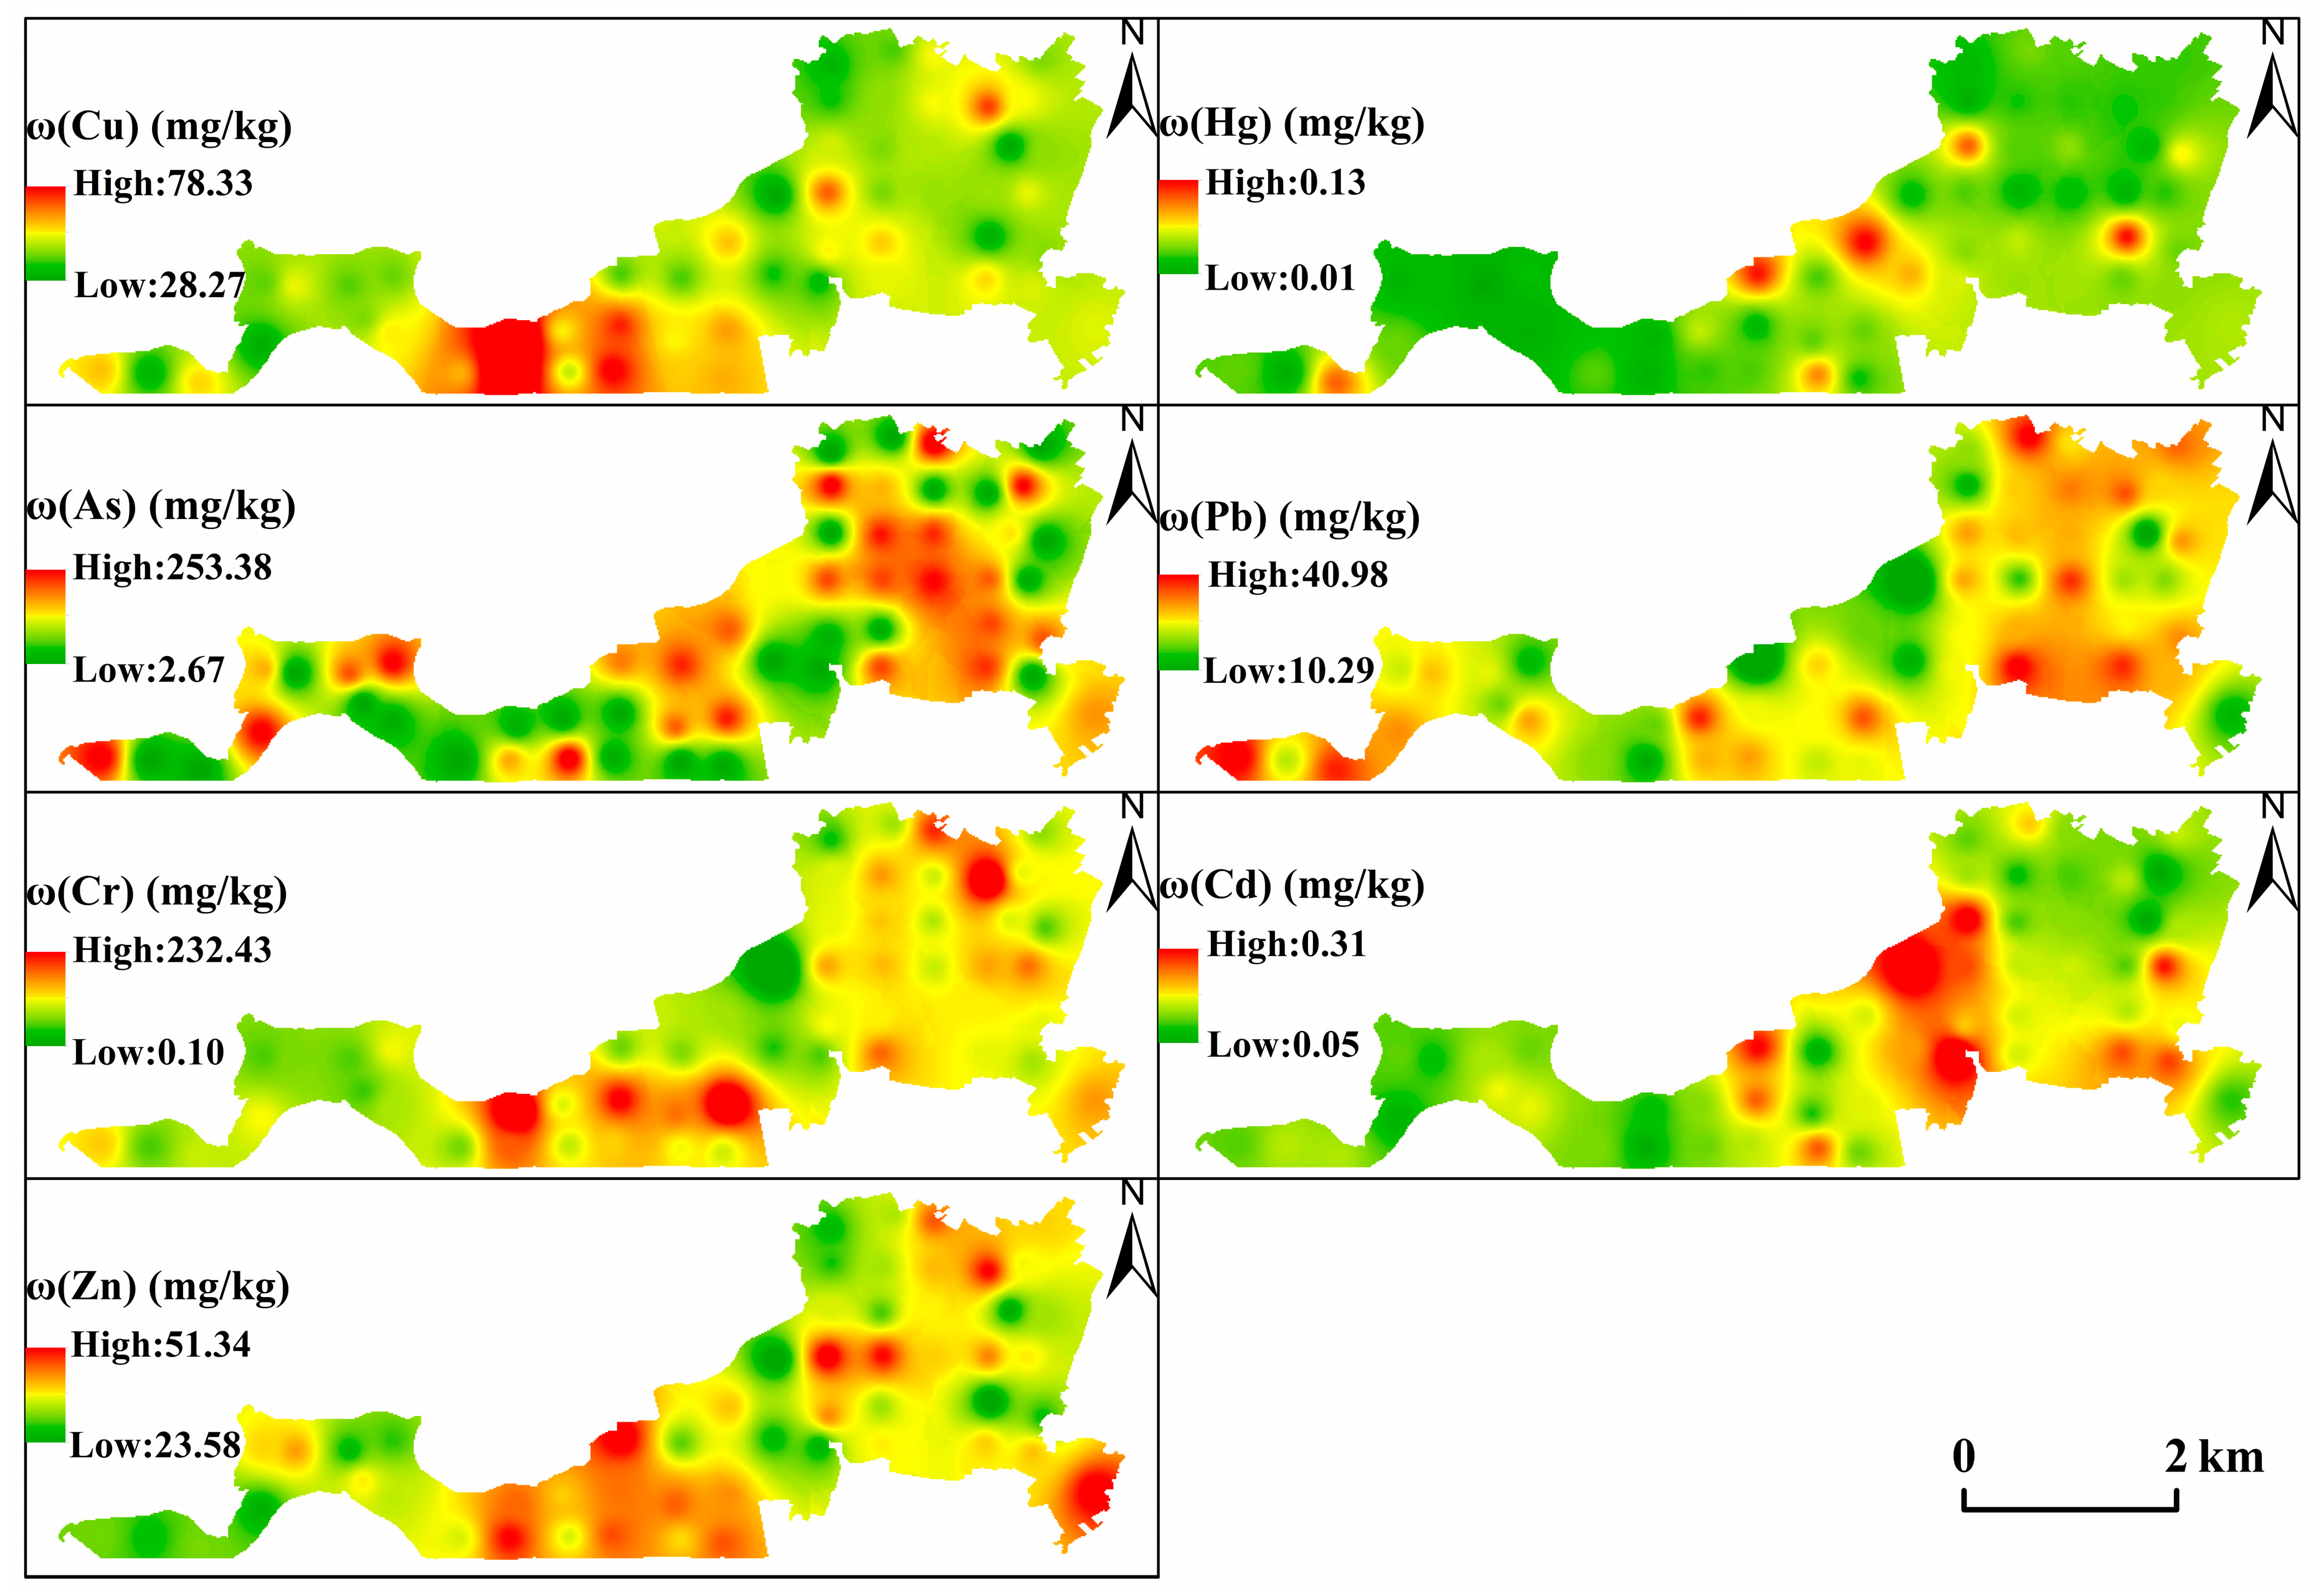
3.1.2. Spatial Distribution of Heavy Metal Content in Soils

As depicted in Figure 2, there was a certain degree of spatial variability in all of the soil heavy metals in the study area, likely influenced by anthropogenic interference. The distribution of As, Pb, Cr, and Zn was similar, with most of the high-concentration areas located in the central and northeastern parts of the study area; the high-Zn area had a larger distribution in the whole study area. Human activities are an important factor in the accumulation of heavy metals in the agricultural soils of these two areas. Cu and Cd concentrations fluctuated considerably, while Hg was more stable, with only a single localized high-concentration area.

3.1.3. Variance

The results of the normality test using Minitab 21 indicate that only two elements, Pb and Zn, had values which were significantly above 0.05 and normally distributed; the other five elements had values which were significantly below 0.05 and not normally distributed, and had to be transformed for normality. To ensure the accuracy of the data, all of the original data were transformed for normality. Comparing the transformation results of Log, BOX–COX, and Johnson, it was found that Cu, Hg, Cr, and Cd conformed to a normal distribution after Johnson transformation, while Pb and Zn conformed to a normal distribution after Box–Cox transformation (Table 5). As did not conform to a normal distribution; this was likely due to human and other factors, and it was therefore not considered in the next step of the analysis.
The GS+ Version 9 geostatistical software was used to fit a model to the data processed in the previous step, and the best-fitted model was selected based on the principle of maximum coefficient of determination and minimum residual (Table 7). In the GS+ analysis, five elements (Cu, Hg, Pb, Cr, and Zn) were fitted to the Gaussian model, while Cd was fitted to the spherical model with the required accuracy.
The spatial variation of block value (C0) is attributed to stochastic variability [70], reflecting the spatial variation caused by random factors (e.g., socio-economic factors). The abutment value reflects the spatial variation caused by a combination of natural and socio-economic factors and is the sum of structural and random variation. The basal effect, or block-to-base ratio (C0/C + C0), is used to indicate which of the factors influencing spatial variation is dominated by structural (natural factors) and stochastic factors (anthropogenic factors) [70]. According to the spatial correlation grading standards of regional variables, the basal effect values of Cd in Table 6 range from 25% to 75%, indicating moderate spatial autocorrelation. This indicates that its spatial structure is influenced by a combination of structural and stochastic factors. All other elements have basal effect values above 99%, with relatively weak spatial autocorrelation, suggesting that their spatial distribution patterns are relatively more influenced by human activities. The range of variation indicates the magnitude of the spatial autocorrelation; the variables have spatial autocorrelation within the range of variation, and vice versa. The variation range of the six elements in the study area was Cd > Hg > Pb > Cr > Cu > Zn; the variation range of Cd was relatively large, indicating strong spatial correlation over a large spatial range, while the variation range of Zn was small, indicating autocorrelation only in a relatively small spatial range. The variation range of all six elements was small, indicating that the uniformity of spatial distribution was weak and that variations within a small range cannot be ignored.

3.2. Source Analysis

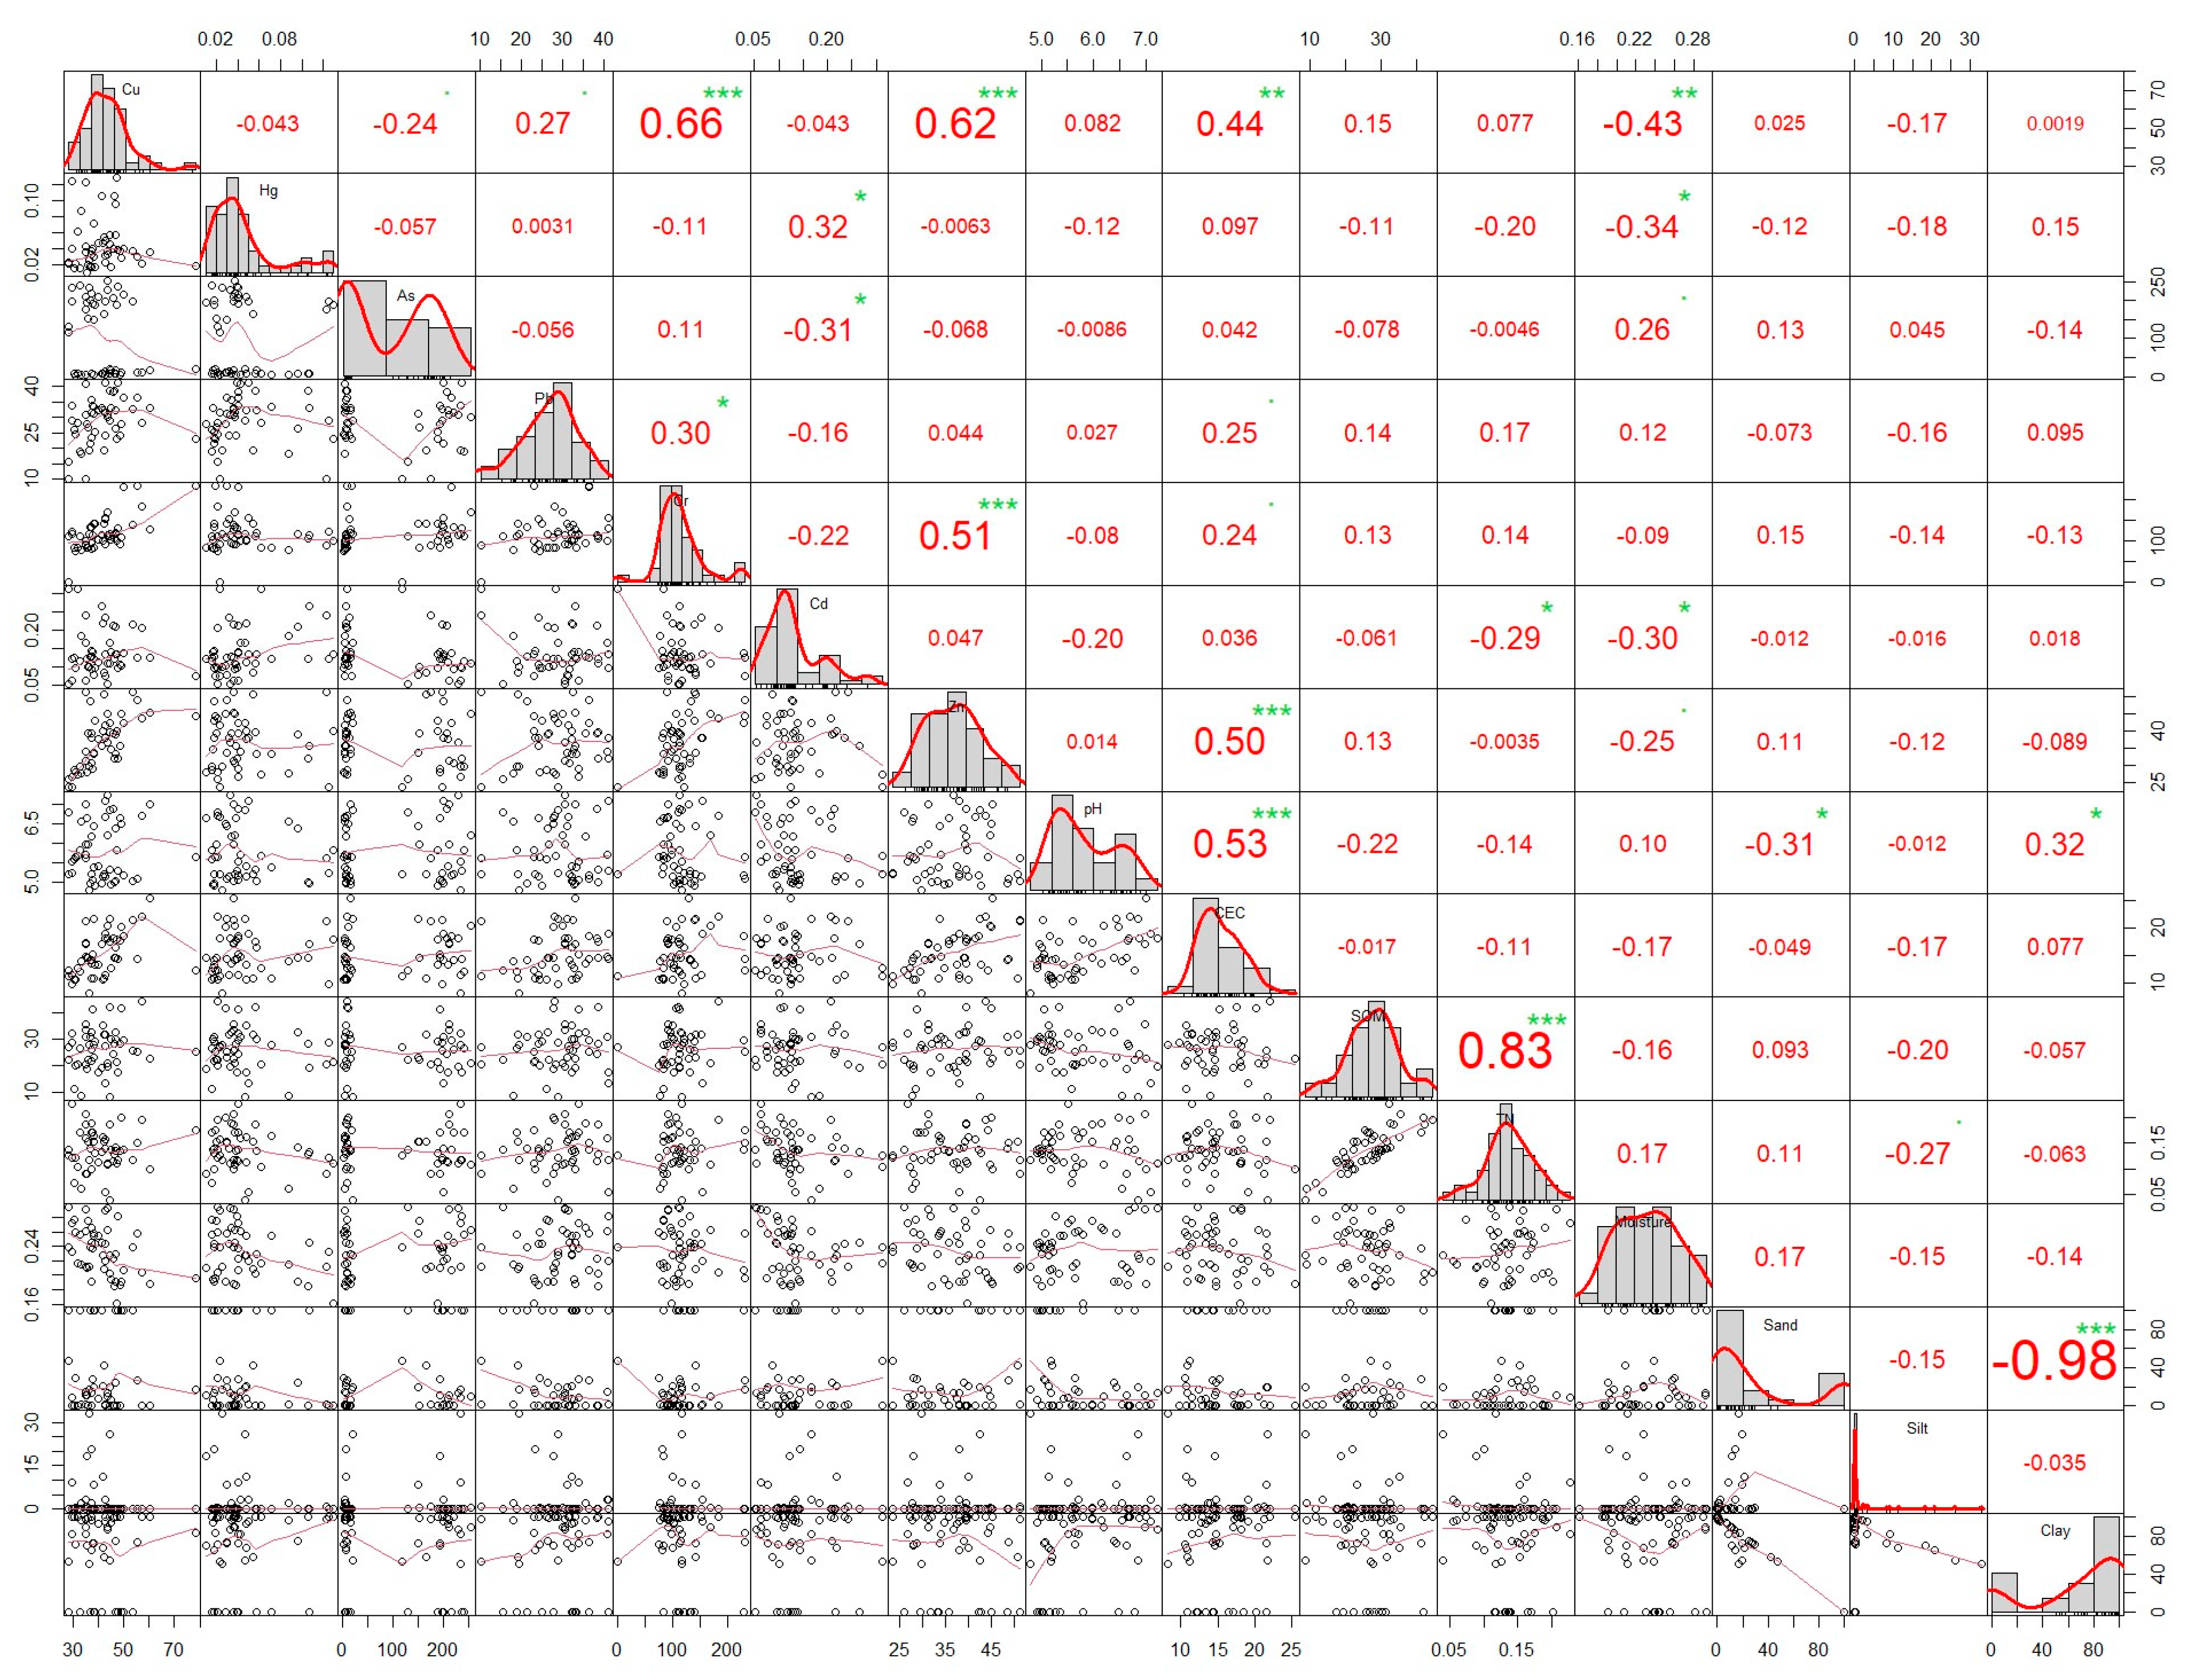
3.2.1. Correlation Analysis
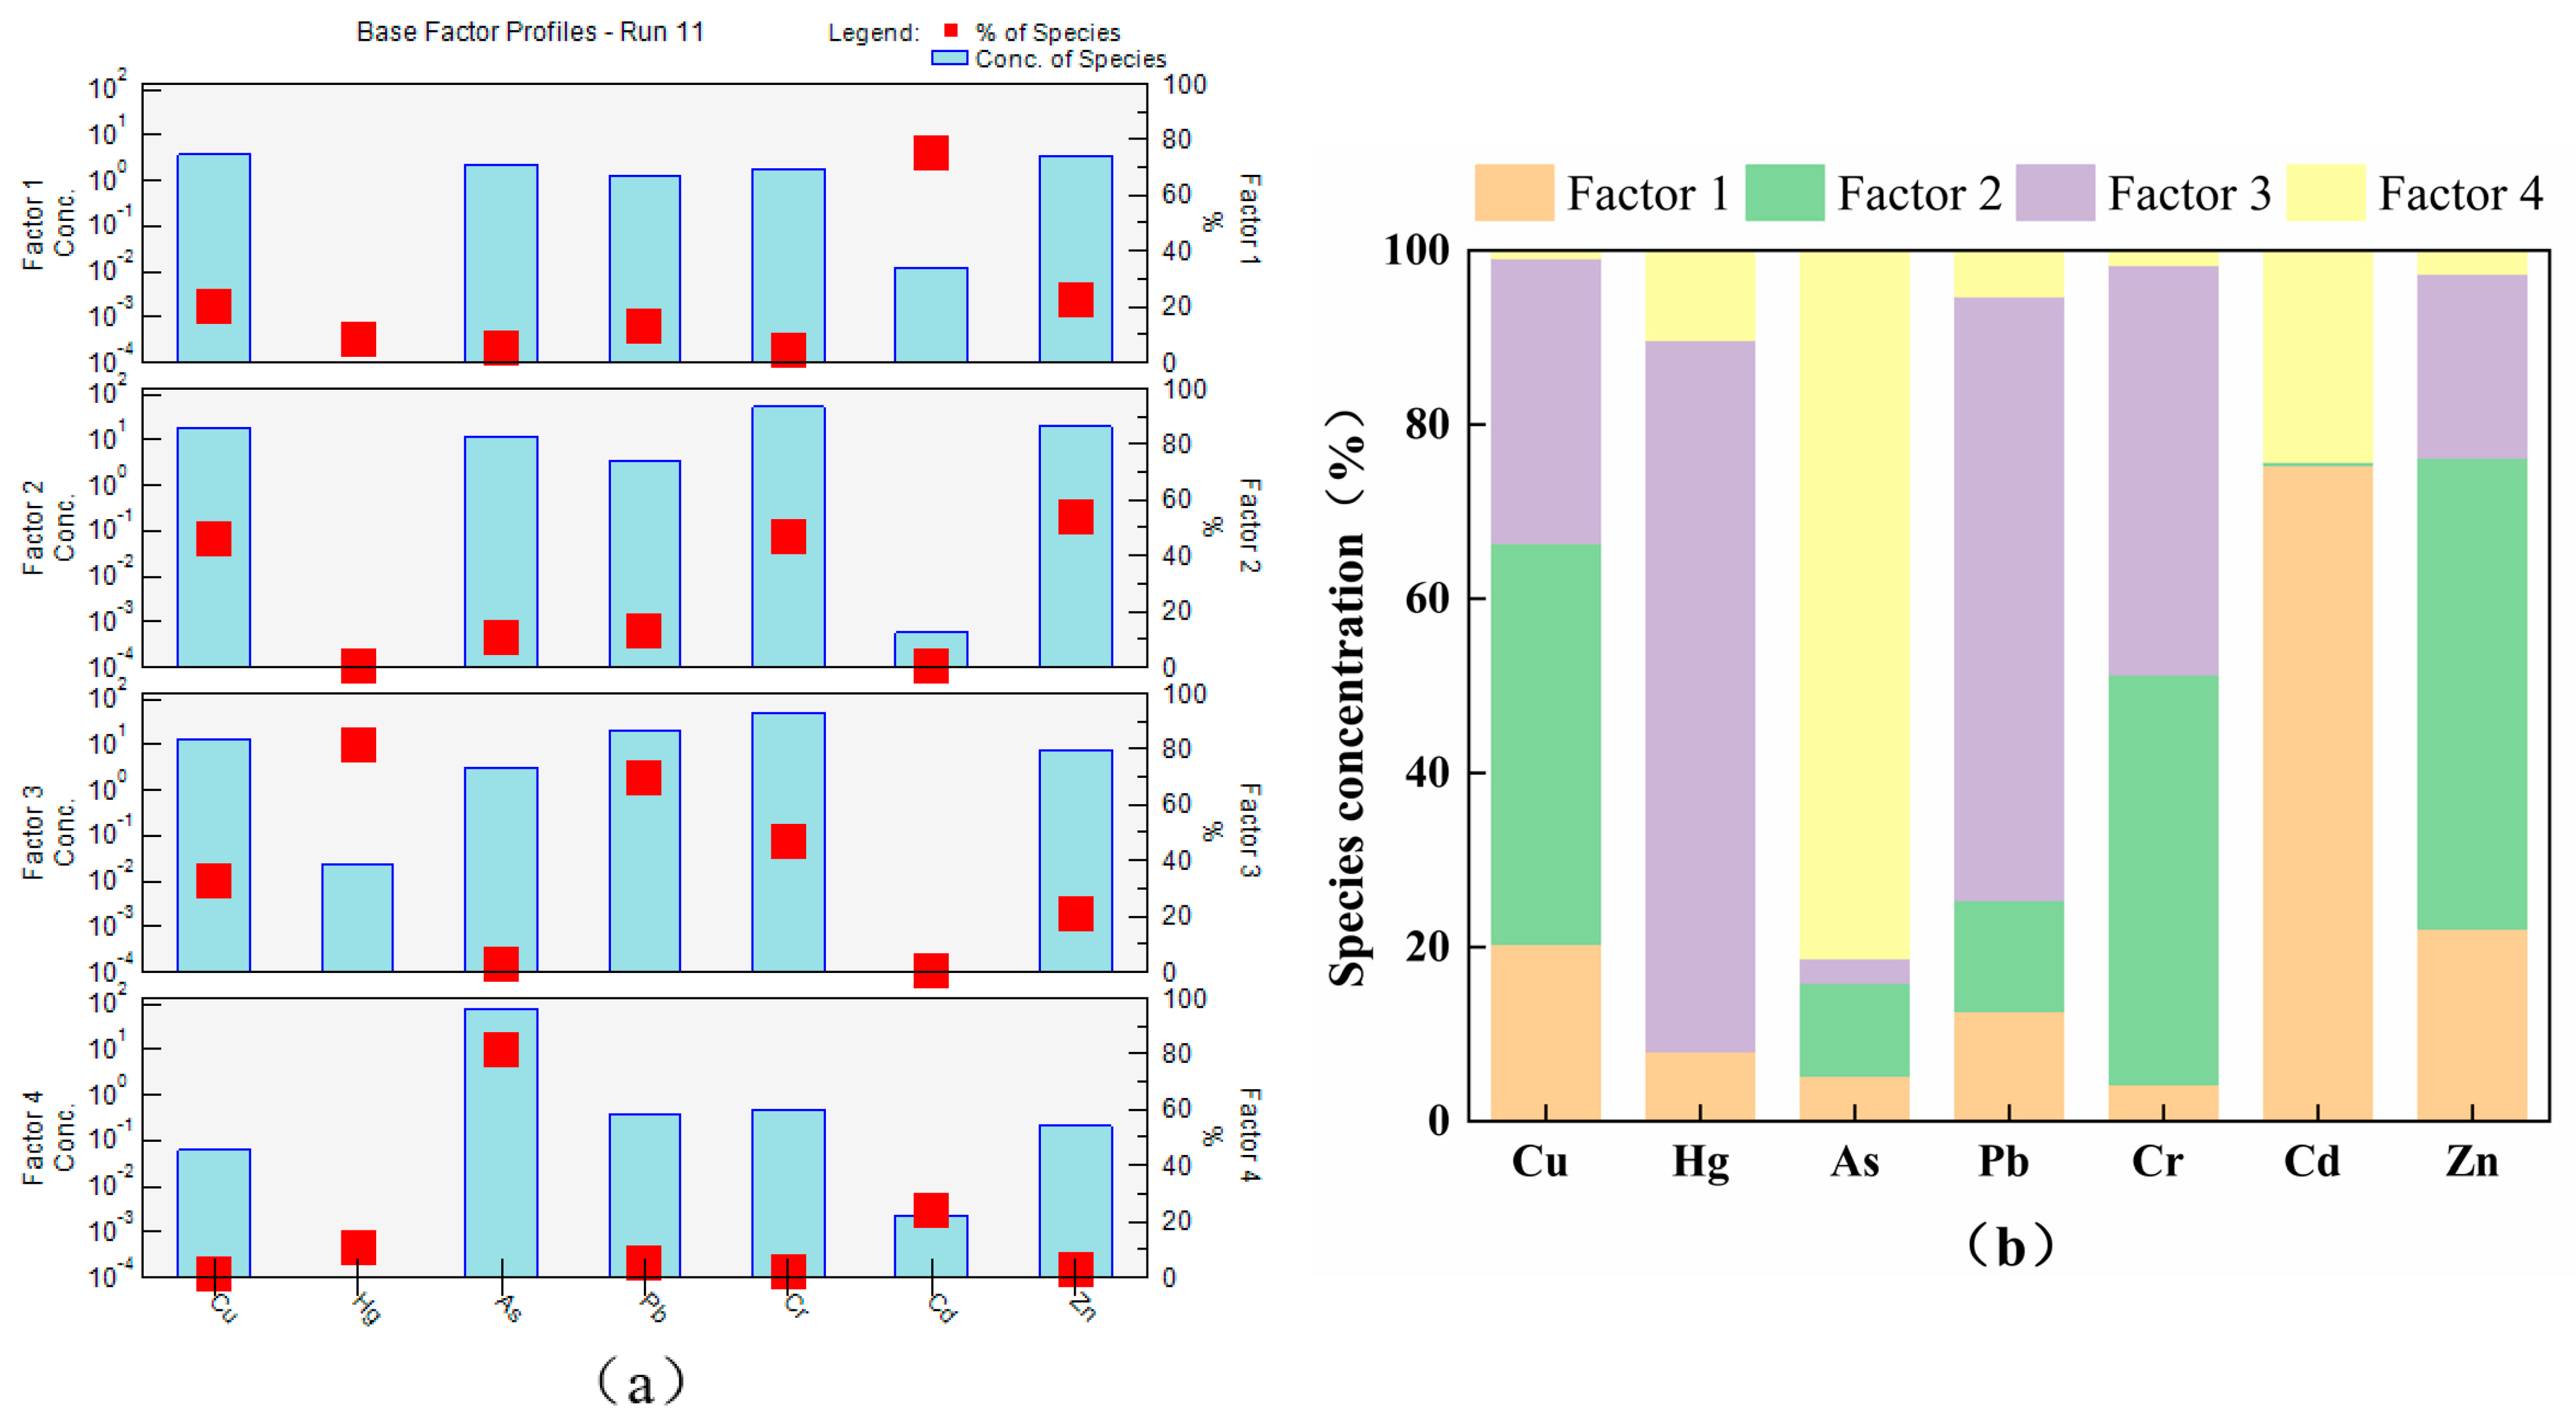
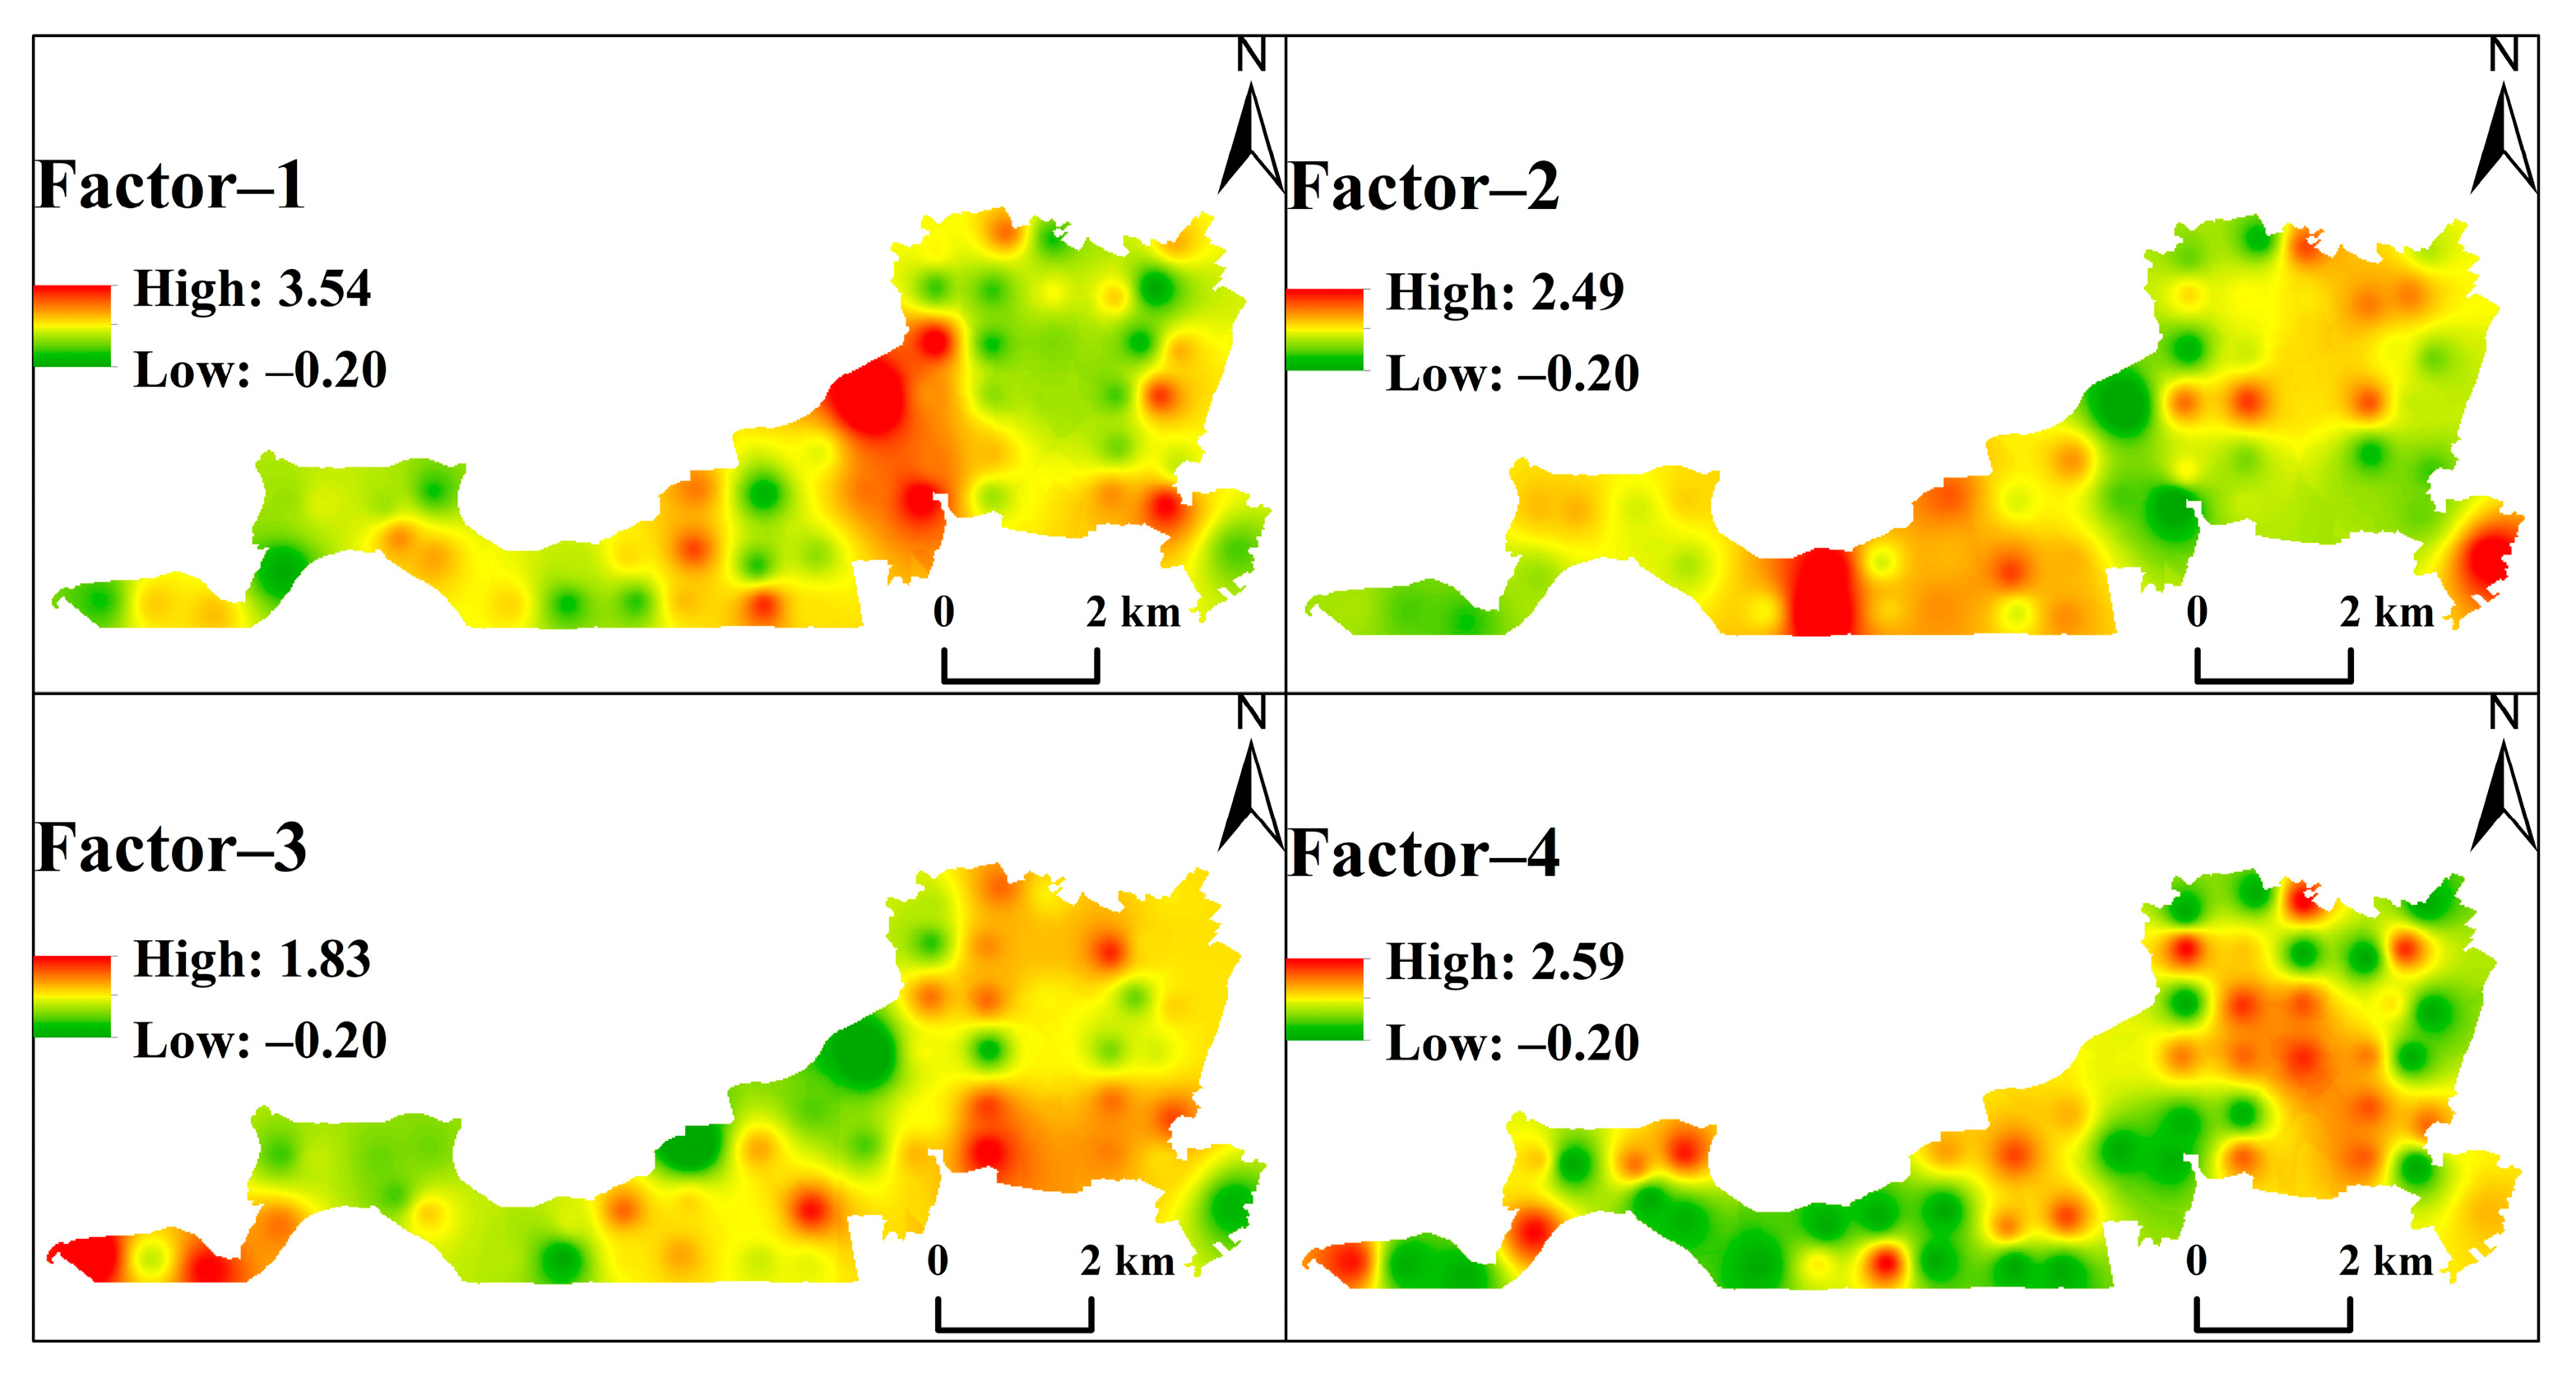
To improve the accuracy of the heavy metal source analysis, a combination of correlation analysis, PMF modelling and geostatistics was used to analyze the sources of the seven heavy metals in Tangwang Village. Visual correlation graphs were employed as a means to elucidate the fundamental associations among different attributes. A distinct and robust correlation indicates that these attributes may potentially be subject to influence from a shared origin. Based on the scatter plot displaying the matrix of Spearman correlation coefficients (*** p < 0.001, ** p < 0.01), notable associations can be observed between the Cu and Cr, Cr and Zn, Cu and Zn, Zn and CEC, pH and CEC, and SOM and TN indicators at the p < 0.001 level. Likewise, the Cu-CEC index also exhibits a significant correlation at the p < 0.01 level (Figure 3). The present study reveals notable associations between various elements, such as Cu, Hg, Pb, Cr, Cd, and Zn, indicating a positive correlation of moderate to strong magnitude. Moreover, a strong positive correlation is observed between Cu, Cr, Zn, pH, CEC, SOM, and TN. Additionally, a strong negative correlation is found between Cu and water content. These findings suggest a potential common origin of Cu, Cr, and Zn in the investigated region, while implying that CEC might exert a significant influence on the distribution and behavior of Cu and Zn.

3.2.2. PMF Parsing

The dataset was imported into the PMF model for analysis and the number of factors was set from two to seven and run 20 times each. The optimal number of factors was determined by comparing the Q(true)/Q(Robust) values for different numbers of factors. The results show that the model ran most consistently when the number of factors was 4, so the results of the run with this number of factors were taken as the best results.
Factor 1 accounted for 21.10% of the total sources, with the main loading elements being Cu, Cd, and Zn; Cd contributed to 75.3% of factor 1, followed by Zn at 22.1% and finally Cu at 20.3% (Figure 4 and Figure 5). The CVs of all three representative elements were greater than 0.2 and less than 0.5, indicating medium variability. In China, the elements Cu, Cd, and Zn are widely used in agricultural production [71]. Some researchers have found that to avoid pest infestation, farmers use pesticides such as insecticides, possibly leading to Cu accumulation risk in the soil [46]. According to Figure 1, over 90% of the study area was found to be arable. Some studies have shown that Cd is a signature element of farming and agricultural production [72]. Studies have shown that fertilizers, plastic films, atmospheric deposition, silt irrigation, and metal mining effluents all contribute to the accumulation of Cd in soils [34]. In this study, it was found that some farmers use plastic film to cover surfaces when growing crops such as maize, and that this film leads to increased levels of elemental Cd in soils. In addition, Cd is commonly found in chemical fertilizers and pesticides [73], and phosphate fertilizers are rich in Cd [74], which also led to increased Cd accumulated in the study area. Because of this, it is speculated that factor 1 may be sourced from agricultural practices.
Factor 2 accounted for 24.45% of the total sources, with high contribution loads from Cu (46.0%), Cr (47.1%), and Zn (54.1%), which can be considered as the signature elements of factor 2. Combined with the geostatistical approach, the distribution of Cu content in Figure 2 and Figure 5 is similar to the spatial distribution of factor 2. Previous studies have shown that Cu is least present in urban areas [74], and that the spatial variability of Cr is low [71]. The results of the description of soil heavy metal content show that the CV of elemental Cr was 0.34. As Cr also contributes highly to factor 2, it likely has multiple sources. Usually, Cr appears as an indicator of natural parent material, but in this study, the proportion of points where Cr exceeds the background value in Huainan City is 98.15%, which indicates a contaminated state, suggesting that Cr in the soil of this region is influenced by human activities. Comparing the spatial distribution of the elements (Figure 2 and Figure 5), the highest values of Cu, Cr, Zn, and factor 2 were all located in the central part of the sampling area, as well as small parts of the northeast. Combined with the other analyses, a significant correlation between Cu, Cr, and Zn can be found. The study area is in the north-central region of Anhui Province, close to the Xiejiaji mining area, which is rich in mineral resources; because of this, and based on the results of the analysis, factor 2 was determined to be a mixed source of natural parent material and mining activities.
Factor 3 was the largest of the four factors, accounting for 36.38% of the total sources, and was mainly composed of Hg (81.7%) and Pb (69.3%). The Ei values of these two representative elements were mostly distributed in the range of medium or slight ecological risk levels; the CVs were greater than 0.2. The CVs for factor 3 elements indicated high or low variability and the presence of enrichment, which implies that anthropogenic activities were the main source of soil Hg and Pb. Factor 3 was widely distributed in the study site (Figure 5). The study area was found to be connected to the Beijing–Shanghai line to the east and the Beijing–Kowloon line to the west, with roads in all directions and frequent traffic throughout the year, and the high Pb value area was found near the 102 provincial road, 206 railway, and Chu–Xin highway. It has been found that vehicle exhaust emissions, tire wear and tear, and leaded petrol can lead to large amounts of Pb entering the environment [75,76,77]. Overall, high values of Pb are mainly found in areas with heavy traffic, and vehicle emissions are an important source of Pb [78]. In addition, it has also been suggested that the impact of Hg pollution from vehicle exhausts has been neglected for a long time, and that road vehicle exhaust not only contributes to atmospheric Hg pollution but also Hg pollution of the soil and plants on both sides of the road [79]. Because of this, factor 3 was judged to be a transport source.
The Igeo (1.199) and CV (0.88) values for As were the highest among the seven elements in the study area. This indicates that As was significantly enriched in the study area and was strongly influenced by human activities. Some studies have reported that As in soils is closely related to iron plant production and that industrial activities are its main source [80]. In terms of spatial heterogeneity, As is influenced by structural factors, but there is point source contamination [81]. The spatial distribution of factor 4 shows that the high-value areas are concentrated in the central and northeastern parts of the study area. Many construction sites are also clustered in the central and northeastern part of the study area, which roughly corresponds to the areas of high values for factor 4, indicating that they are already influenced by exogenous inputs, most likely by industrial activities, transport, and reprocessing (Figure 1 and Figure 5). Metallurgical plants have also been found to significantly increase As levels [82]. In the present study, there were several plants located in the central and northeastern parts of the study area, which most likely contributed to the enrichment of elemental As. Therefore, factor 4 was defined as the industrial activity source.

3.3. Ecological Risk Assessment

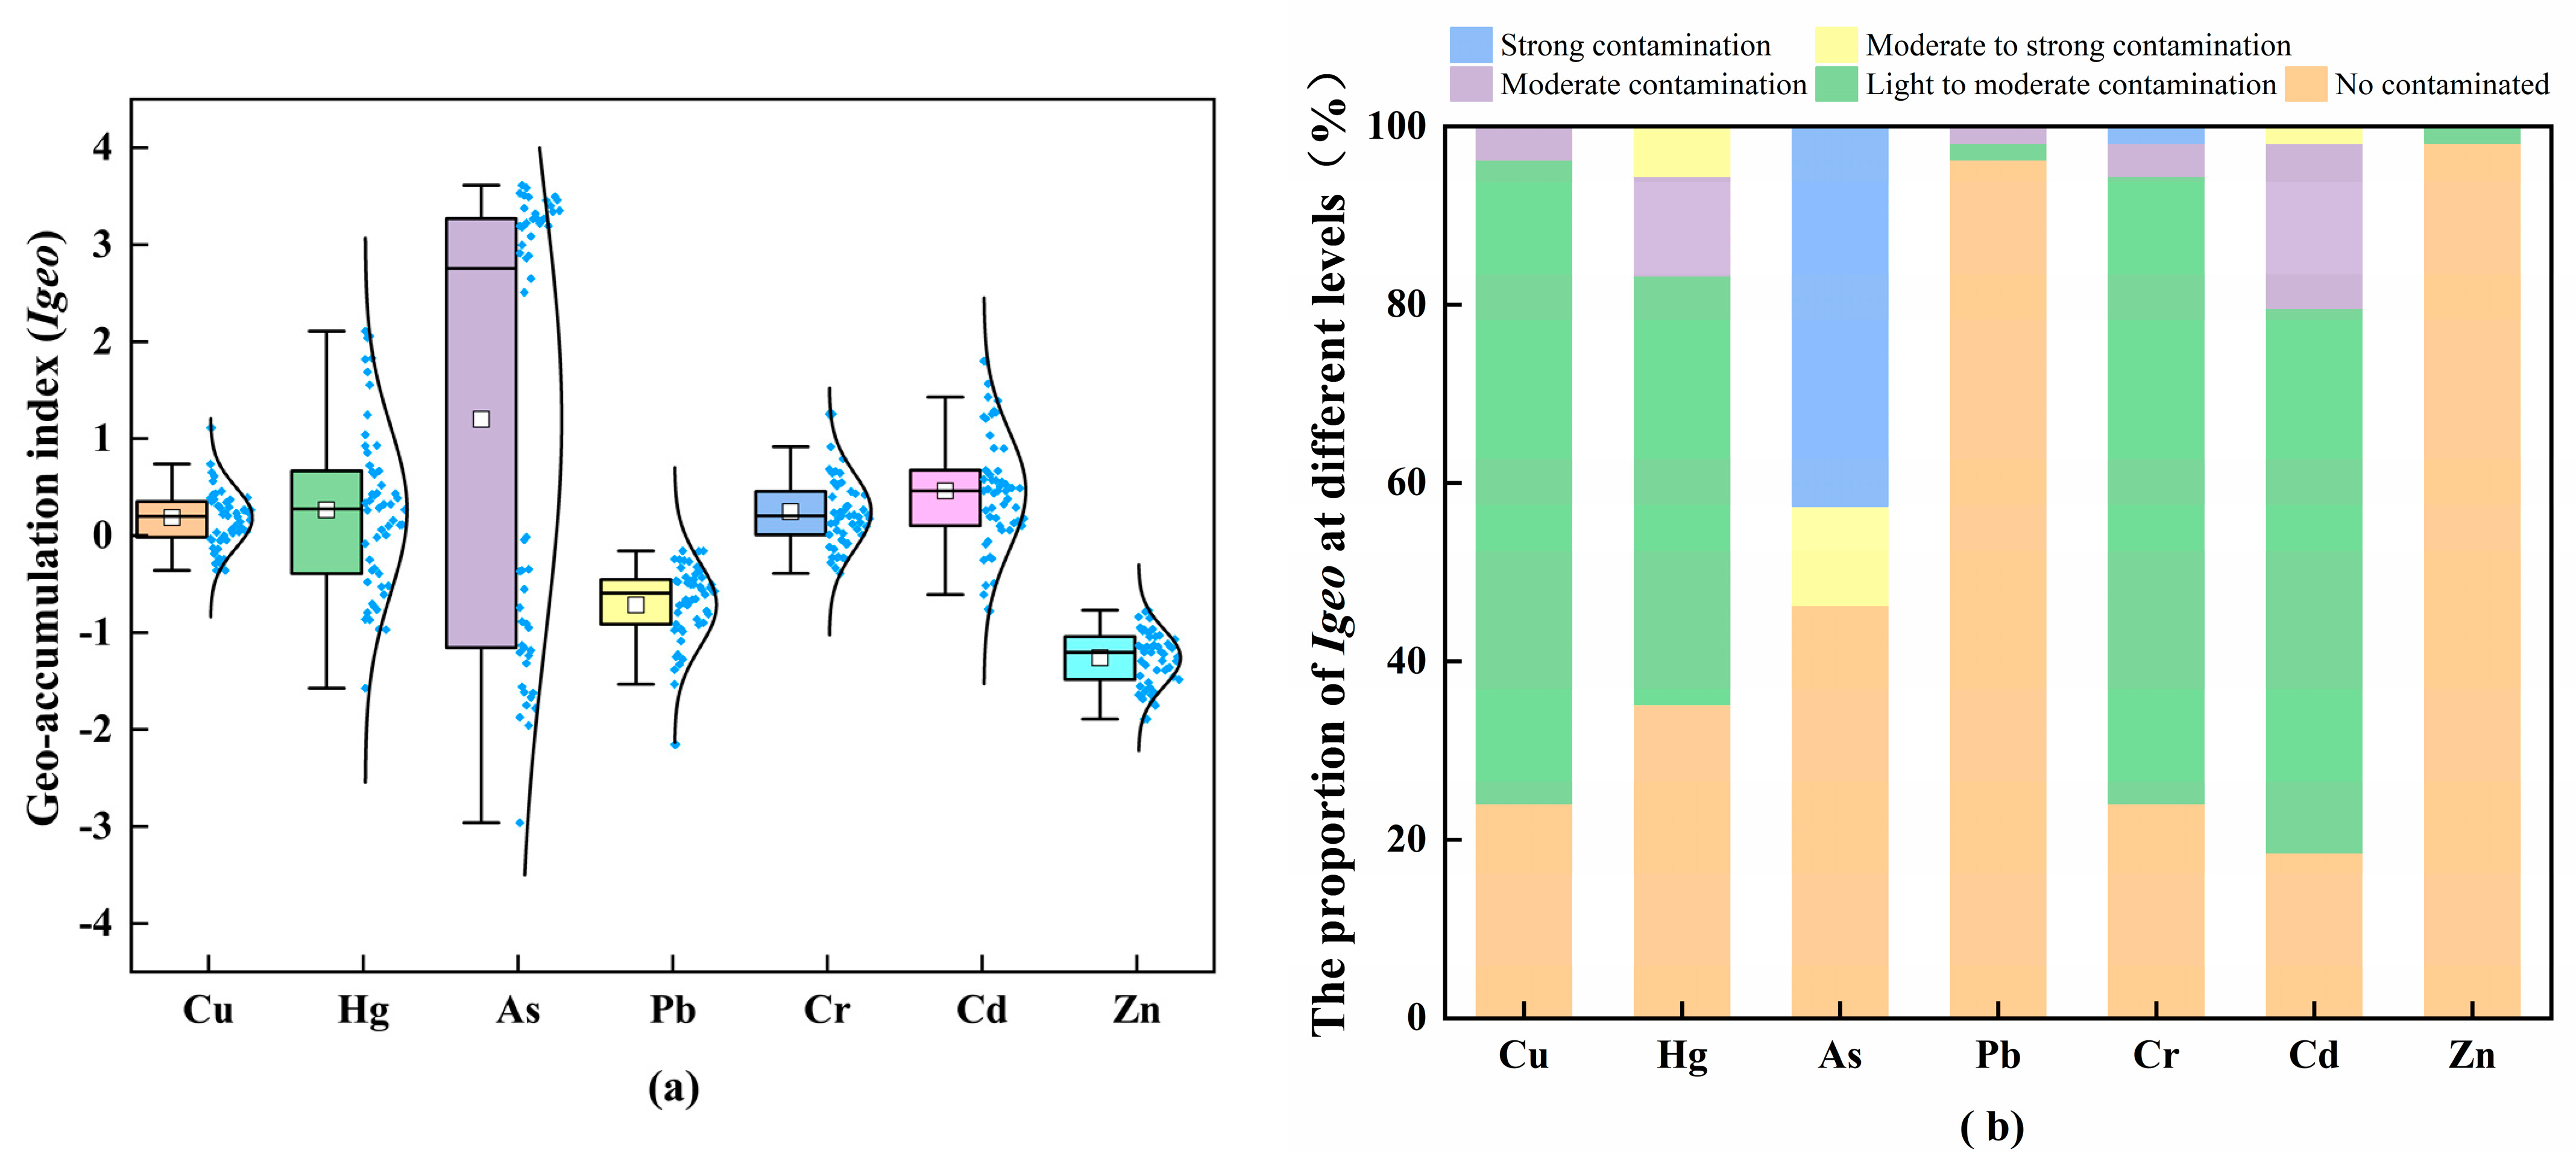
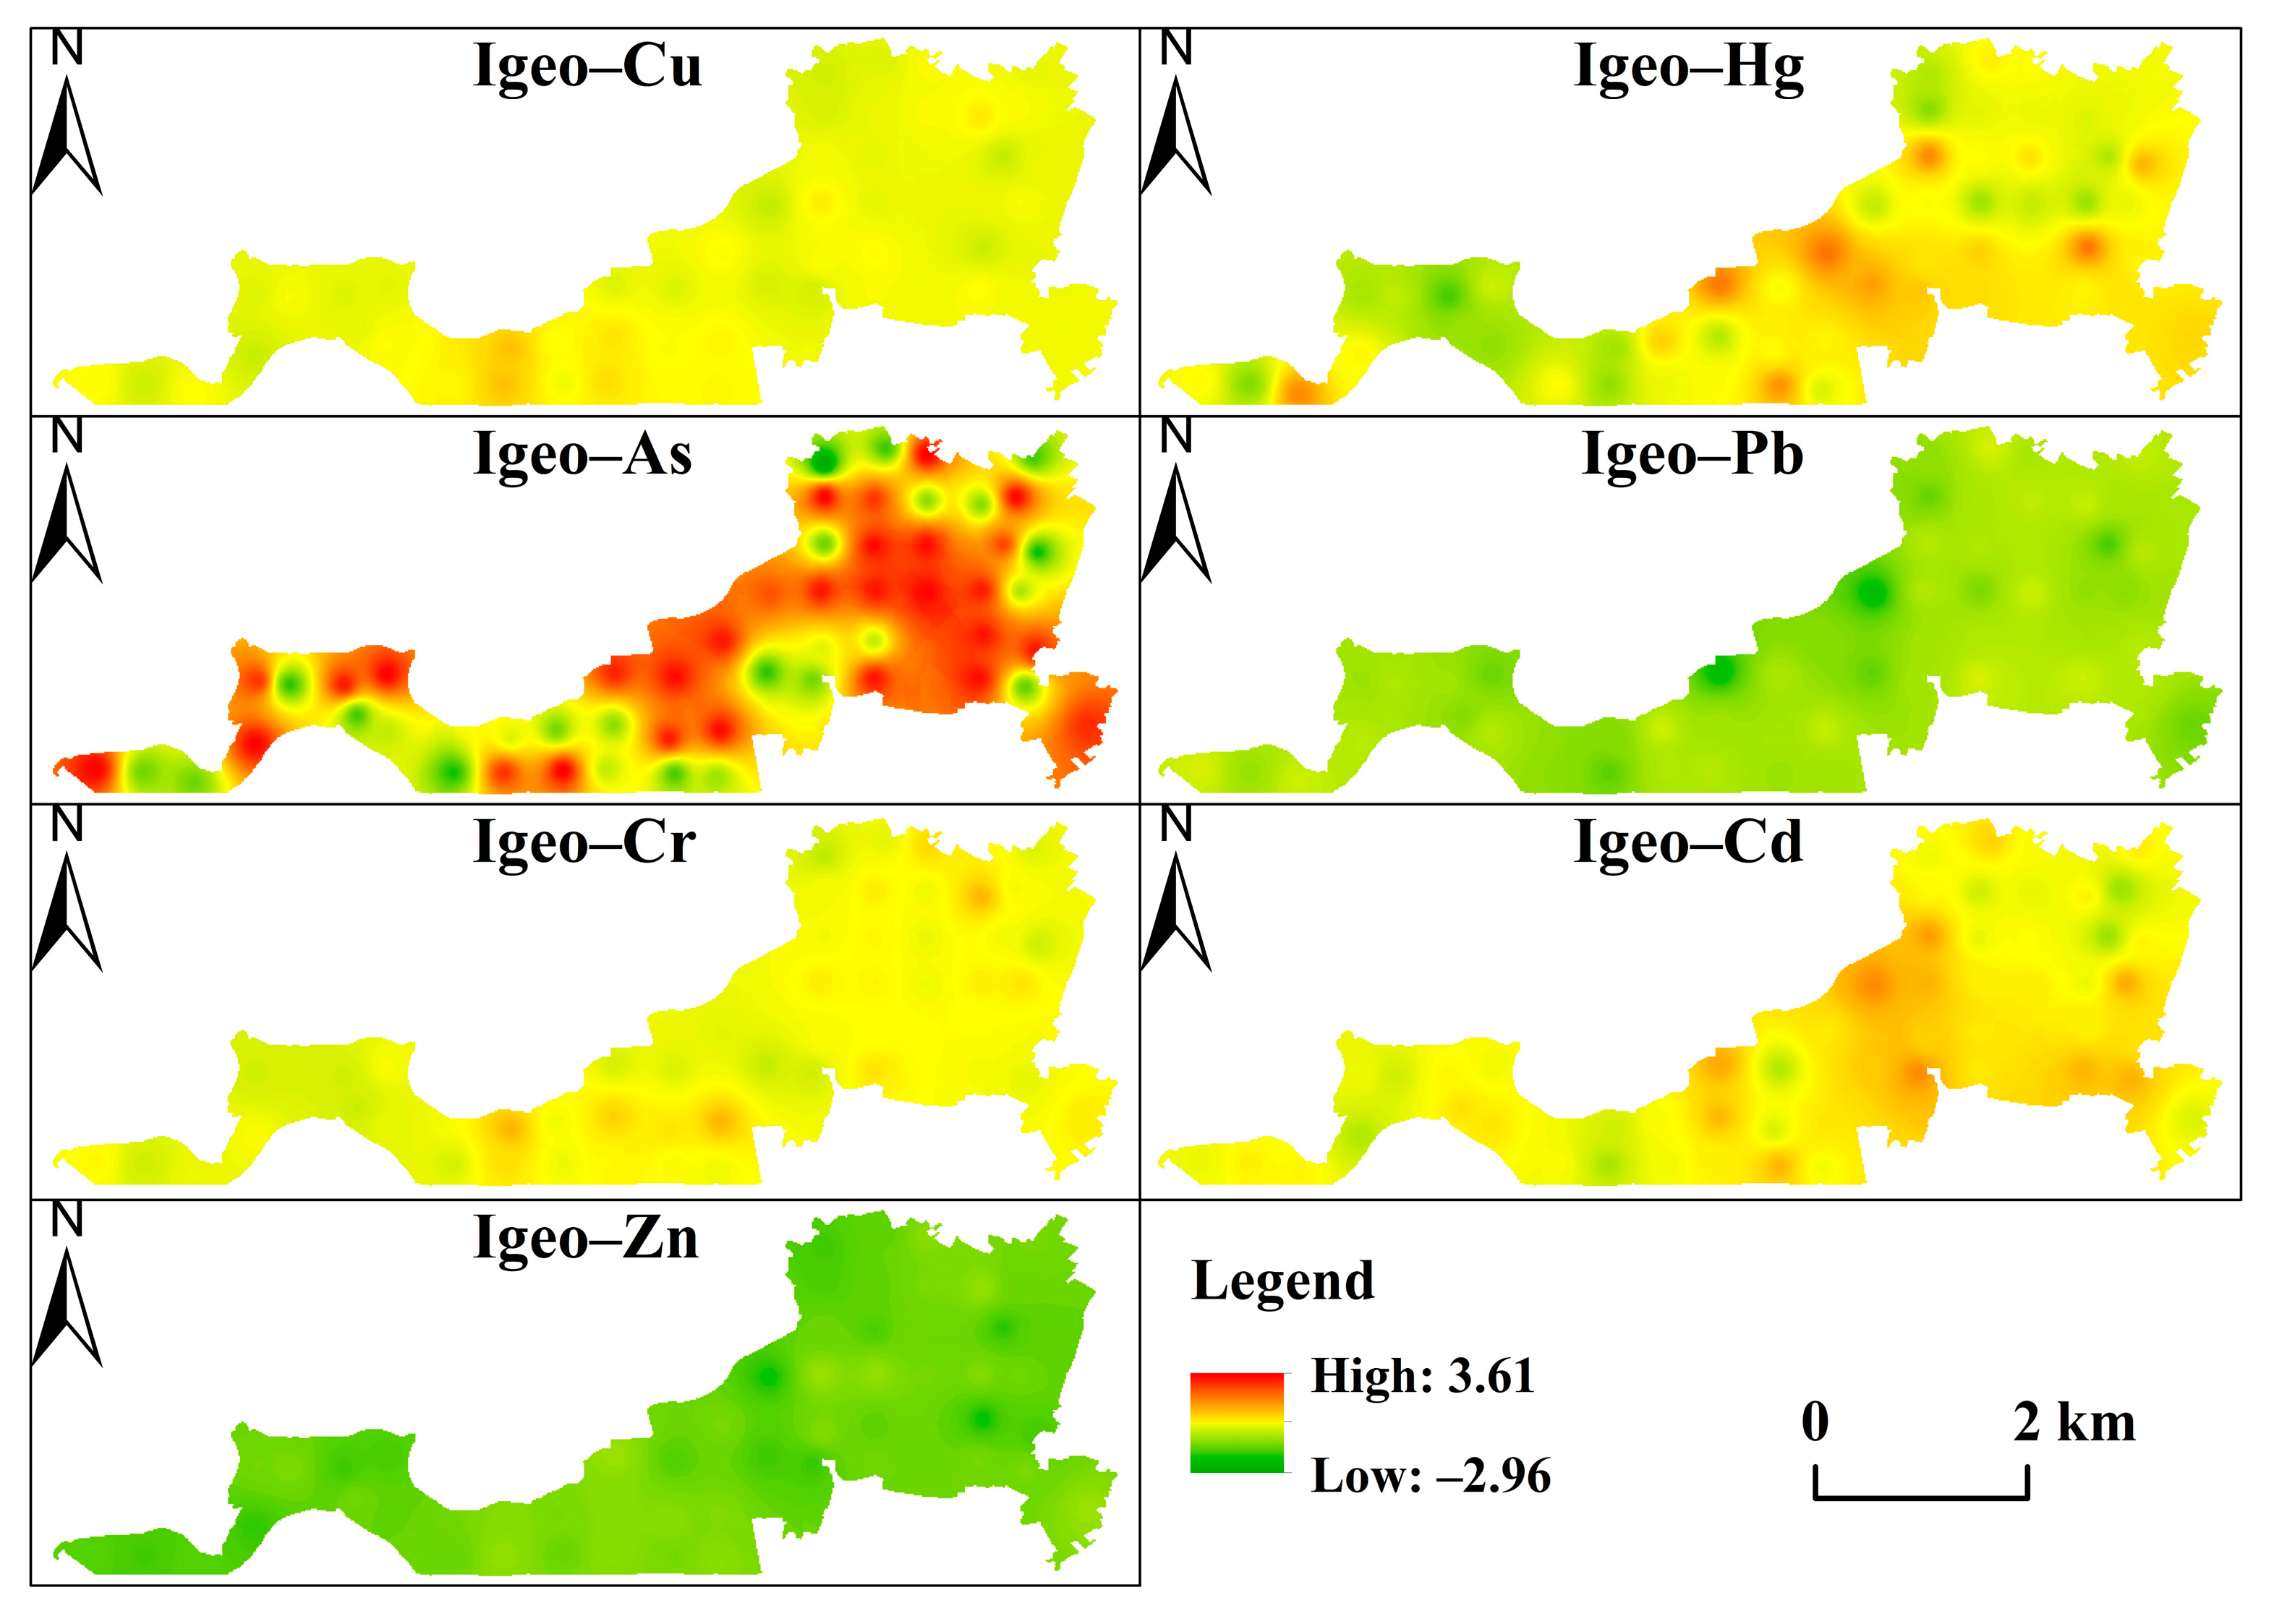
3.3.1. Geological Cumulative Index

The ranking of the mean Igeo values for each element was As (1.199) > Cd (0.462) > Hg (0.265) > Cr (0.247) > Cu (0.186) > Pb (−0.715) > Zn (−1.261) (Figure 6). According to the relevant grading standards in Table 2, the level of soil contamination due to As was determined to be the most severe and classified as moderate contamination. The level of contamination due to Cd, Hg, Cr, and Cu was determined to be the next most severe and classified as light to moderate contamination. The level of contamination due to Pb and Zn was found to be below the threshold and classified as uncontaminated. These results are generally consistent with the previous analysis. To more accurately evaluate the level of pollution in the study area, the results of different levels of Igeo were assessed (Figure 6), and the proportion of points with Igeo less than 0 among the seven elements in the overall sample was ranked as Zn > Pb > As > Hg > Cu > Cr > Cd. In particular, the Igeo values for As and Hg indicated moderate to strong contamination (between 2 and 4). The results of the Igeo study indicate the presence of anthropogenic influences and heavy metal contamination in the soils of the study area, particularly As, Cd, and Hg, mirroring similar findings in previous studies [78,83,84]; the distribution of the elements in Figure 7 is also consistent with the above analysis.

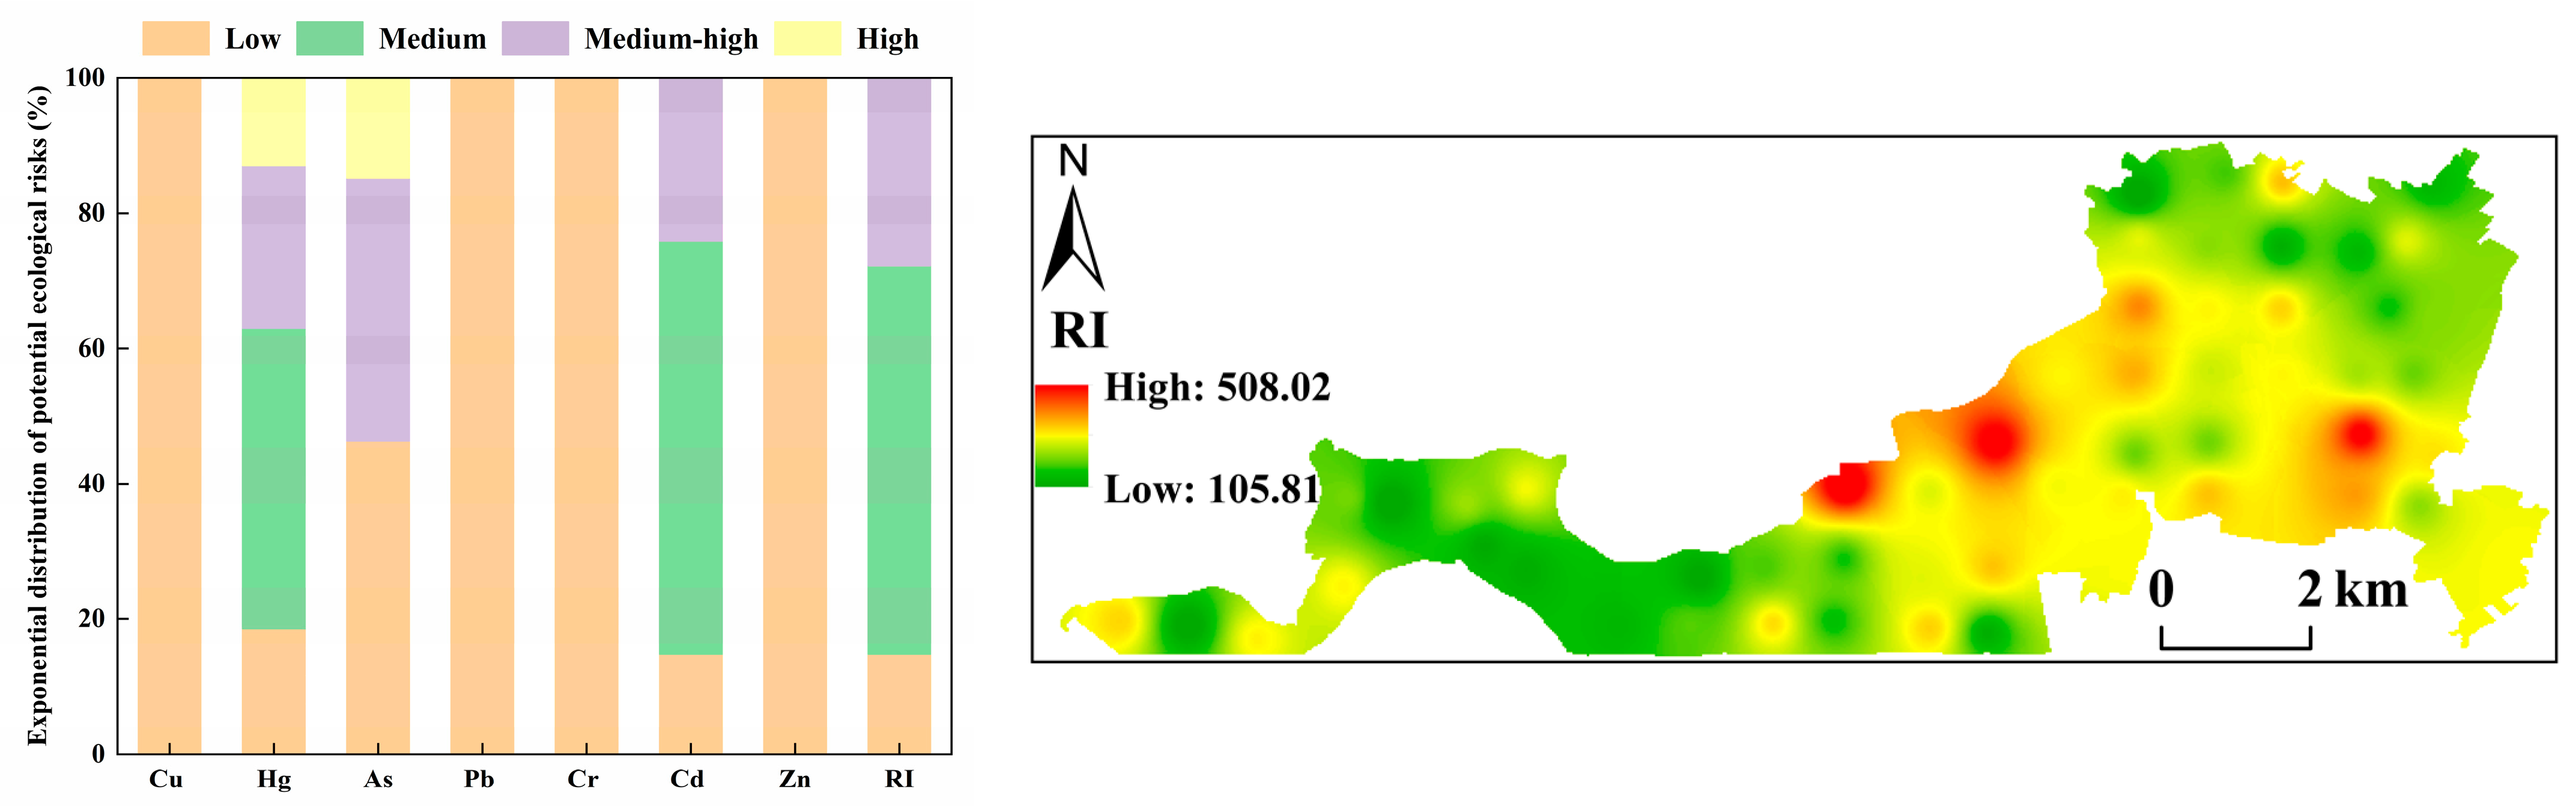
3.3.2. Potential Ecological Risk Evaluation

The ecological risk evaluation of heavy metal elements in the soil of Tangwang village was carried out by calculating their Ei and RI, where the toxicity response coefficients of Cu, Hg, As, Pb, Cr, Cd, and Zn were taken as 5, 40, 10, 5, 2, 30, and 1, respectively [30]. As shown in Table 6, the mean values of the Ei for each heavy metal element in the soil were E(Hg) = 86.81, E(As) = 80.67, E(Cd) = 67.83, E(Cu) = 8.74, E(Pb) = 4.75, E(Cr) = 3.63, and E(Zn) = 0.64. Cu, Pb, Cr, and Zn were generally in a low ecological risk state, Cd was in a medium ecological risk state, and Hg and As were in a medium-high ecological risk state, indicating that the main potential ecological risk elements in the study area were Hg, As, and Cd (Table 3). These findings are similar to those in previous studies [78,83]. This is mainly due to the high toxicity coefficients of these three heavy metal elements, resulting in high individual ecological risk indices. The maximum Ei values for Hg and As were 258.67 and 183.51, respectively, indicating strong ecological risk levels at some of the sample sites. In terms of the percentages of ecological risk at each level, the Ei values of Cu, Pb, Cr, and Zn were all distributed within the range of low ecological risk. These results are in line with the findings of other studies [83]. The percentages of As at each risk level were 46.30%, 38.89%, and 14.81%, respectively, for low, medium-high, and high risk, indicating that it was mainly found to present a low ecological risk. For Hg, the Ei percentages for each risk level were 18.52%, 44.44%, and 12.96%, respectively, and it was dominantly found to present a medium ecological risk. For Cd, the Ei percentages for each risk level were 14.81%, 61.11%, and 24.07%, respectively, mainly indicating that it presented a medium ecological risk (Table 8).
The calculation of the RI for heavy metals allowed the assessment of the degree of combined ecological risk. The results indicate that the RI values of the 54 soil samples range from 105.81 to 508.02, indicating a transition state from low to medium-high ecological risk. The mean value of RI in the study area was 253.08, which is less than 300, indicating that the majority of soils in the study area were in a moderate ecological risk state. In the study area, 14.81% of the sites had an RI of less than 150, indicating a low potential ecological hazard; 57.41% of the sites had an RI between 150 and 300, indicating a medium potential ecological risk, while 27.78% of the sites had an RI between 300 and 600, indicating a medium-high potential ecological risk. The high RI values were concentrated in the central and eastern parts of the study area (Figure 8).
In terms of areas with differing temperatures, cold spots make up 27.8% of the area, while hot spots account for 18.5%. The concentration of cold spots is higher in the southwest region, whereas the northeast region has a higher concentration of hot spots (Figure 9). According to Figure 1, the eastern part of Tangwang Village is the primary area with hot spots and sub-hot spots. This particular region is currently facing an increase in heavy metal pollution due to factors such as population growth, industrial activities, and agricultural practices. The zoning of heavy metal pollution hotspots in farmland can directly provide a spatial basis for the application of pollution control technologies in the later stage. This can reduce the cost of controlling heavy metal pollution in the surface soil of farmland, thereby better achieving food production security, promoting sustainable agricultural development, and ensuring the productivity of agricultural ecosystems. These factors comprise one of the UN’s SGDs, and can also provide data support for revealing the water–energy–food nexus. At the same time, it is crucial to prioritize the protection of arable land and the preservation of healthy soil in order to revitalize rural areas. This approach holds practical and long–term significance in terms of improving the quality of agricultural products, enhancing the ecological environment of rural settlements, and promoting the prosperity of rural farmers.

3.4. Health Risk Assessment

Human Health Risk Assessment

Using the health risk assessment methodology and parameters proposed in Section 2.5, non-carcinogenic risk values were calculated for seven heavy metals across different exposure routes (oral intake, oral–nasal inhalation, and dermal exposure). Carcinogenic risks were also calculated for four heavy metals (As, Pb, Cr, and Cd) for both children and adults across various exposure routes.
As can be seen from Table 9, the individual HQ values of heavy metals from different exposure routes varied widely, with oral ingestion > dermal contact > oral nasal inhalation; oral intake contributed the most to the non-carcinogenic risk in adults and children. The HI values for different heavy metals in descending order were As > Cr > Pb > Cd > Cu > Hg > Zn, with a range of 4.42 × 10⁻²–1.36 × 10² for children in the study area and 4.83 × 10⁻³–1.85 × 101 for adults. Overall, the HI values for children were found to be higher than those for adults, suggesting that children are more susceptible to the effects of heavy metals. This conclusion, which aligns with the results of previous research [84], indicates that children face a greater risk of non-carcinogenic health issues related to heavy metal exposure compared to adults in similar environments. For the non-carcinogenic heavy metal exposure risk indices for adults, the individual risk index HQs for Cu, Hg, Pb, Cd, and Zn for adults were all less than 1 for all three exposure pathways, indicating that the health effects of the five non-carcinogenic heavy metals on adults were not significant. The combined adult THI was 2.08 × 101 and was greater than one. While the individual HQ of the single heavy metals did not demonstrate a noteworthy impact, the collective presence of non-carcinogenic heavy metals in the vicinity had a considerable influence on the overall health of adults. Among these heavy metals, As stood out as the primary contributor to the THI, with a substantial contribution of 89.07%.
As can be seen in Table 10, regarding the CR of As, Pb, Cr, and Cd for children, the CR for each element under the three exposure routes was ranked as As > Cr > 10−4 > Pb > Cd > 10−6; for adults, the CR for each element was ranked as As > Cr > 10−4 > Pb > 10−6 > Cd. The CRij of As for children and adults by different routes of exposure was oral ingestion > 10−4 > dermal contact > 10−6 > oral nasal inhalation. Among these routes, oral ingestion is most significant, while oral nasal inhalation can be ignored. The TCR values for children and adults were 7.01 × 10⁻³ and 3.50 × 10⁻³, respectively. After separately calculating the results of CR/TCR, both displayed a value greater than 10−4, indicating a significant carcinogenic risk to human health from these elements.
Overall, the single heavy metal elements in Tangwang Village did not appear to pose a potential health risk to the surrounding area, but the TCR for children and adults from multiple elements was close to or partially above the risk threshold. In terms of HI and CR, the element that posed the greatest risk was As, which contributed 88.14 percent and 89.07 percent of the HI for children and adults, respectively, and 73.48 percent and 70.21 percent of the CR for children and adults, respectively. Based on the results of the previous source analyses, As was found to originate from industrial activities, indicating that more targeted policy measures are needed for subsequent pollution prevention and control.

4. Conclusions

This paper presents a study of 54 surface soil samples from the outskirts of Huainan City. The main conclusions are as follows:
(1)
The results indicate that, apart from Zn, the average values of the other six heavy metals analyzed (Cu, Hg, As, Pb, Cr, and Cd) were higher than the background values of soil elements in Huainan City. This suggests that the heavy metal content of the arable soils in the study area has been affected by human impact, with most being found to be enriched and some showing local enrichment of Zn.
(2)
The study found that high concentrations of As, Pb, Cr, and Zn were mainly located in the central and northeastern parts of the study area, while Cu and Cd showed distinct peaks in certain areas. Hg was only found in one specific location with high values.
(3)
Following correlation and PMF model analysis, the study area was found to have four sources of soil heavy metals: agricultural practices, mixed sources of natural parent material and mining activities, transport sources, and industrial activities. These sources contributed 21.10%, 24.45%, 36.38%, and 18.07%, respectively, of the total metal concentration. This study revealed that agricultural practices, transport, and industrial activities are the primary sources of heavy metal contamination in arable soils in this region.
(4)
The final health risk assessment analysis of the study area found that As, Cd, Hg, Cr, and Cu had significant levels of contamination. In terms of RI, the entire region is situated within the transitional range from low ecological risk to medium-high ecological risk. In the human health risk assessment, the total carcinogenic risk for children and adults from multiple elements was close to or partially above the risk threshold, with As posing the greatest risk to children and adults, both in terms of non-carcinogenic and carcinogenic risk.
The outcomes of this survey will act as a catalyst for the implementation of fundamental soil management strategies, with the goal of mitigating soil pollution. Concurrently, it can also contribute in a modest manner towards the enhancement of land productivity and ecosystem services, while promoting the advancement of sustainable agricultural practices. Furthermore, it will aid in the identification and prioritization of soil areas that require protection, thus revitalizing rural regions.

Author Contributions

Formal analysis, Y.L. and S.L.; Methodology, Y.L.; Investigation, Y.L., W.S., K.F. and W.P.; Writing original manuscript, Y.L. and W.S.; Experiment, W.S., K.F. and W.P. All authors have read and agreed to the published version of the manuscript.

Funding

This work was supported by the Science Research Fund for Young Teachers of Anhui University of Science and Technology (Grant number XCZX2021-02) and the National Natural Science Foundation of China (Grant number 52204181).

Data Availability Statement

The data presented in this study are available from the corresponding author upon reasonable request.

Conflicts of Interest

The authors declare no conflicts of interest.

References

  1. D’Odorico, P.; Davis, K.F.; Rosa, L.; Carr, J.A.; Chiarelli, D.; Dell’Angelo, J.; Gephart, J.; MacDonald, G.K.; Seekell, D.A.; Suweis, S.; et al. The Global Food-Energy-Water Nexus. Rev. Geophys. 2018, 56, 456–531. [Google Scholar] [CrossRef]
  2. Han, R.; Feng, C.-C.; Xu, N.; Guo, L. Spatial heterogeneous relationship between ecosystem services and human disturbances: A case study in Chuandong, China. Sci. Total Environ. 2020, 721, 137818. [Google Scholar] [CrossRef]
  3. Sarkar, D.; Dubey, P.K.; Chaurasiya, R.; Sankar, A.; Shikha; Chatterjee, N.; Ganguly, S.; Meena, V.S.; Meena, S.K.; Parewa, H.P.; et al. Organic interventions conferring stress tolerance and crop quality in agroecosystems during the UN Decade on Ecosystem Restoration. Land Degrad. Dev. 2021, 32, 4797–4816. [Google Scholar] [CrossRef]
  4. Heinze, A.; Bongers, F.; Ramírez Marcial, N.; García Barrios, L.E.; Kuyper, T.W. Farm diversity and fine scales matter in the assessment of ecosystem services and land use scenarios. Agric. Syst. 2022, 196, 103329. [Google Scholar] [CrossRef]
  5. Sousa Rd Bragança, L.; da Silva, M.V.; Oliveira, R.S. Challenges and Solutions for Sustainable Food Systems: The Potential of Home Hydroponics. Sustainability 2024, 16, 817. [Google Scholar] [CrossRef]
  6. Kurmi, B.; Nath, A.J.; Sileshi, G.W.; Pandey, R.; Das, A.K. Impact of progressive and retrogressive land use changes on ecosystem multifunctionality: Implications for land restoration in the Indian Eastern Himalayan region. Sci. Total Environ. 2024, 912, 169197. [Google Scholar] [CrossRef]
  7. Lasanta, T.; Cortijos-López, M.; Errea, M.P.; Llena, M.; Sánchez-Navarrete, P.; Zabalza, J.; Nadal-Romero, E. Shrub clearing and extensive livestock as a strategy for enhancing ecosystem services in degraded Mediterranean mid-mountain areas. Sci. Total Environ. 2024, 906, 167668. [Google Scholar] [CrossRef]
  8. Testa, S.; Nielsen, K.R.; Vallentin, S.; Ciccullo, F. Sustainability-oriented innovation in the agri-food system: Current issues and the road ahead. Technol. Forecast. Soc. Chang. 2022, 179, 121653. [Google Scholar] [CrossRef]
  9. SDGs UNSDGU. Sustainable Development Goals. 2022. Available online: https://www.un.org/development/desa/dspd/2022/07/sdgs-report/ (accessed on 22 January 2024).
  10. Traverso, M.; Nangah Mankaa, R. The Palgrave Handbook of Global Sustainability; Palgrave Macmillan: Cham, Switzerland, 2023; pp. 1255–1277. [Google Scholar] [CrossRef]
  11. UN-SDGs. United Nations Sustainable Development Goals Platform. 2019. Available online: https://unstats.un.org/sdgs/report/2019/#sdg-goals (accessed on 22 January 2024).
  12. Publication EDoT. Introduction to the Special Topic of ‘Farmland Protection and Food Security. Trans. Chin. Soc. Agric. Eng. 2020, 36, 3. [Google Scholar]
  13. Sang, L.L.; Yun, W.J.; Tang, H.Z.; Zhang, C.; Cheng, F. Analysis and Countermeasures on the Current Situation of China’s Farmland Resource Survey and Monitoring. Agric. Compr. Dev. China 2022, 11, 18–20. [Google Scholar]
  14. Xu, Y.D.; Zhang, Y.L. The Profound Connotation and Key Measures to Consolidate the Foundation of Food Security in the New Journey. J. Northwest A&F Univ. 2023, 23, 95–103. [Google Scholar] [CrossRef]
  15. Council OotL Gft TNL SotS; Resources MoN; Statistics NBo. The main data bulletin of the Third National Land Survey. Natl. Land Resour. Inf. 2021, 17, 7–8. [Google Scholar] [CrossRef]
  16. Ren, Y.; Cao, W.G.; Xiao, S.Y.; Li, X.Z.; Pan, D.; Wang, S. Research progress on distribution, harm and control technology of heavy metals in soil. Geol. China 2023, 51, 1–32. [Google Scholar] [CrossRef]
  17. Li, C.; Sanchez, G.M.; Wu, Z.; Cheng, J.; Zhang, S.; Wang, Q.; Li, F.; Sun, G.; Meentemeyer, R.K. Spatiotemporal patterns and drivers of soil contamination with heavy metals during an intensive urbanization period (1989–2018) in southern China. Environ. Pollut. 2020, 260, 114075. [Google Scholar] [CrossRef]
  18. Wang, Y.; Cheng, H. Soil heavy metal(loid) pollution and health risk assessment of farmlands developed on two different terrains on the Tibetan Plateau, China. Chemosphere 2023, 335, 139148. [Google Scholar] [CrossRef] [PubMed]
  19. Zheng, Y.J.; Gu, F.; Jiu, L.X.; Ren, C.P.; Tian, M.S.; Luo, Y.F.; Li, S.L. Heavy metals contents and sources in soil of typical farmland in Wumeng Mountain, Southwest China. Environ. Pollut. Control 2023, 45, 829–836. [Google Scholar] [CrossRef]
  20. Lu, D.; Zhang, C.; Zhou, Z.; Huang, D.; Qin, C.; Nong, Z.; Ling, C.; Zhu, Y.; Chai, X. Pollution characteristics and source identification of farmland soils in Pb–Zn mining areas through an integrated approach. Environ. Geochem. Health 2023, 45, 2533–2547. [Google Scholar] [CrossRef] [PubMed]
  21. Nuralykyzy, B.; Wang, P.; Deng, X.; An, S.; Huang, Y. Heavy Metal Contents and Assessment of Soil Contamination in Different Land-Use Types in the Qaidam Basin. Sustainability 2021, 13, 12020. [Google Scholar] [CrossRef]
  22. Ning, W.J.; Xie, X.M.; Yan, L.P. Spatial distribution, sources and health risks of heavy metals in soil in Qingcheng District, Qingyuan City: Comparison of PCA and PMF model results. Earth Sci. Front. 2023, 30, 470–484. [Google Scholar] [CrossRef]
  23. Adimalla, N. Heavy metals contamination in urban surface soils of Medak province, India, and its risk assessment and spatial distribution. Environ. Geochem. Health 2019, 42, 59–75. [Google Scholar] [CrossRef]
  24. Fei, X.F.; Lou, Z.H.; Xiao, R.; Ren, Z.Q.; Lv, X.N. Source analysis and source-oriented risk assessment of heavy metal pollution in agricultural soils of different cultivated land qualities. J. Clean. Prod. 2022, 341, 130942. [Google Scholar] [CrossRef]
  25. Yuan, S.; Zhang, S.; Sun, Y.; Guo, M. Analysis of Pollution Sources of Heavy Metal in Farmland Soils Based on Positive Matrix Factorization Model; IOP Publishing: Bristol, UK, 2020; p. 012013. [Google Scholar]
  26. Ma, J.; Chen, L.; Chen, H.; Wu, D.; Ye, Z.; Zhang, H.; Liu, D. Spatial distribution, sources, and risk assessment of potentially toxic elements in cultivated soils using isotopic tracing techniques and Monte Carlo simulation. Ecotoxicol. Environ. Saf. 2023, 259, 115044. [Google Scholar] [CrossRef] [PubMed]
  27. Anaman, R.; Peng, C.; Jiang, Z.; Liu, X.; Zhou, Z.; Guo, Z.; Xiao, X. Identifying sources and transport routes of heavy metals in soil with different land uses around a smelting site by GIS based PCA and PMF. Sci. Total Environ. 2022, 823, 153759. [Google Scholar] [CrossRef] [PubMed]
  28. Li, J.; Teng, Y.G.; Wu, J.; Jiang, J.Y.; Huang, Y. Source Apportionment of Soil Heavy Metal in the Middle and Upper Reaches of Le’an River based on PMF Model and Geostatistics. Res. Environ. Sci. 2019, 32, 984–992. [Google Scholar] [CrossRef]
  29. Liang, C.; Gong, S. Pollution characteristics and source apportionment of ambient PM2.5 from Jinshui District of Zhengzhou in winter. Environ. Prot. Sci. 2023, 49, 102–109+144. [Google Scholar] [CrossRef]
  30. Sylla, M.; Swiader, M.; Vicente-Vicente, J.L.; Arciniegas, G.; Wascher, D. Assessing food self-sufficiency of selected European Functional Urban Areas vs metropolitan areas. Landsc. Urban Plan. 2022, 228, 104584. [Google Scholar] [CrossRef]
  31. Li, K.; Wang, J.; Zhang, Y. Heavy metal pollution risk of cultivated land from industrial production in China: Spatial pattern and its enlightenment. Sci. Total Environ. 2022, 828, 154382. [Google Scholar] [CrossRef]
  32. Yu, F.; Wang, J.B.; Wang, R.; Wang, Y.; Ning, M.H.; Zhang, Y.Y.; Su, L.M.; Dong, J.X. Source Analysis and Ecological Risk Assessment of Heavy Metals in the Arable Soil at the Geological High Background, Based on the Township Scale. Environ. Sci. 2023, 44, 2838–2848. [Google Scholar] [CrossRef]
  33. Jin, Y.L.; O’Connor, D.; Ok, Y.S.; Tsang, D.C.W.; Liu, A.; Hou, D.Y. Assessment of sources of heavy metals in soil and dust at children’s playgrounds in Beijing using GIS and multivariate statistical analysis. Environ. Int. 2019, 124, 320–328. [Google Scholar] [CrossRef]
  34. Hu, B.; Shao, S.; Ni, H.; Fu, Z.; Hu, L.; Zhou, Y.; Min, X.; She, S.; Chen, S.; Huang, M.; et al. Current status, spatial features, health risks, and potential driving factors of soil heavy metal pollution in China at province level. Environ. Pollut. 2020, 266, 114961. [Google Scholar] [CrossRef]
  35. Xiao, P.N.; Zhou, Y.; Li, X.G.; Xu, J.; Zhao, C. Assessment of Heavy Metals in Agricultural Land: A Literature Review Based on Bibliometric Analysis. Sustainability 2021, 13, 4559. [Google Scholar] [CrossRef]
  36. Li, Z.H.; He, W.; Cheng, M.F.; Hu, J.X.; Yang, G.Y.; Zhang, H.Y. SinoLC-1: The first 1-meter resolution national-scale land-cover map of China created with the deep learning framework and open-access data. Earth Syst. Sci. Data Discuss. 2023, 2023, 1–38. [Google Scholar] [CrossRef]
  37. Centre CNEM, Station NEMC. Technical Specification for Soil Environmental Monitoring; The State Administration of Environmental Protection; Ministry of Ecology and Environment of People’s Republic of China: Beijing, China, 2004; p. 38.
  38. Chen, N.; Ren, N. On the testing of the heavy matel in soil with induction coupled plasma emission spectrometry. Yunnan Geol. 2019, 38, 141–144. [Google Scholar] [CrossRef]
  39. Geosciences CUO; Institute HGER; Center CGSD; Institute of Geophysical and Geochemical Exploration CAoGS. Specification of Land Quality Geochemical Assessment; Ministry of Land and Resources of the People’s Republic of China: Beijing, China, 2016; pp. 1–57.
  40. Shi, W.; Zhou, H.; Sun, T.; Huang, J.; Yang, W.; Li, W. Research on Priority Control Factors and Health Risk Assessment of Heavy Metal Pollution in Soil Around Mining Areas. Ecol. Environ. Sci. 2022, 31, 1616–1628. [Google Scholar] [CrossRef]
  41. Norris, G.; Duvall, R.; Brown, S.; Bai, S. EPA Positive Matrix Factorization (PMF) 5.0 Fundamentals and User Guide; US Environmental Protection Agency. National Expo Res Lab Res Triangle Park: Petaluma, CA, USA, 2014; pp. 1–136.
  42. Guan, Q.; Wang, F.; Xu, C.; Pan, N.; Lin, J.; Zhao, R.; Yang, Y.; Luo, H. Source apportionment of heavy metals in agricultural soil based on PMF: A case study in Hexi Corridor, northwest China. Chemosphere 2018, 193, 189–197. [Google Scholar] [CrossRef] [PubMed]
  43. Ma, J.; Shen, Z.J.; Zhang, P.P.; Liu, P.; Liu, J.Z.; Sun, J.; Wang, L.L. Pollution Characteristics and Source Apportionment of Heavy Metals in Farmland Soils Around the Gangue Heap of Coal Mine Based on APCS-MLR and PMF Receptor Model. Environ. Sci. 2023, 44, 2192–2203. [Google Scholar] [CrossRef]
  44. Shen, C.Y.; Yan, Y.; Yu, R.L.; Hu, G.R.; Cui, J.Y.; Yan, Y.; Huang, H.B. APCS-MLR Combined with PMF Model to Analyze the Source of Metals in Sediment of Xinglin Bay Suburban Watershed, Xiamen. Environ. Sci. 2022, 43, 2476–2488. [Google Scholar] [CrossRef]
  45. Wang, Y.N.; Li, Y.R.; Yang, S.Y.; Liu, J.; Zheng, W.; Xu, J.M.; Cai, H.M.; Liu, X.M. Source apportionment of soil heavy metals: A new quantitative framework coupling receptor model and stable isotopic ratios. Environ. Pollut. 2022, 314, 120291. [Google Scholar] [CrossRef]
  46. Xia, Z.S.; Bai, Y.R.; Wang, Y.Q.; Gao, X.L.; Ruan, X.H.; Zhong, Y.X. Spatial Distribution and Source Analysis of Soil Heavy Metals in a Small Watershed in the Mountainous Area of Southern Ningxia Based on PMF Model. Environ. Sci. 2022, 43, 432–441. [Google Scholar] [CrossRef]
  47. Zhu, X.L.; Xue, B.Q.; Li, X.; Wang, J.Q.; Shang, X.Q.; Chen, C.; Geng, P.Y.; Kou, Z.J.; Ma, X.J. Sources apportionment of heavy metals in farmland soil around lead-zinc tailings reservoir based on PMF model. J. Northwest Univ. 2021, 51, 43–53. [Google Scholar] [CrossRef]
  48. Muller, G. Index of geoaccumulation in sediments of the Rhine River. Geojournal 1969, 2, 108–118. [Google Scholar]
  49. Wu, J.T.; Margenot, A.J.; Wei, X.; Fan, M.M.; Zhang, H.; Best, J.L.; Wu, P.B.; Chen, F.R.; Gao, C. Source apportionment of soil heavy metals in fluvial islands, Anhui section of the lower Yangtze River: Comparison of APCS–MLR and PMF. J. Soils Sediments 2020, 20, 3380–3393. [Google Scholar] [CrossRef]
  50. Akoto, R.; Anning, A.K. Heavy metal enrichment and potential ecological risks from different solid mine wastes at a mine site in Ghana. Environ. Adv. 2021, 3, 100028. [Google Scholar] [CrossRef]
  51. Hakanson, L. An ecological risk index for aquatic pollution control-A sedimentological approach. Water Res. 1980, 14, 975–1001. [Google Scholar] [CrossRef]
  52. Xu, Z.Q.; Ni, S.J.; Tuo, X.G.; Zhang, C.J. Calculation of Heavy Metals’ Toxicity Coefficient in the Evaluation of Potential Ecological Risk Index. Environ. Sci. Technol. 2008, 31, 112–115. [Google Scholar] [CrossRef]
  53. Chen, Y.X.; Jiang, X.S.; Wang, Y.; Zhuang, D.F. Assessment of ecological environment and human health of heavy metals in mining area based on GIS. Acta Sci. Circumst. 2018, 38, 1642–1652. [Google Scholar] [CrossRef]
  54. Agency UTUSEP. Exposure Factors Handbook Edition (Final); U.S. Environmental Protection Agency: Washington, DC, USA, 2011.
  55. Li, C.F.; Cao, J.F.; Lu, J.S.; Yao, L.; Wu, Q.Y. Ecological Risk Assessment of Soil Heavy Metals for Different Types of Land Use and Evaluation of Human Health. Environ. Sci. 2018, 39, 5628–5638. [Google Scholar] [CrossRef]
  56. Agency USEP. Risk Assessment Guidance for Superfund Volume 1: Human Health Evaluation Manual (Part A); U.S. Environmental Protection Agency: Washington, DC, USA, 1989.
  57. Yang, S.; He, M.; Zhi, Y.; Chang, S.X.; Gu, B.; Liu, X.; Xu, J. An integrated analysis on source-exposure risk of heavy metals in agricultural soils near intense electronic waste recycling activities. Environ. Int. 2019, 133, 105239. [Google Scholar] [CrossRef]
  58. Ahmad, W.; Alharthy, R.D.; Zubair, M.; Ahmed, M.; Hameed, A.; Rafique, S. Toxic and heavy metals contamination assessment in soil and water to evaluate human health risk. Sci. Rep. 2021, 11, 17006. [Google Scholar] [CrossRef]
  59. Liu, X.; Gu, S.; Yang, S.; Deng, J.; Xu, J. Heavy metals in soil-vegetable system around E-waste site and the health risk assessment. Sci. Total Environ. 2021, 779, 146438. [Google Scholar] [CrossRef] [PubMed]
  60. Duan, Y.X.; Zhang, Y.M.; Li, S.; Fang, Q.L.; Miao, F.F.; Lin, Q.G. An integrated method of health risk assessment based on spatial interpolation and source apportionment. J. Clean. Prod. 2020, 276, 123218. [Google Scholar] [CrossRef]
  61. Chen, H.; Teng, Y.; Lu, S.; Wang, Y.; Wu, J.; Wang, J. Source apportionment and health risk assessment of trace metals in surface soils of Beijing metropolitan, China. Chemosphere 2016, 144, 1002–1011. [Google Scholar] [CrossRef] [PubMed]
  62. Jiang, Y.; Chao, S.; Liu, J.; Yang, Y.; Chen, Y.; Zhang, A.; Cao, H. Source apportionment and health risk assessment of heavy metals in soil for a township in Jiangsu Province, China. Chemosphere 2017, 168, 1658–1668. [Google Scholar] [CrossRef] [PubMed]
  63. Agency USEP. The Office of Solid Waste and Emergency Response; United States Environmental Protection Agency: Washington, DC, USA, 1991.
  64. Kamunda, C.; Mathuthu, M.; Madhuku, M. Health Risk Assessment of Heavy Metals in Soils from Witwatersrand Gold Mining Basin, South Africa. Int. J. Environ. Res. Public Health 2016, 13, 663. [Google Scholar] [CrossRef] [PubMed]
  65. Rehman, A.; Liu, G.; Yousaf, B.; Zia-Ur-Rehman, M.; Ali, M.U.; Rashid, M.S.; Farooq, M.R.; Javed, Z. Characterizing pollution indices and children health risk assessment of potentially toxic metal(oid)s in school dust of Lahore, Pakistan. Ecotoxicol. Environ. Saf. 2020, 190, 110059. [Google Scholar] [CrossRef] [PubMed]
  66. Soil Environmental Quality Risk Control Standard for Soil Contamination of Agricultural Land. 2018. Available online: https://www.mee.gov.cn/ywgz/fgbz/bz/bzwb/trhj/201807/t20180703_446029.shtml (accessed on 5 January 2024).
  67. Yang, X.Y.; Sun, L.G.; Zhang, Z.F.; Cai, Z.Y. General study on soil pollution in Huainan area, Anhui Province. Chin. J. Geol. Hazard Control 1995, 6, 37–43. [Google Scholar]
  68. Liu, Y. Spatial Distribution and Pollute Evaluation of Trace Elements in Surface Soil of Mining City. Master’s Thesis, AnHui University of Science and Technology, Huainan, China, 2015. [Google Scholar]
  69. Phil-Eze, P.O. Variability of soil properties related to vegetation cover in a tropical rainforest landscape. J. Geogr. Reg. Plan. 2010, 3, 177. [Google Scholar]
  70. Cai, L.-M.; Wang, Q.-S.; Wen, H.-H.; Luo, J.; Wang, S. Heavy metals in agricultural soils from a typical township in Guangdong Province, China: Occurrences and spatial distribution. Ecotoxicol. Environ. Saf. 2019, 168, 184–191. [Google Scholar] [CrossRef]
  71. Liang, J.; Feng, C.; Zeng, G.; Gao, X.; Zhong, M.; Li, X.; Li, X.; He, X.; Fang, Y. Spatial distribution and source identification of heavy metals in surface soils in a typical coal mine city, Lianyuan, China. Environ. Pollut. 2017, 225, 681–690. [Google Scholar] [CrossRef]
  72. Chen, H.; Wang, Y.; Wang, S. Source Analysis and Pollution Assessment of Heavy Metals in Farmland Soil Around Tongshan Mining Area. Environ. Sci. 2022, 43, 2719–2731. [Google Scholar] [CrossRef]
  73. Zeng, Q.Q.; Fu, T.L.; Zou, H.Q.; Teng, L.; Wu, K.; Xie, T.; He, T.B. Spatial distribution characteristics and sources of heavy metals in soil in a pepper growing area of county in Guizhou Province, China. J. Agro-Environ. Sci. 2021, 40, 102–113. [Google Scholar] [CrossRef]
  74. Wang, Y.; Duan, X.; Wang, L. Spatial distribution and source analysis of heavy metals in soils influenced by industrial enterprise distribution: Case study in Jiangsu Province. Sci. Total Environ. 2020, 710, 134953. [Google Scholar] [CrossRef] [PubMed]
  75. Huang, Q.Q.; Liu, X.; Zhang, Q.; Liu, X.X.; Qiao, Y.H.; Su, D.C.; Chen, J.S.; Li, H.F. Evaluating the Environmental Risk and the Bioavailability of Cd in Phosphorus Fertilizers. Environ. Sci. Technol. 2016, 39, 156–161. [Google Scholar]
  76. Li, F.; Liu, S.Y.; Li, Y.; Shi, Z. Spatiotemporal Variability and Source Apportionment of Soil Heavy Metals in a Industrially Developed City. Environ. Sci. 2019, 40, 934–944. [Google Scholar] [CrossRef]
  77. Zhou, L.; Zhao, X.; Meng, Y.; Fei, Y.; Teng, M.; Song, F.; Wu, F. Identification priority source of soil heavy metals pollution based on source-specific ecological and human health risk analysis in a typical smelting and mining region of South China. Ecotoxicol. Environ. Saf. 2022, 242, 113864. [Google Scholar] [CrossRef] [PubMed]
  78. Xiao, R.; Guo, D.; Ali, A.; Mi, S.; Liu, T.; Ren, C.; Li, R.; Zhang, Z. Accumulation, ecological-health risks assessment, and source apportionment of heavy metals in paddy soils: A case study in Hanzhong, Shaanxi, China. Environ Pollut. 2019, 248, 349–357. [Google Scholar] [CrossRef] [PubMed]
  79. Li, F.; Zhang, J.; Huang, J.; Huang, D.; Yang, J.; Song, Y.; Zeng, G. Heavy metals in road dust from Xiandao District, Changsha City, China: Characteristics, health risk assessment, and integrated source identification. Environ. Sci. Pollut. Res. 2016, 23, 13100–13113. [Google Scholar] [CrossRef] [PubMed]
  80. Qu, M.; Wang, Y.; Huang, B.; Zhao, Y. Source apportionment of soil heavy metals using robust absolute principal component scores-robust geographically weighted regression (RAPCS-RGWR) receptor model. Sci. Total Environ. 2018, 626, 203–210. [Google Scholar] [CrossRef]
  81. Zhang, H.Z.; Cui, W.G.; Huang, Y.M.; Li, L.Y.L.; Zhong, X.; Wang, L. Evaluation and source analysis of heavy metal pollution of farmland soil around the mining area of karst region of central Guizhou Province. Acta Sci. Circumst. 2022, 42, 412–421. [Google Scholar] [CrossRef]
  82. Wu, Y.; Zhou, X.Y.; Lei, M.; Yang, J.; Ma, J.; Qiao, P.W.; Chen, T.B. Migration and transformation of arsenic: Contamination control and remediation in realgar mining areas. Appl. Geochem. 2017, 77, 44–51. [Google Scholar] [CrossRef]
  83. Chen, J.F.; Fang, H.D.; Wu, J.J.; Lin, J.M.; Lan, W.B.; Chen, J.S. Distribution and source apportionment of heavy metals in farmland soils using PMF and lead isotopic composition. J. Agro-Environ. Sci. 2019, 38, 1026–1035. [Google Scholar] [CrossRef]
  84. Zhang, Y.N.; Wu, X.J.; Dong, Y.; Zhao, J.; Liu, J. Quantitative analysis of ecological risk sources of heavy metals in river sediments of northern Shaanxi Mining area, China. Acta Sci. Circumst. 2023, 43, 238–246. [Google Scholar] [CrossRef]
Figure 1. Location of the study area and distribution of sampling points.
Agronomy 14 00394 g001
Figure 2. Spatial distribution of heavy metal content.
Agronomy 14 00394 g002
Figure 3. Scatter plot of the Spearman correlation coefficient matrix for heavy metals in the study area. (*** p < 0.001, ** p < 0.01, * p < 0.05, · p < 0.1).
Agronomy 14 00394 g003
Figure 4. (a) Factor profiles from PMF model and (b) contribution of different factors on heavy metal accumulation in the studied area.
Agronomy 14 00394 g004
Figure 5. Spatial distribution of normalized contributions of four factors (average of all sample sites = 1).
Agronomy 14 00394 g005
Figure 6. (a) Geo-accumulation index (Igeo) of seven heavy metal elements and their proportions at different levels (b).
Agronomy 14 00394 g006
Figure 7. Spatial distribution of geo-accumulation index.
Agronomy 14 00394 g007
Figure 8. Exponential distribution of potential ecological risks and its spatial distribution.
Agronomy 14 00394 g008
Figure 9. Analysis of hot and cold spots in the research area.
Agronomy 14 00394 g009
Table 1. Basic physical and chemical properties in test soil.
ProjectMinMaxMeanStandard Deviation (SD)Coefficient of Variation (CV)SkewnessKurtosis
pH4.966.435.4220.4900.0901.3180.581
CEC(cmol(+)/kg)10.8021.6015.4643.7040.2400.291−0.986
SOM (g/kg)17.5031.8026.2915.2500.200−0.542−1.296
TN (%)0.1090.1640.1390.0160.115−0.4820.089
Moisture (%)16.1729.3923.6203.3600.1420.001−0.80
Sand (%)0.01100.0027.98038.2711.3681.257−0.135
Silt (%)0.0332.992.8406.9292.4402.9528.652
Clay (%)0.01100.0069.18137.9060.548−1.085−0.405
Table 2. Classification criteria for Igeo evaluation levels [48,50].
Igeo Range<00–11–22–33–44–5>5
Level0123456
Contamination levelNo contaminatedLight to moderate contaminationModerate contaminationModerate to strong contaminationStrong contaminationStrong to extreme contaminationExtreme contamination
Table 3. Classification criteria for potential ecological risk levels.
Ei RangeLevel of Potential Ecological RiskRI RangeCompound Potential Ecological Risk Level
Ei < 40LowRI < 150Low
40 ≤ Ei <80Medium150 ≤ RI < 300Medium
80 ≤ Ei < 160Medium-high300 ≤ RI < 600Medium-high
160 ≤ Ei < 320HighRI ≥ 600High
Ei ≥ 320Extremely high
Table 4. Exposure parameter values for health risk assessment models.
ParameterMeaningUnitValueReferences
ChildAdult
IngRIngestion ratemg/day200100[54,57,58]
InhRInhalation ratemg/cm22020
AFSkin adhesion coefficientmg/cm20.070.2
CFSwitching frequencykg/mg1.00 × 10–61.00 × 10⁻⁶
EFExposure frequencydays/year180180
EDExposure durationyears6.0024.00
BWAverage body weightkg1570
AT (carcinogenic)Mean duration of exposure (carcinogenic)days70 × 36570 × 365
AT (non-carcinogenic)Average exposure time (non-carcinogenic)days6 × 36524 × 365
PEFParticle emission factorm3/kg1.36 × 1091.36 × 109
SAExposed skin surface areacm21150.002145.00
ABSDermal absorption factorunit less0.0010.001
(As: 0.03)(As: 0.03)
Table 5. Reference dose and slope factor values for heavy metals.
Heavy MetalsRfD/mg/(kg·d)SF/(kg·d)/mgReferences
Oral IngestionOral and Nasal InhalationSkin ContactOral IngestionOral and Nasal InhalationSkin Contact
Cu4.00 × 10–24.02 × 10–21.20 × 10–2 [54,61,62,63,64]
Hg3.00 × 10–43.00 × 10–42.10 × 10–5
As3.00 × 10–43.00 × 10–41.23 × 10–40.15 × 1010.15 × 1010.15 × 101
Pb3.50 × 10–33.25 × 10–35.23 × 10–48.50 × 10⁻³ 4.20 × 10⁻²
Cr3.00 × 10–32.86 × 10–56.00 × 10–55.00 × 10⁻¹ 4.10 × 101
Cd1.00 × 10–41.00 × 10–41.00 × 10–53.80 × 10⁻¹ 0.63 × 101
Zn3.00 × 10–13.00 × 10–16.00 × 10–2 [54,61,62,65]
Table 6. Descriptive statistics of heavy metal content in farmland soil of the study area.
ProjectCuHgAsPbCrCdZn
Min/mg/kg28.260.012.6610.270.000.0523.57
Max/mg/kg78.350.13253.4340.99232.500.3151.36
Mean/mg/kg42.240.04111.4128.97117.950.1437.27
Median/mg/kg41.580.04140.3730.29111.710.1238.01
SD/mg/kg10.170.0398.137.3140.000.067.41
CV(%)0.240.680.880.250.340.450.20
K–S test 10.0550.075 0.0900.0610.0810.074
Risk screening value/mg/kg 2501.340701500.3200
Risk management values/mg/kg 2 2.02004008001.5
Huainan background value/mg/kg 324.160.0213.8130.4764.930.0658.35
Mean/background value1.752.178.071.012.022.290.63
Proportion of points exceeding background values100.00%83.33%64.81%50.00%98.15%94.44%1.85%
1 The K–S test in the table provides the original data after the normalization of the results; 2 the risk control standard of pH ≤ 5.5 in the Soil Environmental Quality Risk Control Standard for Soil Contamination of Agricultural Land (GB 15618-2018) [66] was used; 3 references [67,68].
Table 7. Semi-variogram theoretical model and related parameters.
ElementFitting ModelBlock Gold ValueAbutment ValueVariation Range/kmJudgement FactorBlock-to-Base RatioResiduals
C0C+C0Range (A)R2C0/C + C0RSS
CuGaussian model1.00 × 10−36.55 × 10−11.91 × 10−25.43 × 10−19.98 × 10−18.99 × 10⁻²
HgGaussian model1.00 × 10−36.91 × 10−12.89 × 10−29.77 × 10−19.99 × 10−15.61 × 10⁻³
PbGaussian model1.00 × 10−134.672.20 × 10−27.83 × 10−19.97 × 10−1114.00
CrGaussian model1.00 × 10−36.61 × 10−11.94 × 10−26.17 × 10−19.98 × 10−17.97 × 10⁻²
CdSpherical model3.15 × 10−16.62 × 10−13.97 × 10−23.89 × 10−15.24 × 10−15.57 × 10⁻²
ZnGaussian model2.00 × 10−32.54 × 10−11.84 × 10−24.67 × 10−19.92 × 10−19.55 × 10⁻³
Table 8. Statistics and distribution of potential ecological risk index of heavy metal elements.
ProjectTypeEiRI
CuHgAsPbCrCdZn
Potential Ecological Risk Index StatisticsMin5.8520.171.921.690.0026.210.40105.81
Max16.21258.67183.516.737.16156.690.88508.02
Mean8.7486.8180.674.753.6367.830.64253.08
Distribution of potential ecological risk indices/%Low100.00%18.52%46.30%100.00%100.00%14.81%100.00%14.81%
Medium 44.44% 61.11% 57.41%
Medium-high 24.07%38.89% 24.07% 27.78%
High 12.96%14.81%
Extremely high
Table 9. Non-carcinogenic risk exposure dose of heavy metals in the study area [mg/(kg·d)].
IndicatorsCuHgAsPbCrCdZn
ChildADDing2.78 × 10−42.85 × 10−77.33 × 10−41.90 × 10−47.76 × 10−48.92 × 10−72.45 × 10−4
ADDinh2.04 × 10−82.10 × 10−115.39 × 10−81.40 × 10−85.70 × 10−86.56 × 10−111.80 × 10⁻⁸
ADDdermal1.12 × 10−71.15 × 10−108.85 × 10−67.67 × 10−83.12 × 10−73.59 × 10−19.86 × 10⁻⁸
HQing3.75 × 10−15.14 × 10−21.32 × 1022.941.40 × 1014.82 × 10−14.41 × 10⁻²
HQinh2.74 × 10−53.78 × 10−69.70 × 10−32.33 × 10−41.08 × 10−13.54 × 10−53.24 × 10−6
HQdermal5.03 × 10−42.95 × 10−43.887.88 × 10−32.81 × 10−11.94 × 10−38.88 × 10⁻⁵
HI3.76 × 10−15.17 × 10−21.36 × 1022.951.44 × 1014.84 × 10−14.42 × 10⁻²
AdultsADDing2.98 × 10−53.06 × 10−87.85 × 10−52.04 × 10−58.31 × 10−59.56 × 10−82.63 × 10−5
ADDinh4.38 × 10−94.50 × 10−121.15 × 10−83.00 × 10−91.22 × 10−81.41 × 10−113.86 × 10⁻⁹
ADDdermal1.28 × 10−71.31 × 10−101.01 × 10−58.75 × 10−83.56 × 10−74.10 × 10−101.13 × 10⁻⁷
HQing4.02 × 10−25.50 × 10−31.41 × 1013.15 × 10−11.505.16 × 10−24.73 × 10⁻³
HQinh5.88 × 10−68.09 × 10−72.08 × 10−34.63 × 10−52.31 × 10−27.59 × 10−66.95 × 10−7
HQdermak5.75 × 10−43.37 × 10−44.439.00 × 10−33.21 × 10−12.21 × 10−31.01 × 10⁻⁴
HI4.08 × 10−25.84 × 10−31.85 × 1013.24 × 10−11.845.38 × 10−24.83 × 10⁻³
Table 10. Exposure dose of heavy metal carcinogenic risk in the study area [mg/(kg·d)].
IndicatorsChildAdults
AsPbCrCdAsPbCrCd
ADDing6.28 × 10−51.63 × 10−56.65 × 10−57.65 × 10−82.69 × 10−57.00 × 10−62.85 × 10−53.28 × 10⁻⁸
ADDinh4.62 × 10−91.20 × 10−94.89 × 10−95.62 × 10−123.96 × 10−91.03 × 10−94.19 × 10−94.82 × 10−12
ADDdermal7.58 × 10−76.57 × 10−92.68 × 10−83.08 × 10−113.46 × 10−63.00 × 10−81.22 × 10−71.41 × 10−10
CRing5.09 × 10−37.49 × 10−61.79 × 10−31.57 × 10−62.18 × 10−33.21 × 10−67.69 × 10−46.72 × 10⁻⁷
CRinh3.74 × 10−7 3.21 × 10⁻⁷
CRdermal6.14 × 10−51.49 × 10−85.92 × 10−51.05 × 10−82.81 × 10−46.81 × 10−82.71 × 10−44.78 × 10⁻⁸
CR5.15 × 10−37.50 × 10−61.85 × 10−31.58 × 10−62.46 × 10−33.28 × 10−61.04 × 10−37.20 × 10⁻⁷
Disclaimer/Publisher’s Note: The statements, opinions and data contained in all publications are solely those of the individual author(s) and contributor(s) and not of MDPI and/or the editor(s). MDPI and/or the editor(s) disclaim responsibility for any injury to people or property resulting from any ideas, methods, instructions or products referred to in the content.

