
Mitigating Salinity Stress in Barley (Hordeum vulgare L.) through Biochar and NPK Fertilizers: Impacts on Physio-Biochemical Behavior and Grain Yield


 ,
,
Abstract
1. Introduction
2. Materials and Methods
2.1. Preparation of Biochar (BC)
2.2. Experimental Setup and Growth Conditions
2.3. Analysis of Gas Exchange, Photosynthetic Pigments and Measurement of SPAD
2.4. Analysis of Stress-Related Metabolites
2.5. Ion Concentrations in the Leaf
2.6. Analysis of Phenolic Compounds by Analytical LC-ESI -MS
2.7. Grain Yield
2.8. Statistical Analysis
3. Results
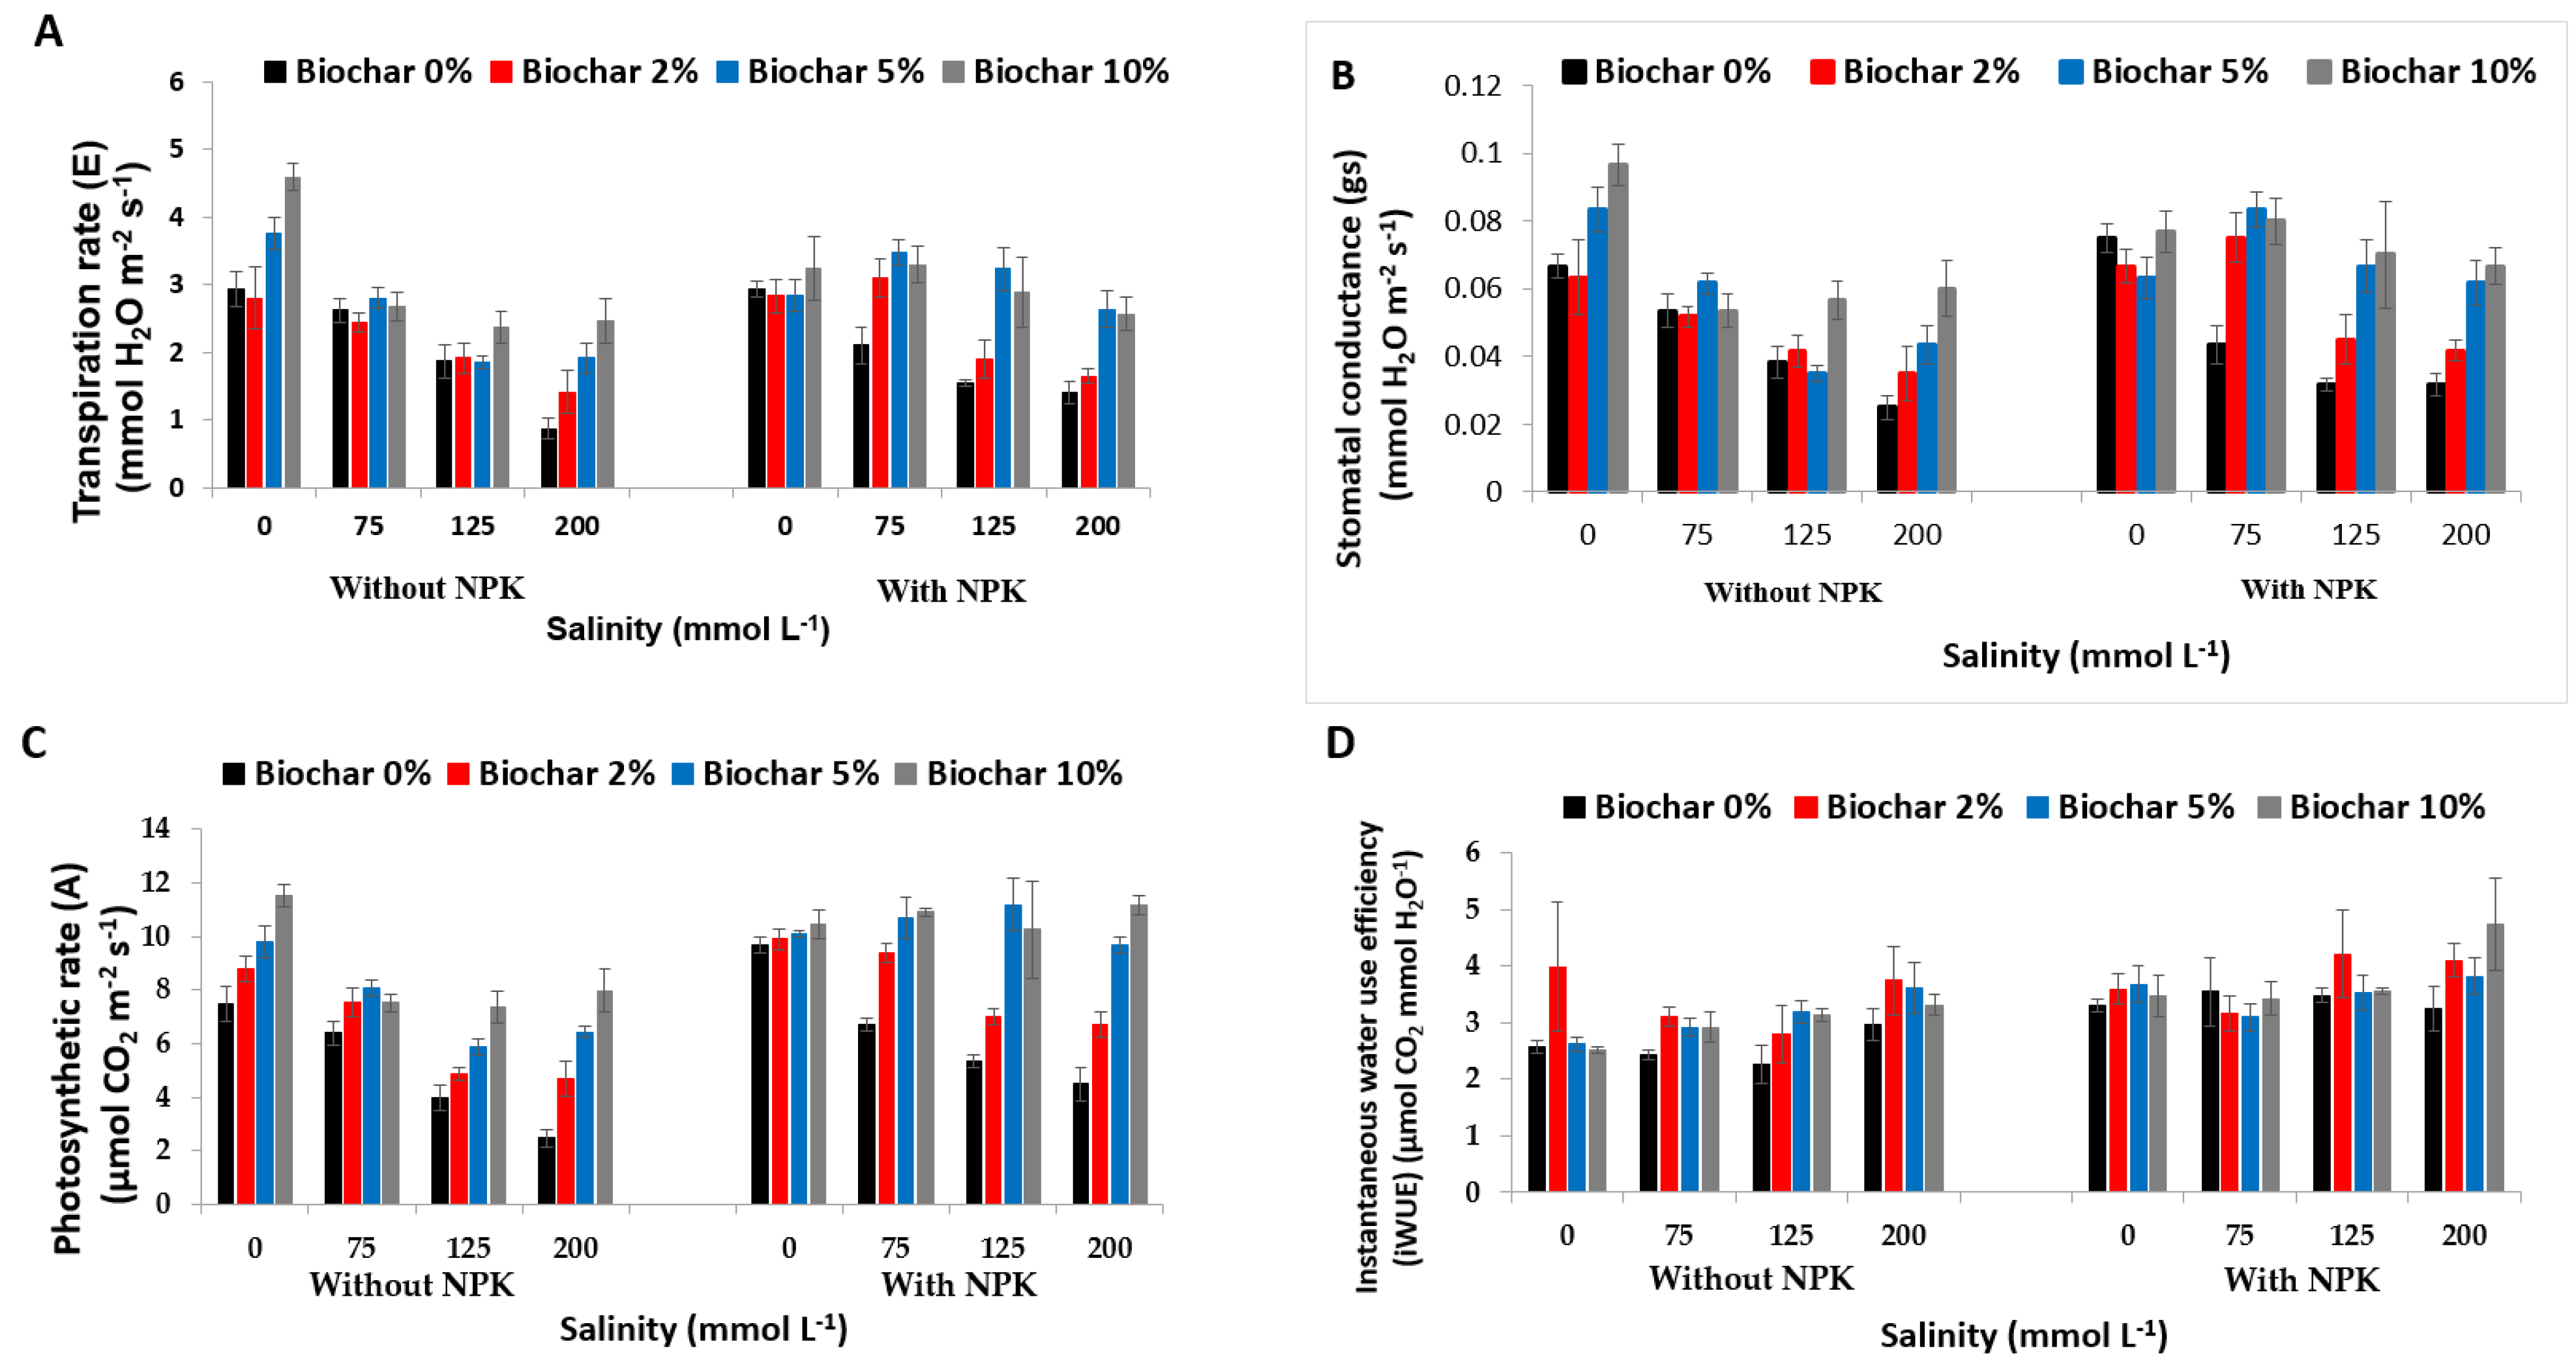
3.1. Effect of Biochar, NPK Fertilizers, and Salinity on Photosynthetic Pigments and Gas Exchange Parameters
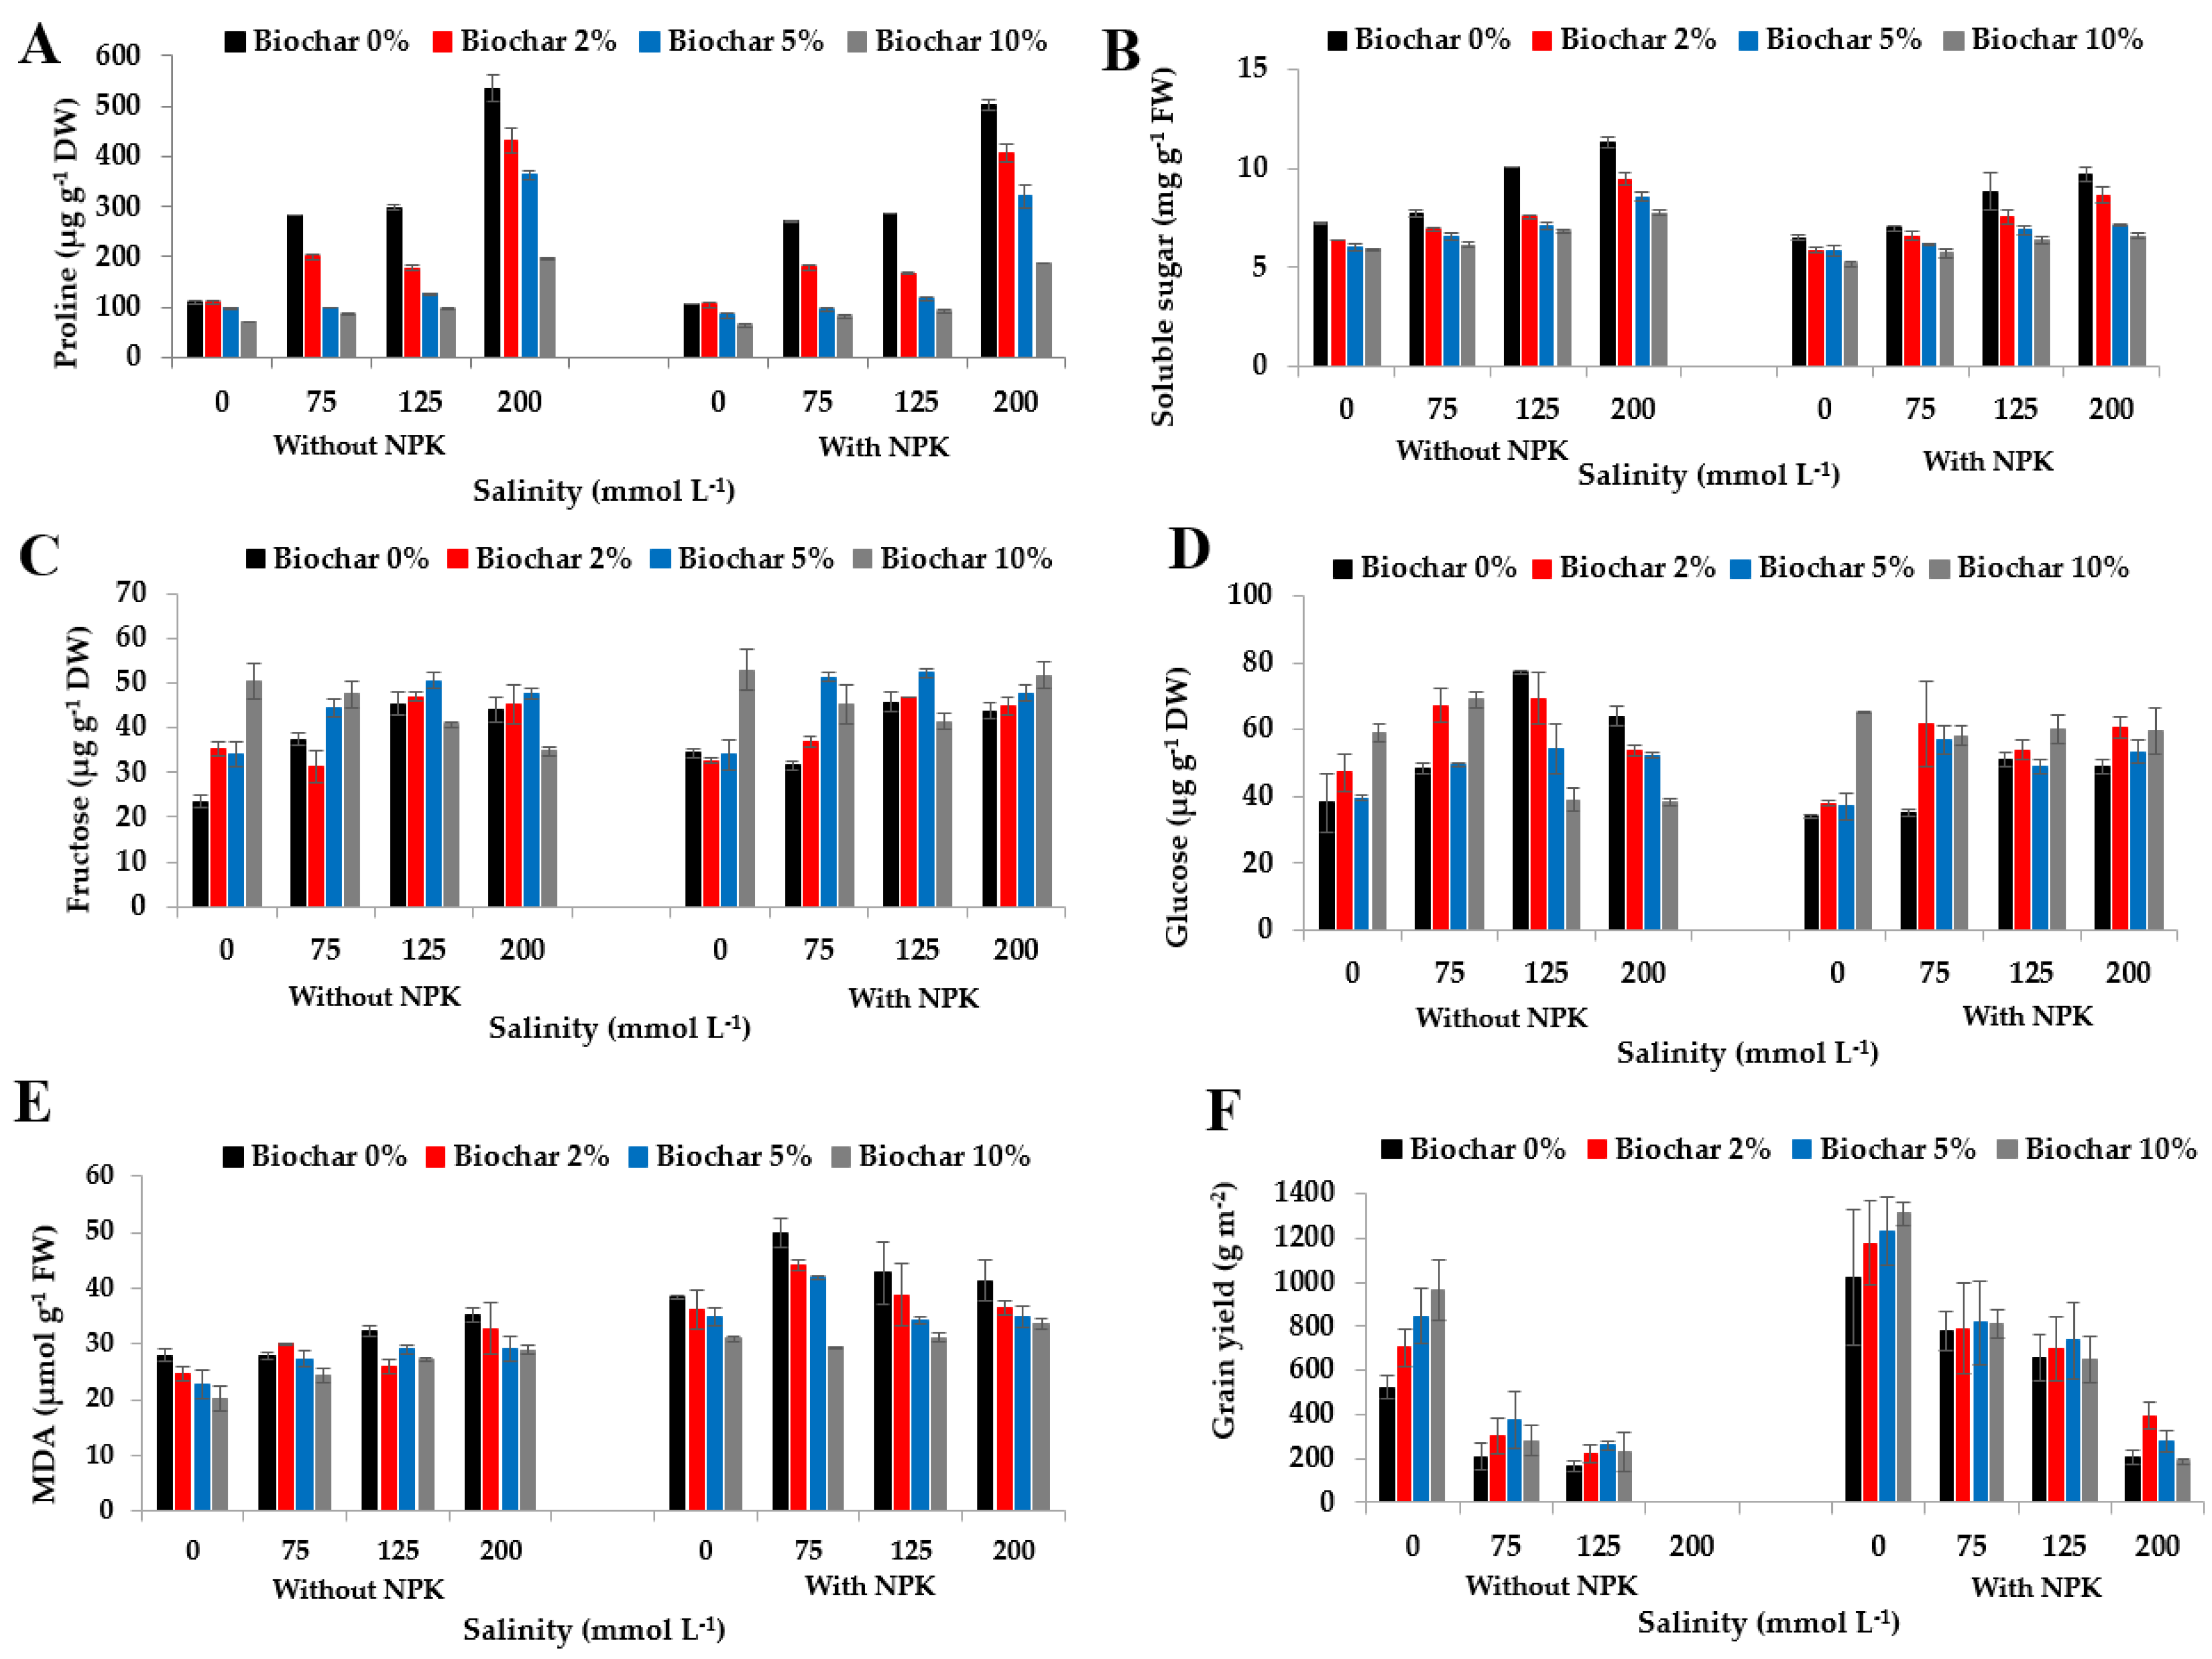
3.2. Effect of Biochar, NPK Fertilizers, and Salinity on Stress-Related Metabolites
3.3. Effect of Biochar, NPK Fertilizers, and Salinity on Phenolic Compounds
3.4. Effect of Biochar, NPK Fertilizers, and Salinity on Leaf Ions Concentrations
3.5. Effect of Biochar, NPK Fertilizers, and Salinity on Grain Yield
4. Discussion
5. Conclusions
Author Contributions
Funding
Data Availability Statement
Conflicts of Interest
References
- FAO. Global Map of Salt-Affected Soils|FAO SOILS PORTAL|Food and Agriculture Organization of the United Nations. 2022. Available online: https://www.fao.org/soils-portal/data-hub/soil-maps-and-databases/global-map-of-salt-affected-soils/en/ (accessed on 10 August 2022).
- Daliakopoulos, I.N.; Tsanis, I.K.; Koutroulis, A.; Kourgialas, N.N.; Varouchakis, A.E.; Karatzas, G.P.; Ritsema, C.J. The threat of soil salinity: A European scale review. Sci. Total Environ. 2016, 573, 727–739. [Google Scholar] [CrossRef] [PubMed]
- Evelin, H.; Devi, T.S.; Gupta, S.; Kapoor, R. Mitigation of salinity stress in plants by arbuscular mycorrhizal symbiosis: Current understanding and new challenges. Front. Plant Sci. 2019, 10, 470. [Google Scholar] [CrossRef] [PubMed]
- Tedeschi, A. Irrigated Agriculture on Saline Soils: A Perspective. Agronomy 2020, 10, 1630. [Google Scholar] [CrossRef]
- Ali, S.; Rizwan, M.; Qayyum, M.F.; Ok, Y.S.; Ibrahim, M.; Riaz, M.; Arif, M.S.; Hafeez, F.; Al-Wabel, M.I.; Shahzad, A.N. Biochar soil amendment on alleviation of drought and salt stress in plants: A critical review. Environ. Sci. Pollut. Res. 2017, 24, 12700–12712. [Google Scholar] [CrossRef] [PubMed]
- Munns, R. Plant Adaptations to Salt and Water Stress: Differences and Commonalities. Adv. Bot. Res. 2011, 57, 1–32. [Google Scholar] [CrossRef]
- Hernández, J.A. Salinity Tolerance in Plants: Trends and Perspectives. Int. J. Mol. Sci. 2019, 20, 2408. [Google Scholar] [CrossRef] [PubMed]
- Elsawy, H.I.A.; Alharbi, K.; Mohamed, A.M.M.; Ueda, A.; AlKahtani, M.; AlHusnain, L.; Attia, K.A.; Abdelaal, K.; Shahein, A.M.E.A. Calcium Lignosulfonate Can Mitigate the Impact of Salt Stress on Growth, Physiological, and Yield Characteristics of Two Barley Cultivars (Hordeum vulgare L.). Agriculture 2022, 12, 1459. [Google Scholar] [CrossRef]
- Hafez, Y.; Attia, K.; Alamery, S.; Ghazy, A.; Al-Doss, A.; Ibrahim, E.; Rashwan, E.; El-Maghraby, L.; Awad, A.; Abdelaal, K. Beneficial Effects of Biochar and Chitosan on Antioxidative Capacity, Osmolytes Accumulation, and Anatomical Characters of Water-Stressed Barley Plants. Agronomy 2020, 10, 630. [Google Scholar] [CrossRef]
- Abdelaal, K.; Alamrey, S.; Attia, K.A.; Elrobh, M.; Elnahhas, N.; Abou El-Yazied, A.; Ibrahim, M.A. The pivotal role of biochar in enhancement soil properties, morphophysiological and yield characters of barley plants under drought stress. Not. Bot. Horti Agrobot. Cluj-Napoca 2022, 50, 12710. [Google Scholar] [CrossRef]
- Wang, L.; Sun, X.; Li, S.; Zhang, T.; Zhang, W.; Zhai, P. Application of Organic Amendments to a Coastal Saline Soil in North China: Effects on Soil Physical and Chemical Properties and Tree Growth. PLoS ONE 2014, 9, e89185. [Google Scholar] [CrossRef]
- Igalavithana, A.D.; Ok, Y.S.; Niazi, N.K.; Rizwan, M.; Al-Wabel, M.I.; Usman, A.R.A.; Moon, D.H.; Lee, S.S. Effect of Corn Residue Biochar on the Hydraulic Properties of Sandy Loam Soil. Sustainability 2017, 9, 266. [Google Scholar] [CrossRef]
- Chaganti, V.N.; Crohn, D.M. Evaluating the relative contribution of physiochemical and biological factors in ameliorating a saline–sodic soil amended with composts and biochar and leached with reclaimed water. Geoderma 2015, 259–260, 45–55. [Google Scholar] [CrossRef]
- Abel, S.; Peters, A.; Trinks, S.; Schonsky, H.; Facklam, M.; Wessolek, G. Impact of biochar and hydrochar addition on water retention and water repellency of sandy soil. Geoderma 2013, 202–203, 183–191. [Google Scholar] [CrossRef]
- Fiaz, K.; Malik, S.A.; Younis, U.; Danish, S.; Raza Shah, M.H.; Niaz, S. Drought impact on Pb/Cd toxicity remediated by biochar in Brassica campestris. J. Soil Sci. Plant Nutr. 2014, 14, 845–854. [Google Scholar] [CrossRef]
- Inyang, M.I.; Gao, B.; Yao, Y.; Xue, Y.; Zimmerman, A.; Mosa, A.; Pullammanappallil, P.; Ok, Y.S.; Cao, X. A review of biochar as a low-cost adsorbent for aqueous heavy metal removal. Crit. Rev. Environ. Sci. Technol. 2015, 46, 406–433. [Google Scholar] [CrossRef]
- Palansooriya, K.N.; Wong, J.T.F.; Hashimoto, Y.; Huang, L.; Rinklebe, J.; Chang, S.X.; Bolan, N.; Wang, H.; Ok, Y.S. Response of microbial communities to biochar-amended soils: A critical review. Biochar 2019, 1, 3–22. [Google Scholar] [CrossRef]
- Foster, E.J.; Hansen, N.; Wallenstein, M.; Cotrufo, M.F. Biochar and manure amendments impact soil nutrients and microbial enzymatic activities in a semi-arid irrigated maize cropping system. Agric. Ecosyst. Environ. 2016, 233, 404–414. [Google Scholar] [CrossRef]
- Mona, S.; Malyan, S.K.; Saini, N.; Deepak, B.; Pugazhendhi, A.; Kumar, S.S. Towards sustainable agriculture with carbon sequestration, and greenhouse gas mitigation using algal biochar. Chemosphere 2021, 275, 129856. [Google Scholar] [CrossRef]
- Malyan, S.; Kumar, S.; Fagodiya, R.; Ghosh, P.; Kumar, A.; Singh, R.; Singh, L. Biochar for environmental sustainability in the energy-water-agroecosystem nexus. Renew. Sustain. Energy Rev. 2021, 149, 111379. [Google Scholar] [CrossRef]
- Najjar, A.A.; Kuhn, A.J.; Al-Tardeh, S.M.; Kuchendorf, C.M. Microalgae and Biochar Agro-Fertilization of the Palestinian Rehan Barley Cultivar under Salinity Stress. Agronomy 2021, 11, 2309. [Google Scholar] [CrossRef]
- Akhtar, S.S.; Andersen, M.N.; Liu, F. Biochar Mitigates Salinity Stress in Potato. J. Agron. Crop Sci. 2015, 201, 368–378. [Google Scholar] [CrossRef]
- Guo, L.; Bornø, M.L.; Niu, W.; Liu, F. Biochar amendment improves shoot biomass of tomato seedlings and sustains water relations and leaf gas exchange rates under different irrigation and nitrogen regimes. Agric. Water Manag. 2021, 245, 106580. [Google Scholar] [CrossRef]
- Mansoor, S.; Kour, N.; Manhas, S.; Zahid, S.; Wani, O.A.; Sharma, V.; Wijaya, L.; Alyemeni, M.N.; Alsahli, A.A.; El-Serehy, H.A.; et al. Biochar as a tool for effective management of drought and heavy metal toxicity. Chemosphere 2021, 271, 129458. [Google Scholar] [CrossRef] [PubMed]
- Allam, M.; Radicetti, E.; Quintarelli, V.; Petroselli, V.; Marinari, S.; Mancinelli, R. Influence of Organic and Mineral Fertilizers on Soil Organic Carbon and Crop Productivity under Different Tillage Systems: A Meta-Analysis. Agriculture 2022, 12, 464. [Google Scholar] [CrossRef]
- Arnon, D.I. Copper Enzymes in Isolated Chloroplasts. Polyphenoloxidase in Beta vulgaris. Plant Physiol. 1949, 24, 1. [Google Scholar] [CrossRef] [PubMed]
- Dubois, M.; Gilles, K.A.; Hamilton, J.K.; Rebers, P.A.; Smith, F. Colorimetric Method for Determination of Sugars and Related Substances. Analatical Chem. 1956, 28, 350–356. [Google Scholar] [CrossRef]
- Bates, L.S.; Waldren, R.P.; Teare, I.D. Rapid determination of free proline for water-stress studies. Plant Soil 1973, 39, 205–207. [Google Scholar] [CrossRef]
- Hernández, J.A.; Almansa, M.S. Short-term effects of salt stress on antioxidant systems and leaf water relations of pea leaves. Physiol. Plant. 2002, 115, 251–257. [Google Scholar] [CrossRef] [PubMed]
- Cakmak, I.; Horst, W.J. Effect of aluminium on lipid peroxidation, superoxide dismutase, catalase, and peroxidase activities in root tips of soybean (Glycine max). Physiol. Plant. 1991, 83, 463–468. [Google Scholar] [CrossRef]
- Taïbi, K.; Taïbi, F.; Ait Abderrahim, L.; Ennajah, A.; Belkhodja, M.; Mulet, J.M. Effect of salt stress on growth, chlorophyll content, lipid peroxidation and antioxidant defence systems in Phaseolus vulgaris L. South Afr. J. Bot. 2016, 105, 306–312. [Google Scholar] [CrossRef]
- Averina, N.G.; Gritskevich, E.R.; Vershilovskaya, I.V.; Usatov, A.V.; Yaronskaya, E.B. Mechanisms of salt stress tolerance development in barley plants under the influence of 5-aminolevulinic acid. Russ. J. Plant Physiol. 2010, 57, 792–798. [Google Scholar] [CrossRef]
- Santos, C.V. Regulation of chlorophyll biosynthesis and degradation by salt stress in sunflower leaves. Sci. Hortic. 2004, 103, 93–99. [Google Scholar] [CrossRef]
- Kanwal, S.; Ilyas, N.; Shabir, S.; Saeed, M.; Gul, R.; Zahoor, M.; Batool, N.; Mazhar, R. Application of biochar in mitigation of negative effects of salinity stress in wheat (Triticum aestivum L.). J. Plant Nutr. 2017, 41, 526–538. [Google Scholar] [CrossRef]
- Abd El-Mageed, T.A.; Rady, M.M.; Taha, R.S.; Abd El Azeam, S.; Simpson, C.R.; Semida, W.M. Effects of integrated use of residual sulfur-enhanced biochar with effective microorganisms on soil properties, plant growth and short-term productivity of Capsicum annuum under salt stress. Sci. Hortic. 2020, 261, 108930. [Google Scholar] [CrossRef]
- Akhtar, S.S.; Andersen, M.N.; Liu, F. Residual effects of biochar on improving growth, physiology and yield of wheat under salt stress. Agric. Water Manag. 2015, 158, 61–68. [Google Scholar] [CrossRef]
- Agegnehu, G.; Nelson, P.N.; Bird, M.I. Crop yield, plant nutrient uptake and soil physicochemical properties under organic soil amendments and nitrogen fertilization on Nitisols. Soil Tillage Res. 2016, 160, 1–13. [Google Scholar] [CrossRef]
- Almaroai, Y.A.; Eissa, M.A. Effect of biochar on yield and quality of tomato grown on a metal-contaminated soil. Sci. Hortic. 2020, 265, 109210. [Google Scholar] [CrossRef]
- Heidari, M.; Golpayegani, A. Effects of water stress and inoculation with plant growth promoting rhizobacteria (PGPR) on antioxidant status and photosynthetic pigments in basil (Ocimum basilicum L.). J. Saudi Soc. Agric. Sci. 2012, 11, 57–61. [Google Scholar] [CrossRef]
- Al-Shammari, W.B.; Altamimi, H.R.; Abdelaal, K. Improvement in Physiobiochemical and Yield Characteristics of Pea Plants with Nano Silica and Melatonin under Salinity Stress Conditions. Horticulturae 2023, 9, 711. [Google Scholar] [CrossRef]
- Nongpiur, R.C.; Singla-Pareek, S.L.; Pareek, A. Genomics approaches for improving salinity stress tolerance in crop plants. Curr. Genom. 2016, 17, 343–357. [Google Scholar] [CrossRef]
- Jabeen, N.; Ahmad, R. Growth response and nitrogen metabolism of sunflower (Helianthus annuus L.) to vermicompost and biogas slurry under salinity stress. J. Plant Nutr. 2016, 40, 104–114. [Google Scholar] [CrossRef]
- She, D.; Sun, X.; Gamareldawla, A.H.D.; Nazar, E.A.; Hu, W.; Edith, K.; Yu, S. Benefits of soil biochar amendments to tomato growth under saline water irrigation. Sci. Rep. 2018, 8, 1–10. [Google Scholar] [CrossRef] [PubMed]
- Zulfiqar, F.; Akram, N.A.; Ashraf, M. Osmoprotection in plants under abiotic stresses: New insights into a classical phenomenon. Planta 2019, 251, 1–17. [Google Scholar] [CrossRef] [PubMed]
- Ghazouani, H.; Ibrahimi, K.; Amami, R.; Helaoui, S.; Boughattas, I.; Kanzari, S.; Milham, P.; Ansar, S.; Sher, F. Integrative effect of activated biochar to reduce water stress impact and enhance antioxidant capacity in crops. Sci. Total Environ. 2023, 905, 166950. [Google Scholar] [CrossRef] [PubMed]
- Mengfei, C.; Yang, H.; Xia, S.; Han, Y.; Guangling, Y.; Guangmu, T.; Shuhuang, C.; Wanli, X.; Hongtao, J. Long-term effects of biochar application on the growth and physiological characteristics of maize. Front. Plant Sci. 2023, 14, 1172425. [Google Scholar] [CrossRef]
- Quartacci, M.F.; Sgherri, C.; Frisenda, S. Biochar amendment affects phenolic composition and antioxidant capacity restoring the nutraceutical value of lettuce grown in a copper-contaminated soil. Sci. Hortic. 2017, 215, 9–14. [Google Scholar] [CrossRef]
- Zulfiqar, F.; Chen, J.; Younis, A.; Abideen, Z.; Naveed, M.; Koyro, H.W.; Siddique, K.H.M. Biochar, Compost, and Biochar–Compost Blend Applications Modulate Growth, Photosynthesis, Osmolytes, and Antioxidant System of Medicinal Plant Alpinia zerumbet. Front. Plant Sci. 2021, 12, 1751. [Google Scholar] [CrossRef] [PubMed]
- Phares, C.A.; Atiah, K.; Frimpong, K.A.; Danquah, A.; Asare, A.T.; Aggor-Woananu, S. Application of Biochar and Inorganic Phosphorus Fertilizer Influenced Rhizosphere Soil Characteristics, Nodule Formation and Phytoconstituents of Cowpea Grown on Tropical Soil. Heliyon 2020, 6, e05255. [Google Scholar] [CrossRef]
- Rózyło, K.; Swieca, M.; Gawlik-Dziki, U.; Stefaniuk, M.; Oleszczuk, P. The Potential of Biochar for Reducing the Negative Effects of Soil Contamination on the Phytochemical Properties and Heavy Metal Accumulation in Wheat Grain. Agric. Food Sci. 2017, 26, 34–46. [Google Scholar] [CrossRef]
- Regmi, A.; Poudyal, S.; Singh, S.; Coldren, C.; Moustaid-Moussa, N.; Simpson, C. Biochar Influences Phytochemical Concentrations of Viola cornuta Flowers. Sustainability 2023, 15, 3882. [Google Scholar] [CrossRef]


| Attribute | Unit | Biochar | Soil |
|---|---|---|---|
| Clay | % | - | 2.17 |
| Silt | % | - | 4.92 |
| Sand | % | - | 92.64 |
| Size | mm | 0.2–2 | - |
| pH | - | 7.63 | 7.8 |
| Cation exchangeable capacity (CEC) | meq 100 g−1 | 54.6 | 4.5 |
| Organic matter (OM) | % | 81.2 | 0.6 |
| Electrical conductivity (EC) | dS cm−1 | 1.3 | 3.79 |
| Total CaCO3 | % | - | 7.22 |
| Active CaCO3 | % | - | 5.83 |
| Total Nitrogen (N) | % | - | 1.12 |
| Phosphorus (P) | ppm | 325.5 | 52.4 |
| Sodium (Na) | mg kg−1 | 27.9 | 13.6 |
| Potassium (K) | mg kg−1 | 58.7 | 60.9 |
| Calcium (Ca) | mg kg−1 | 1192.1 | 869 |
| Magnesium (Mg) | mg kg−1 | 9.5 | 13.9 |
| Zinc (Zn) | mg kg−1 | 0.392 | 0.035 |
| Iron (Fe) | mg kg−1 | 16.132 | 0.048 |
| Manganese (Mn) | mg kg−1 | 2.52 | 0.21 |
| NPK | NaCl (mM) | (BC) % | Chl a (mg g−1) | Chl b (mg g−1) | Chl (a + b) (mg g−1) | Carotenoids (mg g−1) | SPAD |
|---|---|---|---|---|---|---|---|
| −NPK | 0 | 0 | 6.82 ± 0.08 Aa | 2.35 ± 0.04 Ab | 9.18 ± 0.13 Aa | 1.08 ± 0.01 Ba | 42.36 ± 1.34 Ac |
| 2 | 8.87 ± 0.10 Aa | 3.40 ± 0.21 Aa | 12.28 ± 0.10 Aa | 1.58 ± 0.01 Bb | 42.71 ± 1.88 Abc | ||
| 5 | 6.32 ± 0.15 Aa | 2.10 ± 0.01 Aab | 8.42 ± 0.16 Aa | 1.07 ± 0.03 Bb | 43.35 ± 1.44 Ab | ||
| 10 | 3.91 ± 0.22 Ab | 1.24 ± 0.07 Ac | 5.16 ± 0.30 Ab | 0.77 ± 0.02 Bc | 45.70 ± 1.19 Aa | ||
| 75 | 0 | 7.61 ± 0.01 Ba | 1.63 ± 0.02 Bb | 9.25 ± 0.03 Ba | 2.05 ± 0.00 Aa | 40.50 ± 2.01 Ac | |
| 2 | 4.95 ± 0.18 Ba | 1.62 ± 0.02 Ba | 6.57 ± 0.21 Ba | 0.82 ± 0.13 Ab | 41.90 ± 3.08 Abc | ||
| 5 | 5.86 ± 0.97 Ba | 1.91 ± 0.38 Bab | 7.77 ± 1.35 Ba | 1.18 ± 0.15 Ab | 42.16 ± 1.61 Ab | ||
| 10 | 5.40 ± 1.02 Bb | 1.78 ± 0.42 Bc | 7.18 ± 1.44 Bb | 0.90 ± 0.12 Ac | 44.96 ± 1.74 Aa | ||
| 125 | 0 | 5.41 ± 0.07 Ca | 1.78 ± 0.01 Bb | 7.19 ± 0.08 Ca | 1.02 ± 0.07 Ca | 37.73 ± 2.12 Bc | |
| 2 | 4.83 ± 0.12 Ca | 1.55 ± 0.00 Ba | 6.38 ± 0.12 Ca | 0.86 ± 0.16 Cb | 39.95 ± 2.42 Bbc | ||
| 5 | 4.90 ± 0.19 Ca | 1.63 ± 0.07 Bab | 6.53 ± 0.27 Ca | 0.79 ± 0.07 Cb | 41.23 ± 1.60 Bb | ||
| 10 | 5.27 ± 0.54 Cb | 1.70 ± 0.17 Bc | 6.98 ± 0.72 Cb | 0.94 ± 0.16 Cc | 42.13 ± 1.36 Ba | ||
| 200 | 0 | 3.97 ± 0.09 Ca | 1.35 ± 0.03 Bb | 5.31 ± 0.12 Ca | 0.67 ± 0.01 Ca | 37.91 ± 2.91 Bc | |
| 2 | 5.05 ± 0.02 Ca | 1.64 ± 0.04 Ba | 6.69 ± 0.02 Ca | 0.90 ± 0.11 Cb | 38.95 ± 2.65 Bbc | ||
| 5 | 6.63 ± 0.18 Ca | 2.17 ± 0.01 Bab | 8.80 ± 0.19 Ca | 1.20 ± 0.01 Cb | 40.31 ± 3.18 Bb | ||
| 10 | 4.40 ± 0.00 Cb | 1.43 ± 0.01 Bc | 5.83 ± 0.00 Cb | 0.82 ± 0.01 Cc | 41.13 ± 1.46 Ba | ||
| +NPK | 0 | 0 | 7.73 ± 0.06 Aa | 2.64 ± 0.01 Aab | 10.38 ± 0.05 Aa | 1.08 ± 0.01 Aa | 43.73 ± 2.15 Ac |
| 2 | 5.96 ± 0.15 Ab | 1.94 ± 0.12 Aab | 7.91 ± 0.28 Ab | 0.94 ± 0.08 Aa | 43.90 ± 2 Abc | ||
| 5 | 5.43 ± 0.10 Ab | 1.75 ± 0.04 Ac | 7.18 ± 0.14 Ab | 0.97 ± 0.02 Aa | 44.35 ± 2.62 Aab | ||
| 10 | 8.13 ± 0.12 Aa | 2.65 ± 0.05 Aa | 10.78 ± 0.18 Aa | 1.09 ± 0.29 Aa | 46.70 ± 1.97 Aa | ||
| 75 | 0 | 7.94 ± 0.03 ABa | 2.57 ± 0.18 Aab | 10.52 ± 0.14 ABa | 1.26 ± 0.10 Aa | 42.76 ± 0.68 Ac | |
| 2 | 6.61 ± 0.28 ABb | 2.51 ± 0.42 Aab | 9.13 ± 0.70 ABb | 1.05 ± 0.00 Aa | 44.21 ± 2.84 Abc | ||
| 5 | 6.16 ± 0.32 ABb | 2.12 ± 0.09 Ac | 8.28 ± 0.42 ABb | 0.91 ± 0.09 Aa | 46.23 ± 1.07 Aab | ||
| 10 | 5.15 ± 0.15 ABa | 1.59 ± 0.13 Aa | 6.75 ± 0.02 ABa | 0.79 ± 0.00 Aa | 46.43 ± 1.84 Aa | ||
| 125 | 0 | 5.81 ± 0.43 Ba | 1.91 ± 0.14 ABab | 7.73 ± 0.58 Ba | 1.00 ± 0.13 Aa | 42.83 ± 2.06 Ac | |
| 2 | 6.59 ± 0.01 Bb | 2.23 ± 0.03 ABab | 8.83 ± 0.02 Bb | 0.85 ± 0.01 Aa | 43.08 ± 3.38 Abc | ||
| 5 | 5.73 ± 0.92 Bb | 1.87 ± 0.32 ABc | 7.61 ± 1.25 Bb | 0.93 ± 0.10 Aa | 44.73 ± 2.23 Aab | ||
| 10 | 6.64 ± 0.39 Ba | 2.23 ± 0.17 ABa | 8.88 ± 0.56 Ba | 1.15 ± 0.01 Aa | 45.38 ± 1.32 Aa | ||
| 200 | 0 | 4.16 ± 0.44 Ca | 1.44 ± 0.13 Cab | 5.60 ± 0.57 Ca | 0.53 ± 0.10 Ba | 42.36 ± 4.29 Ac | |
| 2 | 4.43 ± 0.75 Cb | 1.51 ± 0.16 Cab | 5.94 ± 0.91 Cb | 0.66 ± 0.20 Ba | 43.38 ± 2 Abc | ||
| 5 | 6.48 ± 0.46 Cb | 2.23 ± 0.22 Cc | 8.71 ± 0.68 Cb | 1.04 ± 0.04 Ba | 44.15 ± 1.94 Aab | ||
| 10 | 7.33 ± 0.01 Ca | 2.51 ± 0.07 Ca | 9.84 ± 0.08 Ca | 0.82 ± 0.11 Ba | 44.71 ± 1.96 Aa | ||
| ANOVA | NaCl | *** | *** | *** | *** | *** | |
| BC | ** | * | *** | *** | *** | ||
| NPK | *** | *** | *** | *** | *** | ||
| NaCl × BC | *** | *** | *** | *** | ns | ||
| NaCl × NPK | ** | *** | *** | *** | ** | ||
| BC × NPK | *** | *** | *** | *** | ns | ||
| NaCl × BC × NPK | *** | *** | *** | *** | ns | ||
| ANOVA | E | gs | A | iWUE | Fructose | Glucose | Proline | Soluble Sugar | MDA | Grain Yield |
|---|---|---|---|---|---|---|---|---|---|---|
| NaCl | *** | *** | *** | ** | *** | *** | *** | *** | *** | *** |
| Biochar (BC) | *** | *** | *** | * | *** | ** | *** | *** | *** | ** |
| NPK | ns | ** | *** | *** | * | ns | *** | *** | *** | *** |
| NaCl × BC | ns | ns | *** | ns | *** | *** | *** | *** | ns | * |
| NaCl × NPK | *** | ** | *** | ns | ns | ns | ns | ** | ** | ** |
| BC × NPK | ns | ns | ns | ns | ns | *** | ns | ns | * | ns |
| NaCl × BC × NPK | ** | ** | ** | ns | *** | ** | ns | ns | ns | ns |
| NPK | NaCl (mM) | BC (%) | Quinic Acid | 1,3-di-O-caffeoyquinic Acid | Gallic Acid | p-coumaric Acid | Trans Ferulic Acid | Luteolin-7-o-glucoside | Quercetin | Apegenin | Acacetin |
|---|---|---|---|---|---|---|---|---|---|---|---|
| −NPK | 0 | 0% | 1769 ± 119 Ab | 16.2 ± 1.6 Aa | 10.2 ± 1.9 Aa | 6.2 ± 0.2 Aa | 6.9 ± 0.3 Aa | 23.9 ± 0.8 Ab | 3.2 ± 0.6 Ba | 1.0 ± 0.1 Ba | 1.4 ± 0.13 Bbc |
| 2% | 1395 ± 78 Ab | 15.3 ± 2.4 Aa | 4.2 ± 0.2 Abb | 2.9 ± 0.3 Ac | 3.6 ± 0.4 Ab | 25.9 ± 0.5 Ab | 2.1 ± 0.0 Bb | 0.48 ± 0.0 Bc | 1.3 ± 0.04 Bc | ||
| 5% | 1887 ± 31 Ab | 12.9 ± 0.4 Aab | 4.9 ± 1.5 Ab | 4.4 ± 01 Ab | 4.1 ± 0.2 Ab | 26.7 ± 0.3 Aa | 2.1 ± 01 Bb | 0.55 ± 0.0 Bb | 1.5 ± 0.02 Bb | ||
| 10% | 2335 ± 18 Aa | 12.3 ± 0.1 Ab | 4.2 ± 0.1 Ab | 4.2 ± 0.0 Ab | 4.0 ± 0.1 Ab | 30.0 ± 0.4 Aa | 1.9 ± 0.1 Bb | 0.54 ± 0.0 Bb | 1.6 ± 0.03 Ba | ||
| 75 | 0% | 1625 ± 37 Ab | 11.7 ± 0.2 Ba | 6.2 ± 1.3 Aa | 3.9 ± 0.1 Bb | 4.4 ± 0.1 ABb | 20.2 ± 0.6 Ab | 2.7 ± 0.3 Ba | 0.59 ± 0.0 Bb | 2.3 ± 0.32 Ba | |
| 2% | 1667 ± 55 Ab | 10.8 ± 0.1 Bb | 5.5 ± 0.6 Ab | 3.4 ± 0.6 Bb | 4.4 ± 0.3 ABb | 21.6 ± 0.9 Ab | 2.1 ± 0.1 Bb | 0.60 ± 0.0 Bb | 1.2 ± 0.14 Bbc | ||
| 5% | 1817 ± 70 Ab | 11.4 ± 1.0 Ba | 3.4 ± 0.4 Ab | 2.90 ± 0.2 Bc | 4.4 ± 08 ABb | 30.6 ± 1.1 Aa | 2.5 ± 0.1 Bab | 0.74 ± 0.0 Ba | 1.03 ± 0.09 Bc | ||
| 10% | 2069 ± 69 Aa | 10.7 ± 0.3 Bb | 3.9 ± 0.1 Ab | 4.15 ± 0.0 Ba | 5.0 ± 0.4 ABa | 29.0 ± 0.9 Aa | 1.9 ± 0.0 Bb | 0.54 ± 0.0 Bc | 1.59 ± 0.03 Bb | ||
| 125 | 0% | 1892 ± 97 ABb | 15.3 ± 0.6 ABa | 4.8 ± 0.2 Ba | 3.9 ± 0.0 Ca | 4.8 ± 0.8 BCa | 18.9 ± 1.7 Bb | 4.1 ± 0.1 Aa | 2.17 ± 0.1 Aa | 3.04 ± 0.34 Ab | |
| 2% | 1558 ± 60 ABb | 13.2 ± 0.3 ABb | 2.1 ± 0.2 Bb | 3.4 ± 0.1 Cb | 3.7 ± 0.1 BCb | 19.1 ± 1.6 Bb | 2.1 ± 0.1 Ab | 1.95 ± 0.0 Ab | 3.09 ± 0.03 Ab | ||
| 5% | 1319 ± 124 ABb | 13.2 ± 1.1 ABb | 2.0 ± 0.1 Bb | 3.0 ± 0.0 Cb | 3.8 ± 0.3 BCb | 27.2 ± 1.3 Ba | 2.5 ± 0.1 Ab | 0.67 ± 0.1 Ac | 3.01 ± 0.07 Ab | ||
| 10% | 2009 ± 73 ABa | 9.8 ± 0.9 ABc | 1.7 ± 0.3 Bb | 1.8 ± 0.1 Cc | 3.6 ± 0.1 BCb | 23.8 ± 1.3 Ba | 3.6 ± 0.1 Ab | 1.01 ± 0.0 Ab | 3.62 ± 0.19 Aa | ||
| 200 | 0% | 1340 ± 90 Bb | 11.9 ± 0.8 Bab | 4.7 ± 0.3 Ba | 1.7 ± 0.1 Dc | 5.7 ± 0.1 Ca | 21.1 ± 0.9 Ab | 3.0 ± 0.0 Ba | 0.86 ± 0.1 Ba | 4.58 ± 0.19 Ba | |
| 2% | 1462 ± 16 Bb | 12.9 ± 0.9 Ba | 2.8 ± 0.1 Bb | 2.2 ± 0.0 Db | 3.1 ± 0.0 Cb | 27.8 ± 2.1 Aa | 2.8 ± 0.1 Bb | 0.68 ± 0.0 Bb | 1.04 ± 0.03 Bb | ||
| 5% | 1134 ± 21 Bb | 12.4 ± 0.1 Ba | 2.3 ± 0.3 Bb | 3.4 ± 0.1 Da | 3.3 ± 0.1 Cb | 26.5 ± 0.2 Aa | 2.5 ± 0.0 Bb | 0.57 ± 0.0 Bb | 0.65 ± 0.05 Bc | ||
| 10% | 2542 ± 163 Ba | 10.9 ± 0.5 Bb | 2.6 ± 0.0 Bb | 2.3 ± 0.1 Db | 3.2 ± 0.2 Cb | 27.6 ± 3.4 Aa | 2.2 ± 0.1 Bb | 0.33 ± 0.0 Bc | 0.53 ± 0.00 Bc | ||
| +NPK | 0 | 0% | 1589 ± 206 Ba | 12.9 ± 0.9 Bc | 4.3 ± 0.3 Aa | 4.1 ± 0.4 Aa | 4.8 ± 0.6 Aa | 11.7 ± 1.0 Ab | 2.9 ± 0.3 Aa | 1.22 ± 0.0 Ba | 3.31 ± 1.21 Ab |
| 2% | 1412 ± 84 Bb | 13.3 ± 1.4 Bc | 1.9 ± 0.0 Ac | 2.8 ± 0.1 Ab | 4.2 ± 0.6 Ab | 25.2 ± 4.2 Aa | 1.9 ± 0.1 Ab | 1.05 ± 0.0 Bb | 4.18 ± 0.10 Aa | ||
| 5% | 1568 ± 28 Bab | 16.3 ± 0.0 Ba | 1.8 ± 0.1 Ac | 2.5 ± 0.1 Ac | 4.2 ± 0.1 Ab | 22.5 ± 0.4 Aa | 1.8 ± 0.1 Ab | 0.43 ± 0.1 Bc | 4.06 ± 0.07 Aa | ||
| 10% | 1287 ± 75 Bc | 15.4 ± 0.8 Bb | 2.4 ± 0.2 Ab | 2.8 ± 0.5 Ab | 3.2 ± 0.2 Ac | 20.4 ± 0.6 Aa | 1.7 ± 0.1 Ab | 0.45 ± 0.0 Bc | 1.96 ± 0.39 Ac | ||
| 75 | 0% | 2022 ± 181 Aab | 16.7 ± 0.0 Ab | 1.4 ± 0.1 Ca | 2.4 ± 0.1 Ac | 3.8 ± 0.1 Ba | 9.5 ± 0.4 Bb | 1.5 ± 0.0 Ac | 0.50 ± 0.1 Bb | 2.02 ± 0.02 Ab | |
| 2% | 1587 ± 49 Ac | 17.5 ± 0.8 Aa | 1.3 ± 0.0 Cb | 3.7 ± 0.1 Aa | 3.3 ± 0.1 Bb | 17.7 ± 0.4 Ba | 1.9 ± 0.0 Ab | 0.45 ± 0.0 Bb | 1.74 ± 0.26 Ab | ||
| 5% | 1720 ± 34 Ab | 16.7 ± 1.3 Ab | 1.2 ± 0.0 Cc | 2.8 ± 0.3 Ab | 2.7 ± 0.1 Bc | 17.8 ± 0.4 Ba | 2.8 ± 0.1 Aa | 1.13 ± 0.1 Ba | 5.14 ± 0.26 Aa | ||
| 10% | 2117 ± 98 Aa | 14.1 ± 1.6 Ac | 1.2 ± 0.1 Cc | 2.9 ± 0.3 Ab | 3.9 ± 0.5 Bab | 18.7 ± 0.2 Ba | 2.0 ± 0.0 Ab | 1 ± 0.06 Ba | 5.03 ± 0.22 Aa | ||
| 125 | 0% | 965 ± 5 Cc | 16.9 ± 0.2 Ab | 2.1 ± 0.1 Ba | 2.7 ± 0.1 Ba | 3.3 ± 0.1 ABb | 10.4 ± 0.6 Bc | 2.1 ± 0.1 Ab | 1.26 ± 0.0 Aa | 1.16 ± 0.23 Bb | |
| 2% | 830 ± 125 Cc | 17.6 ± 0. 8 Aa | 1.9 ± 0.0 Bb | 1.6 ± 0.1 Bb | 4.3 ± 0.1 ABa | 13.2 ± 1.6 Bb | 2.4 ± 0.0 Aa | 1.44 ± 0.1 Aa | 1.86 ± 0.05 Ba | ||
| 5% | 1032 ± 19 Cb | 16.3 ± 0.4 Ab | 2.1 ± 0.1 Ba | 2.7 ± 0.5 Ba | 3.4 ± 0.1 ABb | 17.3 ± 4.0 Ba | 2.4 ± 0.1 Aa | 0.53 ± 0.1 Ab | 0.77 ± 0.03 Bc | ||
| 10% | 1294 ± 115 Ca | 15.3 ± 1.4 Ac | 1.9 ± 0.1 Bb | 2.8 ± 0.2 Ba | 4.3 ± 0.5 ABa | 14.4 ± 0.3 Bb | 2.1 ± 0.2 Ab | 0.57 ± 0.0 Ab | 0.78 ± 0.02 Bc | ||
| 200 | 0% | 859 ± 46 Cc | 17.8 ± 0.4 ABa | 1.9 ± 0.1 Bc | 2.9 ± 0.2 ABb | 2.5 ± 0.1 Bc | 9.8 ± 0.5 Bc | 2.3 ± 0.2 Aab | 0.59 ± 0.0 Bb | 0.68 ± 0.01 Bc | |
| 2% | 939 ± 84 Cc | 16.5 ± 0.4 ABb | 1.8 ± 0.2 Bc | 3.1 ± 0.1 ABa | 3.4 ± 0.3 Bb | 13.3 ± 1.1 Bb | 2.2 ± 0.1 Ab | 0.62 ± 0.0 Bb | 1.70 ± 0.02 Bb | ||
| 5% | 1166 ± 86 Cb | 14.3 ± 1.1 ABc | 2.1 ± 0.1 Bb | 2.5 ± 0.1 ABc | 3.3 ± 0.2 Bb | 14.3 ± 0.6 Ba | 2.1 ± 0.0 Ab | 0.56 ± 0.0 Bb | 1.50 ± 0.06 Bb | ||
| 10% | 1242 ± 77 Ca | 14.6 ± 0.4 ABc | 2.6 ± 0.0 Ba | 2.1 ± 0.0 ABc | 3.9 ± 0.4 Ba | 14.1 ± 0.8 Ba | 2.4 ± 0.0 Aa | 1.34 ± 0.1 Ba | 3.12 ± 0.09 Ba | ||
| ANOVA | (S) | *** | ns | *** | *** | *** | *** | *** | *** | *** | |
| (BC) | *** | *** | *** | *** | *** | *** | *** | *** | ns | ||
| NPK | *** | *** | *** | *** | *** | *** | *** | ns | *** | ||
| S × BC | *** | ns | *** | *** | *** | * | *** | *** | *** | ||
| S × NPK | *** | *** | *** | *** | * | ** | ** | *** | *** | ||
| BC × NPK | *** | ns | *** | ** | *** | * | *** | *** | *** | ||
| S × BC × NPK | *** | ** | ns | *** | *** | * | *** | *** | *** | ||
| NPK | NaCl (mM) | BC (%) | Na+ | K+ | Ca2+ | Mg2+ | Zn2+ | Fe2+ | Mn2+ |
|---|---|---|---|---|---|---|---|---|---|
| −NPK | 0 | 0% | 2.6 ± 0.02 Bc | 52.17 ± 1.92 Aa | 88.28 ± 9.41 Aab | 3.27 ± 0.02 Ca | 0.03 ± 0.001 Bb | 0.15 ± 0.003 Abc | 0.14 ± 0.003 Ac |
| 2% | 2.71 ± 0.18 Bc | 33.06 ± 0.90 Aa | 79.11 ± 4.79 Aa | 2.52 ± 0.26 Ca | 0.02 ± 0.004 Bb | 0.17 ± 0.004 Ac | 0.12 ± 0.008 Ac | ||
| 5% | 4.99 ± 1 Bb | 31.73 ± 0.39 Aa | 100.01 ± 15.82 Ab | 2.69 ± 0.002 Ca | 0.21 ± 0.01 Ba | 0.16 ± 0.001 Aa | 0.18 ± 0.003 Ab | ||
| 10% | 4.82 ± 0.25 Ba | 29.43 ± 1.10 Aa | 158.37 ± 9.54 Aab | 2.80 ± 0.02 Ca | 0.02 ± 0.001 Bb | 0.15 ± 0.00 Aab | 0.15 ± 0.003 Aa | ||
| 75 | 0% | 5.53 ± 0.05 Ba | 34.09 ± 1.13 ABa | 95.91 ± 6.04 Bab | 3.17 ± 0.11 ABa | 0.04 ± 0.003 Db | 0.14 ± 0.007 Abc | 0.10 ± 0.01 Bc | |
| 2% | 3.85 ± 0.21 Bb | 32.57 ± 0.27 ABa | 138.29 ± 4.18 Ba | 5.05 ± 0.15 ABa | 0.05 ± 0.006 Db | 0.07 ± 0.002 Ac | 0.13 ± 0.007 Bc | ||
| 5% | 3.14 ± 0.29 Bc | 32.12 ± 0.68 ABa | 73.66 ± 0.96 Bb | 2.83 ± 0.15 ABa | 0.03 ± 0.005 Da | 0.25 ± 0.09 Aa | 0.16 ± 0.007 Bb | ||
| 10% | 2.98 ± 0.21 Bc | 31.51 ± 1.06 ABa | 70.33 ± 0.92 Bab | 2.83 ± 0.24 ABa | 0.03 ± 0.004 Db | 0.22 ± 0.05 Aab | 0.15 ± 0.002 Ba | ||
| 125 | 0% | 5.20 ± 0.30 Bb | 36.63 ± 0.78 BCa | 94.57 ± 1.36 Bab | 3.22 ± 0.02 Aa | 0.07 ± 0.01 Cb | 0.14 ± 0.003 Abc | 0.09 ± 0.006 Cc | |
| 2% | 4.27 ± 0.05 Ba | 33.51 ± 3.61 BCa | 94.23 ± 6.20 Ba | 2.89 ± 0.08 Aa | 0.04 ± 0.01 Cb | 0.16 ± 0.02 Ac | 0.08 ± 0.00 Cc | ||
| 5% | 3.83 ± 0.25 Bc | 28.63 ± 0.51 BCa | 99.47 ± 1.86 Bb | 4.23 ± 2.01 Aa | 0.06 ± 0.01 Ca | 0.18 ± 0.02 Aa | 0.09 ± 0.02 Cb | ||
| 10% | 2.32 ± 0.11 Bc | 28.05 ± 0.46 BCa | 79.69 ± 0.38 Bab | 5.68 ± 0.17 Aa | 0.04 ± 0.003 Cb | 0.16 ± 0.01 Aab | 0.13 ± 0.01 Ca | ||
| 200 | 0% | 9.14 ± 0.42 Aa | 33.51 ± 1.85 Ca | 85.33 ± 2.75 Cab | 3.23 ± 0.13 BCa | 0.07 ± 0.01 Ab | 0.16 ± 0.02 Abc | 0.08 ± 0.006 Cc | |
| 2% | 5.21 ± 0.91 Ab | 31.51 ± 2.79 Ca | 78.64 ± 5.33 Ca | 3.21 ± 0.32 BCa | 0.07 ± 0.03 Ab | 0.14 ± 0.02 Ac | 0.08 ± 0.007 Cc | ||
| 5% | 3.51 ± 0.13 Ac | 29.20 ± 0.30 Ca | 88.05 ± 1.66 Cb | 3.16 ± 0.13 BCa | 0.19 ± 0.01 Aa | 0.15 ± 0.004 Aa | 0.11 ± 0.004 Cb | ||
| 10% | 2.97 ± 0.60 Ac | 26.77 ± 1.01 Ca | 67.99 ± 3.19 Cab | 3.42 ± 0.03 BCa | 0.06 ± 0.008 Ab | 0.15 ± 0.002 Aab | 0.15 ± 0.006 Ca | ||
| +NPK | 0 | 0% | 5.48 ± 0.66 Ca | 36.43 ± 1.83 Aa | 88.80 ± 8.27 Aa | 3.06 ± 0.28 Aa | 0.11 ± 0.03 Aa | 0.19 ± 0.03 Aa | 0.07 ± 0.006 ABab |
| 2% | 3.92 ± 0.32 Cb | 32.26 ± 2.83 Ab | 77.48 ± 1.36 Aa | 8.70 ± 6.10 Aa | 0.12 ± 0.03 Aa | 0.14 ± 0.01 Ab | 0.04 ± 0.00 ABb | ||
| 5% | 3.25 ± 0.07 Cc | 31.55 ± 1.67 Ab | 77.35 ± 50 Aa | 2.75 ± 0.05 Aa | 0.08 ± 0.05 Aa | 0.24 ± 0.07 Aa | 0.05 ± 0.005 ABab | ||
| 10% | 2.36 ± 0.03 Cc | 28.23 ± 2.73 Ab | 86.86 ± 1.18 Aa | 3.08 ± 0.13 Aa | 0.12 ± 0.07 Aa | 0.16 ± 0.02 Ab | 0.08 ± 0.02 ABa | ||
| 75 | 0% | 5.37 ± 0.25 Bb | 36.52 ± 0.82 Aa | 82.06 ± 2.36 Aa | 2.83 ± 0.08 Aa | 0.11 ± 0.01 Aa | 0.21 ± 0.01 ABa | 0.05 ± 0.004 Bab | |
| 2% | 5.17 ± 0.25 Bc | 30.85 ± 0.45 Ab | 78.15 ± 3.35 Aa | 3.07 ± 0.00 Aa | 0.08 ± 0.00 Aa | 0.12 ± 0.004 ABb | 0.04 ± 0.007 Bb | ||
| 5% | 4.65 ± 0.18 Bc | 30.11 ± 0.36 Ab | 83.88 ± 2.34 Aa | 2.82 ± 0.23 Aa | 0.09 ± 0.05 Aa | 0.14 ± 0.003 ABa | 0.05 ± 0.004 Bab | ||
| 10% | 4.62 ± 0.12 Ba | 28.51 ± 5.66 Ab | 91.16 ± 12.16 Aa | 14.30 ± 11.45 Aa | 0.13 ± 0.09 Aa | 0.14 ± 0.003 ABb | 0.06 ± 0.007 Ba | ||
| 0% | 6.21 ± 0.03 Aa | 32.38 ± 3.76 Ab | 83.88 ± 1.58 Aa | 2.92 ± 0.07 Aa | 0.07 ± 0.04 Aa | 0.14 ± 0.006 Ba | 0.06 ± 0.01 Bab | ||
| 125 | 2% | 6.18 ± 0.38 Ab | 31.70 ± 2.05 Ab | 88.33 ± 1.13 Aa | 2.92 ± 0.32 Aa | 0.11 ± 0.005 Aa | 0.10 ± 0.008 Bb | 0.06 ± 0.00 Bb | |
| 5% | 5.13 ± 0.16 Ac | 30.85 ± 3.35 Aa | 92.55 ± 8.40 Aa | 3.43 ± 0.06 Aa | 0.11 ± 0.07 Aa | 0.15 ± 0.07 Ba | 0.06 ± 0.003 Bab | ||
| 10% | 5.08 ± 0.28 Ac | 30.63 ± 4.88 Ab | 74.60 ± 2.92 Aa | 2.78 ± 0.48 Aa | 0.03 ± 0.002 Aa | 0.11 ± 0.01 Bb | 0.05 ± 0.002 Ba | ||
| 200 | 0% | 6.42 ± 0.15 Aa | 37.50 ± 0.67 Aa | 90.42 ± 1.22 Aa | 3.10 ± 0.02 Aa | 0.12 ± 0.01 Aa | 0.16 ± 0.01 Ba | 0.06 ± 0.004 Aab | |
| 2% | 6.11 ± 0.26 Ac | 32.03 ± 1.68 Ab | 92.73 ± 16.16 Aa | 2.87 ± 0.02 Aa | 0.07 ± 0.02 Aa | 0.15 ± 0.002 Bb | 0.07 ± 0.00 Ab | ||
| 5% | 5.50 ± 0.22 Ab | 31.02 ± 1.20 Ab | 73.91 ± 0.71 Aa | 3.53 ± 0.18 Aa | 0.06 ± 0.03 Aa | 0.15 ± 0.04 Ba | 0.07 ± 0.01 Aab | ||
| 10% | 5.32 ± 0.12 Ac | 24.93 ± 9.83 Ab | 85.61 ± 21.13 Aa | 2.75 ± 0.05 Aa | 0.09 ± 0.005 Aa | 0.12 ± 0.00 Bb | 0.07 ± 0.01 Aa | ||
| ANOVA | NaCl | *** | ** | *** | ns | * | ** | *** | |
| BC | *** | * | ns | ns | ** | *** | *** | ||
| NPK | *** | ns | *** | ns | *** | ns | *** | ||
| NaCl × BC | *** | *** | *** | * | * | ** | *** | ||
| NaCl × NPK | *** | ** | *** | ns | ** | * | *** | ||
| BC × NPK | *** | ** | ns | ns | *** | ** | *** | ||
| NaCl × BC × NPK | *** | *** | *** | *** | *** | *** | *** | ||
Disclaimer/Publisher’s Note: The statements, opinions and data contained in all publications are solely those of the individual author(s) and contributor(s) and not of MDPI and/or the editor(s). MDPI and/or the editor(s) disclaim responsibility for any injury to people or property resulting from any ideas, methods, instructions or products referred to in the content. |
© 2024 by the authors. Licensee MDPI, Basel, Switzerland. This article is an open access article distributed under the terms and conditions of the Creative Commons Attribution (CC BY) license (https://creativecommons.org/licenses/by/4.0/).
Share and Cite
Bagues, M.; Neji, M.; Karbout, N.; Boussora, F.; Triki, T.; Guasmi, F.; Nagaz, K. Mitigating Salinity Stress in Barley (Hordeum vulgare L.) through Biochar and NPK Fertilizers: Impacts on Physio-Biochemical Behavior and Grain Yield. Agronomy 2024, 14, 317. https://doi.org/10.3390/agronomy14020317
Bagues M, Neji M, Karbout N, Boussora F, Triki T, Guasmi F, Nagaz K. Mitigating Salinity Stress in Barley (Hordeum vulgare L.) through Biochar and NPK Fertilizers: Impacts on Physio-Biochemical Behavior and Grain Yield. Agronomy. 2024; 14(2):317. https://doi.org/10.3390/agronomy14020317
Chicago/Turabian StyleBagues, Mohamed, Mohamed Neji, Nissaf Karbout, Faiza Boussora, Tebra Triki, Ferdaous Guasmi, and Kamel Nagaz. 2024. "Mitigating Salinity Stress in Barley (Hordeum vulgare L.) through Biochar and NPK Fertilizers: Impacts on Physio-Biochemical Behavior and Grain Yield" Agronomy 14, no. 2: 317. https://doi.org/10.3390/agronomy14020317
APA StyleBagues, M., Neji, M., Karbout, N., Boussora, F., Triki, T., Guasmi, F., & Nagaz, K. (2024). Mitigating Salinity Stress in Barley (Hordeum vulgare L.) through Biochar and NPK Fertilizers: Impacts on Physio-Biochemical Behavior and Grain Yield. Agronomy, 14(2), 317. https://doi.org/10.3390/agronomy14020317