Article

Optimized Tomato Production in Chinese Solar Greenhouses: The Impact of an East–West Orientation and Wide Row Spacing

1
College of Horticultural Science and Engineering, Shandong Agricultural University, Tai’an 271018, China
2
Department of Smart Agriculture, Hunan Agricultural University, Changsha 410128, China
3
China-Japan Protected Horticulture Cooperative Research Center of Shandong, Tai’an 271018, China
*
Author to whom correspondence should be addressed.
Agronomy 2024, 14(2), 314; https://doi.org/10.3390/agronomy14020314
Submission received: 6 January 2024 / Revised: 25 January 2024 / Accepted: 29 January 2024 / Published: 31 January 2024

Abstract

:
Experimental studies were conducted on the cultivation of tomatoes (Solanum lycopersicum L.) at Shandong Agricultural University, China, from 2022 to 2023. Three cultivation patterns were designed as follows: a north–south orientation with a row spacing of 1.40 m (NS-1.4m), a north–south orientation with a row spacing of 1.80 m (NS-1.8m) and an east–west orientation with a row spacing of 1.80 m (EW-1.8m). A functional–structural plant model using the open source interactive modeling platform of GroIMP was constructed for the cultivation of tomatoes. The growth of plants as well as the light distribution and light interception capacity of the crop canopy were simulated and analyzed. The impacts of these cultivation patterns on the growth, photosynthetic characteristics, fruit ripening time, quality and yield of tomato plants were analyzed. The studies revealed that compared with the NS-1.4m treatment, the canopy light interception of tomato plants under the NS-1.8m and EW-1.8m treatments increased by 6.08% and 9.80% in a winter–spring crop and 6.80% and 19.76% in an autumn–winter crop, respectively. Their plant height, leaf area, aboveground dry matter accumulation, leaf net photosynthesis rate as well as the lycopene, vitamin C and sugar–acid ratio of the fruit all exhibited increasing trends, while fruit ripening was accelerated. The yield of the NS-1.8m and EW-1.8m treatments increased by 3.92% and 6.18% in a winter–spring crop and 4.17% and 9.78% in an autumn–winter crop, respectively. Structural equation modeling was used to further analyze the data, confirming that the cultivation of an east–west orientation with wide row spacing is beneficial for tomato cultivation in Chinese solar greenhouses. This cultivation pattern maximizes the canopy’s light interception, thus leading to improved fruit quality and yield. Overall, this study provides valuable insights for optimizing the cultivation pattern of solar greenhouse crops.

1. Introduction

China’s solar greenhouses allow farmers to effectively control the environment and play a crucial role in the counter-seasonal cultivation of vegetables [1]. Tomatoes (Solanum lycopersicum L.) are rich in lycopene, vitamin C and other nutrients [2], thereby making them one of the main vegetables grown in solar greenhouses [3]. However, conventional solar greenhouse tomato cultivation patterns often utilize a north–south row orientation with narrow row spacing. This arrangement, which is characterized by short row lengths, narrow row spacing and population closure, limits the operation of agricultural machinery and increases labor costs [4]. Therefore, adjusting cultivation row spacing and orientation has become an important agronomic approach to facilitate mechanical operation. It is worth noting that since solar greenhouses primarily rely on the front roof for light and can be shaded through non-transparent structures such as walls and an insulation quilt, their internal light environment is often uneven [5]. Therefore, it is essential to propose optimal row orientation and spacing configurations that consider the impact of the solar greenhouse structure on lighting while also being suitable for mechanized production.
Planting patterns have a direct impact on lighting, which can influence photosynthetic capacity, plant growth, fruit ripening and yield production. A suitable planting pattern can improve the plant canopy’s structure, ventilation, light transmission and utilization, ultimately promoting plant growth and development [6]. Research has shown that planting in wide, narrow rows can increase radiation utilization by 1% compared with that in uniform spacing [7]. The spacing and orientation of rows have a more significant impact on light interception than the spacing between plants does [8,9]. However, excessive dense planting can cause shading within the canopy, thereby limiting light absorption in the lower old leaves [10]. For greenhouse tomatoes, previous studies have shown that changes in the light environment can affect the ripening time and fruit quality [11,12]. Tang et al. [13] concluded that the cluster cultivation method outperformed the traditional double row cultivation method in terms of the light environment, yield and quality. Cui et al. [14] found that under an east–west-oriented cultivation, dense planting was more beneficial for achieving an increased yield. However, the greenhouse structure has rarely been involved in investigating the correlation between the planting strategy and crop growth.
Functional–structural plant models (FSPMs) are capable of simulating complex plant interactions and of quantifying the impact of plant structure on light absorption and photosynthesis using the obtained data of canopy light interception [15,16,17]. They have been widely applied, for instance, in canopy light interception studies involving cotton [18], wheat [19], maize/soybean intercropping [20], rice [21] and cucumbers [22]. In studies on tomato cultivation, De Visser et al. [23] used ray tracing and a detailed FSPM to determine the optimal LED illumination position for tomato plants. Van der Meer et al. [24] analyzed the impact of planting orientation on tomatoes in a Venlo greenhouse and found that east–west row planting affected light interception uniformity but not photosynthesis. Zhang et al. [25] discussed the effects of planting density and row orientation on tomatoes grown in solar greenhouses and determined that plant spacing had the highest impact on light interception, with east–west planting enhancing population light interception. Sarlikioti et al. [26] concluded that higher solar altitude angles in summer resulted in light being more perpendicular to the plant canopy, thus leading to increased light penetration and reduced interception. They also found that north–south-oriented cultivation led to higher light interception than east–west-oriented cultivation did. It is important to note that plants can adapt to the environmental variations caused by cultivation patterns by modifying their canopy structural characteristics during growth [6,27]. Consequently, modeling should take into account the phenotypic plasticity of plants under different environmental conditions [28]. However, the FSPM in the aforementioned study did not take this into consideration.
In our previous study, we found that the tomato yield did not decrease and even increased when using an east–west orientation with wide row spacing in Chinese solar greenhouses compared with the conventional north–south cultivation pattern [29]. However, the underlying mechanism behind this phenomenon remains unclear. We hypothesized that the enhancement of the yield by changing the cultivation pattern was due to an increase in canopy light interception, which may be related to changes in phenotypic parameters such as plant height, leaf area and leaf elevation angle, as well as leaf photosynthetic capacity. Therefore, our objective was to accurately calculate the canopy light interception at different locations in the greenhouse and for different tomato populations and to comprehensively analyze the effects of different cultivation patterns on light interception, growth, photosynthetic capacity, fruit yield and quality through structural equation modeling. This study aims to explore the mechanism of the cultivation pattern of an east–west orientation with wide row spacing to improve the production of solar greenhouse tomatoes and to provide a theoretical basis for the promotion of mechanized production in the field of protected horticulture.

2. Materials and Methods

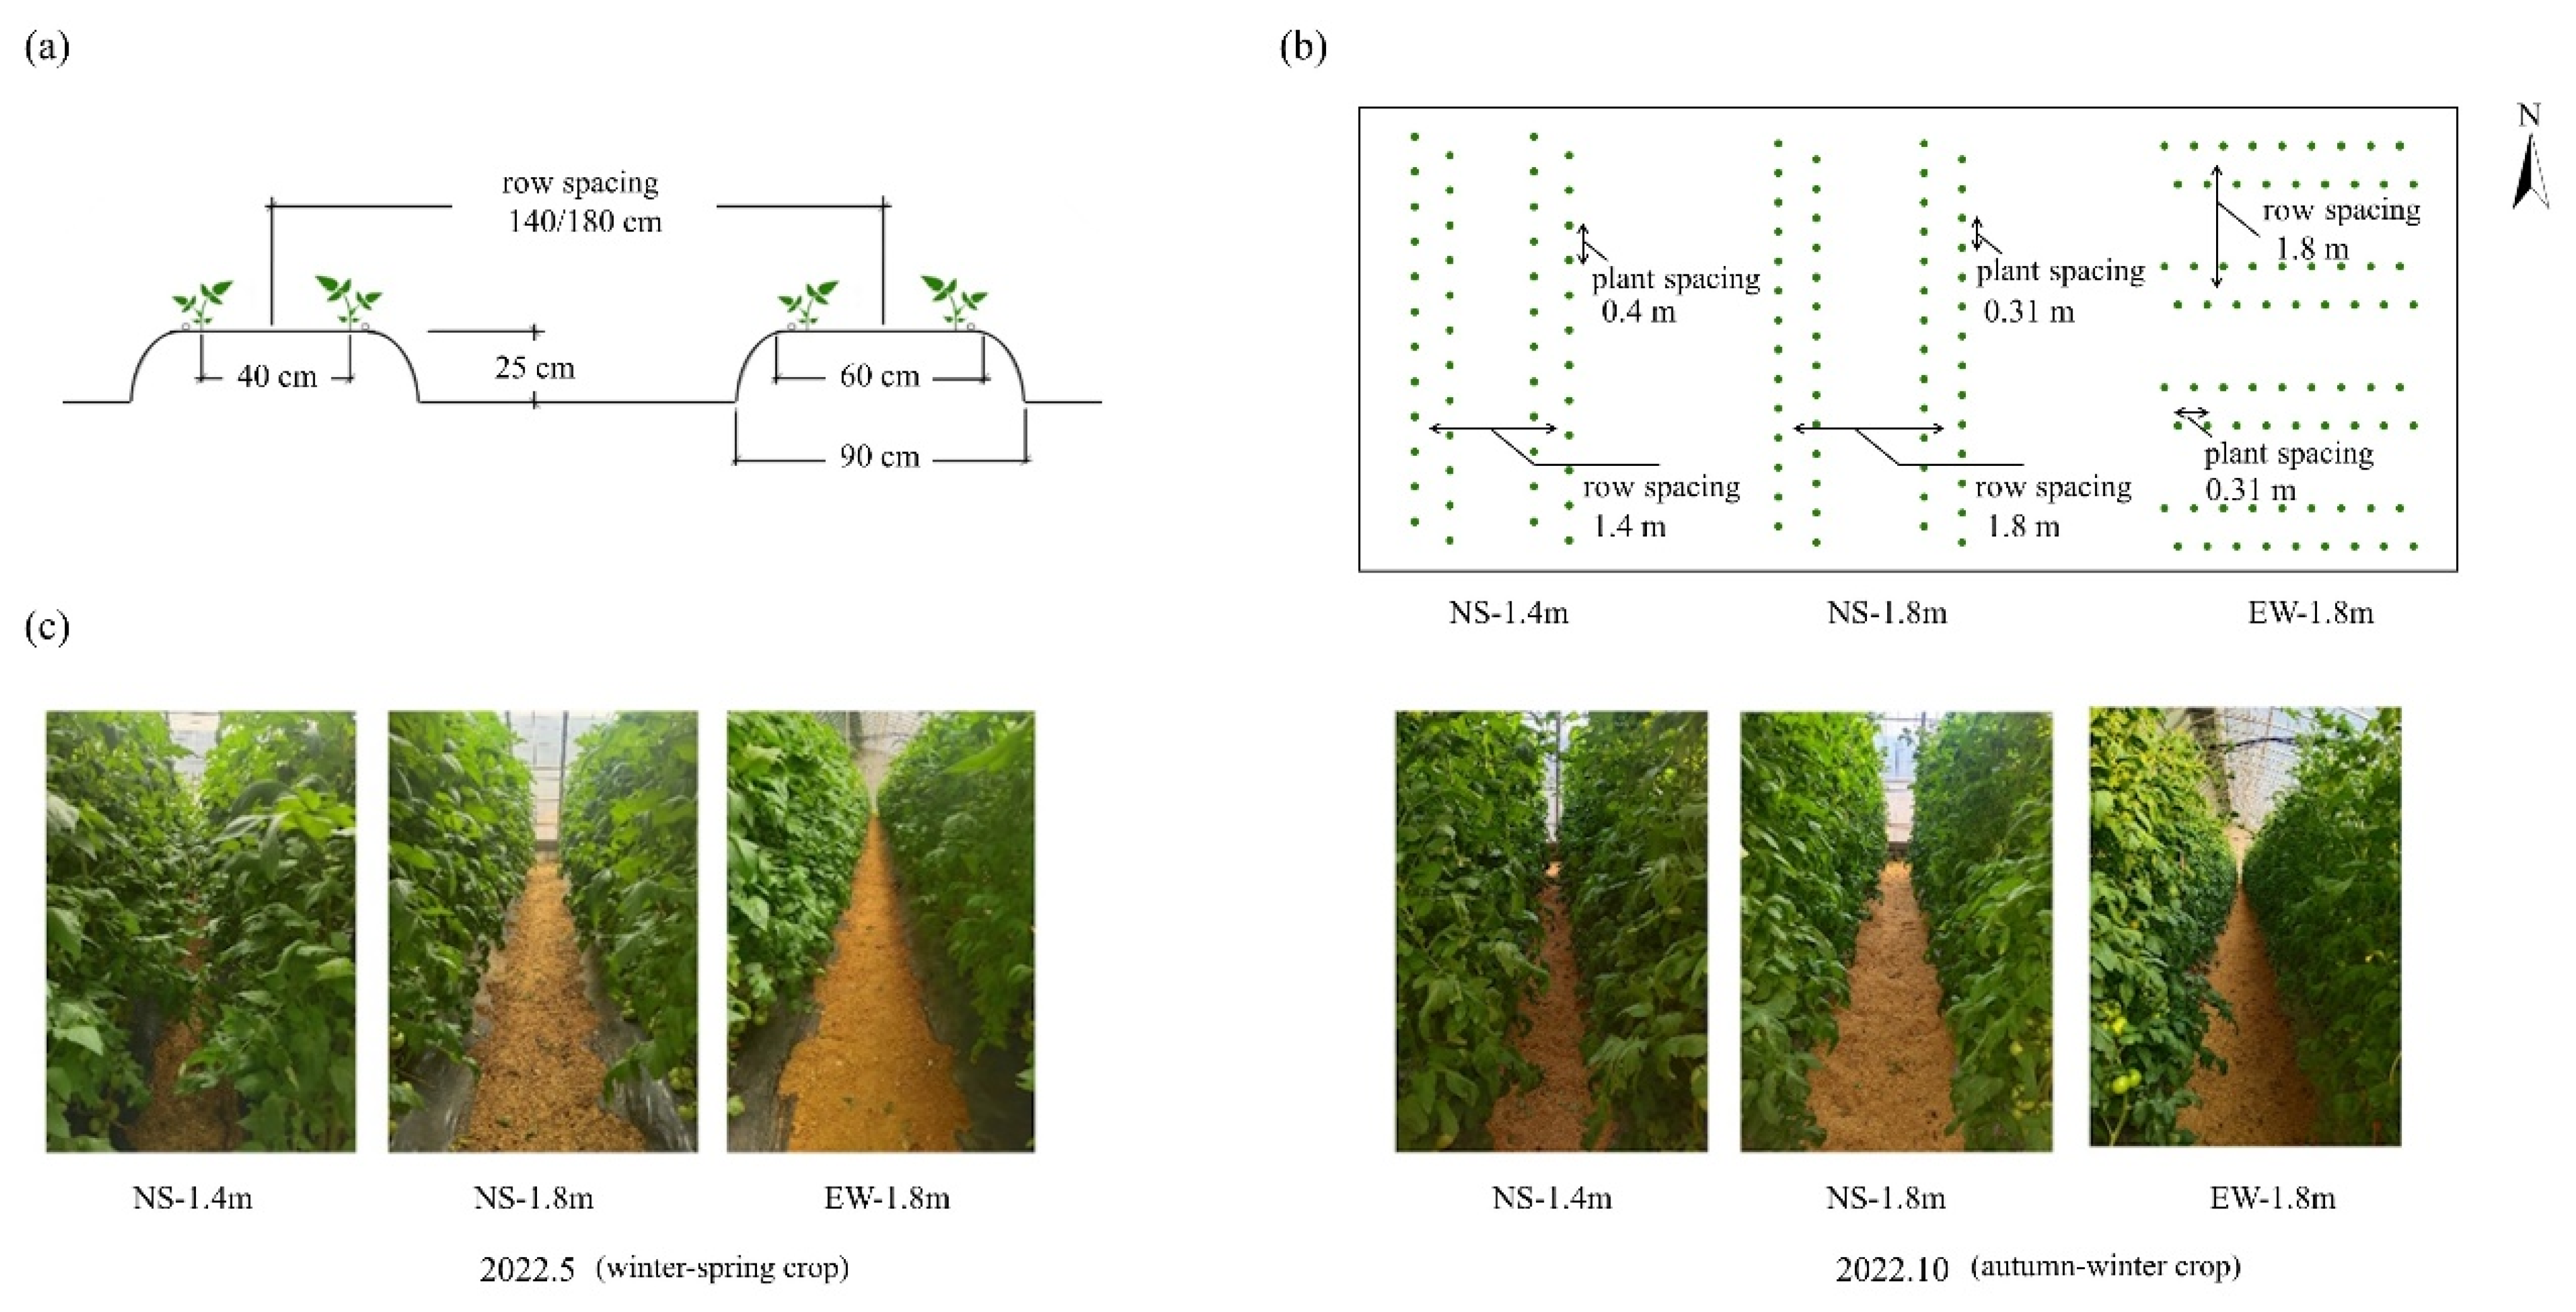
2.1. Experiment Material and Experiment Design

The experiment was conducted in a solar greenhouse (36°10′ N, 117°09′ E) at Shandong Agricultural University, Tai’an City, Shandong Province, China. It was divided into winter–spring (2022.2–2022.6) and autumn–winter (2022.8–2023.1) crops according to the seasons in which they were cultivated. Data collectors (Onset HOBO, Pro V2, Bourne, MA, USA) were used to collect the greenhouse’s daily average temperature and humidity (Figure 1). Soil fertility parameters were measured before transplanting (Table 1). To show the repeatability of the results, two additional crops experiments from 2021.8 to 2022.1 and from 2023.2 to 2023.6 were conducted and the yield data were collected.
The experimental tomato varieties were “3690” (Anxin Seedling Co., Ltd., Jinan, China). Tomatoes were planted in a seedbed with a bottom width of 90 cm, a top width of 60 cm and a height of 25 cm in a double row planting pattern and a the spacing between each row of the double row (within the row spacing) of 40 cm (Figure 2a). Three different treatments were designed for the experiment as follows: one planted in a north–south orientation, with the spacing between the midpoints of the two adjacent double rows being 1.4 m and the plant spacing being 40 cm (NS-1.4m); one planted in a north–south orientation, with the spacing between the midpoints of the two adjacent double rows being 1.8 m and the plant spacing being 31 cm (NS-1.8m); and one planted in an east–west orientation, with the spacing between the midpoints of the two adjacent double rows being 1.8 m and the plant spacing being 31 cm (EW-1.8m) (Figure 2b). The planting density of all the treatments was 36,000 plants·ha−1. A guard plot with a width of approximately 5 m was established between each treatment. Samples were collected from the center of the tomato population within a 6 m × 6 m area. Tomatoes were routinely managed, single pruned and topped after three leaves above the sixth truss (Figure 2c).

2.2. Plant Measurements

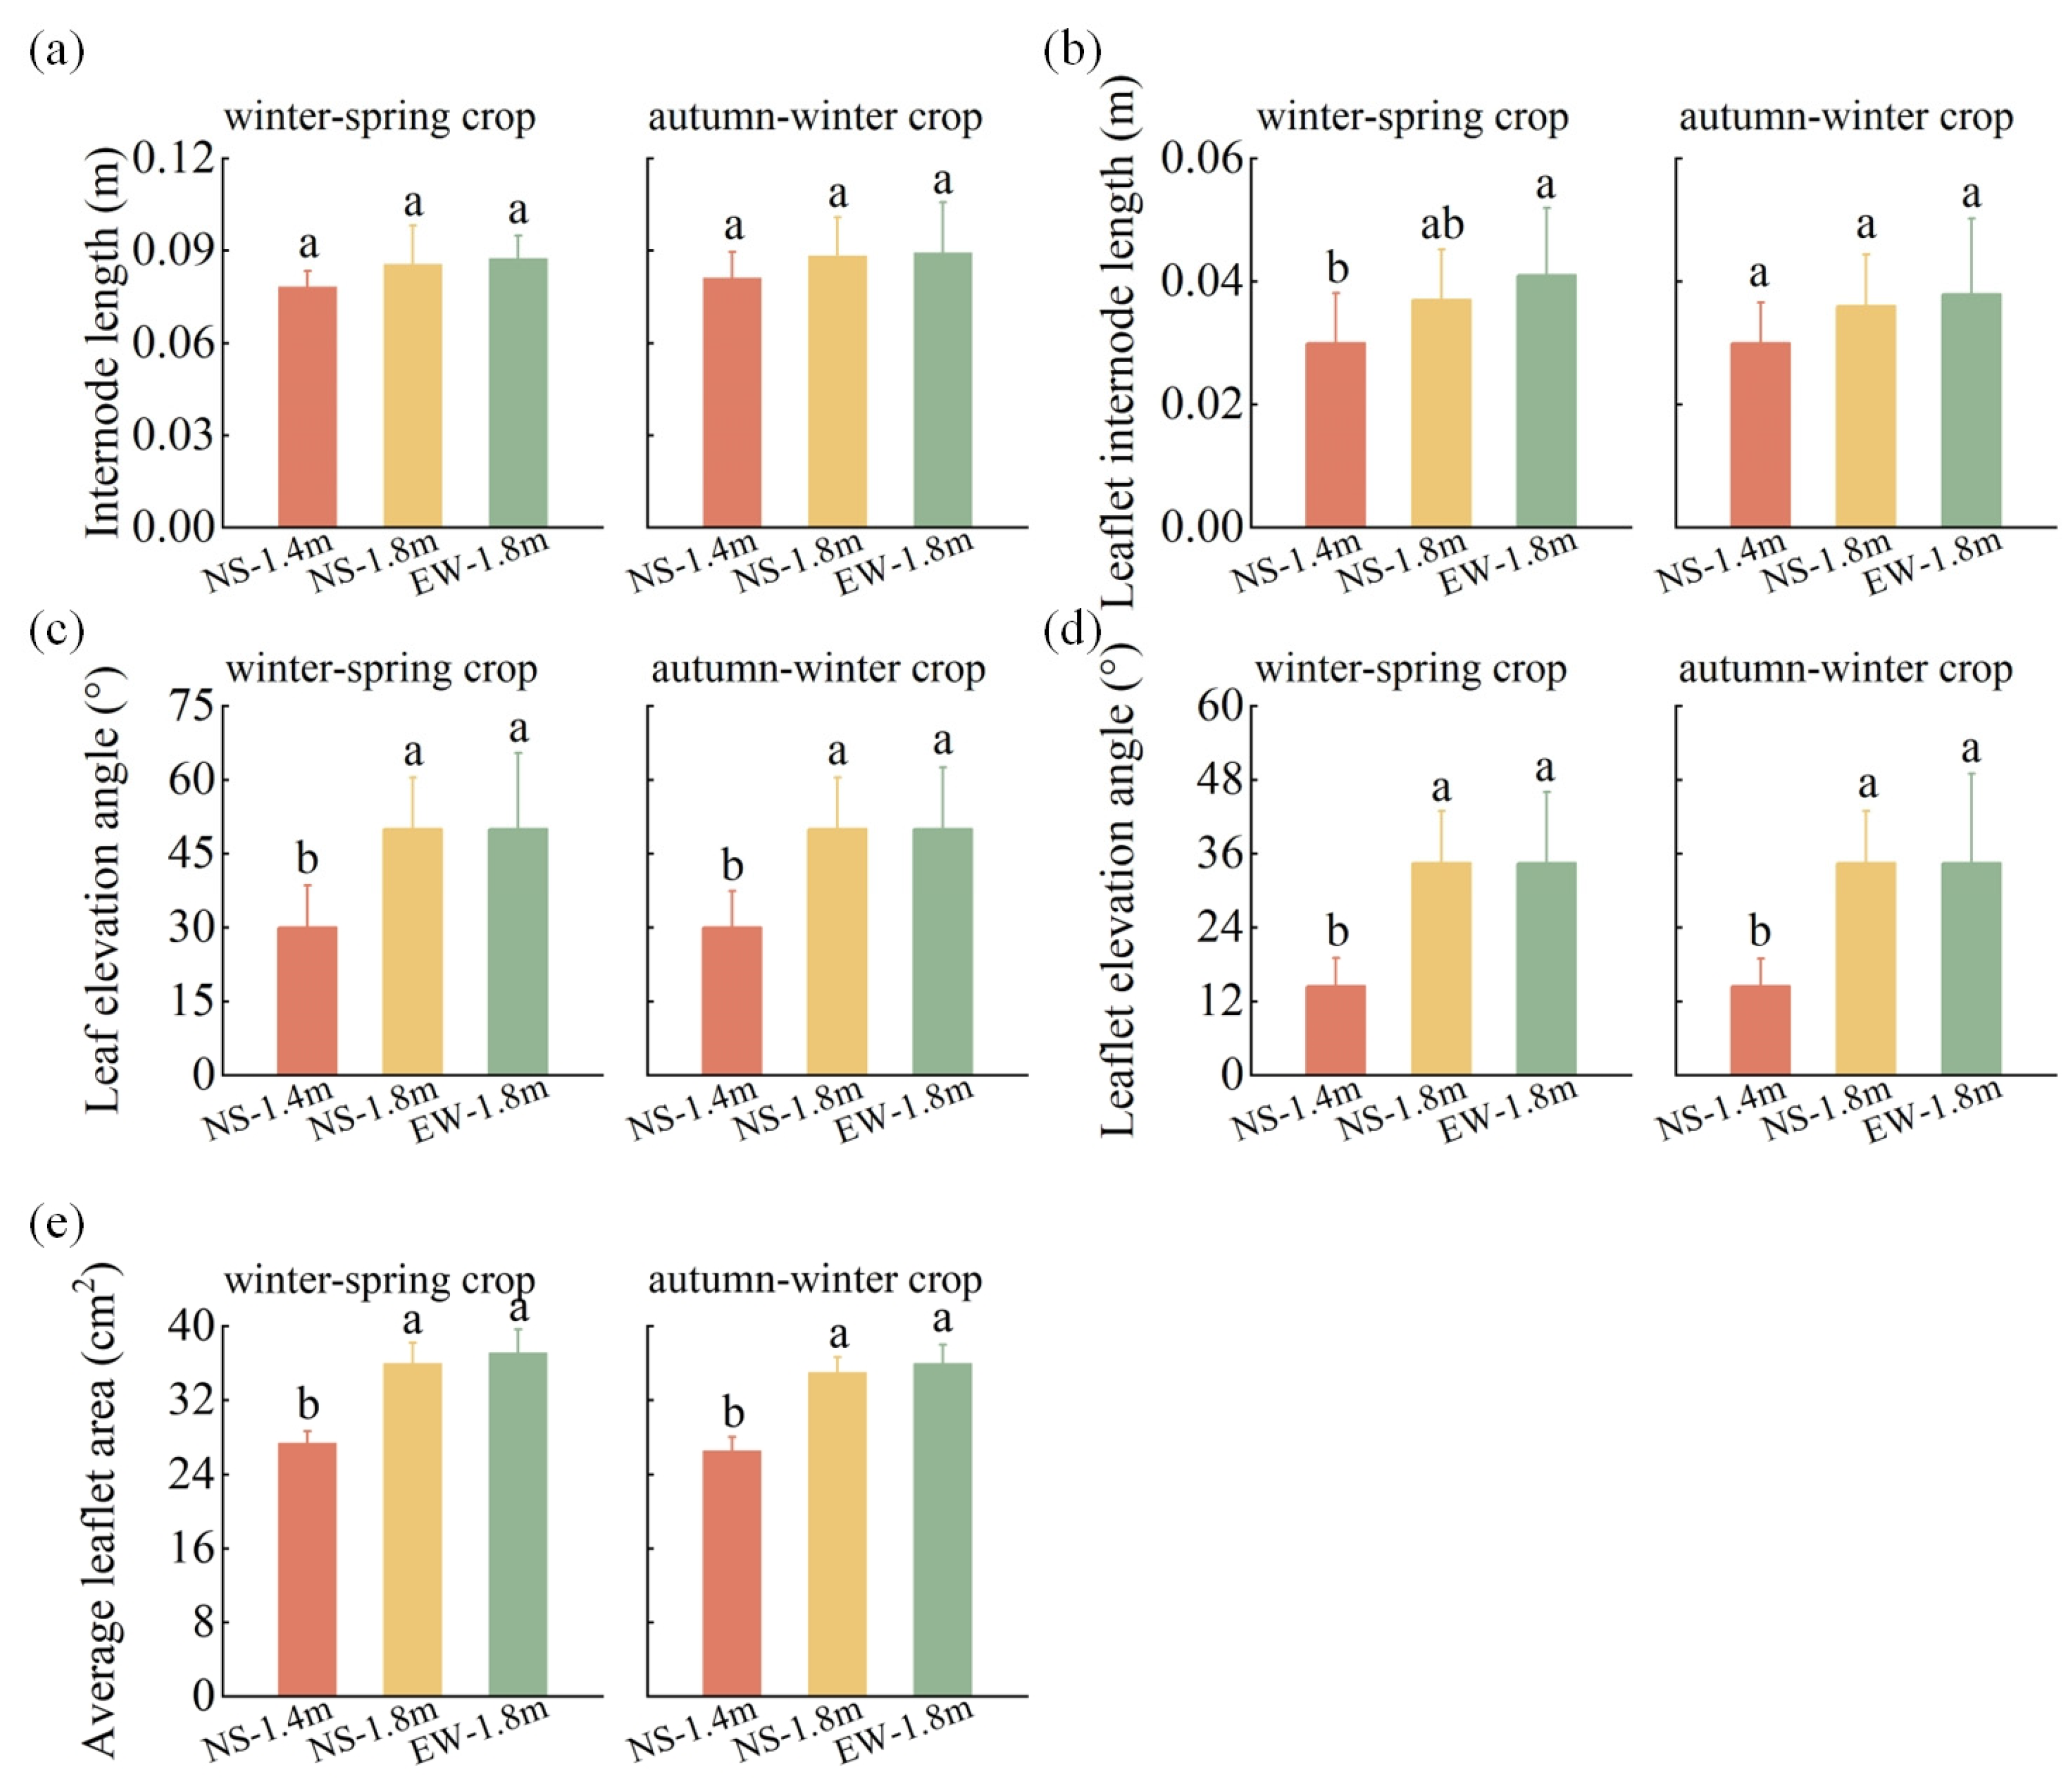
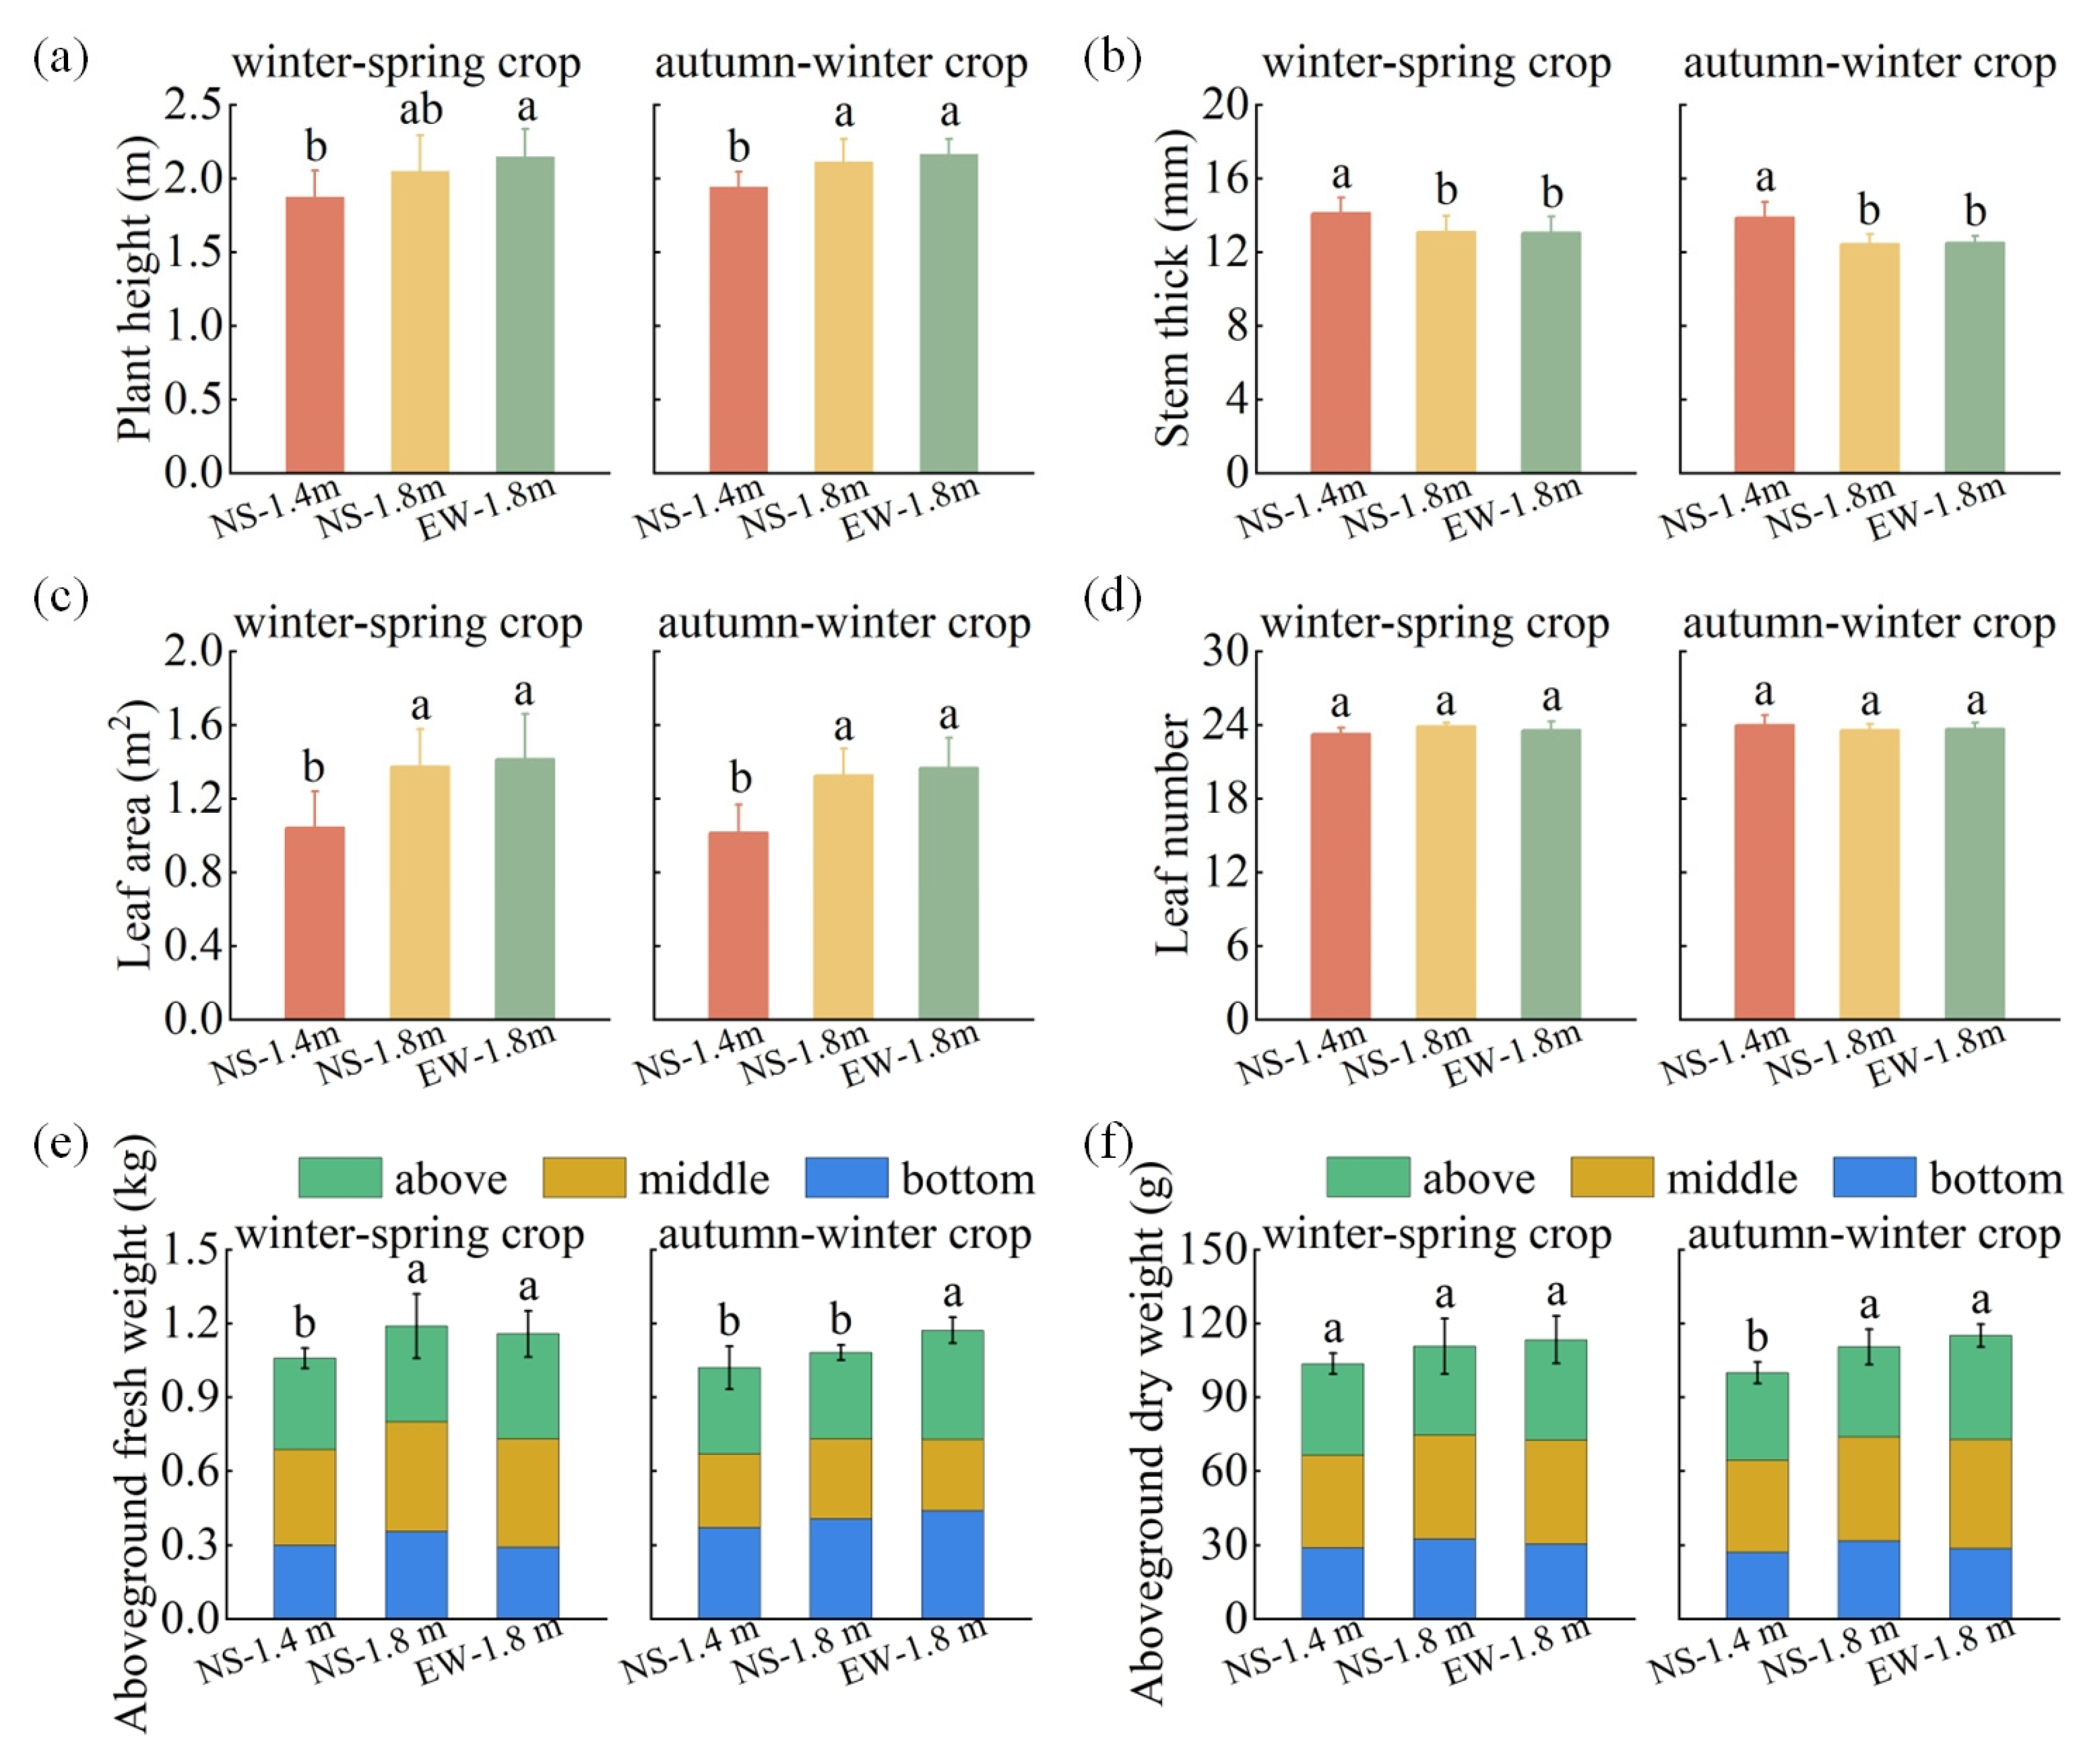
2.2.1. Morphology and Growth

After the plant morphology was stabilized (1 May 2022 and 1 November 2022), 10 tomato plants that had uniform growth were selected from each treatment. Internode and leaf lengths were determined using a tape measure, petiole and leaflet elevation angles were determined using a protractor, leaf area was determined using a leaf area meter (CI-202, CID Bio-science, Camas, WA, USA) and leaf number was counted. Plant height (height from the stem base to the growing point) was determined using a tape measure and stem thickness (maximum diameter at 1 cm above the cotyledons) was determined using a spiral micrometer. The aboveground fresh weight and dry weight after drying to a constant weight at 85 °C in an oven were determined using an analytical balance.

2.2.2. Gas Exchange Parameter

Upon the fruiting period, 10 tomato plants that had uniform growth were selected for each treatment, and the net photosynthetic rate (Pn), intercellular CO2 concentration (Ci), stomatal conductance (Gs) and transpiration rate (Tr) of the fourth leaf below the growing point were measured using a portable photosynthesis system (CIRAS-3, PP Systems, Amesbury, MA, USA) on a sunny day from 9:00 to 11:00 am. The light intensity was 1000 µmol∙m−2∙s−1 and was provided by a built-in LED light source; the CO2 concentration was 400 µmol∙m−2∙s−1 and was supplied by a gas injection system.

2.2.3. Yield and Quality

Ten uniform plants were selected for each treatment, and the number of fruits, individual fruit weight and fruit ripening time of different trusses were recorded to calculate the yield per plant (individual fruit weight multiplied by the fruit number per plant) and per hectare.
Ten fruits of uniform maturity in the second truss were selected from each treatment for quality determination. Soluble sugar content was determined using the anthrone colorimetric method [30]; the organic acid content was determined through the titration method of NaOH solution [31]; the sugar–acid ratio was defined as the ratio of the soluble solid to the total acidity [32]; the lycopene content was determined through the petroleum ether colorimetric method [33]; and vitamin C content was determined through the dichloroindophenol titrimetric method [34].

2.3. Model Description

The open source interactive modeling platform GroIMP v1.6 [35,36] was used to construct a functional–structural plant model (FSPM) of tomato plants including a solar greenhouse model. Moreover, the model further includes sky and sunlight modules to simulate diffuse and direct light within the virtual scene [36].

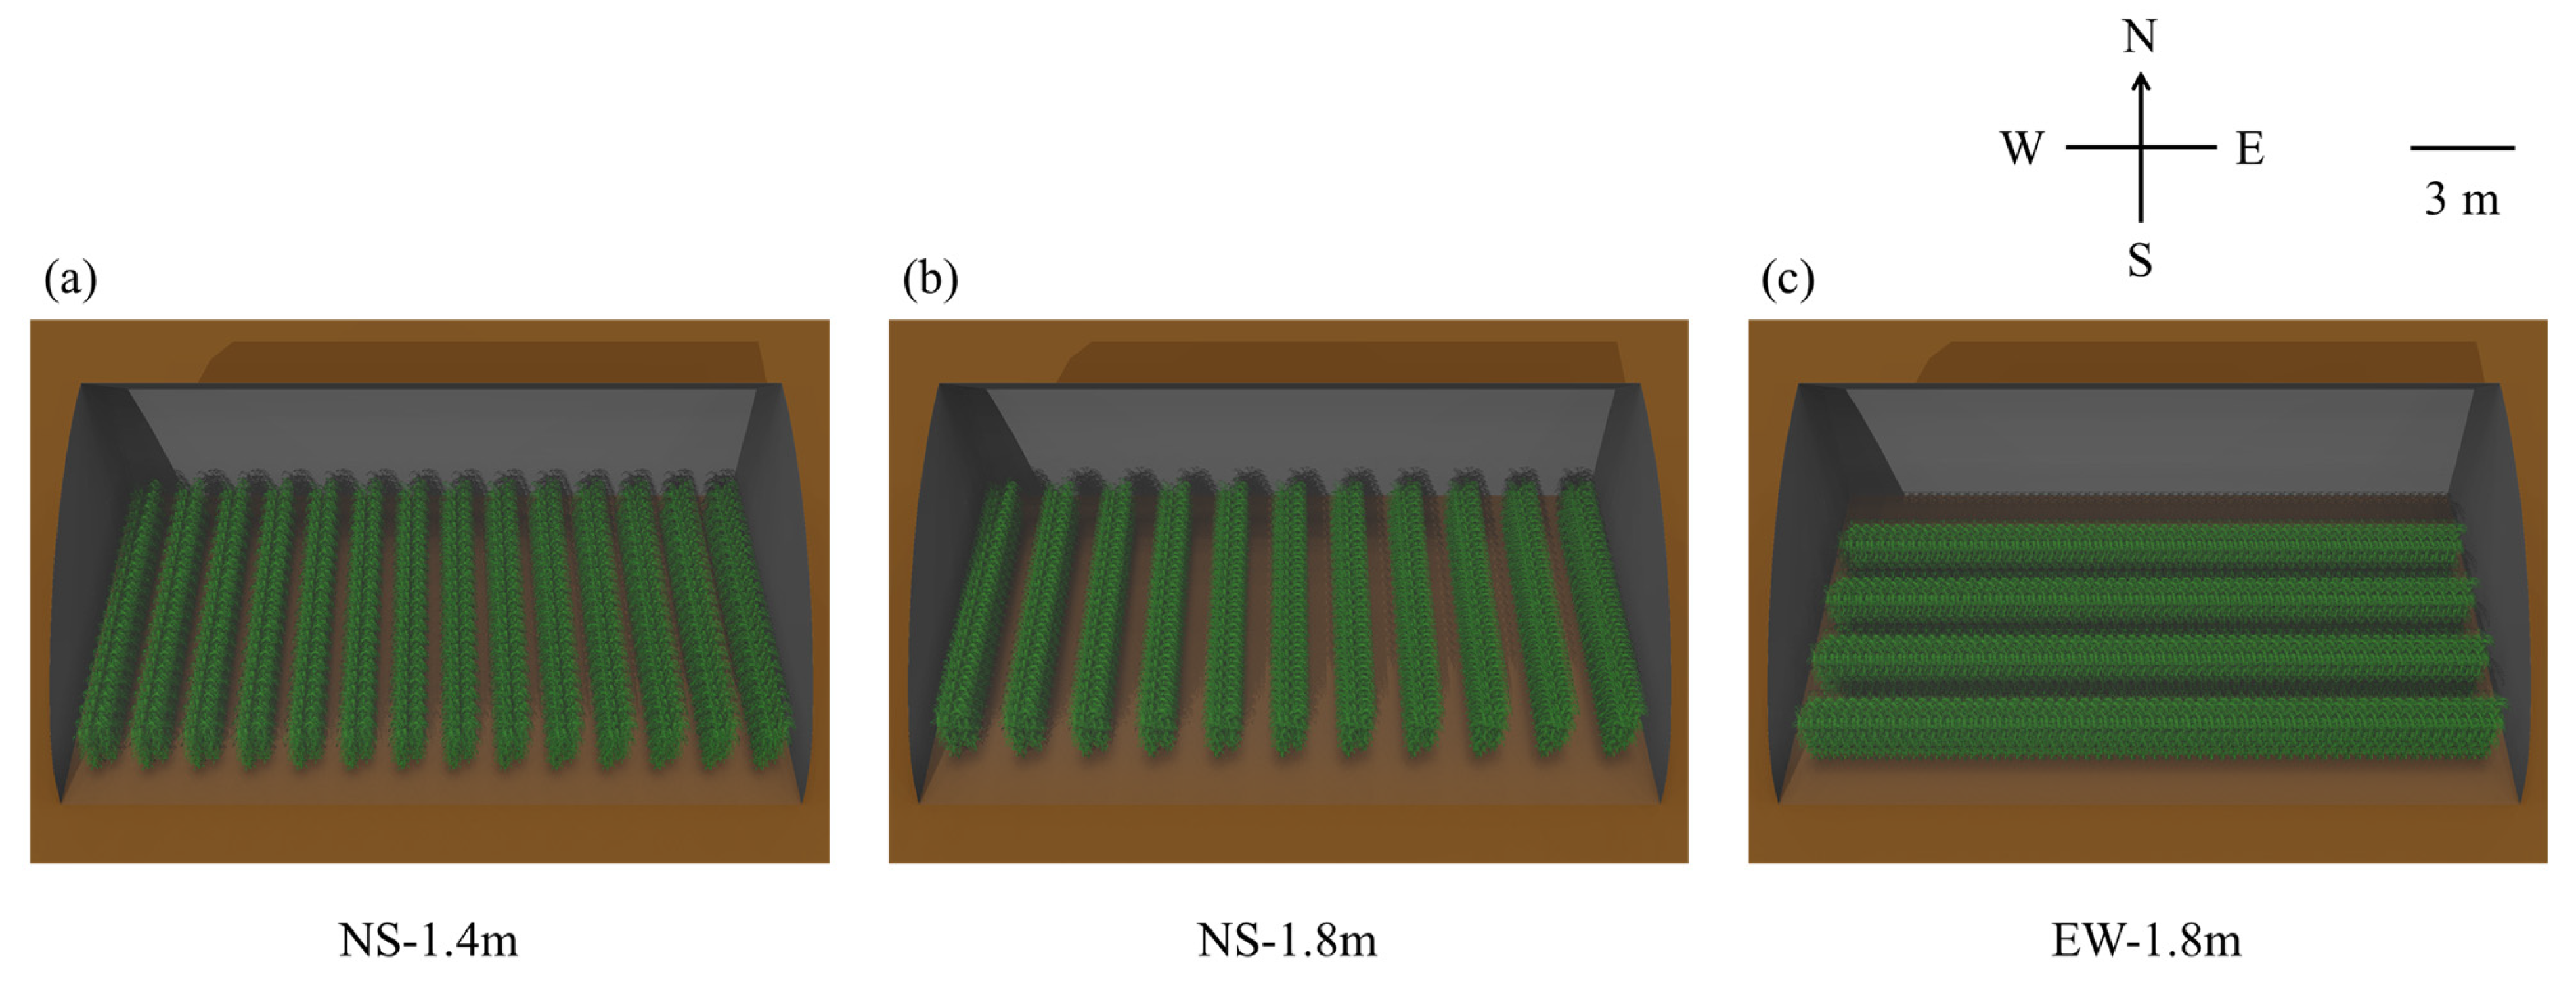
2.3.1. Solar Greenhouse Module

The actual length of the solar greenhouse used in the experiment was 75 m, the span was 10 m and the ridge height, which is the maximum height, was 5.1 m (Figure 3a). According to the drawings, the transparent front roof of the solar greenhouse can be represented using two circular arcs (Figure 3b). Finally, the solar greenhouse module was virtually rebuilt as a 3D model using the modeling platform GroIMP v1.6 based on real-world data. In order to save computer memory (RAM) without affecting the calculation results, the length of the solar greenhouse was reduced to 20 m for the simulation (Figure 3c).

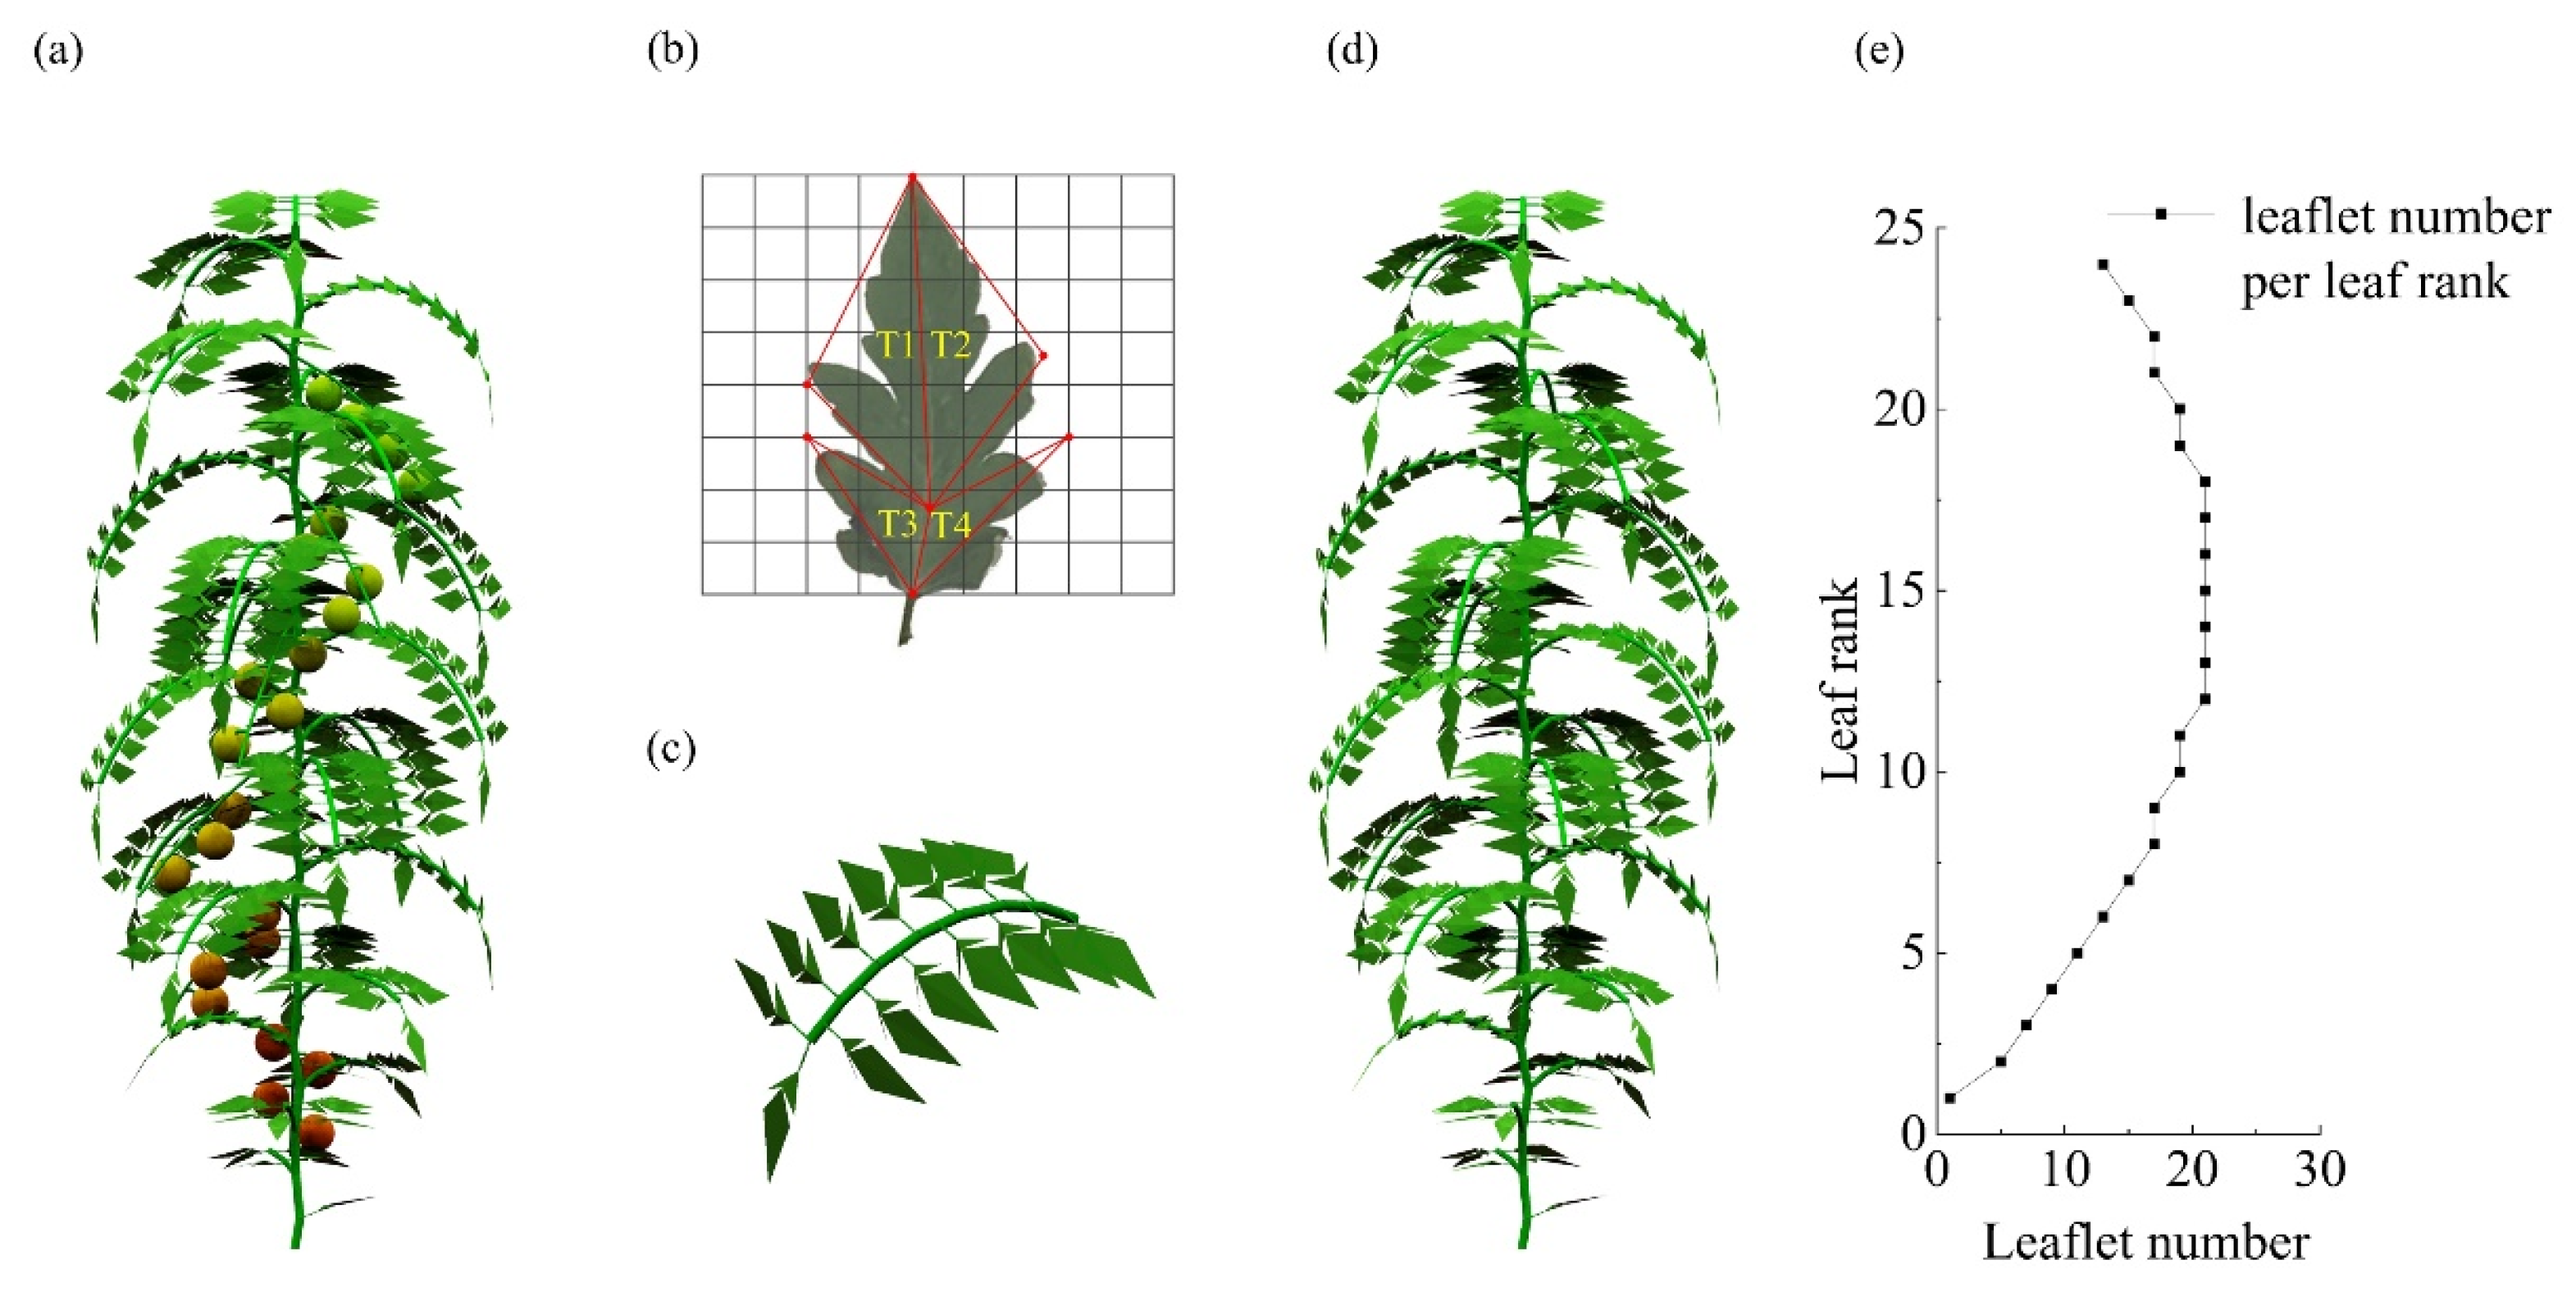
2.3.2. Tomato Plant Module

The virtual tomato plant was constructed using a sequence of internodes building the main stem where a leaf was attached at the end of each internode. The tomato is a sympodial plant, and the number and order of leaves and trusses have a stable pattern [37]. According to this characteristic and the data counted in the field experiment, an individual tomato plant was described as growing six leaves and then starting to bear the first truss. Thereafter, it bore a fruit truss every three leaves and then grew three leaves after growing up to the sixth truss, so there was a total of 24 leaves and 6 trusses (Figure 4a). Tomato leaves were described as a number of paired leaflets plus the top individual leaflet (Figure 4b). Leaflets were of a triangulated surface built of four triangles (Figure 4c) [38]. The fruits were removed to save computer RAM, and only the leaves were retained without affecting the results of the calculations (Figure 4d). The relationship between leaflet number and leaf order was determined according to Equation (1) (Figure 4e). Other parameters are shown in Table 2.
n l e a f l e t = 2 × n p a i r e d _ l e a f l e t + 1
where nleaflet was the leaflet number on an individual leaf and npaired_leaflet (Equation (2)) was the paired leaflet number on an individual leaf.
n p a i r e d _ l e a f l e t = 0.05 × L r a n k 2 + 1.5 × L r a n k 0.75
where Lrank was the leaf order (1–24 in order from the bottom to the top of the tomato plant).

2.3.3. Sky and Sunlight Modules

Light interception was calculated hourly using the GroIMP v1.6 integrated inverse Monte Carlo path tracer [36,39]. For the simulations, 100 million virtual light rays at a reflection depth of 15 reflections per ray were used to deliver stable and reproducible results. The variations of the position of the sun and the distribution of diffuse light during the year at the test site (36° N) are shown in Figure 5a. The actual radiation data for 5 days (1 November 2022–25 November 2022) were selected and compared with the simulated radiation data, and the effectiveness of the model simulation was evaluated using the coefficient of determination (Figure 5b).

2.3.4. Model Scenarios

The FSPM for the three treatments was established using GroIMP v1.6 according to the experimental design in Section 2.1 (Figure 6) and the canopy light interception was calculated at the point of the tomato plant’s morphological stabilization (2022.5.1 and 2022.11.1).

2.4. Data Analysis

IBM SPSS Statistics 20 (IBM Corporation, Armonk, NY, USA) was used to undertake curve fitting and perform analysis of variance (ANOVA), and the means were compared through Duncan’s new multiple range test at the p < 0.05 level of significance. OriginPro 2022 (OriginLab, Northampton, MA, USA) was used to draw figures and perform principal component analyses. A structural equation model (SEM) was performed to quantify the multivariate causal network in which plant height, leaf area, light interception, photosynthesis, ripening time and yield were involved using AMOS 21.0 (IBM Corporation, Armonk, NY, USA).

3. Results

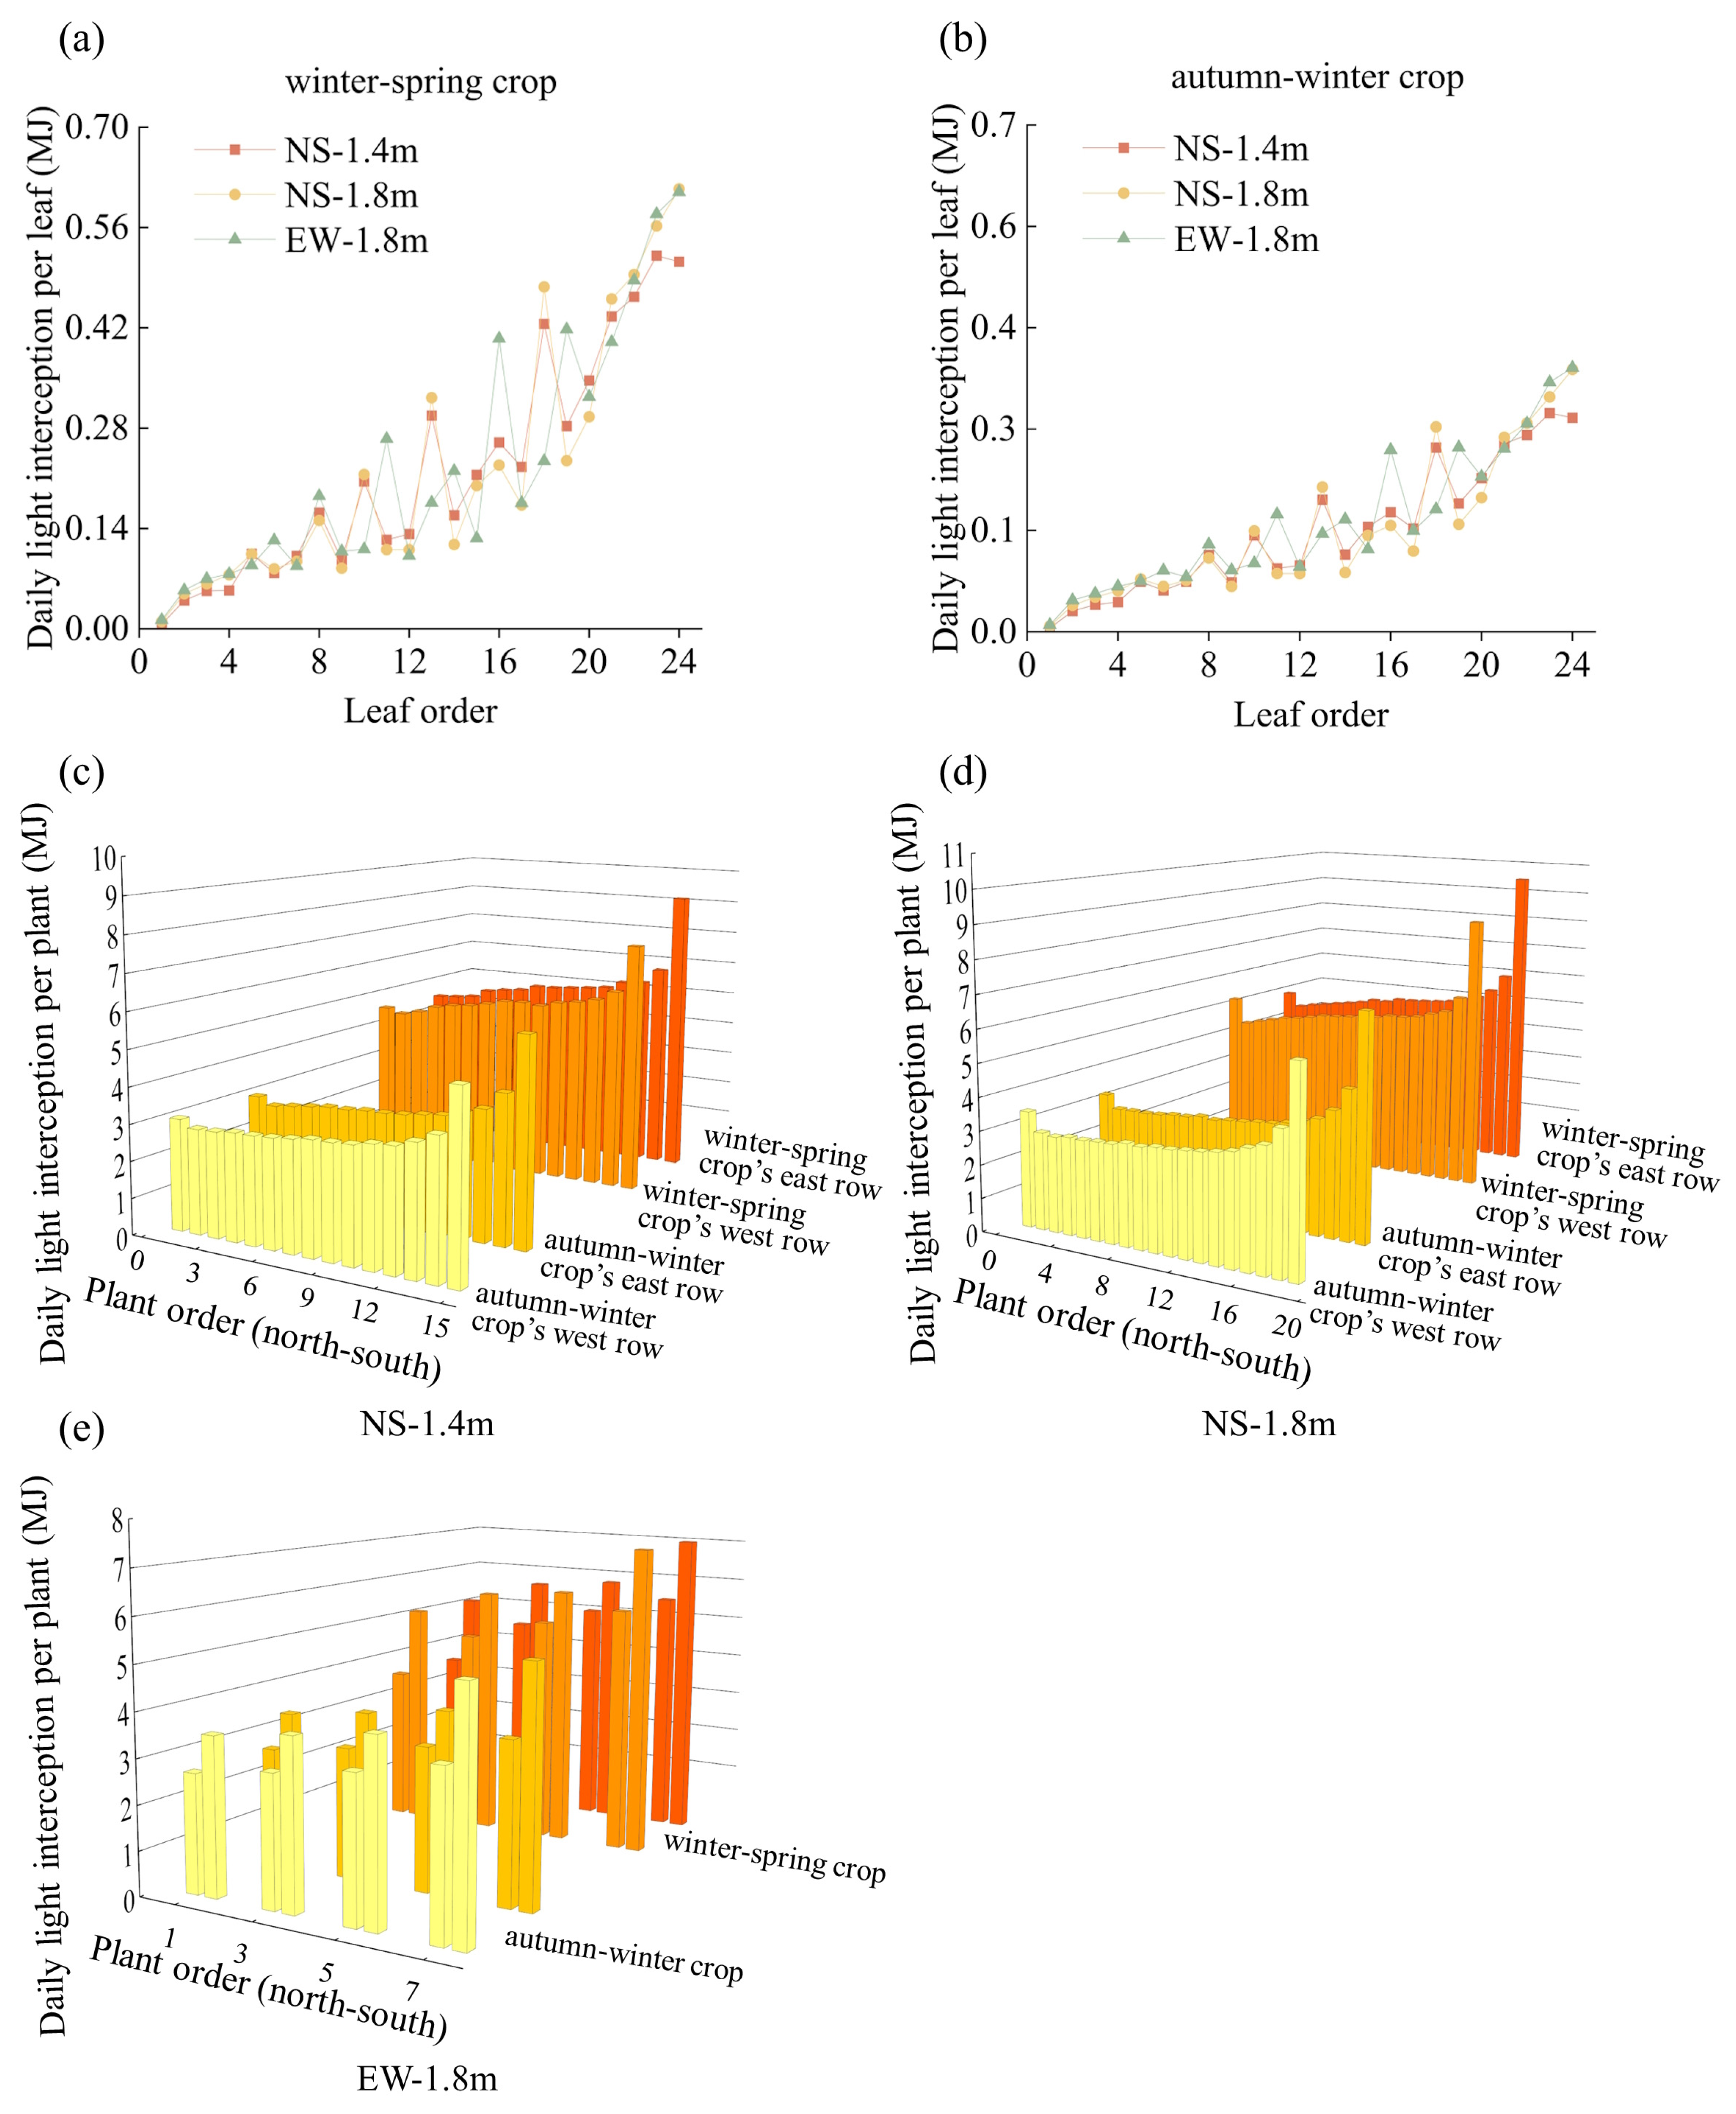
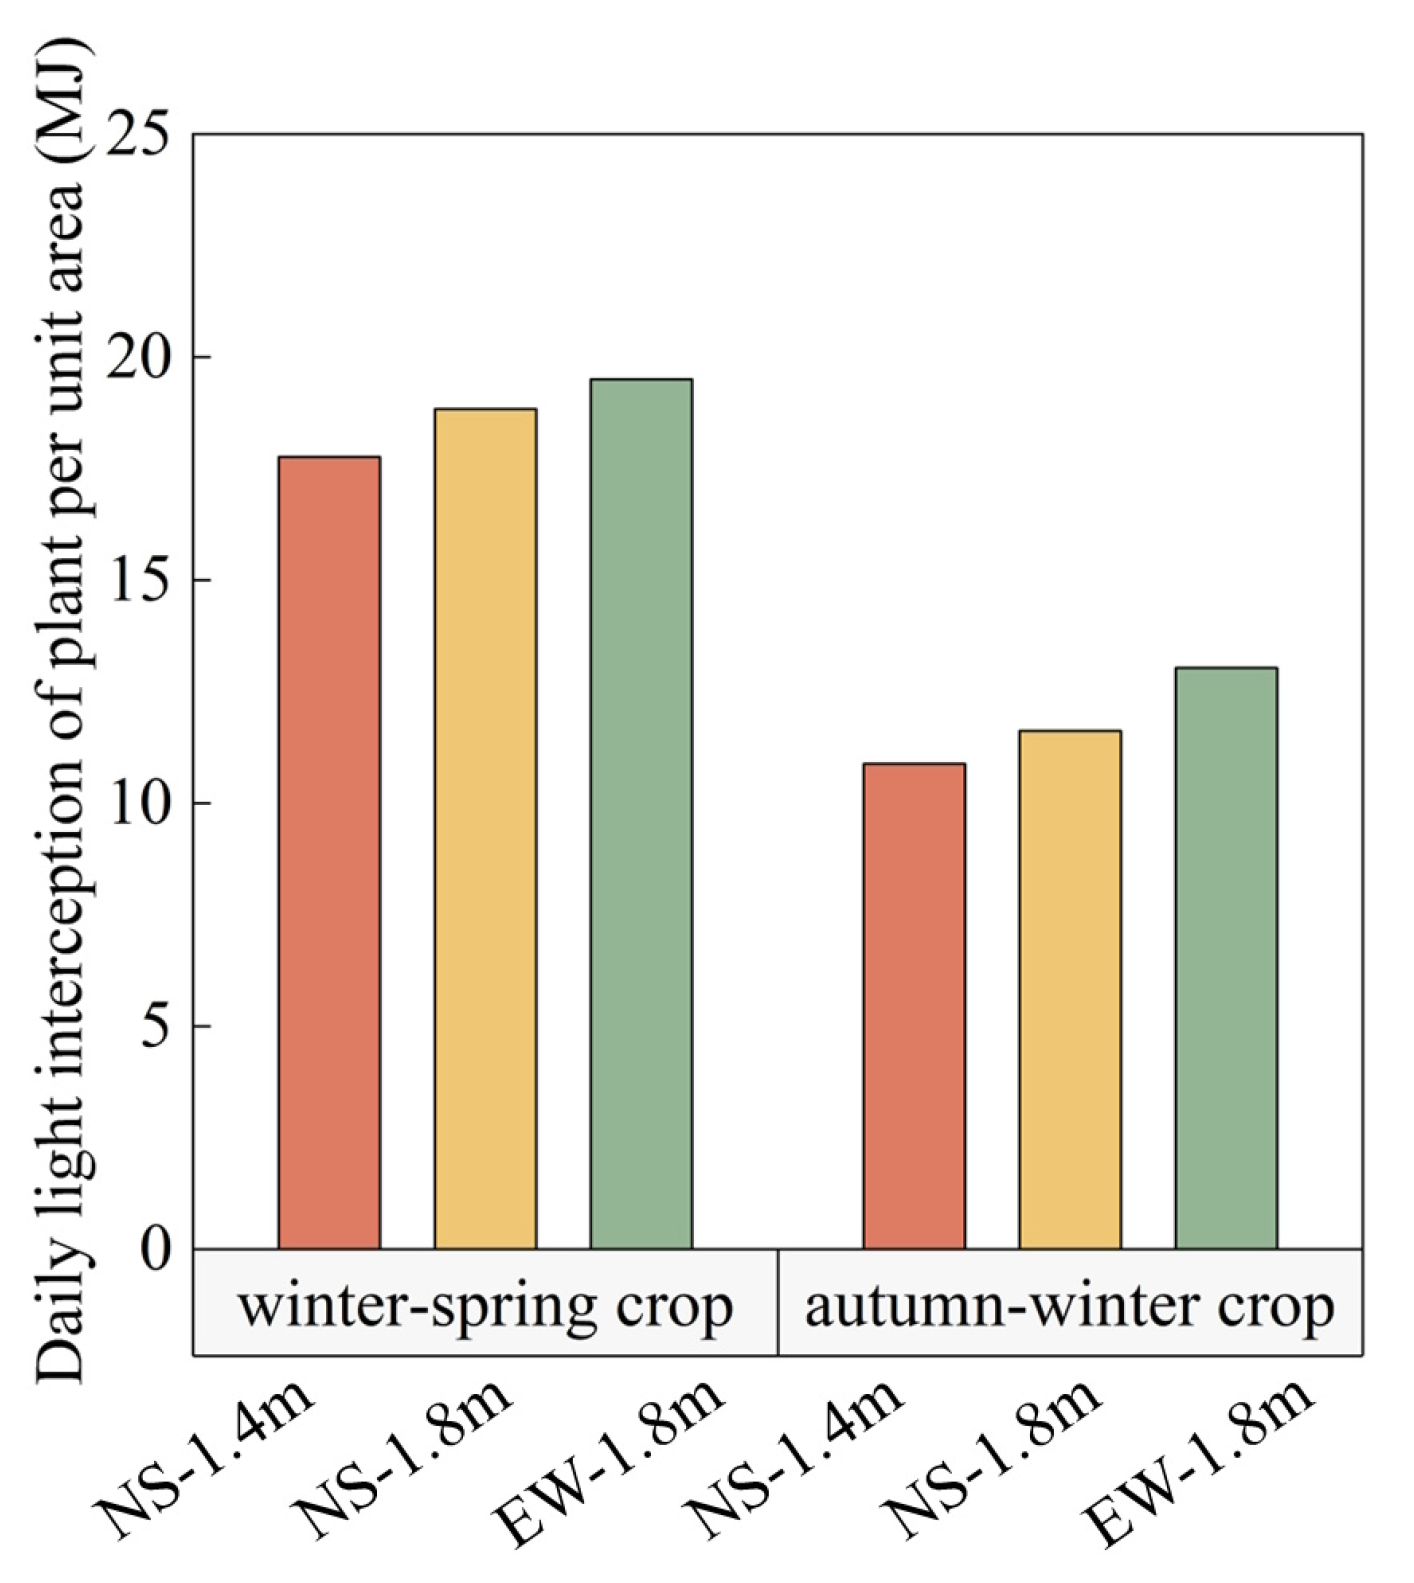
3.1. Light Interception in Tomato Canopies

Compared with the NS-1.4m treatment, the NS-1.8m and EW-1.8m treatments increased the light interception of the bottom leaves (1st–4th) and the top leaves (22nd–24th). The EW-1.8m treatment had a large variability of light interception in the middle leaves (Figure 7a,b). Due to the special structure of the solar greenhouse, the light interception of plants gradually decreased from south to north in the north–south orientation. The light interception of plants in the south row within the double row was higher than that of the plants in the north row in the east–west orientation, (Figure 7c–e). In the winter–spring crop, the NS-1.8m treatment increased light interception by 2.80% and 3.15% for the southern and northern plants, respectively, and the EW-1.8m treatment increased the light interception by 3.21% and 6.58% for the southern and middle plants, respectively, compared with the NS-1.4m treatment. In the autumn–winter crop, the NS-1.8m treatment increased the light interception by 5.22% and 2.55% in the southern and northern plants, respectively, and the EW-1.8m treatment increased the light interception by 10.05%, 13.25% and 6.04% in southern, middle and northern plants, respectively, compared with the NS-1.4m treatment.
Compared with the NS-1.4m treatment, the NS-1.8m treatment increased the canopy light interception per unit area of the winter–spring crop by 6.08% and that of the autumn–winter crop by 6.80%, while the EW-1.8m treatment increased the canopy light interception per unit area of the winter–spring crop by 9.80% and that of the autumn–winter crop by 19.76% (Figure 8).

3.2. Tomato Growth Parameters

In the winter–spring crop, compared with the NS-1.4m treatment, the NS-1.8m and EW-1.8m treatments increased the internode length by 9.44% and 11.61%, the leaflet internode length by 23.33% and 36.67%, the leaf elevation angle by 66.55% and 66.22%, the leaflet elevation angle by 137.93% and 137.94% and the leaflet area by 31.39% and 35.40%, respectively. In the autumn–winter crop, compared with the NS-1.4m treatment, the NS-1.8m and EW-1.8m treatments increased the internode length by 8.87% and 10.22%, the leaflet internode length by 20.00% and 26.67%, the leaf elevation angle by 66.22% and 66.56%, the leaflet elevation angle by 137.93% and 137.94% and the leaflet area by 31.58% and 35.34%, respectively. However, the parameters did not produce significant differences between the NS-1.8m treatment and the EW-1.8m treatment (Figure 9).
In the winter–spring crop, compared with the NS-1.4m treatment, the NS-1.8m and EW-1.8m treatments increased plant height by 9.39% and 14.61%, increased leaf area by 31.61% and 35.54%, increased the aboveground fresh weight by 12.57% and 9.45%, increased the aboveground dry weight by 6.82% and 9.46% and reduced stem thickness by 7.32% and 7.60%, respectively. In the autumn–winter crop, compared with the NS-1.4m treatment, the NS-1.8m and EW-1.8m treatments increased plant height by 8.79% and 11.31%, increased leaf area by 30.77% and 34.71%, increased the aboveground fresh weight by 5.88% and 14.89%, increased the aboveground dry weight by 10.52% and 15.02% and reduced stem thickness by 10.24 and 9.73%, respectively. In both seasons, compared with the NS-1.4m treatment, the NS-1.8m treatment increased the percentage of the fresh and dry weights in the middle part of the canopy, while the EW-1.8m treatment increased the percentage of the fresh and dry weights in the above part of the canopy. None of the treatments had a significant effect on the leaf number of the plant (Figure 10).

3.3. Gas Exchange Parameter
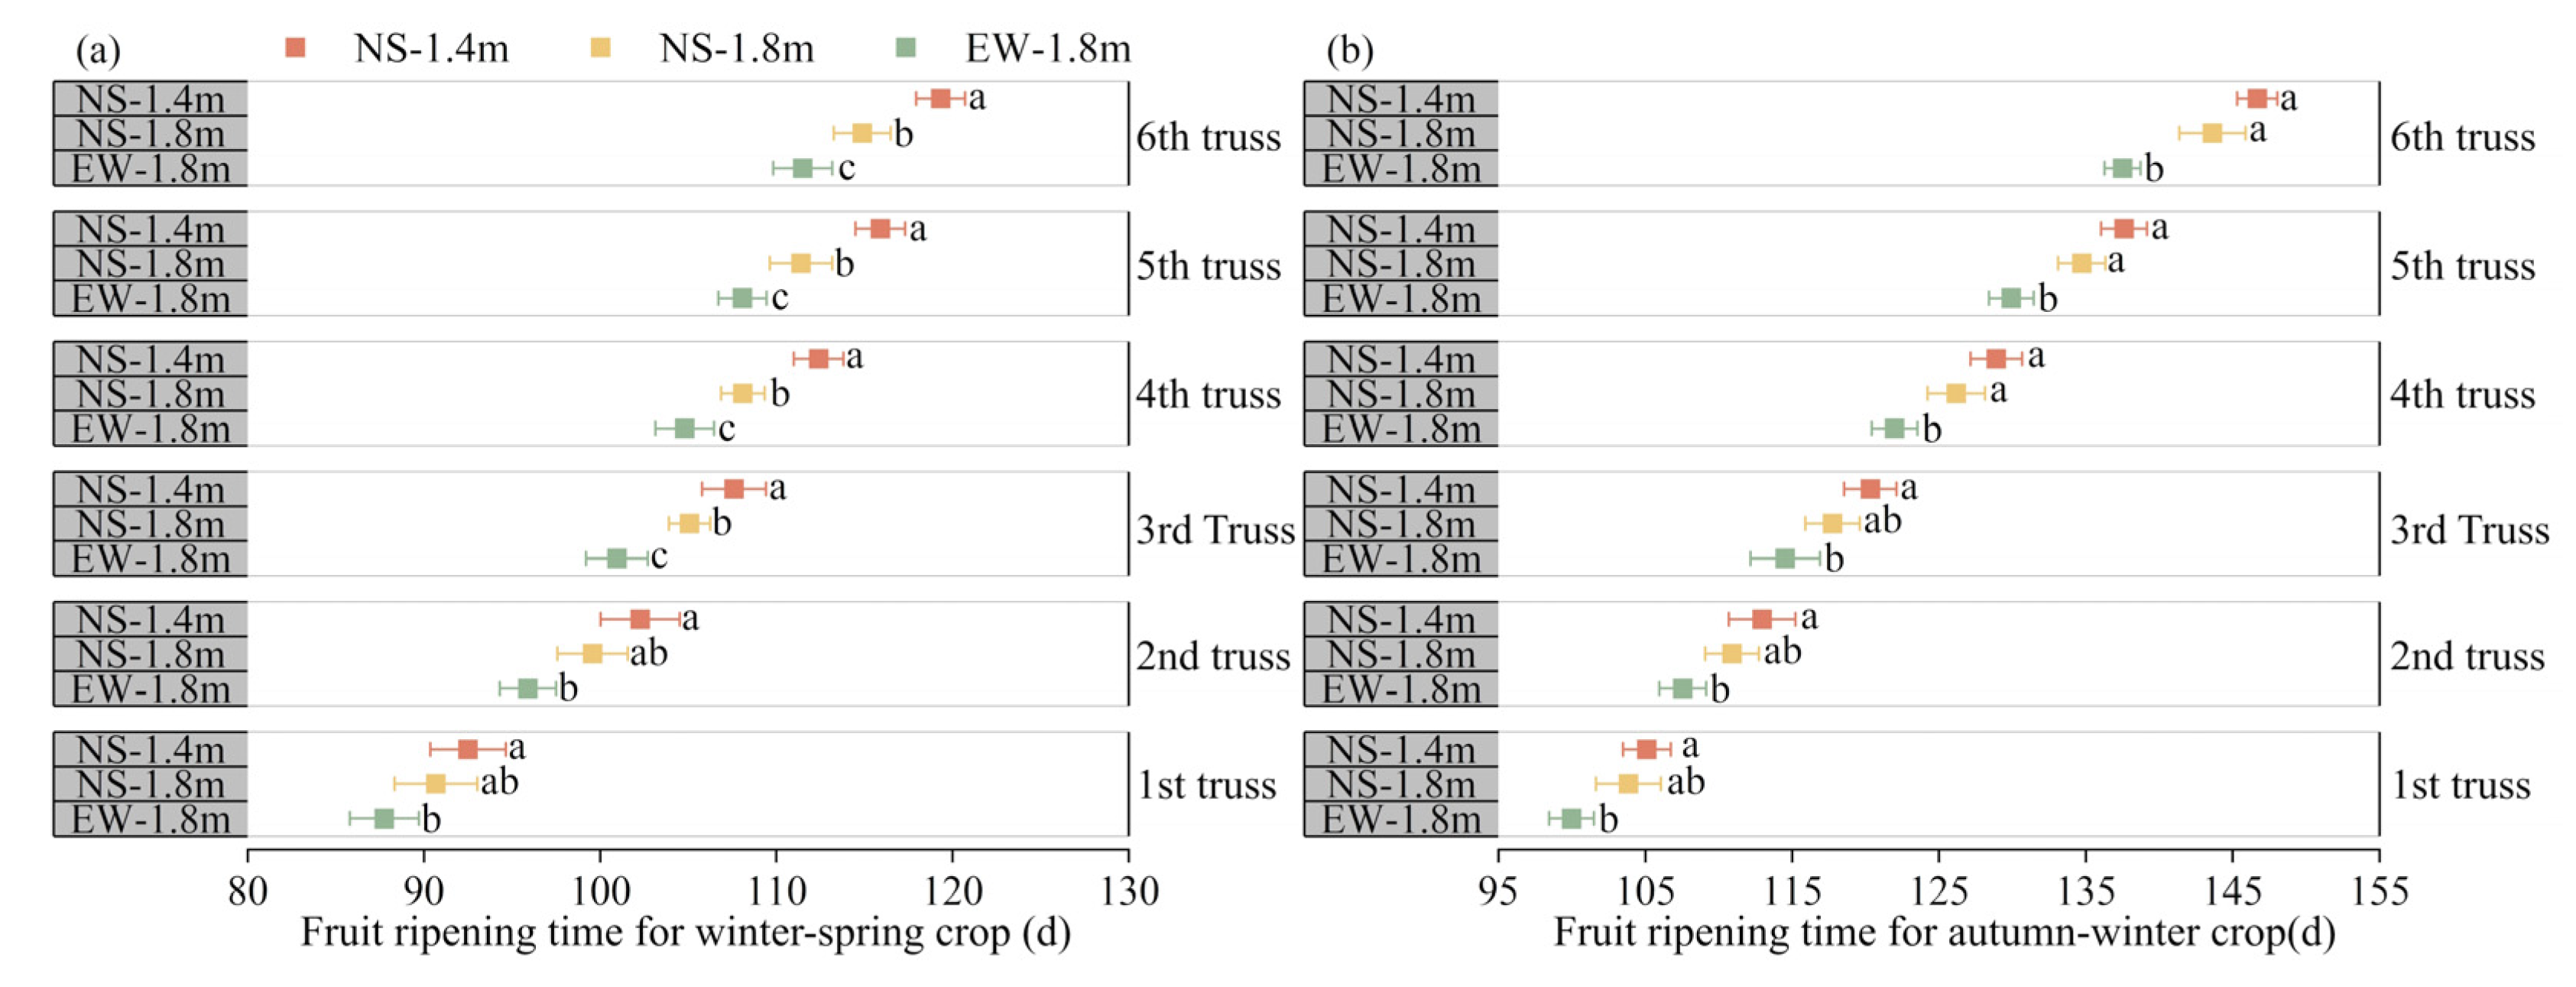
In the winter–spring crop, compared with the NS-1.4m treatment, the NS-1.8m treatment did not significantly affect any of the photosynthetic gas exchange parameters of the tomato leaves, while the EW-1.8m treatment significantly affected the Pn, Ci and Tr, which increased by 5.51%, 4.79% and 11.61%, respectively. In the autumn–winter crop, compared with the NS-1.4m treatment, the NS-1.8m and EW-1.8m treatments significantly affected the Pn and Ci, which under the NS-1.8m treatment increased by 4.90% and 2.83%, respectively, and under the EW-1.8m treatment increased by 6.53% and 4.81%, respectively (Table 3).

3.4. Fruit Ripening

The experimental results showed that changing the cultivation pattern could significantly affect the fruit ripening time. Compared with the NS-1.4m treatment, the fruit ripening time in the NS-1.8m and EW-1.8m treatments was advanced by 1.8–4.5 d and 4.8–7.8 d in the winter–spring crop and by 1.2–3.0 d and 5.1–9.2 d in the autumn–winter crop, respectively. Compared with the autumn–winter crop, the fruit ripening time was advanced by 10.7–27.4 d, 11.3–28.8 d and 11.6–26.0 d in the NS-1.4m, NS-1.8m and EW-1.8m treatments, respectively, in the winter–spring crop (Figure 11).

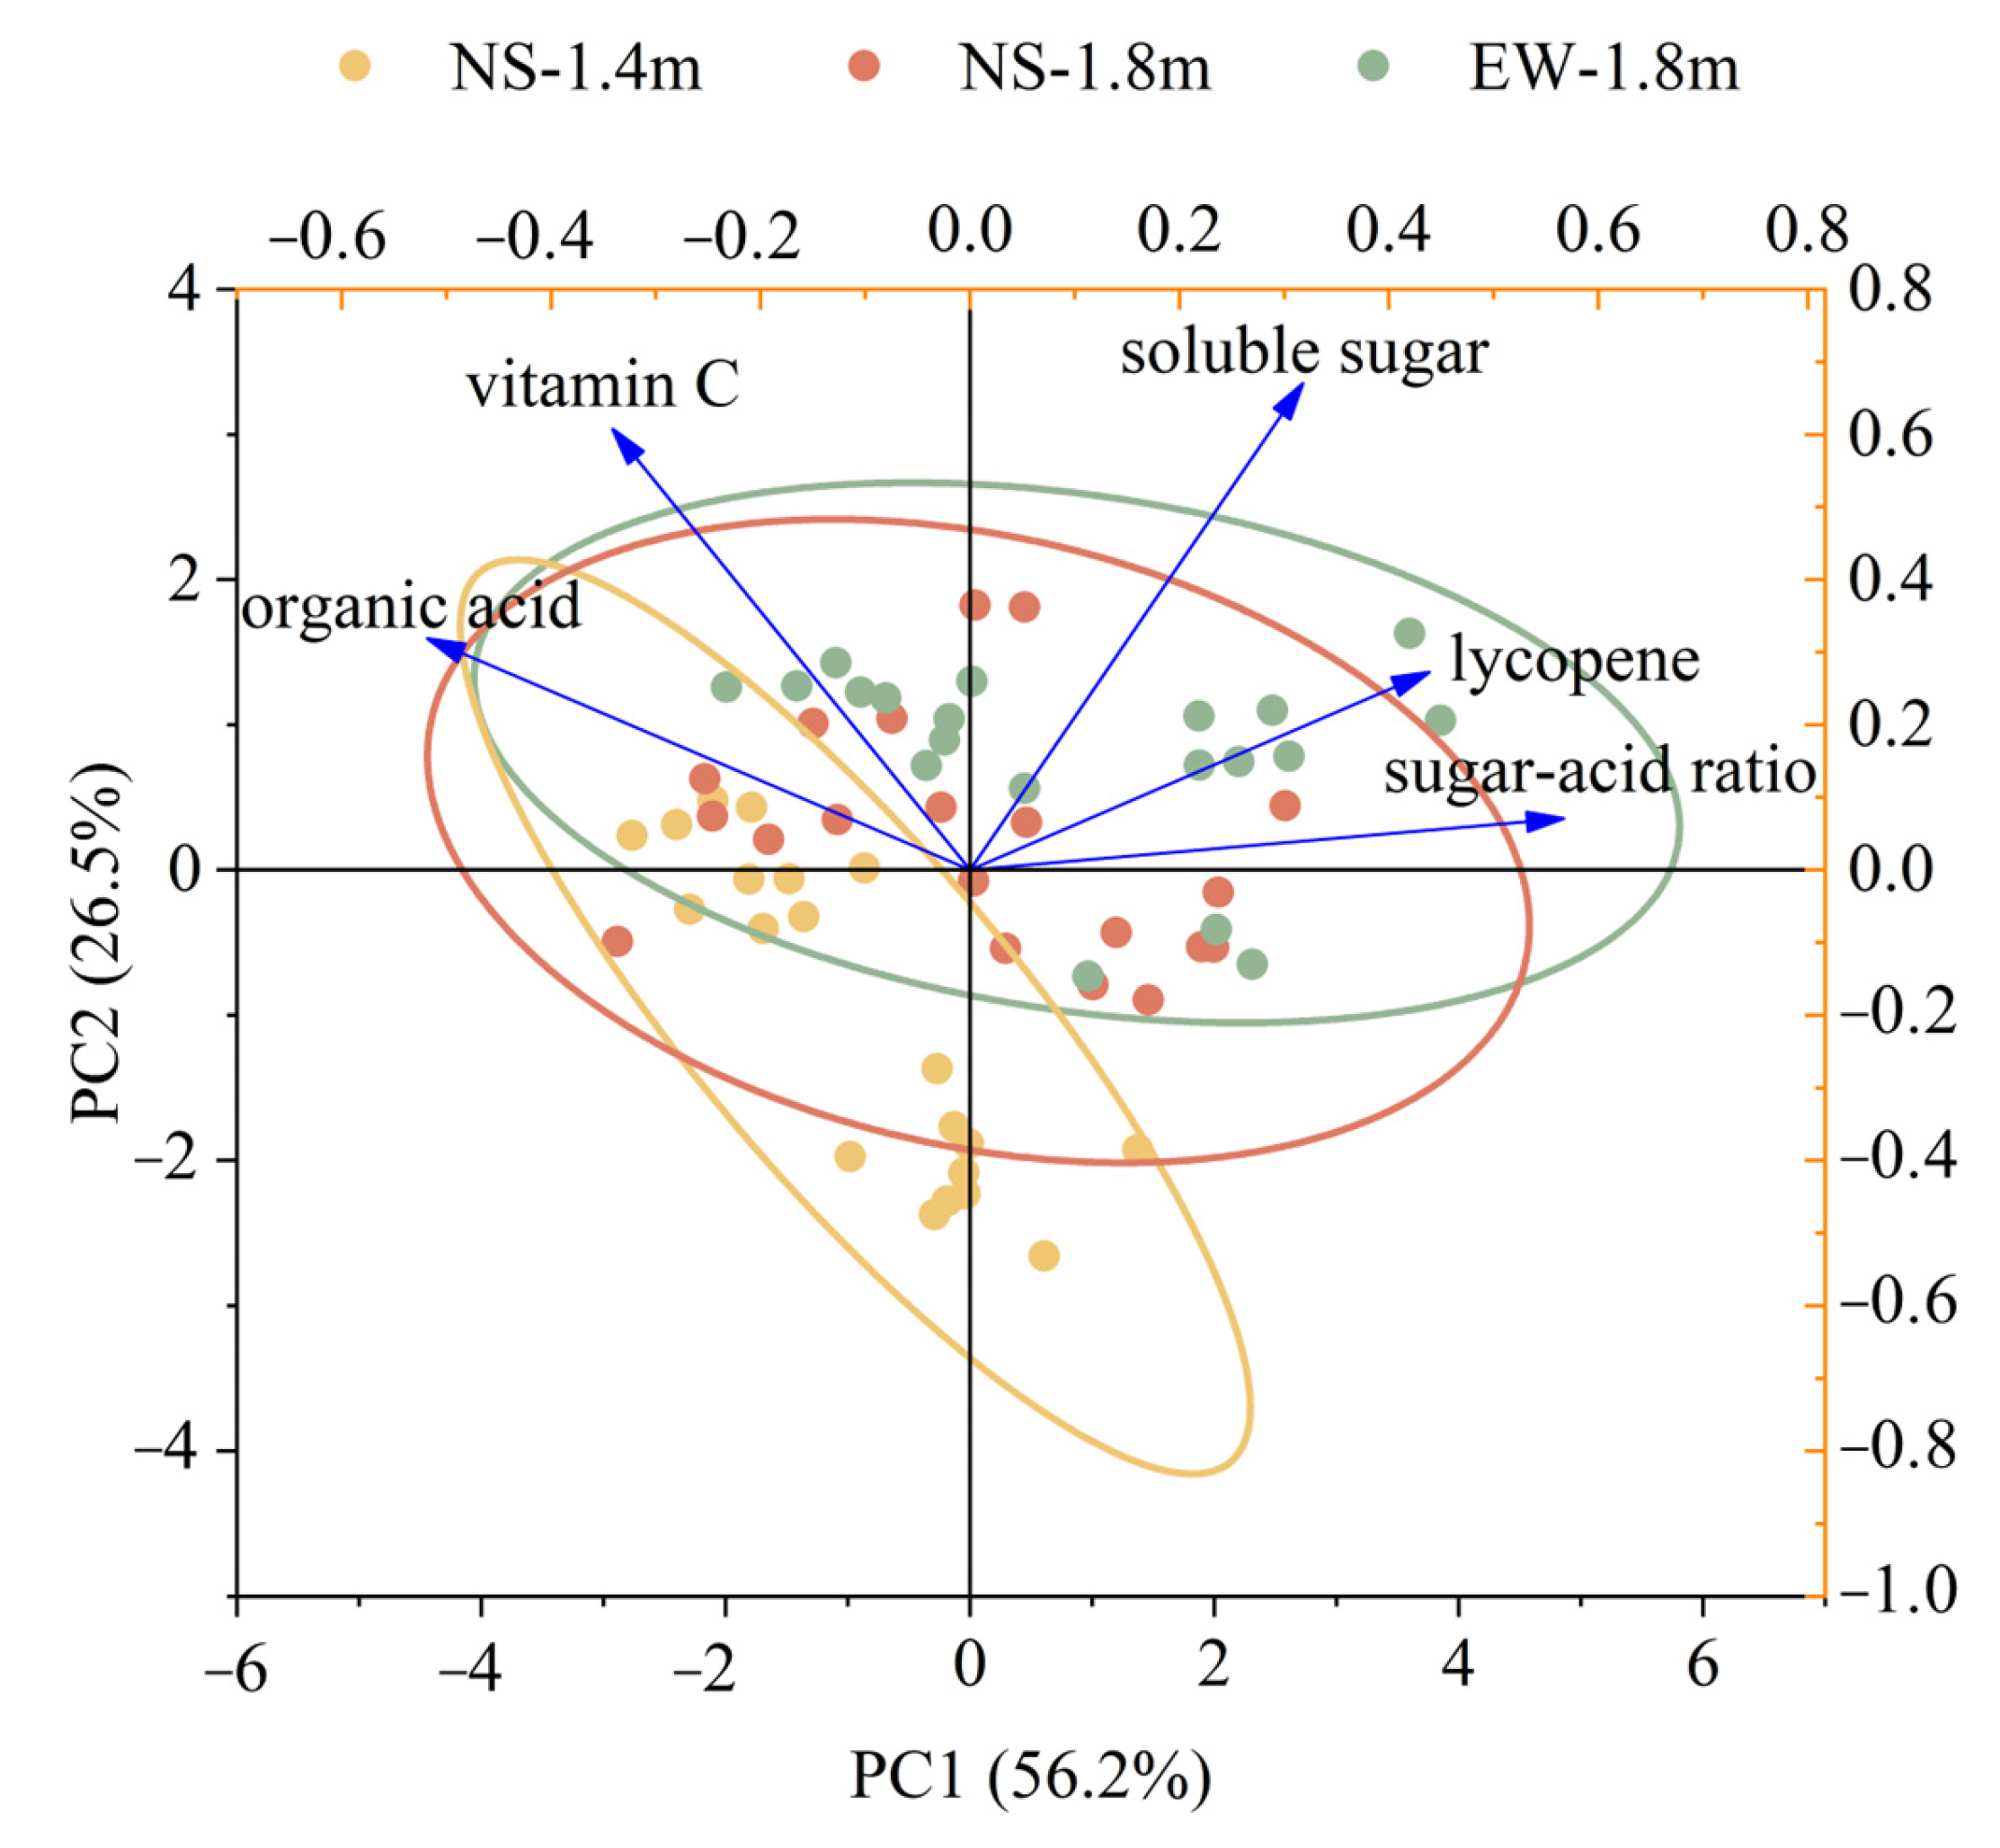
3.5. Fruit Quality and Yield

Compared with the NS-1.4m treatment, the NS-1.8m and EW-1.8m treatments increased the soluble sugar, lycopene and vitamin C contents and sugar–acid ratio of the tomato fruits in the winter–spring crop by 21.58% and 35.79%, 8.68% and 15.53%, 38.83% and 32.96% as well as 25.45% and 43.12%, respectively, and increased these in the autumn–winter crop by 7.41% and 5.93%, 6.78% and 17.05%, 8.50% and 25.82% as well as 13.14% and 20.99%, respectively (Table 4). PCA analysis showed that PC1 and PC2 explained 56.2% and 26.5% of the variability in the data, respectively, and it can be seen that the difference in fruit quality between the NS-1.4m treatment and the NS-1.8m and EW-1.8m treatments was high, while the difference in fruit quality between the NS-1.8m and EW-1.8m treatments was low (Figure 12).
There was a gradual increase in the fruit number per plant, the individual fruit weight and the yield of tomatoes in the NS-1.4m, NS-1.8m and EW-1.8m treatments after the change of cultivation pattern. In the winter–spring crop, compared with the NS-1.4m treatment, the NS-1.8m and EW-1.8m treatments increased the individual fruit weight by 4.34% and 5.66% and the yield by 3.92% and 6.18%, respectively. In the autumn–winter crop, compared with the NS-1.4m treatment, the NS-1.8m and EW-1.8m treatments increased the individual fruit weight by 3.06% and 8.02% and the yield by 4.17% and 9.78%, respectively (Table 5). The results of the experiments from 2021.8 to 2022.2 (autumn–winter crop) and from 2023.1 to 2023.6 (winter–spring crop) showed the same trend of changes. Compared with the NS-1.4m treatment, the yields of the EW-1.8m treatment were significantly increased by 4.87% in the winter–spring crop and 11.44% in the autumn–winter crop (Table S1).
Using structural equation modeling (SEM) to analyze the effect of each parameter on the yield (Figure 13, Table 6), each path was supported by statistical tests. SEM analysis showed that the yield was 98% explained in the model where plant height had significant positive direct effects (0.88, 0.09) on the leaf area and yield and indirect and total effects on the yield were 0.18 and 0.27, respectively, while it had a significant negative direct effect on photosynthesis (−0.45). Leaf area had a significant positive direct effect on light interception per plant (0.57), a significant negative direct effect on ripening time (−0.15) and no direct effect on the yield, but the indirect effect on the yield was 0.61. Light interception per plant had significant direct positive effects on photosynthesis, ripening time and yield (0.98, 0.14, 0.23), and the indirect and total effects on yield ripening were 0.75 and 0.98, respectively. Photosynthesis had a significant direct negative effect on ripening time (−1.06), a significant direct positive effect on the yield (0.43) and the indirect and total effects on the yield were 0.38 and 0.81, respectively.

4. Discussion

4.1. Canopy Light Interception and Growth Characteristics of Tomatoes among Different Cultivation Patterns

Previous studies have shown that changes in cultivation patterns, such as row spacing, plant spacing and planting orientation, lead to different inter- and intra-row shading conditions, which affect light distribution throughout the day [24,40]. The present experiment also demonstrated that the light interception of individual and population canopies of tomato plants in the three treatments of NS-1.4m, NS-1.8m and EW-1.8m increased sequentially (Figure 7 and Figure 8). These variations consequently led to alterations in plant canopy structure, including the size, shape and orientation of branches [41,42]. In turn, differences in plant structure inevitably led to changes in canopy light interception. For instance, the structure of the upper canopy leaves tended to be more upright rather than that of the spreading and the length of the internodes increased, which would promote more light penetration into the canopy and air ventilation and contribute to an increase in light absorption and the photosynthesis efficiency of the plant [26]. In this study, the plant structure changed to different degrees. In general, the internode length, leaflet internode length, leaf elevation angle, leaflet elevation angle, plant height, leaf area and aboveground dry weight increased sequentially, the stem thickness decreased sequentially and the difference between the NS-1.4m and EW-1.8m treatments reached a significant level (Figure 9 and Figure 10). Therefore, suitable row and plant spacing configurations can optimize the tomato population structure and improve canopy light interception, but row spacing should not be too large, otherwise it would cause excessive population light energy loss, which would be detrimental to the overall yield [43]. Liu et al.’s [44] study on wheat also demonstrated that wider row spacing contributes to the increase in population light interception by increasing the light interception in the bottom part of the canopy, but excessively wide row spacing will result in the phenomena of weakened light transmission, leaf senescence and reduction in grain number.
In addition to row spacing and plant spacing, achieving more efficient irradiation can be facilitated by selecting the appropriate row orientation [45]. This is particularly important in solar greenhouses where shadows on the greenhouse ground caused by opaque structures, like wall and insulation quilts, can affect light distribution and crop growth. This phenomenon was especially pronounced during low solar radiation and cold winters [6]. The experiment showed that south-to-north light interception decreased and more plant variation in east–west cultivation (EW-1.8 m) than in north–south cultivation (NS-1.4 m and NS-1.8 m) (Figure 7) and that the highest population light interception was in EW-1.8m treatment rather than in the NS-1.4m and NS-1.8m treatments (Figure 8). Zhang et al. [25] suggested that light interception in the east–west-oriented tomato population was higher than that in the north–south-oriented population but that the light uniformity in the population was weaker, which was similar to our results. Van der Meer et al. [24] proposed that in east–west-oriented cultivation, since most of the light was intercepted by the leaves in the middle part of the tomato plant canopy, the pruning of these leaves could increase the light uniformity within the population by increasing the light penetration.

4.2. Fruit Ripening, Yield and Quality of Tomatoes among Different Cultivation Patterns

Studies have shown that increasing canopy light interception could improve crop yields [46,47]. NS-1.8m and EW-1.8m treatments improved plants’ photosynthesis, ripening, and yields more than the NS-1.4m one did (Table 3 and Table 5 and Figure 11). The yield difference between the NS-1.4m and EW-1.8m treatments was significant in both seasons. This phenomenon may be attributed to the increased row spacing and reduced plant spacing as well as the east–west-oriented cultivation of the tomato plants. These factors enable the plants to intercept more light radiation, leading to the enhanced synthesis of photosynthesis products and their transportation to the fruits. Additionally, the higher radiation increased the environmental temperature (Figure 1), which further promoted the rapid growth of fruit [48,49]. In line with our results, Trentacoste et al. [50] investigated the effect of planting row orientation and spacing on olive hedgerows, demonstrating that radiation received directly by the canopy strongly affected fruit size and quality. Gómez-del-Campo et al. [2] demonstrated that yields increased linearly with radiation interception and that east–west-oriented cultivation allowed higher yields than north–south-oriented cultivation on the same row spacing did.
The study has shown that increased canopy light interception resulted in a higher content of sugars (especially sucrose) and their derivatives and a significant increase in amino acids, organic acids and several secondary metabolites in tomato fruits, which improved the nutritional quality and flavor characteristics of the fruits [51]. However, the high environmental temperature was negative for the accumulation of vitamin C in tomato fruits [52], which mostly corresponds to our results (Table 4). Previous meta-analysis and experimental studies both confirmed the positive effects of supplemental LED lighting on improving tomato yield and quality; however, they also pointed out that high energy costs limit the widespread use of supplemental lighting technology [53,54]. Therefore, in this study, we propose a green and efficient approach to increase light interception and improve tomato yields by altering the cultivation pattern.

5. Conclusions

In the functional–structural plant model, we implemented a new static model for comparing tomato plant populations under different cultivation patterns in a solar greenhouse. Comprehensive model, growth and physiological results show that the cultivation pattern of east–west orientation with wide row spacing (EW-1.8m) was beneficial for increasing the population canopy’s light interception, improving the leaf photosynthetic area and efficacy, decreasing fruit ripening time as well as, at the same time, improving the yield and quality. This cultivation pattern can be considered to be a suitable mechanized planting pattern for solar greenhouse tomatoes. In the next step, we should develop the dynamic model and conduct a more detailed study.

Supplementary Materials

The following supporting information can be downloaded at: https://www.mdpi.com/article/10.3390/agronomy14020314/s1, Table S1: The changes in yield under different treatments.

Author Contributions

Y.L., investigation, software, validation, resources, writing—original draft, writing—review and editing. M.H., methodology, creation of models, software, writing—review and editing. D.Z., conceptualization, writing—review and editing. C.W., writing—review and editing. M.W.: conceptualization, writing—review and editing, funding acquisition. All authors have read and agreed to the published version of the manuscript.

Funding

This research was funded by the China Agriculture Research System (CARS-23).

Data Availability Statement

Data will be made available on request.

Conflicts of Interest

The authors declare no conflicts of interest.

References

  1. Kang, M.Z.; Fan, X.R.; Hua, J.; Wang, H.Y.; Wang, X.J.; Wang, F.Y. Managing traditional solar greenhouse with CPSS: A just-for-fit philosophy. IEEE Trans. Cybern. 2018, 48, 3371–3380. [Google Scholar] [CrossRef] [PubMed]
  2. Gürbüz Çolak, N.; Eken, N.T.; Ülger, M.; Frary, A.; Doğanlar, S. Mapping of quantitative trait loci for antioxidant molecules in tomato fruit: Carotenoids, vitamins C and E, glutathione and phenolic acids. Plant Sci. 2020, 292, 110393. [Google Scholar] [CrossRef] [PubMed]
  3. Sotelo-Cardona, P.; Lin, M.Y.; Srinivasan, R. Growing tomato under protected cultivation conditions: Overall effects on productivity, nutritional yield, and pest incidences. Crops 2021, 1, 97–110. [Google Scholar] [CrossRef]
  4. Song, W.T.; Li, C.X.; Sun, X.G.; Wang, P.Z.; Zhao, S.M. Effects of ridge direction on growth and yield of tomato in solar greenhouse with diffuse film. Trans. Chin. Soc. Agric. Eng. 2017, 33, 242–248. [Google Scholar]
  5. Zhang, X.D.; Lv, J.; Xie, J.M.; Yu, J.H.; Zhang, J.; Tang, C.N.; Li, J.; He, Z.X.; Wang, C. Solar radiation allocation and spatial distribution in Chinese solar greenhouses: Model development and application. Energies 2020, 13, 1108. [Google Scholar] [CrossRef]
  6. Zhang, R.; Liu, Y.C.; Zhu, D.L.; Zhang, X.M.; Lu, L.Q.; Gao, F.; Zheng, C.J. Dynamics of shaded areas in a typical-shaped solar greenhouse and their effects on tomato growth-A case study in winter. Sci. Hortic. 2023, 312, 111882. [Google Scholar] [CrossRef]
  7. Piao, L.; Zhang, S.Y.; Yan, J.Y.; Xiang, T.X.; Chen, Y.; Li, M.; Gu, W.R. Contribution of fertilizer, density and row spacing practices for maize yield and efficiency enhancement in northeast China. Plants 2022, 11, 2985. [Google Scholar] [CrossRef] [PubMed]
  8. Gomez-del-Campo, M.; Connor, D.J.; Trentacoste, E.R. Long-term effect of intra-row spacing on growth and productivity of super-high density hedgerow olive orchards (cv. Arbequina). Front. Plant Sci. 2017, 8, 1790. [Google Scholar] [CrossRef]
  9. Gómez-del-Campo, M.; Trentacoste, E.R.; Connor, D.J. Long-term effects of row spacing on radiation interception, fruit characteristics and production of hedgerow olive orchard (cv. Arbequina). Sci. Hortic. 2020, 272, 109583. [Google Scholar] [CrossRef]
  10. Brunel-Muguet, S.; Beauclair, P.; Bataillé, M.-P.; Avice, J.-C.; Trouverie, J.; Etienne, P.; Ourry, A. Light restriction delays leaf senescence in winter oilseed rape (Brassica napus L.). J. Plant Growth Regul. 2013, 32, 506–518. [Google Scholar] [CrossRef]
  11. Gautier, H.; Diakou-Verdin, V.; Bénard, C.; Reich, M.; Buret, M.; Bourgaud, F.; Poëssel, J.L.; Caris-Veyrat, C.; Génard, M. How does tomato quality (sugar, acid, and nutritional quality) vary with ripening stage, temperature, and irradiance? J. Agric. Food Chem. 2008, 56, 1241–1250. [Google Scholar] [CrossRef] [PubMed]
  12. Hernández, V.; Hellín, P.; Fenoll, J.; Flores, P. Interaction of nitrogen and shading on tomato yield and quality. Sci. Hortic. 2019, 255, 255–259. [Google Scholar] [CrossRef]
  13. Tang, J.N.; Chen, Q.F.; Yu, Z.G.; Fu, H.D.; Liu, C.C.; Zheng, S.R.; Song, W.L.; Sun, Z.P. Effect of east and west ridge cluster planting on the growth of autumn and winter tomato and the temperature and light environment in solar greenhouse. Chin. Agric. Sci. Bull. 2022, 38, 65–71. [Google Scholar] [CrossRef]
  14. Cui, D.Y.; Li, C.Q.; Sun, Y.X.; Wang, J.Q.; Zou, G.Y.; Yang, J.G. Effects of dwarf close planting on growth and yield of tomato under east-west cultivation in greenhouse. Acta Hortic. Sin. 2022, 49, 875–884. [Google Scholar]
  15. Buck-Sorlin, G.H.; Hemmerling, R.; Vos, J.; de Visser, P.H.B. Modelling of spatial light distribution in the greenhouse: Description of the model. In Proceedings of the 2009 Third International Symposium on Plant Growth Modeling, Simulation, Visualization and Applications, Beijing, China, 9–13 November 2009; pp. 79–86. [Google Scholar]
  16. Bongers, F.J.; Evers, J.B.; Anten, N.P.; Pierik, R. From shade avoidance responses to plant performance at vegetation level: Using virtual plant modelling as a tool. New Phytol. 2014, 204, 268–272. [Google Scholar] [CrossRef] [PubMed]
  17. Vos, J.; Evers, J.B.; Buck-Sorlin, G.H.; Andrieu, B.; Chelle, M.; de Visser, P.H.B. Functional-structural plant modelling: A new versatile tool in crop science. J. Exp. Bot. 2009, 61, 2101–2115. [Google Scholar] [CrossRef] [PubMed]
  18. Mao, L.L.; Zhang, L.Z.; Evers, J.B.; Henke, M.; van der Werf, W.; Liu, S.D.; Zhang, S.P.; Zhao, X.H.; Wang, B.M.; Li, Z.H. Identification of plant configurations maximizing radiation capture in relay strip cotton using a functional-structural plant model. Field Crops Res. 2016, 187, 1–11. [Google Scholar] [CrossRef]
  19. Barillot, R.; Chambon, C.; Fournier, C.; Combes, D.; Pradal, C.; Andrieu, B. Investigation of complex canopies with a functional-structural plant model as exemplified by leaf inclination effect on the functioning of pure and mixed stands of wheat during grain filling. Ann. Bot. 2018, 123, 727–742. [Google Scholar] [CrossRef]
  20. Li, S.W.; van der Werf, W.; Zhu, J.Q.; Guo, Y.; Li, B.G.; Ma, Y.T.; Evers, J.B. Estimating the contribution of plant traits to light partitioning in simultaneous maize/soybean intercropping. J. Exp. Bot. 2021, 72, 3630–3646. [Google Scholar] [CrossRef]
  21. Chang, T.G.; Zhao, H.l.; Wang, N.; Song, Q.F.; Xiao, Y.; Qu, M.n.; Zhu, X.G. A three-dimensional canopy photosynthesis model in rice with a complete description of the canopy architecture, leaf physiology, and mechanical properties. J. Exp. Bot. 2019, 70, 2479–2490. [Google Scholar] [CrossRef]
  22. Chen, T.W.; Henke, M.; de Visser, P.H.B.; Buck-Sorlin, G.; Wiechers, D.; Kahlen, K.; Stützel, H. What is the most prominent factor limiting photosynthesis in different layers of a greenhouse cucumber canopy? Ann. Bot. 2014, 114, 677–688. [Google Scholar] [CrossRef] [PubMed]
  23. De Visser, P.H.; Buck-Sorlin, G.H.; van Der Heijden, G.W. Optimizing illumination in the greenhouse using a 3D model of tomato and a ray tracer. Front. Plant Sci. 2014, 5, 48. [Google Scholar] [CrossRef] [PubMed]
  24. Van der Meer, M.; de Visser, P.H.B.; Heuvelink, E.; Marcelis, L.F.M. Row orientation affects the uniformity of light absorption, but hardly affects crop photosynthesis in hedgerow tomato crops. In Silico Plants 2021, 3, diab025. [Google Scholar] [CrossRef]
  25. Zhang, Y.; Henke, M.; Li, Y.M.; Xu, D.M.; Liu, A.H.; Liu, X.A.; Li, T.L. Analyzing the impact of greenhouse planting strategy and plant architecture on tomato plant physiology and estimated dry matter. Front. Plant Sci. 2022, 13, 828252. [Google Scholar] [CrossRef] [PubMed]
  26. Sarlikioti, V.; de Visser, P.H.B.; Marcelis, L.F.M. Exploring the spatial distribution of light interception and photosynthesis of canopies by means of a functional-structural plant model. Ann. Bot. 2011, 107, 875–883. [Google Scholar] [CrossRef]
  27. Qian, T.T.; Lu, S.L.; Zhao, C.J.; Guo, X.Y.; Wen, W.L.; Du, J.J. Heterogeneity analysis of cucumber canopy in the solar greenhouse. J. Integr. Agric. 2014, 13, 2645–2655. [Google Scholar] [CrossRef]
  28. Schneider, H.M. Characterization, costs, cues and future perspectives of phenotypic plasticity. Ann. Bot. 2022, 130, 131–148. [Google Scholar] [CrossRef]
  29. Chen, Z.Z.; Li, Y.M.; Luan, H.; Xu, L.H.; Hu, H.; Wei, M. Effects of ridge direction and plant and row spacing on growth and yield of tomato in solar greenhouse. Shandong Agric. Sci. 2022, 54, 63–67. [Google Scholar]
  30. Liu, L.; Wang, B.; Liu, D.; Zou, C.L.; Wu, P.; Wang, Z.Y.; Wang, Y.B.; Li, C.F. Transcriptomic and metabolomic analyses reveal mechanisms of adaptation to salinity in which carbon and nitrogen metabolism is altered in sugar beet roots. BMC Plant Biol. 2020, 20, 138. [Google Scholar] [CrossRef]
  31. Kaur, C.; Walia, S.; Nagal, S.; Walia, S.; Singh, J.; Singh, B.B.; Saha, S.; Singh, B.; Kalia, P.; Jaggi, S.; et al. Functional quality and antioxidant composition of selected tomato (Solanum lycopersicon L) cultivars grown in Northern India. LWT-Food Sci. Technol. 2013, 50, 139–145. [Google Scholar] [CrossRef]
  32. Qu, Z.M.; Qi, X.C.; Shi, R.G.; Zhao, Y.J.; Hu, Z.P.; Chen, Q.; Li, C.L. Reduced N fertilizer application with optimal blend of controlled-release urea and urea improves tomato yield and quality in greenhouse production system. J. Soil Sci. Plant Nutr. 2020, 20, 1741–1750. [Google Scholar] [CrossRef]
  33. Sun, Q.Q.; Zhang, N.; Wang, J.F.; Zhang, H.J.; Li, D.B.; Shi, J.; Li, R.; Weeda, S.; Zhao, B.; Ren, S.X.; et al. Melatonin promotes ripening and improves quality of tomato fruit during postharvest life. J. Exp. Bot. 2014, 66, 657–668. [Google Scholar] [CrossRef] [PubMed]
  34. Zhai, Y.M.; Yang, Q.; Hou, M.M. The effects of saline water drip irrigation on tomato yield, quality, and blossom-end rot incidence-A 3a case study in the south of China. PLoS ONE 2015, 10, e0142204. [Google Scholar] [CrossRef] [PubMed]
  35. Kniemeyer, O. Design and Implementation of a Graph Grammar Based Language for Functional-Structural Plant Modelling. Doctoral Dissertation, BTU Cottbus-Senftenberg, Cottbus, Germany, 2008. [Google Scholar]
  36. Hemmerling, R.; Kniemeyer, O.; Lanwert, D.; Kurth, W.; Buck-Sorlin, G. The rule-based language XL and the modelling environment GroIMP illustrated with simulated tree competition. Funct. Plant Biol. 2008, 35, 739–750. [Google Scholar] [CrossRef]
  37. Park, S.J.; Jiang, K.; Tal, L.; Yichie, Y.; Gar, O.; Zamir, D.; Eshed, Y.; Lippman, Z.B. Optimization of crop productivity in tomato using induced mutations in the florigen pathway. Nat. Genet. 2014, 46, 1337–1342. [Google Scholar] [CrossRef] [PubMed]
  38. Vermeiren, J.; Villers, S.L.Y.; Wittemans, L.; Vanlommel, W.; van Roy, J.; Marien, H.; Coussement, J.R.; Steppe, K. Quantifying the importance of a realistic tomato (Solanum lycopersicum) leaflet shape for 3-D light modelling. Ann. Bot. 2019, 126, 661–670. [Google Scholar] [CrossRef]
  39. Zhang, Y.; Henke, M.; Li, Y.M.; Yue, X.; Xu, D.M.; Liu, X.A.; Li, T.L. High resolution 3D simulation of light climate and thermal performance of a solar greenhouse model under tomato canopy structure. Renew. Energy 2020, 160, 730–745. [Google Scholar] [CrossRef]
  40. Trentacoste, E.R.; Gómez-del-Campo, M.; Rapoport, H.F. Olive fruit growth, tissue development and composition as affected by irradiance received in different hedgerow positions and orientations. Sci. Hortic. 2016, 198, 284–293. [Google Scholar] [CrossRef]
  41. Chapepa, B.; Mudada, N.; Mapuranga, R. The impact of plant density and spatial arrangement on light interception on cotton crop and seed cotton yield: An overview. J. Cotton Res. 2020, 3, 18. [Google Scholar] [CrossRef]
  42. Feng, L.Y.; Raza, M.A.; Li, Z.C.; Chen, Y.K.; Khalid, M.H.B.; Du, J.B.; Liu, W.G.; Wu, X.L.; Song, C.; Yu, L.; et al. The influence of light intensity and leaf movement on photosynthesis characteristics and carbon balance of soybean. Front. Plant Sci. 2019, 9, 1952. [Google Scholar] [CrossRef]
  43. Chang, J.Y.; Ma, X.L.; Wu, Y.L.; Li, J.M. Effects of row spacing and irrigation amount on canopy light interception and photosynthetic capacity, matter accumulation and fruit quality of tomato. Sci. Agric. Sin. 2023, 56, 2141–2157. [Google Scholar] [CrossRef]
  44. Liu, X.; Wang, W.X.; Lin, X.; Gu, S.B.; Wang, D. The effects of intraspecific competition and light transmission within the canopy on wheat yield in a wide-precision planting pattern. J. Integr. Agric. 2020, 19, 1577–1585. [Google Scholar] [CrossRef]
  45. Maldera, F.; Carone, V.; Castellarnau, I.I.; Vivaldi, G.A.; Camposeo, S. Available PAR, growth and yield of a super high-density almond orchard are influenced by different row orientations. Agronomy 2023, 13, 874. [Google Scholar] [CrossRef]
  46. Papadopoulos, A.P.; Pararajasingham, S. The influence of plant spacing on light interception and use in greenhouse tomato (Lycopersicon esculentum Mill.): A review. Sci. Hortic. 1997, 69, 1–29. [Google Scholar] [CrossRef]
  47. Wei, H.; Zhao, J.; Hu, J.T.; Jeong, B.R. Effect of supplementary light intensity on quality of grafted tomato seedlings and expression of two photosynthetic genes and proteins. Agronomy 2019, 9, 339. [Google Scholar] [CrossRef]
  48. Qian, T.; Dieleman, J.A.; Elings, A.; De Gelder, A.; Marcelis, L.F.M. Response of tomato crop growth and development to a vertical temperature gradient in a semi-closed greenhouse. J. Hortic. Sci. Biotechnol. 2015, 90, 578–584. [Google Scholar] [CrossRef]
  49. Paucek, I.; Pennisi, G.; Pistillo, A.; Appolloni, E.; Crepaldi, A.; Calegari, B.; Spinelli, F.; Cellini, A.; Gabarrell, X.; Orsini, F.; et al. Supplementary LED interlighting improves yield and precocity of greenhouse tomatoes in the Mediterranean. Agronomy 2020, 10, 1002. [Google Scholar] [CrossRef]
  50. Trentacoste, E.R.; Connor, D.J.; Gómez-del-Campo, M. Effect of row spacing on vegetative structure, fruit characteristics and oil productivity of N-S and E-W oriented olive hedgerows. Sci. Hortic. 2015, 193, 240–248. [Google Scholar] [CrossRef]
  51. Gil, H.J.; Kim, Y.X.; Sung, J.; Jung, E.S.; Singh, D.; Lee, Y.; Lee, D.; Lee, C.H.; Lee, S. Metabolomic insights of the tomato fruits (Solanum lycopersicum L.) cultivated under different supplemental LED lighting and mineral nutrient conditions. Hortic. Environ. Biotechnol. 2020, 61, 415–427. [Google Scholar] [CrossRef]
  52. Toor, R.K.; Savage, G.P.; Lister, C.E. Seasonal variations in the antioxidant composition of greenhouse grown tomatoes. J. Food Compos. Anal. 2006, 19, 1–10. [Google Scholar] [CrossRef]
  53. Appolloni, E.; Orsini, F.; Pennisi, G.; Gabarrell Durany, X.; Paucek, I.; Gianquinto, G. Supplemental LED lighting effectively enhances the yield and quality of greenhouse truss tomato production: Results of a meta-analysis. Front. Plant Sci. 2021, 12, 596927. [Google Scholar] [CrossRef]
  54. Appolloni, E.; Paucek, I.; Pennisi, G.; Manfrini, L.; Gabarrell, X.; Gianquinto, G.; Orsini, F. Winter greenhouse tomato cultivation: Matching leaf pruning and supplementary lighting for improved yield and precocity. Agronomy 2023, 13, 671. [Google Scholar] [CrossRef]
Figure 1. Daily average temperature and humidity charts as measured in the solar greenhouse during the experiment periods.
Agronomy 14 00314 g001
Figure 2. (a) Schematic diagram of the tomato seedbed; (b) diagram of the experimental design showing the cultivation patterns and the arrangement within the greenhouse; and (c) photographs of the experimental site of the winter–spring and autumn–winter crops.
Agronomy 14 00314 g002
Figure 3. (a) Photograph of the interior scene of the solar greenhouse where tomatoes were cultivated; (b) simplified parameters of the solar greenhouse profile; (c) a snapshot of the (empty) virtual 3D solar greenhouse module using GroIMP.
Agronomy 14 00314 g003
Figure 4. Snapshot of an individual tomato plant model using GroIMP: (a) individual tomato plant model including fruits; (b) simplified leaflet constructed of four triangles; (c) individual leaf model as sequence of leaflets; (d) individual tomato plant model omitting fruits; (e) relationship between leaflet number and leaf order.
Agronomy 14 00314 g004
Figure 5. Sky and sunlight modules and simulation results for a 36° N solar greenhouse using GroIMP: (a) visualization of the sky and sunlight modules of the 36° N solar greenhouse where 72 white spheres represent the diffuse light sources building the sky module and where the blue spheres represent the hourly scale solar position trajectories over the year; (b) measurement and simulation of solar radiation in the solar greenhouse.
Agronomy 14 00314 g005
Figure 6. Screenshots of the three solar greenhouse tomato cultivation patterns: (a) cultivation pattern of the NS-1.4m treatment; (b) cultivation pattern of the NS-1.8m treatment; (c) cultivation pattern of the EW-1.8m treatment.
Agronomy 14 00314 g006
Figure 7. Simulation of the daily light interception at the individual plant level of tomatoes in different cultivation patterns: (a) leaf’s light interception among different leaf orders of individual plants under different treatments for the winter–spring crop; (b) leaf’s light interception among different leaf orders of individual plants under different treatments for the autumn–winter crop; (c) light interception per plant within the population when plant morphology was stabilized under the NS-1.4m treatment; (d) light interception per plant within the population when plant morphology was stabilized under the NS-1.8m treatment; (e) light interception per plant within the population when plant morphology was stabilized under the EW-1.8m treatment.
Agronomy 14 00314 g007
Figure 8. Simulation of daily light interception for population levels of tomatoes in different cultivation patterns.
Agronomy 14 00314 g008
Figure 9. The changes in plant phenotype among different cultivation patterns: (a) internode length; (b) leaflet internode length; (c) leaf elevation angle; (d) leaflet elevation angle; (e) average leaflet area. Different lowercase letters indicate significant differences (p < 0.05) among different treatments of the same parameters.
Agronomy 14 00314 g009
Figure 10. The changes in plant growth among different cultivation patterns: (a) plant height; (b) stem thick; (c) leaf area; (d) leaf number; (e) aboveground fresh weight; (f) aboveground dry weight. Different lowercase letters indicate significant differences (p < 0.05) among different treatments of the same parameters.
Agronomy 14 00314 g010
Figure 11. Fruit ripening time of different trusses of tomatoes for (a) winter–spring and (b) autumn–winter. Different lowercase letters indicate significant differences (p < 0.05) among different treatments of the same parameters.
Agronomy 14 00314 g011
Figure 12. Principal component analysis of tomato fruit quality indexes: circles in the figure were of a 95% confidence ellipse; arrows were the original variables where the direction represented the correlation between the original variables and the principal components and the length represented the contribution of the original data to the principal components.
Agronomy 14 00314 g012
Figure 13. Path diagram for the structural equation model: numbers next to paths were standardized path coefficients; * indicated p < 0.05, ** indicated p < 0.01 and *** indicated p < 0.001; solid lines indicated positive effects; dotted lines indicated negative effects; R2 indicated the explained rate of each indicator in the model; chi-square = 4.891; degrees of freedom = 4; p level = 0.299; RMSEA = 0.061; CFI = 0.999; TLI = 1.008; and GFI = 0.975. This indicated that the model was reasonable.
Agronomy 14 00314 g013
Table 1. Soil fertility parameters for the experimental plots.
Alkali-Hydrolyzable Nitrogen (mg·kg−1)Available Phosphorus (mg·kg−1)Available Potassium (mg·kg−1)Organic Matter
(g·kg−1)
Bulk Density
(g·cm−1)
175.867.5246.220.11.14
Table 2. General parameters of the virtual tomato plant module.
ParametersSchematicValueUnit
Winter–Spring CropAutumn–Winter Crop
NS-1.4mNS-1.8mEW-1.8mNS-1.4mNS-1.8mEW-1.8m
Leaf phyllotactic angleAgronomy 14 00314 i001137.5137.5137.5137.5137.5137.5°
Internode lengthAgronomy 14 00314 i0020.07840.08580.08750.08120.08840.0900m
Leaf elevation angleAgronomy 14 00314 i003305050305050°
Leaflet internode lengthAgronomy 14 00314 i0040.0300.0370.0410.0300.0360.038m
Leaflet elevation angleAgronomy 14 00314 i005153535153535°
Average leaflet areaAgronomy 14 00314 i0060.002740.003600.003710.002660.003500.00360m2
Table 3. The changes of the gas exchange parameters among the different treatments. Different lowercase letters indicate significant differences (p < 0.05) among the different treatments of the same parameters.
TreatmentNet Photosynthetic Rate
(μmol·m−2·s−1)
Intercellular CO2 Concentration (μmol·mol−1)Stomatal Conductance (mmol·m−2·s−1)Transpiration Rate (mmol·m−2·s−1)
Winter–spring cropNS-1.4m25.68 ± 0.41 b255.35 ± 5.09 b389.85 ± 6.38 ab6.89 ± 0.51 b
NS-1.8m26.04 ± 0.78 b255.44 ± 7.14 b387.01 ± 8.12 b7.15 ± 0.58 b
EW-1.8m27.01 ± 0.39 a267.58 ± 5.82 a394.76 ± 4.37 a7.69 ± 0.32 a
Autumn–winter cropNS-1.4m15.93 ± 0.55 b253.41 ± 5.82 b389.68 ± 9.38 a6.79 ± 0.45 a
NS-1.8m16.71 ± 0.46 a260.59 ± 2.34 a396.17 ± 9.77 a7.13 ± 0.40 a
EW-1.8m16.97 ± 0.60 a265.59 ± 7.23 a399.18 ± 8.33 a7.16 ± 0.48 a
Table 4. The changes of fruit quality under different treatments. Different lowercase letters indicate significant differences (p < 0.05) among the different treatments of the same parameters.
TreatmentSoluble Sugar (%)Organic Acid (%)Sugar–Acid RatioLycopene (μg·g−1)Vitamin C (mg·100g−1)
Winter–spring cropNS-1.4m3.57 ± 0.14 c0.50 ± 0.06 a7.19 ± 1.05 b93.44 ± 4.55 c18.54 ± 1.85 b
NS-1.8m4.35 ± 0.26 b0.49 ± 0.08 a9.02 ± 1.52 a101.55 ± 6.25 b25.74 ± 2.25 a
EW-1.8m4.84 ± 0.46 a0.47 ± 0.06 a10.29 ± 1.63 a107.95 ± 2.75 a24.65 ± 3.24 a
Autumn–winter cropNS-1.4m4.05 ± 0.14 b0.69 ± 0.05 b5.86 ± 0.53 b85.55 ± 6.74 b41.05 ± 6.34 b
NS-1.8m4.35 ± 0.26 a0.66 ± 0.06 ab6.63 ± 0.97 ab91.35 ± 13.8 ab44.54 ± 2.85 b
EW-1.8m4.29 ± 0.10 a0.61 ± 0.08 a7.09 ± 1.02 a100.14 ± 5.65 a51.65 ± 4.15 a
Table 5. The changes of the yield under different treatments. Different lowercase letters indicate significant differences (p < 0.05) among the different treatments of the same parameters.
TreatmentNumber of Fruits per PlantIndividual Fruit Weight (g)Yield per Plant
(kg)
Yield per Unit Area
(t∙ha−1)
Winter–spring cropNS-1.4m22.1 ± 0.87 a217.42 ± 9.84 b4.80 ± 0.21 b172.86 ± 7.85 b
NS-1.8m22.0 ± 0.47 a226.86 ± 12.74 ab4.98 ± 0.27 ab179.63 ± 9.82 ab
EW-1.8m22.2 ± 0.63 a229.72 ± 8.61 a5.09 ± 0.20 a183.55 ± 7.52 a
Autumn–winter cropNS-1.4m18.2 ± 0.78 a189.30 ± 9.33 b3.44 ± 0.25 b124.10 ± 9.24 b
NS-1.8m18.4 ± 1.26 a195.09 ± 12.67 ab3.59 ± 0.35 ab129.27 ± 12.75 ab
EW-1.8m18.5 ± 0.52 a204.49 ± 10.26 a3.78 ± 0.24 a136.24 ± 8.70 a
Table 6. The direct and indirect effects of the indicators on the tomato yield. All the coefficients were standardized.
IndicatorDirect EffectIndirect EffectTotal Effect
Plant height0.090.180.27
Leaf area0.000.610.61
Light interception per plant0.230.750.98
Photosynthesis0.430.380.81
Ripening time−0.350.00−0.35
Disclaimer/Publisher’s Note: The statements, opinions and data contained in all publications are solely those of the individual author(s) and contributor(s) and not of MDPI and/or the editor(s). MDPI and/or the editor(s) disclaim responsibility for any injury to people or property resulting from any ideas, methods, instructions or products referred to in the content.

