Article

ESG-YOLO: A Method for Detecting Male Tassels and Assessing Density of Maize in the Field

1
College of Tropical Crops, Hainan University, Haikou 570228, China
2
National Nanfan Restasselch Institute (Sanya), Chinese Academy of Agricultural Sciences, Sanya 572024, China
3
National Agriculture Science Data Center, Agricultural Information Institute, Chinese Academy of Agricultural Sciences, Beijing 100081, China
4
Farmland Irrigation Restasselch Institute, Chinese Academy of Agricultural Sciences, Xinxiang 453002, China
*
Author to whom correspondence should be addressed.
Agronomy 2024, 14(2), 241; https://doi.org/10.3390/agronomy14020241
Submission received: 15 November 2023 / Revised: 22 December 2023 / Accepted: 17 January 2024 / Published: 24 January 2024
(This article belongs to the Special Issue The Applications of Deep Learning in Smart Agriculture)

Abstract

:
The intelligent acquisition of phenotypic information on male tassels is critical for maize growth and yield assessment. In order to realize accurate detection and density assessment of maize male tassels in complex field environments, this study used a UAV to collect images of maize male tassels under different environmental factors in the experimental field and then constructed and formed the ESG-YOLO detection model based on the YOLOv7 model by using GELU as the activation function instead of the original SiLU and by adding a dual ECA attention mechanism and an SPD-Conv module. And then, through the model to identify and detect the male tassel, the model’s average accuracy reached a mean value (mAP) of 93.1%; compared with the YOLOv7 model, its average accuracy mean value (mAP) is 2.3 percentage points higher. Its low-resolution image and small object target detection is excellent, and it can be more intuitive and fast to obtain the maize male tassel density from automatic identification surveys. It provides an effective method for high-precision and high-efficiency identification of maize male tassel phenotypes in the field, and it has certain application value for maize growth potential, yield, and density assessment.

1. Introduction

Maize is a major grain crop in China, where the improvement of maize yield depends on the breeding of excellent new varieties. While in the process of maize growth, planting density and yield are positively correlated [1], in order to enhance the breeding of maize seeds suitable for high-density planting, it is necessary to obtain maize phenotypic information from large-scale population trials at different planting densities to assess the performance of different maize varieties [2]. Maize’s male tassel is an important agronomic trait in maize breeding [3,4], and the accurate detection and density assessment of maize male tassels is of wide significance. It is a prerequisite element in the research and development of new agricultural technologies [5] and is key to the performance profile and yield prediction of different maize varieties. It helps to manage the impact of environmentally controllable factors on maize growth and development and helps to develop strategies to mitigate the effects of climate change and optimize crop management practices. It also contributes to precision agriculture by allowing farmers to customize inputs to the specific needs of the crop, reducing waste and increasing efficiency.
Current maize male tassel detection mainly relies on manual counting methods. But this approach has the disadvantages of being subjective, time-consuming, inefficient, and unable to adapt to large-scale quantitative analysis of crop traits and phenotypes. In recent years, with the development of drone technology and computer vision technology, researchers at home and abroad have conducted a lot of research on field corn male tassel acquisition and recognition based on drone technology and deep learning. There is the TasselNet convolutional neural network proposed by Lu et al. [6], for example, to construct a new dataset MTC using visible light images captured by a high-resolution camera, to accurately and efficiently count maize male tassels through a local regression network, and to disclose a maize male tassel dataset. Yu et al. [7] proposed a novel lightweight neural network, TasselLFANet, in the dataset MrMT to accurately and efficiently detect and count maize male tassels in high temporal image sequences. KHAKI S et al. [8] proposed a YOLOv4-based computer vision method to detect wheat tassels. Buzzy M et al. [9] used the Tiny-YOLOv3 network to accurately detect the real-time localization of leaves. F. Kurtulmus et al. [10] used Support Vector Machines (SVMs) to detect corn male tassels; they manually collected 46 RGB high-resolution images of corn canopies as a small dataset, extracted the color information using SVMs, and classified the pixel points as having or not having tassels, with a detection accuracy of 81.6%. Liu et al. [11] based their model on the Faster R-CNN network, modified the anchor point size, and detected corn male tassels by replacing different backbone feature extraction networks, and they concluded that a Residual Neural Network (ResNet) is better than a Visual Geometry Group Network as a feature extraction network for corn male tassels, but a large number of parameters and FLOPs can lead to a slow detection speed in Faster R-CNN. Hongming Zhang et al. [12] took maize seedlings as the target, added lightweight improvement measures, and proposed a convolutional neural network detection network for seedling acquisition, which realized the acquisition of maize seedling plants at high throughput and completed the prediction of yield assessment. Liang et al. [13] applied several mainstream detection models such as Faster R-CNN [14], SSD [15], and YOLOv3 [16] to train and predict the labeled corn tassel dataset and compared the results. Yang et al. [17] improved the CenterNet detection model [18], which achieved good positive results in improving the accuracy and speed of maize male tassel detection, but due to the complexity of the field situation, strong light and leaf shading are serious, and some small male tassel targets cannot be detected, i.e., it will lead to an increase in the number of missed and misdetected tassels. A Zadjali et al. [19] used Faster R-CNN as the base model while making some modifications to the threshold for the intersection ratio (Iou) between the predicted and true frames for target detection, which improved the accuracy and recall of the model; however, it still did not solve the problem of the large parameters of the Faster R-CNN model. Ji et al. proposed a coarse-to-fine maize male tassel detection mechanism, which was realized by continuous image acquisition for a wider range of applications and provided a new idea for maize tassel detection [20]. Mirnezami et al. captured close-up images of corn tassels and used deep learning algorithms to detect, classify, and segment the tassels [21]. They then utilized image processing techniques to intercept the major spikelets on the male tassel to track reproductive development. Falahat et al. proposed a maize tassel detection and counting technique based on an improved YOLOv5n network, which consists of applying an attentional mechanism on the trunk and using deep convolution on the neck to enable the model to learn more complex features for better tassel detection; the improved model resulted in an improvement of 6.67% in mAP@ 0.5 [22].
During the growth of maize, the density of planting and yield are positively correlated. Maize density map estimation methods applied to the maize cob counting task to label densely planted cobs with points greatly reduces the workload of manual sample labeling, while the generated density maps help researchers to understand the spatial distribution of maize male cobs, making it possible to count closely planted maize in a plot, and providing assistance in realizing quantitative processing in production. However, it is difficult for existing methods for maize male cob density assessment to show adequate performance in field maize male cob counting tasks. Currently, most of the algorithms for maize male tassel density estimation use Gaussian filters for labeled images. Multi-column CNN [23] uses a multi-scale convolutional kernel operator to adaptively process targets of different sizes to obtain a density map of the target. The shallow network structure does not learn well the various morphologies of corn cobs, and thus the accuracy that can be achieved is limited. To further improve target statistic accuracy, Li et al. [24] proposed an extended convolutional network (CSRNet) to study the target recognition problem in highly congested scenarios. This network shows good performance in target statistics. However, its linear structure cannot effectively handle the variation of male spikes, and the expansion rate of the back-end network is fixed, which results in slow inference. Stack-pool (STP) [25] addresses the scale invariance problem through a stacked pool structure but lacks an efficient back-end network to aggregate and effectively utilize the extracted multi-scale features. Dense Scale Network (DSNet) [26] uses cascading extended convolutions with different scaling rates to enhance feature fusion, but the single-column structure limits its accuracy in scale-varying scenarios. Multi-task Point Supervision (MPS) [27] uses three Vgg16 encoders to acquire feature maps at three scales, which are embedded into an extended convolutional network to improve the processing power of scale transformations. This method, however, performs poorly for a certain size of computation and makes inference slow due to its complex multi-column structure.
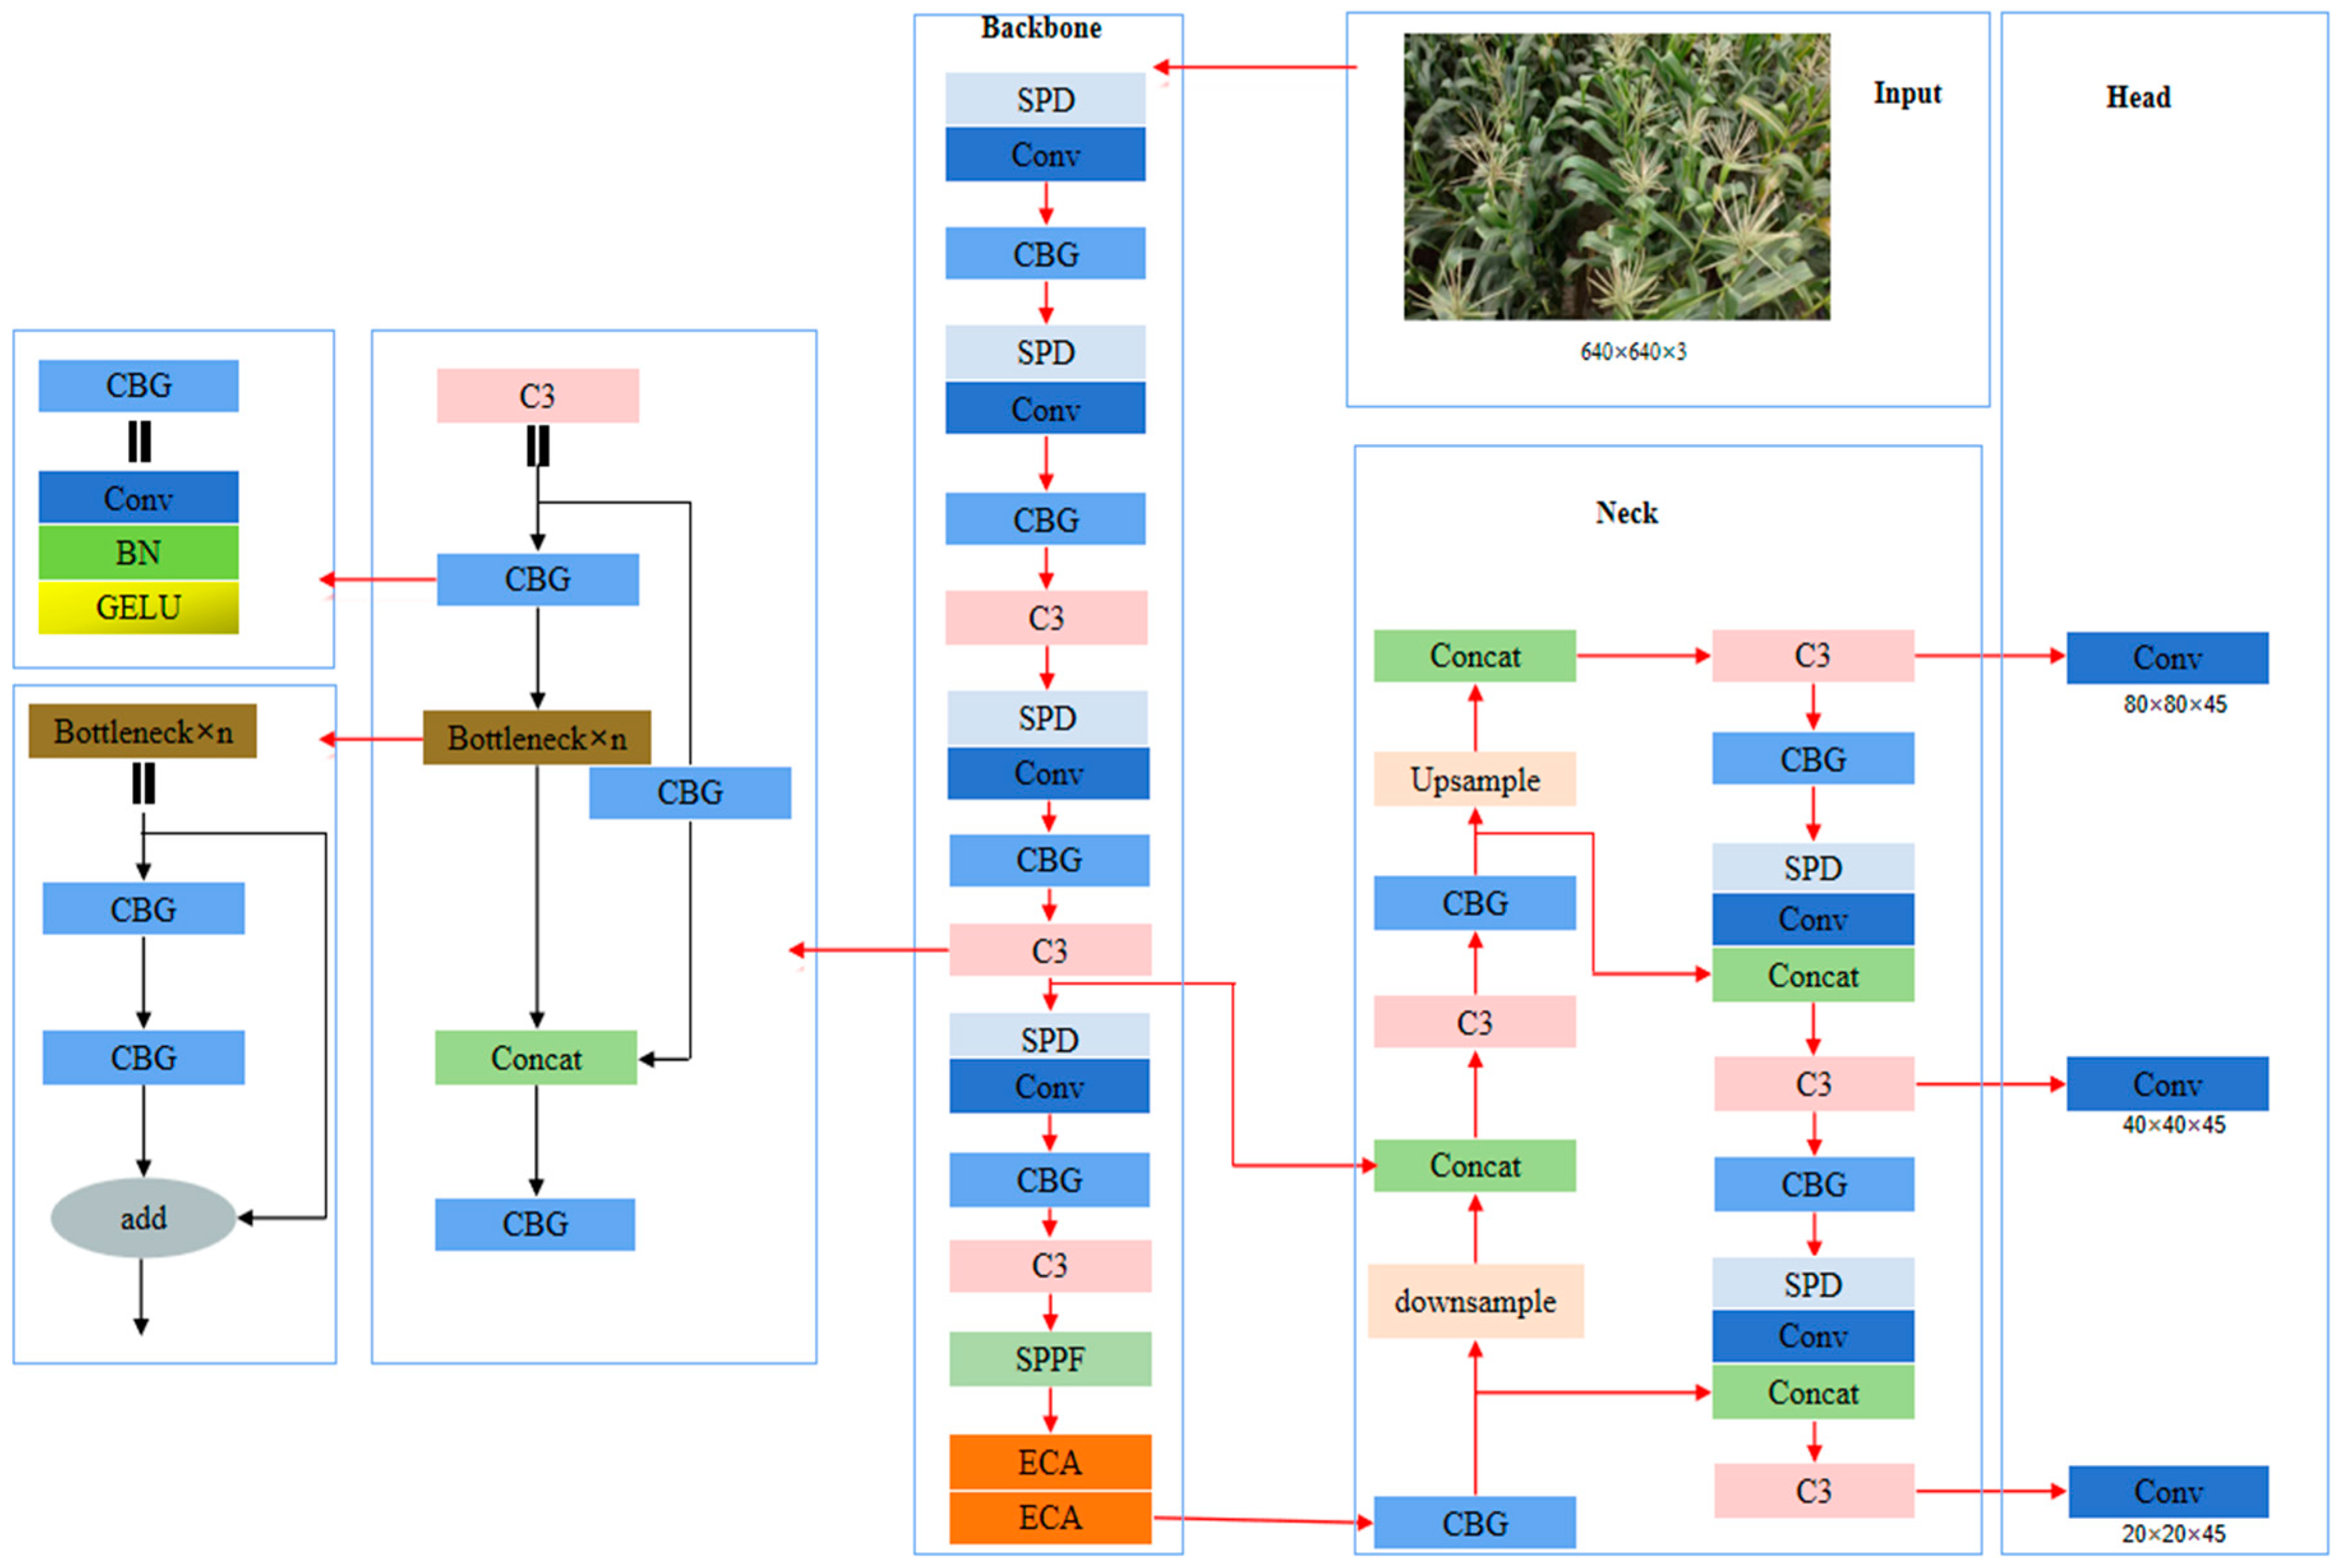
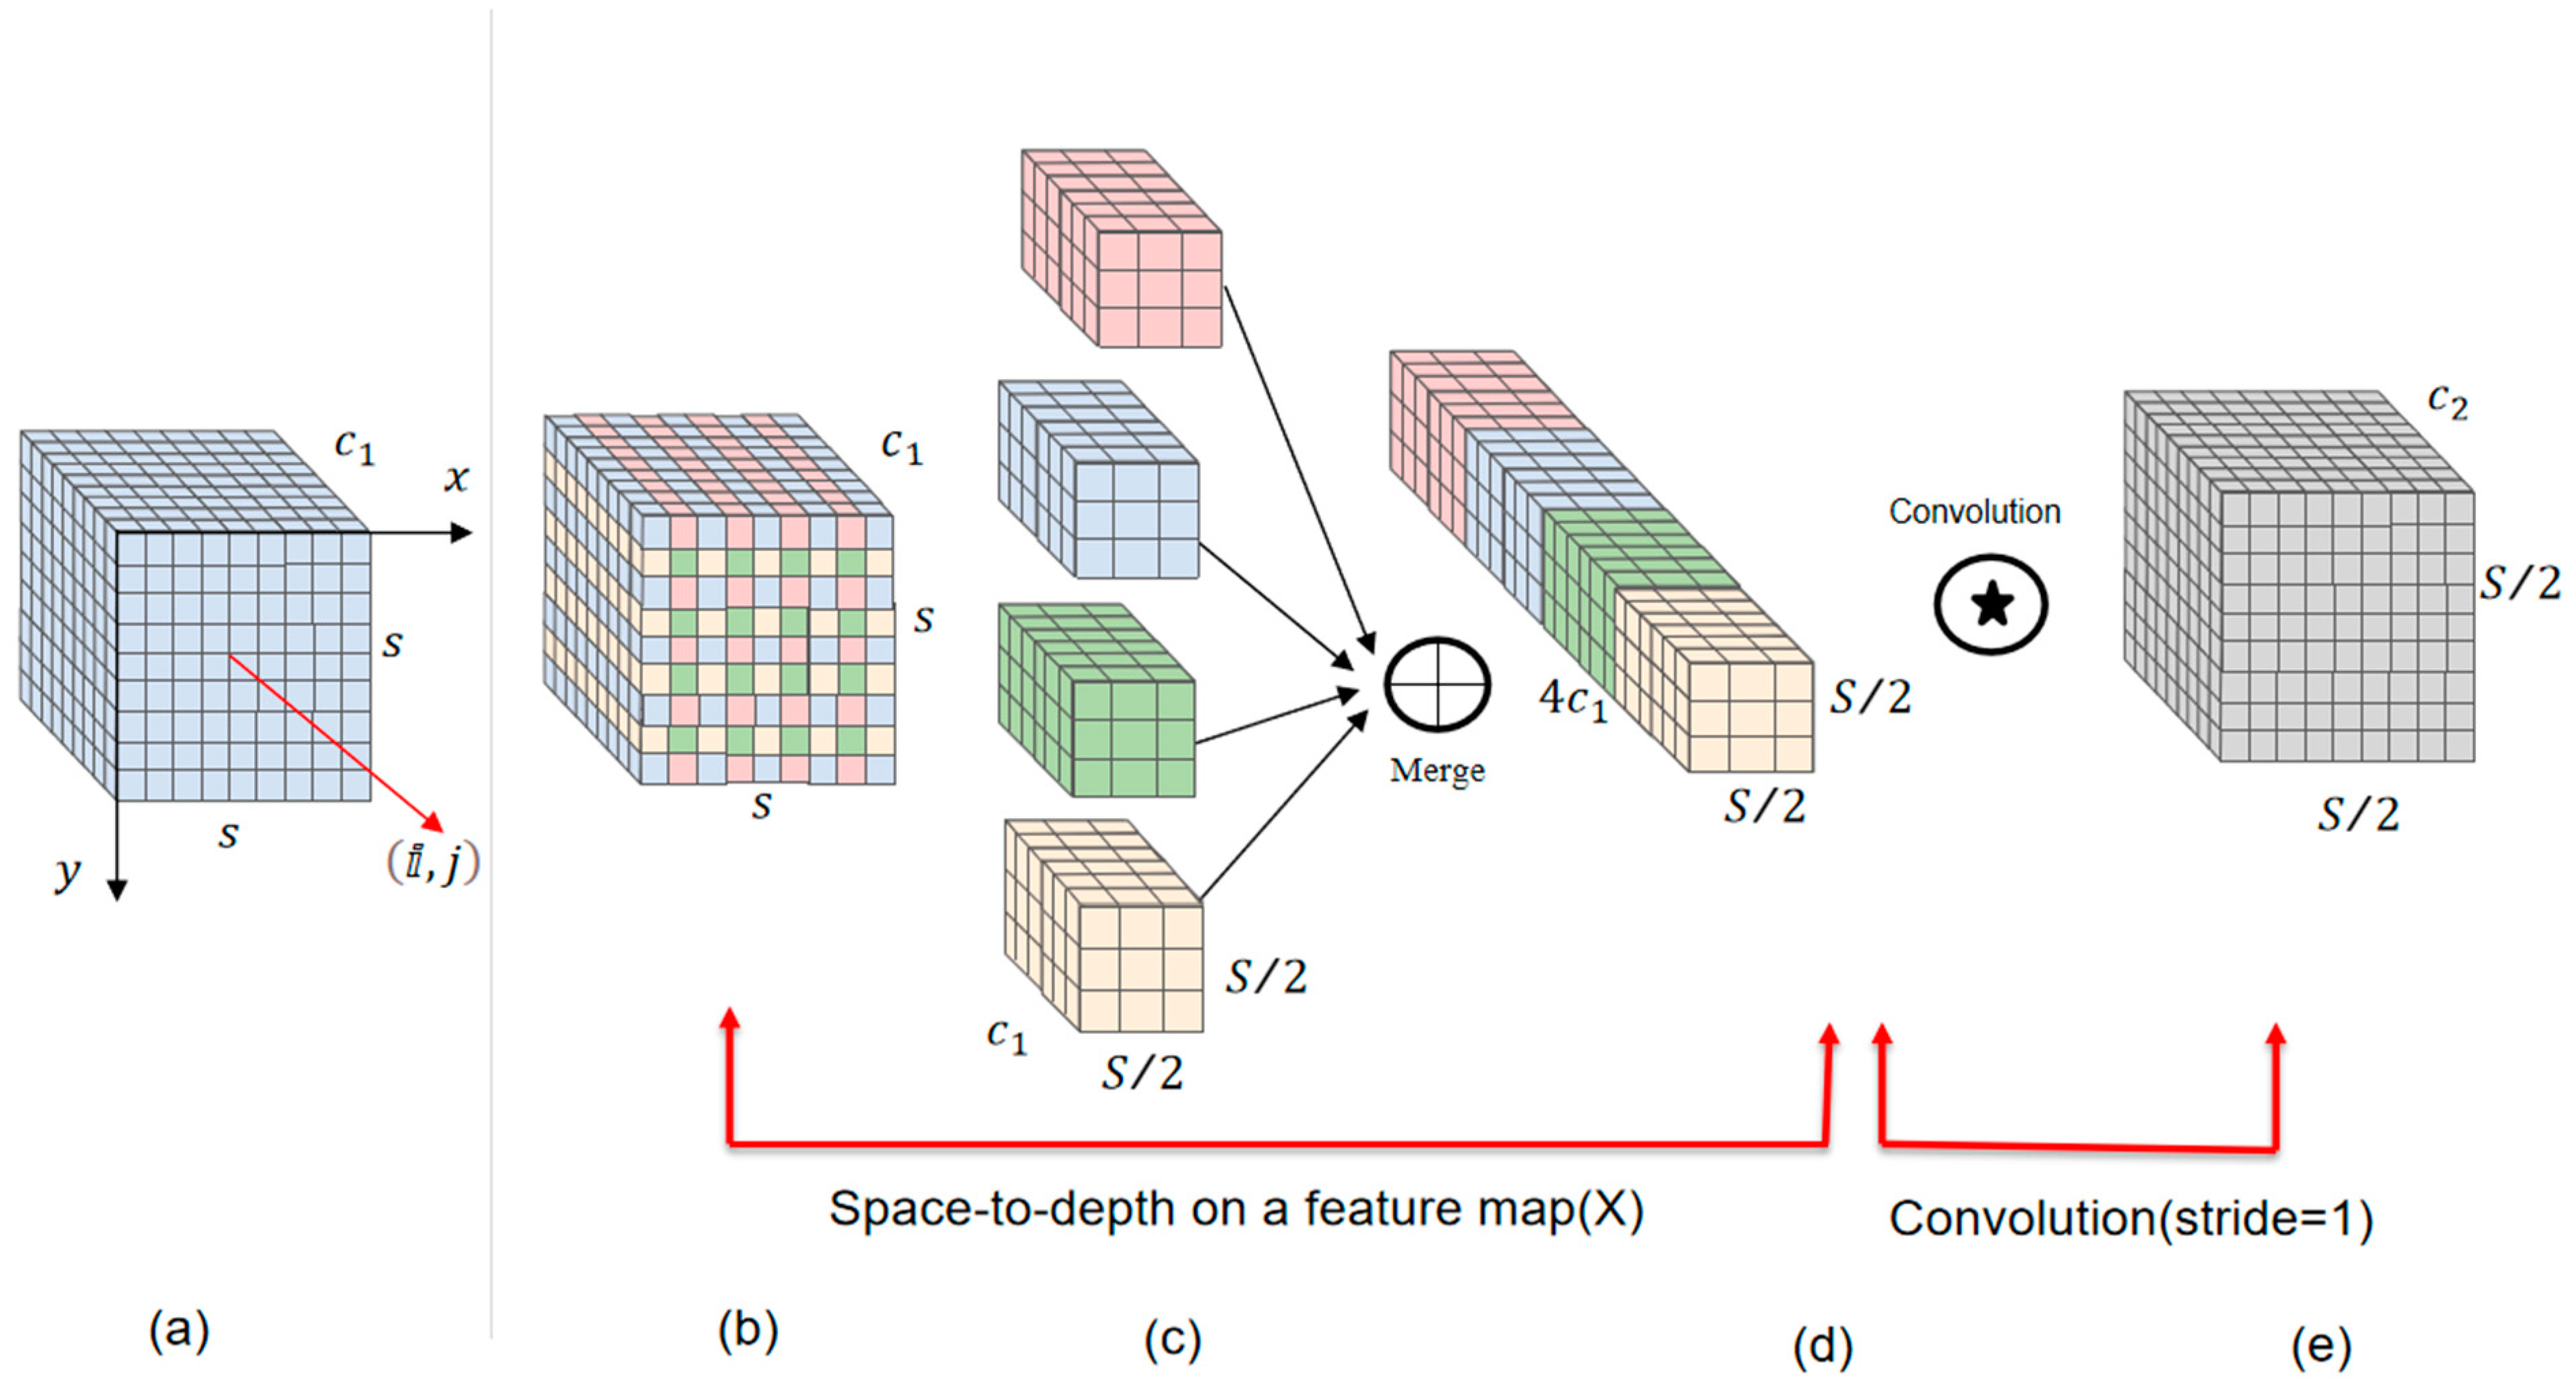
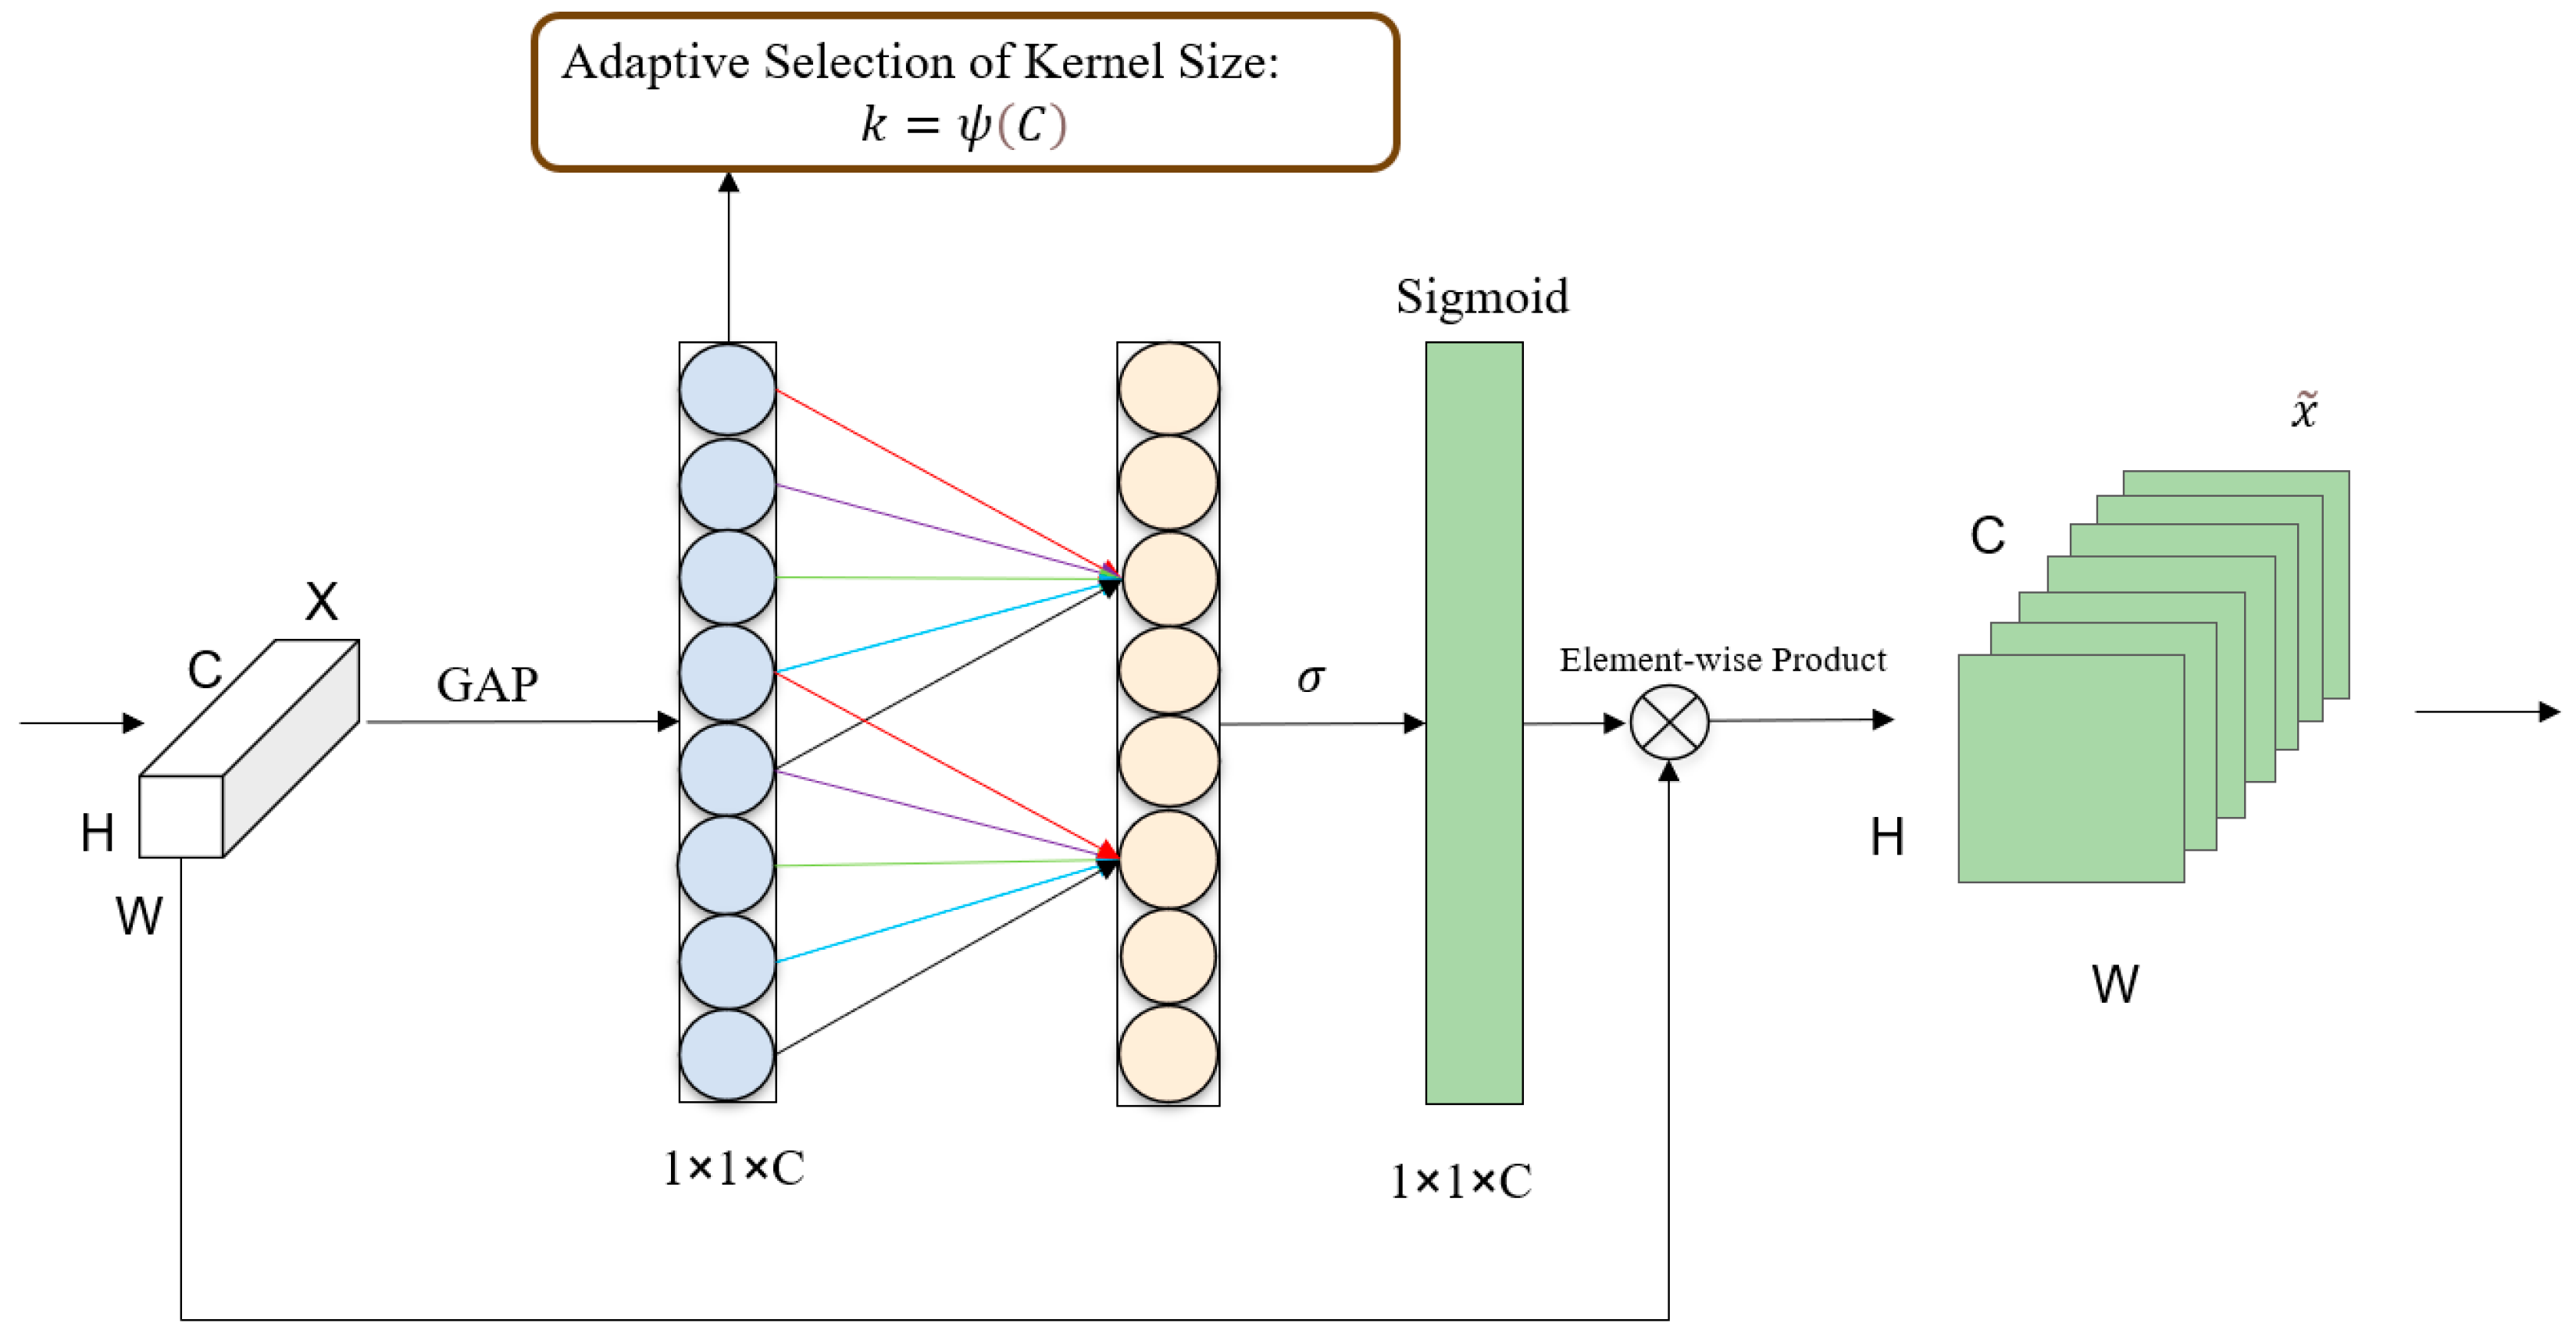
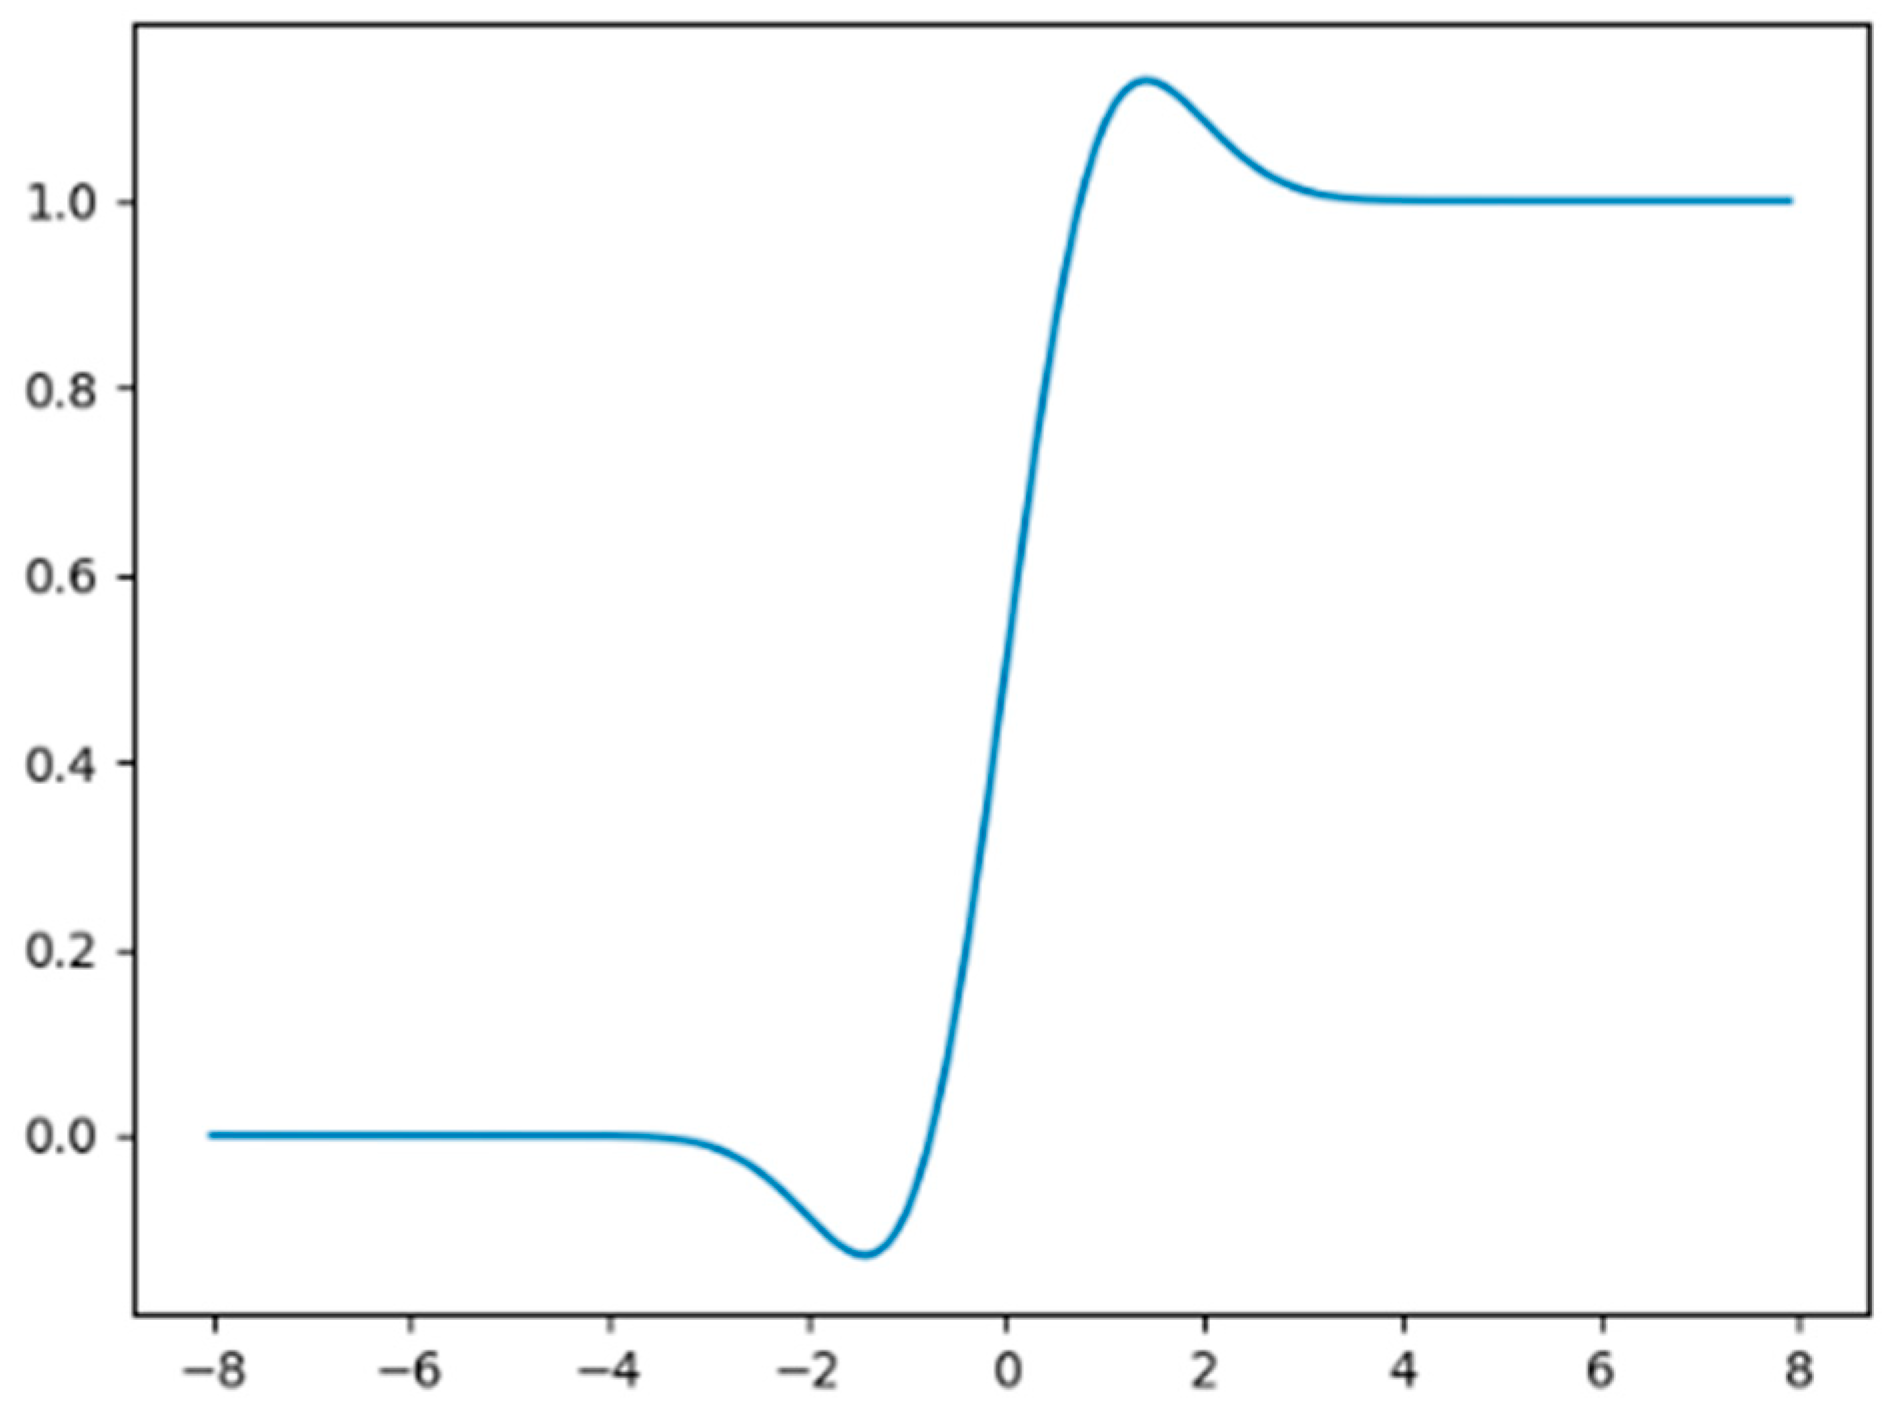
In summary, the direct application of density map-based methods to maize male tassels may lead to serious error problems for three reasons: In the first place, corn male tassels present different sizes at different growth stages, and image capture, i.e., filming, at different distances from the tassels leads to significant variations in the appearance of the tassels. This caused the male tassels to exhibit different shapes and sizes. The second point is that the complexity of the background in the field leads to a large number of force majeure things that shade the maize male tassels and interfere with the counting. For the third point, achieving fast inference and realizing straight-out assessment while ensuring counting accuracy is very challenging for existing networks, which have difficulty reconciling these two tasks. In order to optimize the challenge of scale variation in maize male cob images, a feature extraction network with SPD-Conv was added in this study. This structure is optimized for processing symmetric positive definite matrix data (e.g., covariance matrix, deformation tensor, etc.), which makes it effective for low-resolution images and small object detection. To address the challenge of complex background interference, this study adds a dual ECA attention mechanism module to suppress ambiguous features by emphasizing salient features. This module uses a 1 × 1 convolutional layer directly after the global average pooling layer, removes the fully connected layer, avoids dimensionality reduction, and captures cross-channel interactions effectively. In order to balance efficiency and accuracy, the activation function GULE is used in this study, which is a relatively stable strategy to perform detection and is not prone to large errors. In this study, the ESG-YOLO model was constructed, and the activation function SiLU was modified to GELU on the basis of the YOLOv7 detection model, and the dual ECA attention mechanism module and the SPD-Conv network module were added for the detection of maize male tassels in complex field environments. This method can achieve the accurate identification and counting of the number of maize male tassels in complex backgrounds, which can be combined with effective tassel stage determination to help the management of maize growth and yield estimation in the field, provide good information feedback for the screening of future breeding and selection work as well as agricultural robotic operations, and improve the accuracy and efficiency of maize male tassel phenotype detection.

2. Materials and Methods

2.1. Overview of the Test Site

The image data were collected from Potianyang Experimental Base of National Restasselch Institute of Southern Culture, Chinese Academy of Agricultural Sciences, Yazhou District, Sanya City, Hainan Province (N: 18°24′00″, E: 109°9′37″). The base covers an area of 550 mu, mainly for crop breeding varieties in a large-scale phenotype verification test field, including a maize cultivation area of 200 mu.

2.2. Data Collection

As shown in Figure 1, A DJI Mavic Mini2 drone (SZ DJI Technology Co., Ltd.; Shenzhen, China)was used to capture video images of the test area. The UAV’s onboard gimbal utilizes a 1/2.3-inch 12-megapixel native CMOS image sensor and can capture photos at 4000 × 3000 resolution; it offers 4K/60P video specifications and can record video at a bit rate of 100 Mbps using the H.264 encoder. The experimental data were collected from 21 February to 21 March 2023. Under several rounds of low-altitude debugging, the altitude of 7 m was the height at which the UAV could obtain the best image resolution and capture more detailed information, and that is why the UAV was set to a height of 7 m from the corn farmland, with a ground sampling distance of 0.76 cm/pixel and a video camera with a resolution of 1920 × 1080 pixels. The camera angle of the gimbal was vertically downward, with a flight speed of 0.3 m/s around the corn farmland for video recording. In this study, the male tassel data were collected during the anther dispersal period, which is a stage of maize growth and development when the pollen in the male tassel has matured and begun to disperse, and at this stage, it is suitable to collect male tassel data in order to obtain accurate information. As the light is too strong midday, the light reflection and field reflection situation is the most serious, and the uncontrollability increases the complexity of intelligent detection in the field, so, in order to minimize the error as much as possible, we chose the time periods of 8:00–10:00 a.m. and 16:00–18:00 p.m. for image acquisition. The weather at the time of the acquisition included sunny and cloudy days, and the ambient temperature was 22–30 °C. The varieties of maize male tassels for experimental data collection were Tongfeng 162, Sweet Color Sticky No.2, and Jinbai Sweet 15. The duration of data acquisition for each segment entry was 2 min, with all images collected in complex natural environments in the field, with natural lighting (no flash was used in the acquisition process), and the images contained varying degrees of occlusion, overexposure, and noise interference from weeds, dead leaves, insect erosion, and field debris.

2.3. Dataset Construction and Labeling

As shown in Figure 2, the video data in this study were processed by format factory for image frame extraction, and the frames were extracted every 1.2 s according to the flight speed of the UAV of 0.3 m/s. The experiment was screened, and 2100 valid data points were collected, and the male tassels of maize were labeled using LabelImg1.8.6 software. The number of samples has a positive correlation with the generalizability of the model to a certain extent, which can directly affect the training effect of the model. In reality, maize male tassels show different characteristics under different weather and light, so how to detect male tassels under complex and changing environment is a difficult point. In this connection, the data were randomly expanded to 8400 frames to construct the dataset using random cut, random flip, and Gaussian fuzzy to enhance the generalization ability of the model from the dataset’s point of view.

3. Network Model Construction

3.1. ESG-YOLO Network Model

Due to the corn field environment mixed with a large number of weeds, dead leaves, field debris, and other obstructions, resulting in a complex and diverse field environment so that the detection of corn male tassel is prone to error, and there are differences in the expression of visual features of corn male tassels in corn planting density and different meteorological conditions. The feature information in the image will be lost, which reduces the accuracy of the detection model. To reduce the error and strengthen the accuracy of the detection model, increasing the number of layers of the network structure of the detection model and improving the feature extraction network are common network improvement methods. While the method of increasing the number of layers of the network of the detection model can improve its feature extraction capability, too many layers in the network structure will cause overfitting due to the disappearance of the gradient and the dispersion of the overfitting phenomenon, which will lead to a decrease in the model’s detection accuracy and performance. In harsh environments, detection algorithms with thermal visualization, high accuracy, short inference time, and lighter complexity of model structure are needed. Therefore, this paper adopts the method of improving the feature extraction module to improve the feature extraction ability and functionality of the detection model, and its network structure is shown in Figure 3.
In this paper, the ESG-YOLO network is proposed, which is structured with a C3 module and SPPF as the backbone feature extraction network, and the feature pyramid is modified. The model mainly contains four parts, namely, Input, Backbone, Neck, and Head, and the image is processed in the Input for the part of the data. After preprocessing operations such as data enhancement in Input, the image is fed into the backbone feature extraction network composed of the C3 module and a CBG module for feature extraction, in which the CBG module is composed of three parts: Conv, BN, and GELU. Subsequently, the dual ECA attention mechanism was then embedded in Backbone, and then SPD-Conv was embedded in Backbone and Neck to take advantage of SPD-Conv for symmetric positive definite matrix data processing. The extracted features were fused and processed in Neck using Feature Pyramid Networks (FPNs [28]) to get three sizes of features: large, medium, and small. Finally the Head part generates the class probability and location information of the predicted target. It also solves the problem of harsh environment detection needs for corn male tassels.

3.1.1. YOLOv7 Network Model

In August 2022, Alexey Bochkovskiy et al. [29] proposed the YOLOv7 algorithm. YOLOv7 employs an approach based on single-stage detection, which treats the entire detection process as an end-to-end regression problem. YOLOv7 is faster than traditional two-phase methods and is able to handle real-time application scenarios while maintaining a high level of accuracy. The architecture of YOLOv7 consists of a feature extraction network (Backbone), a feature fusion layer (Neck), and a prediction layer (Head). The feature extraction network typically uses a powerful convolutional neural network for extracting a rich feature representation from the input image. The feature fusion layer is responsible for fusing feature maps at different scales for detection on targets of different sizes, while the prediction layer outputs information about the location, class, and confidence of the target by means of multilayer convolution and fully connected layers. YOLOv7 is efficient and accurate and has fast inference speed and better detection performance, which can perform well in real-time or efficient target detection application scenarios.

3.1.2. SPD-Conv Network Module

SPD-Conv is a new convolutional neural network (CNN) architecture. SPD stands for Symmetric Positive Definite [30]. The architecture is optimized for handling symmetric positive definite matrix data (e.g., covariance matrix, deformation tensor, etc.), which makes it effective for low-resolution images and small object detection. While conventional CNNs are mainly used to process image data, SPD-Conv is specifically designed to process symmetric positive definite matrix data. In SPD-Conv, the inputs and outputs are symmetric positive definite matrices, and a series of operations and convolutional layers are used to extract features and perform classification or regression tasks. The central idea of SPD-Conv is to utilize the geometric structure and properties of symmetric positive definite matrices to enhance feature extraction and representation capabilities. It introduces special convolution operations such as Symmetric Bilintassel Pooling and Symmetric Average Pooling, which preserve symmetric positive definiteness and efficiently handle data with symmetric positive definite matrices.
As shown in Figure 4, a is a conventional feature map with C1 number of channels. b is a spatial block of pixels rearranged to depth/channel dimensions by a space-to-depth operation, increasing the number of channels to 4C1 while reducing the spatial dimensions by a factor of 2. c is a merge of different groups of channels in channel dimensions. d is an addition operation with other processed feature maps. e applies a convolution with a step of 1 to the resulting feature map. d for the merged feature maps to perform addition operation with other processed feature maps. e for applying convolution with step size 1 to the resultant feature maps, reducing the channel dimension to C2.The SPD component uses image conversion technology [31] to down-sample the feature mapping within the CNN and throughout the CNN, as shown below. Considering any intermediate feature map X of size S × S × C1, slice the sequence of sub-feature maps as follows:
f 0,0 = X 0 : S : s c a l e , 0 : S : s c a l e , f 1,0 = x 1 : S : s c a l e , 0 : S : s c a l e , ,            f s c a l e 1,0 = X s c a l e 1 : S : s c a l e , 0 : S : s c a l e ; f 0,1 = X 0 : S : s c a l e , 1 : S : s c a l e , f 1,1 , ,            f s c a l e 1,1 = X s c a l e 1 : S : s c a l e , 1 : S : s c a l e ;             f 0 , s c a l e 1 = X 0 : S : s c a l e , s c a l e 1 : S : s c a l e , f 1 , s c a l e 1 , ,        f s c a l e 1 , s c a l e 1 = X s c a l e 1 : S : s c a l e , s c a l e 1 : S : s c a l e .
Typically, given any original feature map X, the sub-map f x , y consists of all feature maps that form a feature map X(i, j), i + x and j + y that are divisible by scale. Each sub-map down-samples X by a scale factor. Figure 4a–c give an example: when scale = 2, we get four sub-maps, f 0 , 0 , f 1 , 0 , f 0 , 1 , f 1 , 1 , whose shapes are (S/2, S/2, C1), and down-sample X by a factor of two.
We then connect the sub-feature mappings one by one along the channel dimension to obtain a feature mapping X’ that decreases the spatial dimension by a scaling factor and increases the channel dimension by a scaling factor of two.

3.1.3. ECA Attention Mechanism

ECA (Efficient Channel Attention) is a lightweight attention mechanism proposed by WANG et al. [32] to compute the attention weight of each channel in the feature graph. The ECA attention mechanism increases the number of model parameters through the fully connected layer, enabling each channel to be weighted according to its own importance. By introducing channel attention weights, it is able to strike a balance between computational efficiency and model representativeness and enhance feature extraction.
In this study, the dual ECA attention mechanism is used to overlap the training. With the use of a single segment of the ECA attention mechanism, although the accuracy rate is not different from the dual ECA attention mechanism, but the added use of the dual ECA attention mechanism will make the model’s training accuracy to be improved, which lays the foundation for the subsequent application of the model to intelligent agricultural production applications.
As shown in Figure 5, ECA implements a cross-channel interaction without down-scaling. In the ECA (Efficient Channel Attention) attention mechanism, we set the adaptive selection kernel size k to 5 so that its input feature channels are of five different categories, thus presenting five different colored lines. Adaptive selection of kernel size refers to the dynamic selection of the convolutional kernel size in the attention mechanism based on the number of channels of the input features. In this module, the input features are first compressed through the (GAP) layer, which in turn is fed into a one-dimensional convolutional layer for local channel interaction. In turn, it is sent to the Sigmoid function, which then multiplies this output with the input channel by element, and the product result is the output of the ECA module. Among other things, the size of the convolution kernel has a significant impact on the receptive field when performing convolution operations. If the size of the input feature map is large but a small convolutional kernel is used, there is a risk of losing some of the information; the opposite is also inappropriate. The concept of dynamic convolution kernel is introduced in the ECA module, and the size of the convolution kernel can be selected dynamically based on the size of the number of channels. The mapping relationship between the number of channels and the size of the convolution kernel is shown in Equation (1).
k = ψ C = log 2 C γ + b γ o d d
where k represents the convolution kernel size, C represents the channel dimension, and ψ represents the mapping relationship between k and C. t o d d indicates the ntasselest odd number to t, where γ and b are set to 2 and 1, respectively.

3.1.4. GULU Activation Function

GELU (Gaussian Error Linear Unit) [33] is an activation function for deep learning, which is able to preserve the distributional information of the input data and has nonlinear properties by approximating the form of a Gaussian function. It is defined as follows:
G E L U = x P ( X x ) = x ϕ x 0.5 x ( 1 + tanh [ 2 / Π x + 0.047115 x 3 ) ] )
where tanh is the hyperbolic tangent function. GELU is characterized by its approximation as a Gaussian function, which is smooth and nonlinear, as in Figure 6. This allows GELU to map the input data to a continuous range and retains information about the distribution of the input data. Compared to other commonly used activation functions (e.g., ReLU), GELU performs better in some cases. In particular, GELU tends to be better in many natural language processing tasks.

3.2. Evaluation of Maize Male Tassel Density

Male tassel density is an intrinsic property that describes the degree of tightness and compactness of the molecular arrangement of a maize male tassel under a given set of conditions. Density evaluation formulas can help us to compare the density differences between different objects in order to understand their material properties or composition. In the target counting task, the ability to extract features for the image will largely affect the final counting result. With the development of deep learning, the ability of convolutional neural networks to extract features has become more powerful, gradually replacing the manual extraction of features as the current mainstream research method. The density estimation algorithm based on convolutional neural network mainly learns the nonlinear mapping between the input image and the corresponding density map, feeds the input image into the density estimation network, and then automatically generates and outputs the corresponding predicted density map. Compared to the traditional method, the convolutional neural network-based method has higher counting accuracy and better results.
In this study, maize male tassel density d was estimated by Equation [34]:
d = N S
where N is the number of maize male tassels and S is the area hm2 of the detection area and the estimation of maize male tassel density based on the ESG-YOLO model.

4. Experimental Results and Analysis

4.1. Experimental Equipment and Parameter Settings

The operating environment for this test is a Dell Tower Workstation (Dell, Inc.; Londrock, TX, USA). The operating system environment is Windows 11, the processor is a 12th Gen Intel(R) Core(TM) i5-12500 3.00 GHz, and there are 32 G of machine-banded running memory, with a 1 TB SSD. The graphics card is an NVDIA GeForce RTX 3080 with 10 GB of video memory, in addition to 10 GB using GPU-accelerated computing. The software environment consisted of Python 3.9.13, PyTorch 1.7.0, Torchvision 0.8.2, and CUDA 11.0.
Iterative training of this model with the constructed training set is shown as the training curve of the optimized model in this study, with two different kinds of losses in this training process, frame loss and target loss, where box loss indicates the extent to which the predicted box covers the calibrated box and target loss indicates the probability that the target exists in the region of interest. As can be seen from the figure, the above losses decrease rapidly in the early stages of training. In addition, Figure 7 shows the precision, recall, and average precision of the model during the training process. As can be seen from the figure, the model improves rapidly in terms of precision, recall, and average precision, and the curve starts to flatten out after 300 iterations, and the model stops after 500 iterations.
In this paper, we evaluate the performance of the model in terms of precision, recall, F1 score, and accuracy, as shown in Equations (3)–(7), where TP denotes the number of correct positive samples, FP denotes the number of negative samples predicted as positive samples, and FN denotes the number of positive samples predicted as negative samples.
Accuracy is the proportion of positive samples in the validation sample. The formula is calculated as in the following equation:
P r e c i s i o n = T P T P + F P
Recall is the proportion of validated samples that accurately predict positive samples and is calculated as in Equation (4):
R e c a l l = T P T P + F N
The F1 metric is the reconciled average of accuracy and recall, which serves to synthesize the accuracy and recall, and is calculated by the following equation:
F 1 = 2 · P r e c i s i o n · R e c a l l P r e c i s i o n + R e c a l l
The mAP is the area enclosed by the graph plotted on the y-axis for accuracy and the x-axis for recall based on the PR curve, calculated by the following equation:
A P = i = 1 n 1 r i + 1 r i p i n t e r p r i + 1
m A P = Σ = 1 K A P i K
Precision and recall complement each other and are evaluation metrics for binary classification problems, used to measure the accuracy and coverage of the model, and more intuitively reflect the degree of goodness of the model’s performance during the experiment. The harmonic mean combines precision and recall, and it is used to comprehensively evaluate the performance of the model, especially for unbalanced datasets. Average precision, on the other hand, is a key metric in modeling applications and is related to precision but is more concerned with ranking quality and average accuracy.

4.2. Comparison of Attention Mechanism Training

In order to verify the optimization effect of different attention mechanism modules for ESG-YOLO, seven different attention mechanism modules are selected in this paper, namely, the ECA attention mechanism module, simAM attention mechanism module [35], CBAM attention mechanism module [36], GAM attention mechanism module [37], SK attention mechanism module [38], SE attention mechanism module [39], and CA attention mechanism module [40]. The ECA, SE, CA, simAM, CBAM, GAM, and SK modules are sequentially added to the backbone feature network part in YOLOv7 to obtain the YOLOv7 + ECA, YOLOv7 + SE, YOLOv7 + CA, YOLOv7 + simAM, YOLOv7 + CBAM, YOLOv7 + GAM, and YOLOv7 + SK networks. The algorithmic precision, recall, F1, and A_P values are compared under different attention mechanisms, respectively, and the results are shown in Table 1.
As can be seen from Table 1, the model after the introduction of the attention mechanism has a significant improvement in all parameters, and the coordinate attention improvement module has a significant contribution to the network, in which the average precision of the YOLOv7 network before the improvement is 90.8%, and the average precision of the YOLOv7 + ECA network after the improvement is 92%, which is an improvement of 1.2 percentage points, and its precision, recall, and F1 are improved by 3.3, 1, and −1 percentage points, respectively; this network structure reconciles the decrease in average value, which indicates that the accuracy and coverage have relatively positive improvements. Values of 3.3, 1, and −1 percentage points indicate that this network structure reconciles the decrease in the average value with a relatively positive increase in accuracy and coverage, resulting in a significant increase in the average precision; the average precision of the YOLOv7 + simAM network is 91.4%, which is an increase of 0.6 percentage points, but the network structure has an increase in the accuracy but insufficient performance coverage, and its precision rate, recall rate and F1 are improved by 7.2, 0, and 0 percentage points, respectively. The average precision of the YOLOv7 + CBAM network is 91.9%, an increase of 1.1 percentage points, and its precision rate, recall rate, and F1 increase by 2.9, 2, and 0 percentage points, respectively, which improves the accuracy and coverage of the network structure, and the average precision increases accordingly; the average precision of the YOLOv7 + GAM network is 90.9%, an increase of 0.6 percentage points, but this network structure has improved accuracy but insufficient performance coverage, 90.9%, an improvement of 0.1 percentage points. Its precision, recall, and F1 are improved by 4.6, 0, and 0 percentage points, respectively, and only accuracy is improved in this network structure; the average precision of the YOLOv7 + SK network is 90.7%, which is reduced by 0.1 percentage points, and its precision, recall, and F1 are improved by 7.6, −1, and 0 percentage points, respectively, and the accuracy is improved significantly in this network structure, but the coverage is decreased, which leads to the average precision also decreases, while YOLOv7 + SE and YOLOv7 + CA present poor performance results. The experimental results show that in addition to the SK, CA, and SE attention mechanism modules, the introduction of the coordinate attention mechanism has good results for the extraction of maize male cob feature information, proving the effectiveness of adding the ECA attention mechanism to YOLOv7.
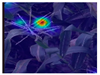
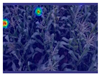
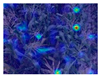
Heat map visualization of the detection process of the network models with the addition of seven types of attention mechanisms is shown in Table 2. After the addition of the attention mechanisms, the attention of each network model becomes broad and deep, and under the single-strain heat effect, SK, CA, and SE are slightly less effective compared to ECA, SimAM, CBAM, and GAM. The GAM attention mechanism is slightly worse than ECA, SimAM, and CABM under the dual-plant thermal effect, while ECA is more effective compared to the SimAM and CBAM attention mechanisms under dense, sparse, and weak light conditions. The experimental results and visualization show that adding the ECA attention mechanism to the network model can effectively improve the detection accuracy of the overall network.
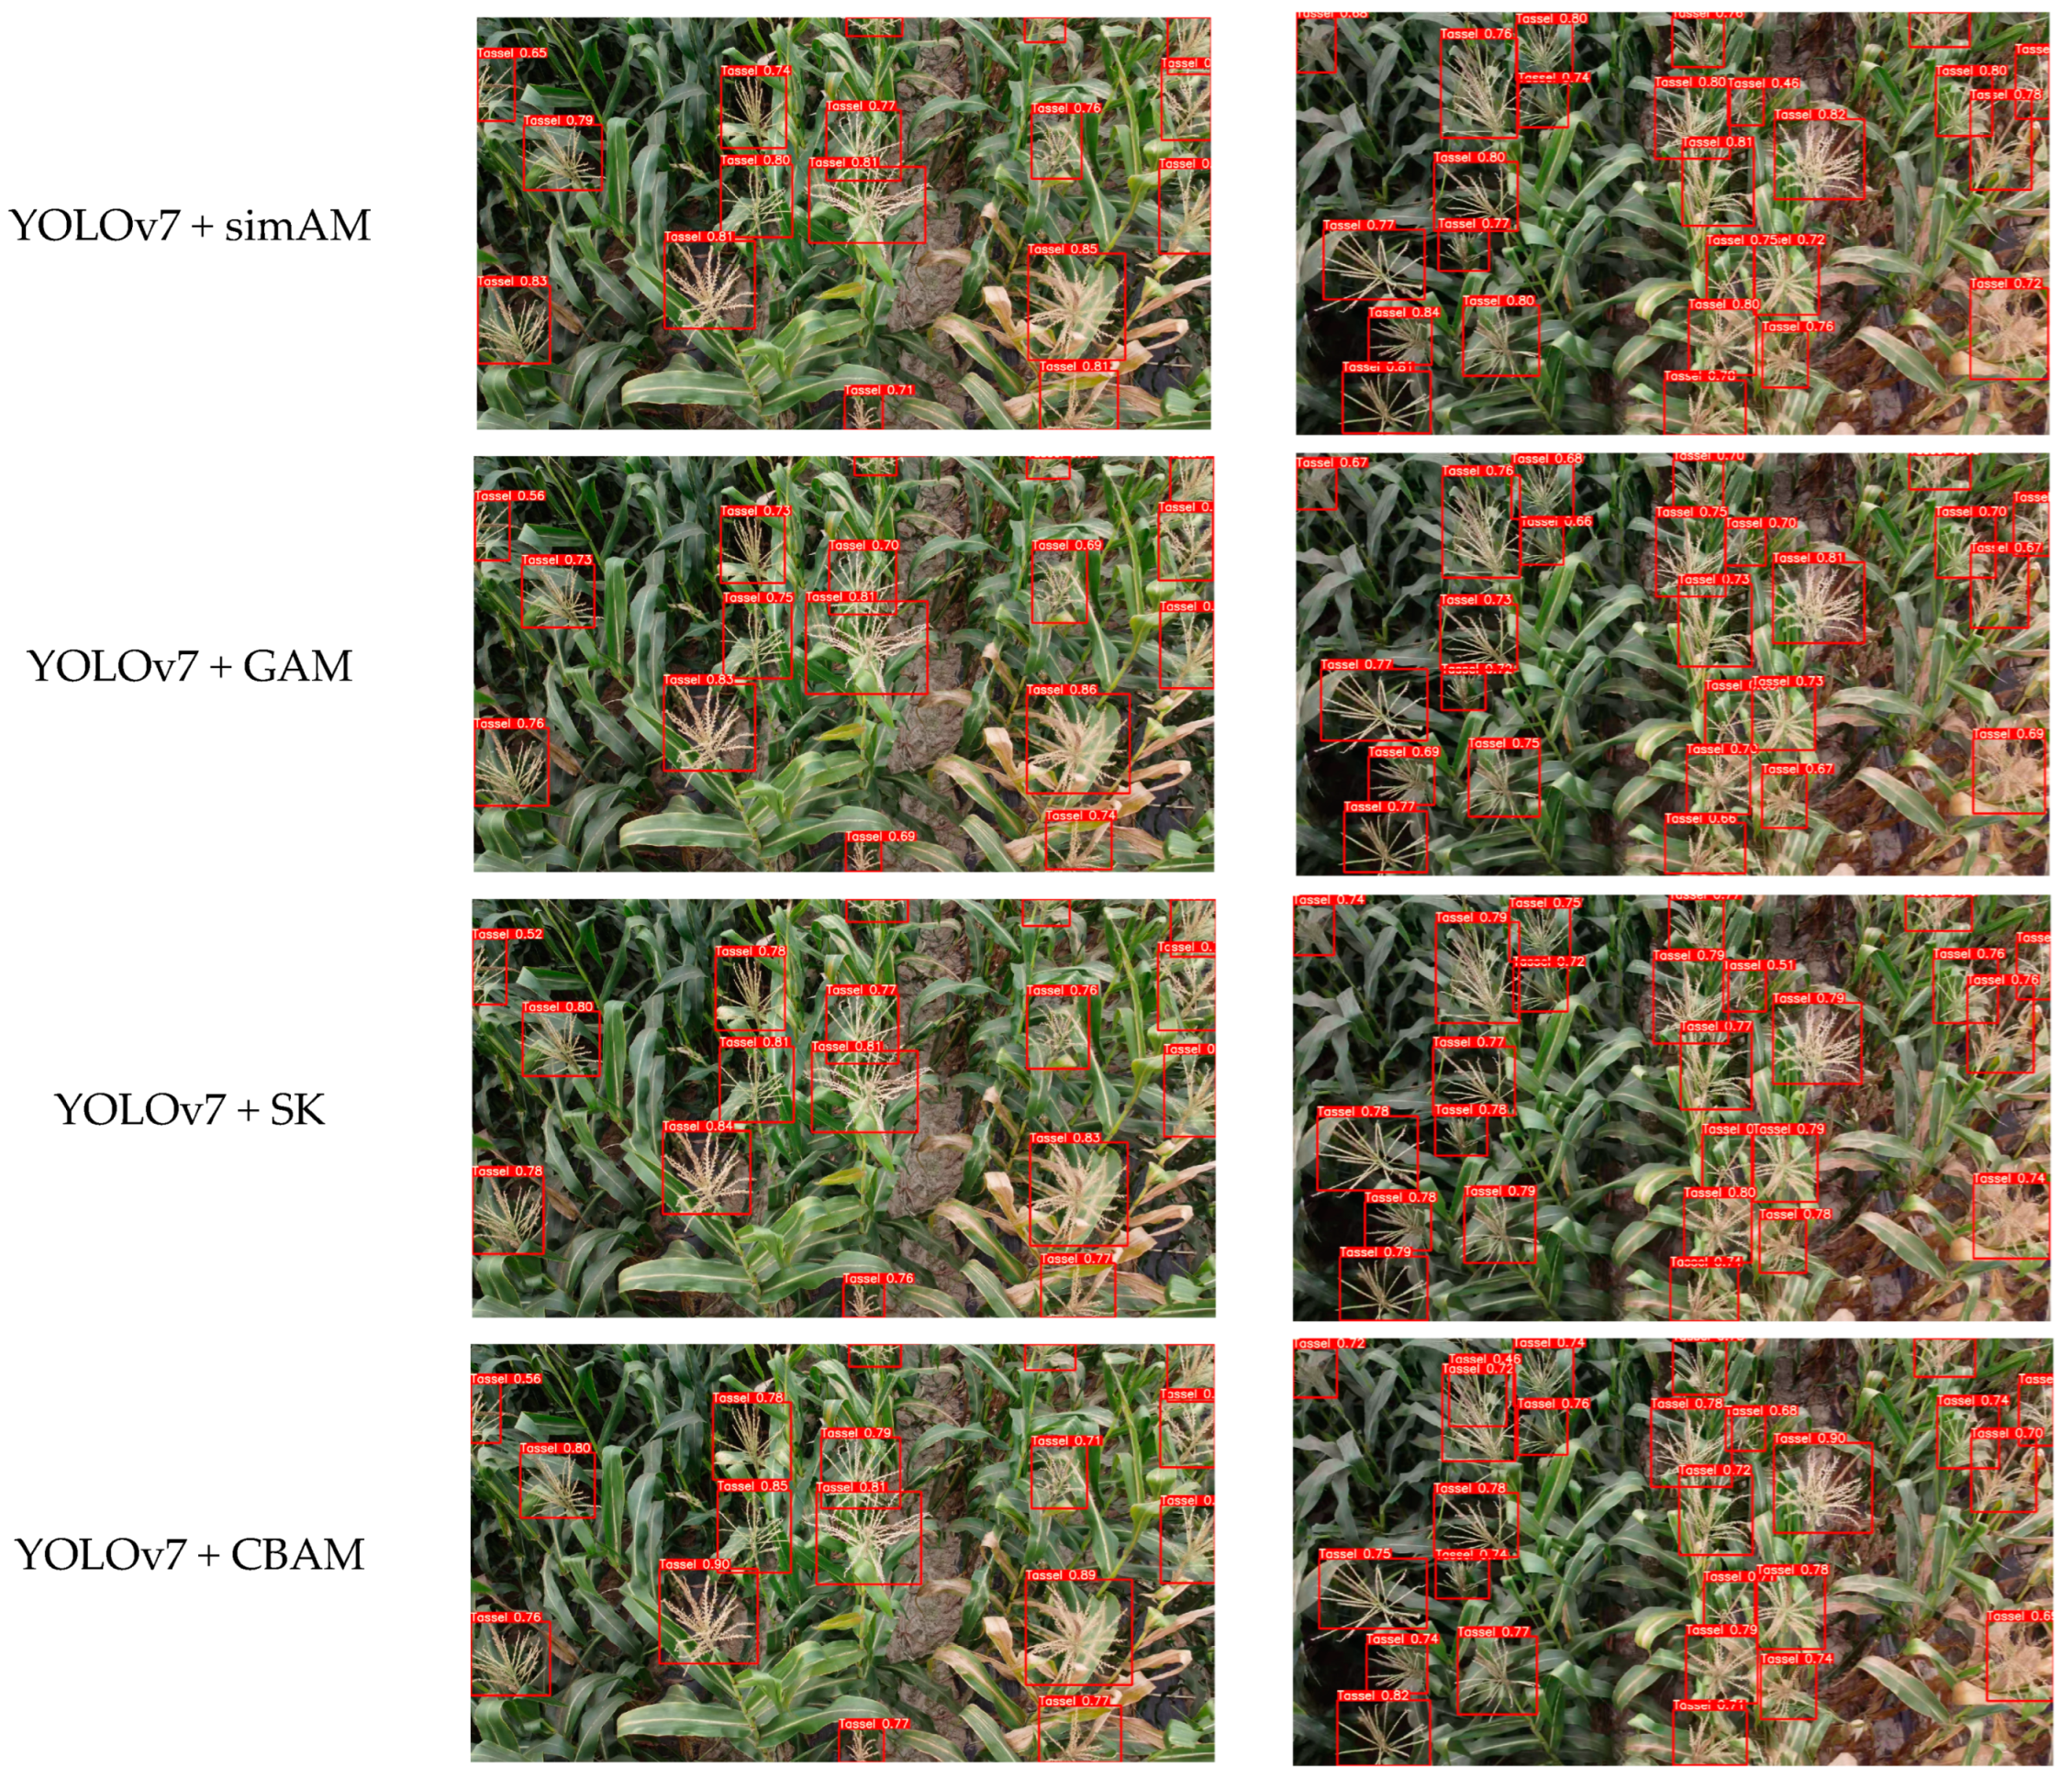
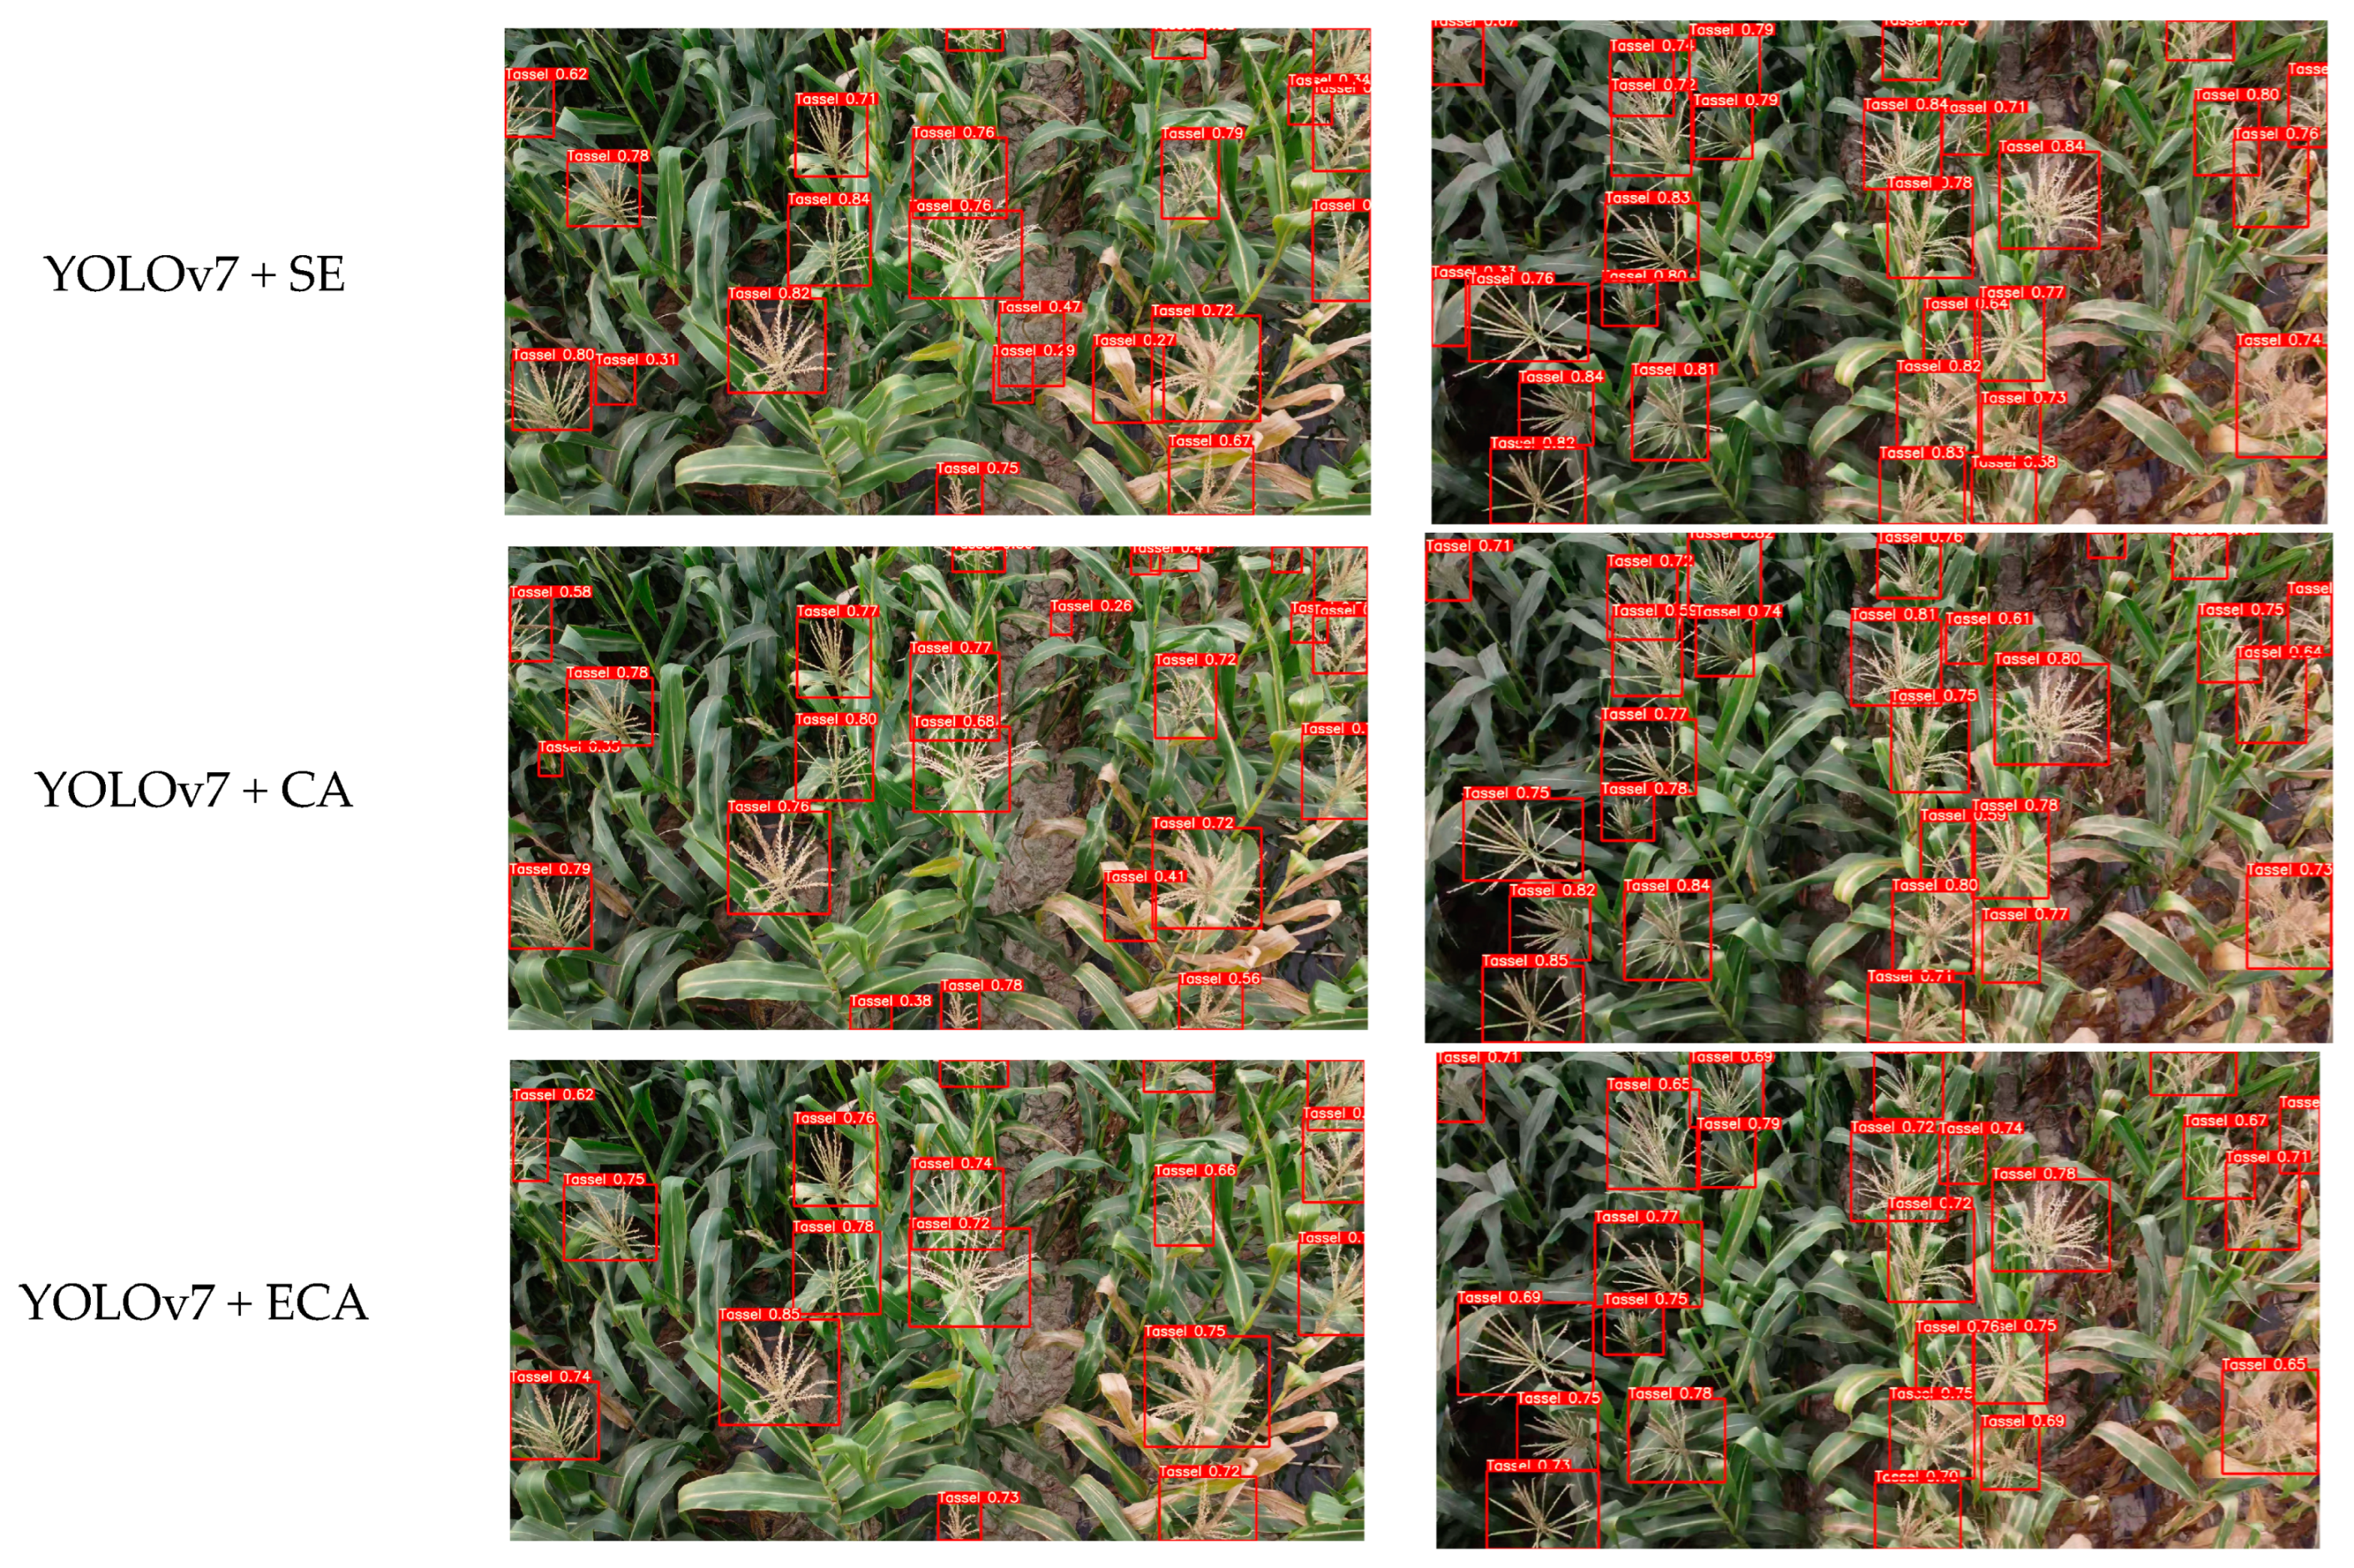
As shown in Figure 8, there is a significant difference in the detection effect after adding the attention mechanism module, and for the cluttered environment in the field, the detection effect of adding the ECA attention mechanism module in the network model is better.

4.3. Ablation Experiment

Ablation experiments are performed on the constructed dataset and the results are shown in Table 3. YOLOv7 is used as the benchmark model in this experiment. Comparisons were made with the following improved models, respectively: adding the SPD-Conv network module to YOLOv7; adding the ECA attention to YOLOv7; using GELU as the activation function instead of SiLU, the original activation function of YOLOv7; and YOLOv7’s addition of the SPD-Conv network module and ECA based on the alteration of the activation function to GELU. The attention mechanism module is a way to verify the significance of each module. As shown in the table, after replacing the backbone with a network, [email protected] increased by 0.6 percentage points compared to YOLOv7, and [email protected] improved by 1.2 percentage points after adding the attention mechanism to YOLOv7. The ECA attention module enhances the distinguishable feature information in the image features and improves the robustness of the model to extract features. The increase in the number of participants is only less than 0.01, which is due to the fact that the ECA attention module itself is also lightweight; when the activation function was replaced with GELU in the YOLOv7 model, the recall was improved. And after modifying the activation function to GELU in yolov7 and adding the SPD-Conv trunk and ECA attention mechanism module, the [email protected] improved by 2.3 percentage points. Finally, an ECA attention mechanism is added on top of YOLOv7 + ECA + SPD + GELU to obtain the final model with a dual ECA attention mechanism, which is 7.3 percentage points more accurate than the single ECA attention mechanism and provides better loading fault tolerance for subsequent future lightweight applications. In the comprehensive analysis, the improved model is superior to other models.

4.4. Comparison of Different Algorithms

To evaluate the ESG-YOLO model, it was compared with four advanced target detection models: namely, YOLOv5, YOLOv7, MobileOne-YOLOv7 [41], and Ghostnet-YOLOv7 [42]. The detection results of each model are shown in Table 4. Compared with the compared models, the improved model has some advantages in terms of [email protected] and the number of parameters. Especially in terms of the number of parameters, the improved model adds the SPD-Conv network module, which makes the overall model more accurate for the small target detection layer. The comparison shows that the proposed ESG-YOLO is the most accurate and stable for the detection of maize male tassels in complex environments.
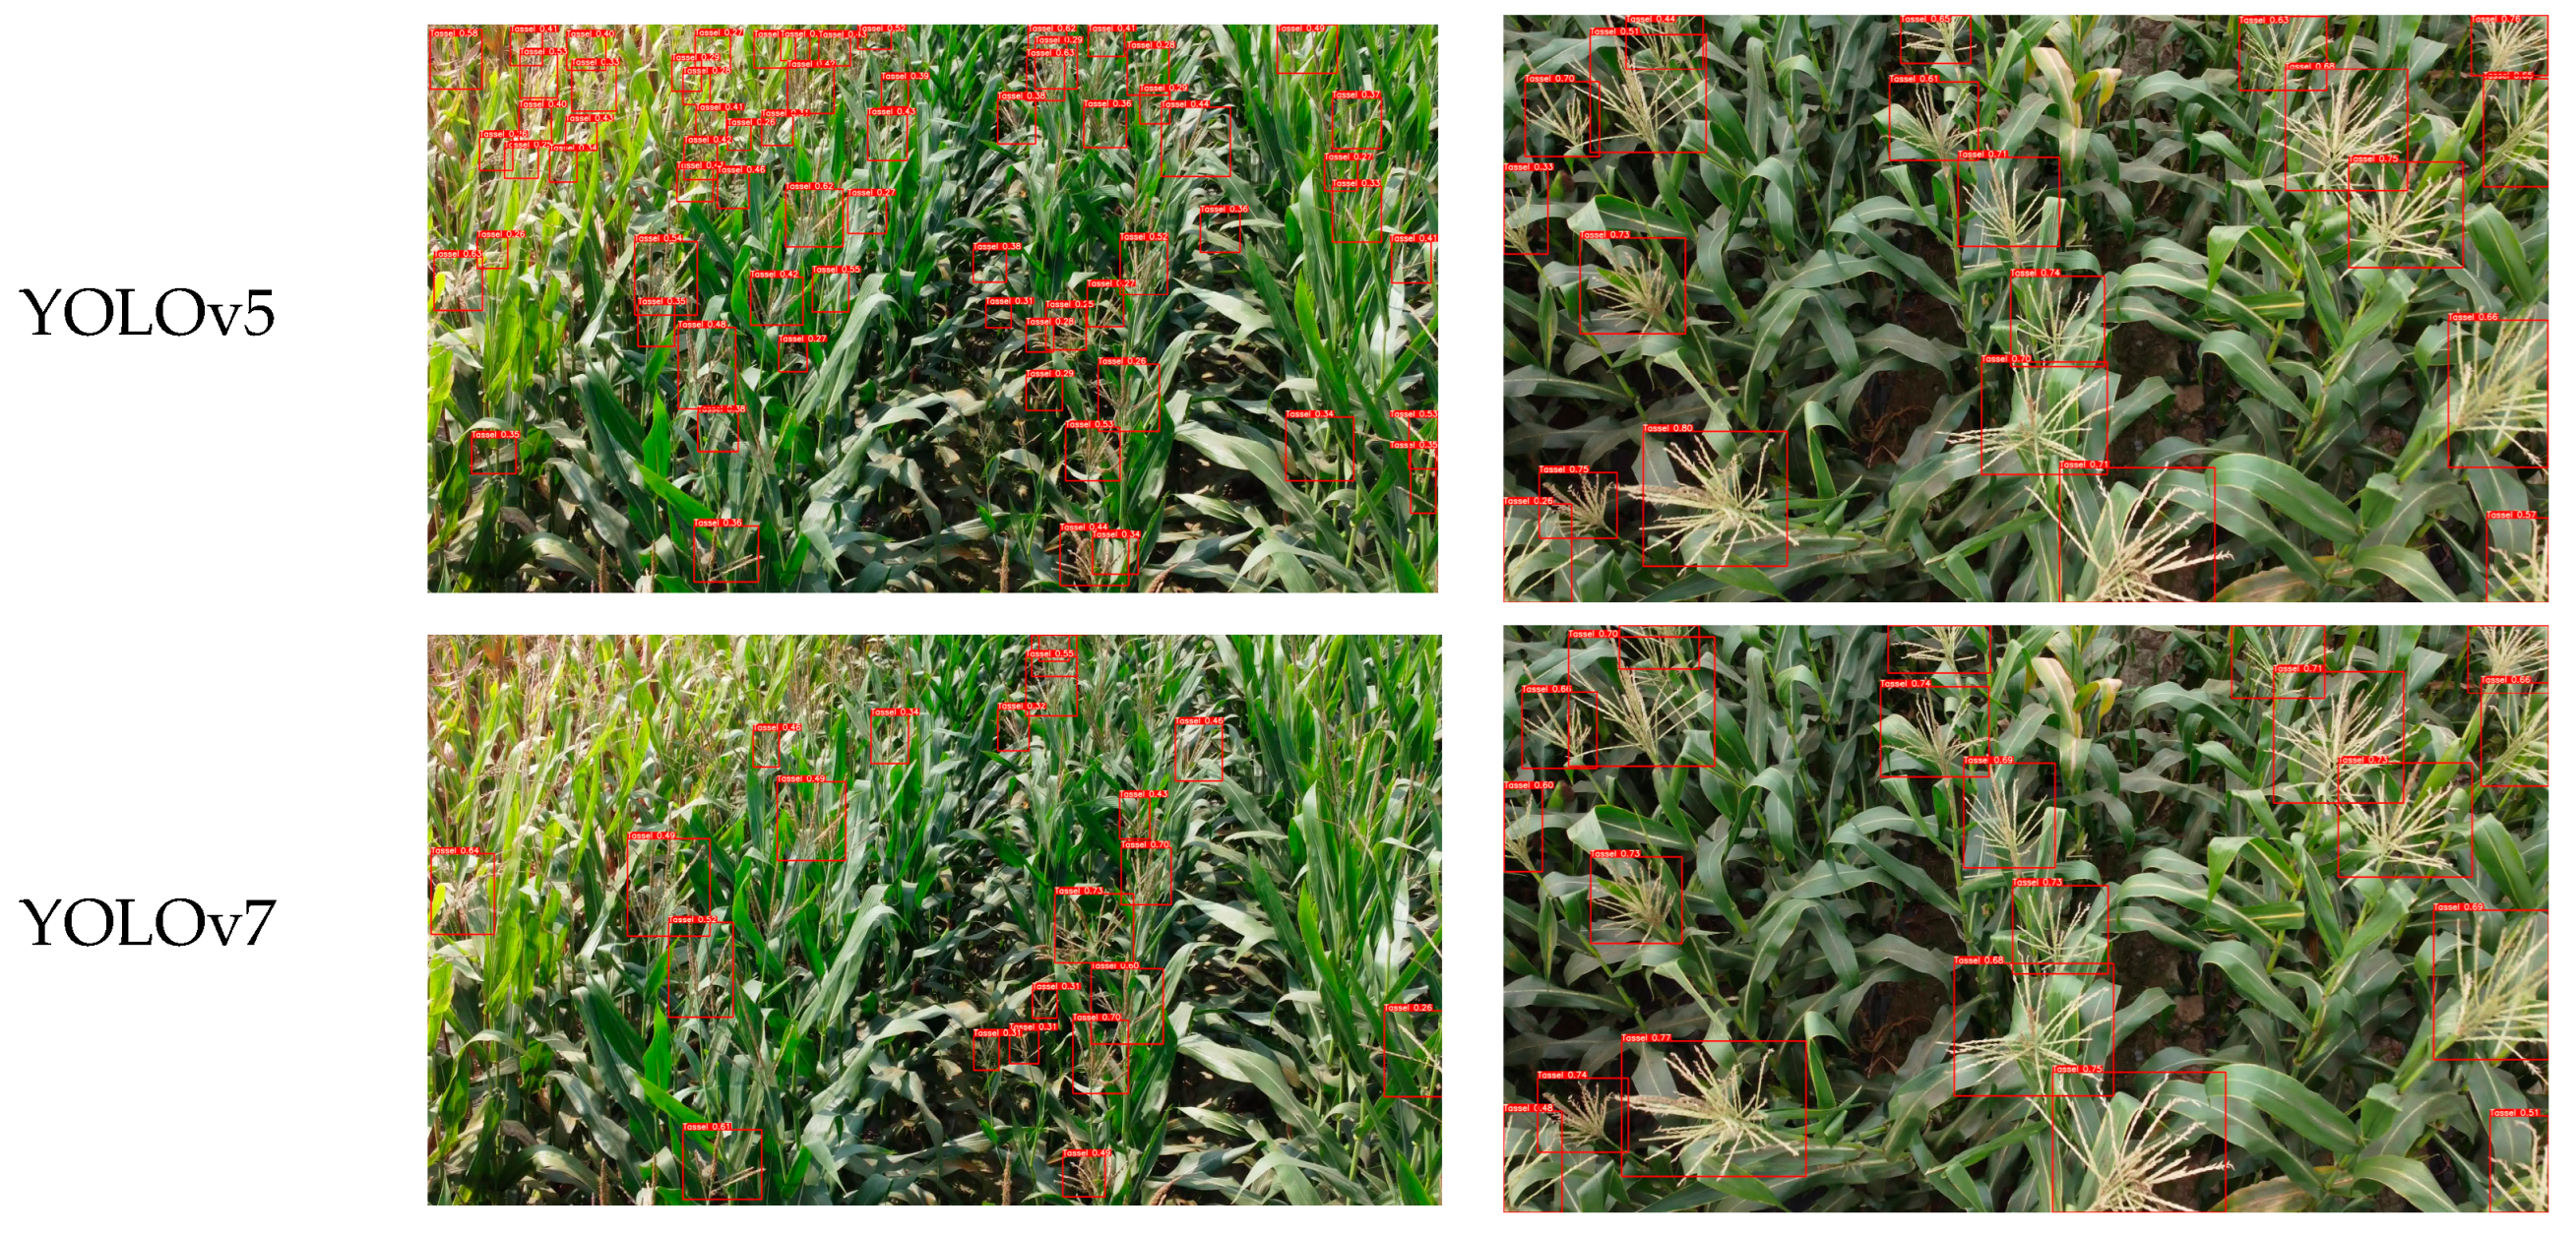
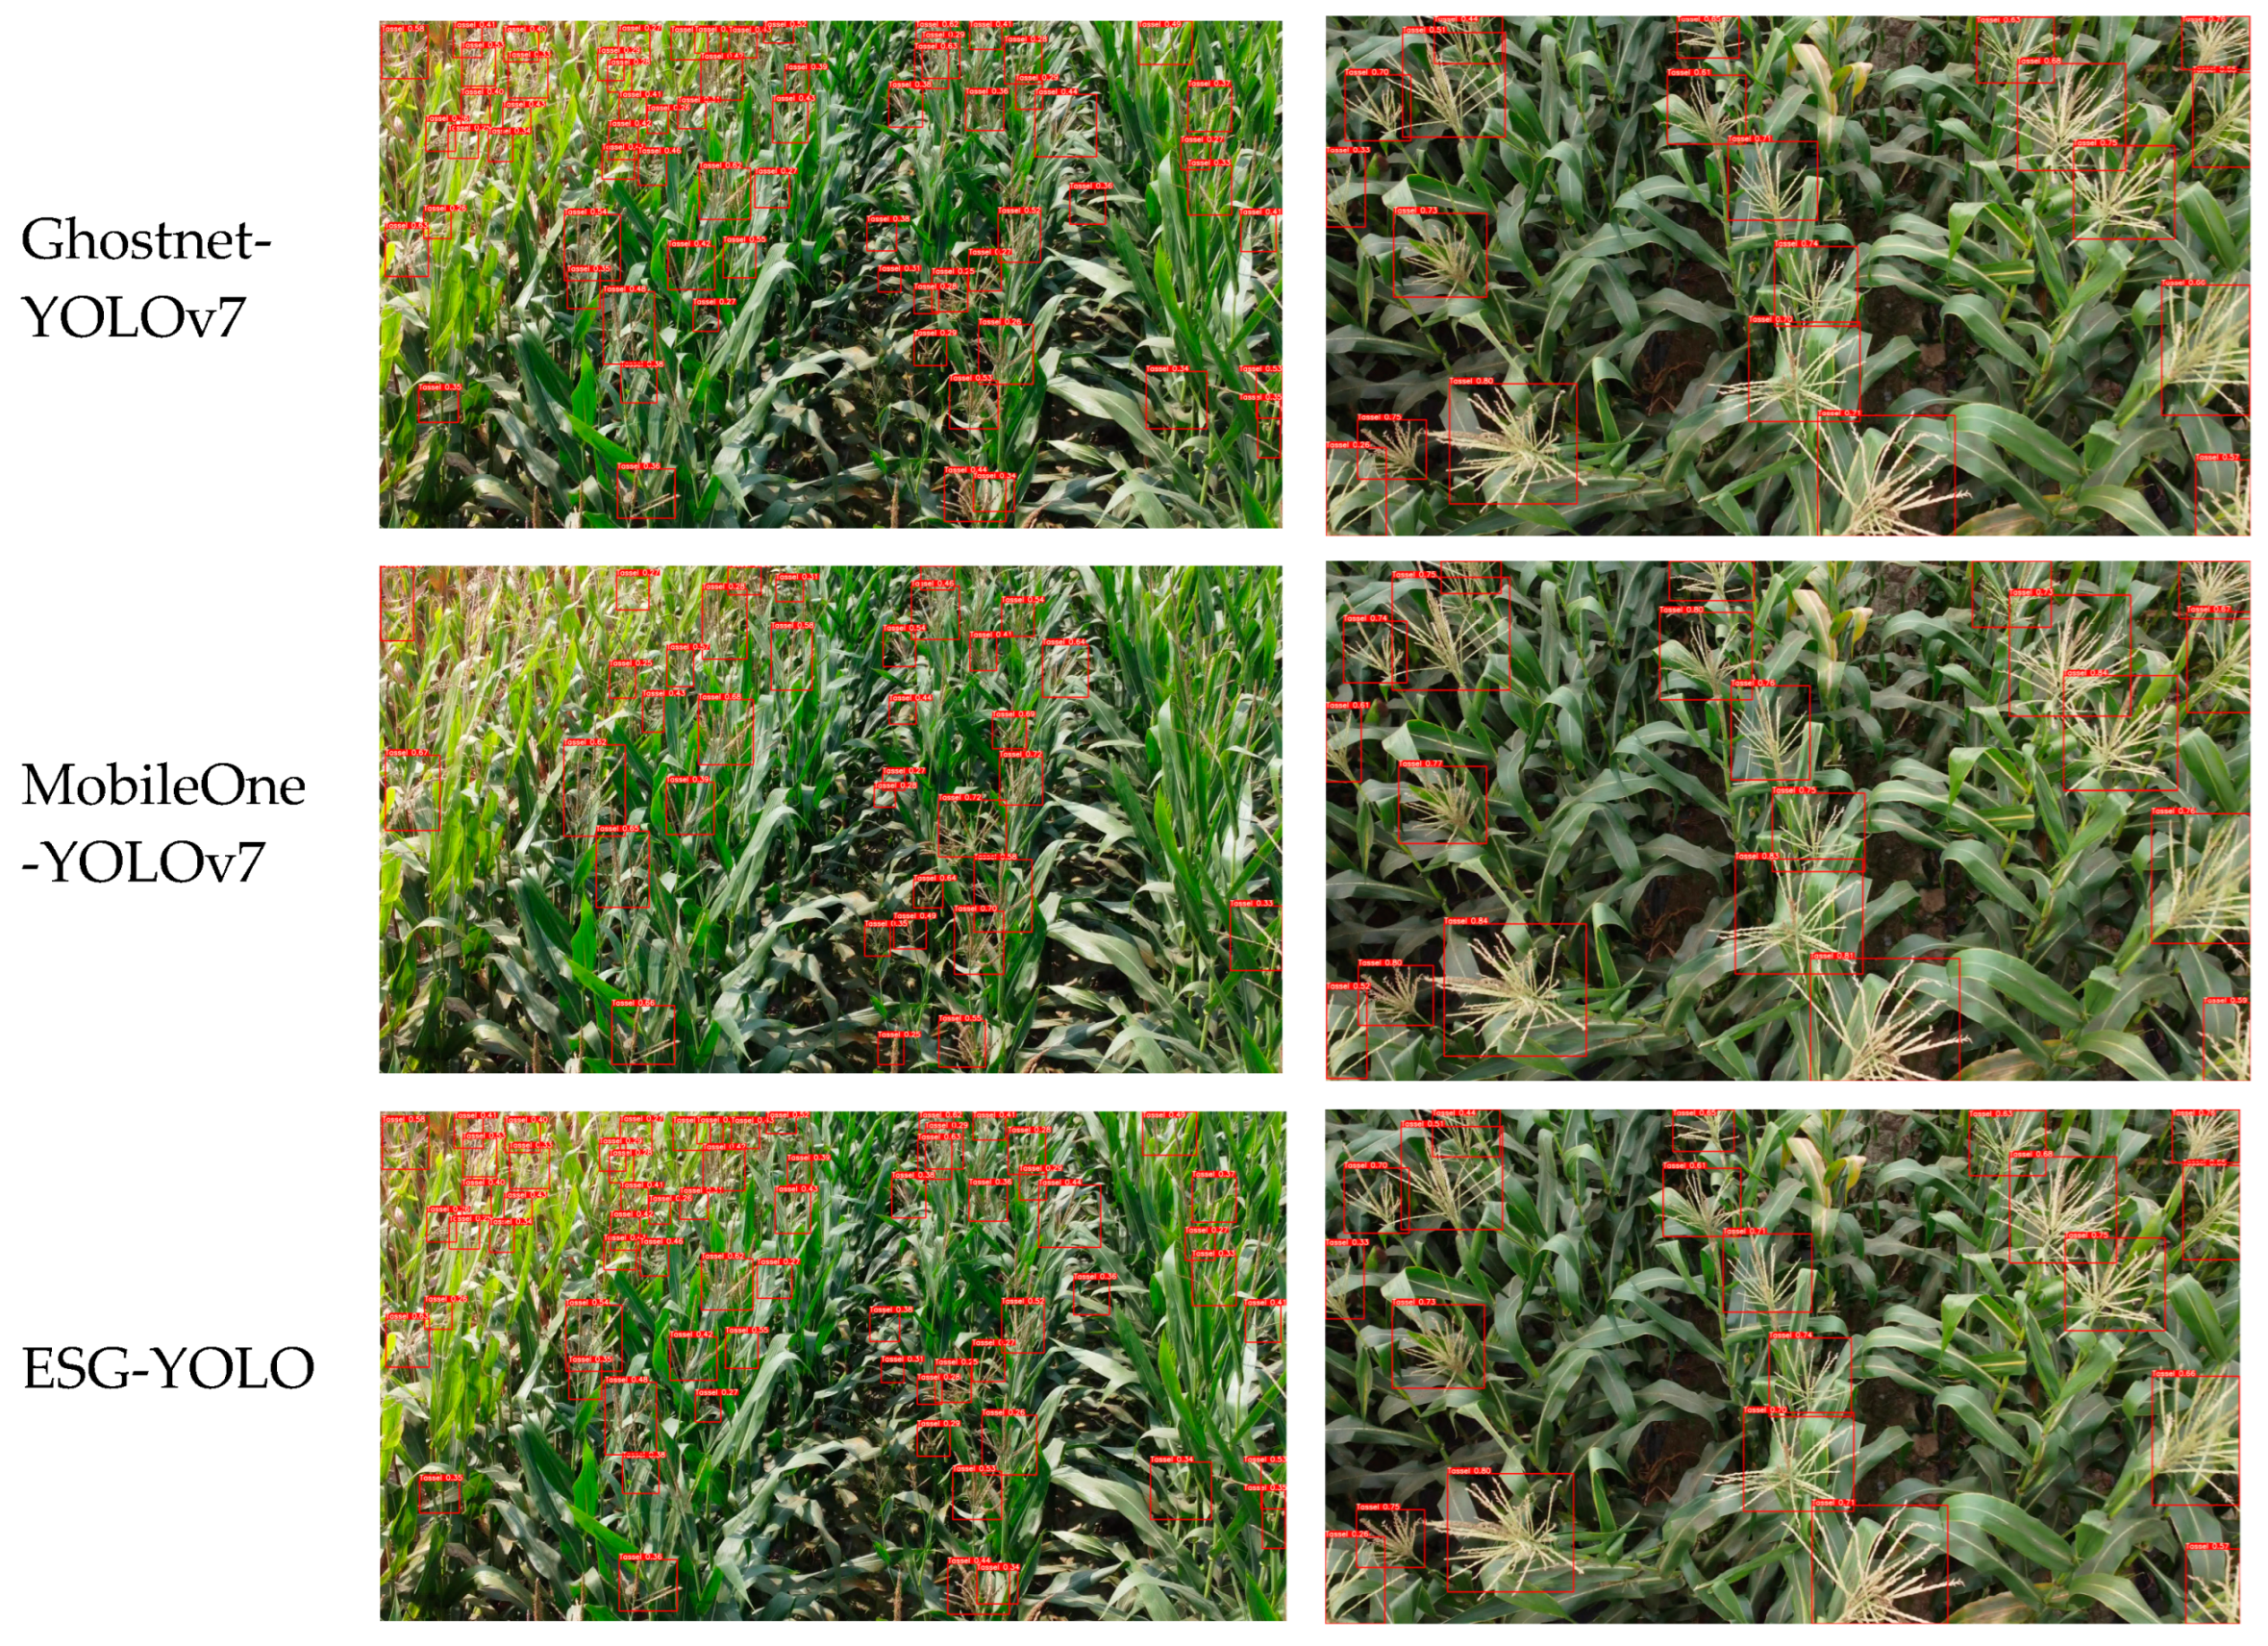
As can be seen in Figure 9, from the comparison of the various models, YOLOv5 and YOLOv7 are detected slightly lower than the other models, while Ghostnet-YOLOv7 and MobileOne-YOLOv7, two lightweight version of the YOLO model, there is a certain amount of misdetection, so after a comprehensive comparison of the test, the detection of ESG-YOLO is the most effective.

4.5. Test Results of Variety and Density

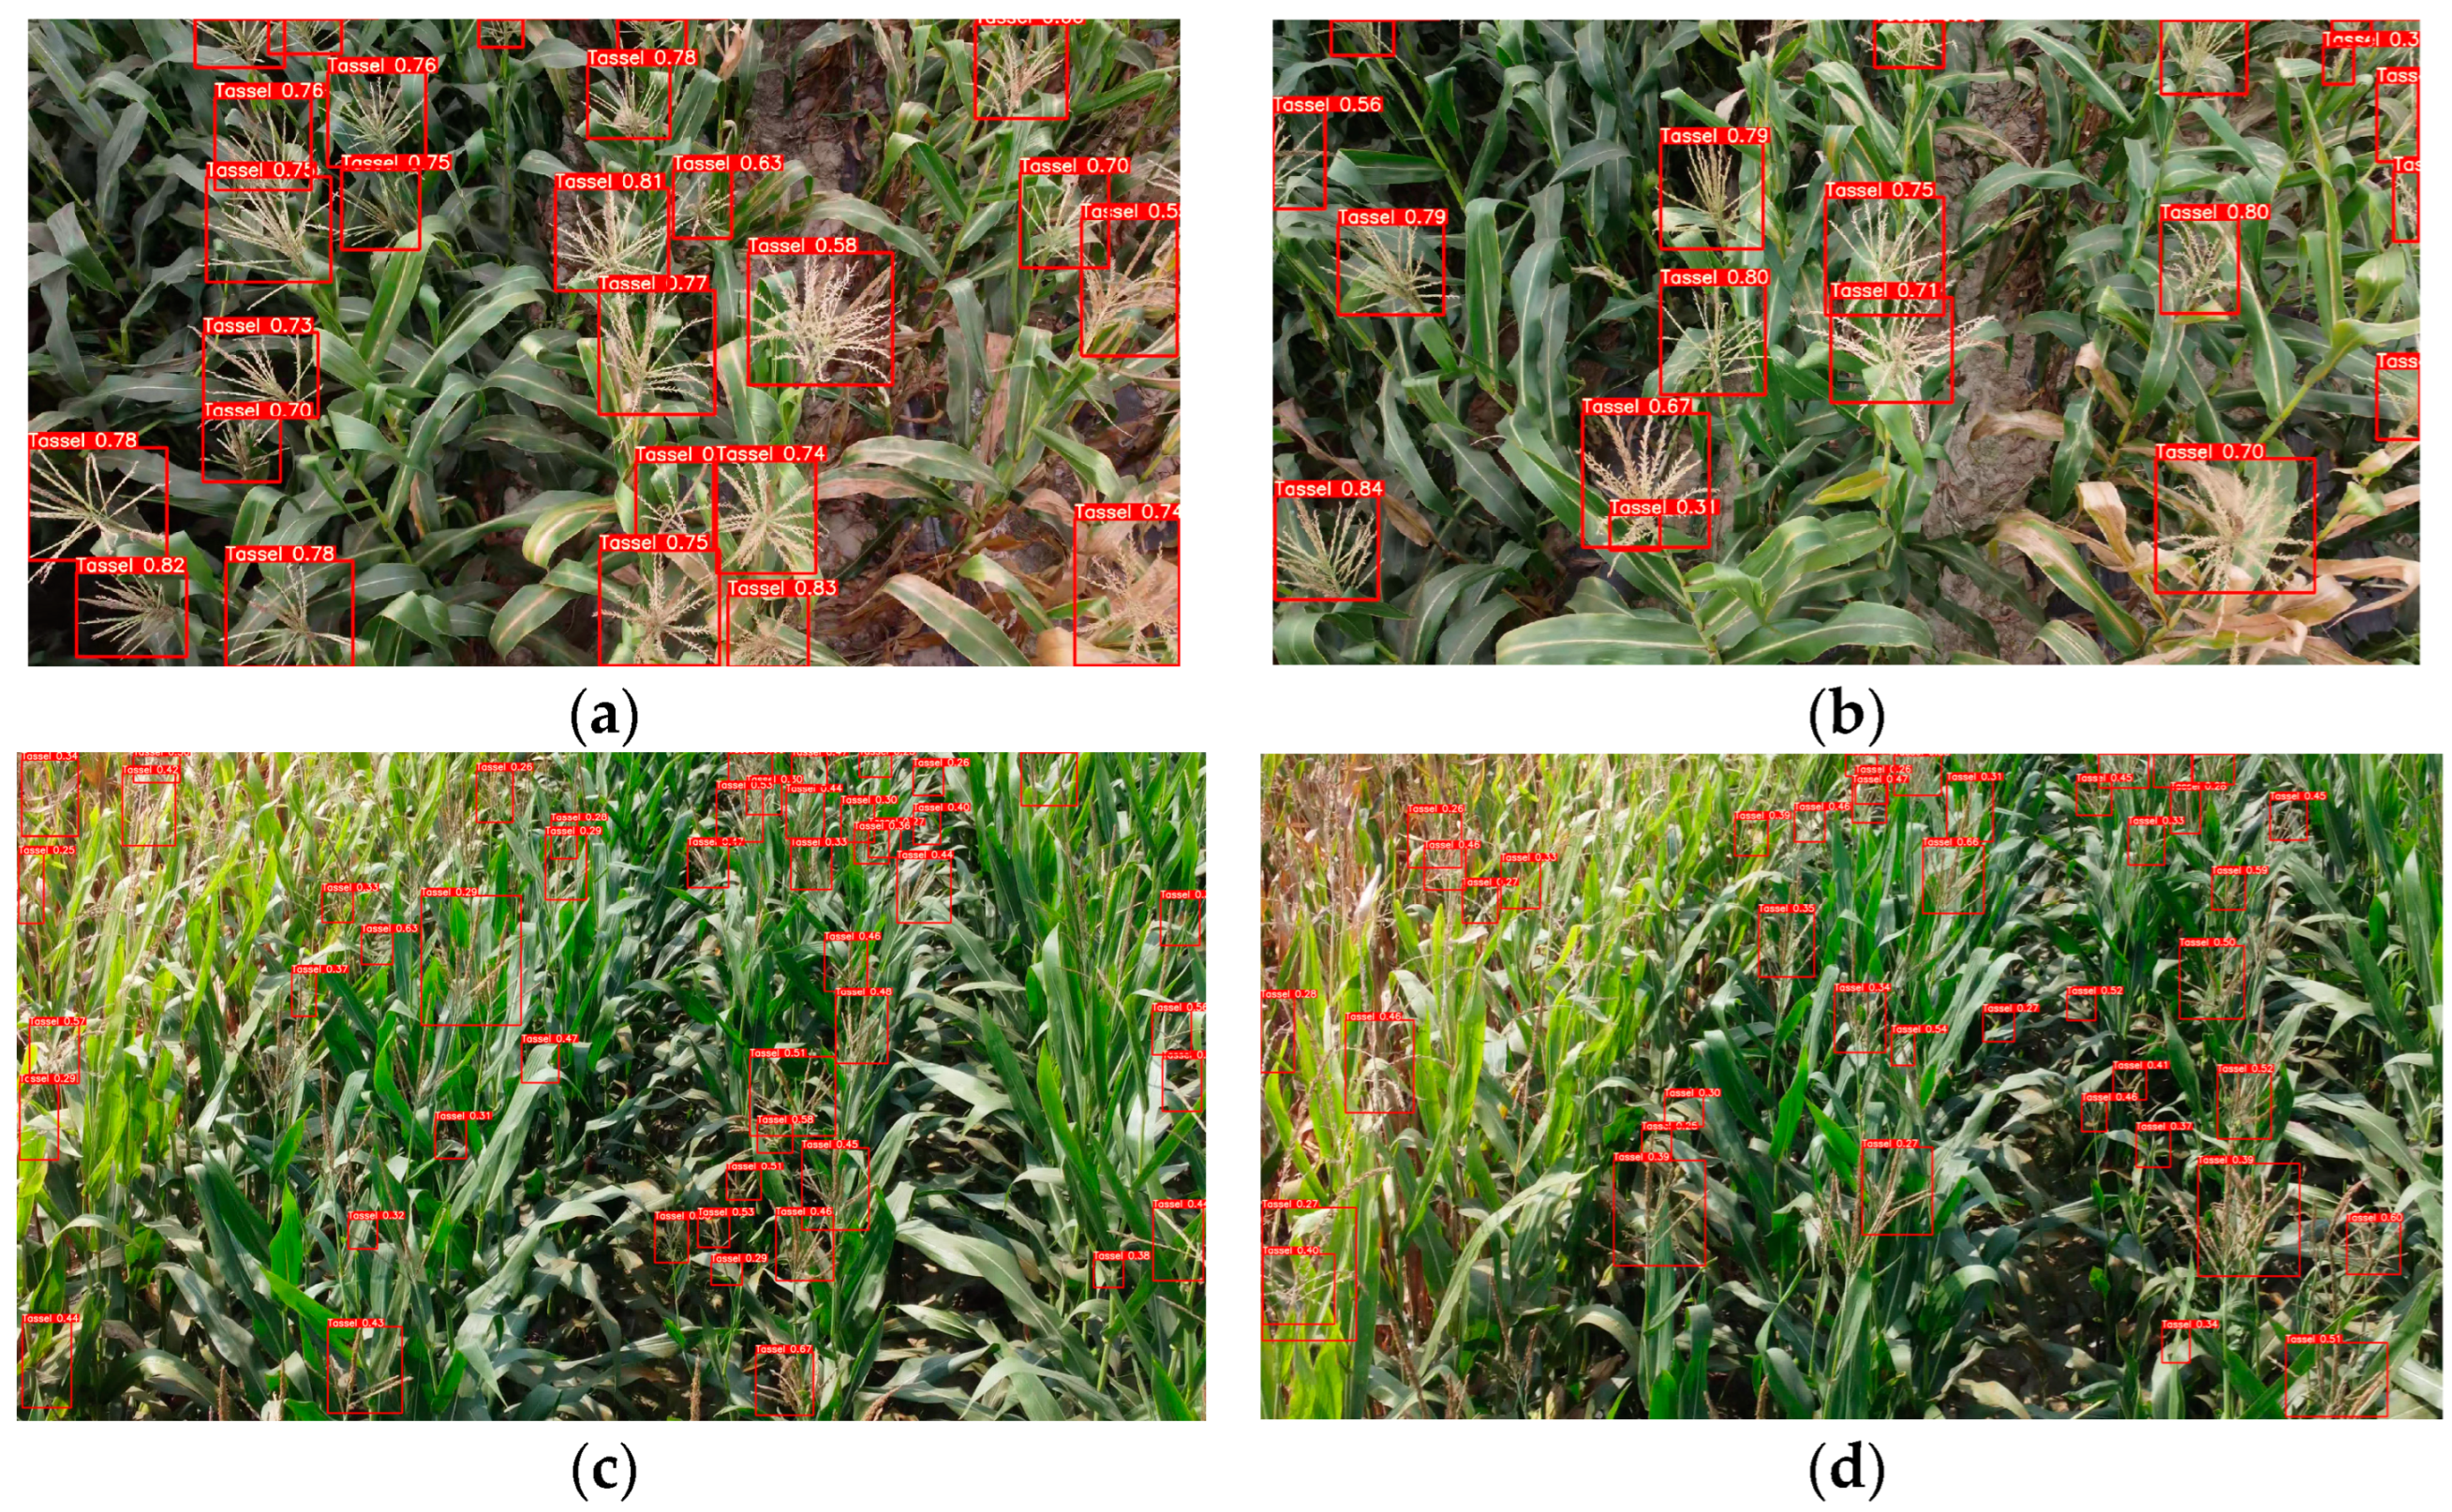
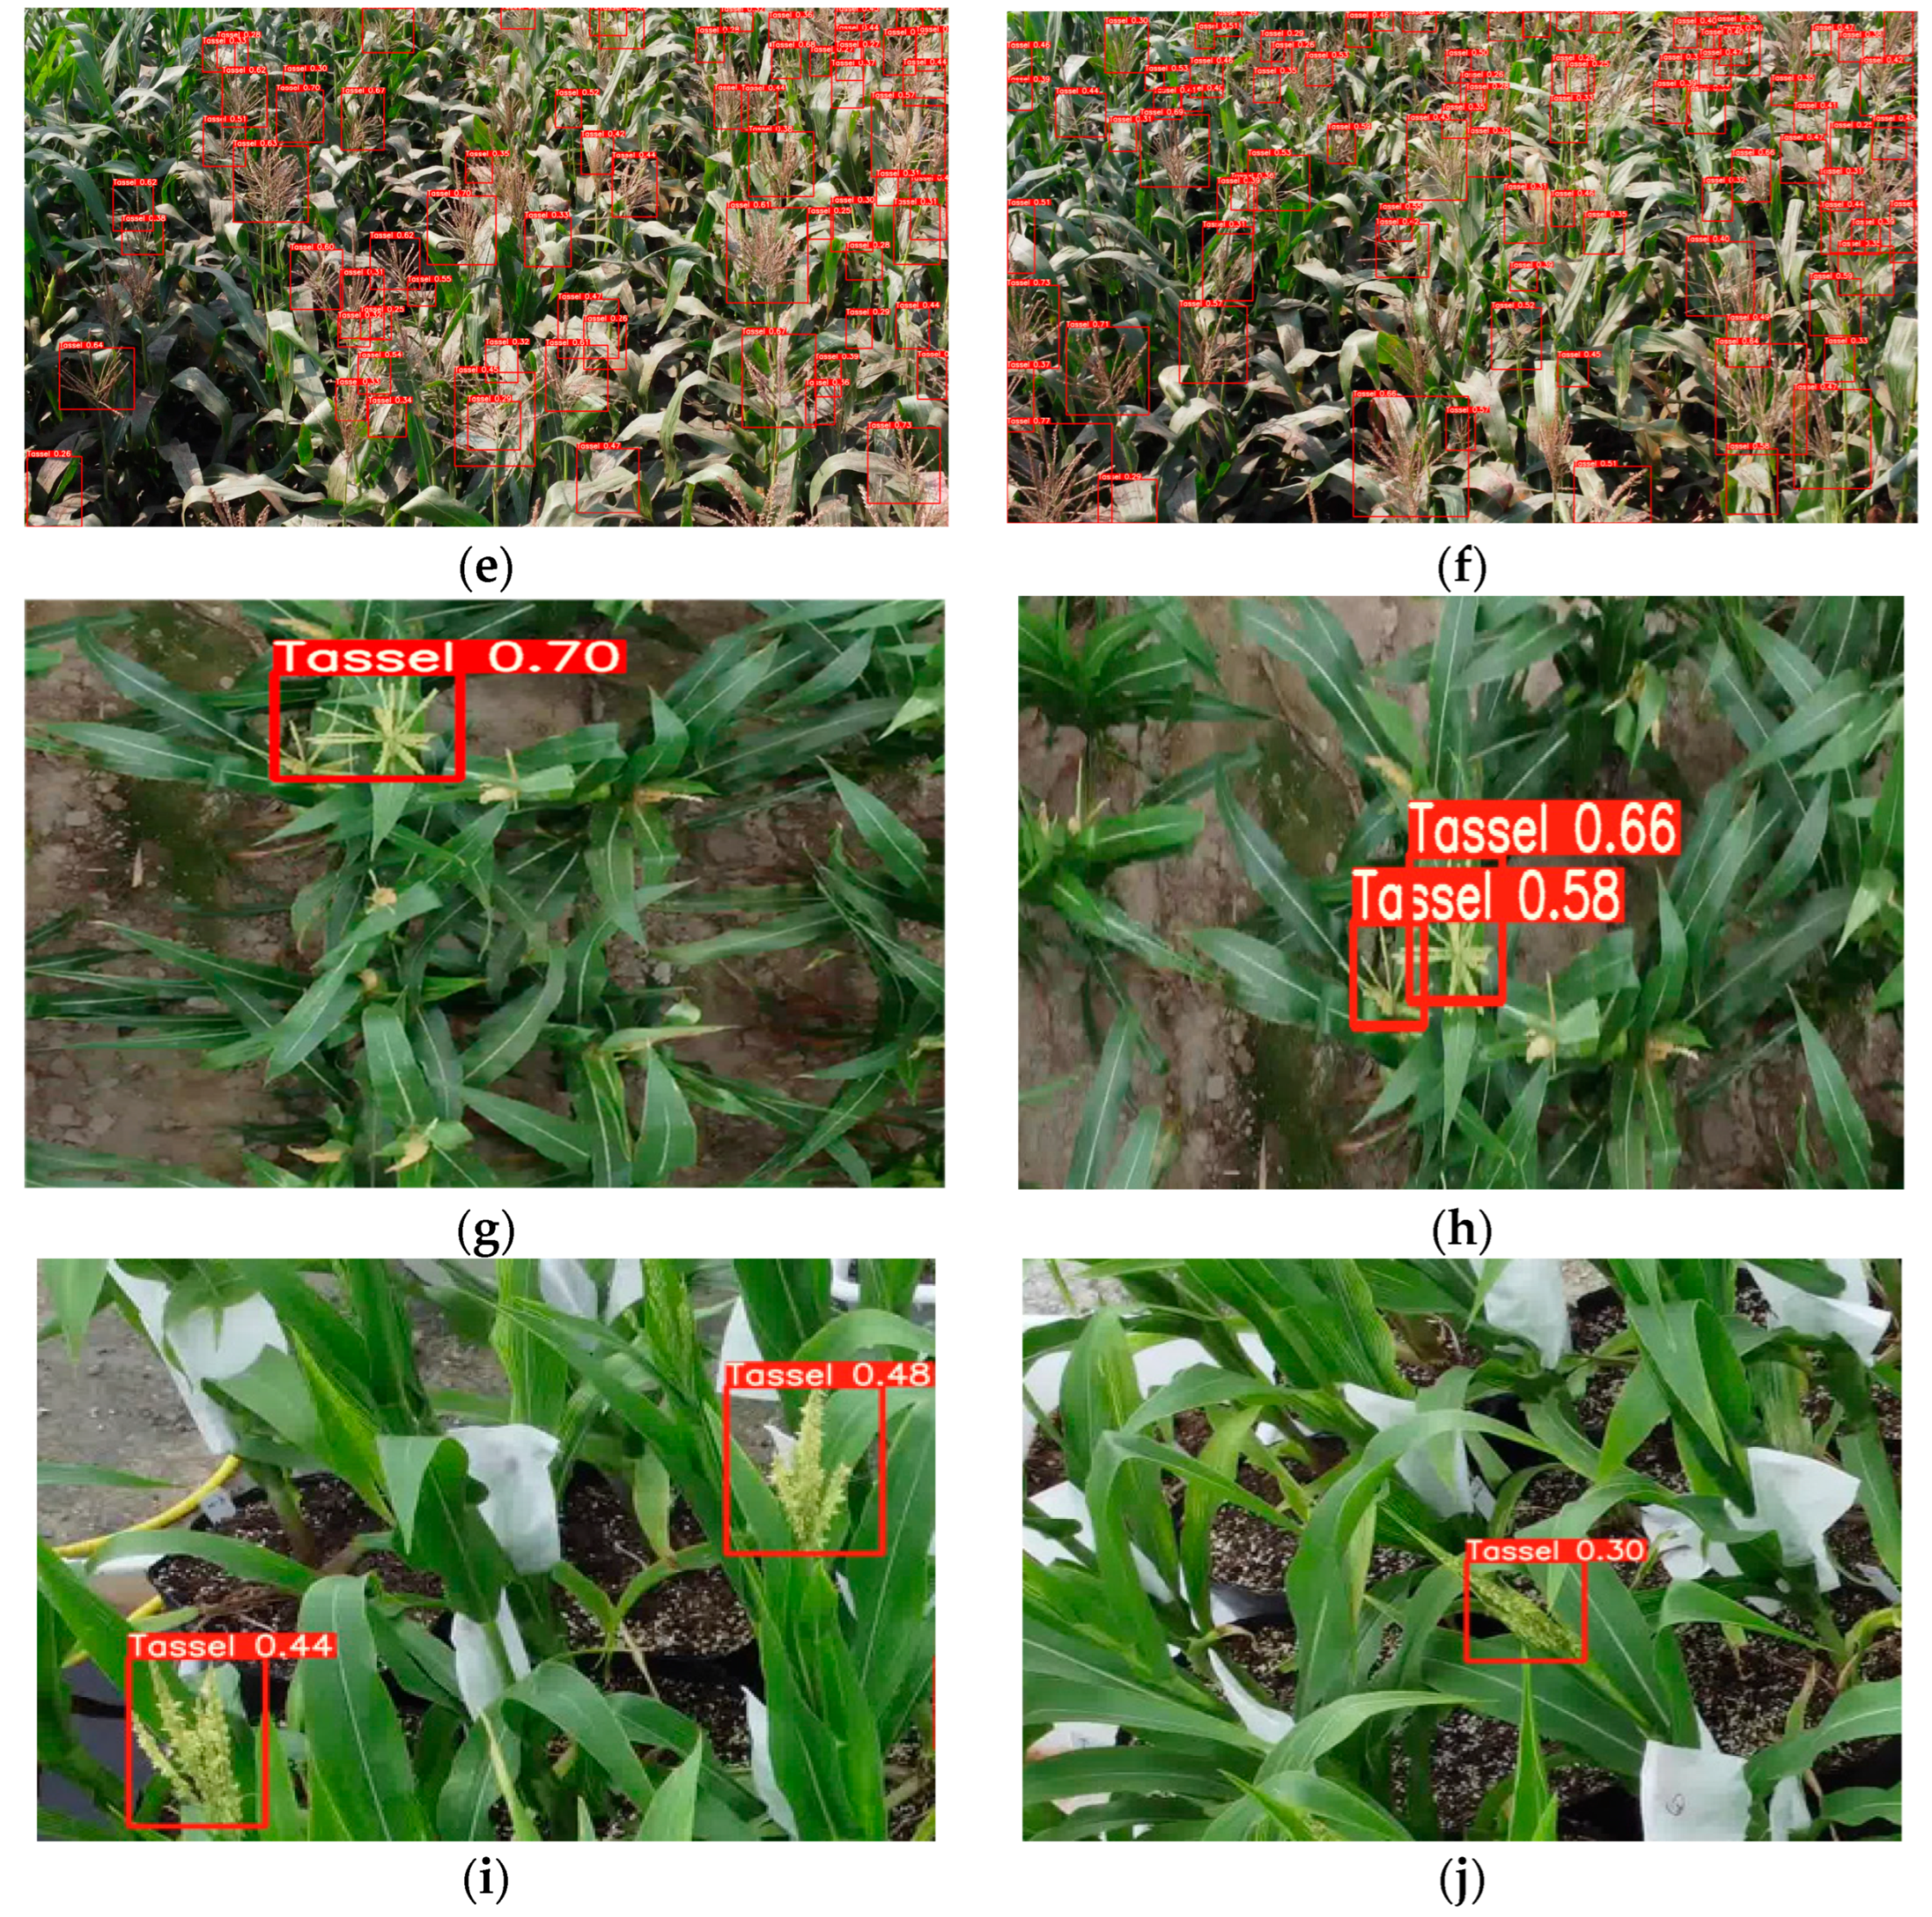
The field environment is complex and varied, and corn male detection often encounters problems such as the situation of shading, the influence of strong light, the density of growth, immaturity, and missed detection. In response to these complex field environmental conditions, ESG-YOLO was used for detection, as shown in Figure 10, and the effect of maize male tassel detection was excellent.
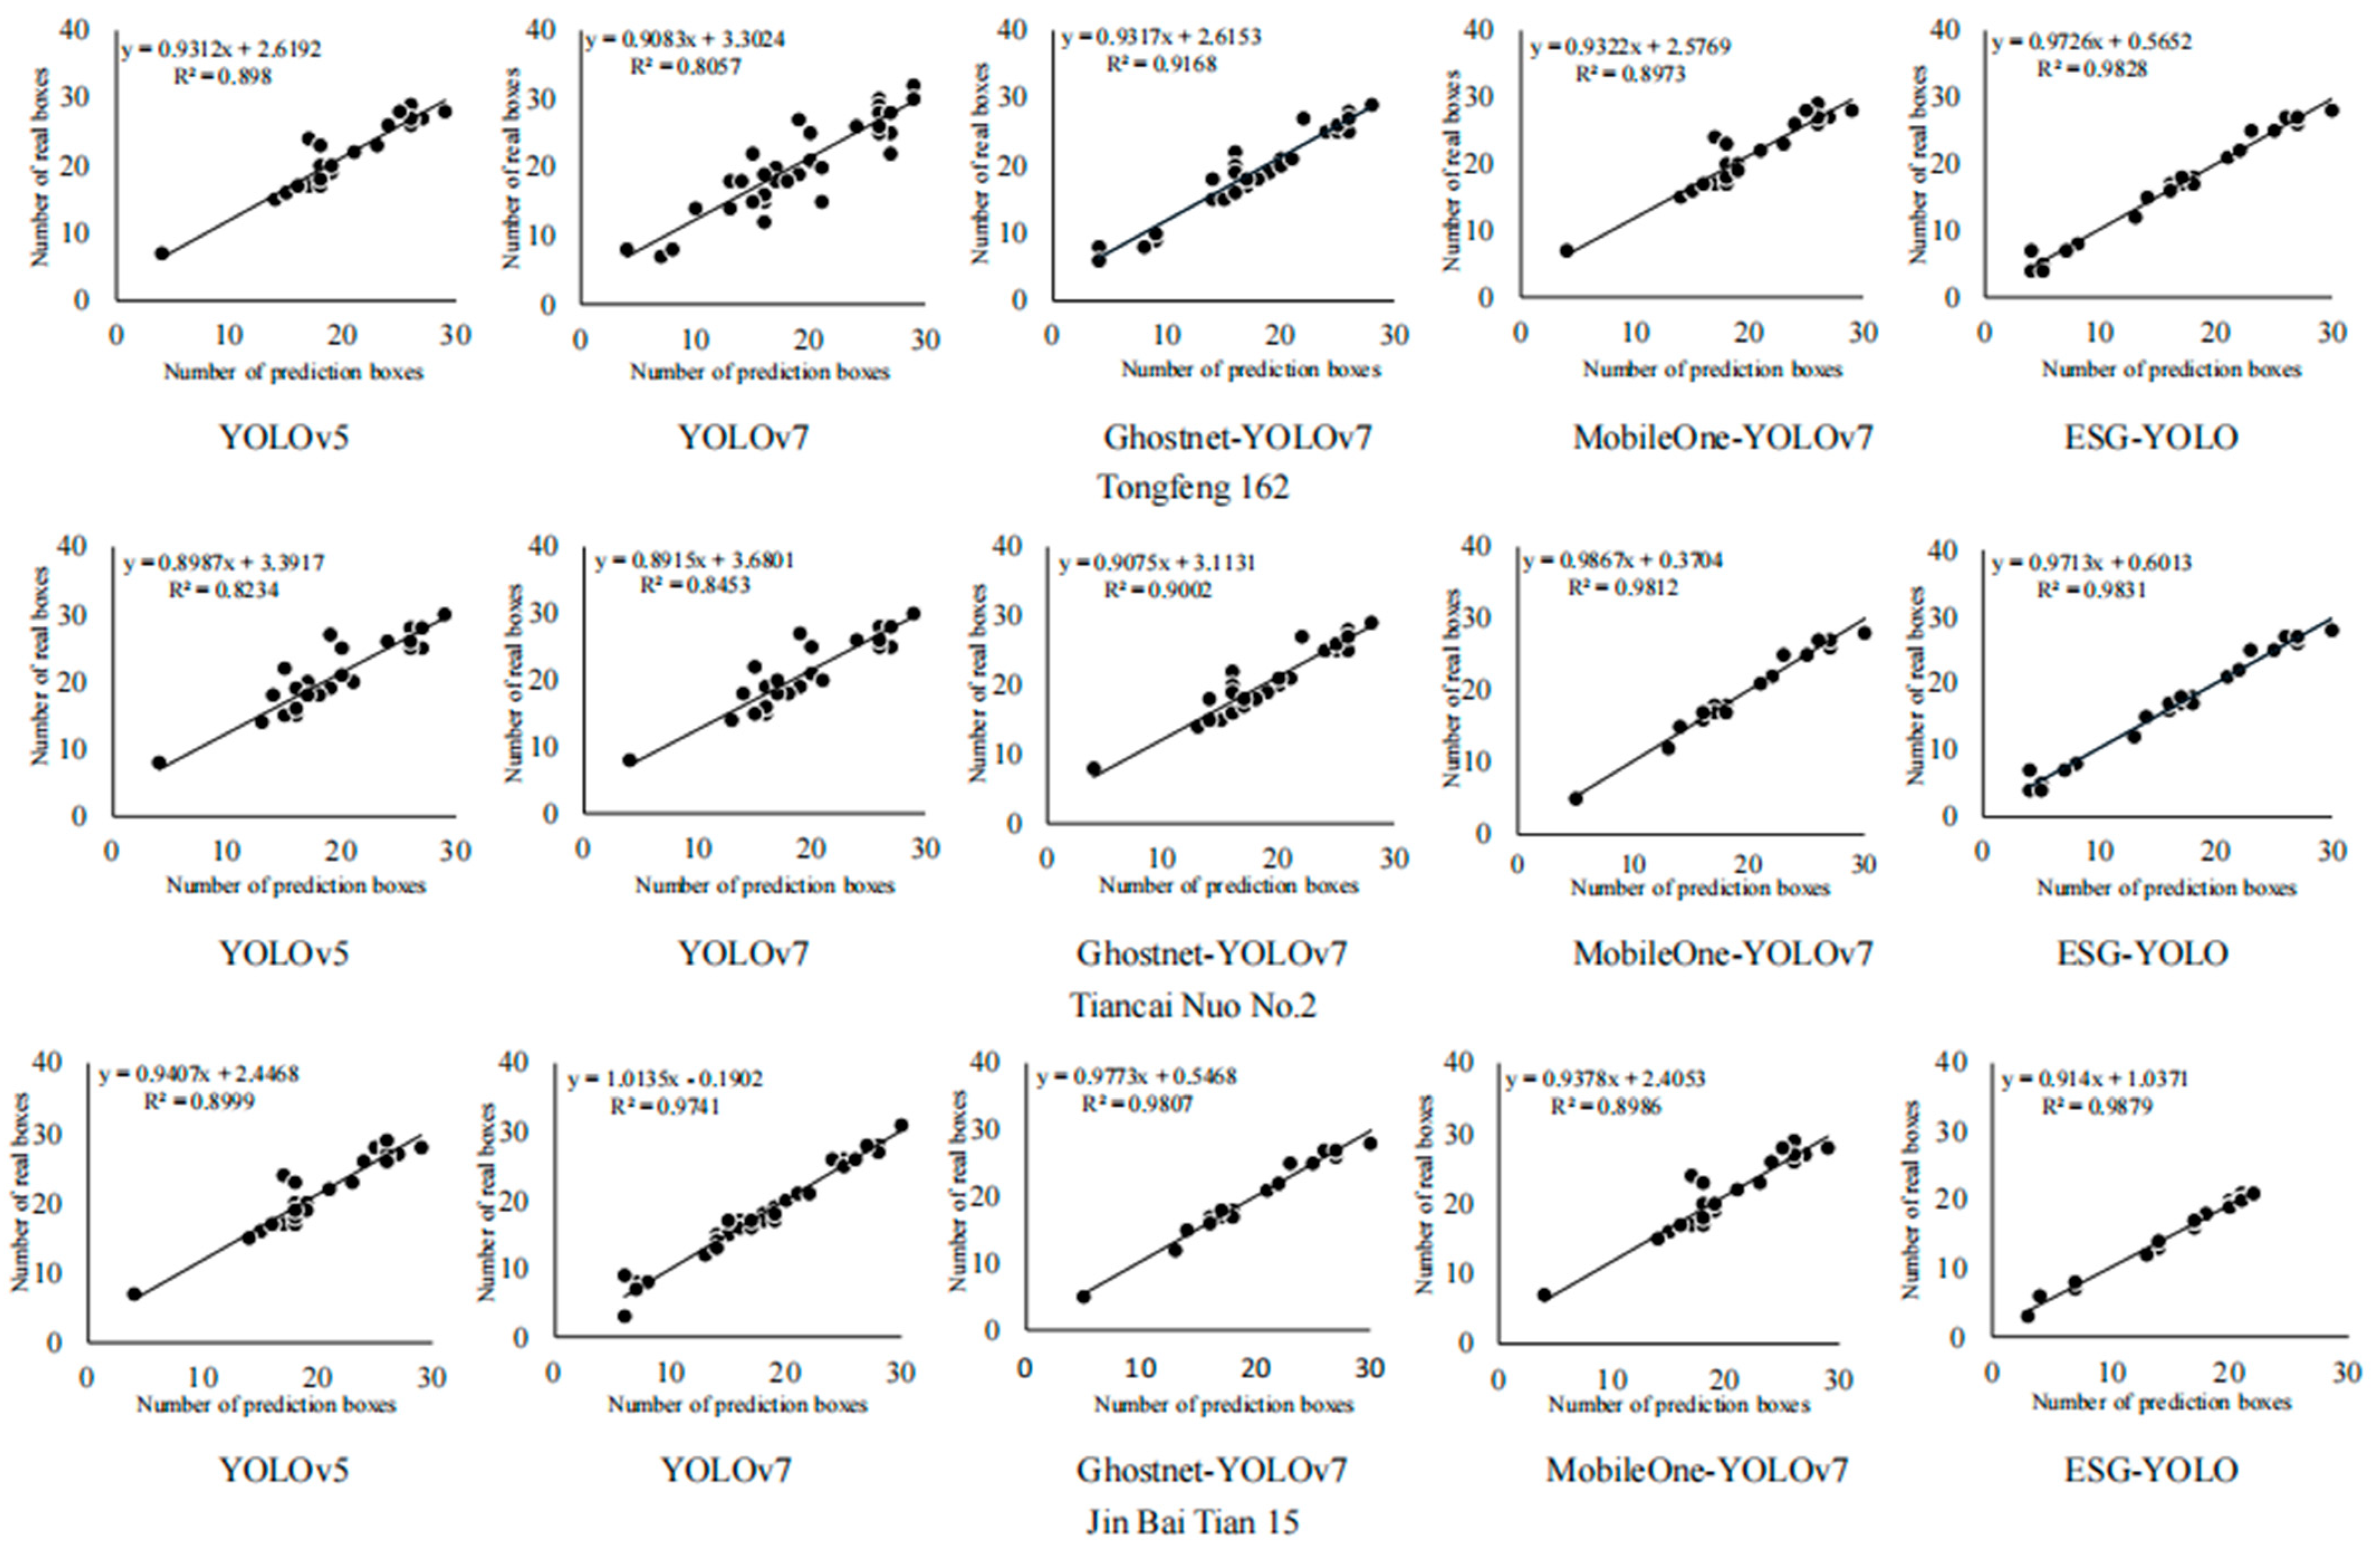
As shown in Figure 11, five models, YOLOv5, YOLOv7, Ghostnet-YOLOv7, MobileOne-YOLOv7, and ESG-YOLO, were used to detect the male tassel of each variety of maize, and linear regression analyses were carried out to analyze the number of artificially labeled true frames and the results of model detection. The coefficient of determination R2 of Tongfeng 162 was 0.898, 0.8057, 0.9168, 0.8973, and 0.9823 for YOLOv5, YOLOv7, Ghostnet-YOLOv7, MobileOne-YOLOv7, and ESG-YOLO models, respectively, and it had the worst adaptability to the model among the three varieties; The coefficient of determination R2 of Kimberly 15 was 0.8999, 0.9741, 0.9807, 0.8986, and 0.9879, respectively, which was the best adaptation to the model among the three varieties. And among the five models, the coefficient of determination R2 of ESG-YOLO model was 0.9828, 0.9831, and 0.9879 for the three varieties, which had the best detection effect, indicating that the ESG-YOLO model had better detection performance in each model, and it also provided a certain prerequisite guarantee for late maize yield assessment and prediction.
In order to verify the recognition effect of maize male tassel with different planting densities based on the ESG-YOLO model, maize male tassel images with different planting densities under the same variety were detected, respectively, and mean absolute error (MAE) was calculated. N is the number of images, as shown in Formula (8), Y i is the angle of the oriented detection box in the i image, and Y i is the angle of the corresponding oriented bounding box.
M A E = 1 N i = 1 N Y i Y i
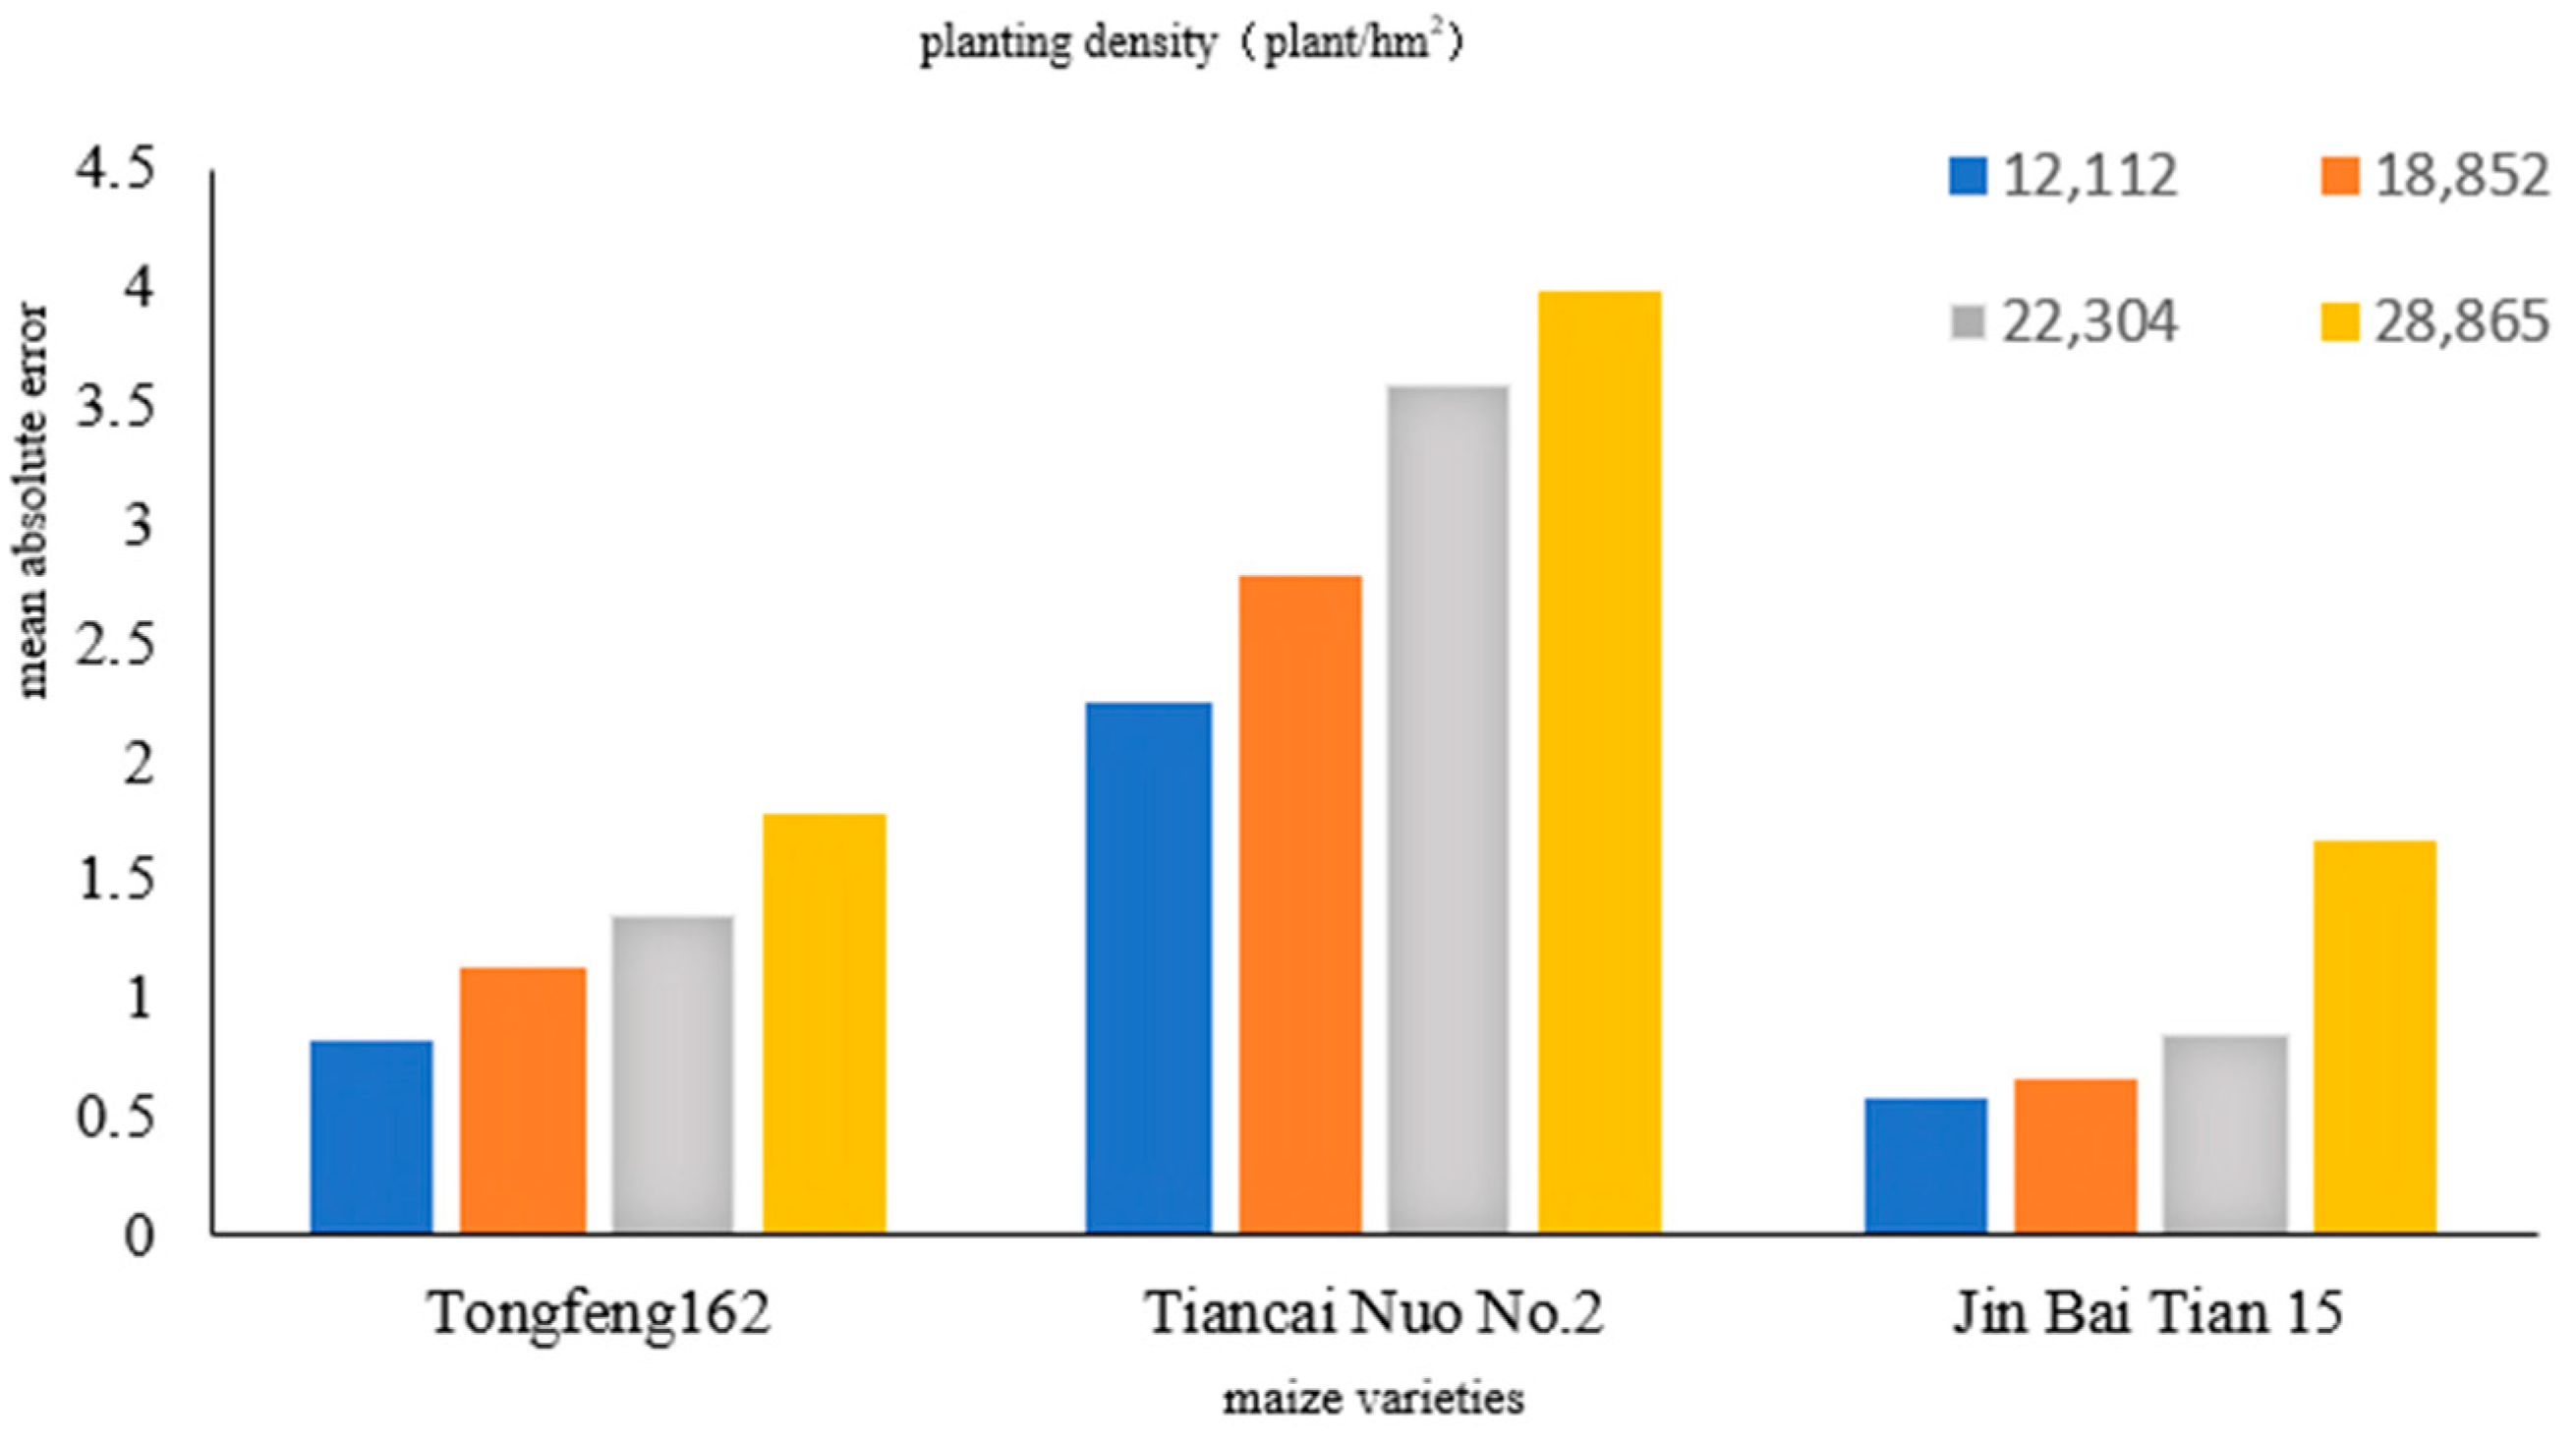
The results of the experiment are shown in Figure 12. The mean absolute error (MAE) values of different varieties varied greatly, and the MAE values under the same planting density were also different. At planting densities of 12,112, 18,852, 22,304, and 28,865 plants/hm2, the models detected MAEs of 0.82, 1.13, 1.35, and 1.78 for Tongfeng 162; 2.24, 2.78, 3.58, and 3.98 for Sweet Colored Glutinous No.2; and 0.57, 0.66, 0.84, and 1.67 for Jinbaitan 15, respectively. For the same variety, the greater the planting density, the greater the average absolute error value. The results showed that the detection accuracy of maize male tassels based on the ESG-YOLO model was not only related to planting density but also related to variety, and the main trend was that as the planting density increased, the detection error gradually became larger, and the main reason for this phenomenon was due to the fact that as the planting density increased, there was more and more serious cross overlap as well as shading between the tassel, which was prone to interfering with the detection process.
In summary, based on ESG-YOLO for the detection of maize male tassels, more intuitive and fast statistics for the number of maize male tassels and the density of male tassels were achieved using an automatic identification survey. This research method has certain accuracy and scientificity and also provides a certain theoretical basis and reference value for target detection and tassel recognition using the top view obtained from the UAV platform and field crop phenotype high-throughput collection platform.

5. Conclusions and Future Prospects

5.1. Conclusions

Detection of maize male tassel is the basic means for ensuring maize yield assessment. In order to realize the accuracy of maize male tassel recognition and detection in complex fields, this study constructed a maize male tassel image dataset based on the conditions of the complex field environment with different degrees of shading, different light intensities, and different densities. Using GELU as an activation function instead of the original SiLU, the SPD-Conv network module as well as the ECA Attention Mechanism module were added to train and predict the dataset in the ESG-YOLO model. The impact of the model improvement on the detection performance was analyzed, and the following conclusions can be drawn.
(1)
The ESG-YOLO model [email protected] is 93.1%, which is an improvement of 2.3% compared to the YOLOv7 model, respectively. In terms of accuracy, recall, F1 value, average frame rate, number of parameters, and computational effort combined, the model outperforms the comparison model, which has the best overall detection performance.
(2)
The SPD-Conv network module is added to the ESG-YOLO model, which is optimized for processing symmetric positive definite matrix data, making it effective in low-resolution images and small-object target detection, which is more suitable for image detection of such small and multiple low-resolution targets as the male tassels of maize in complex fields.
(3)
The class-averaged accuracy of the ESG-YOLO model on the complex maize field phenotyping platform test set reached a respectable 93.1%, respectively. Based on this, this model was applied to continue the heat visualization supply detection of detected maize male tassels, which more efficiently detected the growth status of maize male tassels in different environments.
(4)
The ESG-YOLO model for the detection of maize male tassels is more intuitive and fast for counting the number of maize male tassels as well as the automatic identification of the density of male tassels.
This research method has certain accuracy and scientificity, and it also provides a certain theoretical basis and reference value for target detection and tassel stage identification using the top view obtained from the UAV platform and the field crop phenotype high-throughput collection platform. The optimization of intelligent detection and density assessment of low-resolution maize male tassels using the ESG-YOLO model in complex field environments lays a fundamental role in the research and development of new agricultural technologies, and it is the key to the performance of different maize varieties and yield prediction. It helps to control the impact of environmentally controllable factors on maize growth and development by providing information on maize plant growth, leaf color, and morphology, which in turn assesses the fertility and health of the soil, guides farmers in rational fertilizer application and soil management, improves the sustainable use of land, and helps formulate strategies for mitigating the effects of climate change and optimizing the sustainable management practices of land. It also contributes to precision agriculture by allowing for the real-time monitoring of maize growth and yield forecasts, providing decision support to farmers and the government, optimizing the allocation of agricultural resources, improving the efficiency of agricultural production, and promoting the sustainable development of the rural economy.

5.2. Future Prospects

There are two future perspectives for the detection and density assessment of maize male tassels. First, this paper proposes an improved complex model ESG-YOLO based on YOLOv7, which can significantly improve detection accuracy on the basis of ensuring detection precision. However, in order to make the detection accuracy rise, this study uses a dual ECA attention mechanism channel, which leads to an increase in the model detection time. And in order to realize the integrated management platform of intelligent agriculture, create precision agriculture, help farmers customize inputs according to the specific needs of the crop, and intelligently realize the reasonable control of statistics and planting density in the process of maize production in order to achieve cost savings, reduce waste, and improve production efficiency, the future will inevitably optimize the ESG-YOLO model again and apply it to the field intelligent system for operation. In the future, the ESG-YOLO model will be optimized and applied to the field intelligent system for operation, and the use of the ESG-YOLO model will be loaded into the field intelligent system, which requires a more lightweight adjustment, which is the goal of this study to continue to study and adjust in the future.
Secondly, this model needs to be considered to link to later relevant applications. The generalization application of deep learning models is correlative, associating with related applications that will be used in later stages, such as the application of deep neural networks and transfer learning in remote object detection by drones, the corn disease prediction framework based on the Internet of Things and interpretable machine learning, and the investigation of the application of deep convolutional neural networks in the prediction of plant leaf diseases and other extended applications. We will also generalize this ESG-YOLO model in disease detection and prediction and other deep convolutional neural networks to generalize the use of this ESG-YOLO model to help farmers and agricultural experts to detect problems such as pests and diseases in a timely manner and to take appropriate control measures, so as to safeguard the yield and quality of maize and to ensure the security of the food supply.

Author Contributions

Conceptualization, W.W.; methodology, W.W.; software, W.W.; validation, W.W.; formal analysis, W.W.; investigation, W.W.; resources, J.Z. and G.Z.; data curation, W.W., J.Z., G.Z., L.H., Y.Z. and J.W.; writing—original draft preparation, W.W.; writing—review and editing, W.W. and J.Z.; visualization, W.W.; supervision, J.Z., G.Z., L.H., J.W. and Y.Z.; project administration, J.Z. and G.Z.; funding acquisition, J.Z. and G.Z. All authors have read and agreed to the published version of the manuscript.

Funding

Supported by the National Natural Science Foundation of China (31971792, 32160421); The research was supported by the Project of Sanya Yazhou Bay Science and Technology City (SCKJ-JYRC-2023-45); National Key Research and Development Program of China (2022YFF0711805); Innovation Project of Chinese Academy of Agricultural Sciences (CAAS-ASTIP-2023-AII, ZDXM23011); Special Project for Basic Research Operating Costs of Central Public Welfare Research Institutes (JBYW-AII-2023-06, Y2022XK24, Y2022QC17, JBYW-AII-2022-14); Special Project on Southern Propagation of the National Institute of Southern Propagation, Chinese Academy of Agricultural Sciences, Sanya (YBXM2312, YDLH01, YDLH07, YBXM10).

Data Availability Statement

The data presented in this study are available on request from the corresponding author (accurately indicate status).

Conflicts of Interest

The authors declare no conflict of interest.

References

  1. Shekoofa, A.; Emam, Y.; Shekoufa, N.; Ebrahimi, M.; Ebrahimie, E. Determining the most important physiological and agronomic traits contributing to maize grain yield through machine learning algorithms: A new avenue in intelligent agriculture. PLoS ONE 2014, 9, e97288. [Google Scholar] [CrossRef] [PubMed]
  2. Lunduka, R.W.; Mateva, K.I.; Magorokosho, C.; Manjeru, P. Impact of adoption of drought-tolerant maize varieties on total maize production in south Eastern Zimbabwe. Clim. Dev. 2017, 11, 35–46. [Google Scholar] [CrossRef] [PubMed]
  3. Feng, Y.C.; Yu, Z.J.; Huo, S.P.; Yan, Q.J.; Xiang, Z.F.; Zhang, F.K.; Yang, L.; Zhang, X.D. Genetic effects of tassel-anthesis interval using mixture model of major gene plus polygene in maize. J. Maize Sci. 2019, 27, 1–8. (In Chinese) [Google Scholar]
  4. Yue, Y.L.; Zhu, M.; Yu, L. Research Progress on the Impact of Maize Tassel on Yield. J. Maize Sci. 2010, 18, 150–152. [Google Scholar]
  5. Khanal, S.; KC, K.; Fulton, J.P.; Shearer, S.; Ozkan, E. Remote Sensing in Agriculture—Accomplishments, Limitations, and Opportunities. Remote Sens. 2020, 12, 3783. [Google Scholar] [CrossRef]
  6. Lu, H.; Cao, Z.; Xiao, Y.; Zhuang, B.; Shen, C. TasselNet: Counting maize tassels in the wild via local counts regression network. Plant Methods 2017, 13, 79. [Google Scholar] [CrossRef]
  7. Yu, Z.; Ye, J.; Li, C.; Zhou, H.; Li, X. TasselLFANet: A novel lightweight multi-branch feature aggregation neural network for high-throughput image-based maize tassels detection and counting. Front. Plant Sci. 2023, 14, 1158940. [Google Scholar] [CrossRef]
  8. Khaki, S.; Safaei, N.; Pham, H.; Wang, L. WheatNet: A Lightweight Convolutional Neural Network for High-throughput Image based Wheat Head Detection and Counting. arXiv 2023, arXiv:2103.09408. [Google Scholar] [CrossRef]
  9. Buzzy, M.; Thesma, V.; Davoodi, M.; Mohammadpour Velni, J. Real-Time Plant Leaf Counting Using Deep Object Detection Networks. Sensors 2020, 20, 6896. [Google Scholar] [CrossRef]
  10. Kurtulmuş, F.; Kavdir, I. Detecting corn tassels using computer vision and support vector machines. Expert Syst. Appl. 2014, 41, 7390–7397. [Google Scholar] [CrossRef]
  11. Liu, Y.; Cen, C.; Che, Y.; Ke, R.; Ma, Y.; Ma, Y. Detection of Maize Tassels from UAV RGB Imagery with Faster R-CNN. Remote Sens. 2020, 12, 338. [Google Scholar] [CrossRef]
  12. Zhang, H.; Fu, Z.; Han, W.; Yang, G.; Niu, D.; Zhou, X. Detection Method of Maize Seedlings Number Based on Improved YOLO. Trans. Chin. Soc. Agric. Mach. 2021, 52, 221–229. [Google Scholar]
  13. Liang, Y.H.; Chen, Q.; Dong, C.X. Application of Deep-learning and UAV for Field Surveying Corn Tassel. Fujian J. Agric. Sci. 2020, 35, 456–464. [Google Scholar]
  14. Ren, S.Q.; He, K.M.; Girshick, R.; Sun, J. Faster R-Cnn: Towards Real-Time Object Detection with Region Proposal Networks. arXiv 2015, arXiv:1506.01497. [Google Scholar] [CrossRef] [PubMed]
  15. Liu, W.; Anguelov, D.; Erhan, D.; Szegedy, C.; Reed, S.; Fu, C.-Y.; Berg, A.C. SSD: Single Shot MultiBox Detector. arXiv 2018, arXiv:1804. 02767. [Google Scholar]
  16. Redmon, J.; Farhadi, A. Yolov3: An Incremental Improvement. arXiv 2018, arXiv:1804. 02767. [Google Scholar]
  17. Yang, S.; Liu, J.; Xu, K.; Sang, X.; Ning, J.; Zhang, Z. Improved Centernet Based Tassel Recognition for Uav Remote Sensing Image. Trans. Agric. Mach. 2021, 9, 24. [Google Scholar]
  18. Duan, K.; Bai, S.; Xie, L.; Qi, H.; Huang, Q.; Tian, Q. Centernet: Keypoint Triplets For Object Detection. In Proceedings of the IEEE/Cvf International Conference on Computer Vision, Montreal, BC, Canada, 11–17 October 2021; pp. 6569–6578. [Google Scholar]
  19. Al-Zadjali, A.; Shi, Y.; Scott, S.; Deogun, J.S.; Schnable, J. Faster R-CNN-based deep ltasselning for locating corn tassels in UAV imagery. In Proceedings of the Autonomous Air and Ground Sensing Systems for Agricultural Optimization and Phenotyping V 2020, Virtual, Online, USA, 27 April–8 May 2020. [Google Scholar]
  20. Ji, M.; Yang, Y.; Zheng, Y.; Zhu, Q.; Huang, M.; Guo, Y. In-field automatic detection of maize tassels using computer vision. Inf. Process. Agric. 2021, 8, 87–95. [Google Scholar] [CrossRef]
  21. Mirnezami, S.V.; Srinivasan, S.; Zhou, Y.; Schnable, P.S.; Ganapathysubramanian, B. Detection of the Progression of Anthesis in Field-Grown Maize Tassels: A Case Study. Plant Phenomics 2021, 2021, 4238701. [Google Scholar] [CrossRef]
  22. Falahat, S.; Karami, A. Maize tassel detection and counting using a YOLOv5-based model. Multimedia Tools Appl. 2022, 82, 19521–19538. [Google Scholar] [CrossRef]
  23. Zhang, Y.; Zhou, D.; Chen, S.; Gao, S.; Ma, Y. Single-Image Crowd Counting via Multi-Column Convolutional Neural Network. In Proceedings of the 2016 IEEE Conference on Computer Vision and Pattern Recognition (CVPR), Las Vegas, NV, USA, 27–30 June 2016; pp. 589–597. [Google Scholar]
  24. Li, Y.; Zhang, X.; Chen, D. CSRNet: Dilated Convolutional Neural Networks for Understanding the Highly Congested Scenes. In Proceedings of the 2018 IEEE/CVF Conference on Computer Vision and Pattern Recognition, Salt Lake City, UT, USA, 18–23 June 2018; pp. 1091–1100. [Google Scholar]
  25. Huang, S.; Li, X.; Cheng, Z.-Q.; Zhang, Z.; Hauptmann, A. Stacked pooling: Improving crowd counting by boosting scale invariance. arXiv 2018, arXiv:1808.07456. [Google Scholar]
  26. Dai, F.; Liu, H.; Ma, Y.; Zhang, X.; Zhao, Q. Dense scale network for crowd counting. arXiv 2021, arXiv:1906.09707. [Google Scholar]
  27. Zand, M.; Damirchi, H.; Farley, A.; Molahasani, M.; Greenspan, M.; Etemad, A. Multiscale crowd counting and localization by multitask point supervision. arXiv 2021, arXiv:2202.09942. [Google Scholar]
  28. Lin, T.; Dollár, P.; Girshick, R.B.; He, K.; Hariharan, B.; Belongie, S.J. Feature Pyramid Networks for Object Detection. In Proceedings of the 2017 IEEE Conference on Computer Vision and Pattern Recognition (CVPR), Honolulu, HI, USA, 21–26 July 2017; pp. 936–944. [Google Scholar]
  29. Wang, C.Y.; Bochkovskiy, A.; Liao, H.Y.M. Yolov7: Trainable Bag-Of-Freebies Sets New State-of-The-Art for Real-Time Object Detectors. arXiv 2022, arXiv:2207.02696. [Google Scholar]
  30. Sunkara, R.; Luo, T. No More Strided Convolutions Or Pooling:A New Cnn Building Block For Low-Resolution Images And Small Objects. arXiv 2022, arXiv:2208.03641. [Google Scholar]
  31. Sajjadi, M.S.; Vemulapalli, R.; Brown, M. Frame-Recurrent Video Super-Resolution. In Proceedings of the IEEE Conference on Computer Vision and Pattern Recognition, New Orleans, LA, USA, 18–24 June 2022. [Google Scholar]
  32. Wang, Q.L.; Wu, B.G.; Zhu, P.F.; Li, P.H.; Zuo, W.M.; Hu, Q.H. Eca-Net: Efficient Channel Attention for Deep Convolutional Neural Networks. In Proceedings of the 2020 IEEE/CVF Conference on Computer Vision and Pattern Recognition (CVPR), Seattle, WA, USA, 13–19 June 2020. [Google Scholar]
  33. Hendrycks, D.; Gimpel, K. Gaussian Error Lintassel Units (Gelus). arXiv 2020, arXiv:1606.08415. [Google Scholar]
  34. Wang, B.; Yang, G.; Yang, H.; Gu, J.; Zhao, D.; Xu, S.; Xu, B. UAV images for detecting maize tassel based on YOLO_X and transfer learning. Trans. Chin. Soc. Agric. Eng. 2022, 38, 53–62. [Google Scholar]
  35. Yang, L.; Zhang, R.-Y.; Li, L.; Xie, X. Simam: A Simple, Parameter-Free Attention Module For Convolutional Neural Networks. In Proceedings of the 38th International Conference on Machine Learning, Virtual Event, 18–24 July 2021. [Google Scholar]
  36. Woo, S.; Park, J.; Lee, J.-Y.; Kweon, I.S. Cbam: Convolutional Block Attention Module. arXiv 2018, arXiv:1807.06521. [Google Scholar]
  37. Liu, Y.C.; Shao, Z.R.; Nico, H. Global Attention Mechanism: Retain Information to Enhance Channel-Spatial Interactions. arXiv 2021, arXiv:2112.05561. [Google Scholar]
  38. Li, X.; Wang, W.H.; Hu, X.L.; Yang, J. Selective Kernel Networks. arXiv 2019, arXiv:1903.06586. [Google Scholar]
  39. Hu, J.; Shen, L.; Albanie, S.; Sun, G.; Wu, E. Squeeze-and-Excitation Networks. arXiv 2019, arXiv:1709.01507. [Google Scholar]
  40. Hou, Q.; Zhou, D.; Feng, J. Coordinate Attention for Efficient Mobile Network Design. In Proceedings of the 2021 IEEE/CVF Conference on Computer Vision and Pattern Recognition (CVPR), Nashville, TN, USA, 20–25 June 2021. [Google Scholar]
  41. Vasu, A.; Gabriel, J.; Zhu, J.; Tuzel, O.; Ranjan, A. MobileOne: An Improved One millisecond Mobile Backbone. In Proceedings of the 2023 IEEE/CVF Conference on Computer Vision and Pattern Recognition (CVPR), Vancouver, BC, Canada, 18–22 June 2023; pp. 7907–7917. [Google Scholar]
  42. Han, K.; Wang, Y.; Tian, Q.; Guo, J.; Xu, C.; Xu, C. GhostNet: More features from cheap operations. In Proceedings of the IEEE/CVF Conference on Computer Vision and Pattern Recognition (CVPR), Seattle, WA, USA, 14–19 June 2020; pp. 1580–1589. [Google Scholar]
Figure 1. Image sampling ((A) Potianyang Test Base; (B) working scene; (C) explanation of the universal joint Angle of UAV DJI mini2, National Research Institute of Southern Breeding, Chinese Academy of Agricultural Sciences).
Agronomy 14 00241 g001
Figure 2. Data processing and annotation process.
Agronomy 14 00241 g002
Figure 3. ESG-YOLO structure diagram.
Agronomy 14 00241 g003
Figure 4. Illustration of SPD-Conv when scale = 2 (see text for details). (a) is a conventional feature map with C1 number of channels. (b) is a spatial block of pixels rearranged to depth/channel dimensions by a space-to-depth operation, increasing the number of channels to 4C1 while reducing the spatial dimensions by a factor of 2. (c) is a merge of different groups of channels in channel dimensions. d is an addition operation with other processed feature maps. e applies a convolution with a step of 1 to the resulting feature map. (d) for the merged feature maps to perform addition operation with other processed feature maps. (e) for applying convolution with step size 1 to the resultant feature maps, reducing the channel dimension to C2.The SPD component uses image conversion technology [31] to down-sample the feature mapping within the CNN and throughout the CNN, as shown below.
Agronomy 14 00241 g004
Figure 5. ECA network structure diagram.
Agronomy 14 00241 g005
Figure 6. GELU curve drawing diagram.
Agronomy 14 00241 g006
Figure 7. This shows the graph during the training cycle (where (A,E) are Box_loss, (B,F) are Objloss, (C) is Precision, (D) is Recall, and (G,H) are mAP).
Agronomy 14 00241 g007
Figure 8. Effect of attention mechanism module detection.
Agronomy 14 00241 g008aAgronomy 14 00241 g008b
Figure 9. Effect pictures of each model detection.
Agronomy 14 00241 g009aAgronomy 14 00241 g009b
Figure 10. Detection effect diagrams under various environmental conditions (male spike detection effect diagrams under blade occlusion of (a,b); (c,d) male spike detection effect map under strong light; (e,f) results of male spike detection under dense growth conditions; (g,h) sparse growth condition male spike detection effect map; (i,j) male spike under the condition of immature scattering detection effect map).
Agronomy 14 00241 g010aAgronomy 14 00241 g010b
Figure 11. Detection results of different maize varieties by different models.
Agronomy 14 00241 g011
Figure 12. Identification results of maize male tassel with different planting densities based on ESG-YOLO.
Agronomy 14 00241 g012
Table 1. Comparative analysis of results of different attention mechanism network modules.
NetworkPrecision/%Recall/%F1/%Average Precision/%
YOLOv790969190.8
YOLOv7 + simAM97.29691.491.4
YOLOv7 + CBAM92.9989191.9
YOLOv7 + GAM94.6969190.9
YOLOv7 + SK97.6959190.7
YOLOv7 + SE82.7998687.8
YOLOv7 + CA98.1847366.3
YOLOv7 + ECA92.59891.192
Table 2. Visualization results of heat maps with different attention mechanism modules.
oneAgronomy 14 00241 i001Agronomy 14 00241 i002Agronomy 14 00241 i003Agronomy 14 00241 i004Agronomy 14 00241 i005Agronomy 14 00241 i006Agronomy 14 00241 i007Agronomy 14 00241 i008
twoAgronomy 14 00241 i009Agronomy 14 00241 i010Agronomy 14 00241 i011Agronomy 14 00241 i012Agronomy 14 00241 i013Agronomy 14 00241 i014Agronomy 14 00241 i015Agronomy 14 00241 i016
sparseAgronomy 14 00241 i017Agronomy 14 00241 i018Agronomy 14 00241 i019Agronomy 14 00241 i020Agronomy 14 00241 i021Agronomy 14 00241 i022Agronomy 14 00241 i023Agronomy 14 00241 i024
denseAgronomy 14 00241 i025Agronomy 14 00241 i026Agronomy 14 00241 i027Agronomy 14 00241 i028Agronomy 14 00241 i029Agronomy 14 00241 i030Agronomy 14 00241 i031Agronomy 14 00241 i032
Weak illuminationAgronomy 14 00241 i033Agronomy 14 00241 i034Agronomy 14 00241 i035Agronomy 14 00241 i036Agronomy 14 00241 i037Agronomy 14 00241 i038Agronomy 14 00241 i039Agronomy 14 00241 i040
Initial imageYOLOv7 + ECAYOLOv7 + simAMYOLOv7 + CBAMYOLOv7 + GAMYOLOv7 + SKYOLOv7 + CAYOLOv7 + SE
Table 3. Ablation test and analysis of results.
NetworkPrecision/%Recall/%F1/%mAP/%
YOLOv797.2969090.8
Yolov7 + ECA92.59891.192
Yolov7 + SPD86.4969090.8
Yolov7 + GELU87.4988990.4
Yolov7 + ECA + SPD93.8969091.4
Yolov7 + ECA + GELU88.487.38991.1
Yolov7 + SPD + GELU89.185.68789.9
YOLOv7 + ECA + SPD + GELU81.8999093.1
YOLOv7 + ECA + ECA + SPD + GELU89.1999093.1
Table 4. Results analysis of different YOLO method models.
AlgorithmsPrecision/%Recall/%F1/%Average Precision/%
YOLOv585.1939290.1
MobileOne-YOLOv786.9956766.2
Ghostnet-YOLOv789.785.68890
YOLOv797.2969090.8
ESG-YOLO89.1999093.1
Disclaimer/Publisher’s Note: The statements, opinions and data contained in all publications are solely those of the individual author(s) and contributor(s) and not of MDPI and/or the editor(s). MDPI and/or the editor(s) disclaim responsibility for any injury to people or property resulting from any ideas, methods, instructions or products referred to in the content.

