
Analysis of Future Drought Risk and Wheat Meteorological Disaster in Ningxia (Northwest China) Based on CMIP6 and SPEI

Abstract
1. Introduction
2. Materials and Methods
2.1. Study Area
2.2. Data Sources
2.3. DHW Discriminant Indices
2.4. Standardized Precipitation–Evapotranspiration Index (SPEI)
2.5. WOFOST Model Optimization Method
3. Results
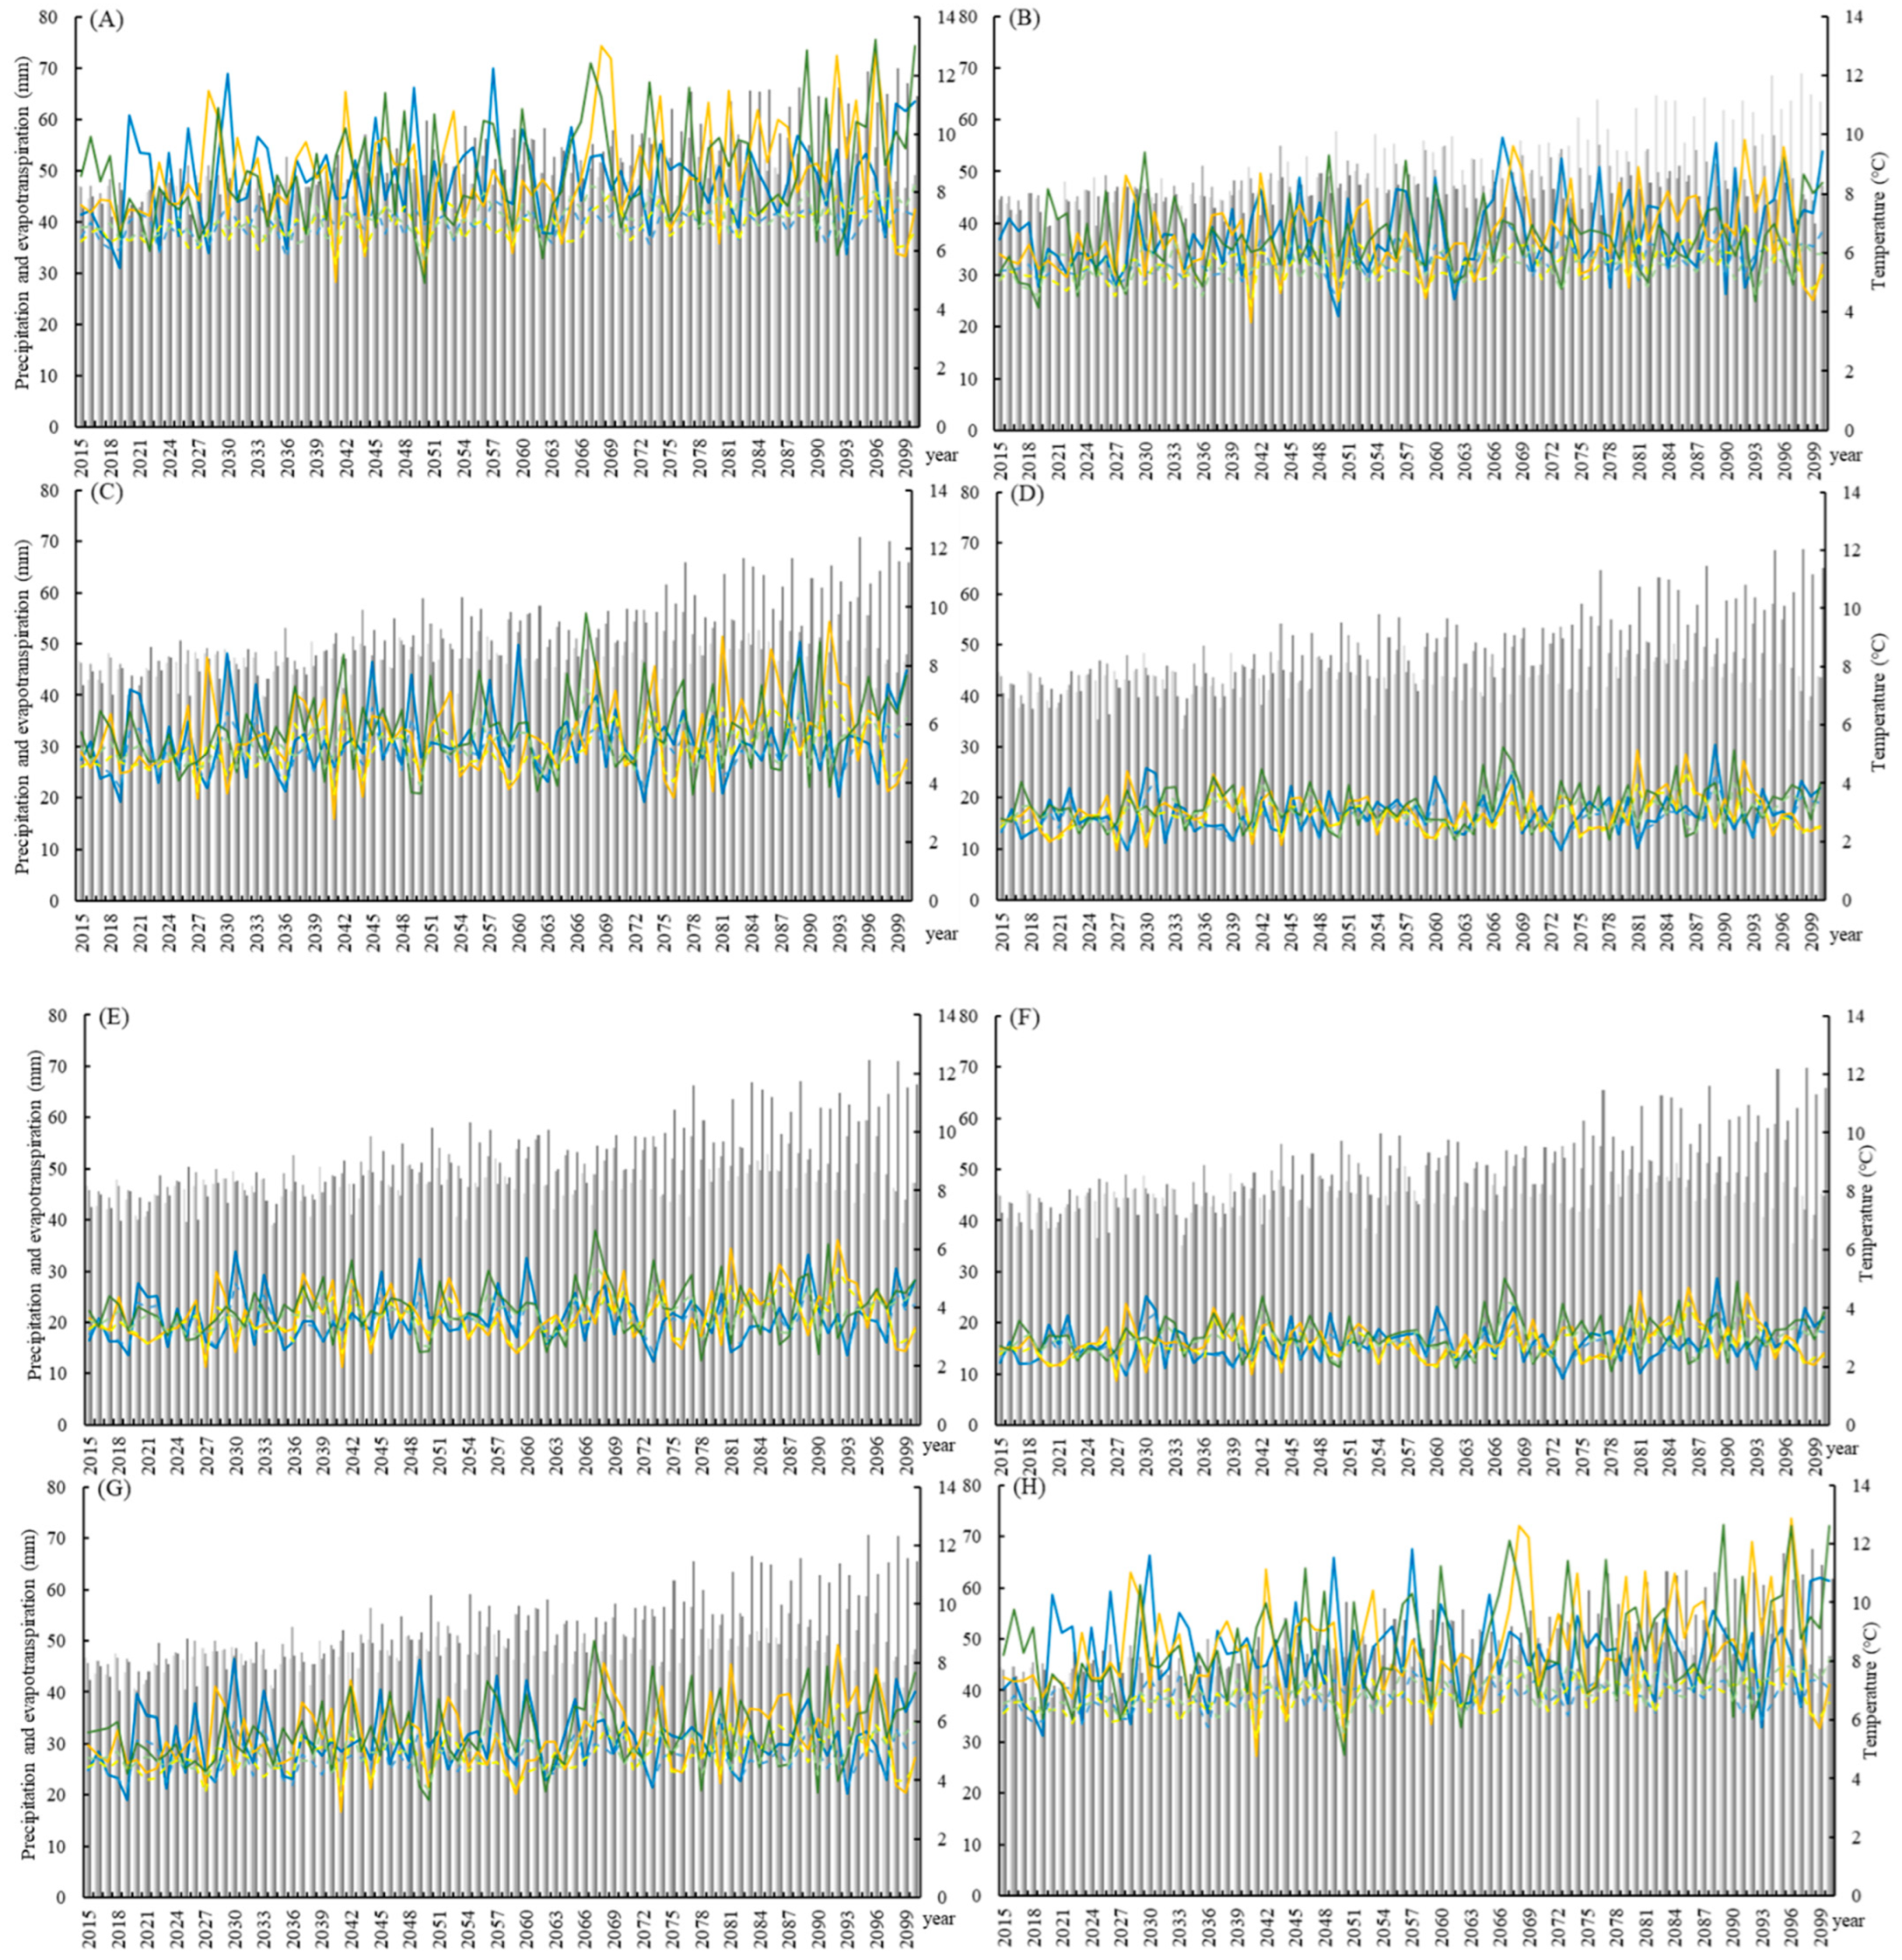
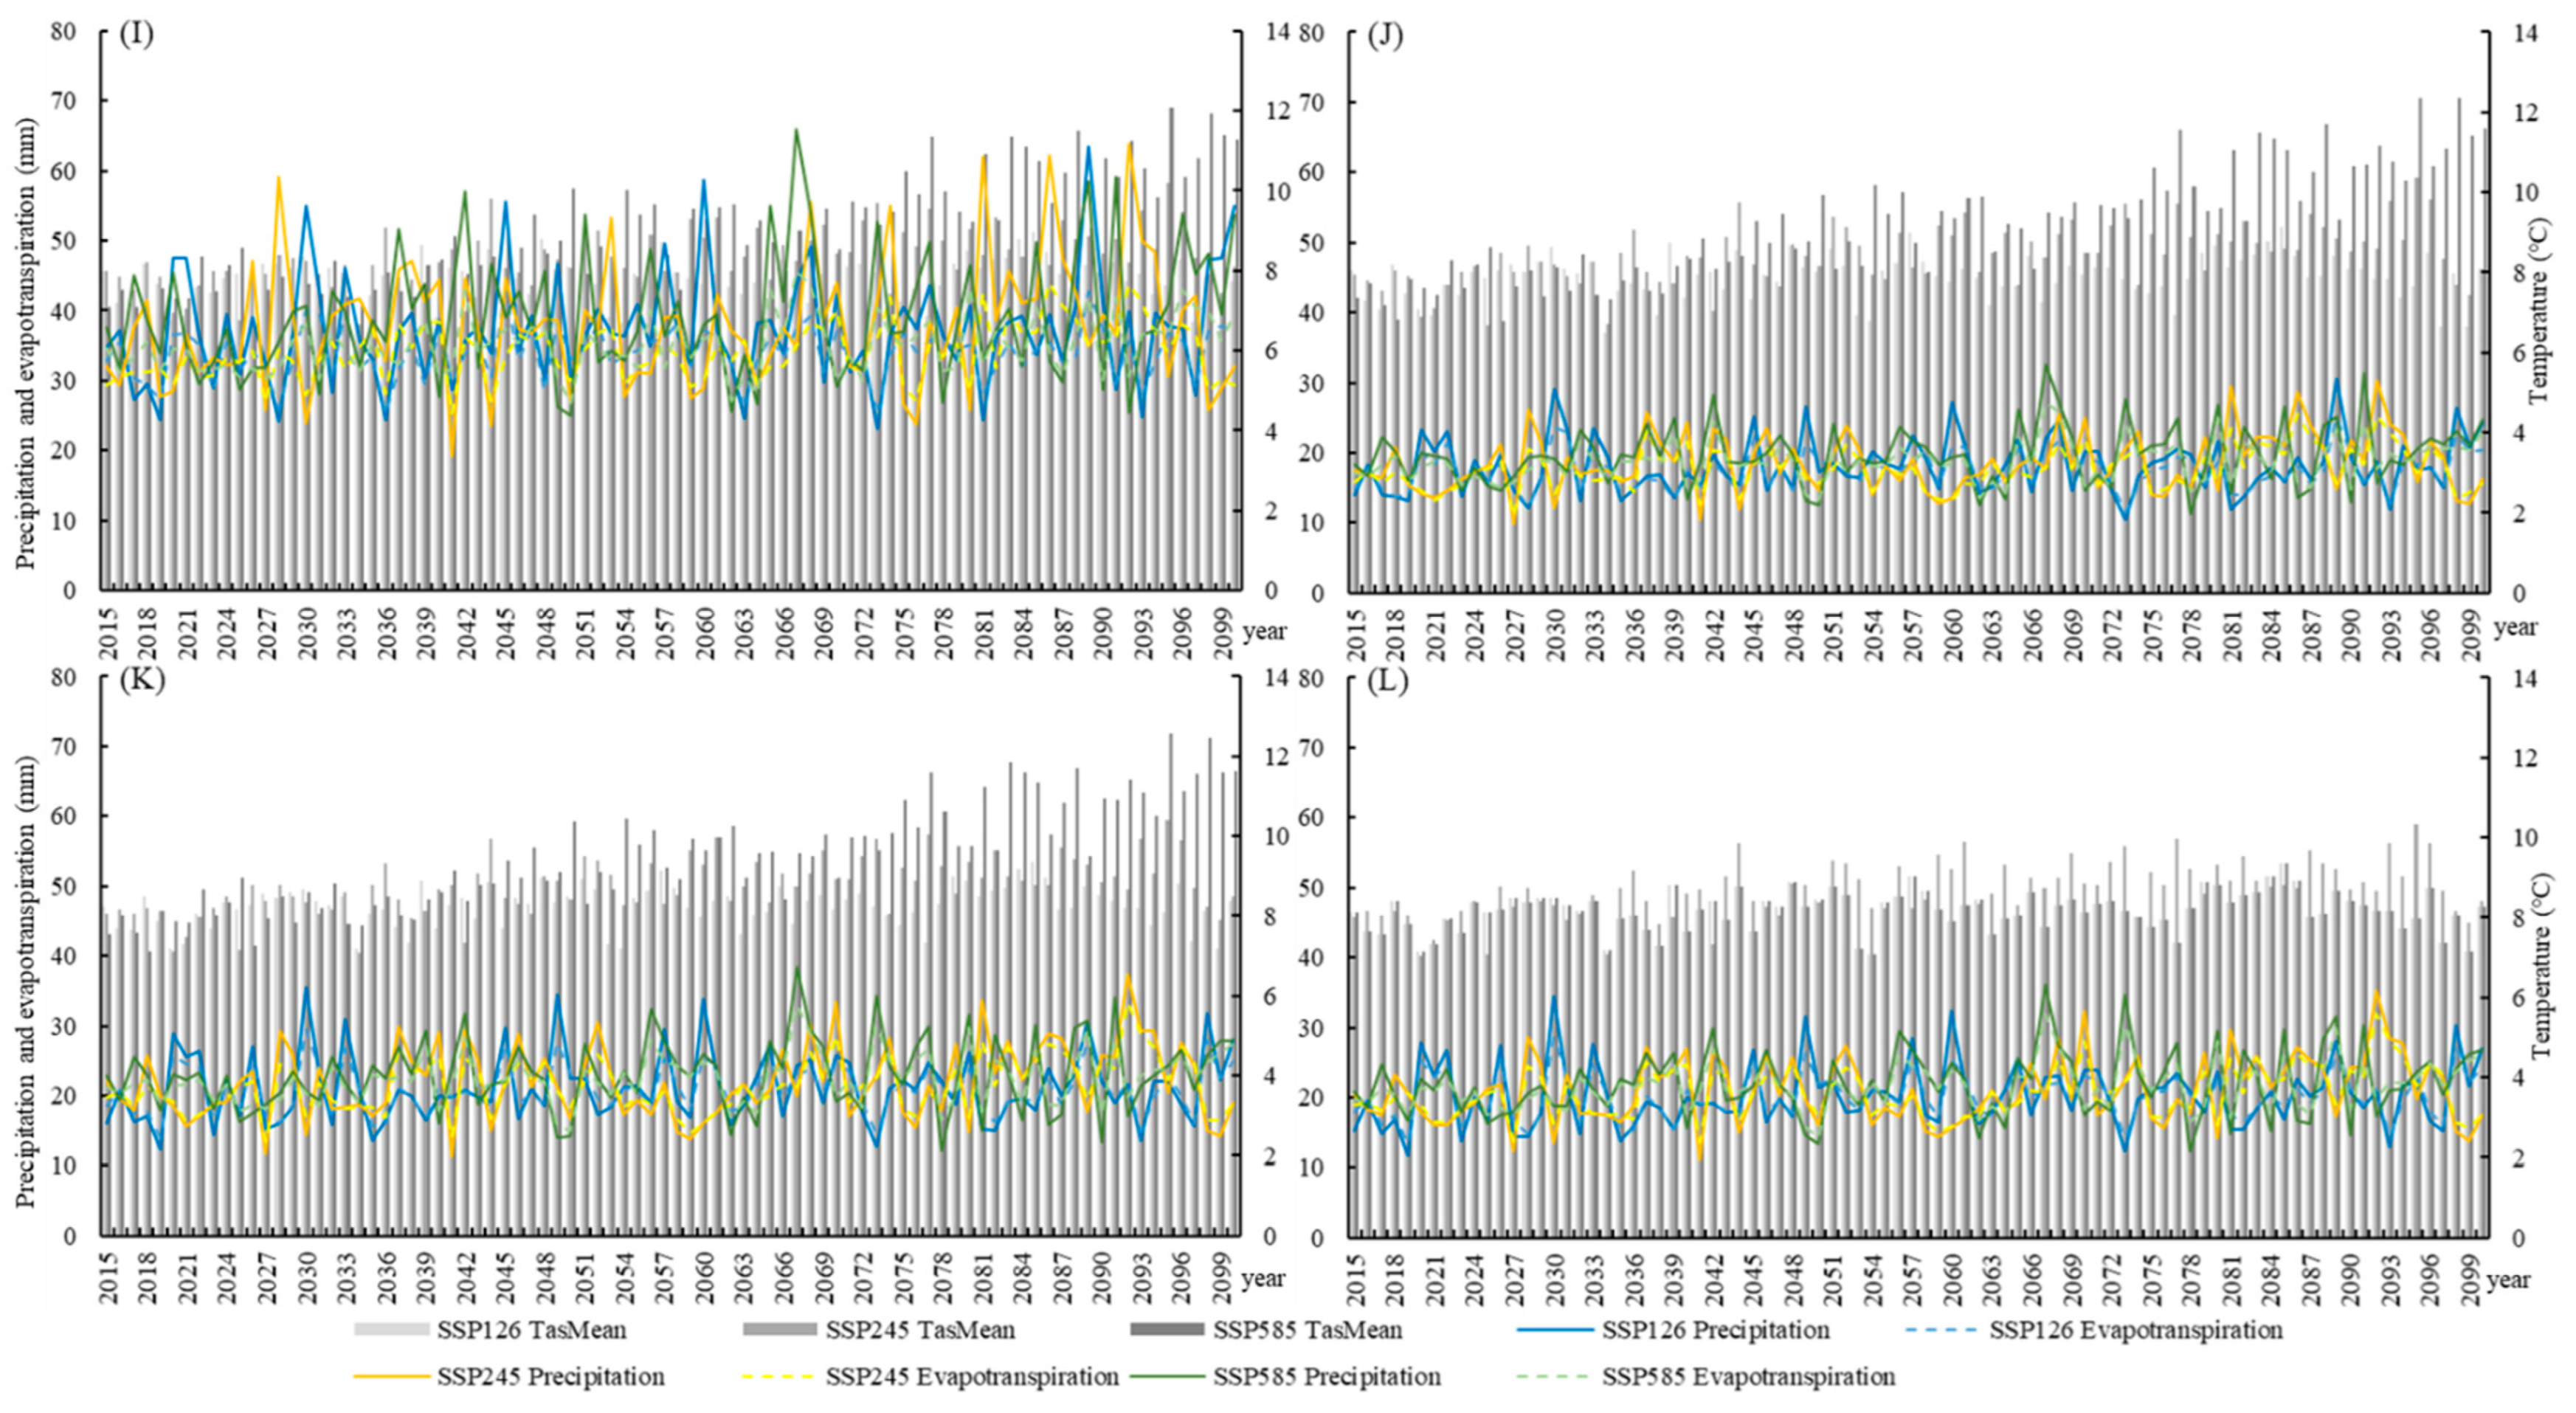
3.1. Meteorological Changes Under Future Climate Scenarios
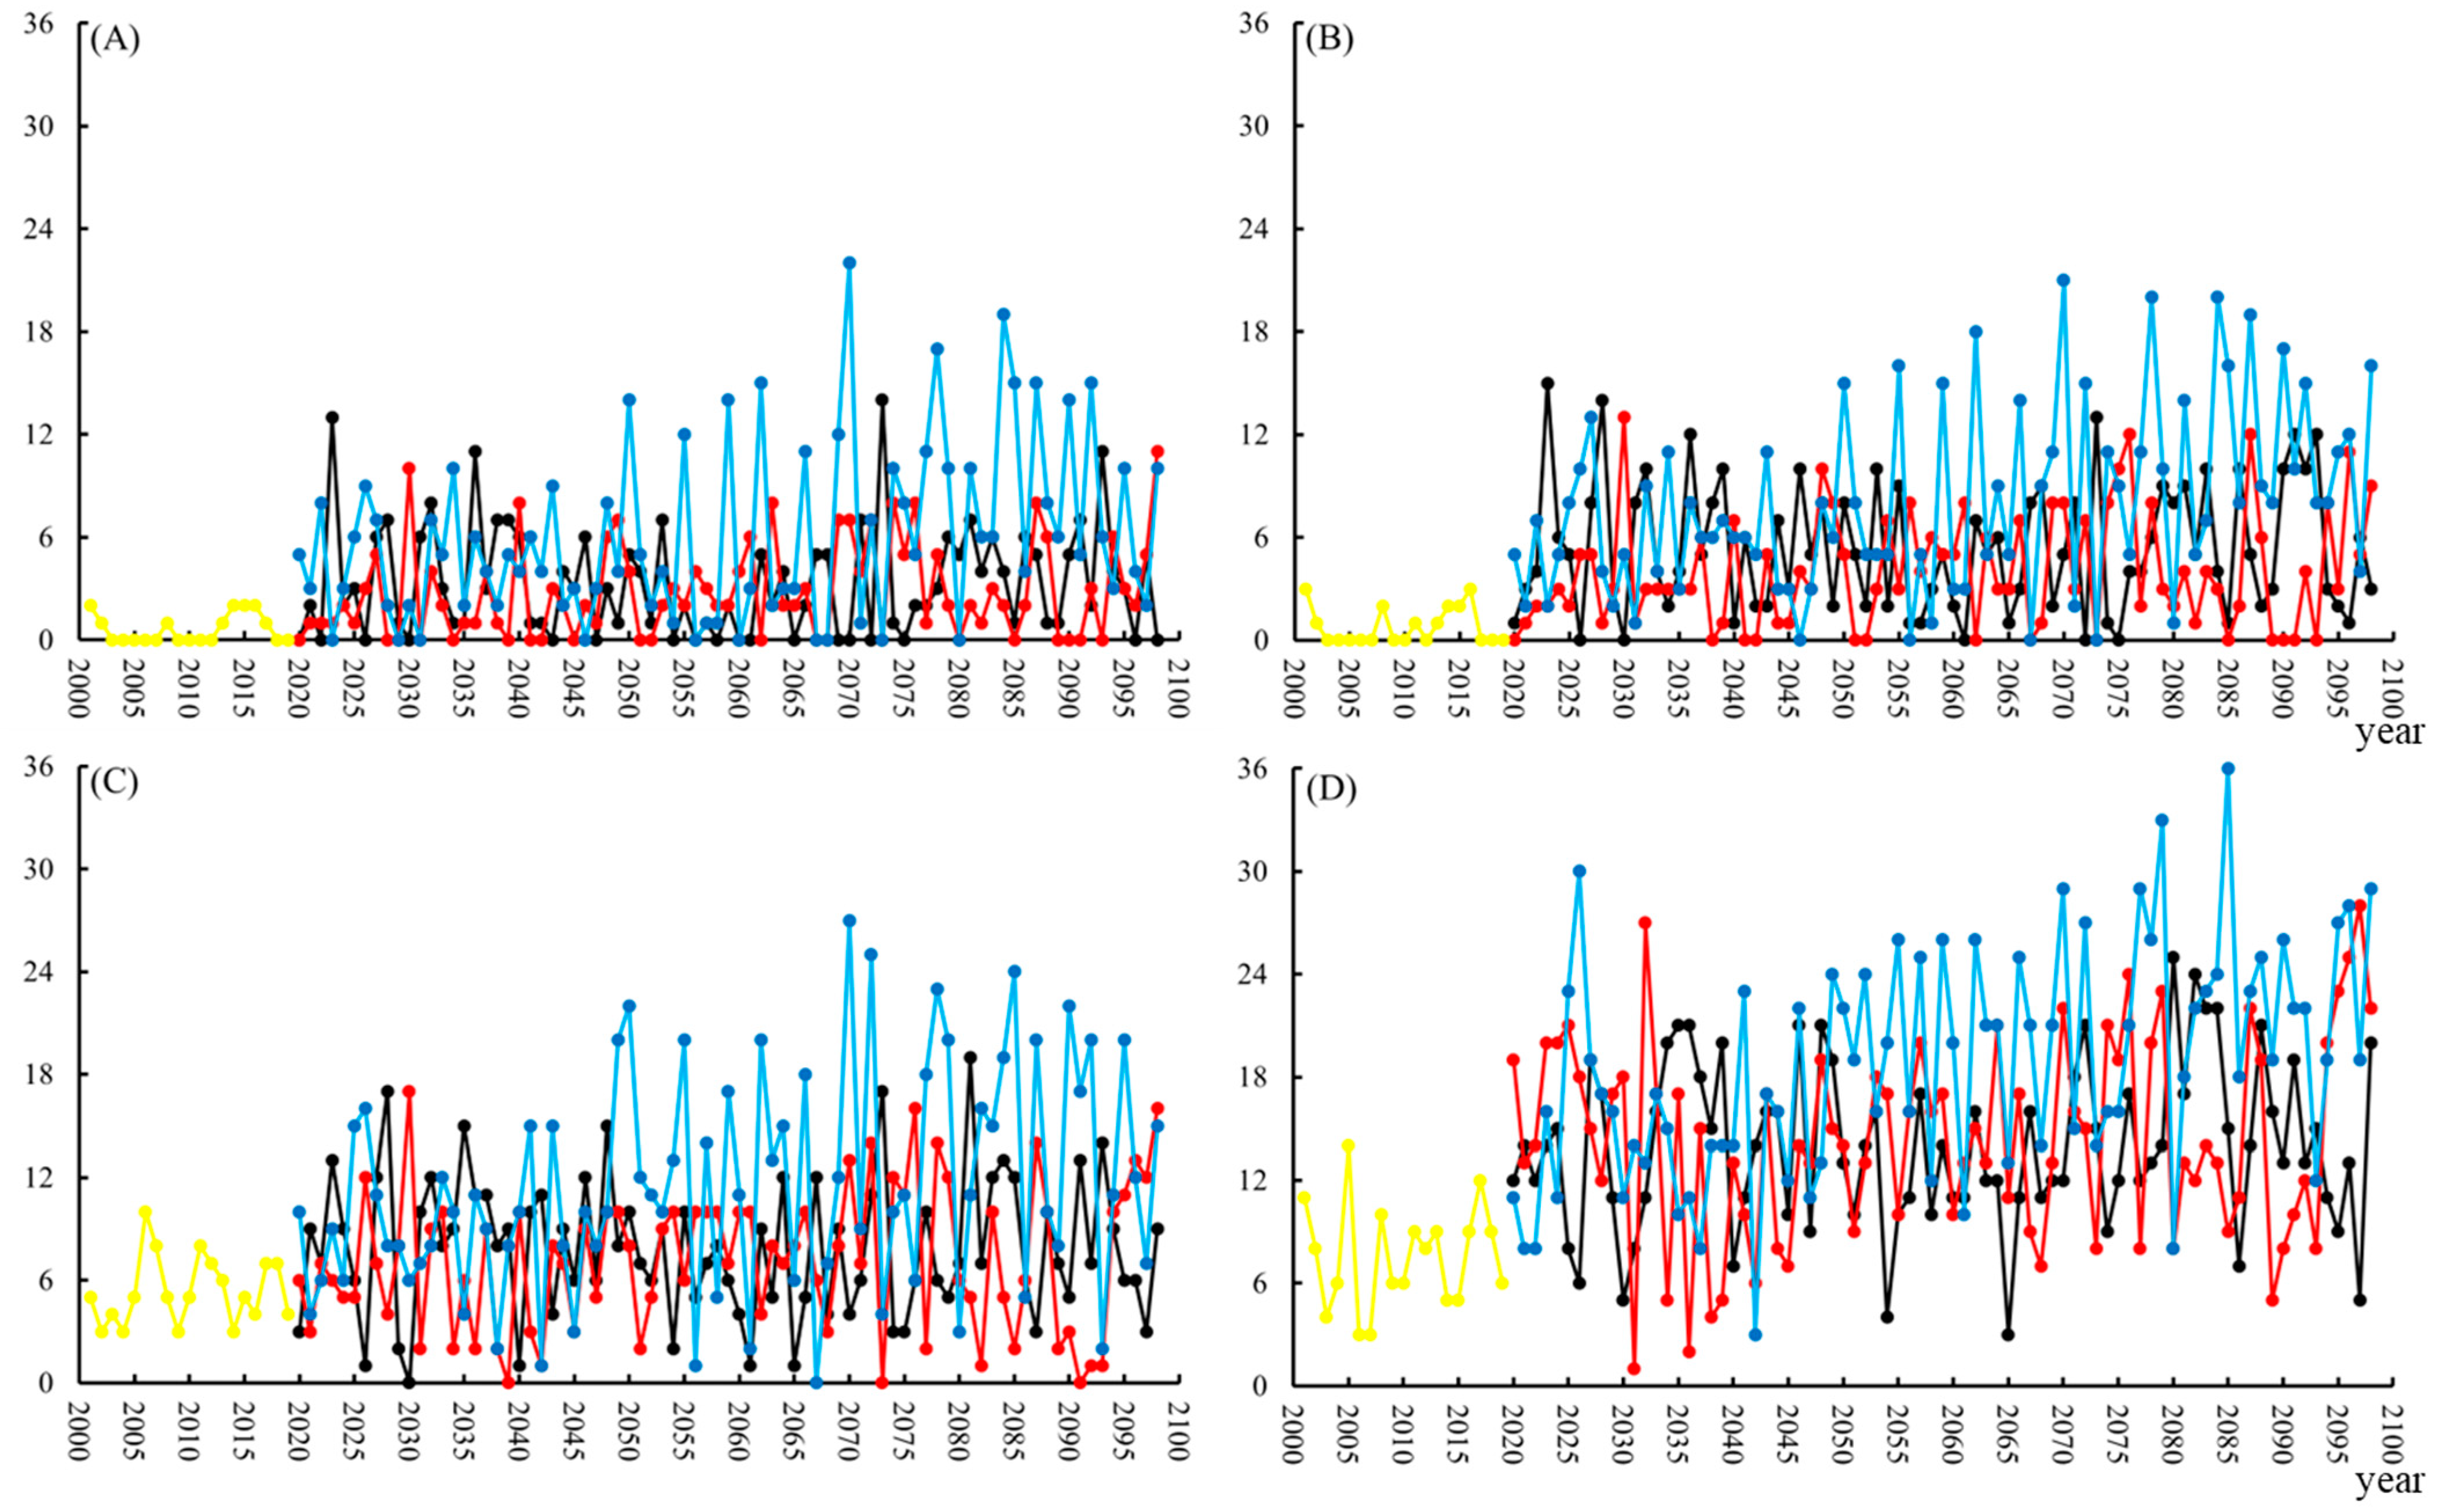
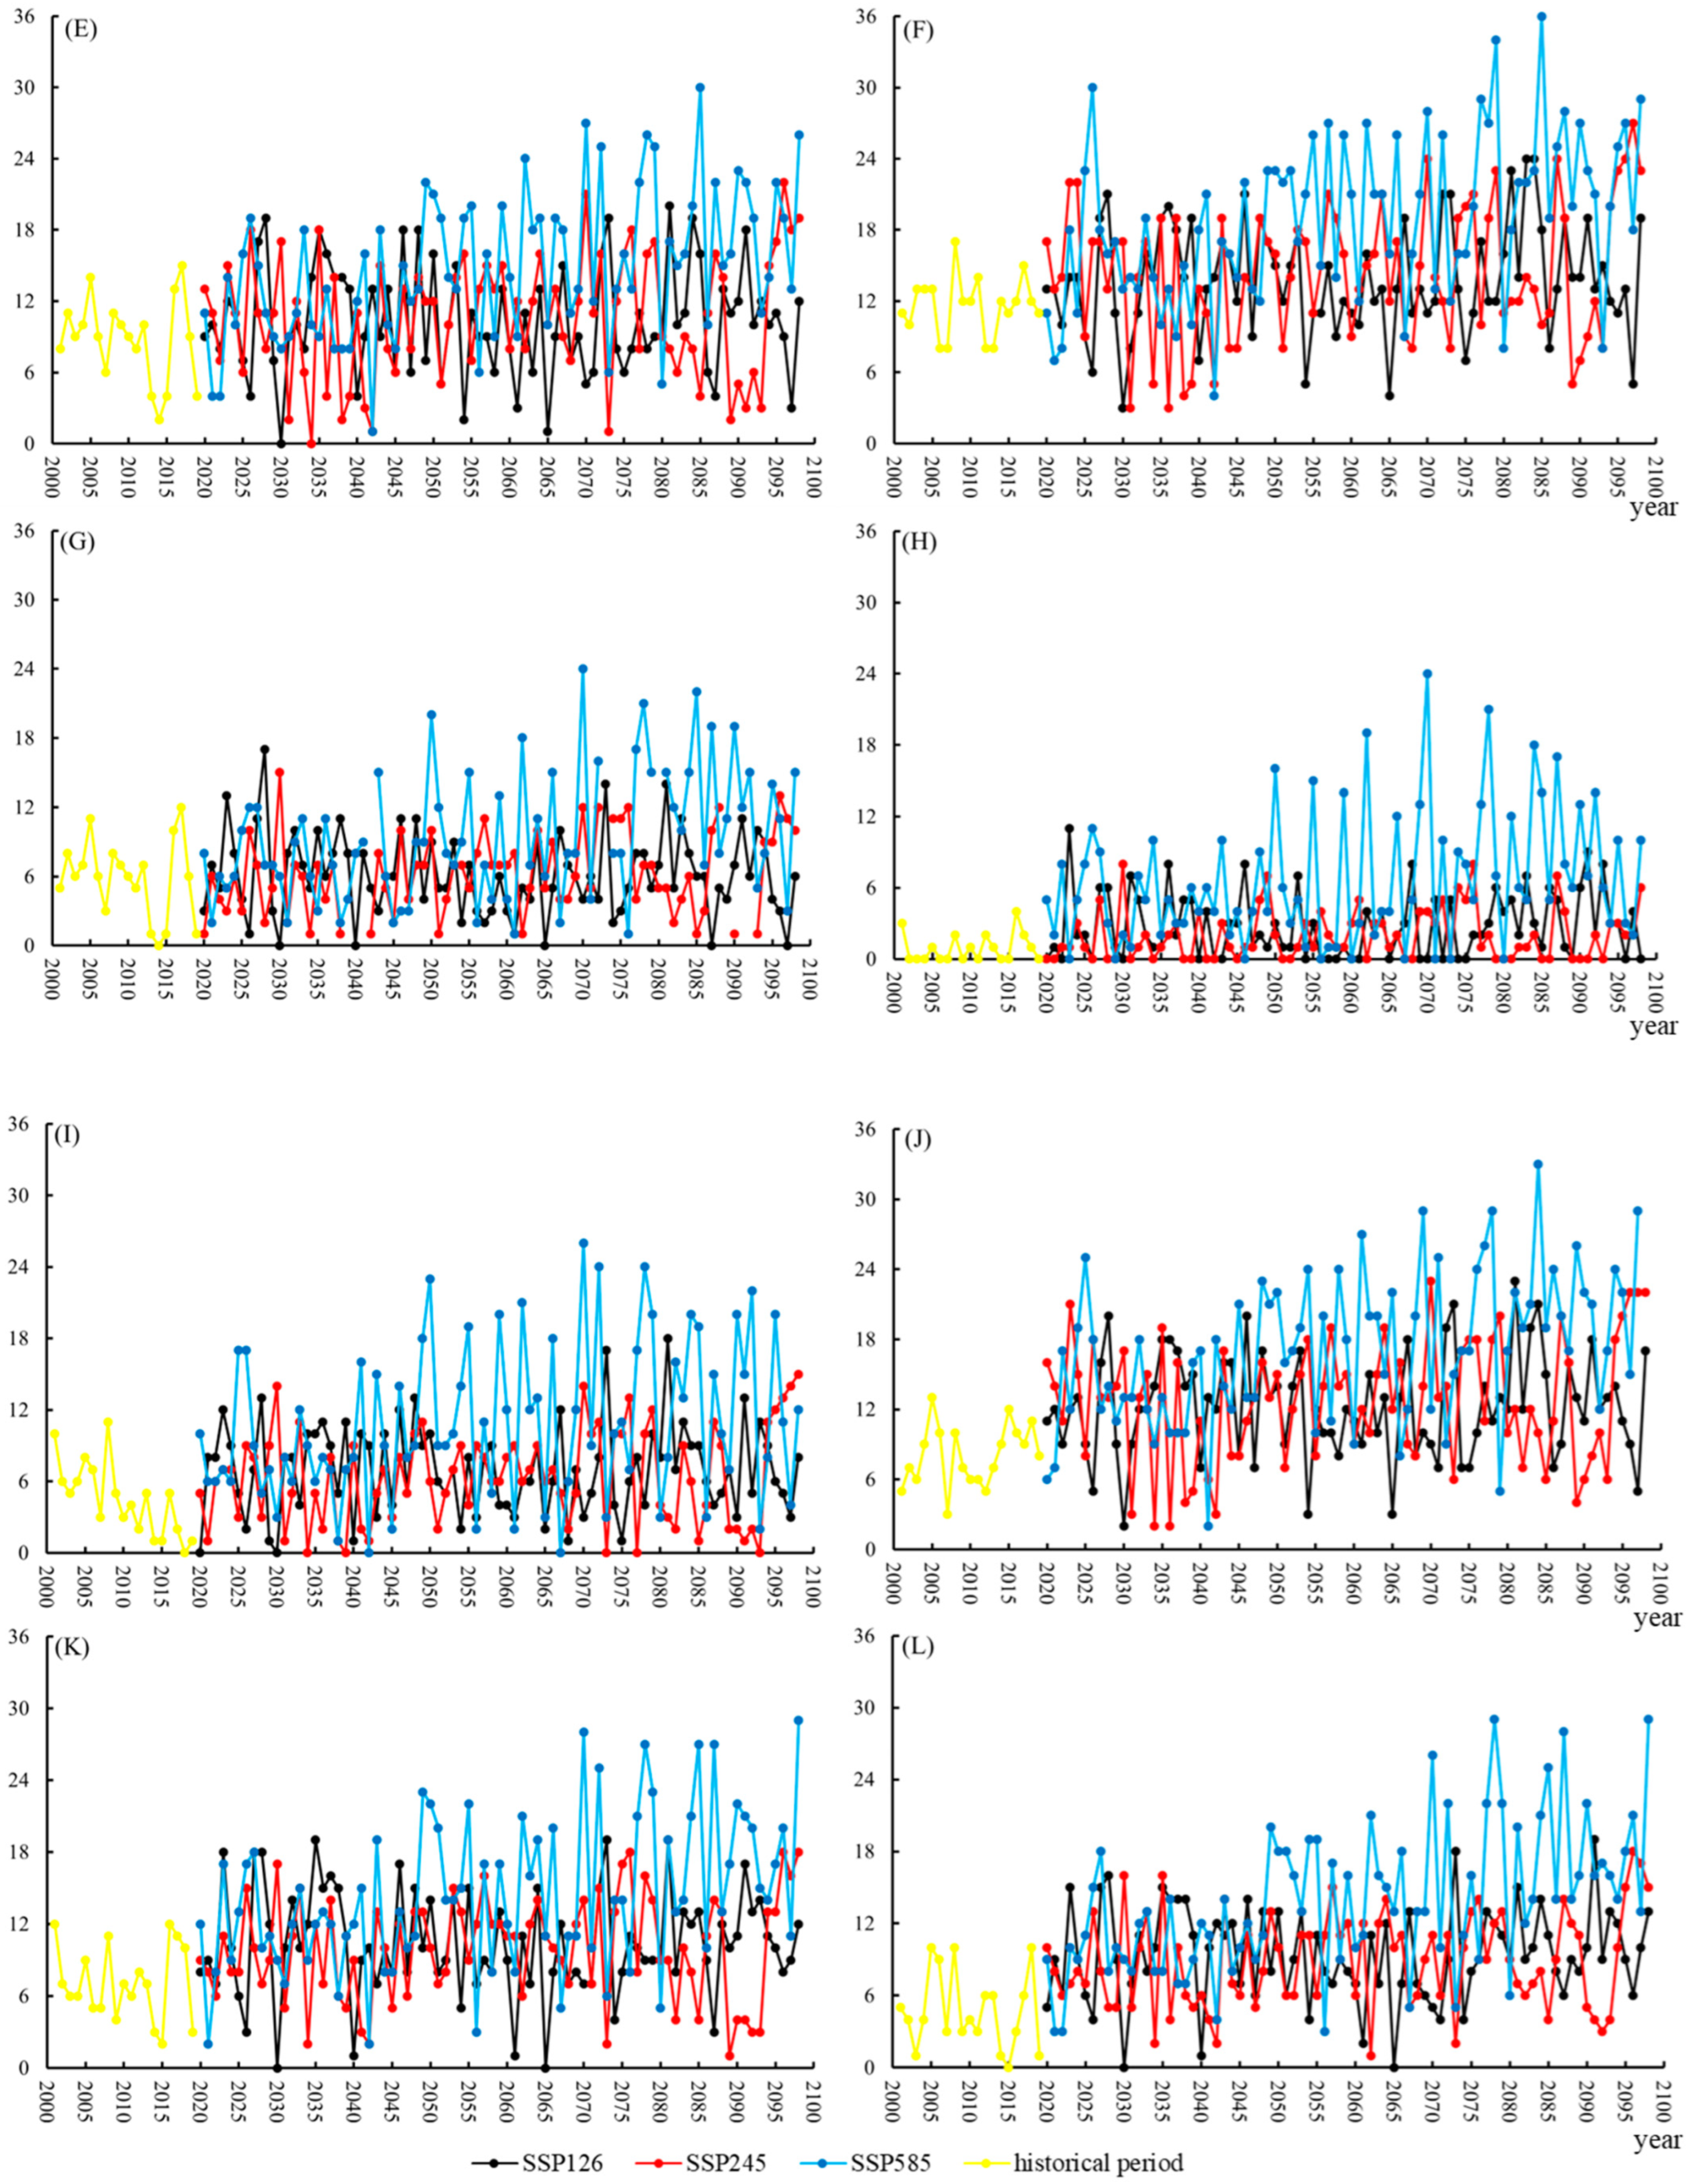
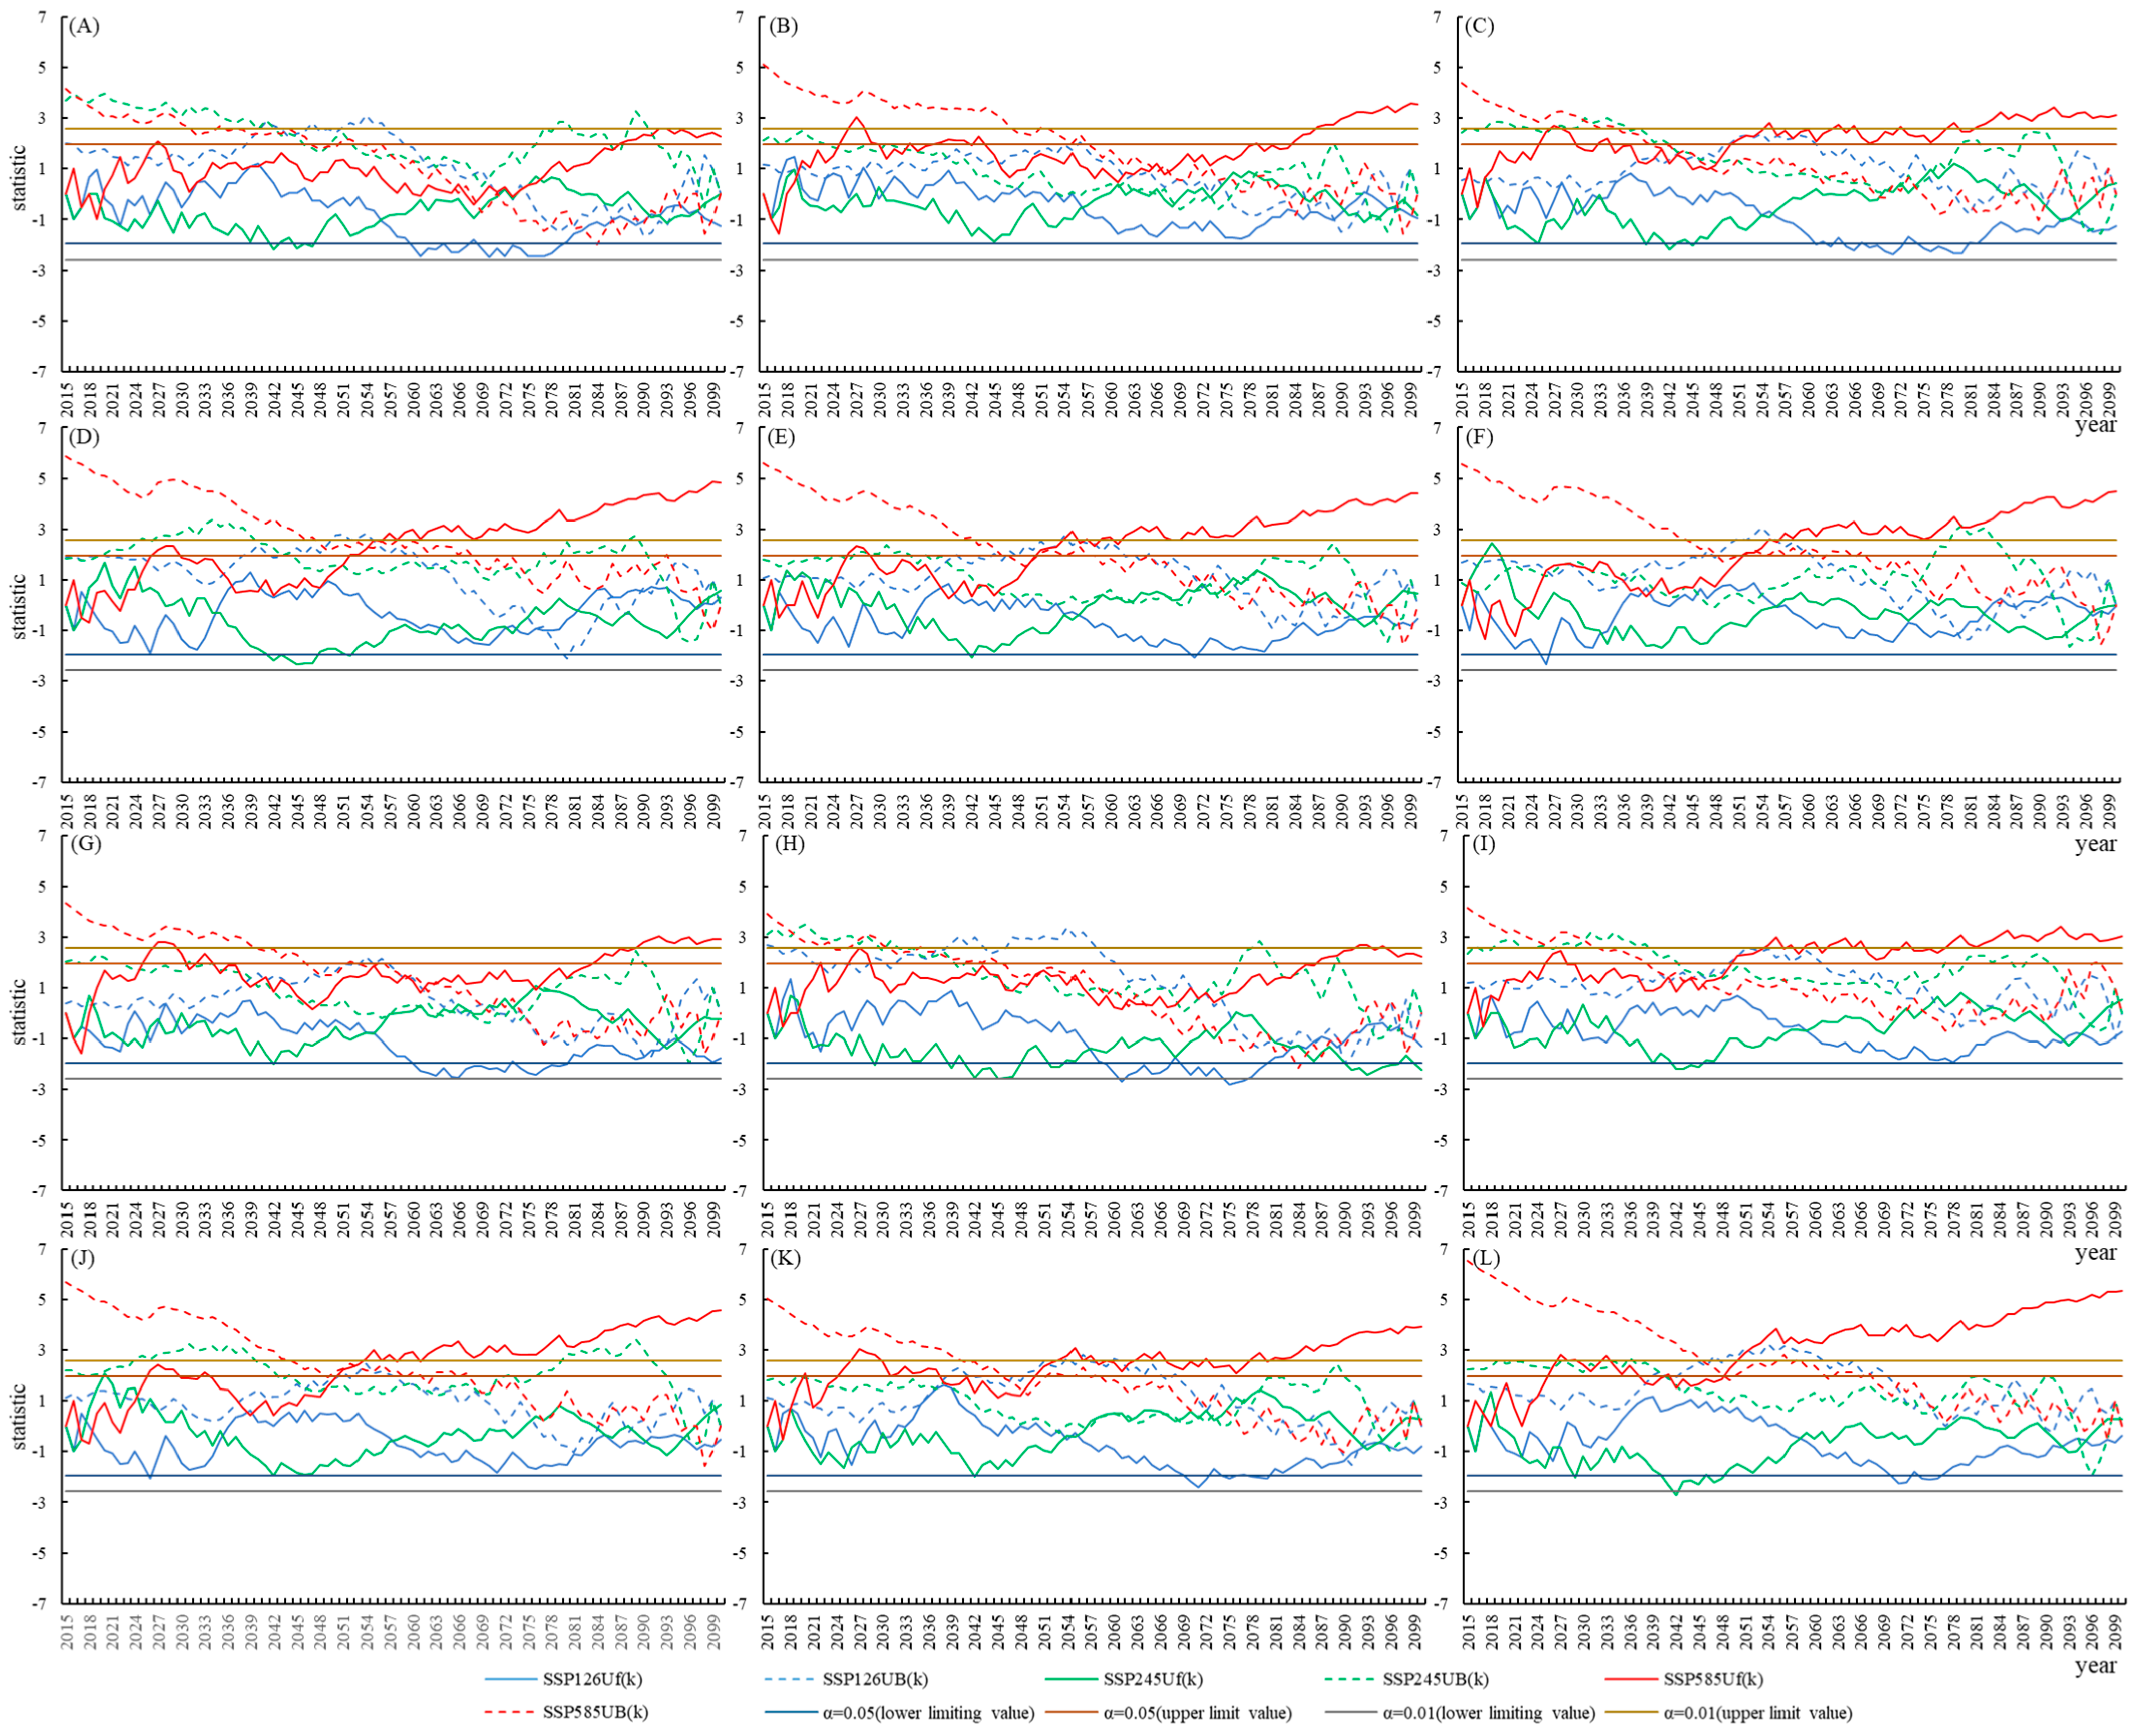
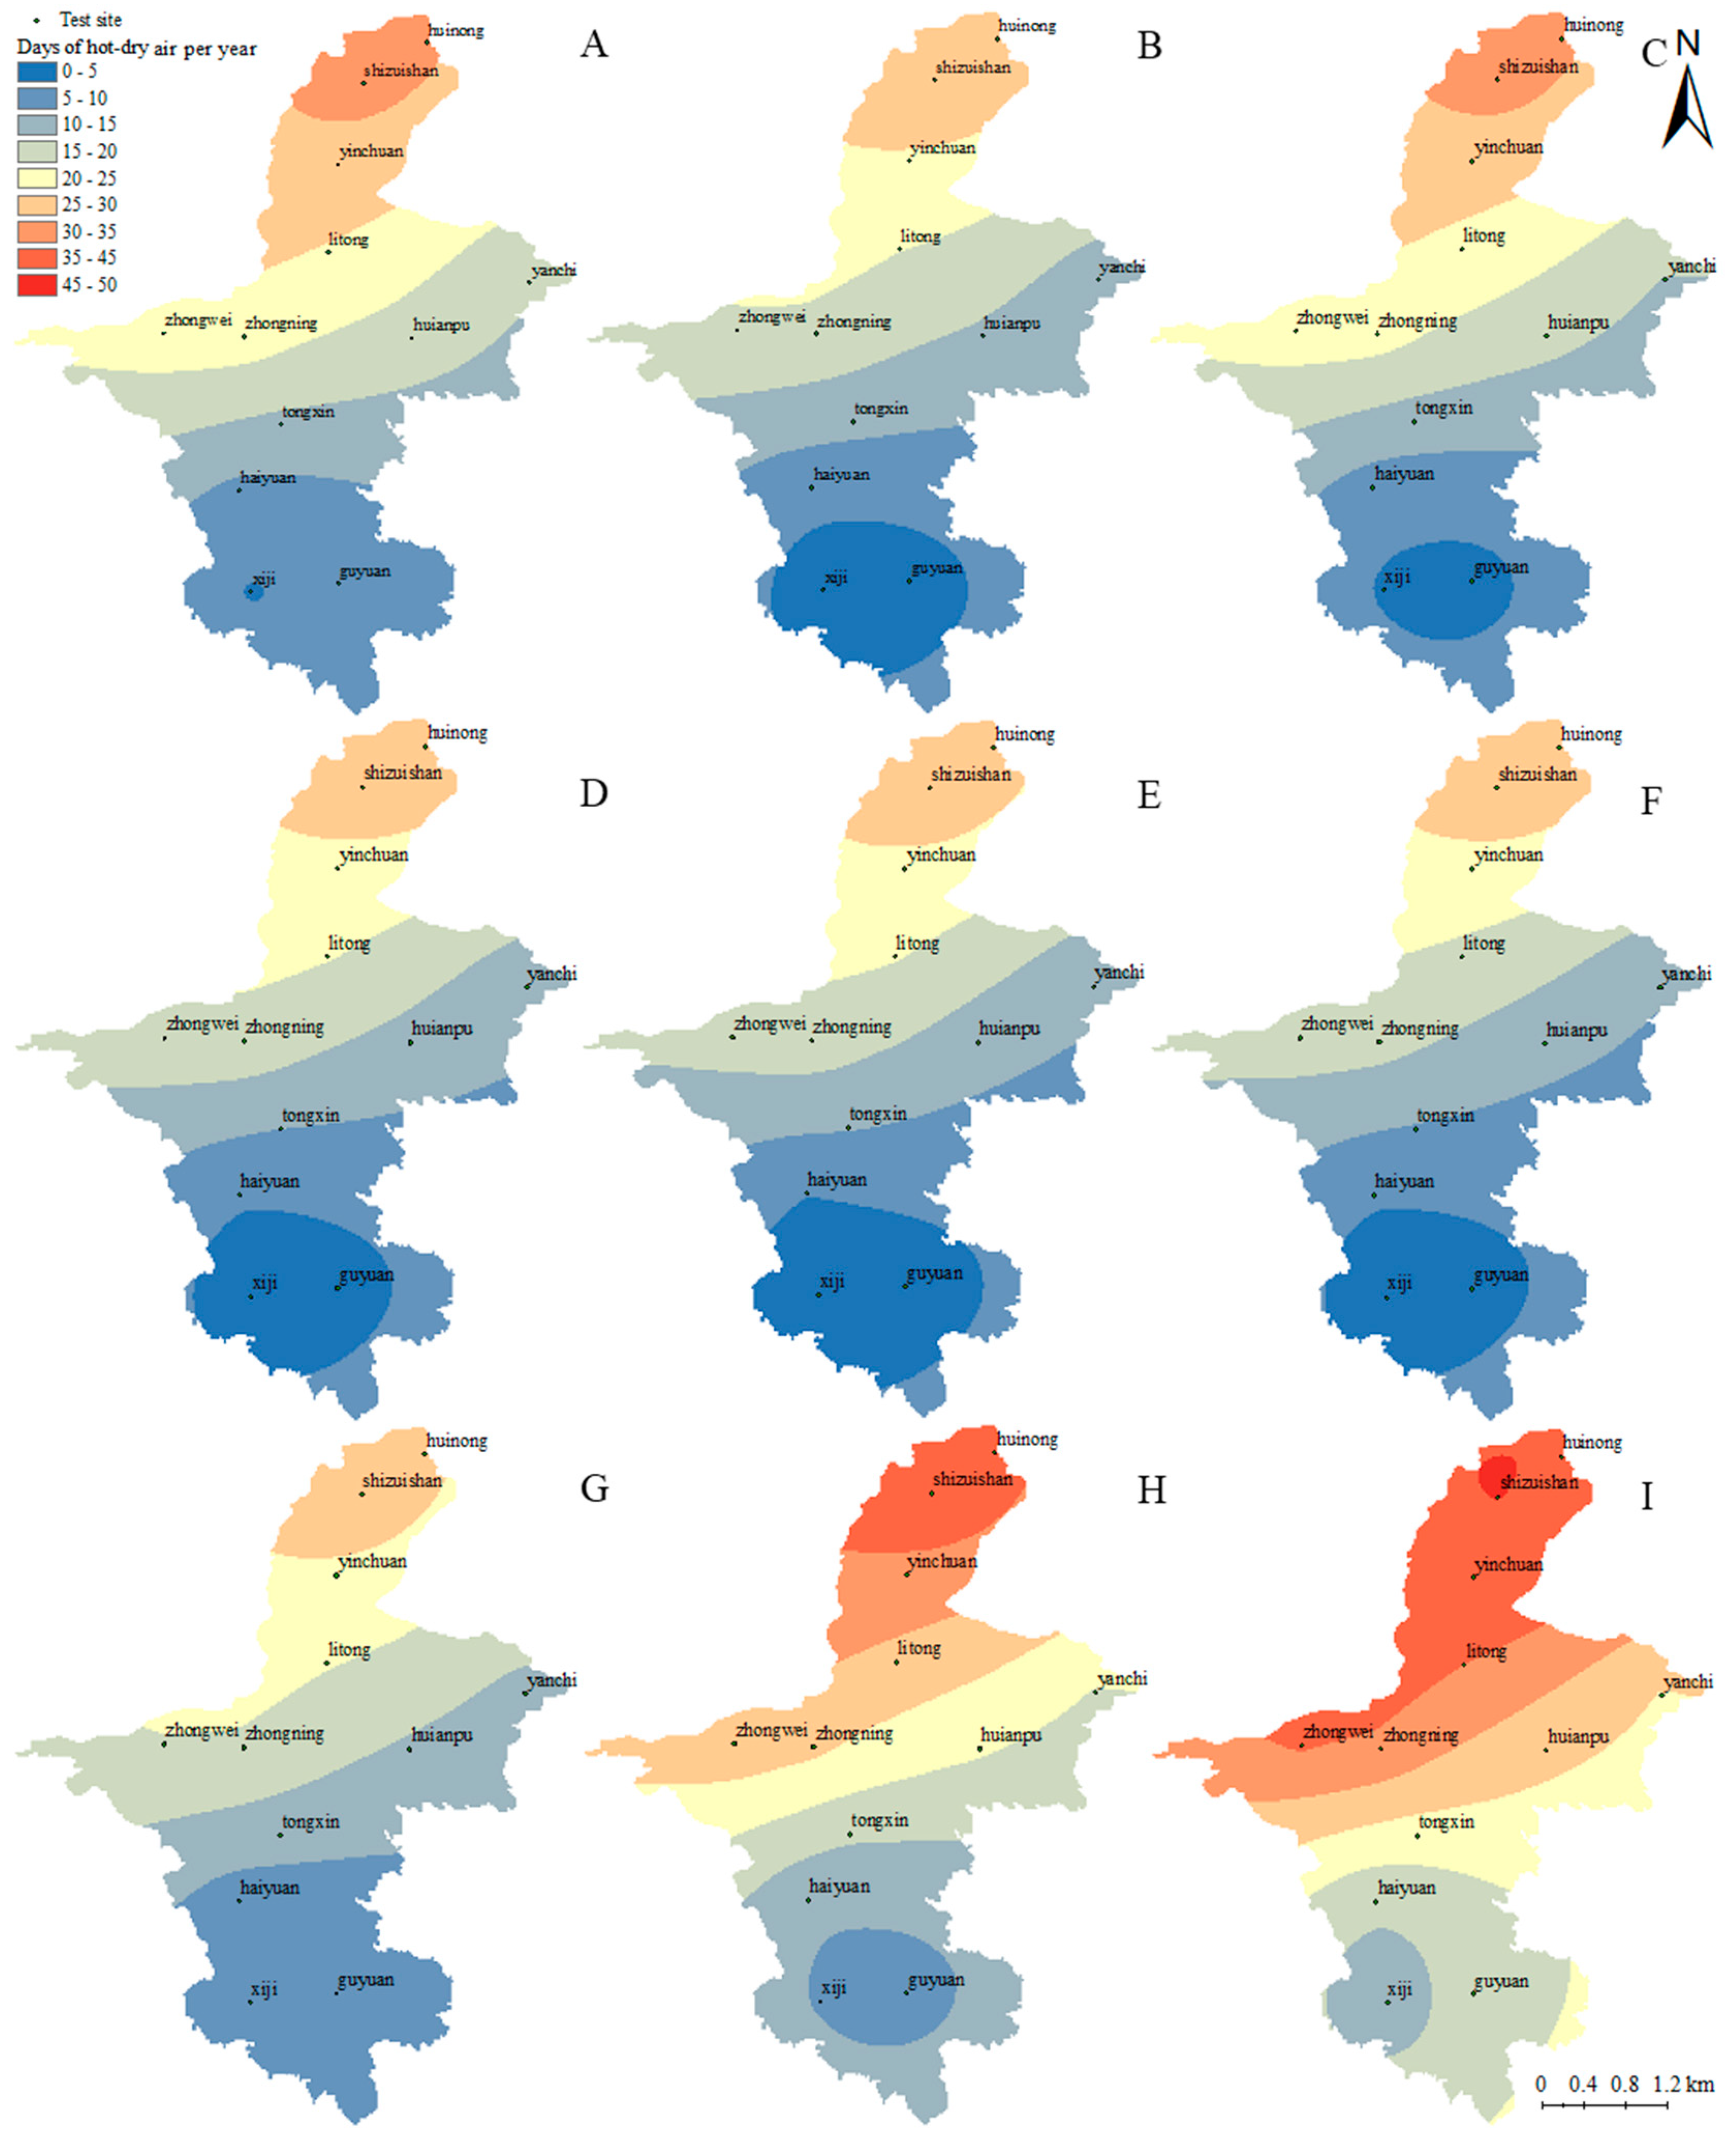
3.2. Future Wheat DHW Temporal and Spatial Changes in Ningxia
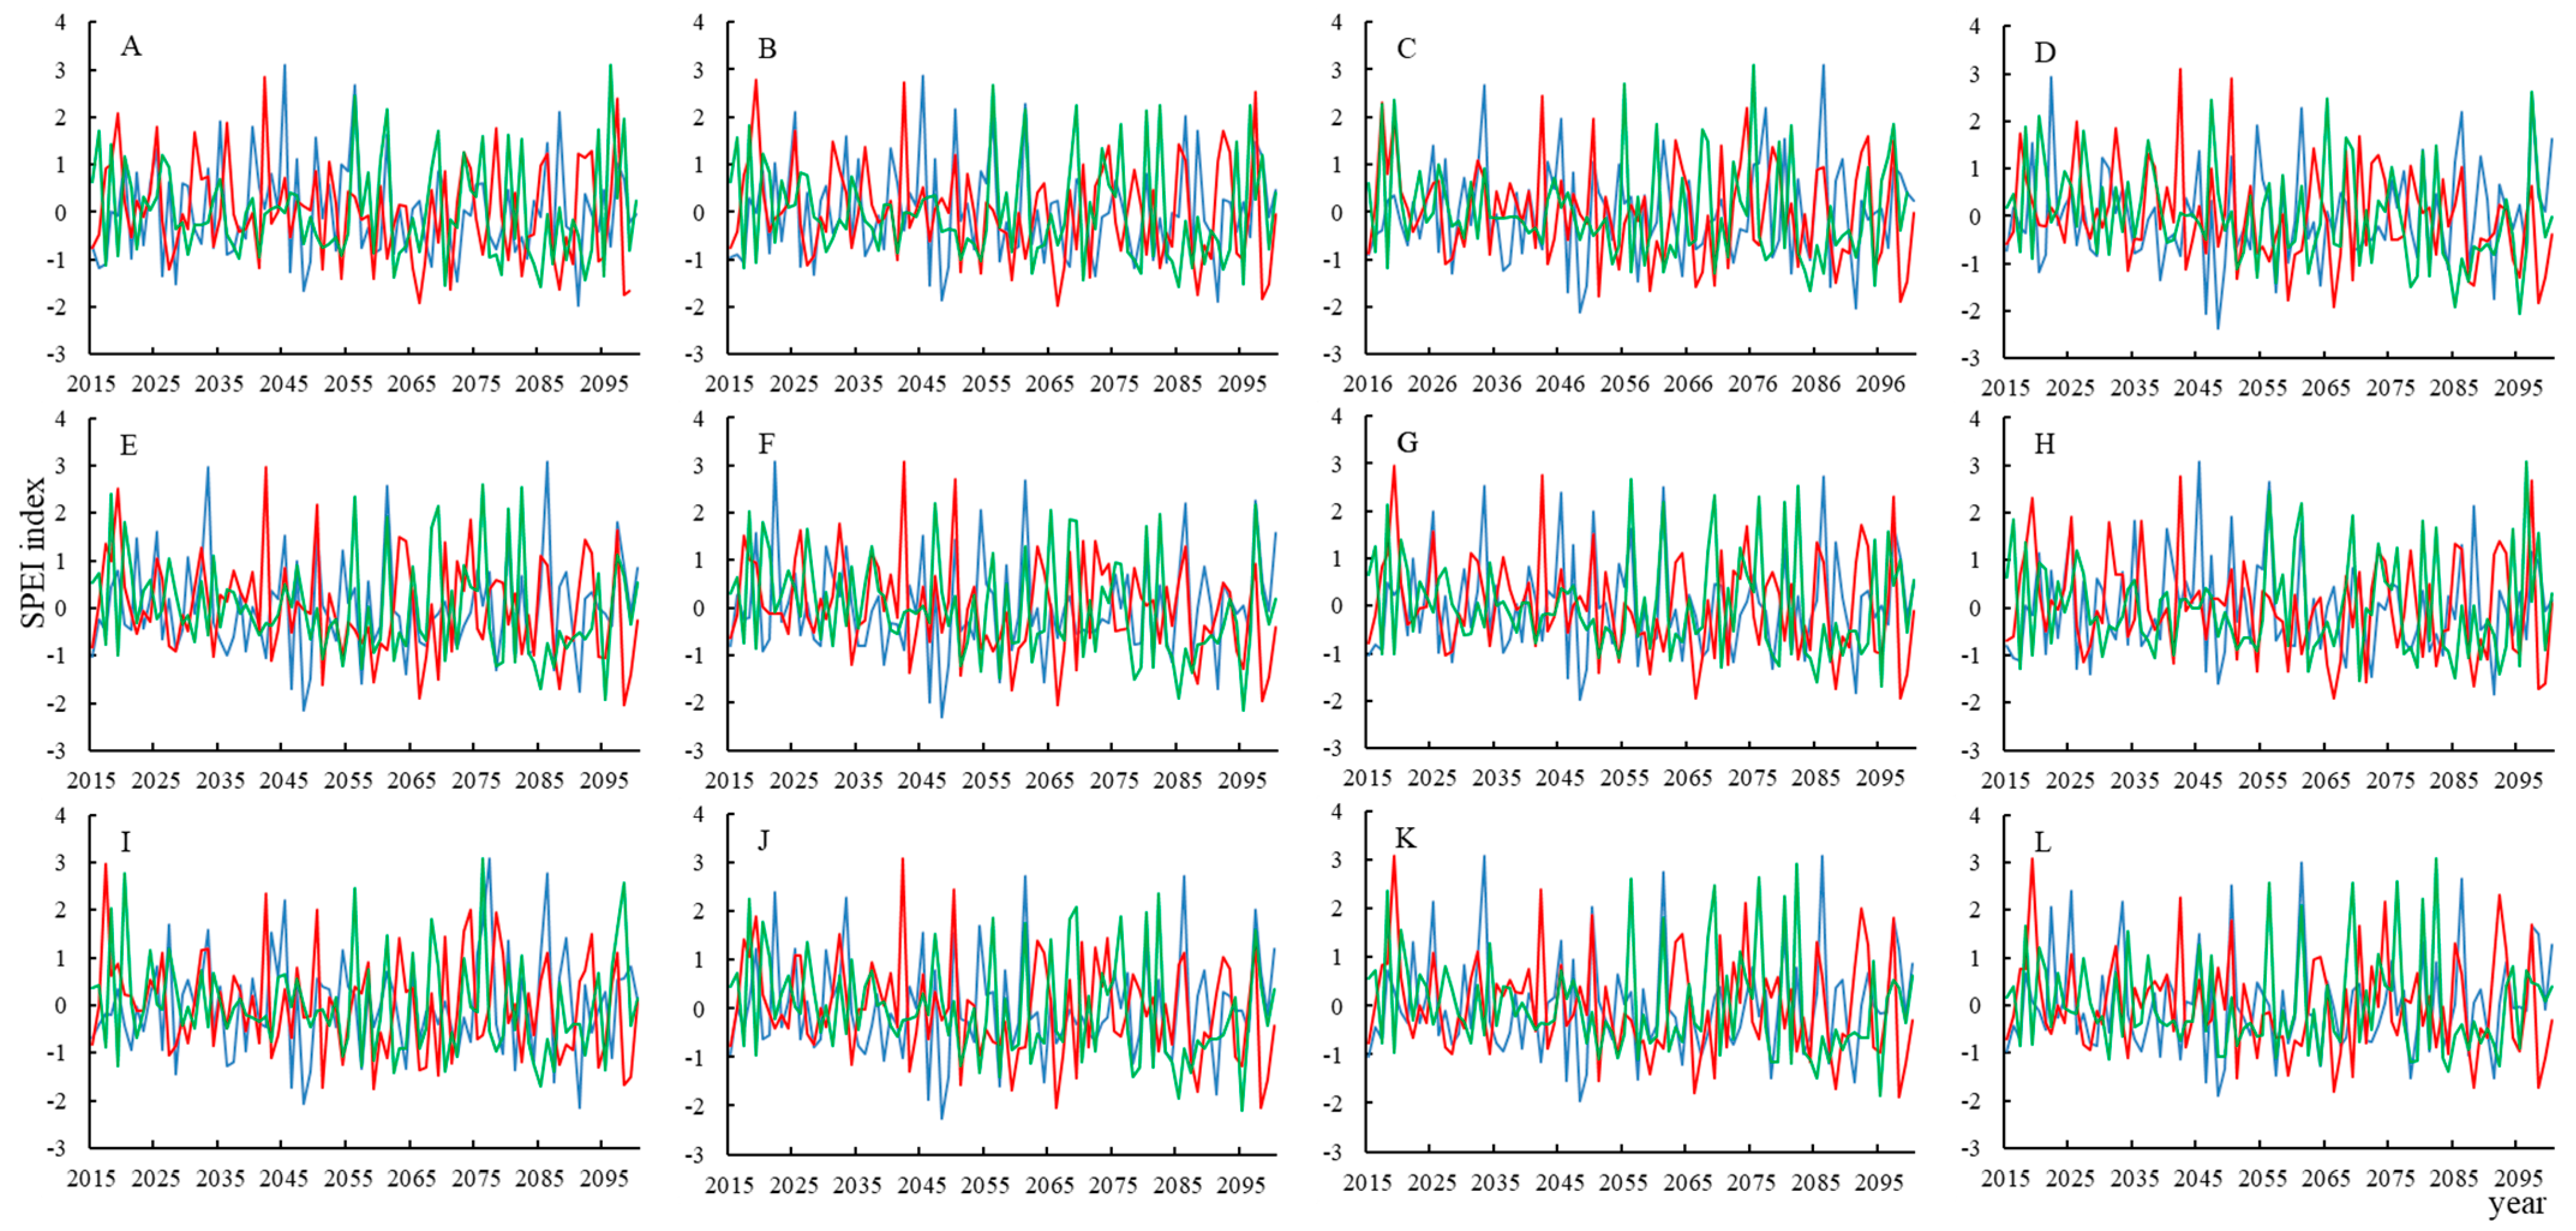
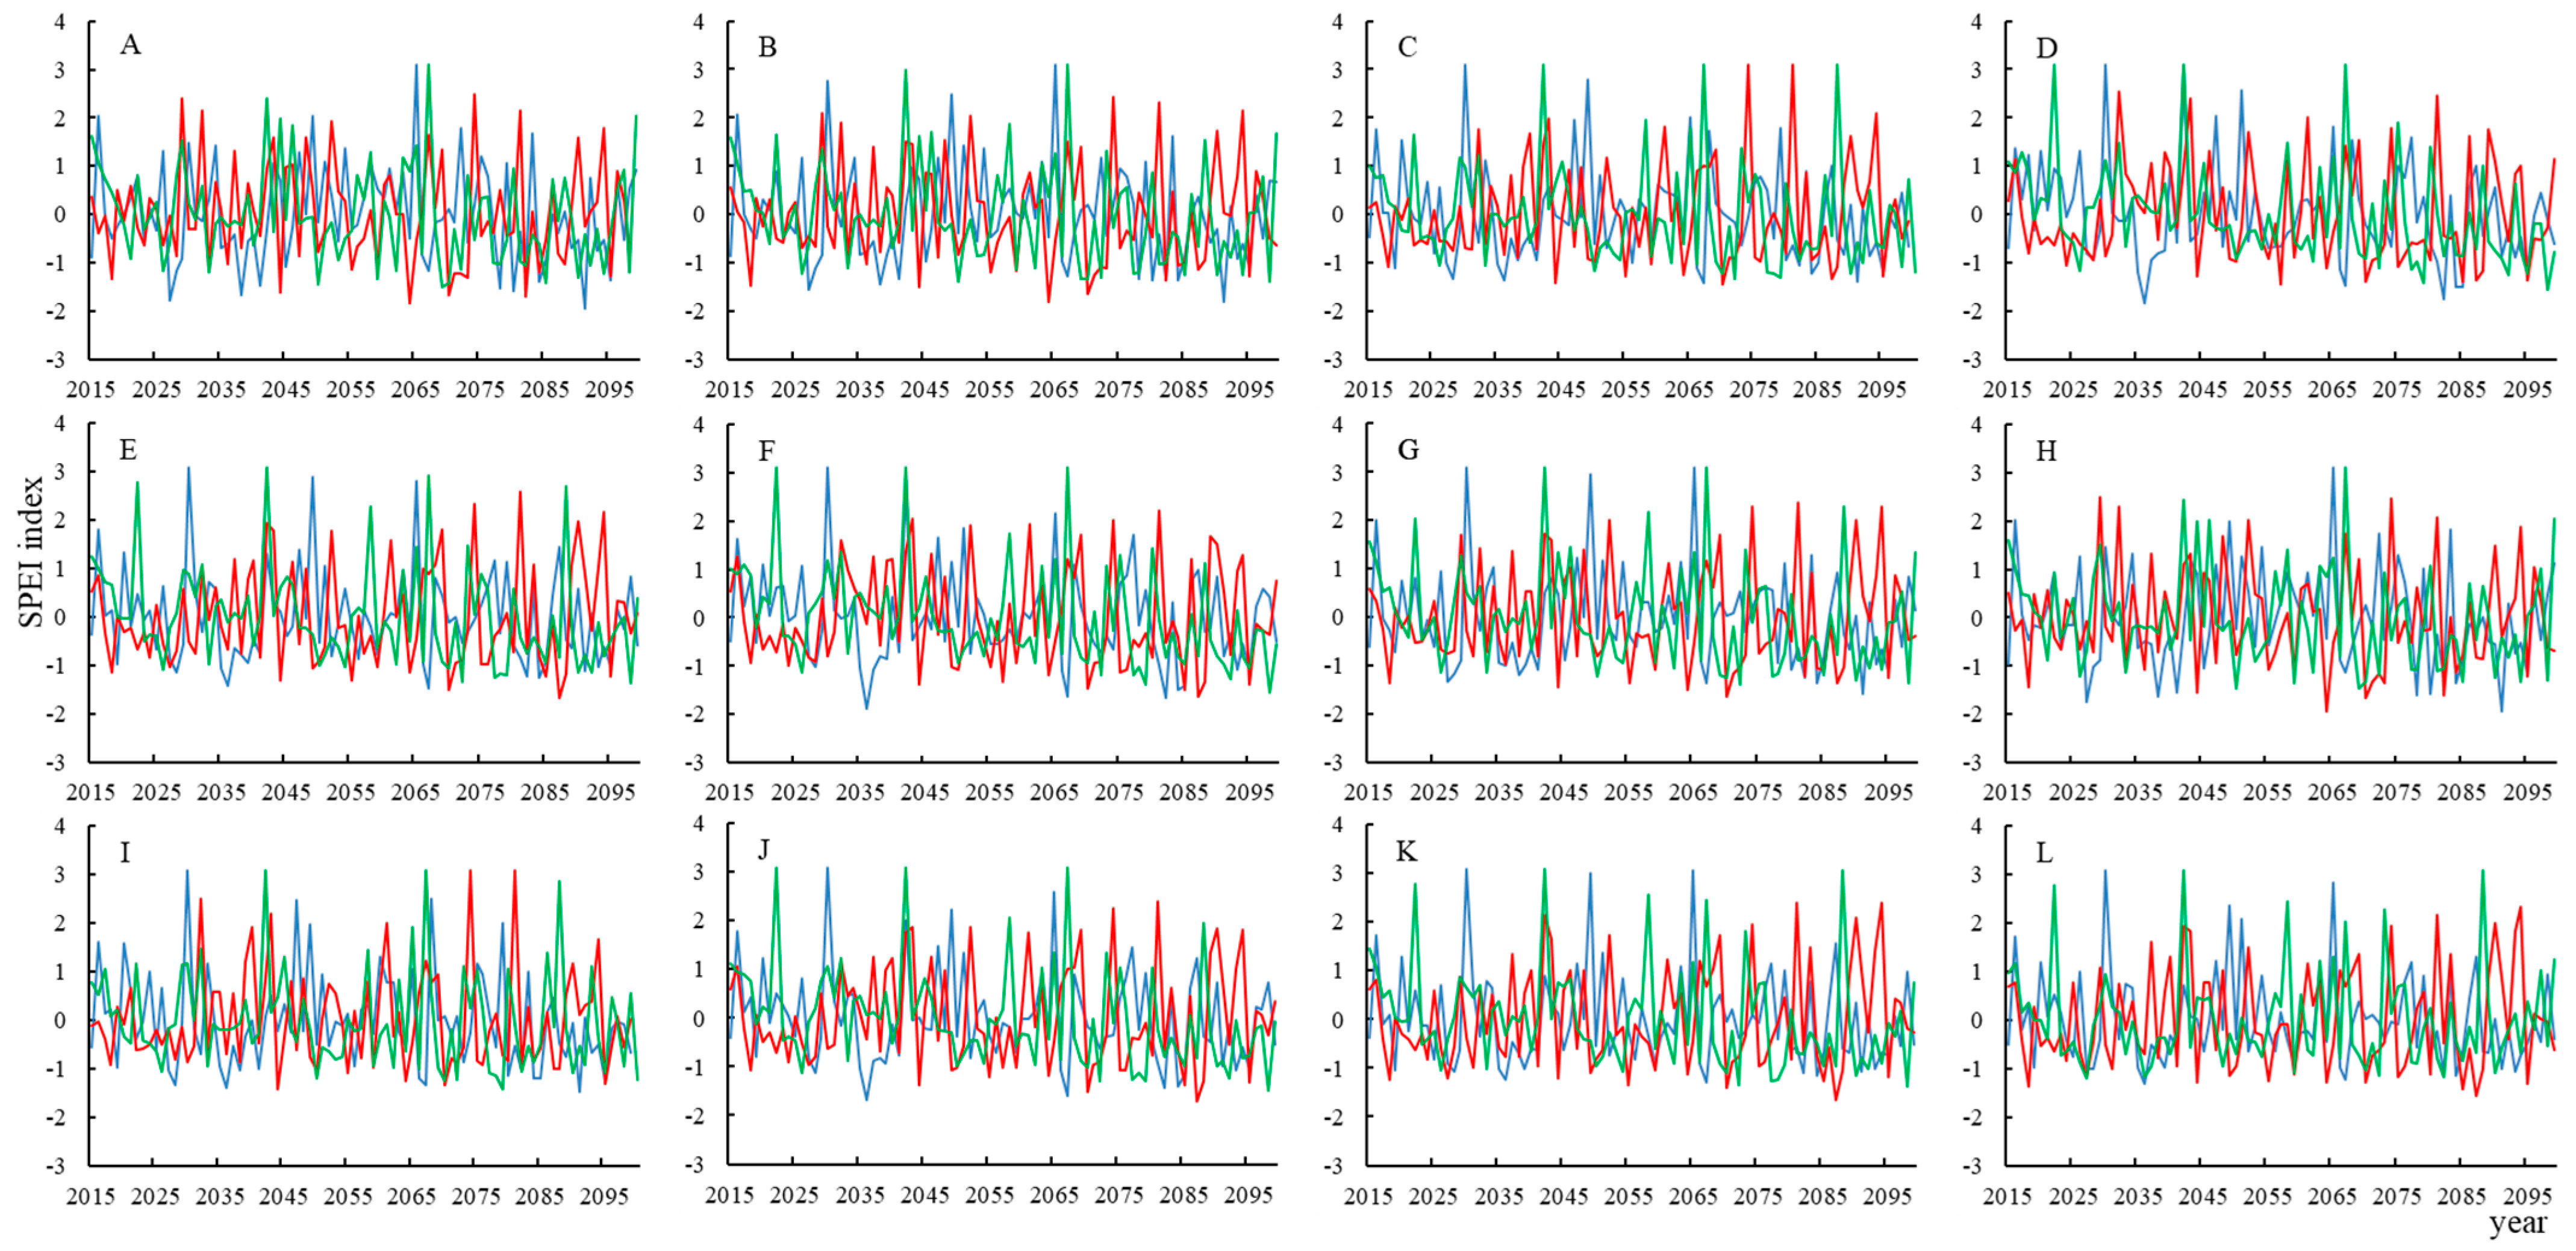
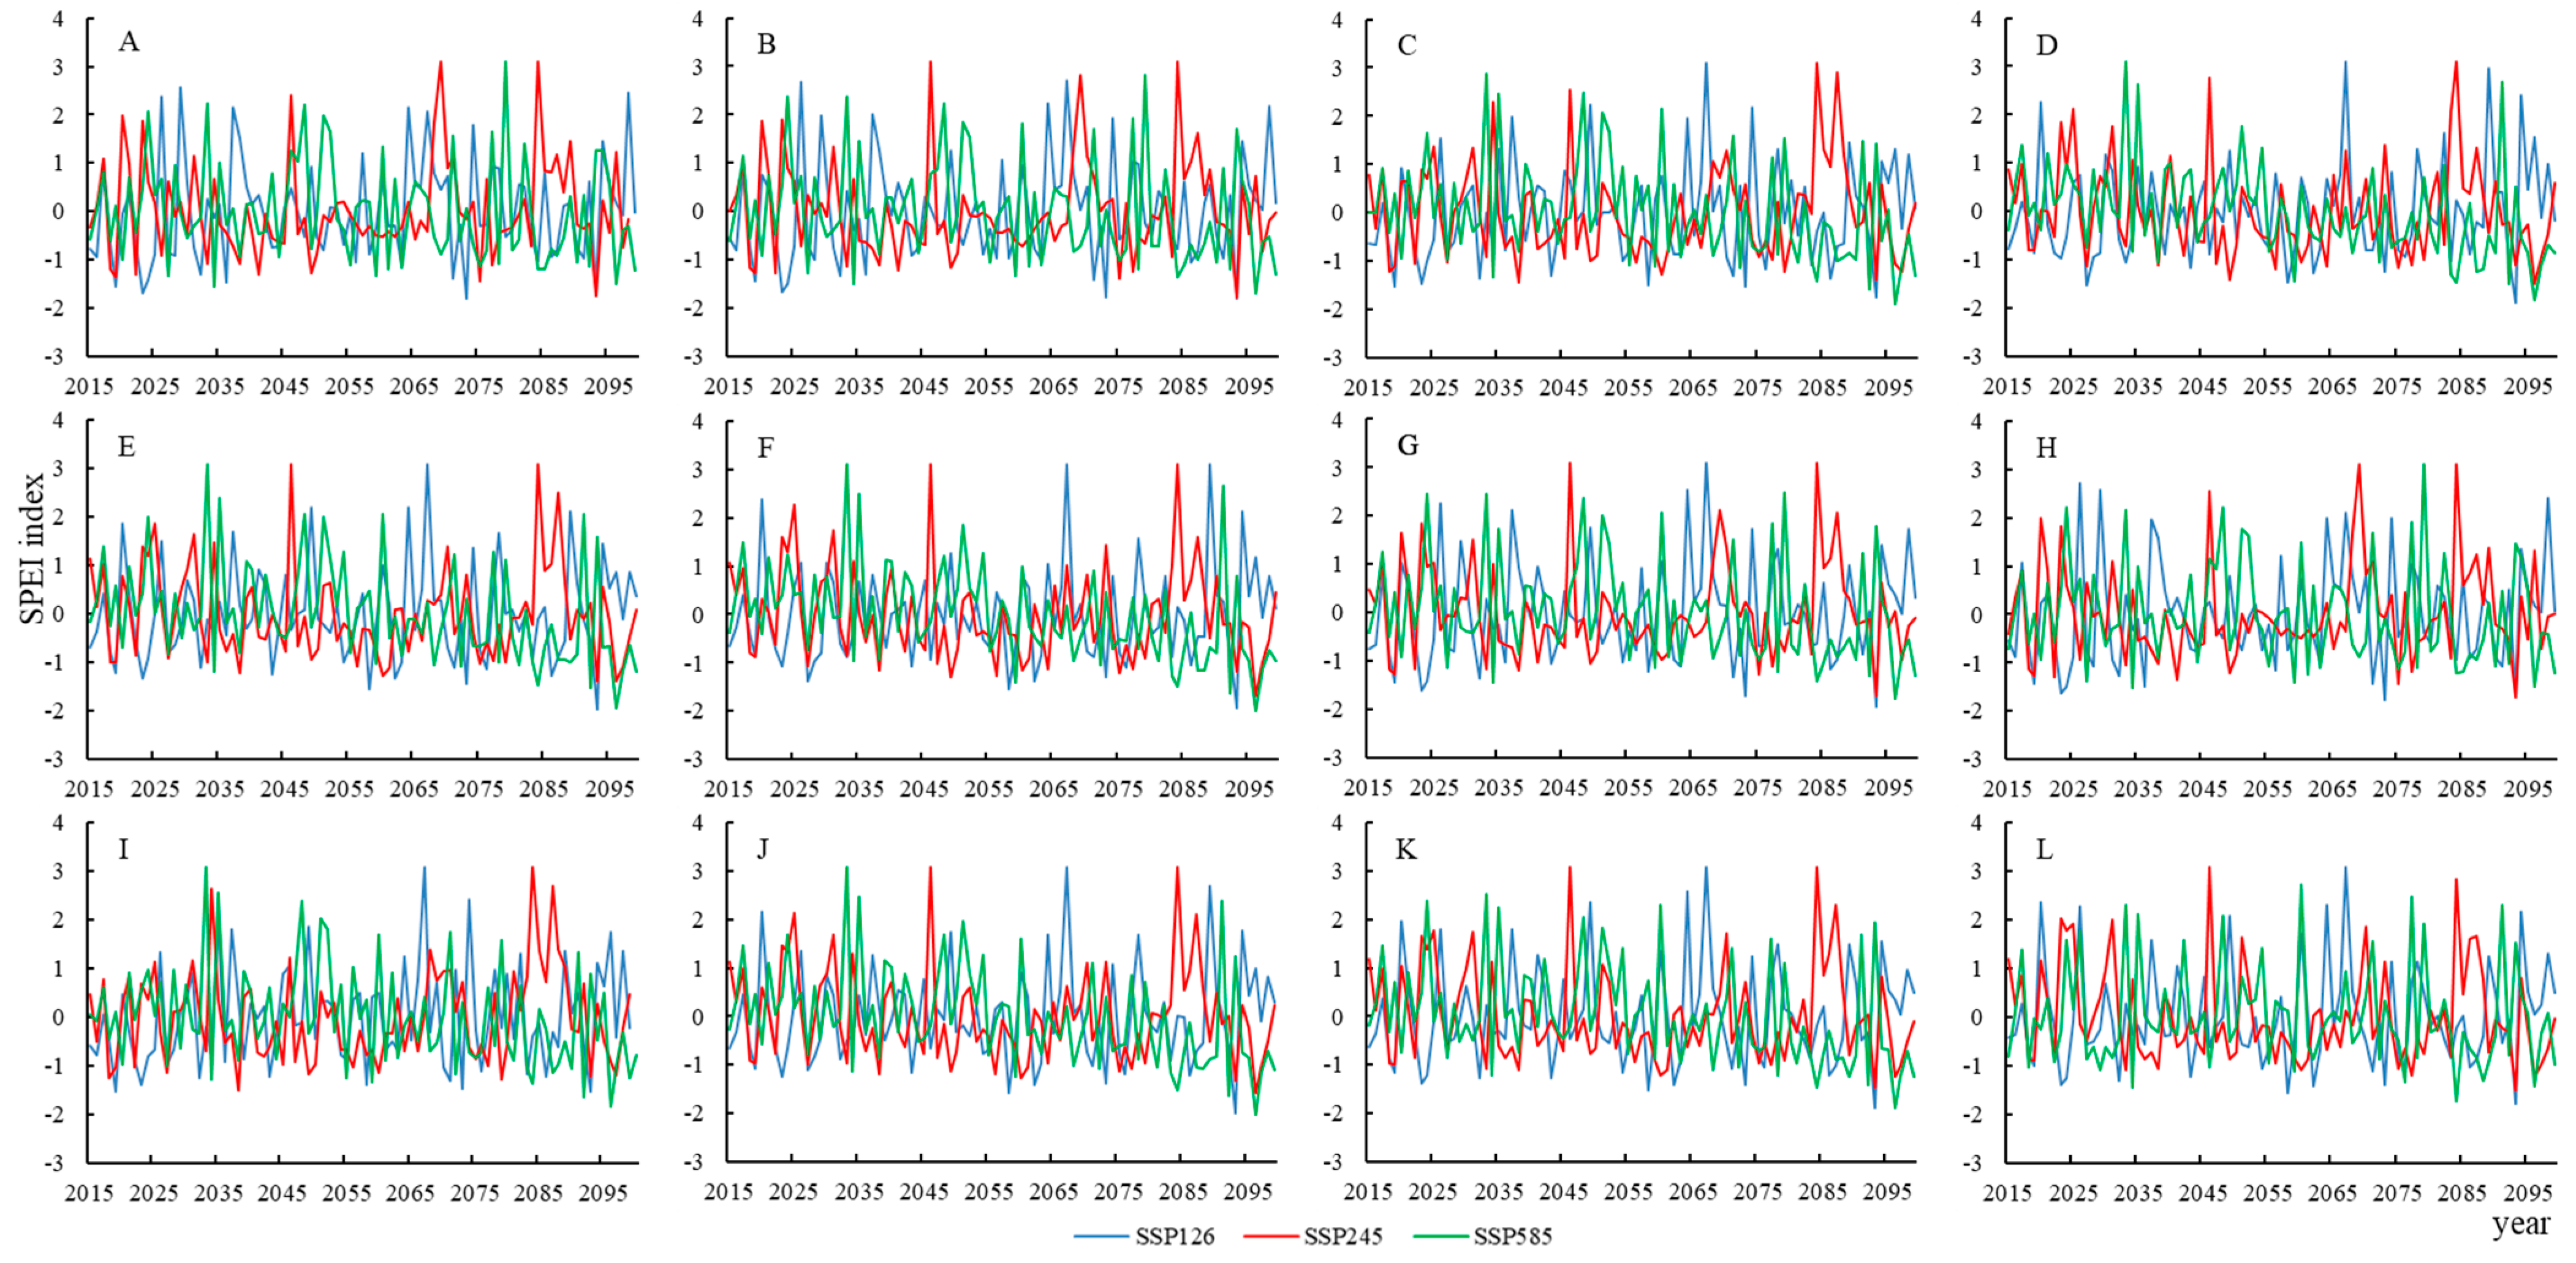
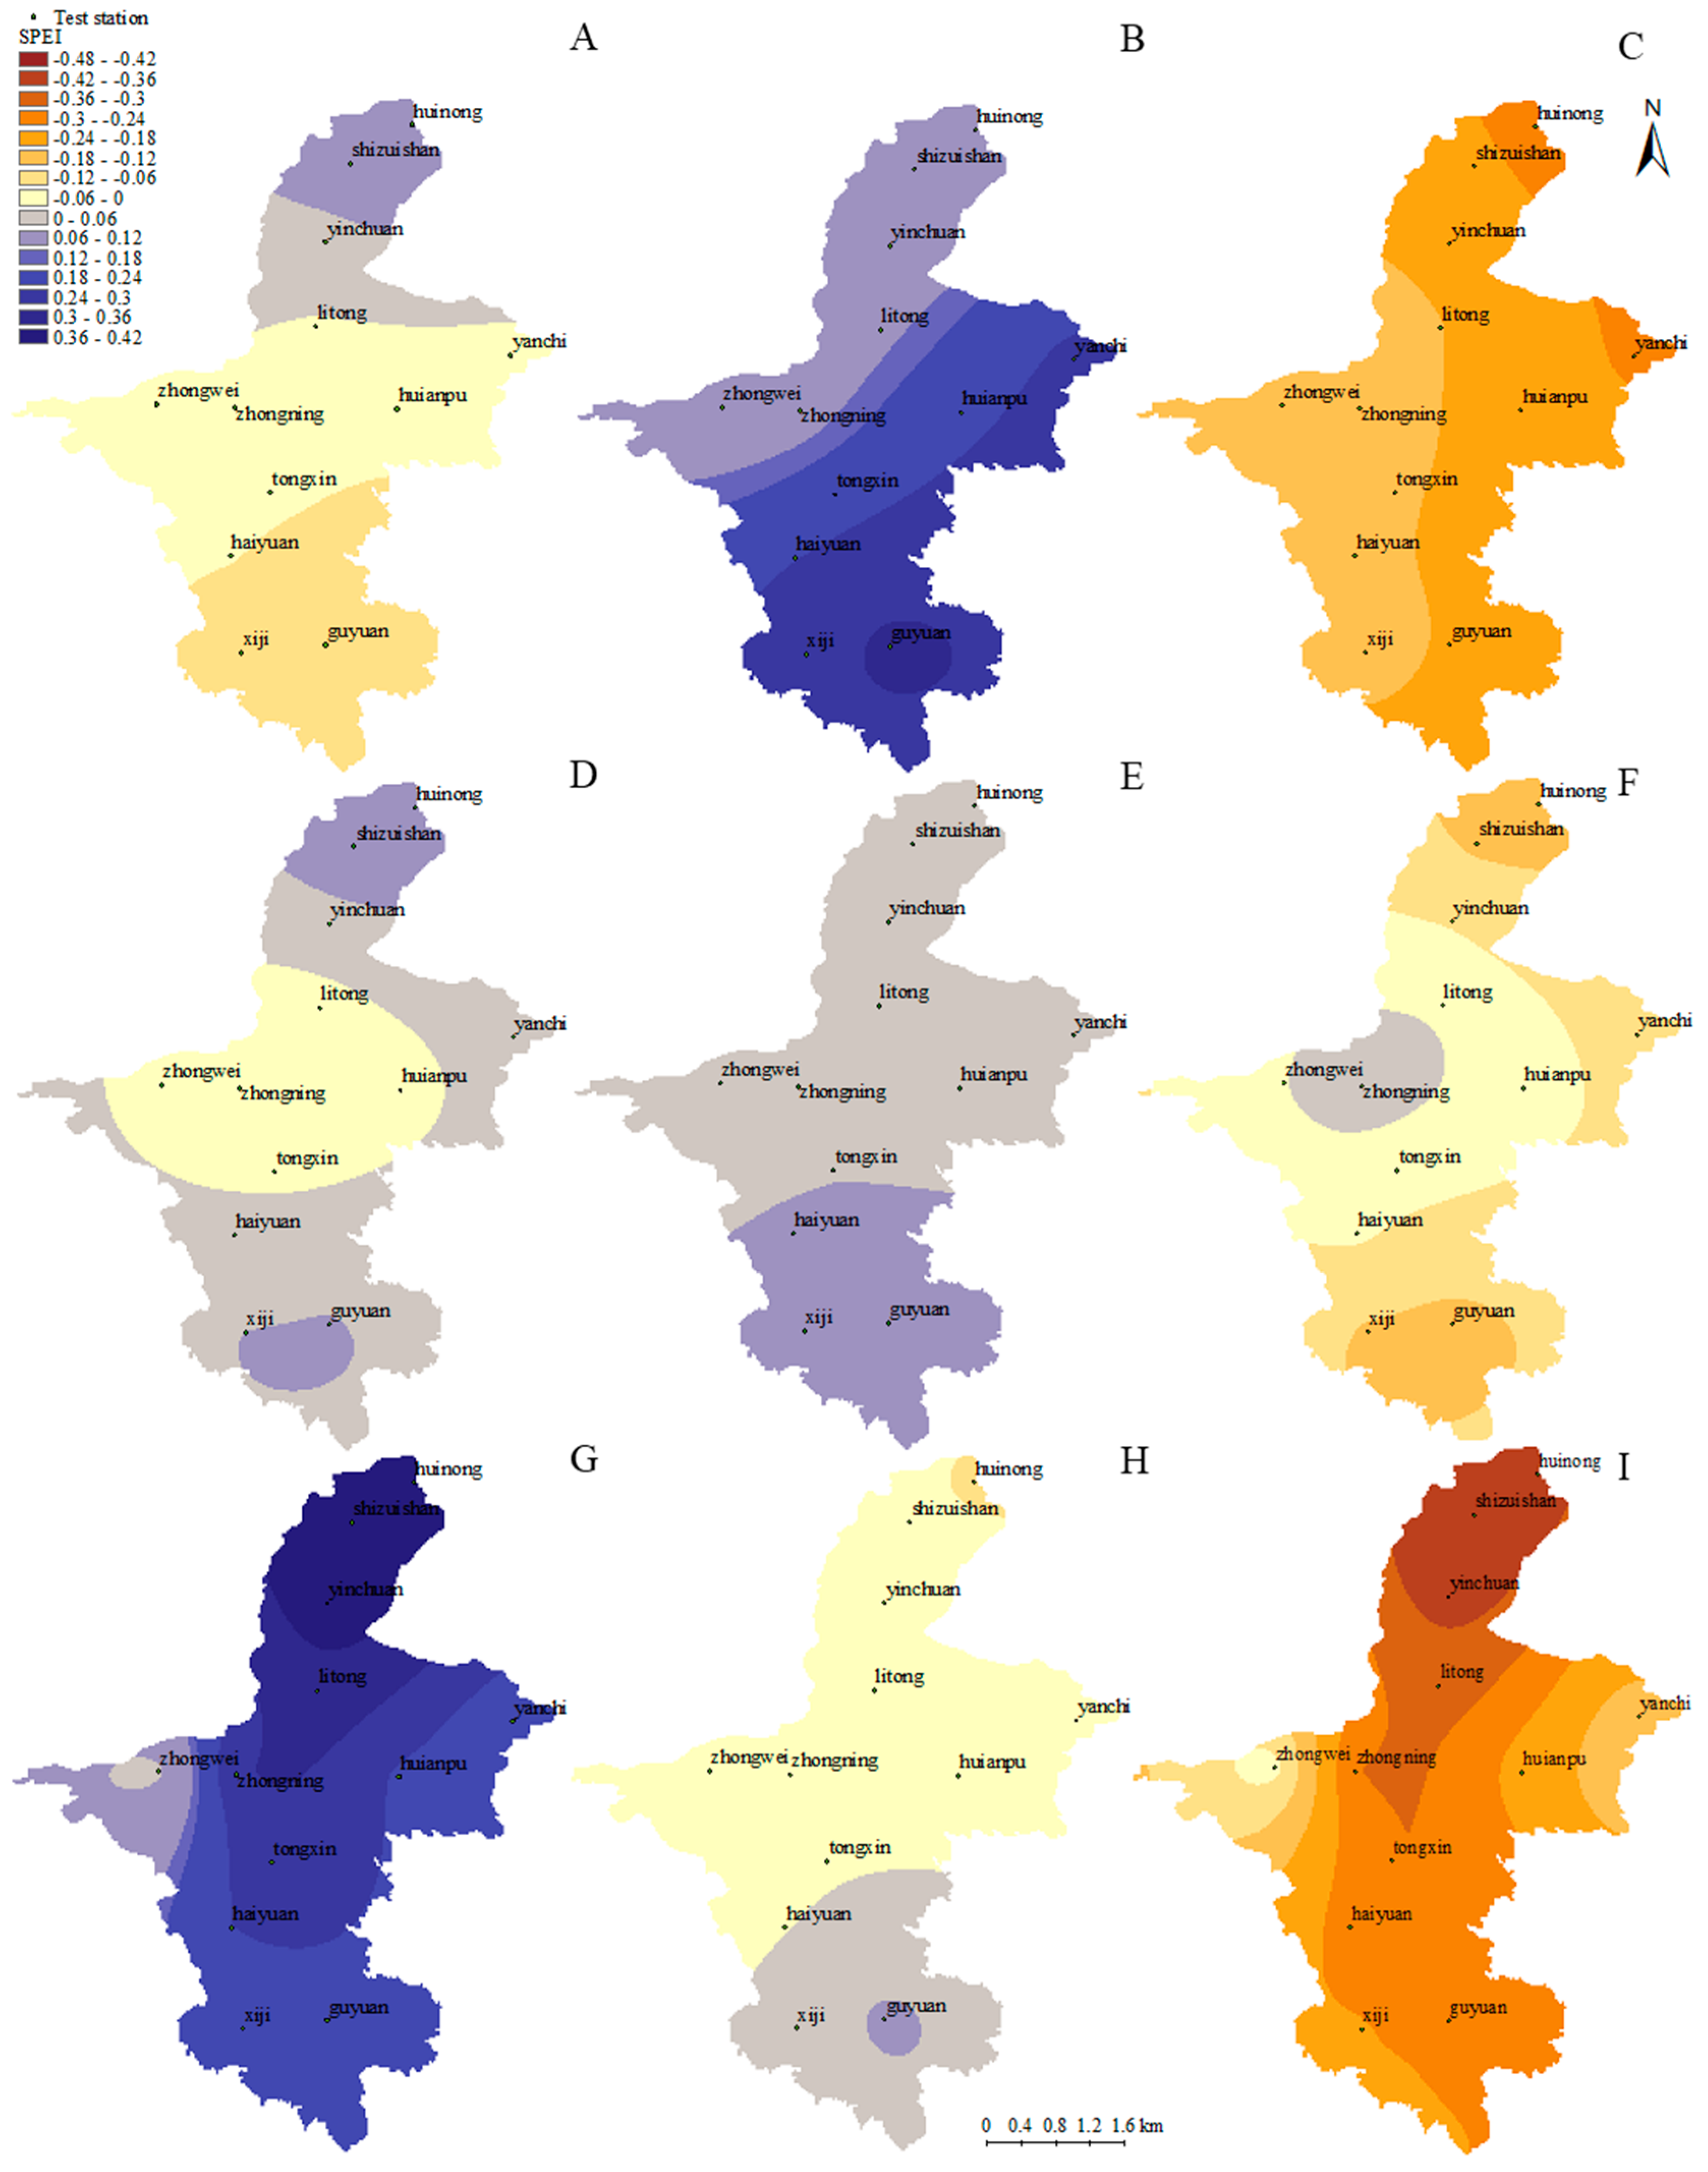
3.3. Drought Index Spatiotemporal Variation During the Wheat Growth Period
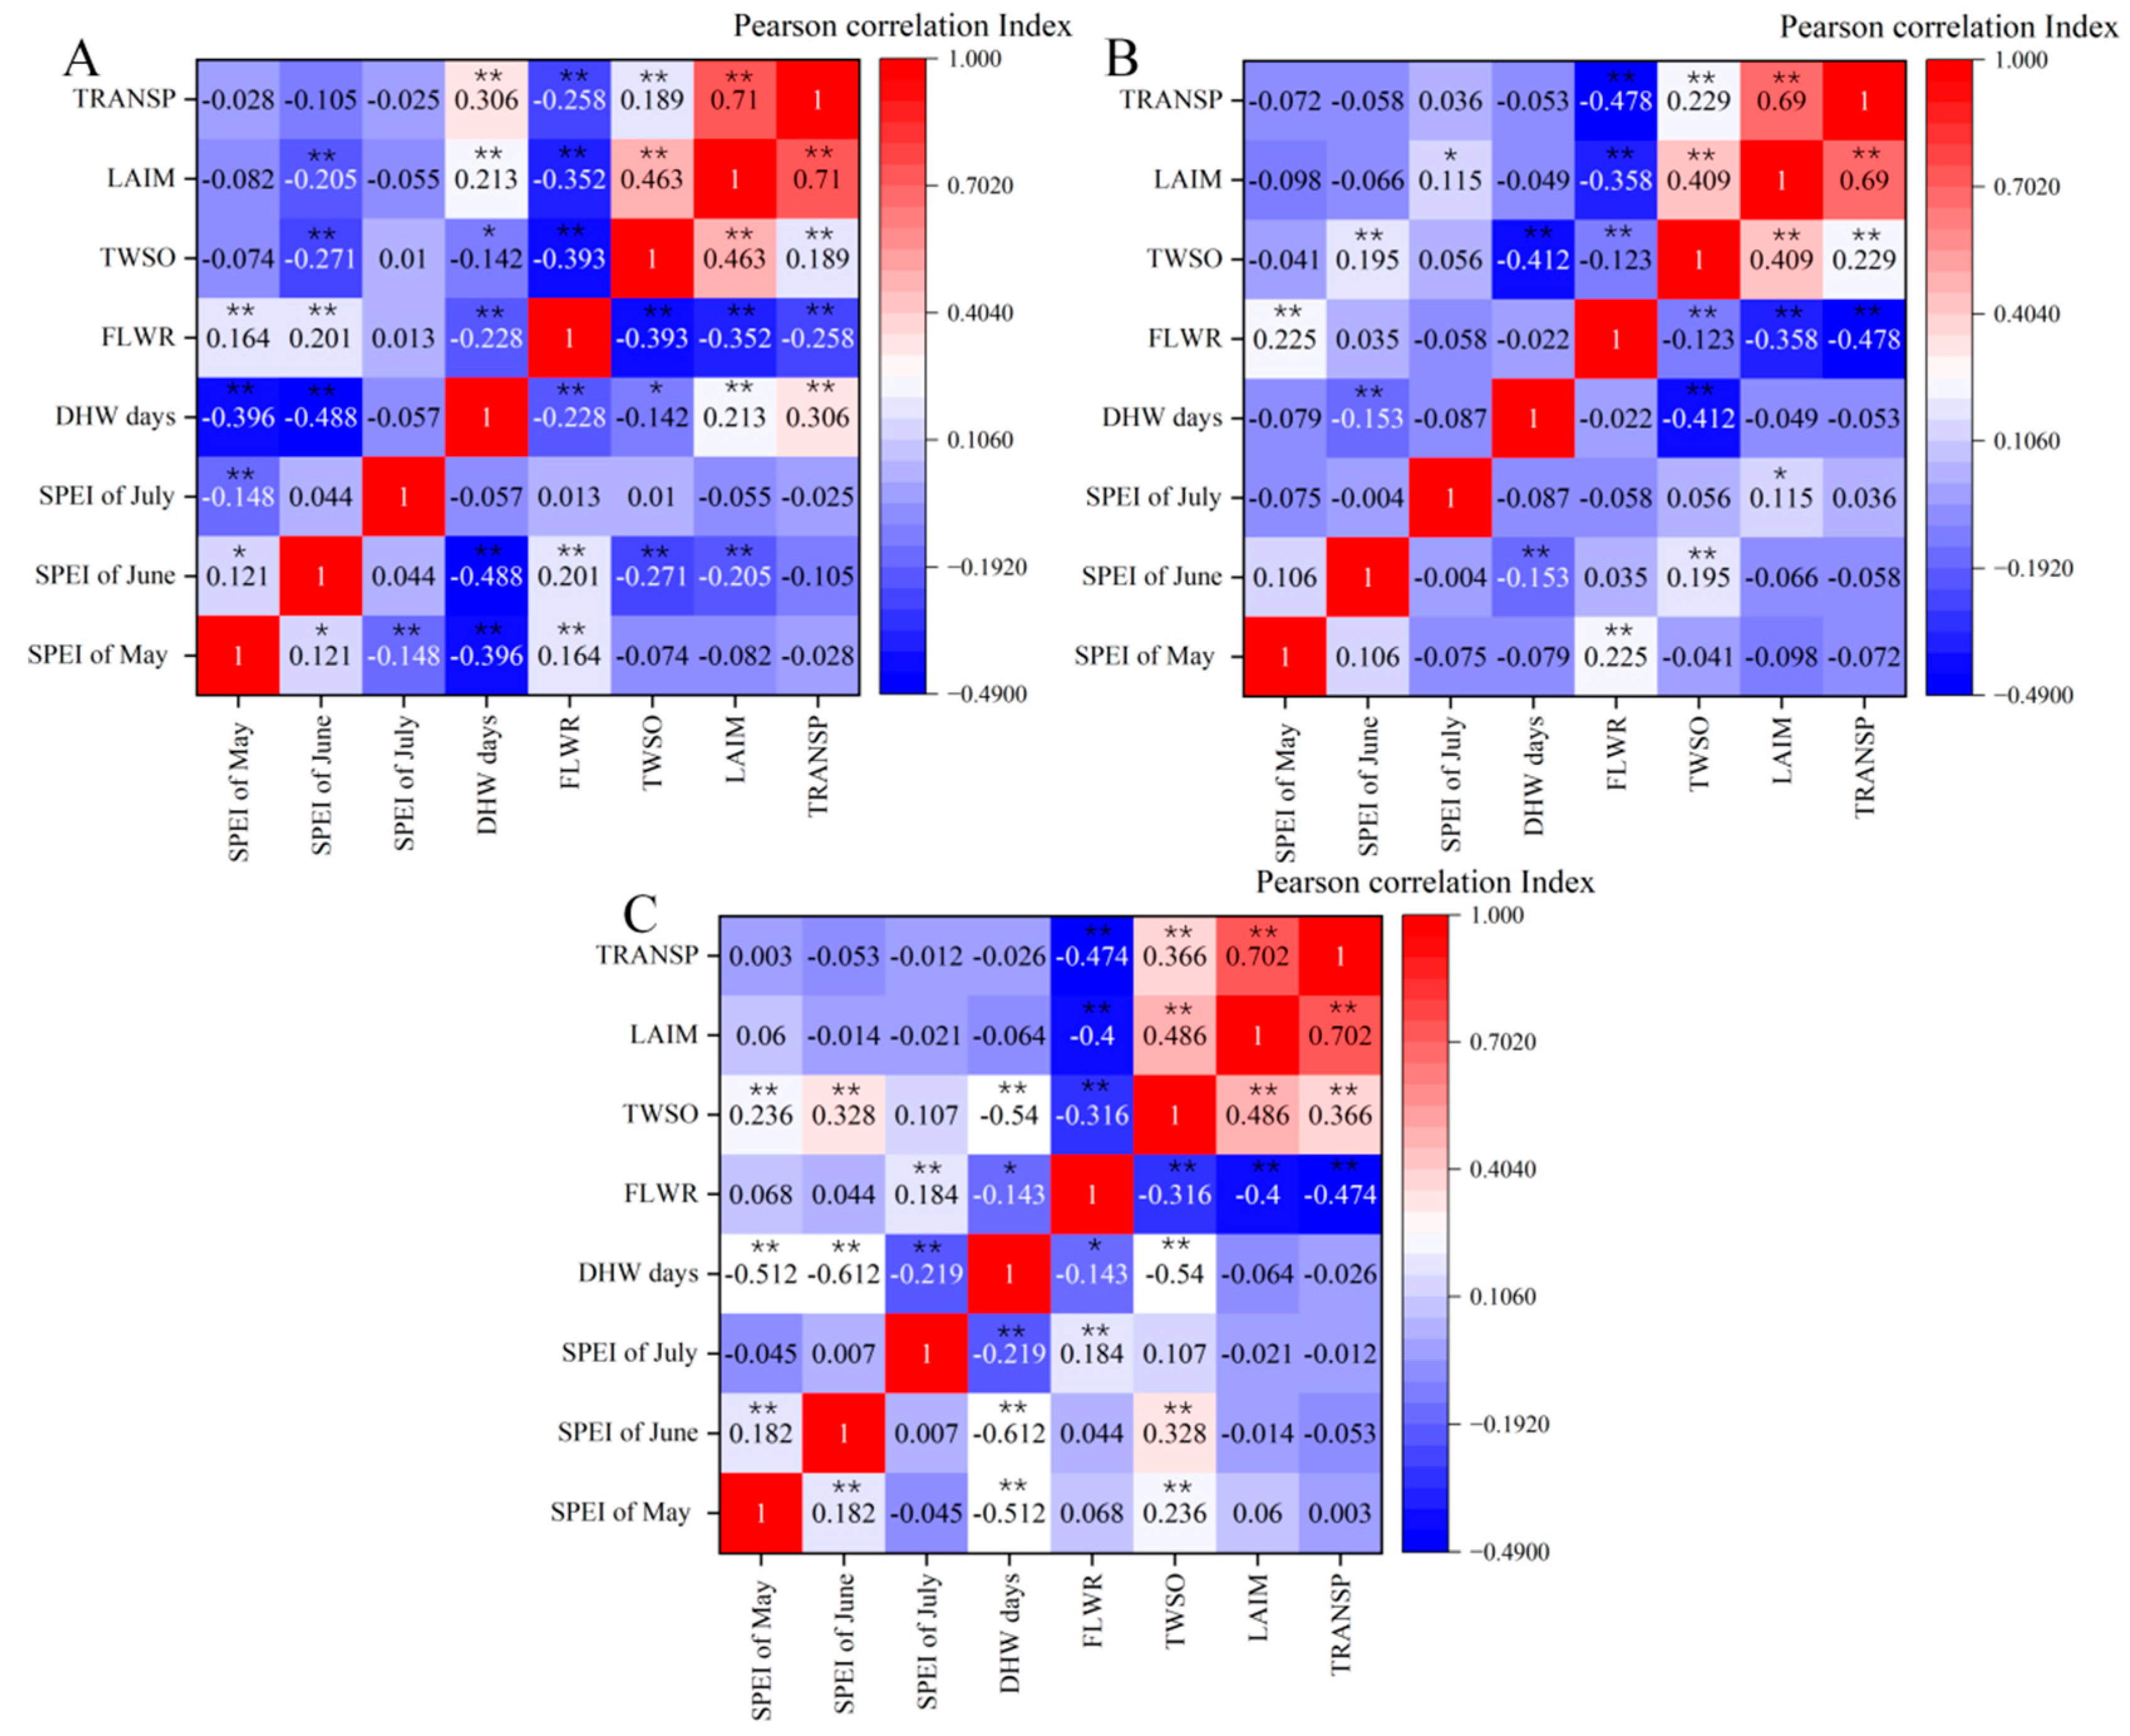
3.4. Effects of DHW and SPEI Index Changes on Wheat Yield
4. Discussion
4.1. Wheat DHW Temporal and Spatial Variation Trends in Ningxia
4.2. Future Drought Temporal and Spatial Changes in Ningxia Based on the Drought Index
5. Conclusions
Author Contributions
Funding
Data Availability Statement
Conflicts of Interest
Appendix A

| Research Site | Period | SSP126 Precipitation Monthly (mm) | SSP126 Evapotranspiration Monthly (mm) | SSP126 TasMean Monthly (°C) | SSP245 Precipitation Monthly (mm) | SSP245 Evapotranspiration Monthly (mm) | SSP245 TasMean Monthly (°C) | SSP585 Precipitation Monthly (mm) | SSP585 Evapotranspiration Monthly (mm) | SSP585 TasMean Monthly (°C) |
|---|---|---|---|---|---|---|---|---|---|---|
| A Guyuan | ST | 46.69 | 38.61 | 8.07 | 46.68 | 37.86 | 8.32 | 46.63 | 38.58 | 8.17 |
| MT | 49.79 | 40.61 | 8.26 | 49.23 | 39.82 | 8.93 | 49.32 | 40.54 | 9.41 | |
| LT | 48.99 | 40.08 | 8.30 | 51.81 | 40.82 | 9.12 | 52.18 | 42.30 | 10.79 | |
| B Haiyuan | ST | 35.41 | 30.74 | 7.79 | 35.42 | 30.30 | 8.01 | 35.95 | 31.10 | 7.89 |
| MT | 37.89 | 32.59 | 8.00 | 37.40 | 31.80 | 8.62 | 38.06 | 32.82 | 9.13 | |
| LT | 37.05 | 31.93 | 8.02 | 39.62 | 33.21 | 8.82 | 40.03 | 34.30 | 10.52 | |
| C Huianpu | ST | 29.89 | 28.33 | 7.97 | 30.42 | 27.83 | 8.17 | 31.86 | 29.08 | 8.01 |
| MT | 32.75 | 30.21 | 8.10 | 31.53 | 29.20 | 8.75 | 33.42 | 30.72 | 9.27 | |
| LT | 31.34 | 29.02 | 8.20 | 34.02 | 31.17 | 8.98 | 34.41 | 31.64 | 10.73 | |
| D Huinong | ST | 15.80 | 15.12 | 7.40 | 16.86 | 15.94 | 7.62 | 18.00 | 17.01 | 7.40 |
| MT | 17.52 | 16.61 | 7.46 | 16.95 | 16.16 | 8.12 | 17.97 | 16.96 | 8.71 | |
| LT | 17.32 | 16.41 | 7.54 | 18.13 | 17.18 | 8.43 | 18.95 | 17.95 | 10.26 | |
| E Litong | ST | 20.05 | 19.49 | 7.94 | 20.50 | 19.44 | 8.13 | 21.79 | 20.59 | 8.01 |
| MT | 22.06 | 21.06 | 8.10 | 21.31 | 20.24 | 8.71 | 22.95 | 21.72 | 9.28 | |
| LT | 20.87 | 20.11 | 8.15 | 22.98 | 22.01 | 8.97 | 23.36 | 22.49 | 10.75 | |
| F Shizuishan | ST | 15.21 | 14.62 | 7.58 | 15.85 | 15.00 | 7.81 | 17.07 | 16.14 | 7.62 |
| MT | 16.82 | 15.99 | 7.69 | 16.12 | 15.35 | 8.32 | 17.28 | 16.35 | 8.92 | |
| LT | 16.29 | 15.52 | 7.75 | 17.30 | 16.45 | 8.63 | 18.14 | 17.26 | 10.45 | |
| G Tongxin | ST | 29.44 | 26.47 | 8.01 | 29.68 | 26.20 | 8.21 | 30.51 | 27.15 | 8.11 |
| MT | 31.81 | 28.25 | 8.22 | 31.27 | 27.44 | 8.83 | 32.52 | 28.83 | 9.36 | |
| LT | 30.68 | 27.38 | 8.25 | 33.36 | 29.20 | 9.04 | 33.48 | 29.87 | 10.77 | |
| H Xiji | ST | 45.79 | 37.92 | 7.64 | 45.46 | 37.13 | 7.90 | 45.55 | 37.79 | 7.76 |
| MT | 48.56 | 39.86 | 7.86 | 48.13 | 39.08 | 8.50 | 48.17 | 39.73 | 8.99 | |
| LT | 48.02 | 39.43 | 7.87 | 50.76 | 40.09 | 8.69 | 51.21 | 41.65 | 10.35 | |
| I Yanchi | ST | 35.45 | 32.94 | 7.70 | 36.27 | 32.44 | 7.93 | 37.79 | 33.75 | 7.67 |
| MT | 38.81 | 34.96 | 7.74 | 37.23 | 33.97 | 8.45 | 38.96 | 35.11 | 8.95 | |
| LT | 37.76 | 33.98 | 7.88 | 40.09 | 35.61 | 8.69 | 40.83 | 36.30 | 10.44 | |
| J Yinchuan | ST | 17.31 | 16.74 | 7.77 | 17.79 | 16.85 | 7.98 | 19.05 | 18.01 | 7.82 |
| MT | 19.08 | 18.17 | 7.90 | 18.33 | 17.42 | 8.53 | 19.73 | 18.67 | 9.11 | |
| LT | 18.20 | 17.45 | 7.96 | 19.73 | 18.82 | 8.81 | 20.37 | 19.50 | 10.62 | |
| K Zhongning | ST | 20.23 | 20.10 | 8.09 | 20.80 | 20.19 | 8.26 | 21.98 | 21.23 | 8.18 |
| MT | 22.35 | 21.82 | 8.29 | 21.76 | 21.01 | 8.88 | 23.45 | 22.64 | 9.44 | |
| LT | 21.05 | 20.80 | 8.33 | 23.42 | 23.03 | 9.11 | 23.63 | 23.35 | 10.87 | |
| L Zhongwei | ST | 19.22 | 19.30 | 8.04 | 19.99 | 19.64 | 8.21 | 21.04 | 20.58 | 8.04 |
| MT | 21.37 | 21.07 | 8.23 | 20.80 | 20.32 | 8.82 | 22.23 | 21.74 | 8.23 | |
| LT | 20.38 | 20.25 | 8.26 | 22.28 | 22.08 | 9.05 | 22.73 | 22.57 | 8.26 |
| Dry Hot Wind Days (d) | Southern Mountainous Area of Ningxia | Arid Area of Central Ningxia | Northern Region of Ningxia | |||||||||
|---|---|---|---|---|---|---|---|---|---|---|---|---|
| guyaun | haiyuan | xiji | huianpu | tongxin | yanchi | zhongning | huinong | litong | shizuishan | yinchuan | zhongwei | |
| SSP126 ST | 3.47 | 5.47 | 2.67 | 8.27 | 6.60 | 6.97 | 10.57 | 13.83 | 10.63 | 13.53 | 12.53 | 9.57 |
| SSP126 MT | 2.23 | 4.69 | 2.08 | 7.04 | 5.42 | 6.31 | 9.42 | 12.54 | 9.15 | 12.85 | 11.27 | 8.19 |
| SSP126 LT | 3.80 | 5.53 | 3.10 | 8.43 | 6.23 | 7.70 | 10.93 | 15.57 | 11.10 | 15.13 | 13.20 | 10.37 |
| SSP245 ST | 2.17 | 3.23 | 1.63 | 6.40 | 5.00 | 5.67 | 9.07 | 13.63 | 9.30 | 13.17 | 11.57 | 8.17 |
| SSP245 MT | 2.96 | 4.46 | 2.08 | 7.73 | 6.46 | 6.81 | 10.77 | 14.19 | 11.58 | 14.81 | 13.27 | 9.19 |
| SSP245 LT | 3.43 | 4.53 | 2.30 | 7.90 | 5.70 | 6.57 | 9.50 | 15.60 | 11.30 | 15.50 | 12.57 | 8.93 |
| SSP585 ST | 3.77 | 5.20 | 4.13 | 7.90 | 6.27 | 7.30 | 10.20 | 13.60 | 10.17 | 14.00 | 12.37 | 8.73 |
| SSP585 MT | 5.50 | 7.42 | 6.50 | 11.81 | 8.73 | 11.46 | 14.58 | 19.58 | 15.73 | 19.85 | 17.92 | 14.27 |
| SSP585 LT | 7.90 | 10.37 | 8.07 | 13.60 | 11.03 | 12.70 | 17.13 | 22.30 | 17.67 | 22.07 | 20.17 | 17.17 |
References
- Musolino, D.A.; Massarutto, A.; de Carli, A. Does drought always cause economic losses in agriculture? An empirical investigation on the distributive effects of drought events in some areas of Southern Europe. Sci. Total Environ. 2018, 633, 1560–1570. [Google Scholar] [CrossRef] [PubMed]
- Zhang, Q.; Yu, H.; Sun, P.; Singh, V.P.; Shi, P. Multisource data based agricultural drought monitoring and agricultural loss in China. Glob. Planet. Change 2019, 172, 298–306. [Google Scholar] [CrossRef]
- Trenberth, K.E.; Dai, A.; van der Schrier, G.; Jones, P.D.; Barichivich, J.; Briffa, K.R.; Sheffield, J. Global warming and changes in drought. Nat. Clim. Change 2014, 4, 17–22. [Google Scholar] [CrossRef]
- Spinoni, J.; Vogt, J.V.; Naumann, G.; Barbosa, P.; Dosio, A. Will drought events become more frequent and severe in Europe? Int. J. Clim. 2018, 38, 1718–1736. [Google Scholar] [CrossRef]
- Tavakol, A.; Rahmani, V.; Harrington, J.J. Temporal and spatial variations in the frequency of compound hot, dry, and windy events in the central United States. Sci. Rep. 2020, 10, 15691. [Google Scholar] [CrossRef]
- Cai, D.; Shoukat, M.R.; Zheng, Y.; Tan, H.; Meng, F.; Yan, H. Optimizing Center Pivot Irrigation to Regulate Field Microclimate and Wheat Physiology under Dry-Hot Wind Conditions in the North China Plain. Water 2022, 14, 708. [Google Scholar] [CrossRef]
- Wang, S.; Zheng, H.; Liu, S.; Miao, Y.; Li, J. Numerical Study on the Stomatal Responses to Dry-Hot Wind Episodes and Its Effects on Land-Atmosphere Interactions. PLoS ONE 2016, 11, e0162852. [Google Scholar] [CrossRef]
- Huang, S.; Leng, G.; Huang, Q.; Xie, Y.; Liu, S.; Meng, E.; Li, P. The asymmetric impact of global warming on US drought types and distributions in a large ensemble of 97 hydro-climatic simulations. Sci. Rep. 2017, 7, 5891. [Google Scholar] [CrossRef]
- Li, S.; Zhang, L.; Huang, B.; He, L.; Zhao, J.; Guo, A. A comprehensive index for assessing regional dry-hot wind events in Huang-Huai-Hai Region, China. Phys. Chem. Earth Parts A/B/C 2020, 116, 102860. [Google Scholar] [CrossRef]
- Zhao, H.; Zhang, L.; Kirkham, M.B.; Welch, S.M.; Nielsen-Gammon, J.W.; Bai, G.; Luo, J.; Andresen, D.A.; Rice, C.W.; Wan, N.; et al. Winter wheat yield loss attributed to compound hot-dry-windy events. Nat. Commun. 2022, 13, 7233. [Google Scholar] [CrossRef]
- Zhao, C.; Zhang, Y.; Wang, Z.; Li, D. Effects of Freezing Damage and Dry Hot Wind on Wheat Production and Defense Countermeasures in Hebei Province. Guizhou Nong Ye Ke Xue 2011, 39, 80–82. [Google Scholar]
- Liu, J.; Zhang, X.; Ma, G.; Cao, N.; Ma, L. Analysis of spectral characteristics of dry hot air hazard of spring wheat in Ningxia. Trans. Chin. Soc. Agric. Eng. 2012, 28, 189–199. [Google Scholar] [CrossRef]
- Xu, Y.; Wu, Y.; Ji, B.; Song, J.; Lv, G.; Zhang, W.; Liu, B.; Bai, W. Effect of phosphorus and sugar preparation on resistance to dry hot air and yield of winter wheat. J. Wheat Crops 2022, 42, 236–245. [Google Scholar]
- Xiao, G.; Zheng, F.; Qiu, Z.; Yao, Y. Impact of climate change on water use efficiency by wheat, potato and corn in semiarid areas of China. Agric. Ecosyst. Environ. 2013, 181, 108–114. [Google Scholar] [CrossRef]
- Huo, Z.; Shang, Y.; Wu, D.; Wu, L.; Fan, Y.; Wang, P.; Yang, J.; Wang, C. Research progress on dry hot air disaster of wheat in China. J. Appl. Meteorol. 2019, 30, 129–141. [Google Scholar]
- Li, X.; Tan, J.; Dong, L.; Wang, X. Analysis and prediction of dry hot air change characteristics and influencing factors of spring wheat in Ningxia. Agric. Res. Arid Areas 2023, 41, 283–292. [Google Scholar] [CrossRef]
- Qi, Y.; Wang, H.; Zhang, K.; Wang, R.; Lei, J. Effects of climate change on spring wheat growth and yield in semi-arid region of the Loess Plateau: A case study of Dingxi City. J. Ecol. Environ. 2019, 28, 1313–1321. [Google Scholar] [CrossRef]
- Zhao, J.; Pu, F.; Li, Y.; Xu, J.; Li, N.; Zhang, Y.; Guo, J.; Pan, Z. Assessing the combined effects of climatic factors on spring wheat phenophase and grain yield in Inner Mongolia, China. PLoS ONE 2017, 12, e0185690. [Google Scholar] [CrossRef]
- Liu, L.; Liu, J.; Wu, D.; Xu, Y.; Jiang, C. Temporal and Spatial Variations of Dry-hot Windy Days in North China Under the Condition of Climatic Change in the Future. Ke Ji Dao Bao 2012, 30, 24–27. [Google Scholar] [CrossRef]
- Zargar, A.; Sadiq, R.; Naser, B.; Khan, F.I. A review of drought indexes. Environ. Rev. 2011, 19, 333–349. [Google Scholar] [CrossRef]
- Beguería, S.; Vicente-Serrano, S.M.; Reig, F.; Latorre, B. Standardized precipitation evapotranspiration index (SPEI) revisited: Parameter fitting, evapotranspiration models, tools, datasets and drought monitoring. Int. J. Clim. 2014, 34, 3001–3023. [Google Scholar] [CrossRef]
- Tirivarombo, S.; Osupile, D.; Eliasson, P. Drought monitoring and analysis: Standardised Precipitation Evapotranspiration Index (SPEI) and Standardised Precipitation Index (SPI). Phys. Chem. Earth Parts A/B/C 2018, 106, 1–10. [Google Scholar] [CrossRef]
- Vicente-Serrano, S.M.; Van der Schrier, G.; Beguería, S.; Azorin-Molina, C.; Lopez-Moreno, J. Contribution of precipitation and reference evapotranspiration to drought indexes under different climates. J. Hydrol. 2015, 526, 42–54. [Google Scholar] [CrossRef]
- Tan, C.; Yang, J.; Wang, X.; Qin, D.; Huang, B.; Chen, H. Drought disaster risks under CMIP5 RCP scenarios in Ningxia Hui Autonomous Region, China. Nat. Hazards. 2020, 100, 909–931. [Google Scholar] [CrossRef]
- Chen, H.; Sun, J. Changes in Drought Characteristics over China Using the Standardized Precipitation Evapotranspiration Index. J. Clim. 2015, 28, 5430–5447. [Google Scholar] [CrossRef]
- Li, Y.; Wang, Z.; Zhang, Y.; Li, X.; Huang, W. Drought variability at various timescales over Yunnan Province, China: 1961–2015. Theor. Appl. Climatol. 2019, 138, 743–757. [Google Scholar] [CrossRef]
- Zhou, T.; Zou, L.; Chen, X. Review of the sixth International Coupling Model Comparison Program (CMIP6). Adv. Clim. Chang. Res. 2019, 15, 445–456. [Google Scholar]
- Li, X.; Tan, J.; Wang, X.; Han, G.; Qian, Z.; Li, H.; Wang, L.; Niu, G. Responses of spring wheat yield and growth period to different future climate change models in the yellow river irrigation area based on CMIP6 and WOFOST models. Agr. Forest Meteorol. 2024, 353, 110071. [Google Scholar] [CrossRef]
- Vicente-Serrano, S.M.; Beguería, S.; López-Moreno, J.I. A Multiscalar Drought Index Sensitive to Global Warming: The Standardized Precipitation Evapotranspiration Index. J. Clim. 2010, 23, 1696–1718. [Google Scholar] [CrossRef]
- Helsel, D.R.; Frans, L.M. Regional Kendall test for trend. Environ. Sci. Technol. 2006, 40, 4066–4073. [Google Scholar] [CrossRef]
- Wu, D.; Ouyang, B.; Zhao, X.; Yu, Q.; Luo, Y. Applicability of crop growth model WOFOST in North China Plain. Chin. J. Plant Ecol. 2003, 5, 594–602. [Google Scholar]
- Li, X.; Tan, J.; Li, H.; Wang, L.; Niu, G.; Wang, X. Sensitivity Analysis of the WOFOST Crop Model Parameters Using the EFAST Method and Verification of Its Adaptability in the Yellow River Irrigation Area, Northwest China. Agronomy 2023, 13, 2294. [Google Scholar] [CrossRef]
- Li, B.; Liang, Z.; Zhang, J.; Wang, G. A revised drought index based on precipitation and pan evaporation. Int. J. Clim. 2017, 37, 793–801. [Google Scholar] [CrossRef]
- Stagge, J.H.; Tallaksen, L.M.; Gudmundsson, L.; Van Loon, A.F.; Stahl, K. Candidate Distributions for Climatological Drought Indexes (SPI and SPEI). Int. J. Clim. 2015, 35, 4027–4040. [Google Scholar] [CrossRef]
- Naumann, G.; Alfieri, L.; Wyser, K.; Mentaschi, L.; Betts, R.A.; Carrao, H.; Spinoni, J.; Vogt, J.; Feyen, L. Global Changes in Drought Conditions Under Different Levels of Warming. Geophys. Res. Lett. 2018, 45, 3285–3296. [Google Scholar] [CrossRef]
- Ma, Y.; Cui, Y.; Zhang, W.; Li, X. Prediction of future temperature change in Ningxia section of Yellow River Basin based on CMIP6 model. Arid. Meteorol. 2023, 41, 43–53. [Google Scholar]
- Zhang, S.; Hu, Y.; Li, Z. Variation trend and forecast of precipitation in northwest China. Adv. Clim. Change Res. 2022, 18, 683–694. [Google Scholar]
- Li, S.; Miao, L.; Jiang, Z.; Wang, G.; Gnyawali, K.R.; Zhang, J.; Zhang, H.; Fang, K.; He, Y.; Li, C. Projected drought conditions in Northwest China with CMIP6 models under combined SSPs and RCPs for 2015–2099. Adv. Clim. Chang. Res. 2020, 11, 210–217. [Google Scholar] [CrossRef]
- Feng, Y.; Sun, F.; Liu, F. Temporal and spatial variations of multivariate hot, dry and windy climate extremes in Northwest China. Int. J. Clim. 2023, 43, 8005–8018. [Google Scholar] [CrossRef]
- Yao, N.; Li, L.; Feng, P.; Feng, H.; Li Liu, D.; Liu, Y.; Jiang, K.; Hu, X.; Li, Y. Projections of drought characteristics in China based on a standardized precipitation and evapotranspiration index and multiple GCMs. Sci. Total Environ. 2020, 704, 135245. [Google Scholar] [CrossRef]
- Tietjen, B.; Schlaepfer, D.R.; Bradford, J.B.; Lauenroth, W.K.; Hall, S.A.; Duniway, M.C.; Hochstrasser, T.; Jia, G.; Munson, S.M.; Pyke, D.A.; et al. Climate change-induced vegetation shifts lead to more ecological droughts despite projected rainfall increases in many global temperate drylands. Global Change Biol. 2017, 23, 2743–2754. [Google Scholar] [CrossRef] [PubMed]
- Liu, Y.; Tian, J.; Fu, Y.; Zhu, B.; He, X.; Gao, M.; Odamtten, M.T.; Kong, R.; Zhang, Z. Will the arid and semi-arid regions of Northwest China become warmer and wetter based on CMIP6 models? Hydrol. Res. 2022, 53, 29–50. [Google Scholar] [CrossRef]
- Ma, D.; Deng, H.; Yin, Y.; Wu, S.; Zheng, D. Sensitivity of arid/humid patterns in China to future climate change under a high-emissions scenario. J. Geogr. Sci. 2019, 29, 29–48. [Google Scholar] [CrossRef]
- Zhang, G.; Gan, T.Y.; Su, X. Twenty-first century drought analysis across China under climate change. Clim. Dynam. 2022, 59, 1665–1685. [Google Scholar] [CrossRef]
- Masipa, T.S. The impact of climate change on food security in South Africa: Current realities and challenges ahead. Jamba 2017, 9, 411. [Google Scholar] [CrossRef]
- Cooper, M.; Messina, C.D. Breeding crops for drought-affected environments and improved climate resilience. Plant Cell 2023, 35, 162–186. [Google Scholar] [CrossRef]
- Yuan, X.; Su, C.; Umar, M.; Shao, X.; LOBONŢ, O. The race to zero emissions: Can renewable energy be the path to carbon neutrality? J. Environ. Manag. 2022, 308, 114648. [Google Scholar] [CrossRef]
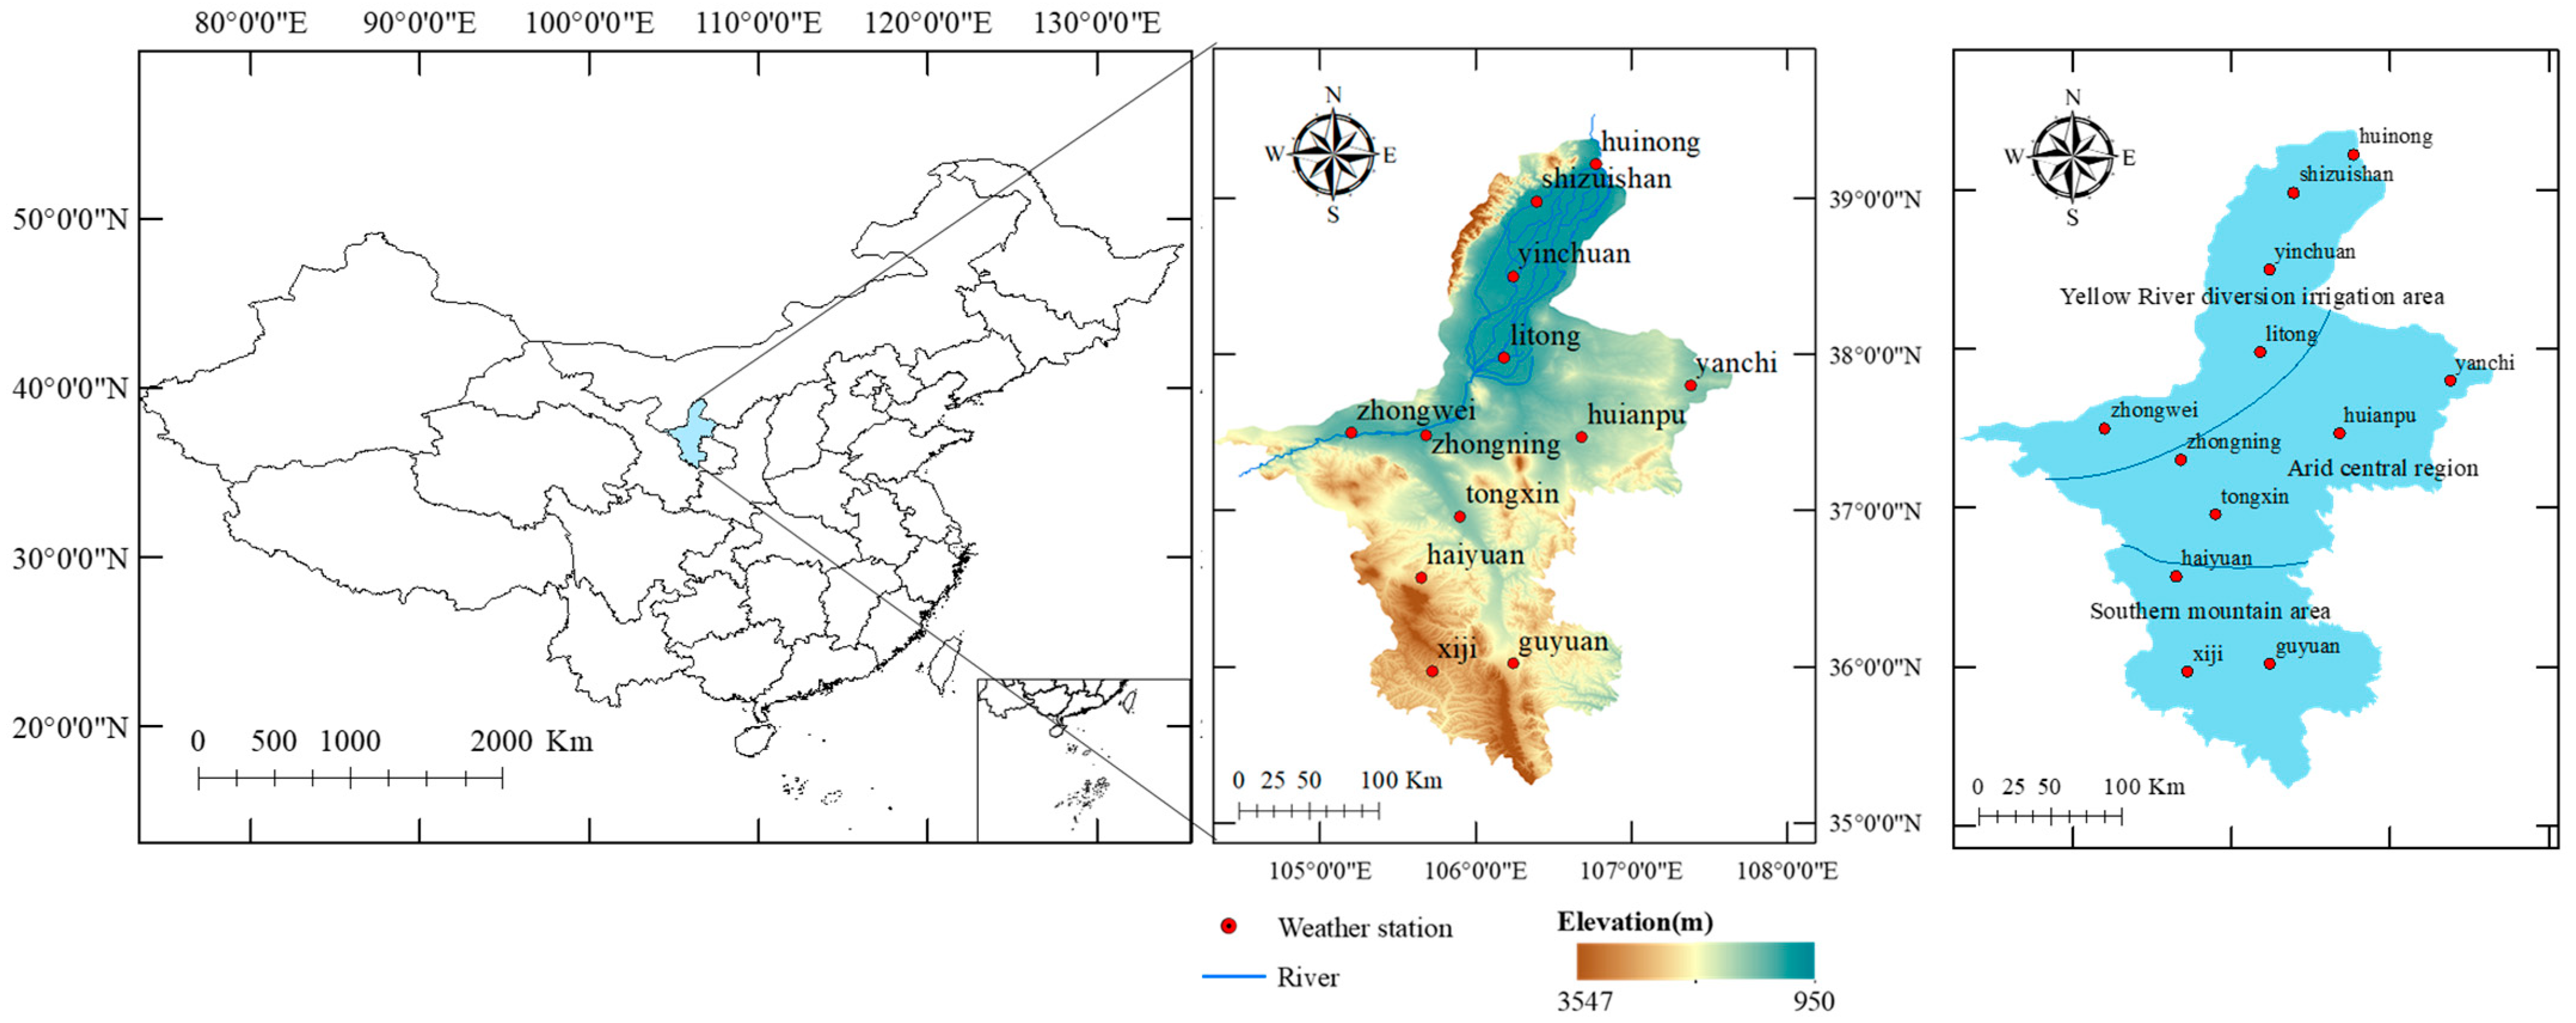


| Agro-Ecological Region | Site Name | Latitude | Longitude | Elevation (m) |
|---|---|---|---|---|
| Ningxia Yellow River diversion irrigation area | huinong | 39.22 | 106.77 | 1091 |
| shizuishan | 38.98 | 106.39 | 1101.6 | |
| yinchuan | 38.5 | 106.24 | 1111.4 | |
| zhongwei | 37.5 | 105.2 | 1225.7 | |
| litong | 37.98 | 106.18 | 1127.7 | |
| Arid area of central Ningxia | zhongning | 37.48 | 105.68 | 1183.3 |
| yanchi | 37.8 | 107.38 | 1347.8 | |
| tongxin | 36.96 | 105.9 | 1343.9 | |
| huianpu | 37.47 | 106.68 | 1512.3 | |
| Southern mountainous area of Ningxia | xiji | 35.97 | 105.72 | 1916.5 |
| guyuan | 36.02 | 106.24 | 1753.2 | |
| haiyuan | 36.57 | 105.65 | 1853.7 |
| Crop Parameter | AMAXTB0 (kg·hm−2·h−1) | AMAXTB1 (kg·hm−2·h−1) | AMAXTB1.3 (kg·hm−2·h−1) | CVO (kg·kg−1) | CVL (kg·kg−1) |
|---|---|---|---|---|---|
| Significance | Maximum CO2 assimilation rate at growth stage 0 | Maximum CO2 assimilation rate at growth stage 1 | Maximum CO2 assimilation rate at growth stage 1.3 | Efficiency of dry matter conversion to seed | Efficiency of dry matter conversion to leaves |
| Value | 35.25283831 | 39.0031 | 38.17566 | 0.765686 | 0.667321425 |
| Parameter | CVS (kg·kg−1) | CVR (kg·kg−1) | EFFTB0 (kg·hm−2·h−1·J−1·m2·s) | EFFTB40 (kg·hm−2·h−1·J−1·m2·s) | KDIFTB0 |
| Significance | Efficiency of conversion of dry matter to stems | Efficiency of dry matter conversion to roots | Single-leaf light energy utilization at 0 °C | Single-leaf light energy utilization at 40 °C | Scattered light extinction coefficient at growth stage 0 |
| Value | 0.72464208 | 0.667882 | 0.487338 | 0.476887 | 0.573684886 |
| Parameter | KDIFTB2 | SPAN (d) | SLATB0 (hm2·kg−1) | SLATB0.5 (hm2·kg−1) | SLATB2 (hm2·kg−1) |
| Significance | Scattered light extinction coefficient at growth stage 2 | Leaf life cycle at 35 °C | Specific leaf area at growth stage 0 | Specific leaf area at growth stage 0.5 | Specific leaf area at growth stage 2 |
| Value | 0.654334798 | 33.02043 | 0.002004 | 0.001944 | 0.002072466 |
| Parameter | TMPFTB0 | TMPFTB10 | TMPFTB15 | TMPFTB25 | TMPFTB35 |
| Significance | Maximum CO2 assimilation rate discount factor at mean temperature 0 °C | Maximum CO2 assimilation rate discount factor at mean temperature 10 °C | Maximum CO2 assimilation rate discount factor at mean temperature 15 °C | Maximum CO2 assimilation rate discount factor at mean temperature 25 °C | Maximum CO2 assimilation rate discount factor at mean temperature 35 °C |
| Value | 0.099834809 | 0.56683 | 0.937174 | 0.956712 | 0.015038988 |
| Parameter | TBASE | TSUM1 (°C·d) | TSUM2 (°C·d) | TMNFTB0 | TMNFTB3 |
| Significance | Minimum temperature for seedling emergence | Accumulated temperature from seedling emergence to flowering | Accumulated temperature from flowering to maturity | Total assimilation rate discount factor at 0 °C minimum temperature | Total assimilation rate discount factor at 3 °C minimum temperature |
| Value | −1.530764949 | 1269.892 | 1263.679 | 0.078391 | 0.913047808 |
| Parameter | LAIEM (hm2·hm−2) | FOTB1 (kg·kg−1) | CFET | FLTB0 (kg·kg−1) | FLTB0.25 (kg·kg−1) |
| Significance | LAI at seedling emergence | Proportion of above-ground dry matter allocated to storage organs | Evapotranspiration rate correction factor | Proportion of above-ground dry matter allocated to leaves at growth stage 0 | Proportion of above-ground dry matter allocated to leaves at growth stage 0.25 |
| Value | 0.129033698 | 0.956577 | 0.929755 | 0.601276 | 0.641848876 |
| Parameter | FLTB0.5 (kg·kg−1) | FLTB0.646 (kg·kg−1) | DEPNR | TDWI (kg·hm−2) | Q10 |
| Significance | Proportion of above-ground dry matter allocated to leaves at growth stage 0.5 | Proportion of above-ground dry matter allocated to leaves at growth stage 0.646 | Number of soil water depleting crop groups | gross initial dry weight | Rate of change in respiration at a temperature change of 10 °C |
| Value | 0.450768093 | 0.296593 | 4.648691 | 182.6195 | 1.870266321 |
| Parameter | RDI (cm) | RRI (cm·d−1) | RDMCR (cm) | AMAXTB2 (kg·hm−2·h−1) | |
| Significance | Initial root depth | Maximum daily increase in root depth | Maximum root depth | Maximum CO2 assimilation rate at growth stage 2 | |
| Value | 11.94677171 | 1.290248 | 122.5433 | 4.84661 |
| Z Value | Southern Mountainous Area of Ningxia | Arid Area of Central Ningxia | Northern Region of Ningxia | |||||||||
|---|---|---|---|---|---|---|---|---|---|---|---|---|
| guyaun | haiyuan | xiji | huianpu | tongxin | yanchi | zhongning | huinong | litong | shizuishan | yinchuan | zhongwei | |
| SSP126 | −0.37 | −0.38 | −0.03 | −1.06 | −1.28 | −0.51 | −0.64 | 0.15 | −0.57 | −0.14 | −0.45 | −0.36 |
| confidence interval | - | - | - | - | - | - | - | - | - | - | - | - |
| SSP245 | 1.76 | 1.12 | 0.85 | 1.44 | 1.23 | 1.17 | 1.28 | 0.85 | 1.27 | 1.11 | 1.19 | 1.23 |
| confidence interval | 95% | - | - | 90% | - | - | 90% | - | - | - | - | - |
| SSP585 | 2.65 | 3.61 | 2.61 | 3.44 | 3.08 | 3.37 | 3.86 | 4.59 | 4.38 | 4.41 | 4.46 | 5.20 |
| confidence interval | 99% | 99% | 99% | 99% | 99% | 99% | 99% | 99% | 99% | 99% | 99% | 99% |
| Future Climate Model | Drought Risk Level | Southern Mountainous Area of Ningxia | Arid Area of Central Ningxia | Northern Region of Ningxia | |||||||||
|---|---|---|---|---|---|---|---|---|---|---|---|---|---|
| Guyaun | Haiyuan | Xiji | Huianpu | Tongxin | Yanchi | Zhongning | Huinong | Litong | Shizuishan | Yinchuan | Zhongwei | ||
| SSP126 | Moderate drought | 103 | 109 | 106 | 80 | 95 | 109 | 68 | 79 | 80 | 75 | 83 | 74 |
| Severe drought | 31 | 28 | 30 | 16 | 17 | 12 | 14 | 16 | 12 | 18 | 14 | 14 | |
| Extreme drought | 1 | 1 | 1 | 2 | 1 | 2 | 0 | 5 | 2 | 4 | 4 | 1 | |
| SSP245 | Moderate drought | 110 | 94 | 114 | 85 | 82 | 87 | 70 | 87 | 84 | 85 | 86 | 73 |
| Severe drought | 24 | 18 | 26 | 12 | 15 | 11 | 16 | 17 | 16 | 20 | 18 | 17 | |
| Extreme drought | 2 | 4 | 2 | 0 | 3 | 0 | 1 | 2 | 2 | 3 | 4 | 2 | |
| SSP585 | Moderate drought | 93 | 102 | 101 | 80 | 89 | 89 | 84 | 91 | 91 | 93 | 95 | 72 |
| Severe drought | 20 | 20 | 18 | 16 | 17 | 15 | 15 | 18 | 18 | 18 | 17 | 9 | |
| Extreme drought | 4 | 4 | 4 | 1 | 4 | 1 | 2 | 3 | 2 | 6 | 6 | 1 | |
| SSP126 (Growth period) | Moderate drought | 22 | 25 | 22 | 25 | 30 | 34 | 28 | 19 | 27 | 19 | 25 | 24 |
| Severe drought | 12 | 9 | 11 | 7 | 7 | 4 | 7 | 7 | 5 | 10 | 8 | 6 | |
| Extreme drought | 0 | 0 | 0 | 2 | 0 | 2 | 0 | 2 | 1 | 1 | 1 | 0 | |
| SSP245 (Growth period) | Moderate drought | 32 | 31 | 31 | 33 | 33 | 32 | 26 | 28 | 33 | 29 | 29 | 28 |
| Severe drought | 10 | 8 | 10 | 5 | 6 | 4 | 5 | 5 | 6 | 6 | 7 | 7 | |
| Extreme drought | 0 | 0 | 0 | 0 | 0 | 0 | 0 | 0 | 1 | 1 | 2 | 0 | |
| SSP585 (Growth period) | Moderate drought | 37 | 39 | 40 | 31 | 36 | 33 | 31 | 26 | 34 | 24 | 29 | 26 |
| Severe drought | 4 | 4 | 2 | 4 | 3 | 3 | 2 | 3 | 4 | 5 | 3 | 1 | |
| Extreme drought | 0 | 0 | 0 | 0 | 0 | 0 | 0 | 1 | 0 | 1 | 2 | 0 | |
Disclaimer/Publisher’s Note: The statements, opinions and data contained in all publications are solely those of the individual author(s) and contributor(s) and not of MDPI and/or the editor(s). MDPI and/or the editor(s) disclaim responsibility for any injury to people or property resulting from any ideas, methods, instructions or products referred to in the content. |
© 2024 by the authors. Licensee MDPI, Basel, Switzerland. This article is an open access article distributed under the terms and conditions of the Creative Commons Attribution (CC BY) license (https://creativecommons.org/licenses/by/4.0/).
Share and Cite
Li, X.; Tan, J.; Wang, X.; Shang, Q.; Li, H.; Li, X. Analysis of Future Drought Risk and Wheat Meteorological Disaster in Ningxia (Northwest China) Based on CMIP6 and SPEI. Agronomy 2024, 14, 3051. https://doi.org/10.3390/agronomy14123051
Li X, Tan J, Wang X, Shang Q, Li H, Li X. Analysis of Future Drought Risk and Wheat Meteorological Disaster in Ningxia (Northwest China) Based on CMIP6 and SPEI. Agronomy. 2024; 14(12):3051. https://doi.org/10.3390/agronomy14123051
Chicago/Turabian StyleLi, Xinlong, Junli Tan, Xina Wang, Qian Shang, Hao Li, and Xuefang Li. 2024. "Analysis of Future Drought Risk and Wheat Meteorological Disaster in Ningxia (Northwest China) Based on CMIP6 and SPEI" Agronomy 14, no. 12: 3051. https://doi.org/10.3390/agronomy14123051
APA StyleLi, X., Tan, J., Wang, X., Shang, Q., Li, H., & Li, X. (2024). Analysis of Future Drought Risk and Wheat Meteorological Disaster in Ningxia (Northwest China) Based on CMIP6 and SPEI. Agronomy, 14(12), 3051. https://doi.org/10.3390/agronomy14123051