
Biochar: An Option to Maintain Rice Yield and Mitigate Greenhouse Gas Emissions from Rice Fields in Northeast China

 ,
, 
Abstract
1. Introduction
2. Materials and Methods
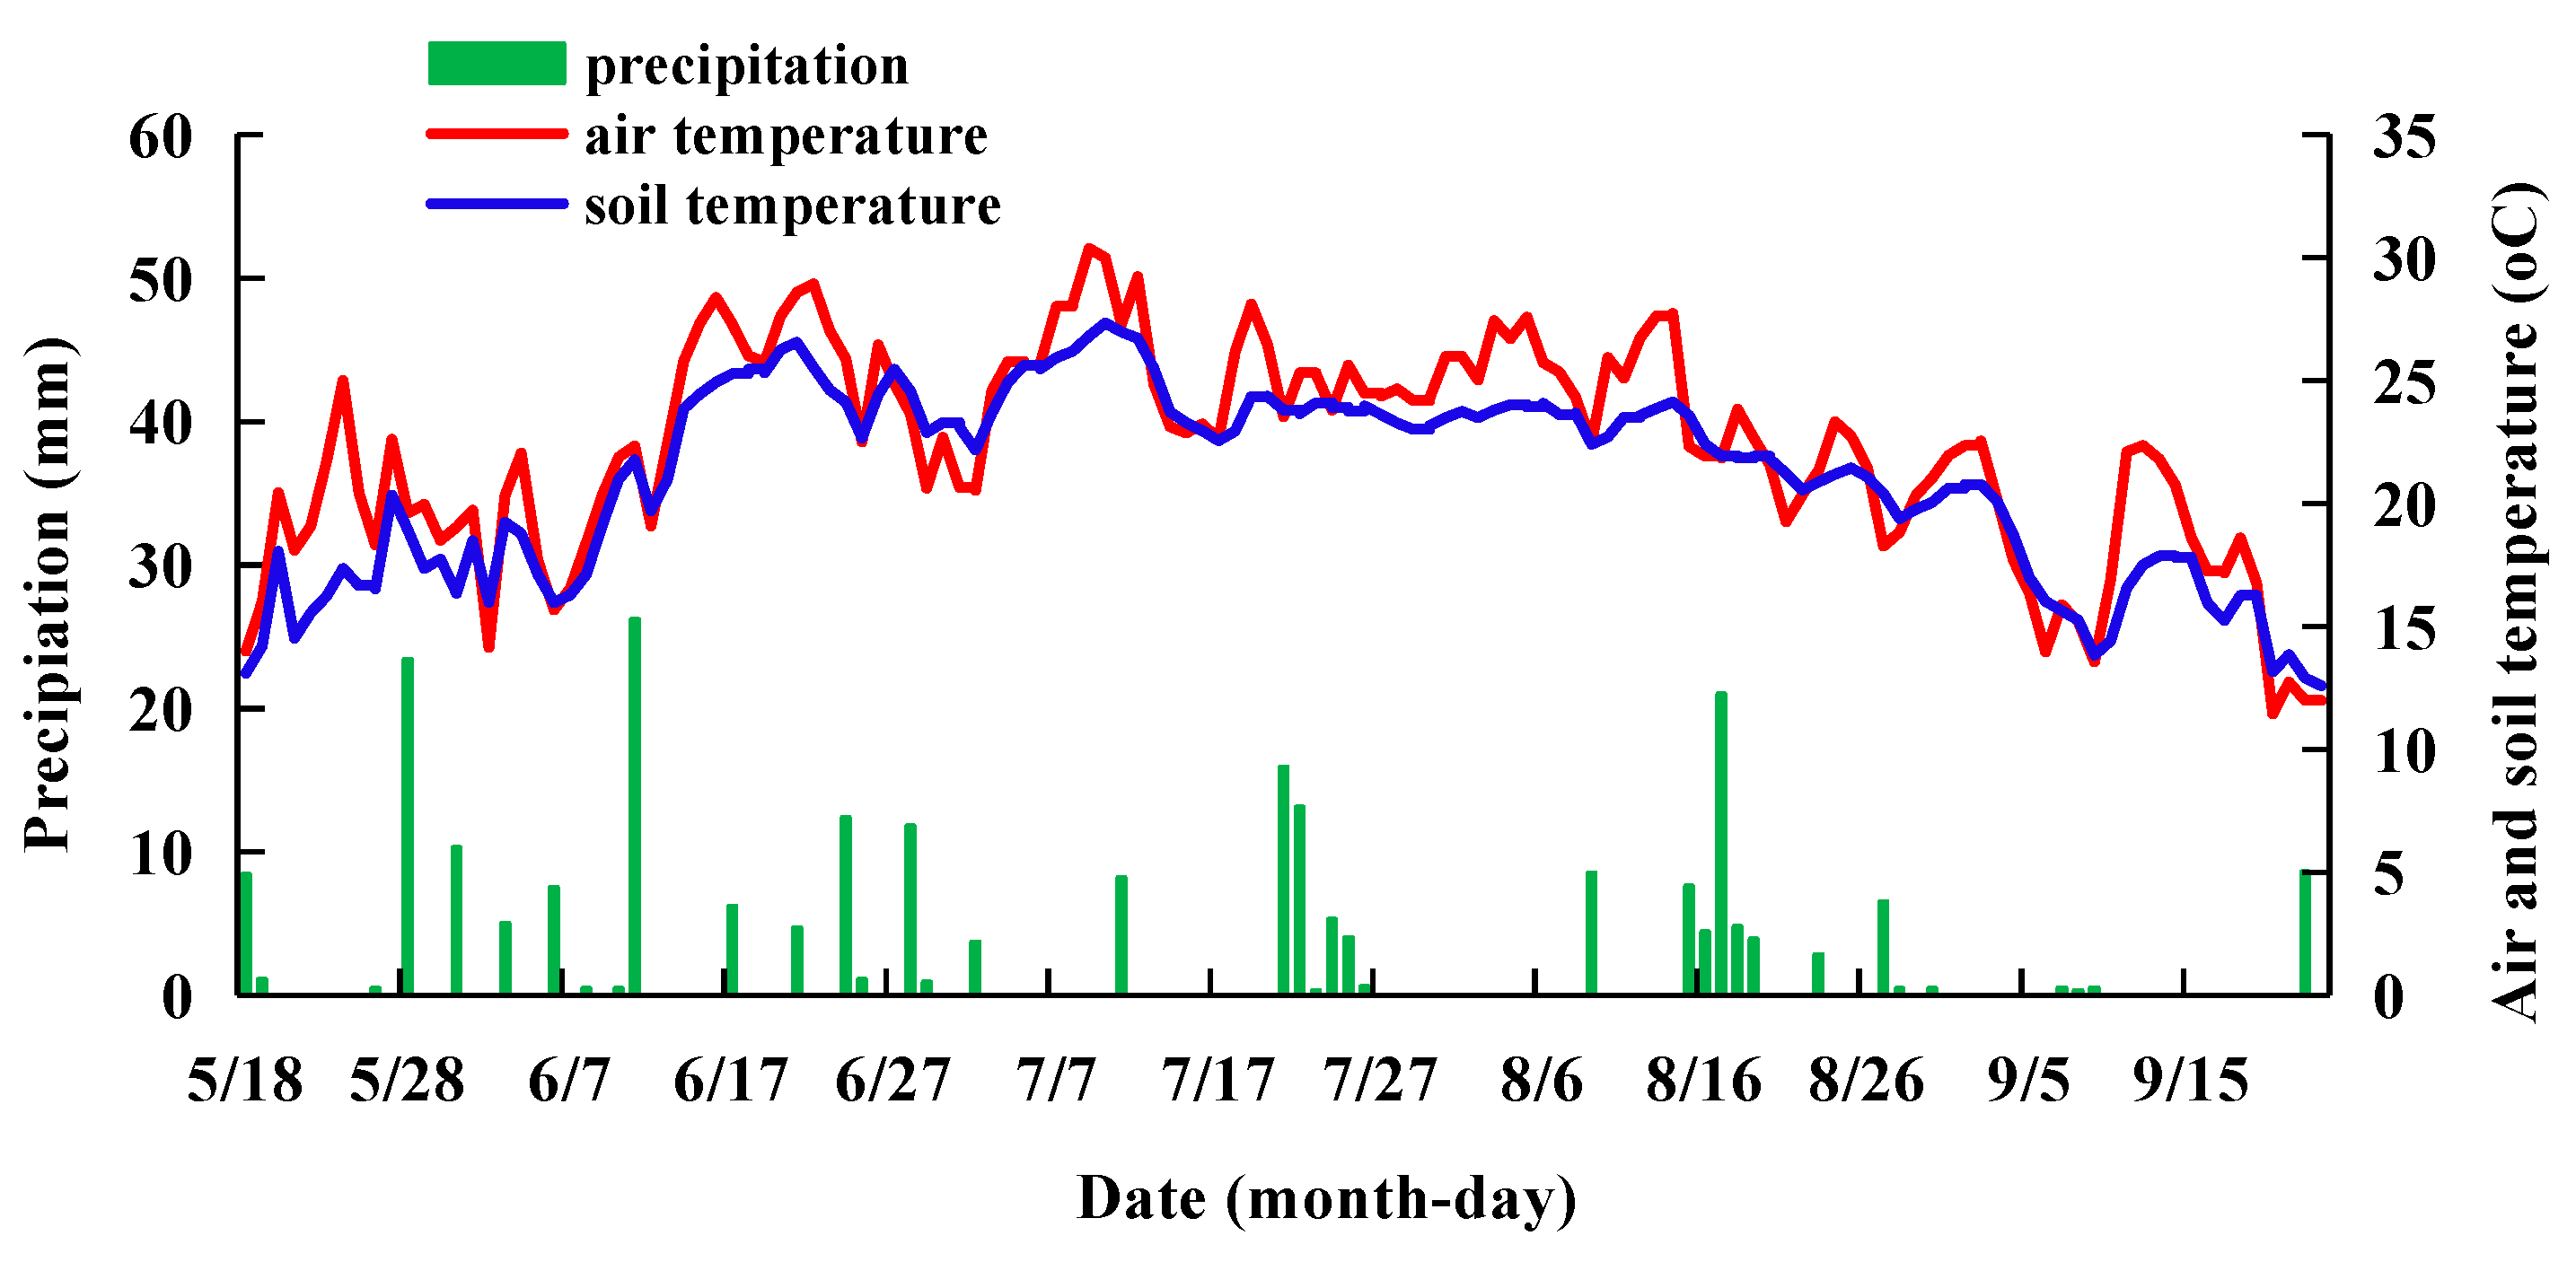
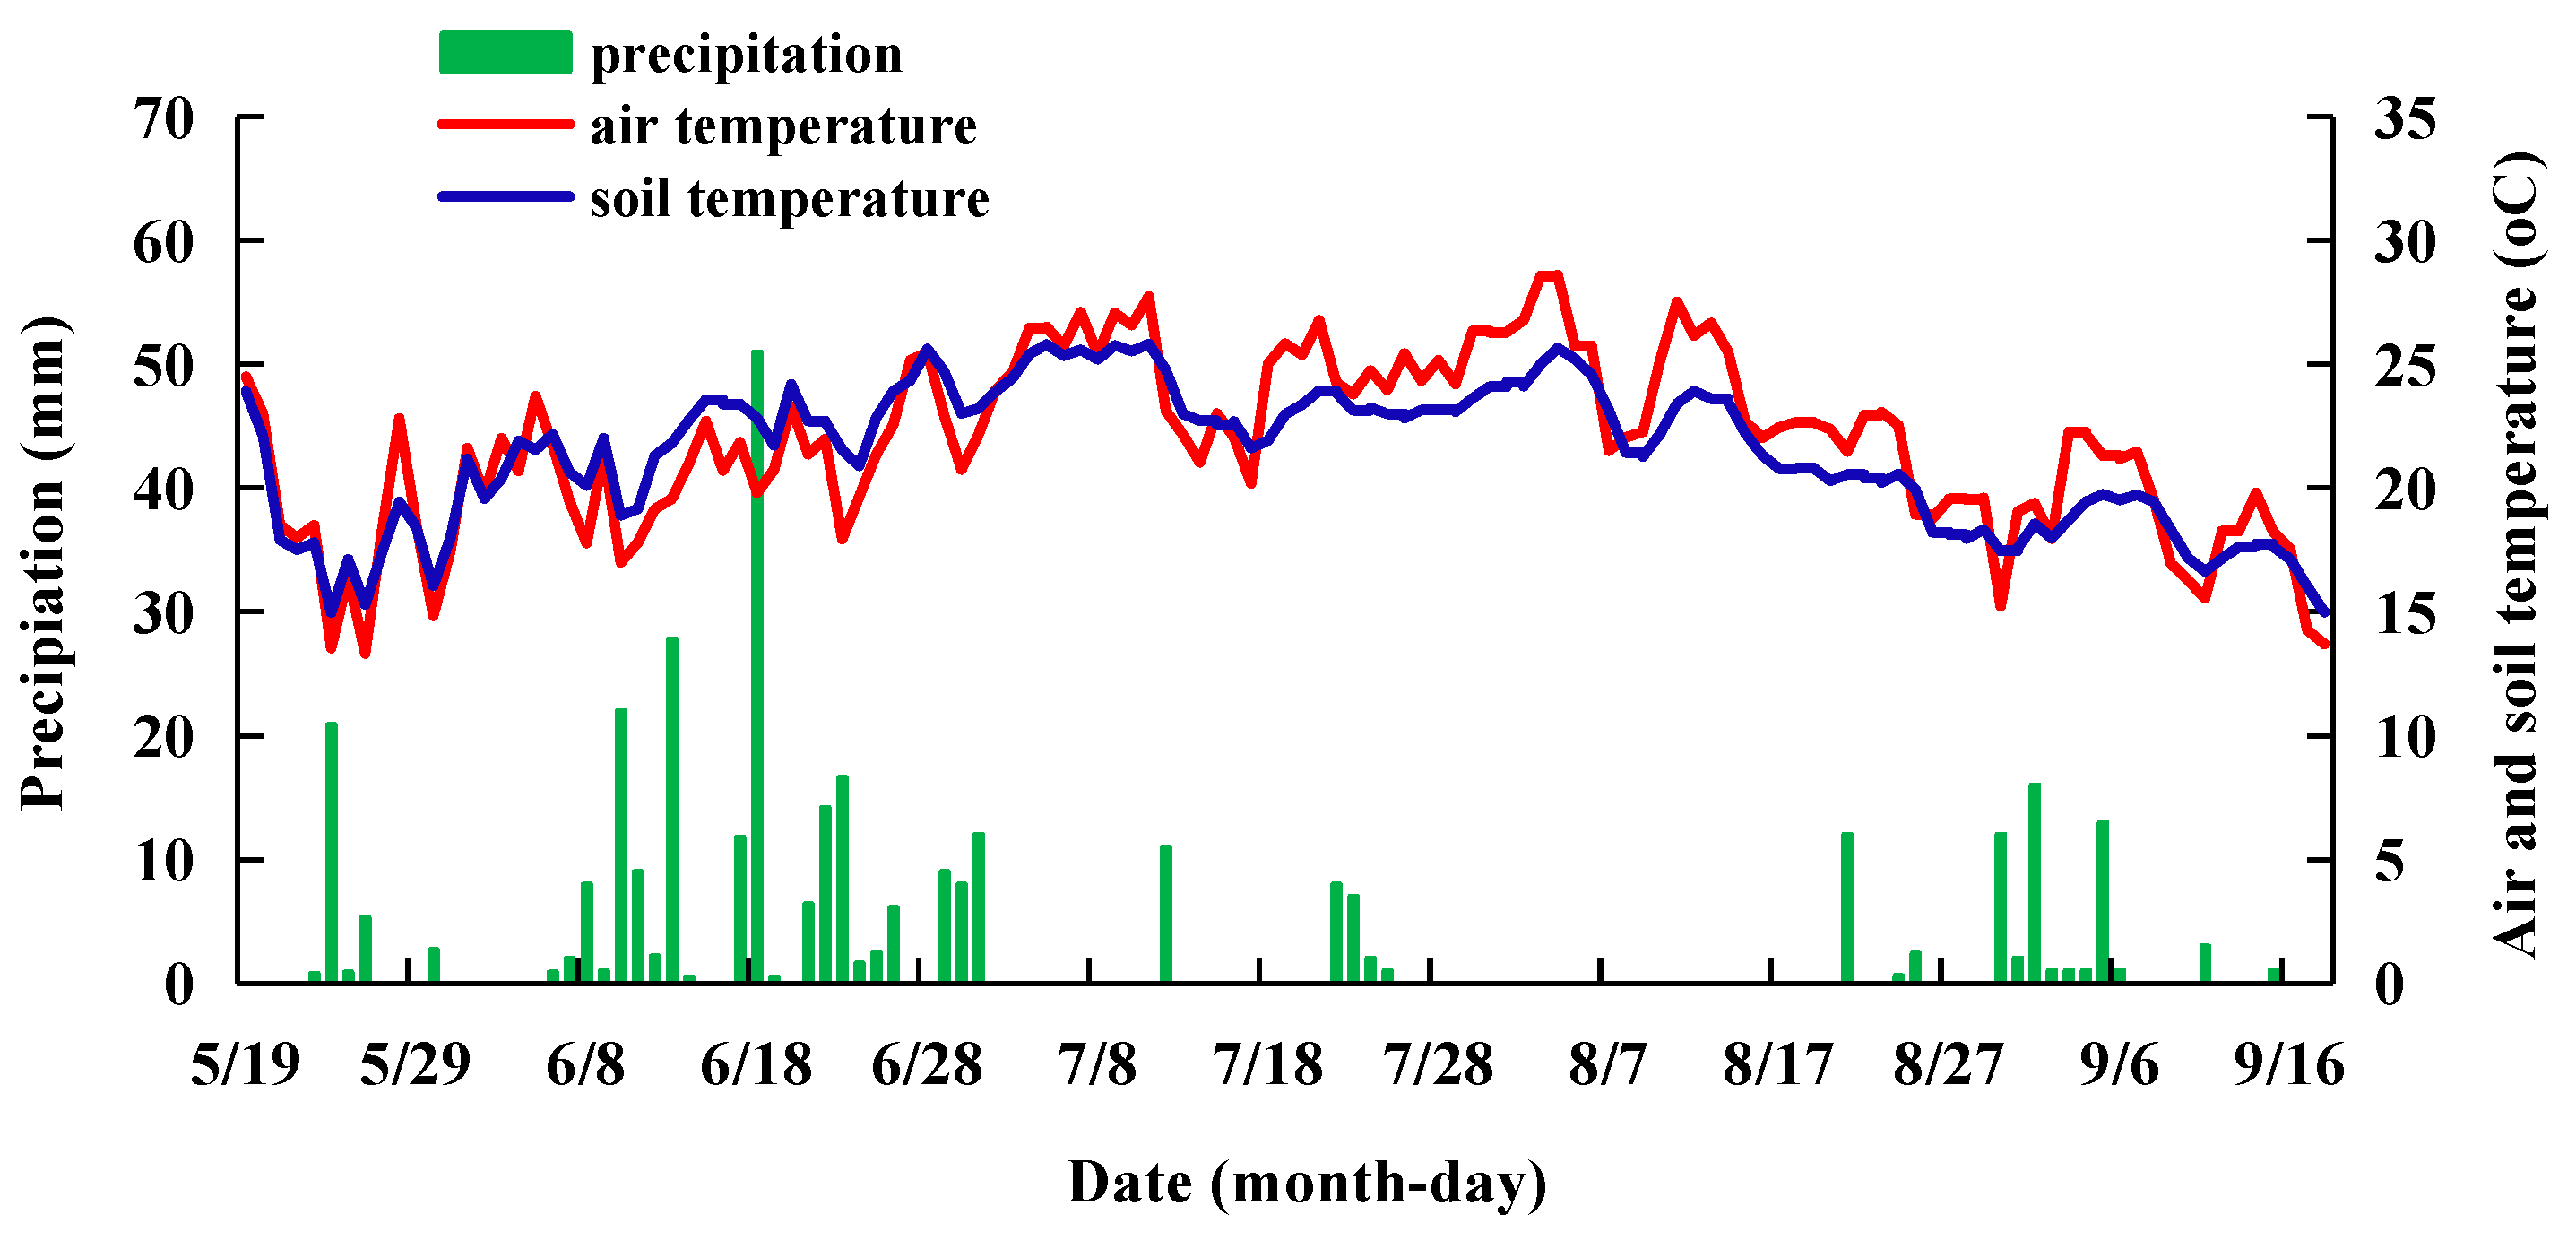
2.1. Site Description
2.2. Experimental Design
2.3. Crop Management
2.4. Gas Sampling and Measurement
2.5. Estimation of Greenhouse Gas Emissions
2.6. Estimation of Biomass and Yield
2.7. Determination of SOC and Soil Available Nutrients
2.8. Statistical Analysis
3. Results
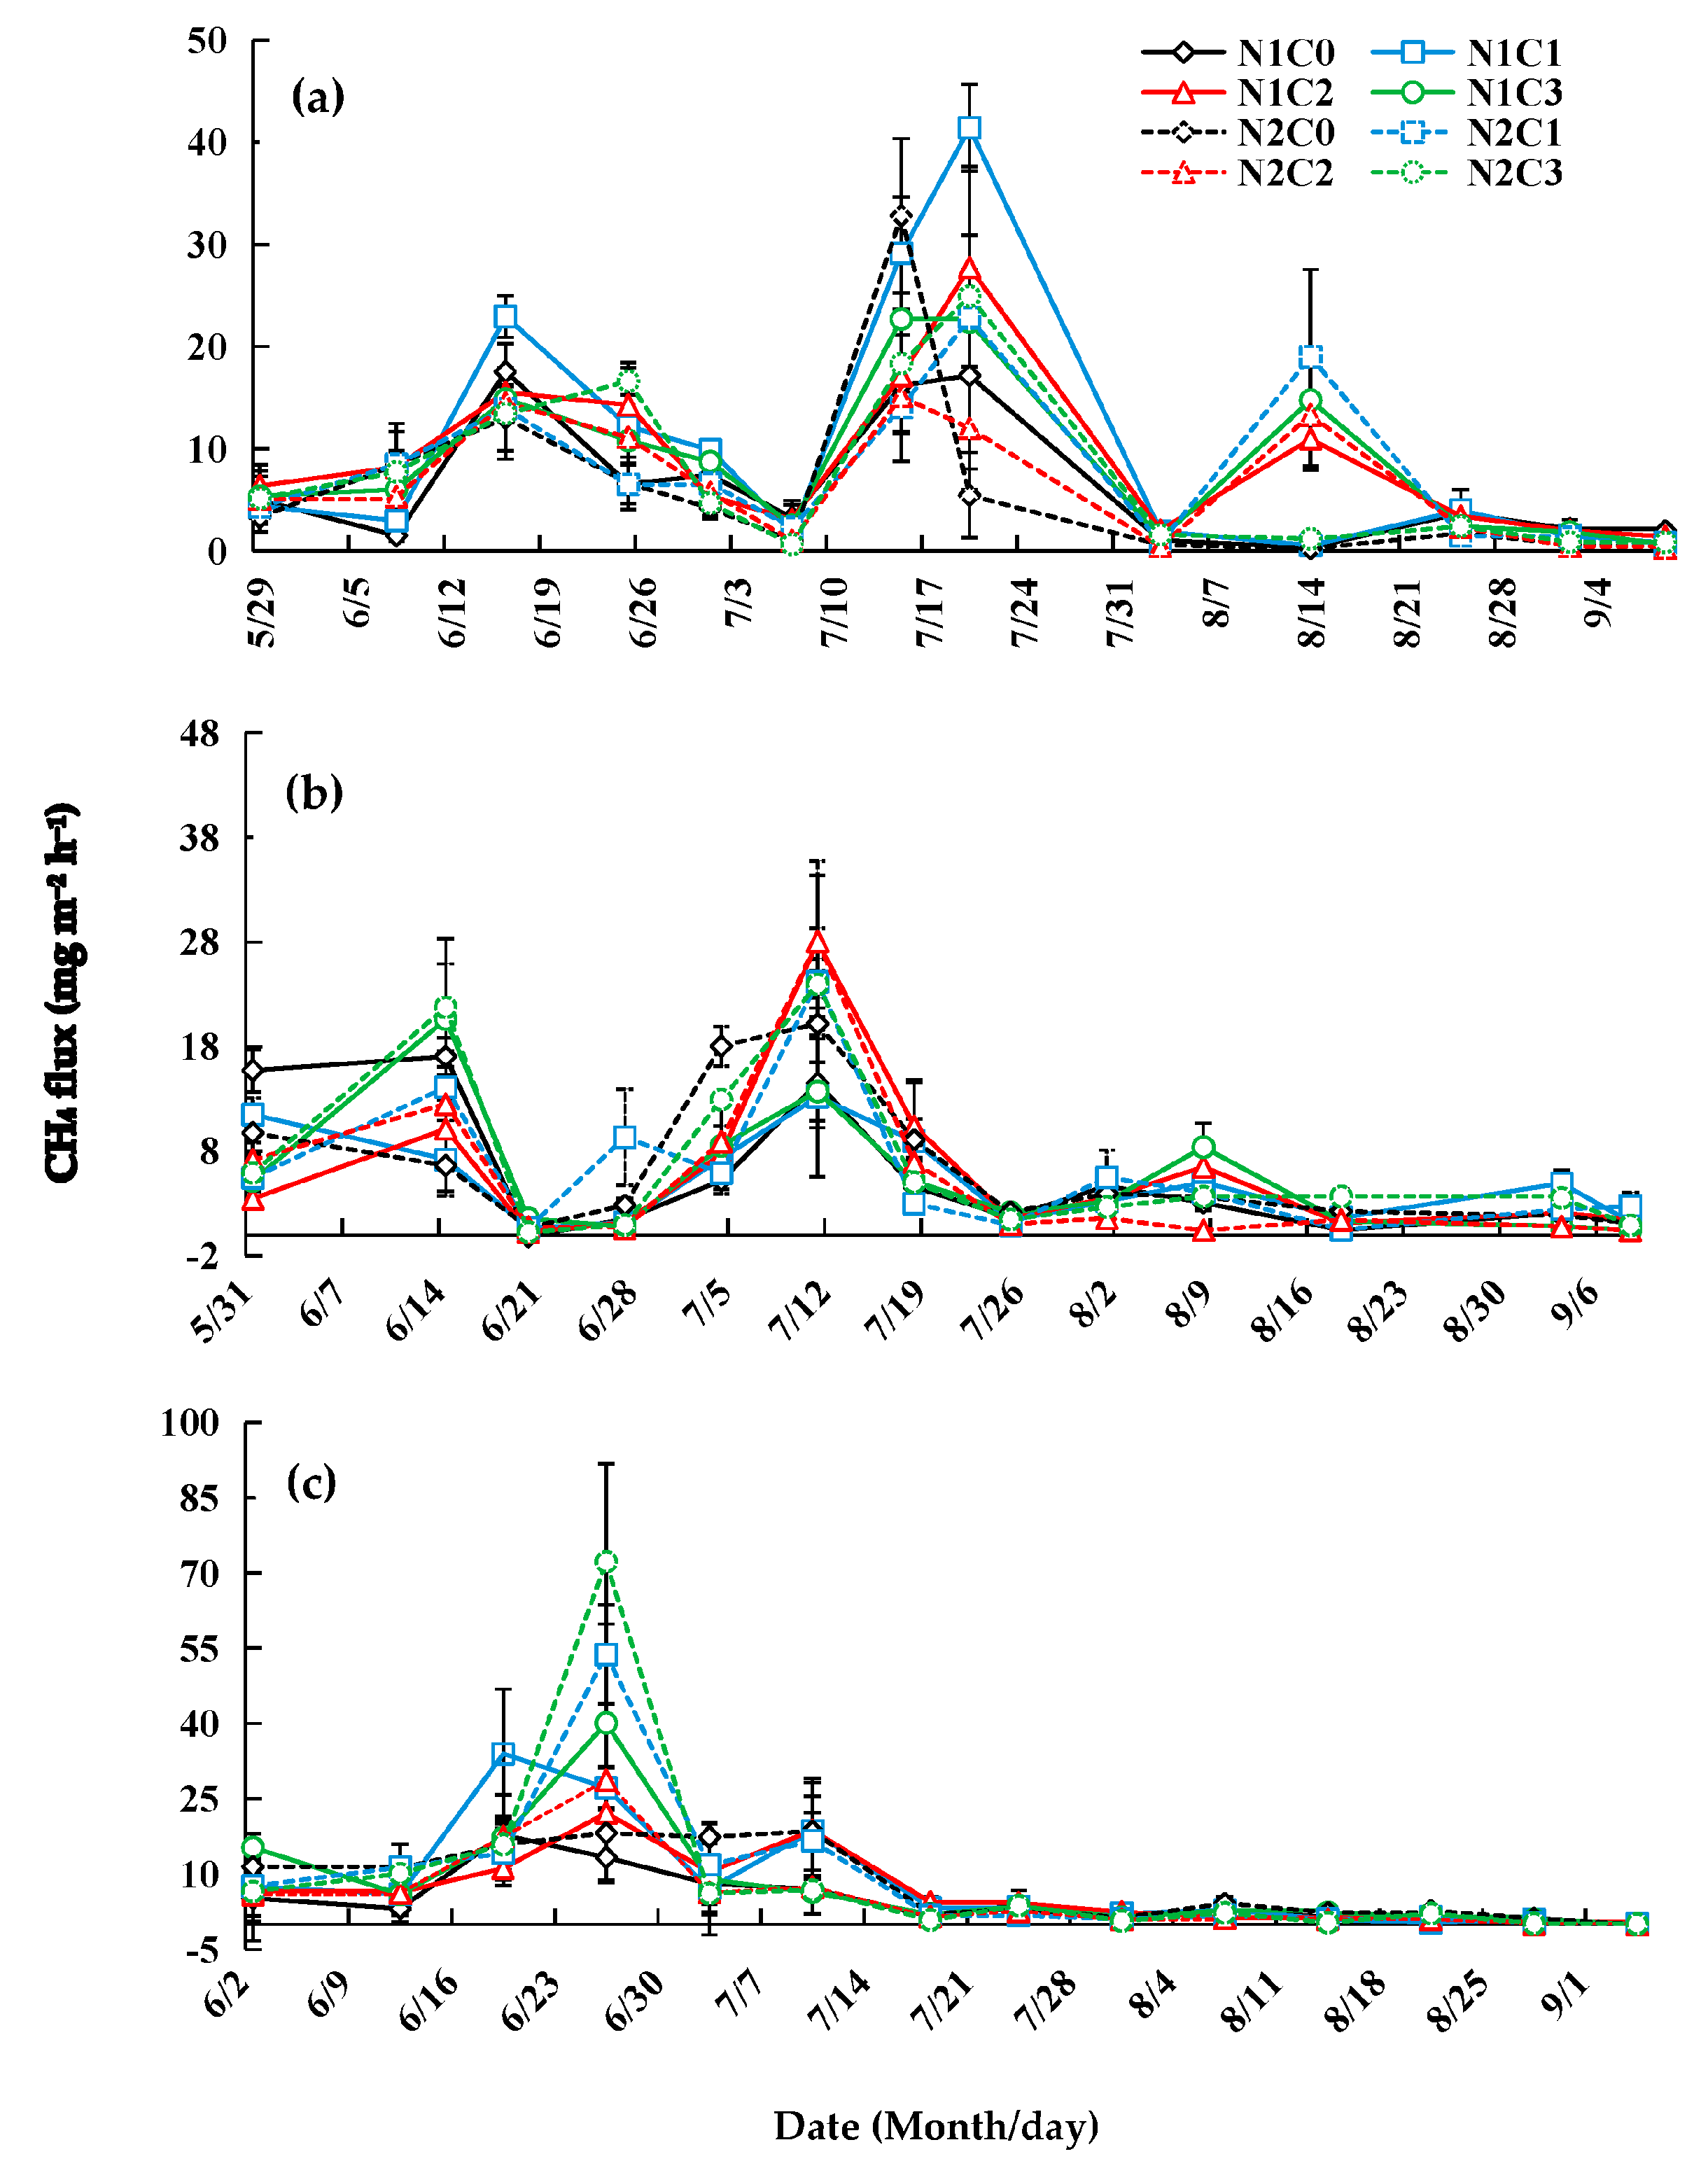
3.1. CH4 Emissions
3.2. Cumulative CH4 Emission
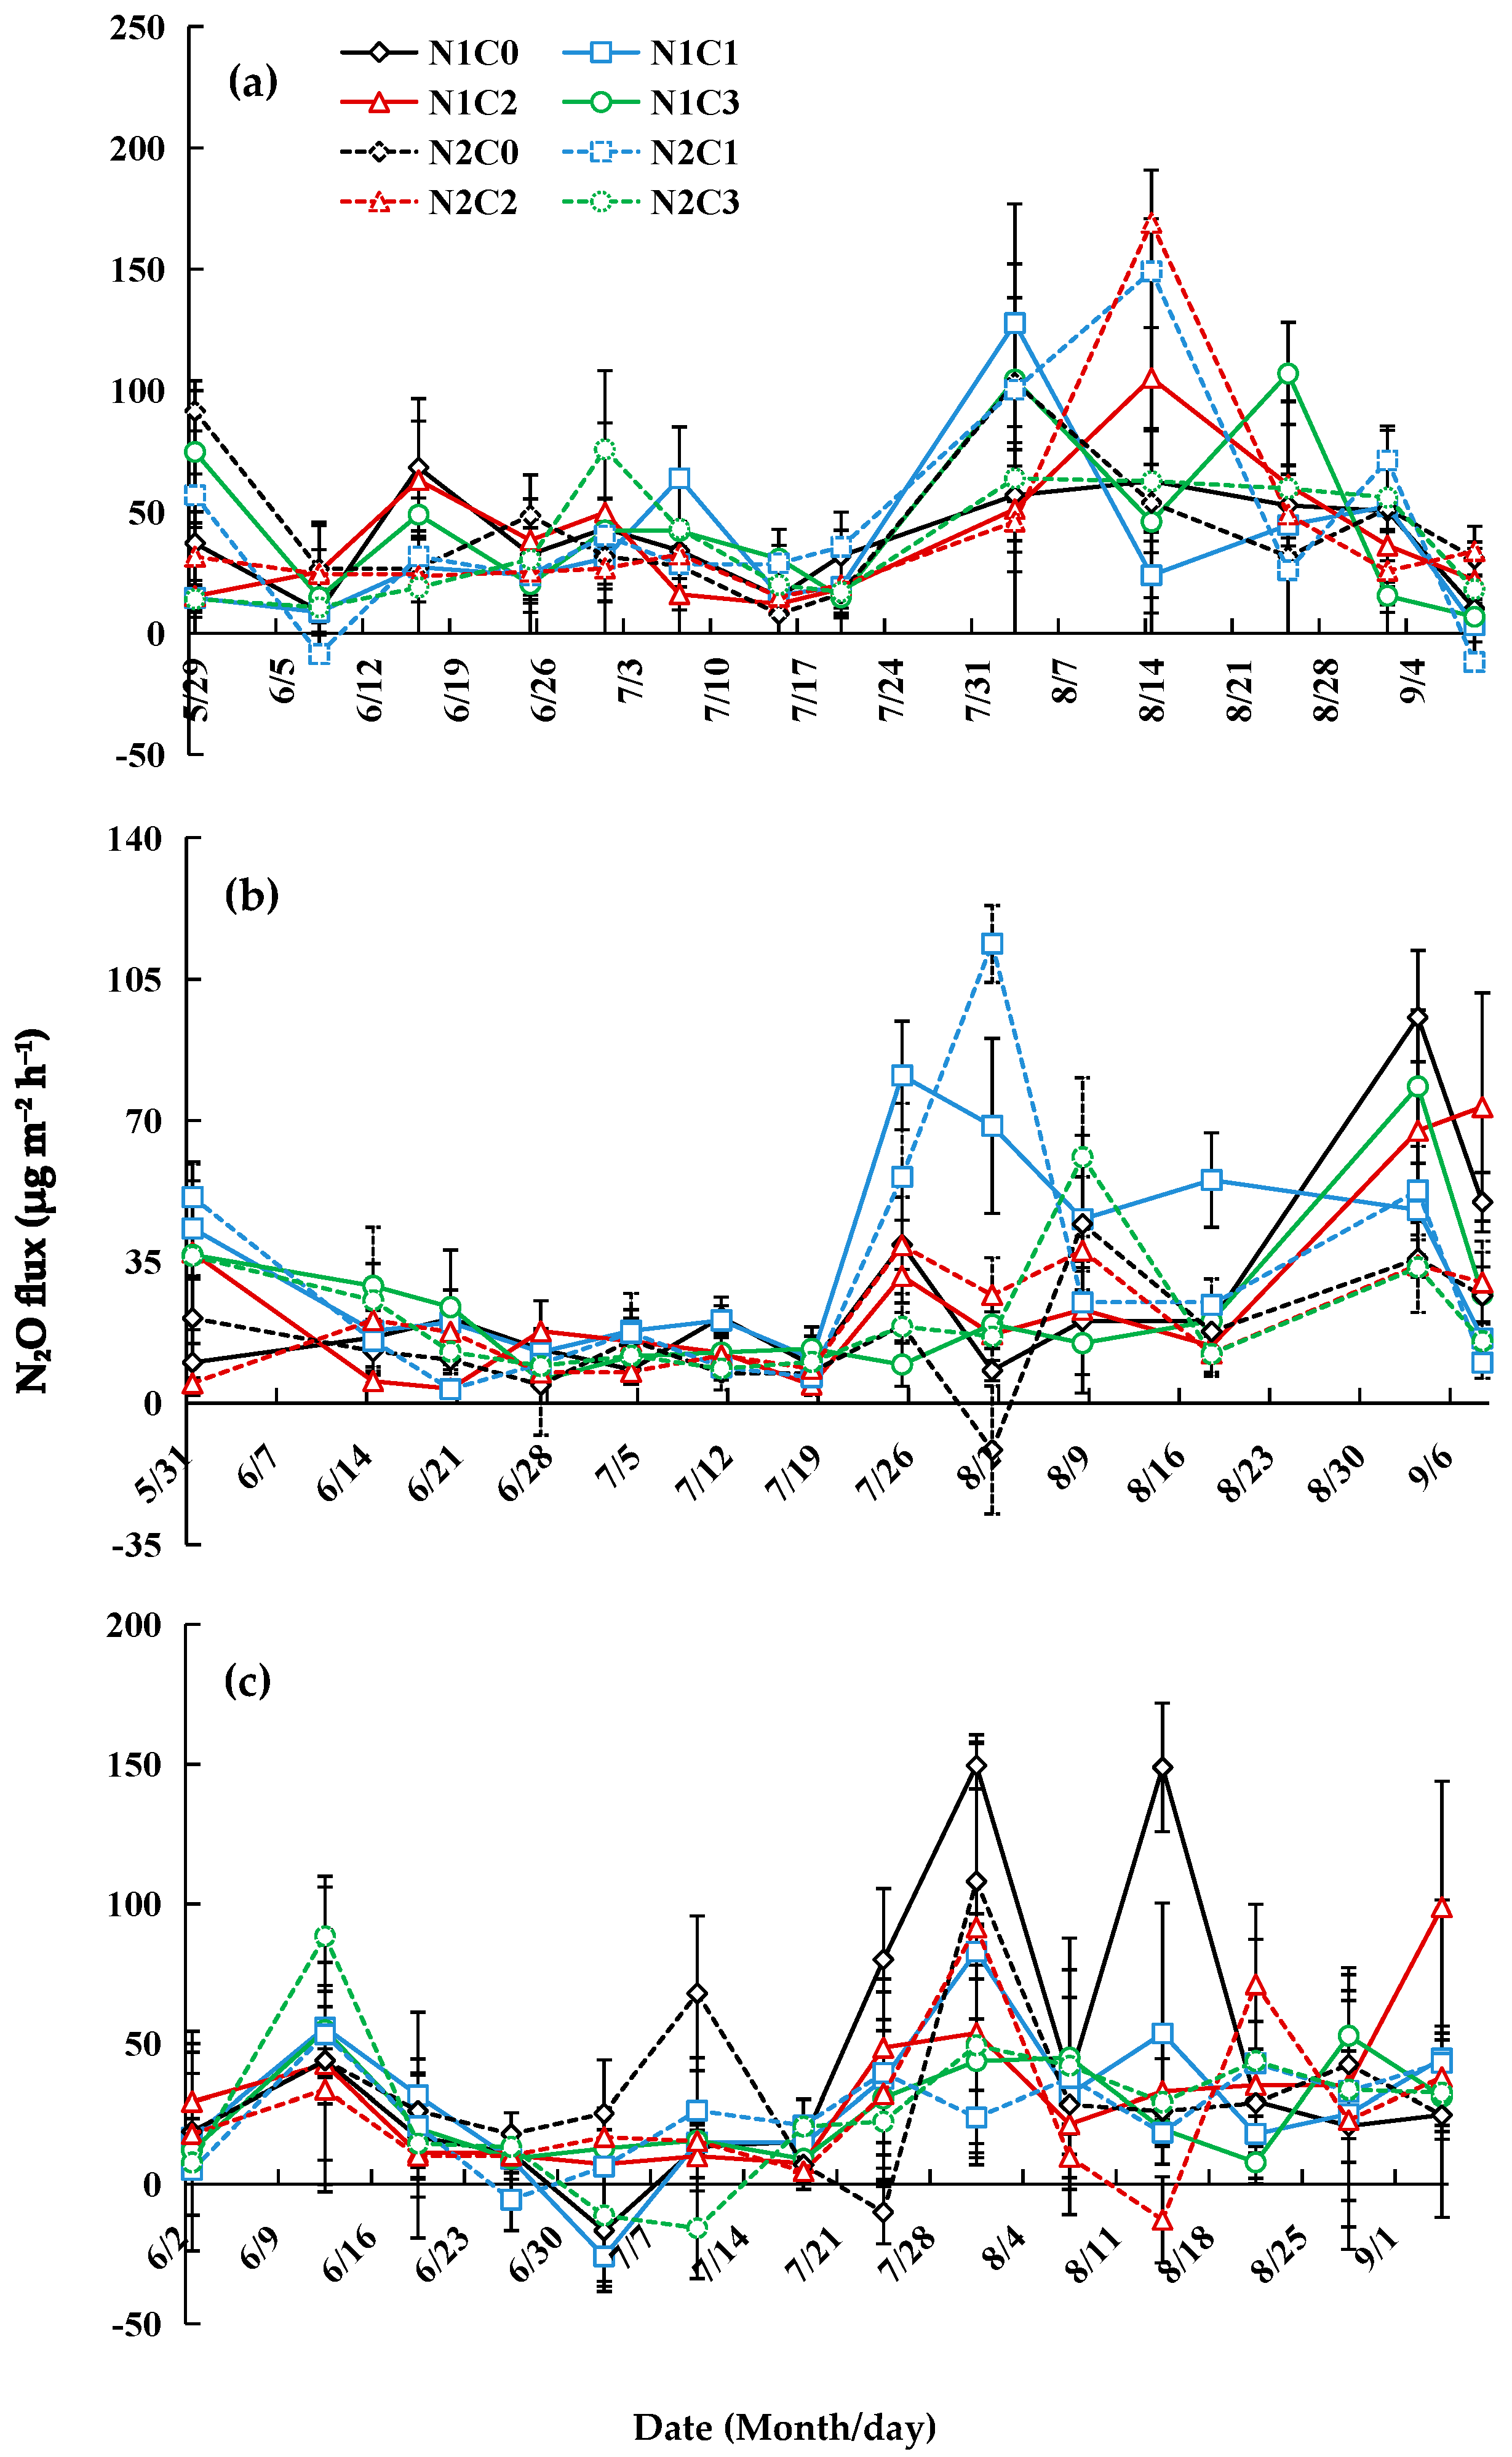
3.3. N2O Emission
3.4. Cumulative N2O
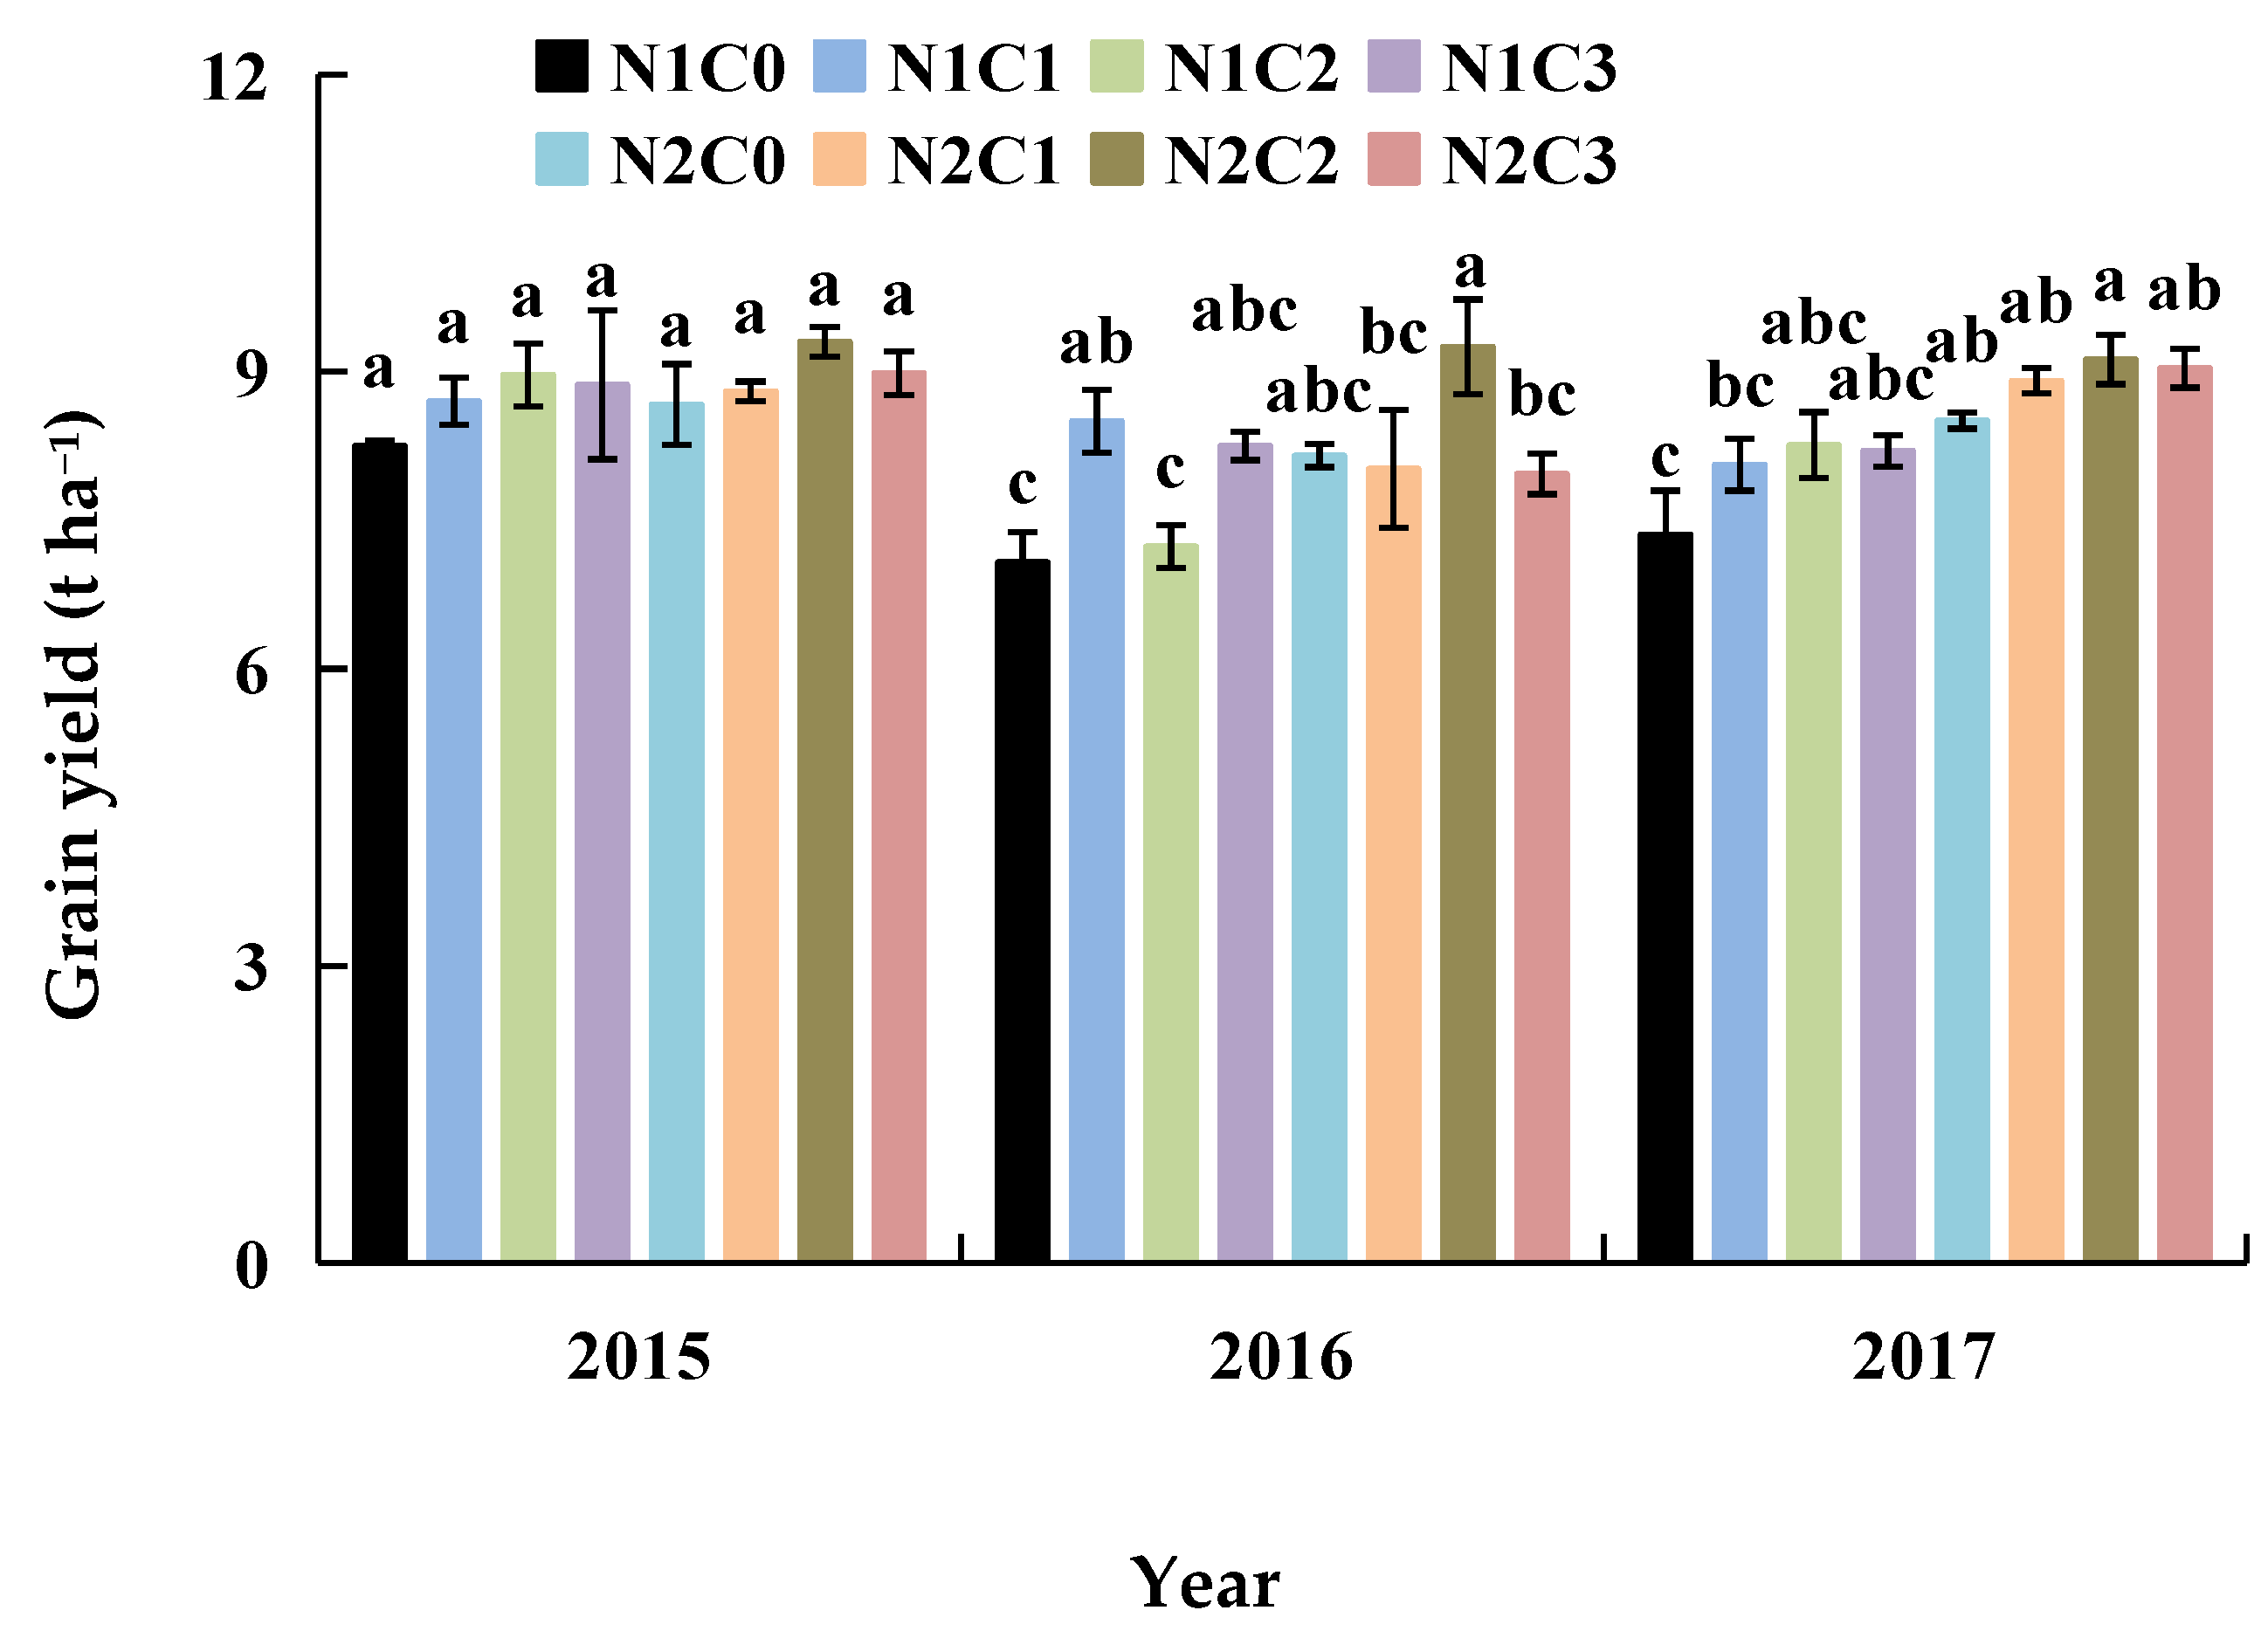
3.5. Rice Biomass and Yield
3.6. Impact of Biochar and N Fertilizer on GWP and GHGI
3.7. Soil Organic Carbon
3.8. Soil Available Nutrients

| Year | Treatment | Alkaline Nitrogen (mg kg−1) | Available Phosphorus (mg kg−1) | Available Potassium (mg kg−1) |
|---|---|---|---|---|
| 2015 | N1C0 | 86.03 ± 2.80 a | 16.83 ± 0.02 b | 146.17 ± 0.75 a |
| N1C1 | 84.22 ± 1.06 a | 19.20 ± 0.31 ab | 142.03 ± 4.39 a | |
| N1C2 | 76.77 ± 0.77b | 20.08 ± 0.45 ab | 151.80 ± 6.89 a | |
| N1C3 | 79.84 ± 1.58 ab | 20.53 ± 0.64 ab | 154.50 ± 6.86 a | |
| N2C0 | 82.36 ± 1.10 ab | 19.80 ± 1.28 ab | 147.77 ± 3.64 a | |
| N2C1 | 81.70 ± 2.37 ab | 19.39 ± 0.62 ab | 154.85 ± 0.45 a | |
| N2C2 | 79.51 ± 1.16 ab | 21.09 ± 0.96 a | 147.33 ± 8.04 a | |
| N2C3 | 83.57 ± 3.66 ab | 20.51 ± 1.41 ab | 155.53 ± 3.54 a | |
| 2016 | N1C0 | 121.65 ± 1.21 a | 27.29 ± 1.51cd | 177.50 ± 4.15 ab |
| N1C1 | 121.42 ± 1.37 a | 33.83 ± 1.07 a | 172.38 ± 3.69 ab | |
| N1C2 | 117.99 ± 4.98 a | 31.21 ± 0.81 abc | 181.37 ± 2.70 a | |
| N1C3 | 115.48 ± 3.18 a | 32.85 ± 2.35 ab | 185.05 ± 9.44 a | |
| N2C0 | 120.74 ± 2.86 a | 26.56 ± 1.20 cd | 144.93 ± 6.97 c | |
| N2C1 | 122.11 ± 2.40 a | 25.79 ± 1.75 d | 153.05 ± 4.82 bc | |
| N2C2 | 117.31 ± 3.30 a | 28.70 ± 1.85 bcd | 171.38 ± 4.08 ab | |
| N2C3 | 117.42 ± 0.75 a | 33.64 ± 2.04 a | 165.02 ± 8.85 abc | |
| 2017 | N1C0 | 101.14 ± 9.06 cd | 25.84 ± 2.81 a | 151.83 ± 2.02 bc |
| N1C1 | 114.07 ± 3.56 bc | 28.72 ± 4.05 a | 146.28 ± 4.53 bc | |
| N1C2 | 131.49 ± 8.65 a | 30.13 ± 2.51 a | 164.27 ± 5.24 abc | |
| N1C3 | 99.79 ± 4.70 cd | 36.23 ± 2.71 a | 181.65 ± 0.70 a | |
| N2C0 | 107.63 ± 3.49 cd | 25.85 ± 1.92 a | 151.40 ± 1.90 bc | |
| N2C1 | 112.22 ± 4.37 bc | 24.61 ± 3.15 a | 142.18 ± 5.93 c | |
| N2C2 | 124.15 ± 1.18 ab | 26.75 ± 1.74 a | 168.80 ± 10.23 ab | |
| N2C3 | 95.46 ± 1.36 d | 32.14 ± 1.92 a | 186.48 ± 7.09 a |
| Source | df | Aboveground Biomass | Grain Yield | Average CH4 Flux | Average N2O Flux | CH4 Emission | N2O Emission | GWP | GHGI | SOC | Alkaline Nitrogen | Available Phosphorus | Available Potassium |
|---|---|---|---|---|---|---|---|---|---|---|---|---|---|
| Year | 2 | ** | ** | ** | ** | ** | ** | ** | ns | ** | ** | ** | ** |
| N | 1 | ** | ** | ns | ns | ns | ns | ns | ** | ns | ns | ns | ns |
| C | 3 | ** | ** | ** | ns | * | ns | * | * | * | ** | ** | ** |
| Year × N | 2 | ns | ns | ** | ns | ** | ns | ** | ** | ns | ns | ns | ** |
| Year × C | 6 | ns | ns | ns | * | ns | ns | ns | ns | ns | ** | * | ** |
| N × C | 3 | ns | * | ns | ns | ns | ns | ns | ns | ns | ns | * | ns |
| Year × N × C | 6 | ns | ns | ns | ns | ns | ns | ns | ns | ns | ns | ns | ns |
| Error | 46 |
4. Discussion
4.1. Effects of Biochar and N Fertilizer on CH4 Emissions
4.2. Effects of Biochar and N Fertilizer on N2O Emissions
4.3. Effects of Biochar and N Fertilizer on GWP and GHGI
4.4. Effects of Biochar and Fertilizer on Yield of Rice and Biomass
4.5. Effects of Biochar and Fertilizer on Soil SOC and Available Nutrients
5. Conclusions
Author Contributions
Funding
Data Availability Statement
Conflicts of Interest
References
- Win, E.P.; Win, K.K.; Bellingrath-Kimura, S.D.; Oo, A.Z. Greenhouse gas emissions, grain yield and water productivity: A paddy rice field case study based in Myanmar. Greenh. Gas Sci. Technol. 2020, 10, 884–897. [Google Scholar] [CrossRef]
- FAO. Food and Agriculture Organization of the United Nations; FAO: Rome, Italy, 2019. [Google Scholar]
- Kalu, S.; Kulmala, L.; Zrim, J.; Peltokangas, K.; Tammeorg, P.; Rasa, K.; Kitzler, B.; Pihlatie, M.; Karhu, K. Potential of biochar to reduce greenhouse gas emissions and increase nitrogen use efficiency in boreal arable soils in the long-term. Front. Environ. Sci. 2022, 10, 914766. [Google Scholar] [CrossRef]
- Wang, Z.; Zhang, X.; Liu, L.; Wang, S.; Zhao, L.; Wu, X.; Zhang, W.; Huang, X. Inhibition of methane emissions from Chinese rice fields by nitrogen deposition based on the DNDC model. Agric. Syst. 2020, 184, 102919. [Google Scholar] [CrossRef]
- Ndzelu, B.S.; Dou, S.; Zhang, X. Corn straw return can increase labile soil organic carbon fractions and improve water-stable aggregates in haplic cambisol. J. Arid. Land 2021, 12, 1018–1030. [Google Scholar] [CrossRef]
- Gross, A.; Glaser, B. Meta-analysis on how manure application changes soil organic carbon storage. Sci. Rep. 2021, 11, 5516. [Google Scholar] [CrossRef]
- Iqbal, A.; Xie, H.; He, L.; Ahmad, S.; Hussain, I.; Raza, H.; Khan, A.; Wei, S.; Quan, Z.; Wu, K. Partial substitution of organic nitrogen with synthetic nitrogen enhances rice yield, grain starch metabolism and related genes expression under the dual cropping system. Saudi J. Biol. Sci. 2021, 28, 1283–1296. [Google Scholar] [CrossRef]
- Yousaf, B.; Liu, G.; Wang, R.; Abbas, Q.; Imtiaz, M.; Liu, R. Investigating the biochar effects on C-mineralization and sequestration of carbon in soil compared with conventional amendments using the stable isotope (δ13C) approach. GCB Bioenergy 2017, 9, 1085–1099. [Google Scholar] [CrossRef]
- Shakoor, A.; Arif, M.S.; Shahzad, S.M.; Farooq, T.H.; Ashraf, F.; Altaf, M.M.; Ahmed, W.; Tufail, M.A.; Ashraf, M. Does biochar accelerate the mitigation of greenhouse gaseous emissions from agricultural soil?—A global meta-analysis. Environ. Res. 2021, 202, 111789. [Google Scholar] [CrossRef]
- Ashiq, W.; Nadeem, M.; Ali, W.; Zaeem, M.; Wu, J.; Galagedara, L.; Thomas, R.; Kavanagh, V.; Cheema, M. Biochar amendment mitigates greenhouse gases emission and global warming potential in dairy manure-based silage corn in boreal climate. Environ. Pollut. 2020, 265, 114869. [Google Scholar] [CrossRef]
- Yin, X.; Chen, N.; Cao, F.; Tui, Z.; Huang, M. Short-term application of biochar improves post-heading crop growth but reduces pre-heading biomass translocation in rice. Plant Prod. Sci. 2020, 23, 522–528. [Google Scholar] [CrossRef]
- Ding, X.; Li, G.; Zhao, X. Biochar application significantly increases soil organic carbon under conservation tillage: An 11-year field experiment. Biochar 2023, 5, 28. [Google Scholar] [CrossRef]
- Zhang, D.; Pan, G.; Wu, G.; Kibue, G.W.; Li, L.; Zhang, X.; Cheng, K.; Joseph, S.; Liu, X. Biochar helps enhance maize productivity and reduce greenhouse gas emissions under balanced fertilization in a rainfed low fertility inceptisol. Chemosphere 2016, 142, 106–113. [Google Scholar] [CrossRef] [PubMed]
- Wang, Y.; Bai, R.; Di, H.J.; Mo, L.Y.; Han, B.; Zhang, L.M.; He, J.Z. Differentiated mechanisms of biochar mitigating straw-induced greenhouse gas emissions in two contrasting paddy soils. Front. Microbiol. 2018, 9, 2566. [Google Scholar] [CrossRef]
- Li, J.; Kwak, J.H.; Chang, S.X.; Gong, X.; An, Z.; Chen, J. Greenhouse gas emissions from forest soils reduced by straw biochar and nitrapyrin applications. Land 2021, 10, 189. [Google Scholar] [CrossRef]
- Huang, M.; Yang, L.; Qin, H.; Jiang, L.; Zou, Y. Fertilizer nitrogen uptake by rice increased by biochar application. Biol. Fert. Soils 2014, 50, 997–1000. [Google Scholar] [CrossRef]
- Yao, Y.; Gao, B.; Zhang, M.; Inyang, M.; Zimmerman, A.R. Effect of biochar amendment on sorption and leaching of nitrate, ammonium, and phosphate in a sandy soil. Chemosphere 2012, 89, 1467–1471. [Google Scholar] [CrossRef]
- Turunen, M.; Hyväluoma, J.; Heikkinen, J.; Keskinen, R.; Kaseva, J.; Hannula, M. Quantifying the pore structure of different biochars and their impacts on the water retention properties of sphagnum moss growing media. Biosyst. Eng. 2020, 191, 96–106. [Google Scholar] [CrossRef]
- Zhao, Y.; Jiang, H.; Gao, J.; Feng, Y.; Yan, B.; Li, K.; Zhang, W. Effects of nitrogen co-application by different biochar materials on rice production potential and greenhouse gas emissions in paddy fields in northern China. Environ. Technol. Innov. 2023, 32, 103242. [Google Scholar] [CrossRef]
- Liao, P.; Sui, F.; Tang, J.; Zeng, Y.J.; Wu, Z.M.; Shi, Q.H.; Huang, S. Effects of biochar amendment on the global warming potential and greenhouse gas intensity in a double rice-cropping system. J. Nucl. Agric. Sci. 2018, 32, 1821–1830. [Google Scholar] [CrossRef]
- Xu, C.; Ji, L.; Chen, Z.; Fang, F.P. Historical review and prospect of China’s rice production, market and import and export trade. J. China Rice. 2021, 27, 17–21. [Google Scholar] [CrossRef]
- Wang, J.Y.; Jia, J.X.; Xiong, Z.Q.; Khalil, M.A.K.; Xing, G.X. Water regime–nitrogen fertilizer–straw incorporation interaction: Field study on nitrous oxide emissions from a rice agroecosystem in Nanjing, China. Agric. Ecosyst. Environ. 2011, 141, 437–446. [Google Scholar] [CrossRef]
- Zou, J.; Huang, Y.; Jiang, J.; Zheng, X.; Sass, R. A 3-year field measurement of methane and nitrous oxide emissions from rice paddies in China: Effects of water regime, crop residue, and fertilizer application. Glob. Biogeochem. Cycles 2005, 19, 153–174. [Google Scholar] [CrossRef]
- He, Y.; Zhou, X.; Jiang, L.; Li, M.; Du, Z.; Zhou, G.; Shao, J.; Wang, X.; Xu, Z.; Bai, S.; et al. Effects of biochar application on soil greenhouse gas fluxes: A meta-analysis. GCB Bioenergy 2017, 9, 743–755. [Google Scholar] [CrossRef]
- Mukome, F.N.D.; Six, J.; Parikh, S.J. The effects of walnut shell and wood feedstock biochar amendments on greenhouse gas emissions from a fertile soil. Geoderma 2013, 200–201, 90–98. [Google Scholar] [CrossRef]
- Montanarella, L.; Lugato, E. The application of biochar in the EU: Challenges and opportunities. Agron 2013, 3, 462–473. [Google Scholar] [CrossRef]
- Paustian, K.; Larson, E.; Kent, J.; Marx, E.; Swan, A. Soil C sequestration as a biological negative emission strategy. Front. Clim. 2019, 1, 8. [Google Scholar] [CrossRef]
- Cayuela, M.L.; van Zwieten, L.; Singh, B.P.; Jeffery, S.; Roig, A.; Sanchez-Monedero, M.A. Biochar’s role in mitigating soil nitrous oxide emissions: A review and meta-analysis. Agric. Ecosys. Environ. 2014, 191, 5–16. [Google Scholar] [CrossRef]
- IPCC. Climate Change 2014: Synthesis Report. Contribution of Working Groups I, II and III to the Fifth Assessment Report of the Intergovernmental Panel on Climate Change; Core Writing Team; Pachauri, R.K., Meyer, L.A., Eds.; IPCC: Geneva, Switzerland, 2013. [Google Scholar]
- Liu, X.; Mao, P.N.; Li, L.H.; Ma, J. Impact of biochar application on yield-scaled greenhouse gas intensity: A meta-analysis. Sci. Total Environ. 2019, 656, 969–976. [Google Scholar] [CrossRef]
- Schulz, H.; Dunst, G.; Glaser, B. Positive effects of composted biochar on plant growth and soil fertility. Agron. Sustain. Dev. 2013, 33, 817–827. [Google Scholar] [CrossRef]
- Kongthod, T.; Thanachit, S.; Anusontpornperm, S.; Wiriyakitnateekul, W. Effects of biochar and other organic soil amendments on plant nutrient availability in an Ustoxic Quartzipsamment. Pedosphere 2015, 25, 790–798. [Google Scholar] [CrossRef]
- Zhang, A.; Liu, Y.; Pan, G.; Hussain, Q.; Li, L.; Zheng, J.; Zhang, X. Effect of biochar amendment on maize yield and greenhouse gas emissions from a soil organic carbon poor calcareous loamy soil from Central China Plain. Plant Soil 2012, 351, 263–275. [Google Scholar] [CrossRef]
- Liu, Y.; Lu, H.; Yang, S.; Wang, Y. Impacts of biochar addition on rice yield and soil properties in a cold waterlogged paddy for two crop seasons. Field Crops Res. 2016, 191, 161–167. [Google Scholar] [CrossRef]
- Wang, C.; Liu, J.; Shen, J.; Chen, D.; Li, Y.; Jiang, B.; Wu, J. Effects of biochar amendment on net greenhouse gas emissions and soil fertility in a double rice cropping system: A 4-year field experiment. Agric. Ecosyst. Environ. 2018, 262, 83–96. [Google Scholar] [CrossRef]
- Qi, L.; Pokharel, P.; Chang, S.X.; Zhou, P.; Niu, H.; He, X.; Wang, Z.; Gao, M. Biochar application increased methane emission, soil carbon storage and net ecosystem carbon budget in a 2-year vegetable–rice rotation. Agric. Ecosyst. Environ. 2020, 292, 106831. [Google Scholar] [CrossRef]
- Atkinson, C.J.; Fitzgerald, J.D.; Hipps, N.A. Potential mechanisms for achieving agricultural benefits from biochar application to temperate soils: A review. Plant Soil. 2010, 337, 1–18. [Google Scholar] [CrossRef]
- Duku, H.M.; Gu, S.; Hagan, E.B. Biochar production potentials in Ghana—A review. Renew. Sustain. Energy Rev. 2011, 15, 3539–3551. [Google Scholar] [CrossRef]
- De Gryze, S.; Cullen, M.; Durschinger, L.; Lehmann, J.; Bluhm, D.; Six, J. Evaluation of opportunities for generating carbon offsets from soil sequestration of biochar. In An Issues Paper Commissioned by the Climate Action Reserve, 5th ed.; Terra Global Capital LLC: Oakland, CA, USA, 2010; pp. 1–99. Available online: http://www.terraglobalcapital.com/press/Soil (accessed on 23 May 2019).
- de Vasconcelos, A.C.F.; Chaves, L.H.G.; Gheyi, H.R.; Fernandes, J.D.; Tito, G.A. Crambe growth in a soil amended with biochar and under saline irrigation. Commun. Soil Sci. Plant Anal. 2017, 48, 1291–1300. [Google Scholar] [CrossRef]
- El-Eyuoon, A.; Amin, A.Z. Impact of corn cob biochar on potassium status and wheat growth in a calcareous sandy soil. Commun. Soil Sci. Plant Anal. 2016, 47, 2026–2033. [Google Scholar] [CrossRef]
- Amendola, C.; Montagnoli, A.; Terzaghi, M.; Trupiano, D.; Oliva, F.; Baronti, S.; Miglietta, F.; Chiatante, D.; Scippa, G.S. Short-term effects of biochar on grapevine fine root dynamics and arbuscular mycorrhizae production. Agric. Ecosyst. Environ. 2017, 239, 236–245. [Google Scholar] [CrossRef]


| Treatment | N Rate (kg N ha−1) | Biochar Rate (t ha−1) |
|---|---|---|
| N1C0 | 120 | 0.0 |
| N1C1 | 120 | 1.0 |
| N1C2 | 120 | 1.5 |
| N1C3 | 120 | 2.0 |
| N2C0 | 180 | 0.0 |
| N2C1 | 180 | 1.0 |
| N2C2 | 180 | 1.5 |
| N2C3 | 180 | 2.0 |
| Treatment | Cumulative CH4 (kg ha−1) | ||
|---|---|---|---|
| 2015 | 2016 | 2017 | |
| N1C0 | 193.34 ± 29.39 ab | 188.04 ± 16.44 a | 132.38 ±2.58 c |
| N1C1 | 272.68 ± 21.83 a | 164.16 ± 4.09 a | 220.41 ± 9.85 ab |
| N1C2 | 255.91 ± 11.76 ab | 155.90 ± 2.20 a | 177.91 ± 25.60 abc |
| N1C3 | 242.61 ± 30.87 ab | 158.46 ± 33.49 a | 233.16 ± 17.90 a |
| N2C0 | 151.76 ± 21.42 b | 180.57 ± 25.55 a | 225.85 ± 20.09 ab |
| N2C1 | 224.05 ± 62.56 ab | 167.52 ± 6.09 a | 239.35 ± 30.25 a |
| N2C2 | 187.37 ± 5.23 ab | 153.43 ± 14.95 a | 156.80 ± 19.46 bc |
| N2C3 | 206.99 ± 20.61 ab | 190.47 ± 2.60 a | 240.02 ± 27.98 a |
| Treatment | Cumulative N2O (kg ha−1) | ||
|---|---|---|---|
| 2015 | 2016 | 2017 | |
| N1C0 | 1.15 ± 0.16 a | 0.78 ± 0.12 ab | 1.13 ±0.12 a |
| N1C1 | 1.05 ± 0.29 a | 1.07 ± 0.11 a | 0.87 ± 0.17 a |
| N1C2 | 1.20 ± 0.11 a | 0.85 ± 0.10 ab | 1.10 ± 0.30 a |
| N1C3 | 1.47 ± 0.22 a | 0.78 ± 0.08 ab | 0.75 ± 0.06 a |
| N2C0 | 1.43 ± 0.09 a | 0.54 ± 0.01 b | 0.91 ± 0.06 a |
| N2C1 | 1.45 ± 0.18 a | 0.93 ± 0.06 ab | 0.76 ± 0.04 a |
| N2C2 | 1.45 ± 0.04 a | 0.56 ± 0.02 b | 0.77 ± 0.08 a |
| N2C3 | 1.10 ± 0.06 a | 0.68 ± 0.02 ab | 0.76 ± 0.13 a |
| Treatment | GWP (kg ha−1) | ||
|---|---|---|---|
| 2015 | 2016 | 2017 | |
| N1C0 | 5176.6 ± 597.9 ab | 4934.0 ± 446.7 a | 3644.7 ±83.9 c |
| N1C1 | 7130.1 ± 464.0 a | 4423.6 ± 133.2 a | 5770.6 ± 267.5 ab |
| N1C2 | 6755.2 ± 263.3 ab | 4149.3 ± 28.4 a | 4775.1 ± 723.2 abc |
| N1C3 | 6501.9 ± 780.2 ab | 4193.0 ± 853.5 a | 6051.3 ± 438.1 a |
| N2C0 | 4220.6 ± 508.2 b | 4674.1 ± 639.6 a | 5917.8 ± 504.1 ab |
| N2C1 | 6033.4 ± 1511.5 ab | 4466.2 ± 141.2 a | 6209.2 ± 760.6 a |
| N2C2 | 5114.8 ± 133.1 ab | 4003.3 ± 397.2 a | 4149.2 ± 467.1 bc |
| N2C3 | 5502.4 ± 761.5 ab | 4963.0 ± 98.8 a | 6225.9 ± 695.9 a |
| Treatment | GHGI (kg kg−1) | ||
|---|---|---|---|
| 2015 | 2016 | 2017 | |
| N1C0 | 0.63 ± 0.07 abc | 0.70 ± 0.05 a | 0.50 ± 0.02 bc |
| N1C1 | 0.82 ± 0.05 a | 0.52 ± 0.01 bc | 0.72 ± 0.04 a |
| N1C2 | 0.76 ± 0.05 ab | 0.57 ± 0.02 abc | 0.58 ± 0.08 abc |
| N1C3 | 0.76 ± 0.14 ab | 0.51 ± 0.10 bc | 0.74 ± 0.04 a |
| N2C0 | 0.55 ± 0.07 bc | 0.57 ± 0.07 abc | 0.70 ± 0.06 ab |
| N2C1 | 0.52 ± 0.17 c | 0.56 ± 0.06 abc | 0.70 ± 0.09 ab |
| N2C2 | 0.55 ± 0.01 bc | 0.43 ± 0.02 c | 0.46 ± 0.06 c |
| N2C3 | 0.61 ± 0.07 abc | 0.62 ± 0.03 ab | 0.69 ± 0.07 ab |
| Treatment | SOC (g kg−1) | ||
|---|---|---|---|
| 2015 | 2016 | 2017 | |
| N1C0 | 13.65 ± 0.30 a | 13.92 ± 0.73 a | 13.44 ± 0.92 b |
| N1C1 | 13.84 ± 0.44 a | 13.75 ± 0.72 a | 14.94 ± 0.77 ab |
| N1C2 | 13.86 ± 0.22 a | 14.61 ± 1.10 a | 14.97 ± 0.41 ab |
| N1C3 | 14.16 ± 0.59 a | 13.33 ± 0.38 a | 15.53 ± 0.94 a |
| N2C0 | 13.44 ± 0.09 a | 13.68 ± 0.48 a | 13.96 ± 0.67 ab |
| N2C1 | 14.10 ± 0.04 a | 13.99 ± 1.39 a | 14.18 ± 0.36 ab |
| N2C2 | 14.12 ± 0.03 a | 13.99 ± 0.39 a | 14.88 ± 0.24 ab |
| N2C3 | 14.21 ± 0.15 a | 13.90 ± 0.94 a | 15.24 ± 0.27 a |
Disclaimer/Publisher’s Note: The statements, opinions and data contained in all publications are solely those of the individual author(s) and contributor(s) and not of MDPI and/or the editor(s). MDPI and/or the editor(s) disclaim responsibility for any injury to people or property resulting from any ideas, methods, instructions or products referred to in the content. |
© 2024 by the authors. Licensee MDPI, Basel, Switzerland. This article is an open access article distributed under the terms and conditions of the Creative Commons Attribution (CC BY) license (https://creativecommons.org/licenses/by/4.0/).
Share and Cite
Dong, W.; Danso, F.; Tang, A.; Zhang, J.; Liu, Y.; Meng, Y.; Zhang, X.; Wang, L.; Yang, Z. Biochar: An Option to Maintain Rice Yield and Mitigate Greenhouse Gas Emissions from Rice Fields in Northeast China. Agronomy 2024, 14, 3050. https://doi.org/10.3390/agronomy14123050
Dong W, Danso F, Tang A, Zhang J, Liu Y, Meng Y, Zhang X, Wang L, Yang Z. Biochar: An Option to Maintain Rice Yield and Mitigate Greenhouse Gas Emissions from Rice Fields in Northeast China. Agronomy. 2024; 14(12):3050. https://doi.org/10.3390/agronomy14123050
Chicago/Turabian StyleDong, Wenjun, Frederick Danso, Ao Tang, Jun Zhang, Youhong Liu, Ying Meng, Xijuan Zhang, Lizhi Wang, and Zhongliang Yang. 2024. "Biochar: An Option to Maintain Rice Yield and Mitigate Greenhouse Gas Emissions from Rice Fields in Northeast China" Agronomy 14, no. 12: 3050. https://doi.org/10.3390/agronomy14123050
APA StyleDong, W., Danso, F., Tang, A., Zhang, J., Liu, Y., Meng, Y., Zhang, X., Wang, L., & Yang, Z. (2024). Biochar: An Option to Maintain Rice Yield and Mitigate Greenhouse Gas Emissions from Rice Fields in Northeast China. Agronomy, 14(12), 3050. https://doi.org/10.3390/agronomy14123050