Article

Effect of Light Intensity and Two Different Nutrient Solutions on the Yield of Flowers and Cannabinoids in Cannabis sativa L. Grown in Controlled Environment

1
Faculty of Agriculture and Technology, University of South Bohemia in České Budějovice, Branišovská 1645/31a, 370 05 České Budějovice, Czech Republic
2
Cannabis Facility, International Clinical Research Centre, St. Anne’s University Hospital, 602 00 Brno, Czech Republic
3
Department of Natural Drugs, Faculty of Pharmacy, Masaryk University, Palackého 1946/1, 612 00 Brno, Czech Republic
4
Forensic Laboratory of Biologically Active Substances, Department of Natural Compounds, University of Chemistry and Technology, 166 28 Prague, Czech Republic
5
Department of Environmentalistics and Natural Resources, Faculty of Regional Development and International Studies, Mendel University in Brno, Zemědělská 1, 613 00 Brno, Czech Republic
6
Institute of Agronomic Sciences, Faculty of Agrobiology and Food Resources, Slovak University of Agriculture in Nitra, Tr. A. Hlinku 2, 94976 Nitra, Slovakia
*
Author to whom correspondence should be addressed.
Agronomy 2024, 14(12), 2960; https://doi.org/10.3390/agronomy14122960 (registering DOI)
Submission received: 2 November 2024 / Revised: 25 November 2024 / Accepted: 10 December 2024 / Published: 12 December 2024
(This article belongs to the Section Plant-Crop Biology and Biochemistry)

Abstract

:
Due to the typical production of Cannabis sativa L. for medical use in an artificial environment, it is crucial to optimize environmental and nutritional factors to enhance cannabinoid yield and quality. While the effects of light intensity and nutrient composition on plant growth are well-documented for various crops, there is a relative lack of research specific to Cannabis sativa L., especially in controlled indoor environments where both light and nutrient inputs can be precisely manipulated. This research analyzes the effect of different light intensities and nutrient solutions on growth, flower yield, and cannabinoid concentrations in seeded chemotype III cannabis (high CBD, low THC) in a controlled environment. The experiment was performed in a licensed production facility in the Czech Republic. The plants were exposed to different light regimes during vegetative phase and flowering phase (light 1 (S1), photosynthetic photon flux density (PPFD) 300 µmol/m2/s during vegetative phase, 900 µmol/m2/s in flowering phase and light 2 (S2) PPFD 500 µmol/m2/s during vegetative phase, 1300 µmol/m2/s during flowering phase) and different nutrition regimes R1 (fertilizer 1) and R2 (fertilizer 2). Solution R1 (N-NO3 131.25 mg/L; N-NH4+ 6.23 mg/L; P2O5 30.87 mg/L; K2O 4112.04 mg/L; CaO 147.99 mg/L; MgO 45.68 mg/L; SO42− 45.08 mg/L) was used for the whole cultivation cycle (vegetation and flowering). Solution R2 was divided for vegetation phase (N-NO3 171.26 mg/L; N-NH4+ 5.26 mg/L; P2O5 65.91 mg/L; K2O 222.79 mg/L; CaO 125.70 mg/L; MgO 78.88 mf/L; SO42− 66.94 mg/L) and for flowering phase (N-NO3 97.96 mg/L; N-NH4+ 5.82 mg/L; P2O5 262.66 mg/L; K2O 244.07 mg/L; CaO 138.26 mg/L; MgO 85.21 mg/L; SO42− 281.54 mg/L). The aim of this study was to prove a hypothesis that light will have a significant impact on the yield of flowers and cannabinoids, whereas fertilizers would have no significant effect. The experiment involved a four-week vegetative phase followed by an eight-week flowering phase. During the vegetative and flowering phases, no nutrient deficiencies were observed in plants treated with either nutrient solution R1 (fertilizer 1) or R2 (fertilizer 2). The ANOVA analysis showed that fertilizers had no significant effect on the yield of flowers nor cannabinoids. Also, light intensity differences between groups S1 (light 1) and S2 (light 2) did not result in visible differences in plant growth during the vegetative stage. However, by the fifth week of the flowering phase, plants under higher light intensities (S2—PPFD 1300 µmol/m2/s) developed noticeably larger and denser flowers than plants in the lower light intensity group (S1). The ANOVA analysis also confirmed that the higher light intensities positively influenced cannabidiol (CBD), tetrahydrocannabinol (THC), cannabigerol (CBG), and cannabichromene (CBC) when the increase in the concentration of individual cannabinoids in the harvested product was 17–43%. Nonetheless, the study did not find significant differences during the vegetative stage, highlighting that the impact of light intensities is phase-specific. These results are limited to controlled indoor conditions, and further research is needed to explore their applicability to other environments and genotypes.

1. Introduction

The first written records of cannabis date back as far as 5000 years and are documented in the first pharmacopoeia written by Chinese Emperor Chen Nung [1,2,3,4,5]. Cannabis is an annual, dioecious plant of the family Cannabaceae with a historically ambiguous and still debated taxonomy. Today’s most widely accepted taxonomy classifies cannabis as a single species, Cannabis sativa L., which is further divided into subspecies sativa, indica, and ruderalis, distinguished by phenotypic characteristics and chemical profiles [6,7,8,9,10,11,12].
Due to the global wave of cannabis legalization, this plant has recently been cultivated increasingly for its pharmacological properties. In Europe, cannabis for medical use can only be grown under GACP (Good Agricultural and Collection Practice) standards, and manufactured (dry flower) under GMP (Good Manufacturing Practice) standards [13]. These standards place a strong emphasis on homogeneity which makes cultivation challenging due to the numerous factors (for example light, temperature, humidity, CO2, fertilizers, genetics) that impact cannabis quality (cannabinoid content) and yield [14,15,16,17,18,19,20].
The pharmacological effects of cannabis are primarily attributed to terpene-phenolic compounds and cannabinoids [21], which can be divided into ten primary groups as shown in Figure 1, some of which are the focus of this study [22,23,24]. These include Cannabigerol (CBG) and Cannabichromene (CBC) [25]; Cannabidiol (CBD) [22]; and Tetrahydrocannabinol (D9-THC) [26].
The growth and development of cannabis plants are highly dependent on cultivation conditions. Given that medicinal cannabis is grown under controlled conditions (temperature, humidity, CO2, irrigation, fertilization, light, photoperiod), there is an increasing need to spread the information from research among commercial growers and to unify the procedures, for example regarding nutrients and light, so it can be ensured that maximum yield of inflorescences and active compounds will be achieved.
For example, Bernstein et al. [26] discovered through their research that mineral nutrition increased the accumulation of several nutrients in different organs, which might stimulate cannabinoid synthesis, but it is still speculated that this effect might be species- and compound-dependent. Additionally, Saloner et al. [27], through their research, discovered that K concentration requirements were different across tested cultivars. Also, Saloner & Bernstein [28] reported that NUE (nitrogen use efficiency) defined as biomass produced per unit of nitrogen supplied decreased with increasing nitrogen concentration.
Regarding light, Eaves et al. [29] reported a linear relationship between yield and light intensity up to, at least, 1498 µmol/m2/s.
The authors aimed to design this study in a way that will provide to commercial growers clear and practical information that can be directly applied in their cultivation practices.
In this study, PAR (photosynthetically active radiation) refers to the wavelength range of 400–700 nm, and PPFD (photosynthetic photon flux density) indicates light intensity in µmol/m2/s.
Light intensity during growth can influence plant height, branching, and leaf size [30,31]. Light provides the energy essential for photosynthesis, a process critical to the growth of all plants [32]. Light quality (i.e., color and wavelength), quantity (intensity), and photoperiod are factors that directly influence photomorphogenesis, such as flowering induction and senescence [33,34,35]. On Earth, visible light has wavelengths between 400–700 nm, including violet (400–500 nm), blue (450–520 nm), green (520–560 nm), yellow (560–600 nm), orange (600–625 nm), red (625–700 nm), and far-red (700–750 nm). The most critical component for plants is PAR, although the so-called extended PAR (ePAR), which includes wavelengths beyond 700 nm, is also recognized [36,37,38,39,40,41,42].
Among growers, a commonly debated question is whether light spectrum (specific wavelengths and their ratios, such as red to blue) or high light intensity (PPFD within the PAR range) is more crucial for achieving maximum inflorescence yield. Some authors argue that cannabis yield is directly proportional to light intensity (LI) [28,43], or that a 1% increase in PPFD results in a 1% increase in yield [44]. Other researchers argue that light quality (spectrum) is more critical than intensity, as specific wavelengths (600–700 nm for red and 420–450 nm for blue) are most efficiently absorbed by chlorophyll a and chlorophyll b [45].
Additionally, some authors report a reduction in leafy vegetable yield with increased blue light spectrum [46,47]. Nevertheless, studies by Vanhove et al. [48], Potter and Duncombe [49], and Eaves et al. [29] have documented a linear increase in cannabis yield (both inflorescences and cannabinoids) with increased light intensity.
Another critical aspect of cannabis cultivation under controlled conditions is fertilization. In these systems, plants are typically grown in containers that restrict root systems, making them entirely dependent on the water and nutrients the grower provides. In such systems, liquid fertilizers are predominantly used, based on the formula developed by Hoagland and Snyder in 1933 [50], 1935 [51] and revised by Arnon in 1950 [52].
Today, numerous manufacturers provide liquid fertilizers for hydroponic systems (e.g., Advanced Hydroponics, Metrop, Athena, Atami, Hosi, BioBizz, and many others), and as diverse as the fertilizer options are, so too are the opinions of growers. Many non-scientific sources regarding fertilizers, nutrient uptake, and more are available online, which can often lead to issues in cultivation. This is mainly because the scientific literature on cannabis nutrition and fertilization in controlled environments is still limited due to past restrictions on cultivating these plants. Growers often face uncertainty regarding the optimal pH level, nutrient concentration, and watering frequency. Bugbee [53], for instance, states that an optimal pH range is 5.5 to 6.5, which is a range that minimally affects the root system. Bugbee [53] grew plants at various pH levels (4 to 7) and observed no impact on the root system. However, it is known that higher pH values inhibit the uptake of Fe, Mn, Zn, Cu, and P. In comparison, lower pH values inhibit the uptake of P, K, Ca, Mg, and S. Low pH can also reduce the solubility of some metals, especially Fe, but this issue can be mitigated by using chelated forms of metals, such as EDDHA (ethylenediamine-N,N′-bis(2-hydroxyphenylacetic acid) [53] or EDTA (ethylenediamintetraacetic acid).
Growers frequently judge the “strength” of fertilizer based on its electrical conductivity (EC), with measurements in units of mS/cm (millisiemens/cm), µS/cm (microsiemens/cm), or dS/m (decisiemens/cm). However, this method is misleading, as it only measures NH4+, K+, Ca2+, and Mg2+ ions in solution [54]. If EC reflects the number of cations, then two fertilizers with different NO3 and P contents but identical NH4+, K+, Ca2+, and Mg2+ concentrations will have the same or similar EC, even though these fertilizers are fundamentally different. Thus, EC is a somewhat imprecise concept, and growers should consider the specific nutrient content of a fertilizer in milligrams per milliliter of the concentrated solution when using various fertilizers. Many growers use EC in the substrate as an indicator when deciding whether to increase fertilizer concentration (low EC = increase concentration, high EC = maintain or reduce concentration). This is typically done by watering a sample of plants with a large amount of pure water, causing water to drain from the substrate, which is then measured, and based on the EC result, a decision is made on adjusting fertilizer concentration. This method, however, is not ideal, as it mainly measures Ca2+ and Mg2+ levels, which are passively absorbed, while K+ in the substrate, which is actively absorbed, will not be reflected [54]. Additionally, EC does not provide information on the exact amount of specific cations (Ca2+ and Mg2+). Excessive salt concentration in the substrate can lead to osmotic water stress. Langenfeld et al. [54] cites a typical osmotic potential of −0.04 MPa (WUE—water use efficiency) for fertilizer at 3 g.L−1 and −0.08 MPa at 6 g.L−1. Since calculating the osmotic potential of fertilizer can be complex, it can be estimated from the EC of the solution using the formula Ψs = EC × −0.036 [54].
The above elements and other essential nutrients can be categorized into groups based on the plant’s absorption rate (Table 1). The roots absorb elements in Group 1 and these can be taken up within hours. Elements in Group 2 are absorbed more slowly than those in Group 1 and are generally taken up faster than the plant absorbs water. Group 3 elements are passively absorbed and often accumulate [53].
Plant cultivation, including cannabis, allows growers to utilize resources efficiently, reducing the environmental burden that agriculture can impose. Unfortunately, excessive fertilizer use is expected daily in commercial growing, especially with phosphorus, particularly in cannabis cultivation. Applying P doses exceeding 100 mg per liter of irrigation is not unusual. However, no positive effects of such high P concentrations have been demonstrated, especially in the flowering phase [55]. Additionally, authors such as Bernstein et al. [26], Cockson et al. [55], Veazie et al. [56], and Caplan et al. [19] observed no positive effects on flower or cannabinoid yield with P doses above 60 mg per liter.
Our study aims to investigate how varying light intensities and distinct nutrient solutions impact the growth performance, flower yield and cannabinoid profile of chemotype III Cannabis sativa L. (high CBD, low THC). Since the most-discussed parameters when cultivating in controlled environments are fertilizers (pH and EC) and light (light spectrum vs. light intensity), two hypotheses were made: a. different fertilizer solutions will not have an impact on the yield and cannabinoid profile; b. higher light intensity with PAR from 400 to 700 nm will provide higher yield than lower light intensity with the same PAR.
Information on the mechanisms—for example, how nutrients affect the synthesis of cannabinoids—is limited. Bernstein et al. [26] proposed that nitrogen levels in the fertilizers have only minor effects on the accumulation of secondary compounds, like cannabinoids.
Regarding light regime, it is more plausible to suggest that there is an interplay between genetics and light quality; this is in fact also mentioned by Danziger & Bernstein [45].
This study aims to prove that low-concentration fertilizer which was specifically designed for cultivated chemotype III Cannabis sativa L. will provide the same result as a generic fertilizer, with a higher amount of macronutrients, mainly phosphorus, under high light intensity of light with PAR between 400–700 nm. This might be a proposal for the commercial growers to not to use fertilizers in such high concentrations, since higher concentrations (mainly high EC) might harm the plants.

2. Materials and Methods

The experiment was conducted in South Bohemia, Czech Republic in a closed production system. The company that provided the facility holds a license for cultivating cannabis for medical use. The entire experiment was replicated twice. The plants used were of chemotype III (high CBD content, low THC content) and were sourced from the company’s stable mother plants. During the experiment, temperature, humidity, light intensity, concentration of fertilizer solution, CO2 concentration and the amount of irrigation were monitored. Average temperatures and humidity during the day and night are shown in Table 2.

2.1. Plant Cultivation Methods

The plants were obtained as cuttings from the mother plant, which was grown in a grow tent, with cuttings taken from the upper part of the plant. The cuttings were dipped in Clonex (Growth Technology Ltd., Great Western Way, Tanton, UK) and transferred to Grodan mineral wool (40 × 40 × 40 mm) (Rockwool B.V., Roermond, The Netherlands), which had been soaked for 24 h in water with adjusted pH 5.7 prior to use. The cuttings were grown in greenhouses measuring 540 × 279 × 250 mm (GrowCity, Prague, Czech Republic). During the rooting process, the average temperature inside the greenhouses was 23.7 °C, and the humidity was 81%. After 14 days, 70% of the prepared cuttings had rooted sufficiently for the experiment. The rooted cuttings were transferred into 11 L plastic pots filled to the top with a mix of coconut substrate and perlite in a ratio of 60:40 (Gramoflor GmbH & Co. KG, Vechta, Germany). The day of transplanting was considered the first day of the experiment.
PPFD was selected primarily based on prior experience from commercial cultivation, where practical constraints played a significant role, specifically low ceilings (2.5 m). Given the fact that commercially cultivated plants (at the company) are cultivated in raised beds (50 cm above the ground) and are growing up to 1.5 m in height, which makes maximum distance from the fixture above the plant canopy 50 cm, under these conditions, PPFD over 1300 µmol/m2/s can lead to heat stress in the plants.
For the experiment, 32 rooted plant cuttings were used, which were placed in 11 L pots under two LED lights, Sundocan 900 W (GrowCity, Prague, Czech Republic), with a plant density of 16 plants per m2. The plants were labeled S1 and S2 (Light 1 and Light 2, with each light having a different PPFD light intensity). Furthermore, the plants under lights S1 (light 1) and S2 (light 2) were divided into groups labelled R1 and R2 (R1 and R2 representing different nutrient solutions). The plants were grown in the vegetative phase for four weeks (28 days), during which all plants were topped to preserve the first six terminals. The photoperiod was set to 18 h of light and 6 h of darkness throughout the 28 days. The flowering phase began on day 29 with a change in the photoperiod to 12 h of light and 12 h of darkness, lasting eight weeks. Between the second and third week of the flowering phase, the plants were pruned to 1/3 of their height, removing weak branches that would likely not produce high-quality flowers.
The value of pH was set for the whole of experiments 1 and 2 at 6.1 ± 0.1. For pH correction, a 30% concentrated solution of KOH was used if pH needed to be increased and 35% of HNO3 when it was necessary to lower the pH.

2.2. Fertilization Strategy

2.2.1. Type of Fertilizers

Mineral fertilizers were used in the experiment.
(1)
During the vegetative phase, the plants were watered manually, with the volume of water and nutrients increased each week.
(2)
In the flowering phase, the AutoPot system (AutoPot (Global) Ltd., Hampshire, UK) was used for watering. Water consumption per plant was calculated based on the frequency of replenishment of nutrient solution.

2.2.2. Fertilizers Preparation

The fertilizer solutions were created using HydroBuddy v1.100. Solution R1 (fertilizer 1) was prepared based on the analysis of leaves that were collected from plants prior to this experiment, since the cultivar that was used for this experiment was cultivated several times commercially using solution R2 (fertilizer 2). Fertilizer formula was than calculated based on the principal of mass balance and water use efficiency.
Solution R2 (fertilizer 2) was calculated and created mainly based on the requirements of high concentration of phosphorus and ratio of potassium to calcium to magnesium of 1:2:4 (2× more potassium than calcium and 4× more potassium than magnesium).
For solution R2 (fertilizer 2), two versions were created: (a) for the plant vegetative phase and (b) for the plant flowering phase. More details about the composition of individual fertilizers is given in Table 3.

2.2.3. Fertilizers Composition and Concentration

The fertilizers/solutions were prepared as parts A and B, with both solutions applied in a 1:1 ratio. The concentration of all fertilizers used from the start of cultivation (from transplanting rooted cuttings into 11 L pots until harvest) was 2 mL/L for both solution A and solution B.
The table compares nutrient concentrations in fertilizers (R1 and R2) during two growth phases of plants: Vegetation phase (V) and Flowering phase (F). It shows the measured concentrations of nutrients in milligrams per liter (mg/L) and highlights the relative differences between fertilizers.

2.2.4. Fertilization Intervals

The irrigation of plants was divided into four weeks for the vegetative phase:
  • Week 1: daily 50 mL of nutrient solution per plant
  • Week 2: daily 100 mL of nutrient solution per plant
  • Week 3: 4 times a week, 200 mL of nutrient solution per plant
  • Week 4: 3 times a week, 300 mL of nutrient solution per plant
The irrigation in the flowering phase was divided into eight weeks:
  • Weeks 1–3: daily 500 mL of nutrient solution per plant
  • Weeks 4 to 5: daily 700 mL of nutrient solution per plant
  • Weeks 6 to 8: daily 900 mL of nutrient solution per plant

2.3. Lighting Strategy

For lighting, two authentic LED fixtures were used. Parameters of the fixtures employed are given in Figure 2.

Light Intensity

The lights were divided by intensity into two groups, namely light S1 and light S2 (Table 4).
In the first experiment, the S2 fixture was set to 540 W during the vegetative phase with a PPFD of 500 µmol/m2/s. In the flowering phase, the PPFD was set to 1300 µmol/m2/s at a power of 900 W. In the second experiment, the S2 light fixture was set to a PPFD of 500 µmol/m2/s at 540 W for the vegetative phase and to a PPFD of 1300 µmol/m2/s at 900 W for the flowering phase.
During the first experiment, the S1 fixture was set to a PPFD of 300 µmol/m2/s at 360 W in the vegetative phase and to a PPFD of 900 µmol/m2/s at 540 W in the flowering phase. In the second experiment, the S2 fixture was set to 300 µmol/m2/s at 360 W in the vegetative phase and to a PPFD of 900 µmol/m2/s at 540 W in the flowering phase. The schematic representation of plant groups R1.S1, R2.S1, R1.S2, and R2.S2 is shown in Table 5.
This table presents the PPFD values for two light sources (S1 and S2) combined with fertilizers (R1 and R2) during two experiments, each evaluated in vegetative phase and flowering phase. Average PPFD was calculated as the average of 5 measurements (bottom left and right corner, upper left and right corner, and the middle of each light). Rounded PPFD was rounded to the nearest hundred (e.g., 334.6 µmol/m2/s to 300 µmol/m2/s).
Sixteen plants were cultivated under each fixture, with eight plants subjected to different nutrient solutions. Due to the fact that the measurement of PPFD depends mainly on the uniformity of the plant canopy, Figure 3 represents real measured values of the fixture. Measurements of each light were made with an Apogee MQ610 (Apogee Instruments Inc., Logan, UT, USA) in the bottom left and right corner, upper left and right corner, and in the middle. During the measurements, the height of the fixtures was adjusted to the measured light intensity 1300.

2.4. Sample Collection

At harvest, the plants were divided according to treatment into four groups (fertilizer 1, light 1; fertilizer 1, light 2; fertilizer 2, light 1; and fertilizer 2, light 2). Each group contained eight plants, and the top of the flowers were collected from four plants within each group. These were dried for ten days at a constant temperature of 20 °C and relative humidity of 50%. After ten days, the flowers were weighed, sampled, and sent for analysis according to their group.

2.5. Laboratory Analysis

The flower samples were sent to the commercial laboratory, Institut für Hanfanalytik, Vienna, Austria. The method used for determining cannabinoid content was HPLC-DAD (High-Performance Liquid Chromatography—Diode Array Detector) according to Ph. Eur. 2.2.29 (Liquid Chromatography) of the European Pharmacopoeia.

Statistical Analysis

Statistical analysis was performed to determine the effect of light and nutrition on cannabis yield and cannabinols. All statistical analyses were performed in JMP v. 14 (SAS, Cary, NC, USA) software. Tukey’s HSD test was performed with the significance level at p < 0.05. The replicates and repetitions are described in detail in the method section. Briefly, the experiment was repeated twice, and each plant served as a replicate within the experiment.

3. Results

The results are divided into two parts—assessing the effect of light regimes S1 and S2, and nutrition R1 and R2 on plant morphology. The effects of the above experimental factors on plant yield and cannabinoid content are also presented.

3.1. Plant Morphology and Visual Appearance—Influence of Light and Nutrition

The different light intensities between groups S1 and S2 (PPFD 300 µmol/m2/s vs. PPFD 500 µmol/m2/s) in experiments 1 and 2 did not visually show differences in plant growth (height, branching, and structure) during vegetation. However, noticeable differences were evident in both experiments during the flowering phase, where group S1 showed a more pronounced elongation. From the fifth week onwards, plants from group S2 (PPFD 1300 µmol/m2/s) had significantly larger flower inflorescence than group S1 (PPFD 900 µmol/m2/s). This difference was particularly pronounced in experiment 2, where group S2 showed significantly larger flower inflorescence than group S1.
The nutrient regimes used did not result in significant differences in plant growth (height, branching and structure) during the vegetative or flowering phases (Table 6). Nor were signs of nutrient deficiency observed at any vegetative phase, indicating that both fertilizers were sufficient for the plants. During the flowering phase, it was impossible to distinguish which group was fertilized with solution R1 and which with solution R2, indicating that both solutions were equally effective.
Result summarization of the analysis of variance (ANOVA) for the effect of nutrition and light treatments on yield (dry mass) and cannabinoid content showed the nutrition (fertilizer R1 = less concentrated, fertilizer R2 = more concentrated) had no significant effects (ns) for any parameter (yield or cannabinoids). Light S2 (PPFD 1300 µmol/m2/s) showed a significant difference in yield and cannabinoid content 74.90 g vs. Light S1 (PPFD 900 µmol/m2/s) 44.30 g and higher concentrations of CBD (10.59% vs. 9.04%) and THC (0.474% vs. 0.400%).

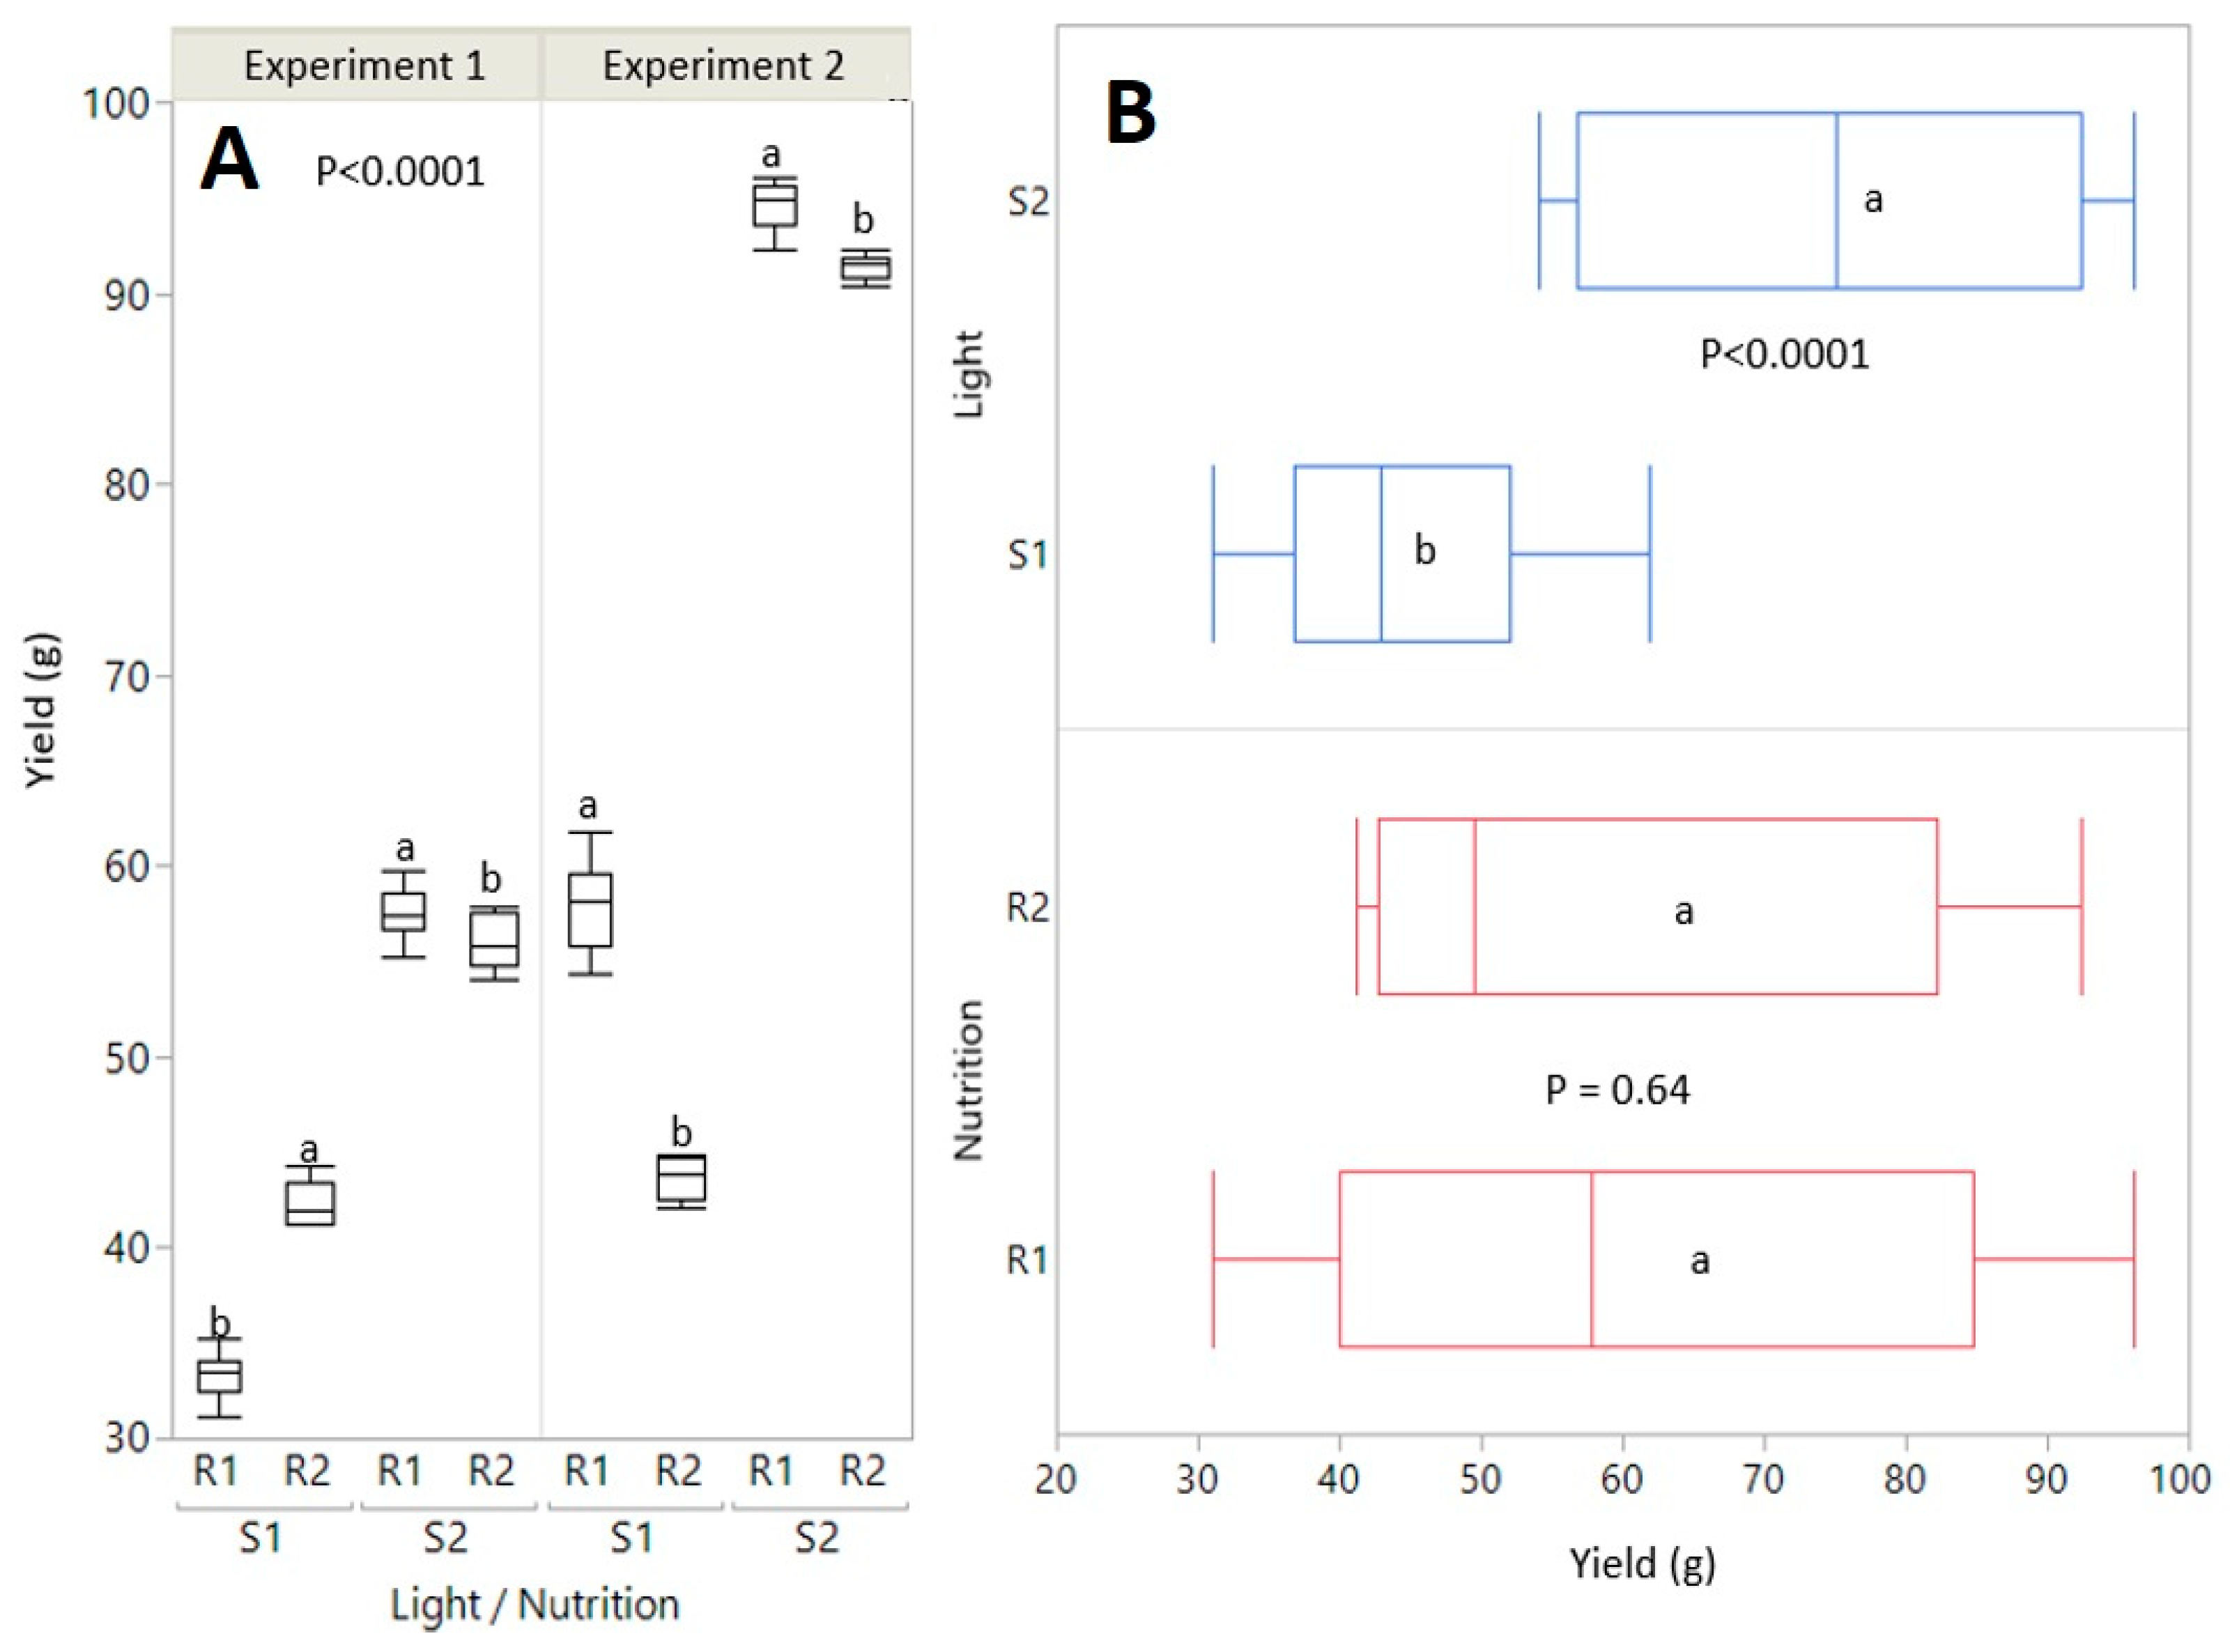
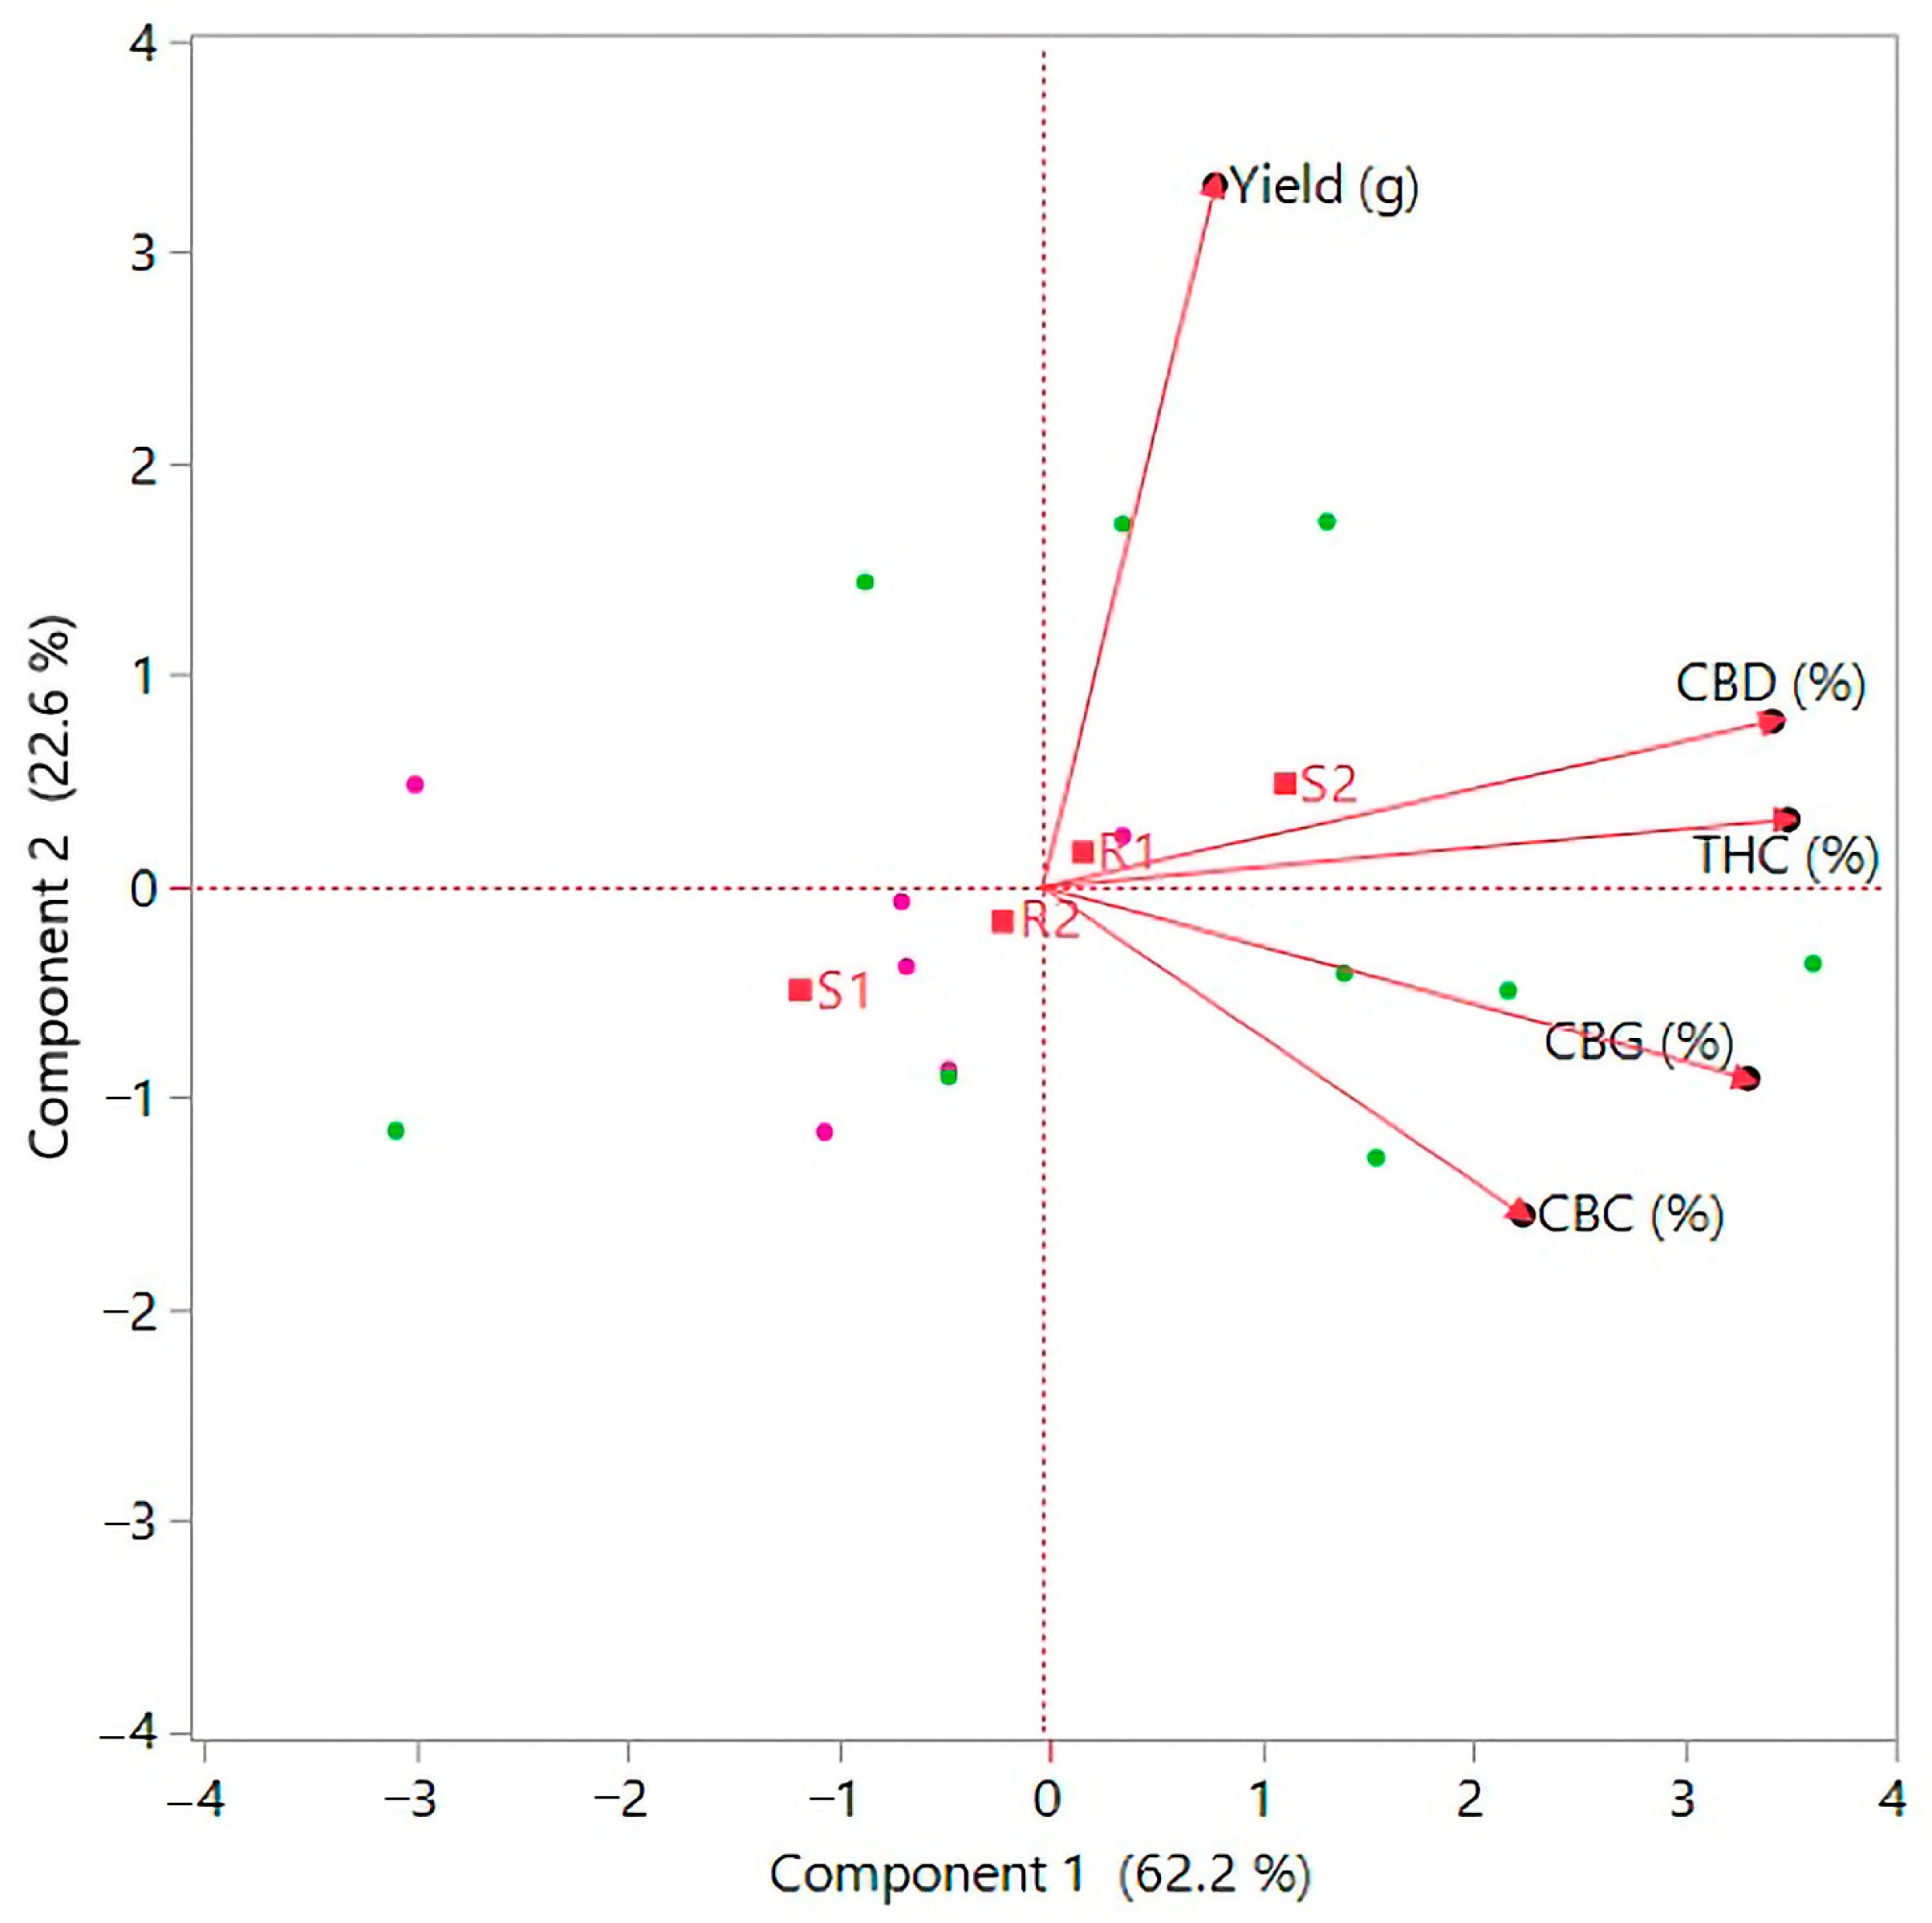
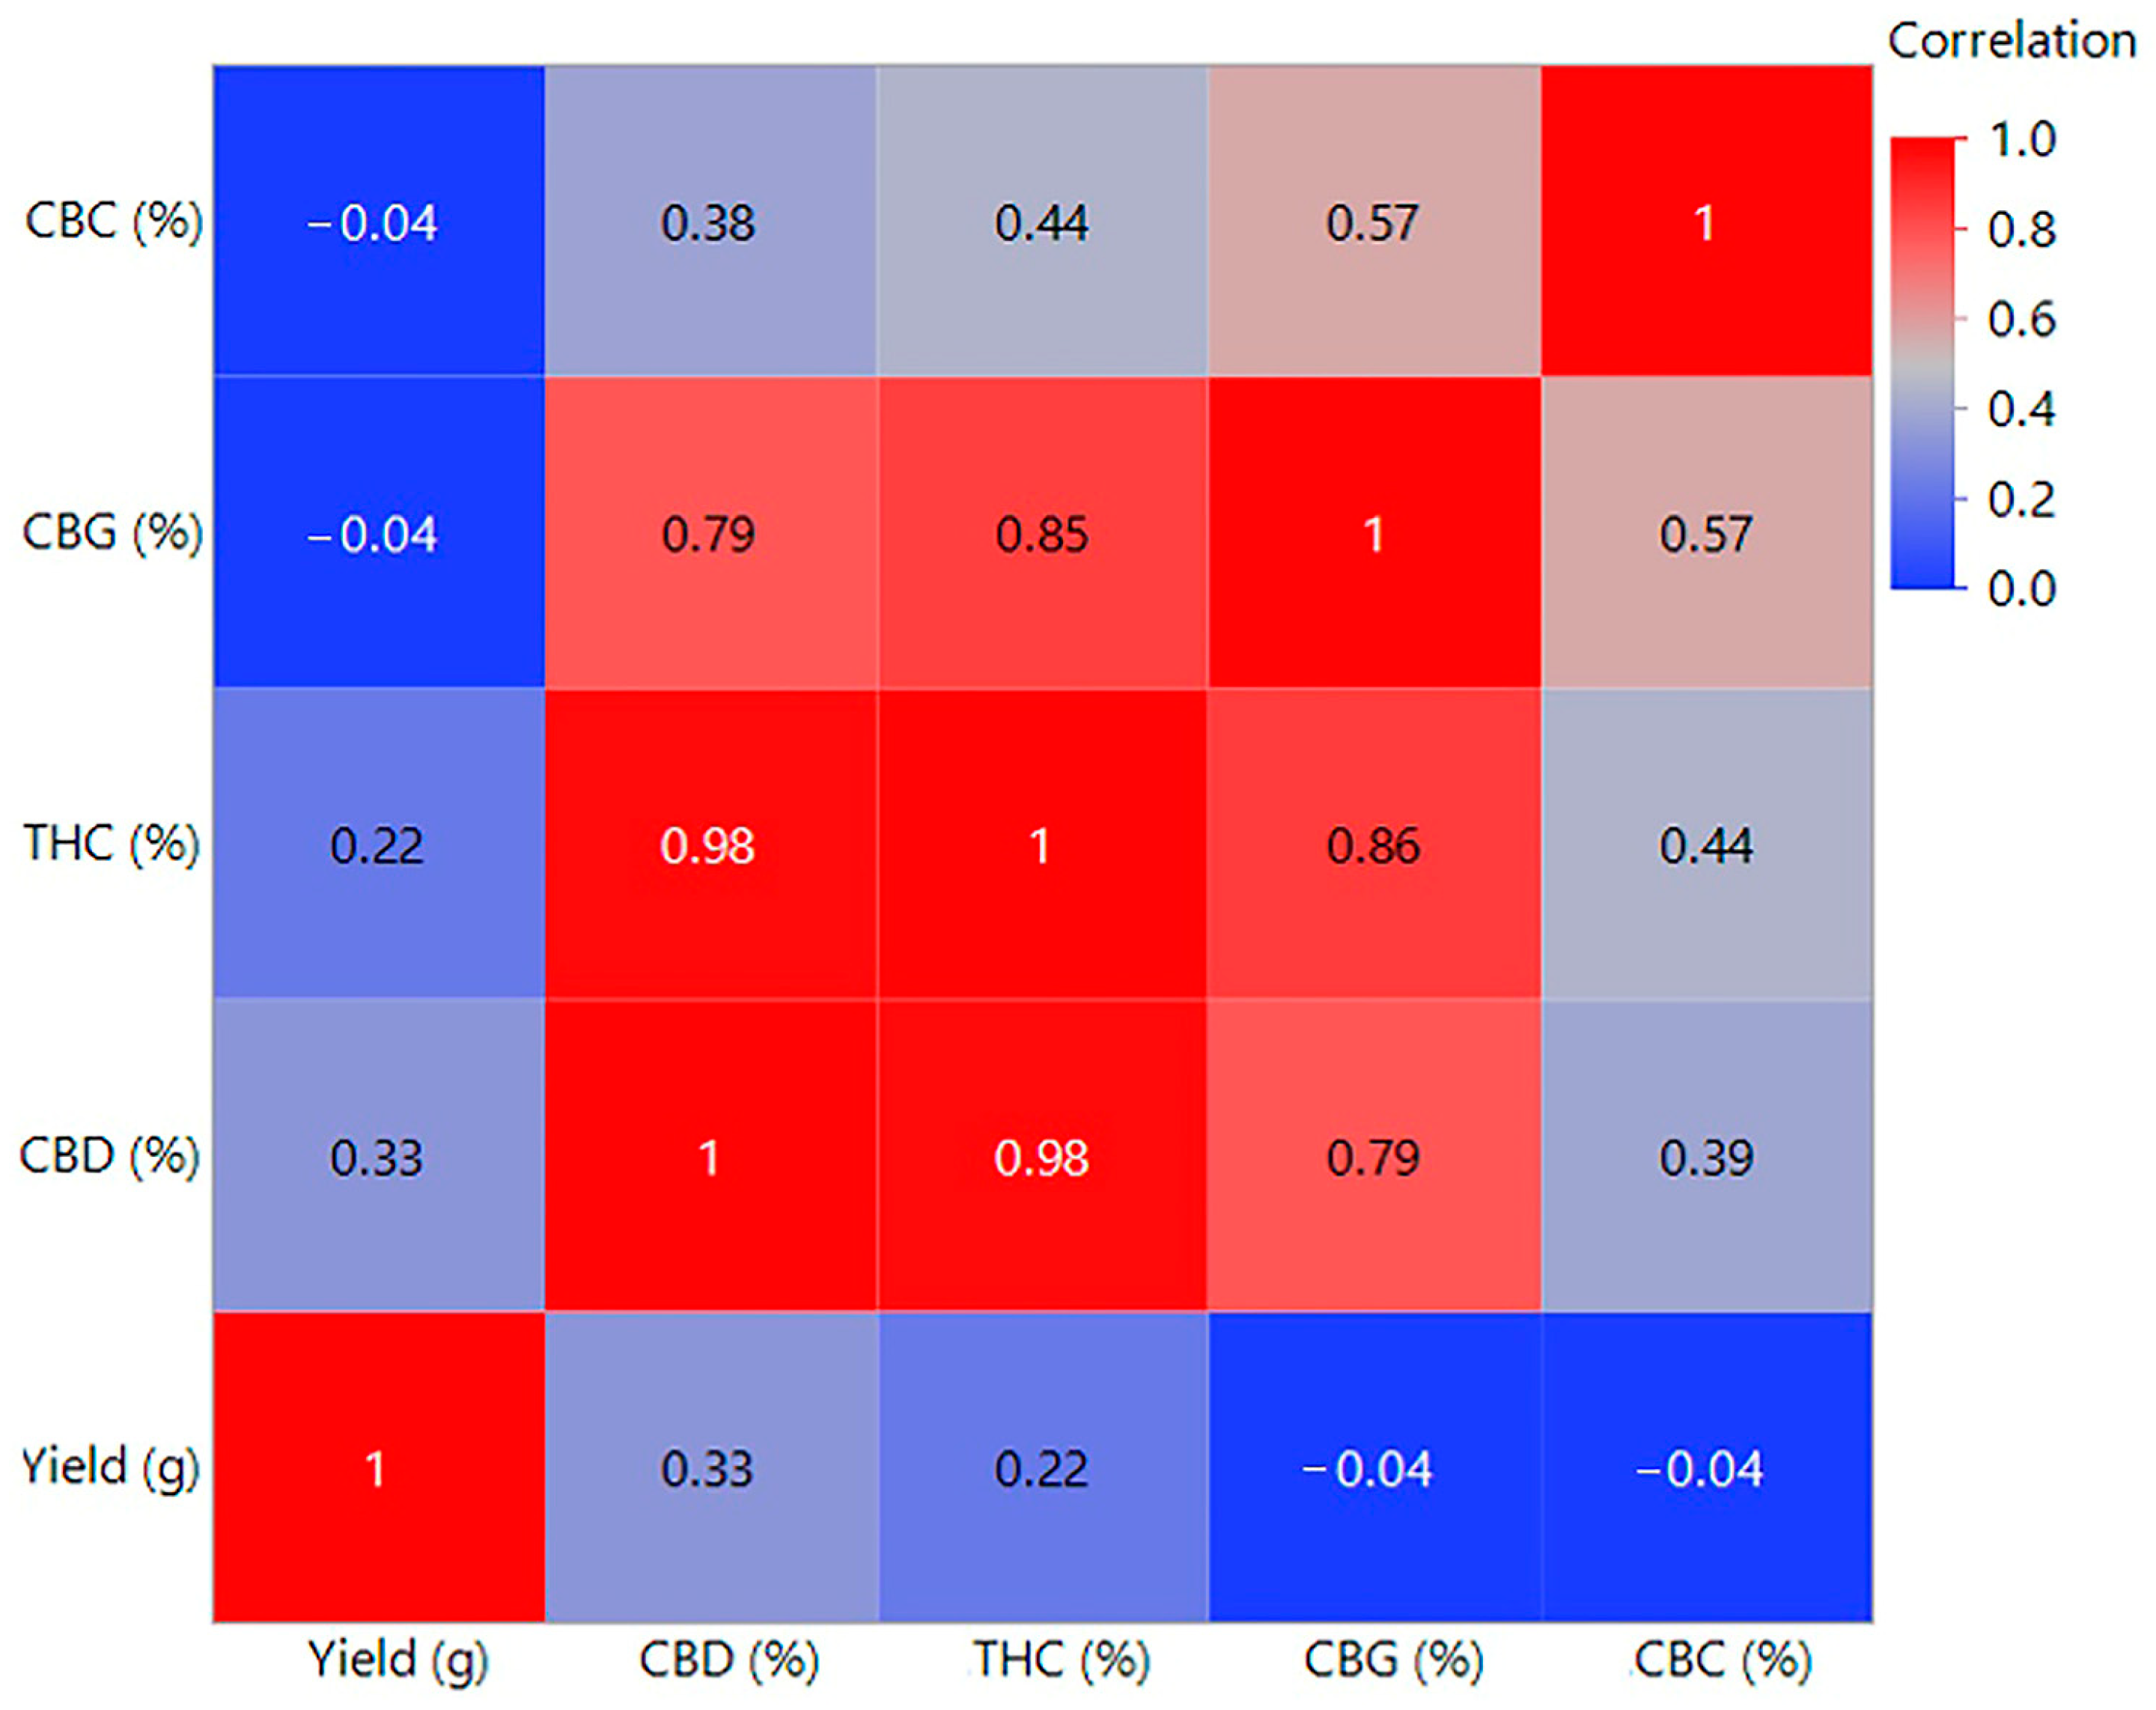
3.2. Yield and Cannabinoid Content—Influence of Light and Nutrition

The experiment results confirm that light significantly affected the yield of cannabis plants, as can be seen from the analysis shown in the figures and tables. Yields conditioned by light showed significant statistical significance (p ≤ 0.0001), while fertilizers did not have a statistically significant effect on yield (p = 0.64) (Figure 3). Our results suggest that light is a critical factor affecting cannabis yield, which is consistent with previous studies that we used to design the experiment, confirming the importance of lighting in optimizing cannabis production. Statistical analyses also showed that light significantly affected cannabinoid content, including CBD (p ≤ 0.01), THC (p ≤ 0.05), and CBG and CBC (p ≤ 0.1). These results suggest that light intensity is a critical factor for yield and product quality, which is essential for the market value of cannabis crops. Table 4 summarizes the results of the ANOVA analysis for yield and cannabinoid content based on the effects of light and fertilization. A more detailed analysis of the content of cannabinoids, especially CBD and THC, showed that the highest concentrations of these substances were measured in the S2 light regime (1300 µmol/m2/s). The light intensity that was used is suitable for the production of cannabis for therapeutic purposes.
Conversely, the lower concentrations of CBG and CBC in this group indicate a possible negative correlation between yield and content of these cannabinoids, which could be a consequence of excessive lighting, which could affect the metabolic processes of the plant. The content of cannabinoids, specifically CBD, THC, CBG, and CBC, was affected by light conditions, while fertilizers did not significantly affect the content of these substances. Figure 4 further illustrates the average values and differences in the content of individual cannabinoids according to the treatments. The result suggests that a cultivation strategy focused on optimizing light conditions can contribute to higher yields and, above all, the quality of cannabinoids. The best results regarding flower yield and cannabinoid content were observed when using S2 light (1300 µmol/m2/s) in combination with R1 solution. This combination proved to be the most effective in the Principal Component Analysis (PCA), as shown in Figure 5, where the groups are distinguished by color, visually simplifying the interpretation of the results. The PCA further showed that plants grown under optimal light conditions achieved higher yields in terms of volume and quality, as measured by cannabinoid content. In addition, the correlation analysis shown in Figure 6 showed a positive correlation between yield and CBD and THC content, but a negative correlation between yield and CBG and CBC content. The results of the study can be used to optimize indoor cannabis cultivation, as it shows that some cannabinoids can have synergistic effects on yield, while others can have opposite effects.

4. Discussion

Our study was conducted to evaluate the effect of light intensity and fertilizer on the yield of cannabis plants for medicinal use, both the effect on the yield of aboveground mass (inflorescence) and the content of cannabinoids (CBD, THC, CBG, and CBC) to better understand these two factors, since light is one of the most significant factors affecting plants. At the same time, it is one of the most expensive factors regarding operating costs, and fertilizers are necessary for the plant’s life. However, the fundamental effect of fertilizer on the yield of inflorescences and cannabinoid content has not been confirmed.

4.1. Effect of Light on Yield

The results confirmed the hypothesis that light has a significant effect on the yield of cannabis for medicinal use and the content of cannabinoids.
In the vegetative phase, no visual difference was observed between PPFD of 300 µmol/m2/s, which corresponds to daily light integral (DLI) of 19.4 mol⋅m−2⋅d−1 and 500 µmol/m2/s, which corresponds to daily light integral (DLI) of 32.4 mol⋅m−2⋅d−1, which does not correspond with Rodriguez-Morrison et al. [57], where the authors state that the aboveground biomass increases linearly with increasing light intensity. However, the authors Llewellyn et al. [43] and Moher et al. [58] state that the most significant increase in aboveground biomass in the vegetative phase was observed at PPFD 900 µmol/m2/s (DLI 38.87 mol⋅m−2⋅d−1).
The increased yield, especially under the S2 light, corresponds to [15,28,43,48,49,57] by finding that higher intensity = higher yield. This finding, or confirmation of what has already been found, only adds more information to the lighting issue since, with the right light intensity, growers or producers of this plant can increase their profits.
The most important finding of this study is that light is a critical factor in yield since the yield of inflorescences and cannabinoids was greatest under a light intensity of 1300 µmol/m2/s (DLI 56.16 mol⋅m−2⋅d−1) compared to 900 µmol/m2/s (DLI) of 38.87 mol⋅m−2⋅d−1. The results of this study correspond to the findings of Moher et al. [58] and Kim et al. [59], where plants exposed to higher intensity were smaller since there was not as much elongation in the first 2–3 weeks after changing the photoperiod to 12 h.
The positive effect of light on cannabinoid content in this study contradicts the findings of other authors [48,49,57]. Studies done by Vanhove et al. [48] and Potter and Duncombe [49] did not take into consideration CO2 levels, which in this study were ambient (see Table 2); however, Rodriguez-Morrison et al. [57] performed their study under ambient CO2 levels. As in this study, none of the cited studies took nutrient availability into consideration. Additionally, these studies were not able to prove that higher light intensity impacts the composition of cannabinoids, e.g., their ratios, however, they proved that the higher light intensity influenced the amount of cannabinoids in dried flowers mainly because of the fact that higher light intensity increased flower production. However, the positive effect on CBD content (p ≤ 0.01) and THC (p ≤ 0.05) corresponds with Morello et al. [60], although in this study, the light spectrum was primarily examined, not its intensity. Marcelis et al. [44] described the “1% rule”, which expresses the increasing yield with increasing PAR (photosynthetically active radiation). Since PAR is defined in the range of 400–700 nm [36,37], when the used fixtures meet these parameters and when the S2 fixture had a 44.44% higher light intensity than the S1 fixture and the yield under the S2 fixture was 69.07% higher than under the S1 fixture, the results from this study not only confirm the “1% rule”, they exceed it, since in this case, the increase in yield is as follows:
Y i e l d   i n c r e a s e = 74.9 44.3 44.3 * 100 = 69.07 %
Increase of PPFD is
i n c r e a s e   o f   P P F D = 1300 900 900 * 100 = 44.44 %
Calculation of yield increase with PPFD increase is
P r o p o r t i o n   o f   y i e l d   i n c r e a s e = 69.07 % 44.44 % = 1.55 %

4.2. Effect of Fertilizers on Yield

The ANOVA analysis in this experiment did not confirm that fertilizers had an influence on yield or cannabinoid content; however, the use of high-intensity lighting and less concentrated fertilizer solution appears to be the best option.
Even though phosphorus concentration was relatively high in the R2 fertilizer that was used in the flowering phase (262.66 mg/L P2O5), no deficiency symptoms were observed, as excess phosphorus can limit the uptake of other elements [61]. Since no deficits were observed during the vegetative phase (solution R1 30.87 mg/L P2O5; solution R2 for vegetative phase 65.91 mg/L P2O5), nor were there any differences in plant growth or branching, this is in line with the findings of [62], the authors of which found that a phosphorus dose of 30 mg/L was necessary for maximum biomass yield in cannabis plants in the growth phase, which lasted 4 weeks, and with the findings of Cockson et al. [55], who did not observe an increase in biomass in plants in the vegetative phase for 8 weeks at a phosphorus dose of 11 mg/L.
Veazie et al. [56] also investigated the effect of phosphorus on the inflorescence of cannabis plants, using solutions with a phosphorus concentration of 15–180 mg/L, but no effect of this element on yield was observed.
In particular, overuse of phosphorus fertilizers is common practice in commercial grow rooms [63]. In practice, phosphorus doses of 100 mg/L or higher are regular, but such high phosphorus doses are not scientifically supported. The impression that high concentrations of fertilizers, especially phosphorus, are necessary during the flowering phase may be because many plant species accumulate phosphorus in large quantities in their inflorescences [64,65,66]. Although cannabis plants may be able to take up phosphorus in high concentrations, especially during the vegetative phase [26,62], this does not necessarily mean that the plants need high doses of phosphorus for growth. There is currently no information that high doses of phosphorus have a positive effect on cannabinoid synthesis.
If the concentration of nutrients in 1L solution were doubled, the solution would be more concentrated but the amount of water would remain the same. Therefore, no deficiencies and no retardation of growth in cultivated plants was visible, since the conductivity of solution R1 was 1.6 mS/cm ± 0.2 mS/cm through the cultivation cycle, the conductivity of solution R2 (for vegetative phase) was 1.7 mS/cm ± 0.2 mS/cm and the conductivity of solution R2 (for flowering phase) was 1.9 mS/cm ± 0.2 mS/cm.
It should be mentioned that since mineral nutrient uptake is derived from the plant size and biomass, e.g., bigger plants should have higher mineral accumulation, it is very hard to say if cultivated plants in this study reached their potential saturation point, since plants cultivated in controlled environments are typically much smaller than plants grown in the field. Also, the timing of dosing of the fertilizer cannot be evaluated in this study, since the AutoPot™ system was used, when the function of this system is to keep the water constantly flowing into the pot until a certain water level is reached. Additionally, the lack of significant nutrient effects observed in this study might suggest that nutrient levels were sufficient to meet the plant’s needs under the given conditions. However, further studies focusing on nutrient concentration thresholds or timing adjustments could provide more insight into their potential role in influencing cannabinoid biosynthesis.
As mentioned, the effect of fertilizers on inflorescence yield or cannabinoid content has not been proven, although the use of high-intensity lighting and less concentrated fertilizer appears to be the best option, which is in line with previous research [67,68], where, for example, a nitrogen dose higher than 160 mg/L harmed the cannabinoid content in the cannabis plant and high doses of phosphorus had the same effect on the cannabinoid content as nitrogen.
Unfortunately, this study did not specifically investigate the potential effects between high light intensity and nutrient uptake patterns. Additionally, no secondary data were collected that could provide insights into such interactions. While the dry inflorescence yield increases linearly with rising canopy-level PPFD up to 1800 µmol/m²/s, leaf-level photosynthesis saturates at significantly lower PPFD values [57]. This might suggest that while higher light intensities can drive yield increase at the canopy level, associated nutrient uptake dynamics might operate differently in the leaf area.
Furthermore, growers should use nitrogen mainly in the form of N (NO3). Since N (NH4+) is toxic to plants in high doses, it is therefore recommended to use doses of N (NH4+) from 0–30% of the N (NO3) content since cannabis, like many other plants [69], accepts N (NO3) better. Furthermore, a high potassium (K) content, above 170 mg/L, has the effect of reducing the cannabinoid content, mainly Cannabidiolic acid (CBDA), Tetrahydrocannabinolic acid (THCA), Cannabigerolic acid (CBGA) and Cannabichromenic acid (CBCA) [68], which still correlates with the fact that overuse of fertilizers is not always beneficial for the cannabis plant and growers thereby reduce the potential value and quality of the resulting product.
The results of our study, considering the lack of differences observed during the vegetative phase, corresponds with findings of Massuela et al. [70], who reported no significant variations in plant growth in similar conditions.
Regarding phosphorus, the effect of fertilizers in this study was not proven to have an impact on yield and cannabinoid concentration, particularly at higher phosphorus levels. This aligns with the findings of Westmoreland and Bugbee [63], Cockson et al. [55], and Shiponi and Bernstein [62], who demonstrated that phosphorus levels beyond a certain threshold are not relevant for harvest.
Further, the research of Saloner and Bernstein [28] showed that potassium levels were optimal in the range of 60–175 mg.L−1 and may be cultivar-dependent, since in their study concentration above 170 mg.L−1 of K had no significant impact on yield, a finding also observed in this study.
Additionally, Bernstein et al. [26] proposed that the relationship between nutritional supplementation and cannabinoid content is not straightforward and may involve several interacting parameter numbers including nutrient availability, plant biosynthetic conditions or other physiological or environmental signals.
While our study reinforces these findings, it does not fully explore the mechanisms underlying these interactions. Future research should aim to investigate these pathways in more detail to provide a clearer understanding of how nutrient levels and other factors influence cannabinoid synthesis.

5. Conclusions

Based on the study of how light intensity affects the yield of a cannabis plant for medicinal use, it can be said that with increasing light intensity, the yield increases, so the optimal PPFD value for individual growers becomes more of an economic question, where individual growers must calculate how much financial input they can put into operating costs, which are mostly electricity, in order to maximize profit. This study, along with others that have been conducted with a focus on light cannabis production for medicinal use, can help current or future growers determine optimal PPFD limits or at least use such limits as a point from which they can bounce back.
Given that cannabis was legalized relatively recently, there is not much research like this at the moment, and research must develop further in a direction that focuses on cultivation as such.
The effect of fertilizers on yield or cannabinoid content has not been proven, which only confirms the research of other scientists who have dealt with this issue.
This study’s results demonstrate that the less-concentrated R1 solution, formulated based on leaf analysis (containing 8.49 × less P2O5 and 8.45 × less S-SO42− compared to the R2 solution designed for the flowering phase), did not negatively impact the yield of dry flowers or the cannabinoid composition when compared to the more concentrated and ‘generic’ R2 solution. These findings suggest that using a less-concentrated solution could be more advantageous from both financial and environmental perspectives, considering the finite nature of fertilizer resources. Additionally, the results indicate that higher light intensity can increase the yield of dry flowers and cannabinoids. However, other factors, such as environmental conditions, also play a significant role and may greatly influence the overall yield, which makes it hard to state that the yield and cannabinoid concentration are only light-specific.

Author Contributions

Conceptualization, P.K. and J.N.; methodology, J.N., V.T., M.K. and T.L.; validation, T.N.H., J.B., V.T., M.K., L.V. and T.L.; writing—original draft preparation, P.K., J.N., T.N.H. and T.L.; writing—review and editing, J.B.; visualization, J.N. and T.N.H.; supervision, P.K.; project administration, P.K.; funding acquisition, P.K. and J.N. All authors have read and agreed to the published version of the manuscript.

Funding

The research was financially supported by the Grant Agency of the University of South Bohemia in České Budějovice, Czech Republic (No. GA JU 085/2022/Z).

Data Availability Statement

The data that support the findings of this study are available from the corresponding author, J.N., upon reasonable request.

Acknowledgments

We thank ECO GROW s.r.o. company (Vranín, Czech Republic) for cooperation and supply of plant material and also for providing premises for the cultivation, including equipment needed.

Conflicts of Interest

The authors declare no conflicts of interest.

References

  1. Abel, E.L. Marijuana: The First Twelve Thousand Years; Springer: New York, NY, USA, 1980. [Google Scholar] [CrossRef]
  2. Li, H.L. An archaeological and historical account of cannabis in China. Econ. Bot. 1973, 28, 437–448. [Google Scholar] [CrossRef]
  3. Mercuri, A.M.; Accorsi, C.A.; Bandini Mazzanti, M. The long history of cannabis and its cultivation by the Romans in central Italy, shown by pollen records from Lago Albano and Lago di Nemi. Veg. Hist. Archaeobot 2002, 11, 263–276. [Google Scholar] [CrossRef]
  4. Clarke, R.C.; Merlin, M.D. Cannabis: Evolution and Ethnobotany; Berkley, M.I., Ed.; University of California Press: Los Angeles, CA, USA, 2013. [Google Scholar]
  5. Clarke, R.C.; Merlin, M.D. Cannabis domestication, breeding history, present-day genetic diversity, and future prospects. CRC Crit. Rev. Plant Sci. 2016, 35, 293–327. [Google Scholar] [CrossRef]
  6. Small, E.; Jui, P.Y.; Lefkovitch, L.P. A numerical taxonomic analysis of cannabis with special reference to species delimitation. Syst. Bot. 1976, 1, 67. [Google Scholar] [CrossRef]
  7. Hillig, K.W. Genetic evidence for speciation in Cannabis (Cannabaceae). Genet. Resour. Crop Evol. 2005, 52, 161–180. [Google Scholar] [CrossRef]
  8. Chandra, S.; Lata, H.; Khan, I.A.; ElSohly, M.A. Cannabis sativa L.: Botany and horticulture. In Cannabis sativa L.—Botany and Biotechnology; Chandra, S., Ed.; Springer: New York, NY, USA, 2017; pp. 79–100. [Google Scholar]
  9. Small, E. Classification of Cannabis sativa L. in relation to agricultural, biotechnological, medical and recreational utilization. In Cannabis sativa L.—Botany and Biotechnology; Chandra, S., Ed.; Springer: New York, NY, USA, 2017; pp. 1–62. [Google Scholar]
  10. McPartland, J.M. Cannabis systematics at the levels of family, genus, and species. Cannabis Cannabinoid Res. 2018, 3, 203–212. [Google Scholar] [CrossRef]
  11. Small, E. Evolution and classification of Cannabis sativa (Marijuana, Hemp) in relation to human utilization. Bot. Rev. 2015, 81, 189–294. [Google Scholar] [CrossRef]
  12. Zhang, Q.; Chen, X.; Guo, H.; Trindade, L.M.; Salentijn, E.M.J.; Guo, R. Latitudinal adaptation and genetic insights into the origins of Cannabis sativa L. Front. Plant Sci. 2018, 9, 1876. [Google Scholar] [CrossRef]
  13. Ilikj, M.; Brchina, I.; Ugrinova, L.; Karcev, V.; Grozdanova, A. GMP/GACP—New Standards for Quality Assurance of Cannabis; LAP LAMBERT Academic Publishing: Saarbrucken, Germany, 2021. [Google Scholar]
  14. Lefsrud, M.G.; Kopsell, D.A.; Kopsell, D.E.; Curran-Celentano, J. Irradiance levels affect growth parameters and carotenoid pigments in kale and spinach grown in a controlled environment. Physiol. Plant 2006, 127, 624–631. [Google Scholar] [CrossRef]
  15. Chandra, S.; Lata, H.; Khan, I.A.; Elsohly, M.A. Photosynthetic response of Cannabis sativa L. to variations in photosynthetic photon flux densities, temperature and CO2 conditions. Physiol. Mol. Biol. Plants 2008, 14, 299–306. [Google Scholar] [CrossRef] [PubMed]
  16. Magagnini, G.; Grassi, G.; Kotiranta, S. The effect of light spectrum on the morphology and cannabinoid content of Cannabis sativa L. Med. Cannabis Cannabinoids 2018, 1, 19–27. [Google Scholar] [CrossRef] [PubMed]
  17. Chandra, S.; Lata, H.; Khan, I.A.; ElSohly, M.A. Temperature response of photosynthesis in different drug and fiber varieties of Cannabis sativa L. Physiol. Mol. Biol. Plants 2011, 17, 297. [Google Scholar] [CrossRef]
  18. Upton, R.; Craker, L.; ElSohly, M.; Romm, A.; Russo, E.; Sexton, M. Cannabis Inflorescence: Cannabis spp. In Standards of Identity, Analysis, and Quality Control; American Herbal Pharmacopoeia: Scotts Valley, CA, USA, 2013. [Google Scholar]
  19. Caplan, D.; Dixon, M.; Zheng, Y. Optimal rate of organic fertilizer during the vegetative-stage for cannabis grown in two coir-based substrates. HortScience 2017, 52, 1307–1312. [Google Scholar] [CrossRef]
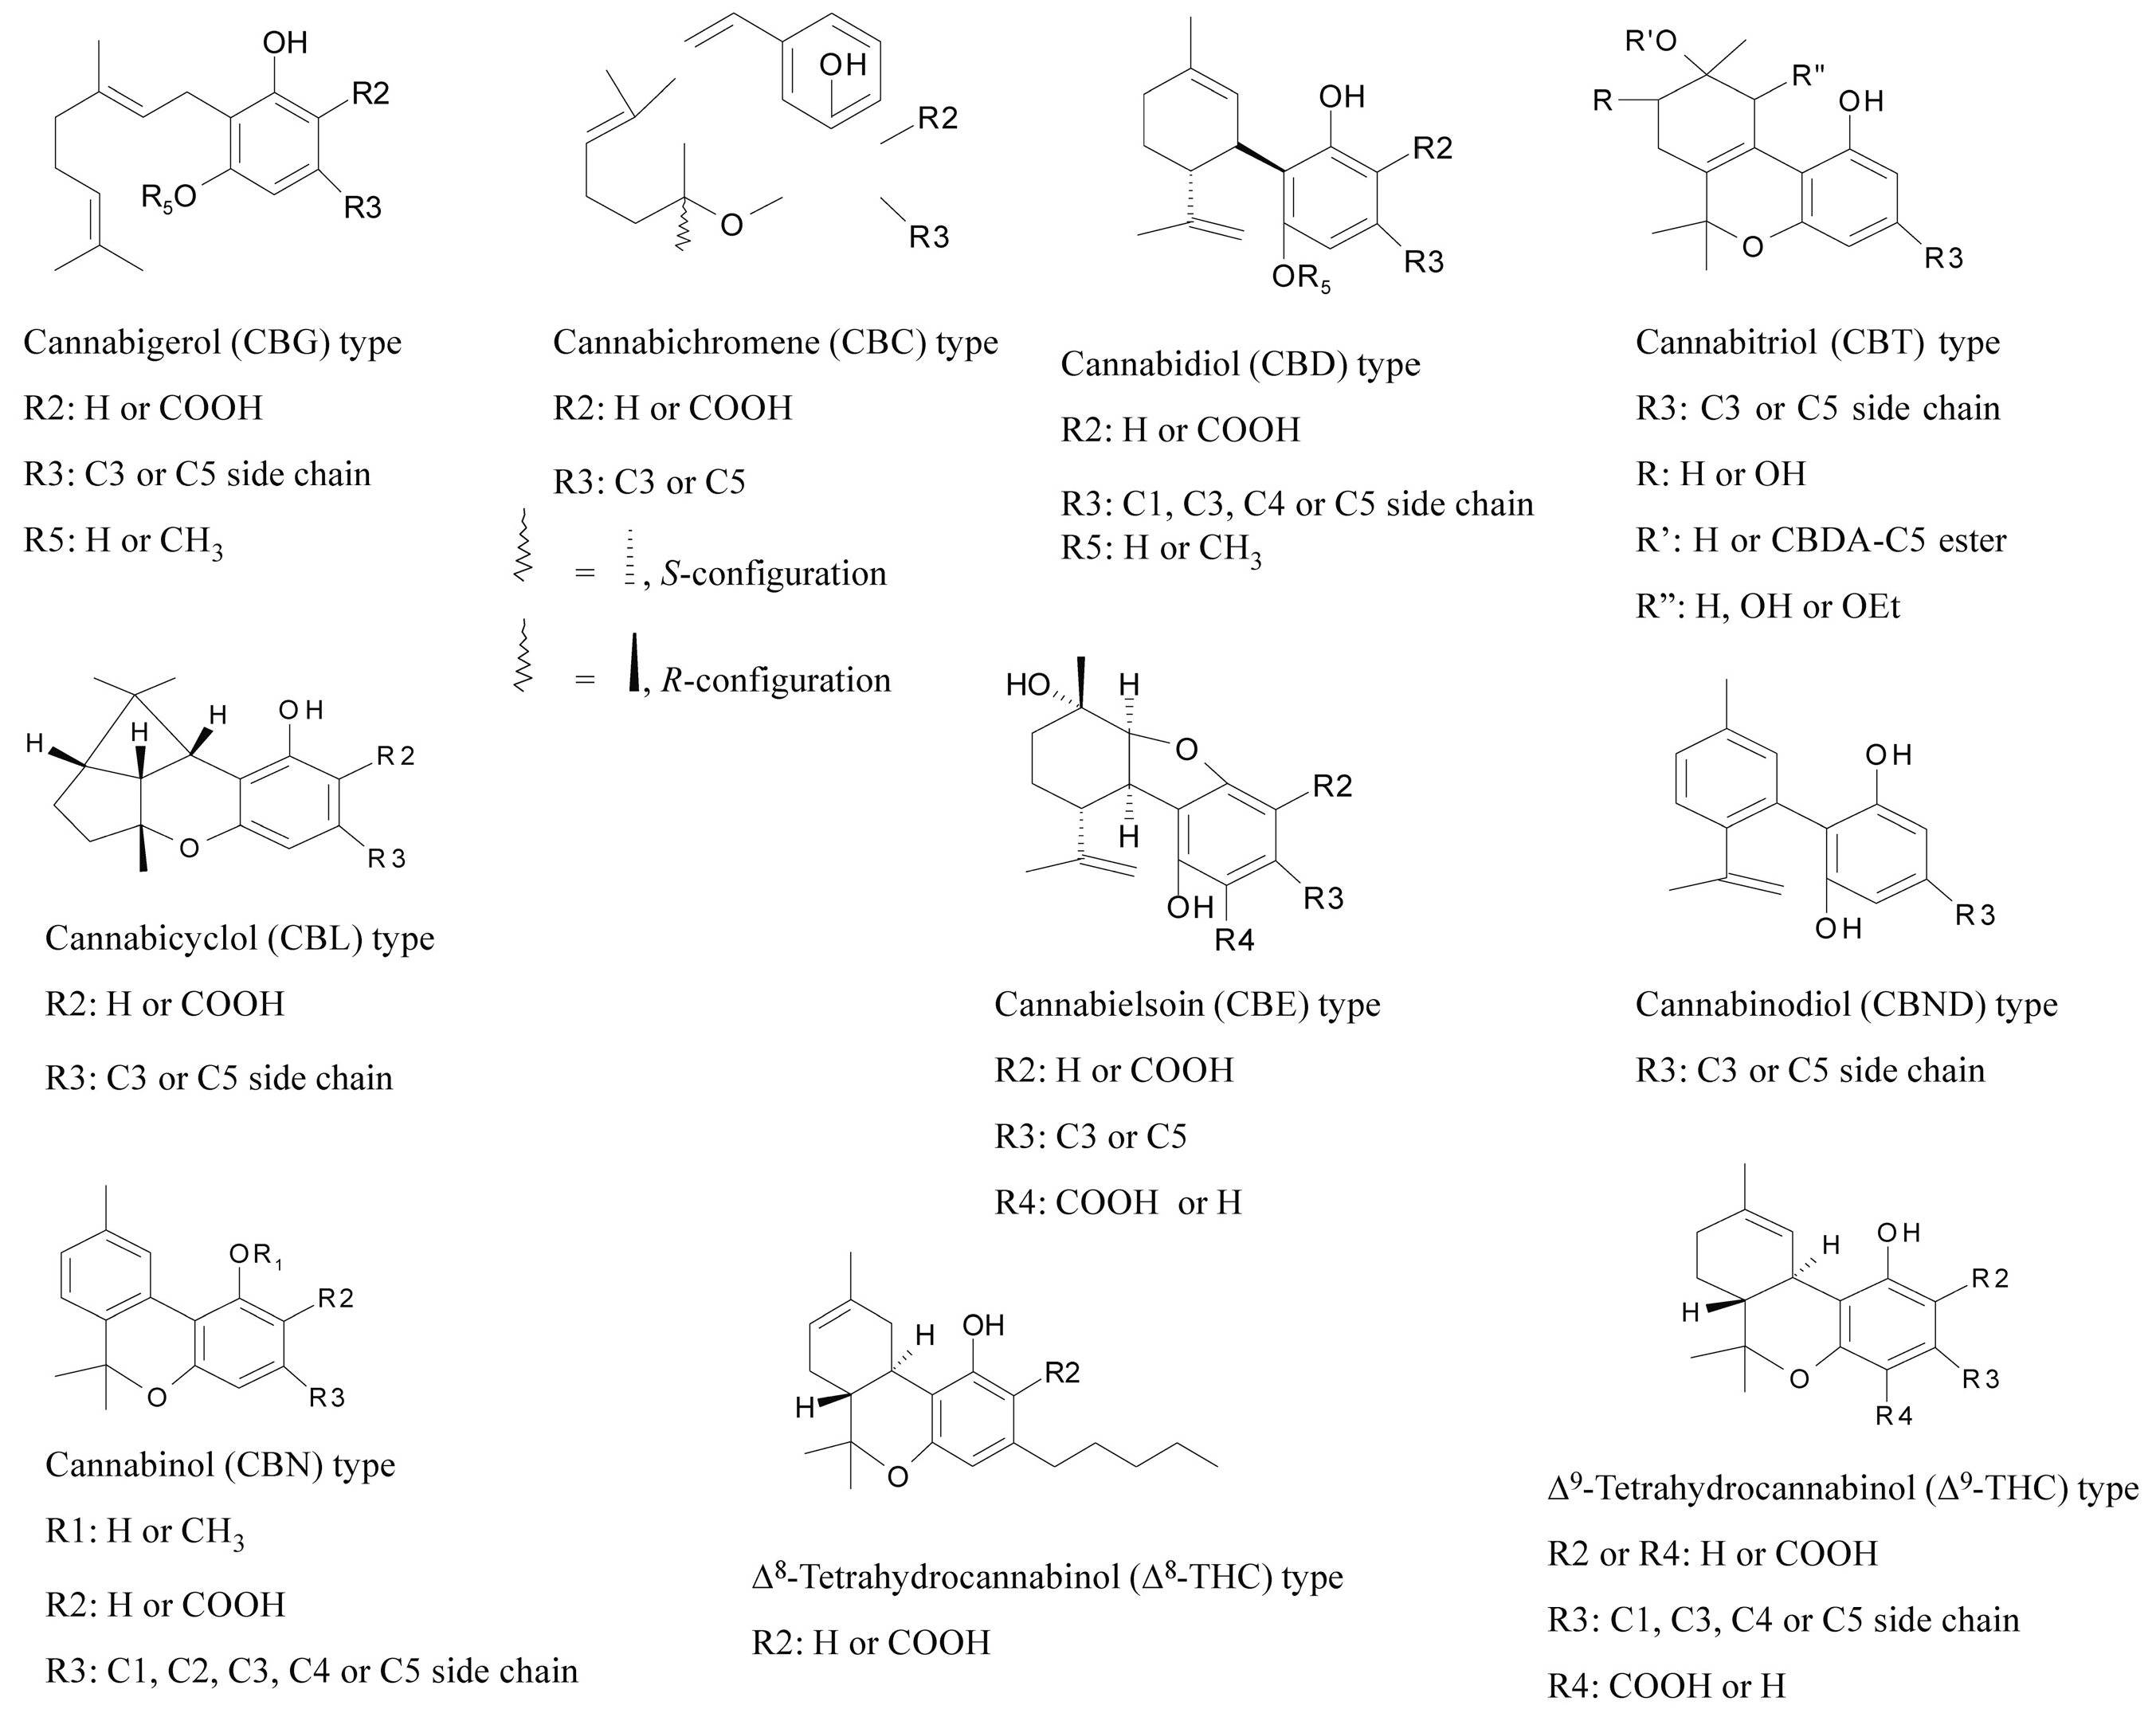
  20. Flores-Sanchez, I.J.; Verpoorte, R. Secondary metabolism in cannabis. Phytochem. Rev. 2008, 7, 615–639. [Google Scholar] [CrossRef]
  21. Hanus, L.O.; Meyer, S.M.; Muñoz, E.; Taglialatela-Scafati, O.; Appendino, G. Phytocannabinoids: A unified critical inventory. Nat. Prod. Rep. 2016, 33, 1357–1392. [Google Scholar] [CrossRef] [PubMed]
  22. Hill, A.J.; Williams, C.M.; Whalley, B.J.; Stephens, G.J. Phytocannabinoids as novel therapeutic agents in CNS disorders. Pharmacol. Ther. 2012, 133, 79–97. [Google Scholar] [CrossRef]
  23. Sirikantaramas, S.; Taura, F. Cannabinoids: Biosynthesis and biotechnological applications. In Cannabis sativa L.—Botany and Biotechnology; Springer: New York, NY, USA, 2017; pp. 183–206. [Google Scholar] [CrossRef]
  24. Izzo, A.A.; Borrelli, F.; Capasso, R.; Di Marzo, V.; Mechoulam, R. Non-psychotropic plant cannabinoids: New therapeutic opportunities from an ancient herb. Trends Pharmacol. Sci. 2009, 30, 515–527. [Google Scholar] [CrossRef]
  25. Pertwee, R.G. The diverse CB1 and CB2 receptor pharmacology of three plant cannabinoids: δ9-tetrahydrocannabinol, cannabidiol and Δ9-tetrahydrocannabivarin. Br. J. Pharmacol. 2008, 153, 199–215. [Google Scholar] [CrossRef]
  26. Bernstein, N.; Gorelick, J.; Zerahia, R.; Koch, S. Impact of N, P, K, and humic acid supplementation on the chemical profile of medical cannabis (Cannabis sativa L). Front. Plant Sci. 2019, 10, 736. [Google Scholar] [CrossRef]
  27. Saloner, A.; Sacks, M.M.; Bernstein, N. Response of medical cannabis (Cannabis sativa L.) genotypes to K supply under long photoperiod. Front. Plant Sci. 2019, 10, 1369. [Google Scholar] [CrossRef]
  28. Saloner, A.; Bernstein, N. Response of medical cannabis (Cannabis sativa L.) to nitrogen supply under long photoperiod. Front. Plant Sci. 2020, 11, 572293. [Google Scholar] [CrossRef] [PubMed]
  29. Eaves, J.; Eaves, S.; Morphy, C.; Murray, C. The relationship between light intensity, cannabis yields, and profitability. Agron. J. 2020, 112, 1466–1470. [Google Scholar] [CrossRef]
  30. Caplan, D.; Stemeroff, J.; Dixon, M.; Zheng, Y. Vegetative propagation of cannabis by stem cuttings: Effects of leaf number, cutting position, rooting hormone and removal of leaf tips. Can. J. Plant Sci. 2018, 98, 1126–1132. [Google Scholar] [CrossRef]
  31. Moher, M.; Llewellyn, D.; Jones, M.; Zheng, Y. High light intensities can be used to grow healthy and robust cannabis plants during the vegetative stage of indoor production. Preprints 2021, 2021040417. [Google Scholar] [CrossRef]
  32. Lawlor, D.W. Photosynthesis, productivity and environment. J. Exp. Bot. 1995, 46, 1449–1461. [Google Scholar] [CrossRef]
  33. Casal, J.J.; Yanovsky, M.J. Regulation of gene expression by light. Int. J. Dev. Biol. 2005, 49, 501–511. [Google Scholar] [CrossRef]
  34. Casal, J.J.; Fankhauser, C.; Coupland, G.; Blázquez, M.A. Signalling for developmental plasticity. Trends Plant Sci. 2004, 9, 309–314. [Google Scholar] [CrossRef]
  35. Chen, M.; Galvão, R.M.; Li, M.; Burger, B.; Bugea, J.; Bolado, J.; Chory, J. Arabidopsis HEMERA/pTAC12 initiates photomorphogenesis by phytochromes. Cell 2010, 141, 1230–1240. [Google Scholar] [CrossRef] [PubMed]
  36. McCree, K. The action spectrum, absorptance and quantum yield of photosynthesis in crop plants. Agric. Meteorol. 1972, 9, 191–216. [Google Scholar] [CrossRef]
  37. McCree, K. Test of current definitions of photosynthetically active radiation against leaf photosynthesis data. Agric. Meteorol. 1972, 10, 443–453. [Google Scholar] [CrossRef]
  38. Van Iersel, M.W. Optimizing LED lighting in controlled environment agriculture. In Light Emitting Diodes for Agriculture; Gupta, S.D., Ed.; Springer: Singapore, 2017; pp. 59–80. [Google Scholar]
  39. Zhen, S.; van Iersel, M.W. Far-red light is needed for efficient photochemistry and photosynthesis. J. Plant Physiol. 2017, 209, 115–122. [Google Scholar] [CrossRef] [PubMed]
  40. Kono, M.; Kawaguchi, H.; Mizusawa, N.; Yamori, W.; Suzuki, Y.; Terashima, I. Far-red light accelerates photosynthesis in the low-light phases of fluctuating light. Plant Cell Physiol. 2020, 61, 192–202. [Google Scholar] [CrossRef] [PubMed]
  41. Zhen, S.; van Iersel, M.W.; Bugbee, B. Why far-red photons should be included in the definition of photosynthetic photons and the measurement of horticultural fixture efficacy. Front. Plant Sci. 2021, 12, e693445. [Google Scholar] [CrossRef]
  42. Zhen, S.; van Iersel, M.W.; Bugbee, B. Photosynthesis in sun and shade: The surprising importance of far-red photons. New Phytol. 2022, 236, 538–546. [Google Scholar] [CrossRef] [PubMed]
  43. Llewellyn, D.; Golem, S.; Foley, E.; Dinka, S.; Jones, M.; Zheng, Y. Cannabis yield increased proportionally with light intensity, but additional ultraviolet radiation did not affect yield or cannabinoid content. Preprints 2021, 2021030327. [Google Scholar] [CrossRef]
  44. Marcelis, L.F.M.; Broekhuijsen, A.G.M.; Meinen, E.; Nijs, E.M.F.M.; Raaphorst, M.G.M. Quantification of the growth response to light quantity of greenhouse grown crops. Acta Hortic. 2006, 711, 97–103. [Google Scholar] [CrossRef]
  45. Danziger, N.; Bernstein, N. Light matters: Effect of light spectra on cannabinoid profile and plant development of medical cannabis (Cannabis sativa L.). Ind. Crops Prod. 2021, 164, 113351. [Google Scholar] [CrossRef]
  46. Meng, Q.; Boldt, J.; Runkle, E.S. Blue radiation interacts with green radiation to influence growth and predominantly controls quality attributes of lettuce. J. Am. Soc. Hortic. Sci. 2020, 145, 75–87. [Google Scholar] [CrossRef]
  47. Naznin, M.T.; Lefsrud, M.; Gravel, V.; Azad, O.K. Blue light added with red LEDs enhance growth characteristics, pigments content, and antioxidant capacity in lettuce, spinach, kale, basil, and sweet pepper in a controlled environment. Plants 2019, 8, 93. [Google Scholar] [CrossRef]
  48. Vanhove, W.; Van Damme, P.; Meert, N. Factors determining yield and quality of illicit indoor cannabis (Cannabis spp.) production. Forensic Sci. Int. 2011, 212, 158–163. [Google Scholar] [CrossRef] [PubMed]
  49. Potter, D.J.; Duncombe, P. The effect of electrical lighting power and irradiance on indoor-grown cannabis potency and yield. J. Forensic Sci. 2012, 57, 618–622. [Google Scholar] [CrossRef] [PubMed]
  50. Hoagland, D.R.; Snyder, W.C. Nutrition of strawberry plant under controlled conditions: (a) Effects of deficiencies of boron and certain other elements: (b) Susceptibility to injury from sodium salts. Proc. Am. Soc. Hortic. Sci. 1933, 30, 288–294. [Google Scholar]
  51. Hoagland, D.R.; Arnon, D.I. The Water-Culture Method for Growing Plants Without Soil, 347th ed.; California Agricultural Experiment Station: Davis, CA, USA, 1938; Available online: http://www.ledson.ufla.br/wp-content/uploads/2019/11/Hoagland-Arnon-the-water-culture-method-for-growing-plants-without-soil.1938.pdf (accessed on 1 November 2024).
  52. Hoagland, D.R.; Arnon, D.I. The Water-Culture Method for Growing Plants Without Soil, 347th ed.; California Agricultural Experiment Station: Davis, CA, USA, 1950; Available online: https://www.nutricaodeplantas.agr.br/site/downloads/hoagland_arnon.pdf (accessed on 1 November 2024).
  53. Bugbee, B. Nutrient management in recirculating hydroponic culture. In Proceedings of the South Pacific Soilless Culture Conference-SPSCC 648, Palmerston North, New Zealand, 10–13 February 2003; pp. 99–112. [Google Scholar]
  54. Langenfeld, N.J.; Pinto, D.F.; Faust, J.E.; Heins, R.; Bugbee, B. Principles of nutrient and water management for indoor agriculture. Sustainability 2022, 14, 10204. [Google Scholar] [CrossRef]
  55. Cockson, P.; Schroeder-Moreno, M.; Veazie, P.; Barajas, G.; Logan, D.; Davis, M. Impact of phosphorus on Cannabis sativa reproduction, cannabinoids, and terpenes. Appl. Sci. 2020, 10, 7875. [Google Scholar] [CrossRef]
  56. Veazie, P.; Cockson, P.; Kidd, D.; Whip, B. Elevated phosphorus fertility impact on Cannabis sativa ‘BaOx’ growth and nutrient accumulation. Int. J. Innov. Sci. Eng. Technol. 2021, 8, 345–351. [Google Scholar]
  57. Rodriguez-Morrison, V.; Llewellyn, D.; Zheng, Y. Cannabis yield, potency, and leaf photosynthesis respond differently to increasing light levels in an indoor environment. Front. Plant Sci. 2021, 12, 646020. [Google Scholar] [CrossRef]
  58. Moher, M.; Llewellyn, D.; Jones, M.; Zheng, Y. Light intensity can be used to modify the growth and morphological characteristics of cannabis during the vegetative stage of indoor production. Ind. Crops Prod. 2022, 183, 114909. [Google Scholar] [CrossRef]
  59. Kim, I.S.; Zhang, C.; Kang, H.M.; Mackay, B. Control of stretching of cucumber and tomato plug seedlings using supplemental light. Hortic. Environ. Biotechnol. 2008, 49, 287–292. [Google Scholar]
  60. Morello, V.; Brousseau, V.D.; Wu, N.; Wu, B.S.; MacPherson, S.; Lefsrud, M. Light quality impacts vertical growth rate, phytochemical yield and cannabinoid production efficiency in Cannabis sativa. Plants 2022, 11, 2982. [Google Scholar] [CrossRef]
  61. Parry, C.; Bugbee, B. Reduced root-zone phosphorus concentration decreases iron chlorosis in maize in soilless substrates. HortTechnology 2017, 27, 490–493. [Google Scholar] [CrossRef]
  62. Shiponi, S.; Bernstein, N. Response of medical cannabis (Cannabis sativa L.) genotypes to P supply under long photoperiod: Functional phenotyping and the ionome. Ind. Crops Prod. 2021, 161, 113154. [Google Scholar] [CrossRef]
  63. Westmoreland, F.M.; Bugbee, B. Sustainable cannabis nutrition: Elevated root-zone phosphorus significantly increases leachate P and does not improve yield or quality. Front. Plant Sci. 2022, 13, 1015652. [Google Scholar] [CrossRef]
  64. Ma, Q.; Longnecker, N.; Atkins, C. Varying phosphorus supply and development, growth and seed yield in narrow-leafed lupin. Plant Soil. 2002, 239, 79–85. [Google Scholar] [CrossRef]
  65. Malhotra, H.; Vandana, S.; Sharma; Pandey, R. Phosphorus nutrition: Plant growth in response to deficiency and excess. In Plant Nutrients and Abiotic Stress Tolerance; Springer: Berlin/Heidelberg, Germany, 2018; pp. 171–190. [Google Scholar]
  66. Kim, H.J.; Li, X. Effects of phosphorus on shoot and root growth, partitioning, and phosphorus utilization efficiency in Lantana. HortScience 2016, 51, 1001–1009. [Google Scholar] [CrossRef]
  67. Saloner, A.; Bernstein, N. Nitrogen supply affects cannabinoid and terpenoid profile in medical cannabis (Cannabis sativa L.). Ind. Crops Prod. 2021, 167, 113516. [Google Scholar] [CrossRef]
  68. Saloner, A.; Bernstein, N. Effect of potassium (K) supply on cannabinoids, terpenoids and plant function in medical cannabis. Agronomy 2022, 12, 1242. [Google Scholar] [CrossRef]
  69. Saloner, A.; Bernstein, N. Nitrogen source matters: High NH4/NO3 ratio reduces cannabinoids, terpenoids, and yield in medical cannabis. Front. Plant Sci. 2022, 13, 830224. [Google Scholar] [CrossRef]
  70. Massuela, D.C.; Munz, S.; Hartung, J.; Nkebiwe, P.M.; Graeff-Hönninger, S. Cannabis hunger games: Nutrient stress induction in flowering stage-impact of organic and mineral fertilizer levels on biomass, cannabidiol (CBD) yield and nutrient use efficiency. Front. Plant Sci. 2023, 14, 1233232. [Google Scholar] [CrossRef]
Figure 1. Illustration of the chemical structures and basic differences between the different types of cannabinoids. For each cannabinoid, the substituents on the main carbon chain are listed as R1, R2, R3 and R4, which specify possible functional groups or atoms that define the specific cannabinoid. Adapted from Flores-Sanchez & Verpoorte [20].
Agronomy 14 02960 g001
Figure 2. Spectrum of the SunPro SUNDOCAN 900 W light used. Measured with the UPRtek MK350 LED device (UPRtek Corp., Zhunan Township, Taiwan). CCT (correlated color temperature): 4098 K indicates the color temperature of the light in Kelvin. Light with a value of 4098 K has white color, close to neutral to warm white. CRI (color rendering index): 83 measures how accurately a given light displays colors compared to natural light. LUX: 7968 indicates the intensity in LUX, where 7958 LUX is considered high intensity. λp (Peak Wavelength): 452 nm means that the dominant wavelength of the light spectrum is 452 nm which corresponds to the blue part of the spectrum. I-Time: 34 ms is the integration time for the measurement, which was set for 34 ms. CIE1931 (x, y) shows the coordinates x = 0.3755 and y = 0.3712 that indicate where the point of light is located on the color diagram, which corresponds to approximately neutral white. CIE1976 (u’, v’): The coordinates u’ = 0.2241 and v’ = 0.4984 provide similar information to CIE1931, that better matches human color perception.
Agronomy 14 02960 g002
Figure 3. Yield of cannabis under the effect of light and nutrition. (A) effects in separate experiments/replicates (p < 0.0001), (B) total yield under the effect of light (p < 0.0001) and nutrition (p = 0.64). S1 = light 1; S2 = light 2; R1 = fertilizer 1; R2 = fertilizer 2; different lowercase letters in the figure indicates statistical differences in the parameters.
Agronomy 14 02960 g003
Figure 4. Cannabidiol (CBD), Tetrahydrocannabinol (THC), Cannabigerol (CBG) and Cannabichromene (CBC) results under the effect of nutrition R1 (fertilizer 1), R2 (fertilizer 2) and light S1 (light 1) and S2 (light 2). Error bars display the average absolute difference below and above in each treatment for all pairwise comparisons between treatments (n = 4).
Agronomy 14 02960 g004
Figure 5. Principal Component Analysis (PCA) is based on yield and cannabinoid content under the effect of nutrition and light. Green points are light 2 (S2), pink points are light 1 (S1).
Agronomy 14 02960 g005
Figure 6. Heatmap pairwise correlations for all parameter data. CBC (%): Cannabichromene percentage, representing the proportion of CBC in the sample. CBG (%): Cannabigerol percentage, representing the proportion of CBG in the sample. THC (%): Tetrahydrocannabinol percentage, representing the proportion of THC in the sample. CBD (%): Cannabidiol percentage, representing the proportion of CBD in the sample. Yield (g): The total dry flower weight (in grams) harvested from the plants.
Agronomy 14 02960 g006
Table 1. Nutrient absorption by plants [53].
Group 1Active absorptionNO3, NH4, P, K, Mn
Group 2Moderate absorptionMg, S, Fe, Zn, Cu, Mo, Cl
Group 3Passive absorptionCa, B
Table 2. Average temperature, humidity and CO2 levels during the experiments.
Vegetative Phase
TemperatureHumidityCO2 (ppm)
DayNightDayNightDayNight
Experiment 123.4 °C20.6 °C78.7%54.3%406428
Experiment 223.8 °C20.9 °C76.3%52.1%411436
Flowering Phase
TemperatureHumidityCO2 (ppm)
DayNightDayNightDayNight
Experiment 126.1 °C22.3 °C58.5%48.4%410443
Experiment 226.8 °C22.6 °C61.2%50.3%414449
Table 3. Fertilizer compositions and concentrations.
R1 R2 R2
V + F Vegetation Flower
Nutrientmg/LR1 × R2 (V)mg/LR1 × R2 (F)mg/L
N (NO3)131.250.76 × less in R1171.261.38 × more in R197.96
N (NH4+)6.231.19 × more in R15.261.07 × more in R15.82
P2O530.870.55 × less in R165.918.49 × less in R1262.66
K2O112.040.51 × less in R1222.791.13 × less in R1244.07
CaO147.991.19 × more in R1125.701.10 × more in R1138.26
MgO45.680.51 × less in R178.881.87 × less in R185.21
SO42−45.080.68 × less in R166.946.25 × less in R1281.54
Table 4. Parameters of light sources used in the experiments.
ParameterLight S1Light S2
VFVF
PPFD (µmol/m2/s)3009005001300
Power (W)360540540900
Comparison of two light sources (light S1 and S2) regarding light intensity (PPFD) and power (watts) used during the experiment in two plant growth phases: Vegetation phase (V) and Flowering phase (F).
Table 5. Photosynthetic photon flux density (PPFD) in experiments 1 and 2.
Experiment 1—vegetation phase
Light S1 + Fertilizer R1 + R2Light S2 + Fertilizer R1 + R2
Average PPFD334.6
µmol/m²/s
Average PPFD471 µmol/m²/s
Rounded PPFD300
µmol/m²/s
Rounded PPFD500
µmol/m²/s
Experiment 1—flowering phase
Light S1 + Fertilizer R1 + R2Light S2 + Fertilizer R1 + R2
Average PPFD927
µmol/m2/s
Average PPFD1299
µmol/m²/s
Rounded PPFD900
µmol/m²/s
Rounded PPFD1300
µmol/m²/s
Experiment 2—vegetation phase
Light S1 + Fertilizer R1 + R2Light S2 + Fertilizer R1 + R2
Average PPFD315.4
µmol/m²/s
Average PPFD492
µmol/m²/s
Rounded PPFD300
µmol/m²/s
Rounded PPFD500
µmol/m²/s
Experiment 2—flowering phase
Light S1 + Fertilizer R1 + R2Light S2 + Fertilizer R1 + R2
Average PPFD914.6
µmol/m²/s
Average PPFD1308
µmol/m²/s
Rounded PPFD900
µmol/m²/s
Rounded PPFD1300
µmol/m²/s
Table 6. ANOVA results for the treatment for yield in dry mass (DM) (n = 8), Cannabidiol (CBD), Tetrahydrocannabinol (THC), Cannabigerol (CBG) and Cannabichromene (CBC) (n = 4) under effects of varying nutrition and light.
EffectYield (g DM)CBD (%)THC (%)CBG (%)CBC (%)
NutritionR160.85 ± 3.9410.05 ± 0.650.446 ± 0.030.846 ± 0.110.160 ± 0.02
R258.34 ± 3.579.58 ± 0.200.428 ± 0.010.749 ± 0.080.193 ± 0.03
p-Valuensnsnsnsns
LightS144.30 ± 1.61 b9.04 ± 0.39 b0.400 ± 0.02 b0.670 ± 0.060.145 ± 0.02
S274.90 ± 3.27 a10.59 ± 0.38 a0.474 ± 0.02 a0.925 ± 0.110.208 ± 0.02
p-Value*****
Nutrition and
Light
R1S145.63 ± 3.228.75 ± 0.790.38 ± 0.040.64 ± 0.110.13 ± 0.06
R1S276.08 ± 4.8011.35 ± 0.460.51 ± 0.031.05 ± 0.130.20 ± 0.11
R2S142.97 ± 0.339.33 ± 0.250.42 ± 0.020.70 ± 0.060.17 ± 0.05
R2S273.72 ± 4.589.83 ± 0.290.44 ± 0.020.80 ± 0.170.22 ± 0.11
p-Valuensnsns
ns—not significant, † p ≤ 0.1, * p ≤ 0.05, and ** p ≤ 0.01; different lowercase letters in the table indicates statistical differences in the parameters.
Disclaimer/Publisher’s Note: The statements, opinions and data contained in all publications are solely those of the individual author(s) and contributor(s) and not of MDPI and/or the editor(s). MDPI and/or the editor(s) disclaim responsibility for any injury to people or property resulting from any ideas, methods, instructions or products referred to in the content.

