Article

Assessing the Impact of Saline Irrigation Water on Durum Wheat (cv. Faraj) Grown on Sandy and Clay Soils

1
Laboratory of Agrophysiology and PhytoBiotechnology, Department of Biology, Faculty of Sciences, Ibn Tofail University, Kenitra 14000, Morocco
2
Research Unit on Environment and Conservation of Natural Resources, Regional Center of Rabat, National Institute of Agricultural Research, AV. Ennasr, Rabat 10101, Morocco
3
International Center for Agricultural Research in the Dry Areas (ICARDA), Rabat 10100, Morocco
4
National Center for Energy Sciences and Nuclear Techniques (CNESTEN), Rabat 10001, Morocco
5
Laboratory of Materials, Nanotechnologies, and Environment, Department of Chemistry, Faculty of Sciences, Mohammed V University in Rabat, Rabat 10101, Morocco
*
Author to whom correspondence should be addressed.
Agronomy 2024, 14(12), 2865; https://doi.org/10.3390/agronomy14122865
Submission received: 24 August 2024 / Revised: 31 October 2024 / Accepted: 5 November 2024 / Published: 1 December 2024

Abstract

:
In Morocco, saline irrigation significantly affects soil quality and reduces crop yields. This study evaluates the effect of salt stress on soil properties and the overall performance of the durum wheat variety “Faraj”, aiming to optimize production under saline conditions. A greenhouse experiment was conducted during the 2023–2024 season, using a completely randomized design (CRD) to assess soil properties, plant growth, and yield. Five salinity levels (0.2, 4, 8, 12, and 16 dS m−1) were applied to two soil types: silty-clay (S1) and sandy (S2). Results showed significant changes in soil properties, including increased pH, electrical conductivity, and accumulation of potassium, calcium, and magnesium in soil. Grain yield decreased significantly with increasing salinity, from 1.12 t ha−1 in freshwater to 0.12 t ha−1 at 16 dS m−1 in S1, and from 0.56 t ha−1 in freshwater to 0.12 t ha−1 at 16 dS m−1 in S2. Straw yield was less affected, with values of 1.24 and 1.16 t ha−1 for S1 and S2 at 12 dS m−1, decreasing to 0.80 and 0.55 t ha−1 at 16 dS m−1. The “Faraj” variety shows good tolerance to salinity up to 8 dS m−1 for grain yield and 12 dS m−1 for straw yield, making it particularly suitable for moderately saline environments.

Graphical Abstract

1. Introduction

In recent years, climate change has led to an increase in drought and population growth worldwide. According to UN forecasts for 2020, this population increase tripled between 1950 (2.6 billion) and 2020 (8 billion) [1]. However, in the face of these major challenges facing the food security and agriculture sectors, it is imperative to improve the performance of agricultural production. Moreover, given the issue of limited water resources, irrigation with poor-quality water, especially saline water, could provide a solution to alleviate crop water stress. However, this practice also increases the risk of soil salinization, which can lead to reduced yields due to additional salt stress [2,3,4]. Climate change and variations in agricultural practices exacerbate these challenges by affecting soil and water resource quality [5,6]. It is essential to implement appropriate management strategies to minimize the negative impacts of salinity, such as selecting salt-resistant varieties and adopting more efficient irrigation techniques.
Furthermore, in Morocco, a Mediterranean country with an arid to semi-arid climate, around 700,000 hectares of land are affected by salinity, half of which is in irrigated perimeters, representing just over 20% of irrigated areas [7,8]. These figures highlight the crucial importance of efficient water resource management and the adoption of innovative agricultural practices to maintain crop productivity despite water and salt stress conditions [9,10,11].
Durum wheat is a key crop in Morocco, valued for its resilience to various environmental challenges, including drought, heat, and limited water availability. While it is mainly cultivated under rainfed conditions, these environmental stressors, such as fluctuating rainfall, poor soil quality, and high temperatures, significantly impact its yield and overall productivity. Studies have highlighted these constraints as critical factors influencing durum wheat performance in dryland areas [12]. The yield of wheat can be significantly influenced by several crucial environmental factors. First, water management is critical for optimizing wheat production. In rainfed systems, limited water availability can result in severe water stress, adversely impacting seed germination and plant development [13]. High temperatures also play a decisive role. During sensitive stages such as flowering, elevated temperatures can impair grain formation, leading to reduced yields [14]. Soil quality and the use of inputs are also vital considerations. Poorly maintained or low-quality soils can hinder wheat growth and lower yields. Additionally, improper use of agrochemical inputs can lead to pollution issues and negatively affect crop health [15]. Pests and diseases pose another significant threat to wheat yield. Fungal infections and pest infestations can reduce both the quantity and quality of the harvest [16]. Lastly, the effects of climate change are becoming increasingly concerning for wheat production. Changes in precipitation patterns and extreme weather events can adversely affect yields [17].
This study is essential for several reasons. First, a deeper understanding of the effects of saline irrigation on both soils and crops is necessary to develop more sustainable irrigation strategies, thereby reducing the pressure on freshwater resource [18]. Second, this study seeks to enhance durum wheat yields by identifying strategies to optimize productivity under salinity conditions. Such efforts are critical for addressing the challenges posed by saline environments on crop growth and ensuring food security in affected regions [19].
Recent studies underline the critical impact of water deficit and salinity stress on durum wheat, highlighting the need to manage salinity stress in cereal crops [20]. Indeed, soil salinity, accumulated in particular from saline irrigation water, is known to be a factor that can have detrimental effects on the morphological, physiological and biochemical processes of crops [21]. It can compromise the development of wheat plants by reducing water and nutrient uptake, photosynthetic capacity and enzymatic activities, leading to a reduction in overall crop yield [22].
Durum wheat, however, is generally considered among the salinity-tolerant crops, but its level of tolerance varies between varieties [23,24]. Understanding the variability of salinity tolerance between varieties can help improve and optimize yields and crop resilience to harsh environmental conditions. As a result, several recently developed durum wheat varieties, including “Faraj”, have gained recognition in Morocco for their good drought resistance and low irrigation water requirements. These varieties, bred through advanced selection techniques, are particularly suited to rain-fed areas and soil conservation practices such as no-till seeding systems [25].
The aim of this study is to assess the salinity tolerance of the durum wheat variety “Faraj”. This study specifically examined the effects of salt treatment with increasing NaCl concentrations on soil properties, growth parameters, and yields of grain and straw for this durum wheat variety, on two soil types—sandy and silty-clay—under controlled conditions. This study is crucial to understanding how saline water, rich in NaCl, affects soils and crops, by examining the effect of salt on germination, growth parameters in this durum wheat variety, dry matter yields, and potassium, magnesium, and sodium assimilation under two sandy and clayey soil conditions.

2. Materials and Methods

2.1. Test Site and Field Sampling

This research was conducted at the Regional Center of Rabat of the National Institute for Agricultural Research (INRA), within the Research Unit of Environment and Conservation of Natural Resources (URECRN). The experiment site is located at a latitude of 34°03′50″ N and a longitude of 06°50′40″ W, at an elevation of approximately 70 m above sea level, typical of Rabat’s coastal region in Morocco, which is characterized by a Mediterranean climate with oceanic nuances. The trial was carried out in a greenhouse at this center. The soils used in this study were sampled from the Temara region, 30 km south of Rabat, which is characterized by a Mediterranean climate with oceanic nuances. Figure 1 illustrates both the soil sampling sites and the experiment site. Average temperatures in the region range from 12 °C in winter to 28 °C in summer, with an average annual precipitation of 400 mm. Two soil types, a clayey soil and a sandy soil, were collected from local farms. This region was selected due to the high quality of its fine granulometric classes, which are particularly vulnerable to salinization. Soil samples were collected from the top 40 cm of the surface using an auger, as this layer is the most active and sensitive to erosion and irrigation-induced degradation. Additionally, a composite sample for each soil type was taken from the 0–20 cm depth in situ and transported to the soil and water chemistry laboratory of URECRN, INRA, Rabat, for the analysis of texture and the initial physicochemical composition before the start of the experiment (Figure 1).

2.2. Plant Material

Seeds of the durum wheat variety “Faraj” (Triticum turgidum L. var. durum) were sown in plastic pots with dimensions of 28 cm in width and 21 cm in depth. To ensure adequate drainage, the bottoms of the pots were lined with a layer of gravel. Each pot was then filled with 4 kg of one of two soil types: S1 (silty-clay soil) or S2 (sandy soil). A total of 30 pots were utilized, divided equally between the two soil types, with 15 pots containing S1 and 15 containing S2. Each pot was planted with ten seeds of the “Faraj” variety. The salinity treatments were applied throughout the entire vegetative cycle of the wheat plants. The salinity levels used were 0.2 dS m−1 (fresh water), 4 dS m−1, 8 dS m−1, 12 dS m−1, and 16 dS m−1. The pots were maintained under these salinity conditions for the duration of the vegetative cycle, with measurements taken at various developmental stages to provide a thorough assessment of salinity impacts. The seeds used in this research were provided by INRA and obtained from INRA’s Merchouch experimental station in Morocco during the 2022/2023 season. This region is characterized by a Mediterranean climate, with a mean annual temperature of 23 °C and annual rainfall of approximately 450 mm, and the dominant soil type is a Vertisol, classified according to the World Reference Base for Soil Resources (WRB) [26]. This variety was chosen for its specific characteristics, as detailed in Table 1.

2.3. Experimental Design

The experiment was conducted in a greenhouse at INRA-Rabat from April to July 2023. A total of 30 pots were used, divided between two soil types and five distinct salinity levels. The first batch, designated as the control group (T0), was irrigated with fresh water at 0.2 dS m−1. The other four batches (T1, T2, T3, and T4) received increasing concentrations of NaCl in the irrigation water: 4, 8, 12, and 16 dS m−1, respectively. Each salinity level was replicated three times, with three pots per treatment/soil type, and each pot containing 10 seeds. The experimental setup was a randomized complete design (RCD), ensuring random distribution of treatments to pots to avoid experimental bias. During the experiment, the greenhouse temperature was maintained at 22 ± 1 °C under light, using a forced-air evaporation cooling system. Measurements were taken at different phenological stages of the crop’s vegetative cycle, including tillering, stem elongation, heading, and maturation, to assess plant growth parameters.

2.4. Irrigation Practices in Greenhouse Cultivation

For the irrigation of the plants, we adhered to protocols based on Maas’s research [27]. Initially, during the first week, a pre-irrigation phase was implemented using unsalted, pre-analyzed freshwater delivered in fine droplets. This approach was designed to minimize seed displacement and detachment, ensuring effective seed germination and uniform emergence. Once the seedlings had emerged and reached approximately 3 cm in height, the irrigation protocol was modified to introduce salinity treatments, ensuring their continued growth under varying salt conditions. We prepared saline solutions by dissolving sodium chloride (NaCl) in tap water to achieve salinities of 4, 8, 12, and 16 dS m−1, respectively. Control pots (T0) received only freshwater. Irrigation was conducted three times a week, with each pot receiving 0.5 L of water per application, whether saline or not. This volume was selected to maintain the growing medium at field capacity without causing excessive leaching or waterlogging. The preparation of salt solutions was carefully managed to ensure accurate salinity levels in each treatment. The irrigation regimen was maintained from April to July 2023, with close monitoring of plant development to evaluate the effects of different salinity treatments on growth parameters.

2.5. Fertilization and Phytosanitary Treatment

To ensure optimal plant growth throughout the wheat development cycle, a comprehensive nitrogen fertilization regimen was implemented, delivering a total of 120 kg ha−1 of nitrogen. This application was divided into three key stages of wheat growth: one-third of the total nitrogen was applied at sowing, another third during the stem elongation phase, and the final third at the heading stage. The initial fertilization at sowing used ammonium sulfate (21% N) to provide a steady supply of nitrogen, supporting early seedling development and establishment. For the subsequent applications, ammonium nitrate (33% N) was chosen for its high nitrogen content and rapid availability, which is critical for supporting vigorous growth during the stem elongation and heading stages. This split-fertilization approach was designed to align with the plant’s nutritional needs at each growth stage, thereby optimizing nutrient uptake and improving overall plant health and yield. During the study, black aphid infestations were detected, posing a threat to plant health and productivity. To address this issue, a targeted phytosanitary treatment was applied. Primor DG was produced by Syngenta, located in Rabat, Morocco. This product was selected based on its proven efficacy against black aphids, ensuring effective pest control while minimizing potential negative impacts on the plants and the environment. This treatment was carefully administered to manage the aphid population and protect the crops from significant damage, thereby maintaining the integrity of the experimental conditions and supporting successful plant growth throughout the study period.

2.6. Germination Test

Before conducting the germination test, a seed preparation process was performed to ensure the selection of seeds with uniform size and to minimize potential contamination. The seeds were sterilized with a mild solution of sodium hypochlorite at a concentration of 0.5% to eliminate surface contaminants. This step aimed to ensure that all seeds were free from pathogens and external contaminants, ensuring a homogenous environment for the germination test. Following this preparation, the seeds were placed in Petri dishes with a diameter of 9 cm, each lined with two layers of filter paper saturated with distilled water. This setup resulted in two repetitions of 10 seeds per dish. The Petri dishes were maintained under controlled conditions to promote germination, including consistent temperature and appropriate humidity. After a three-day period, the germination status of the seeds was assessed for each Petri dish. The seeds were examined daily, and the number of germinated seeds was recorded. At the end of the evaluation period, the final germination percentage (G%) was calculated using the following formula [28]:
G % = g Ng ×   100
where G% represents the germination rate in percentage, Ng denotes the number of germinated seeds, and Ng signifies the total number of seeds.

2.7. Analytical Methods

2.7.1. Analysis of Physicochemical Soil Parameters

Soil samples were air-dried, spread on trays, and placed under a drying ramp overnight to achieve a stable moisture level through ambient air. Following this step, sieving was conducted to separate particles by size. The samples were first passed through a 2 mm sieve, which allowed for the removal of larger particles and soil aggregates. The materials retained by this sieve were collected and noted separately. Analyses performed on this fraction included pH, EC, and exchangeable cations such as Na, K, Ca, and Mg. The fraction obtained after sieving at 2 mm was then passed through a 0.2 mm sieve, enabling the separation of finer particles. The parameters analyzed in this fraction included P, total N, and OM.
Soil particle size distribution was determined using the sedimentation method, which involves dispersing the soil in water and measuring the rate at which soil particles settle [29]. Soil pH was determined potentiometrically using a pH meter (Mettler Toledo Seven Easy-728 Metrohm) ((Mettler Toledo Seven Easy-728, Mettler Toledo, Columbus, OH, USA) after preparing a soil-water suspension at a ratio of 1:2.5 (10 g of dry soil to 25 mL of distilled water) [30]. After weighing the soil sample, it was mixed with water in a beaker and stirred vigorously to achieve a homogeneous dispersion. The suspension was then allowed to rest for 30 min to 1 h to stabilize the particles. The pH electrode was calibrated using appropriate buffer solutions (pH 4 and 7) before being immersed in the suspension to measure the pH, with the value recorded once the reading stabilized. The electrode was rinsed with distilled water after each measurement to avoid cross-contamination. Electrical conductivity (EC) was measured in the saturated soil paste extract using a conductivity meter (Orion model 162, Thermo Fisher Scientific, Waltham, MA, USA) [31]. A sample of 50 g of soil was weighed, and a few milliliters of distilled water were added to obtain a saturated paste. The paste was allowed to rest overnight, followed by centrifugation at 2500 rpm. The supernatant was then collected for measurement. The organic matter (OM) content was analyzed by the Walkley–Black method, which involves oxidizing organic carbon with potassium dichromate in an acidic medium, followed by titration with ammonium ferrous sulfate (Sigma, Sigma-Aldrich, St. Louis, MO, USA) [32]. A sample of 2 g of soil was taken for this analysis. After oxidation, the addition of 3 drops of 0.5% diphenylamine allows the visualization of the reaction, followed by titration with a 5 N Mohr salt solution (Sigma, Sigma-Aldrich, St. Louis, MO, USA). Cation exchange capacity (CEC) was measured using 1N ammonium acetate at pH 7 [32]. Total nitrogen (N) content was determined by the Kjeldahl method, involving acid digestion with sulfuric acid and subsequent distillation [33]. This method quantifies total nitrogen in a soil sample by converting it into ammonium during acid digestion. A 2-g soil sample is weighed and placed in a Kjeldahl flask. Mineralization is performed by heating with sulfuric acid, allowing for the oxidation of organic nitrogen. After this step, the formed ammonium is distilled into a receiving solution. Finally, the nitrogen content is determined by the titration of the distilled ammonia with a 0.1 N HCl solution (Sigma, Sigma-Aldrich, St. Louis, MO, USA). Cation. Available phosphorus (P) was extracted with 0.5 M sodium bicarbonate (pH 8.5) and quantified by spectrophotometry at 882 nm using a JENWAY 6405 spectrophotometer (Bibby Scientific Ltd., Stone, Staffordshire, UK) [34]. Exchangeable potassium (K) and sodium (Na) were measured by flame photometry (Jenway PFP7, Jenway, Felsted, UK) after extraction with 1 M ammonium acetate at pH 7 (Sigma, Sigma-Aldrich, St. Louis, MO, USA). Cation [30]. The determination of chlorides (Cl) in soil was conducted using a colorimetric method. This analysis involves extracting chloride ions from the soil with a saline solution. The extracted sample is then mixed with a silver nitrate (AgNO3) solution, resulting in the formation of silver chloride precipitate. The concentration of chlorides is determined by measuring the intensity of the resulting color at a specific wavelength. Exchangeable calcium (Ca) and magnesium (Mg) were quantified by atomic absorption spectrophotometry using a novAA 800 D analyzer (Analytik Jena, Jena, Germany) [31]. The titration is performed using complexometric titration with ethylenediaminetetraacetic acid (EDTA) (Sigma, Sigma-Aldrich, St. Louis, MO, USA). The soil is first treated with a buffered EDTA solution at pH 10. Subsequently, the solution is titrated with a standard EDTA solution, which allows for the determination of the concentrations of these cations.

2.7.2. Physiological and Biochemical Assessment

Assessments were carried out throughout the various developmental stages of durum wheat, including tillering, stem elongation, heading, and maturation, both on soil S1 (sandy) and S2 (clay). For growth parameters, plant height was measured using a graduated ruler, ensuring that the ruler was positioned vertically alongside each plant to achieve precise measurements. The height was recorded from the base of the stem to the tip of the highest leaf on three representative plants per pot, providing a reliable average. Additionally, the total number of leaves was counted on the same plants used for height measurement, with manual counting performed at each vegetative stage to ensure data accuracy. Regarding physiological parameters, chlorophyll fluorescence was assessed using a Fluorimeter model 15–30. The leaves were collected, cleaned, and dark-adapted for 30 min prior to measurement to allow the stabilization of fluorescence levels. The fluorimeter was calibrated according to the manufacturer’s instructions before each series of measurements. Each leaf was placed in the sample holder of the fluorimeter, where the device excited chlorophyll a with specific light and measured the emitted fluorescence.

2.7.3. Yield Component Analysis

At the end of the trial, at maturity stage, a detailed evaluation of durum wheat yield components was conducted to assess key characteristics related to grain production. The following procedures were followed to ensure the precision and reliability of the measurements: the wheat ears were manually harvested at maturity, taking care not to damage the grains. Following harvest, the ears were thoroughly cleaned to remove debris and impurities. The grains extracted from the ears were then dried in an oven at 105 °C for 45 min. This drying process was crucial to remove residual moisture from the grains, ensuring that weight measurements were not affected by water content. Uniform drying at 105 °C for 45 min is a standard method to obtain accurate measurements of dry grain mass, allowing for reliable yield assessment. After drying, a sample of 200 grains was taken from each batch and weighed using a precision balance (Ohaus, Parsippany, NJ, USA) to determine their mass. The total mass of grains extracted from the ears was also measured with this precision balance, which is essential for calculating the overall grain yield for each plot. The grains were then counted using a grain counter (Numigral, Villeneuve-la-Garenne Cedex, France) to determine the total number of grains in each sample with precision. The straw yield was assessed by measuring the total mass of straw separated from the ears after harvest, using the same precision balance to ensure consistency in the measurements. The planting density was calculated according to the following formula:
Planting   Density   = Total   surface   area   in   hectares Total   number   of   plants
where the total number of plants is 250 per hectare, and each planting pot has an area of 0.04 m.

2.8. Data Analysis

A 2- or 3-factor analysis of variance (ANOVA) was conducted to examine the means for the two soil types, five salinity levels, and four sampling periods, along with their interactions. ANOVA was applied to soil physicochemical parameters, growth parameters, chlorophyll a content, and yield components. All tests were performed with a significance threshold of 0.05. In the event of significant differences, Duncan’s post hoc test was used to identify differing groups and to conduct pairwise comparisons. Correlation analyses and linear regressions were performed to explore the nature of correlations between soil chemical variables and salinity levels, as well as between yield components and salinity levels. All statistical analyses were carried out using SPSS software version 25.

3. Results and Discussion

3.1. Soil Laboratory Results

Soil characterization prior to experimentation is an essential step in understanding the physicochemical properties of the soils. The results obtained will serve as a baseline for adequately assessing the changes induced during experimentation due to the effects of the treatments. However, the granulometric analysis and physicochemical characterization of the soils tested in the follow-up trial are shown in Table 2. They showed that the S1 soil has a high proportion of clay, reaching 52.6%, with a relatively low sand content of 13.1%. The silt level is around 34.3%. This indicates that S1 has a silty-clay texture. In contrast, S2 shows a notably high sand content, reaching 87.6%. However, the silt + clay fractions are less abundant in the soil, at 6.4 and 6%, respectively, indicating a sandy texture.
In addition, both soil types exhibit alkaline pH levels, specifically 7.80 for S1 and 8.40 for S2, indicating their non-saline nature [35,36]. The results show a salinity of 0.20 and 0.51 dS m−1 for S1 and S2, respectively. These values indicate that both soils have low salinity, which is considered suitable for agriculture, as previously noted by Richards [37]. In terms of organic matter (OM), the results indicate that the soil organic matter content is 1.33 and 1.18% for S1 and S2, respectively, classifying both soils as having low organic matter levels [38].
Overall, the results presented in Table 1 indicate that the soil samples exhibited very low cation exchange capacity (CEC). For soil S1, the CEC is 0.65 cmol kg−1, and for soil S2 it is 0.40 cmol kg−1, according to the classification by Hazelton and Murphy [39]. These CEC values are well below the range of 1.34 to 3.11 cmol kg−1, reflecting a very low capacity for retaining and exchanging essential cations for plant nutrition. The soils have high phosphorus concentrations, particularly for S2, which does not require phosphate fertilization. K2O content is high in both soils, indicating that they contain an adequate amount of potassium available to plants. Concerning total nitrogen, soil analyses revealed a low nitrogen concentration, 0.078 and 0.024 % for S1 and S2, respectively, requiring the use of nitrogen fertilizers according to Kjeldahl nitrogen interpretation standards [40]. The exchangeable potassium values are 229 mg kg−1 for S1 and 325 mg kg−1 for S2. According to the classification by Baruah and Barthakur [41], both soils are classified as having high potassium concentrations, suggesting an ample supply of potassium for plant growth and agricultural productivity. The analysis of Na, Ca, Mg, and Cl concentrations reveals that the levels are relatively low.

3.2. Effect of Salt Stress on the Germination Dynamics of Durum Wheat

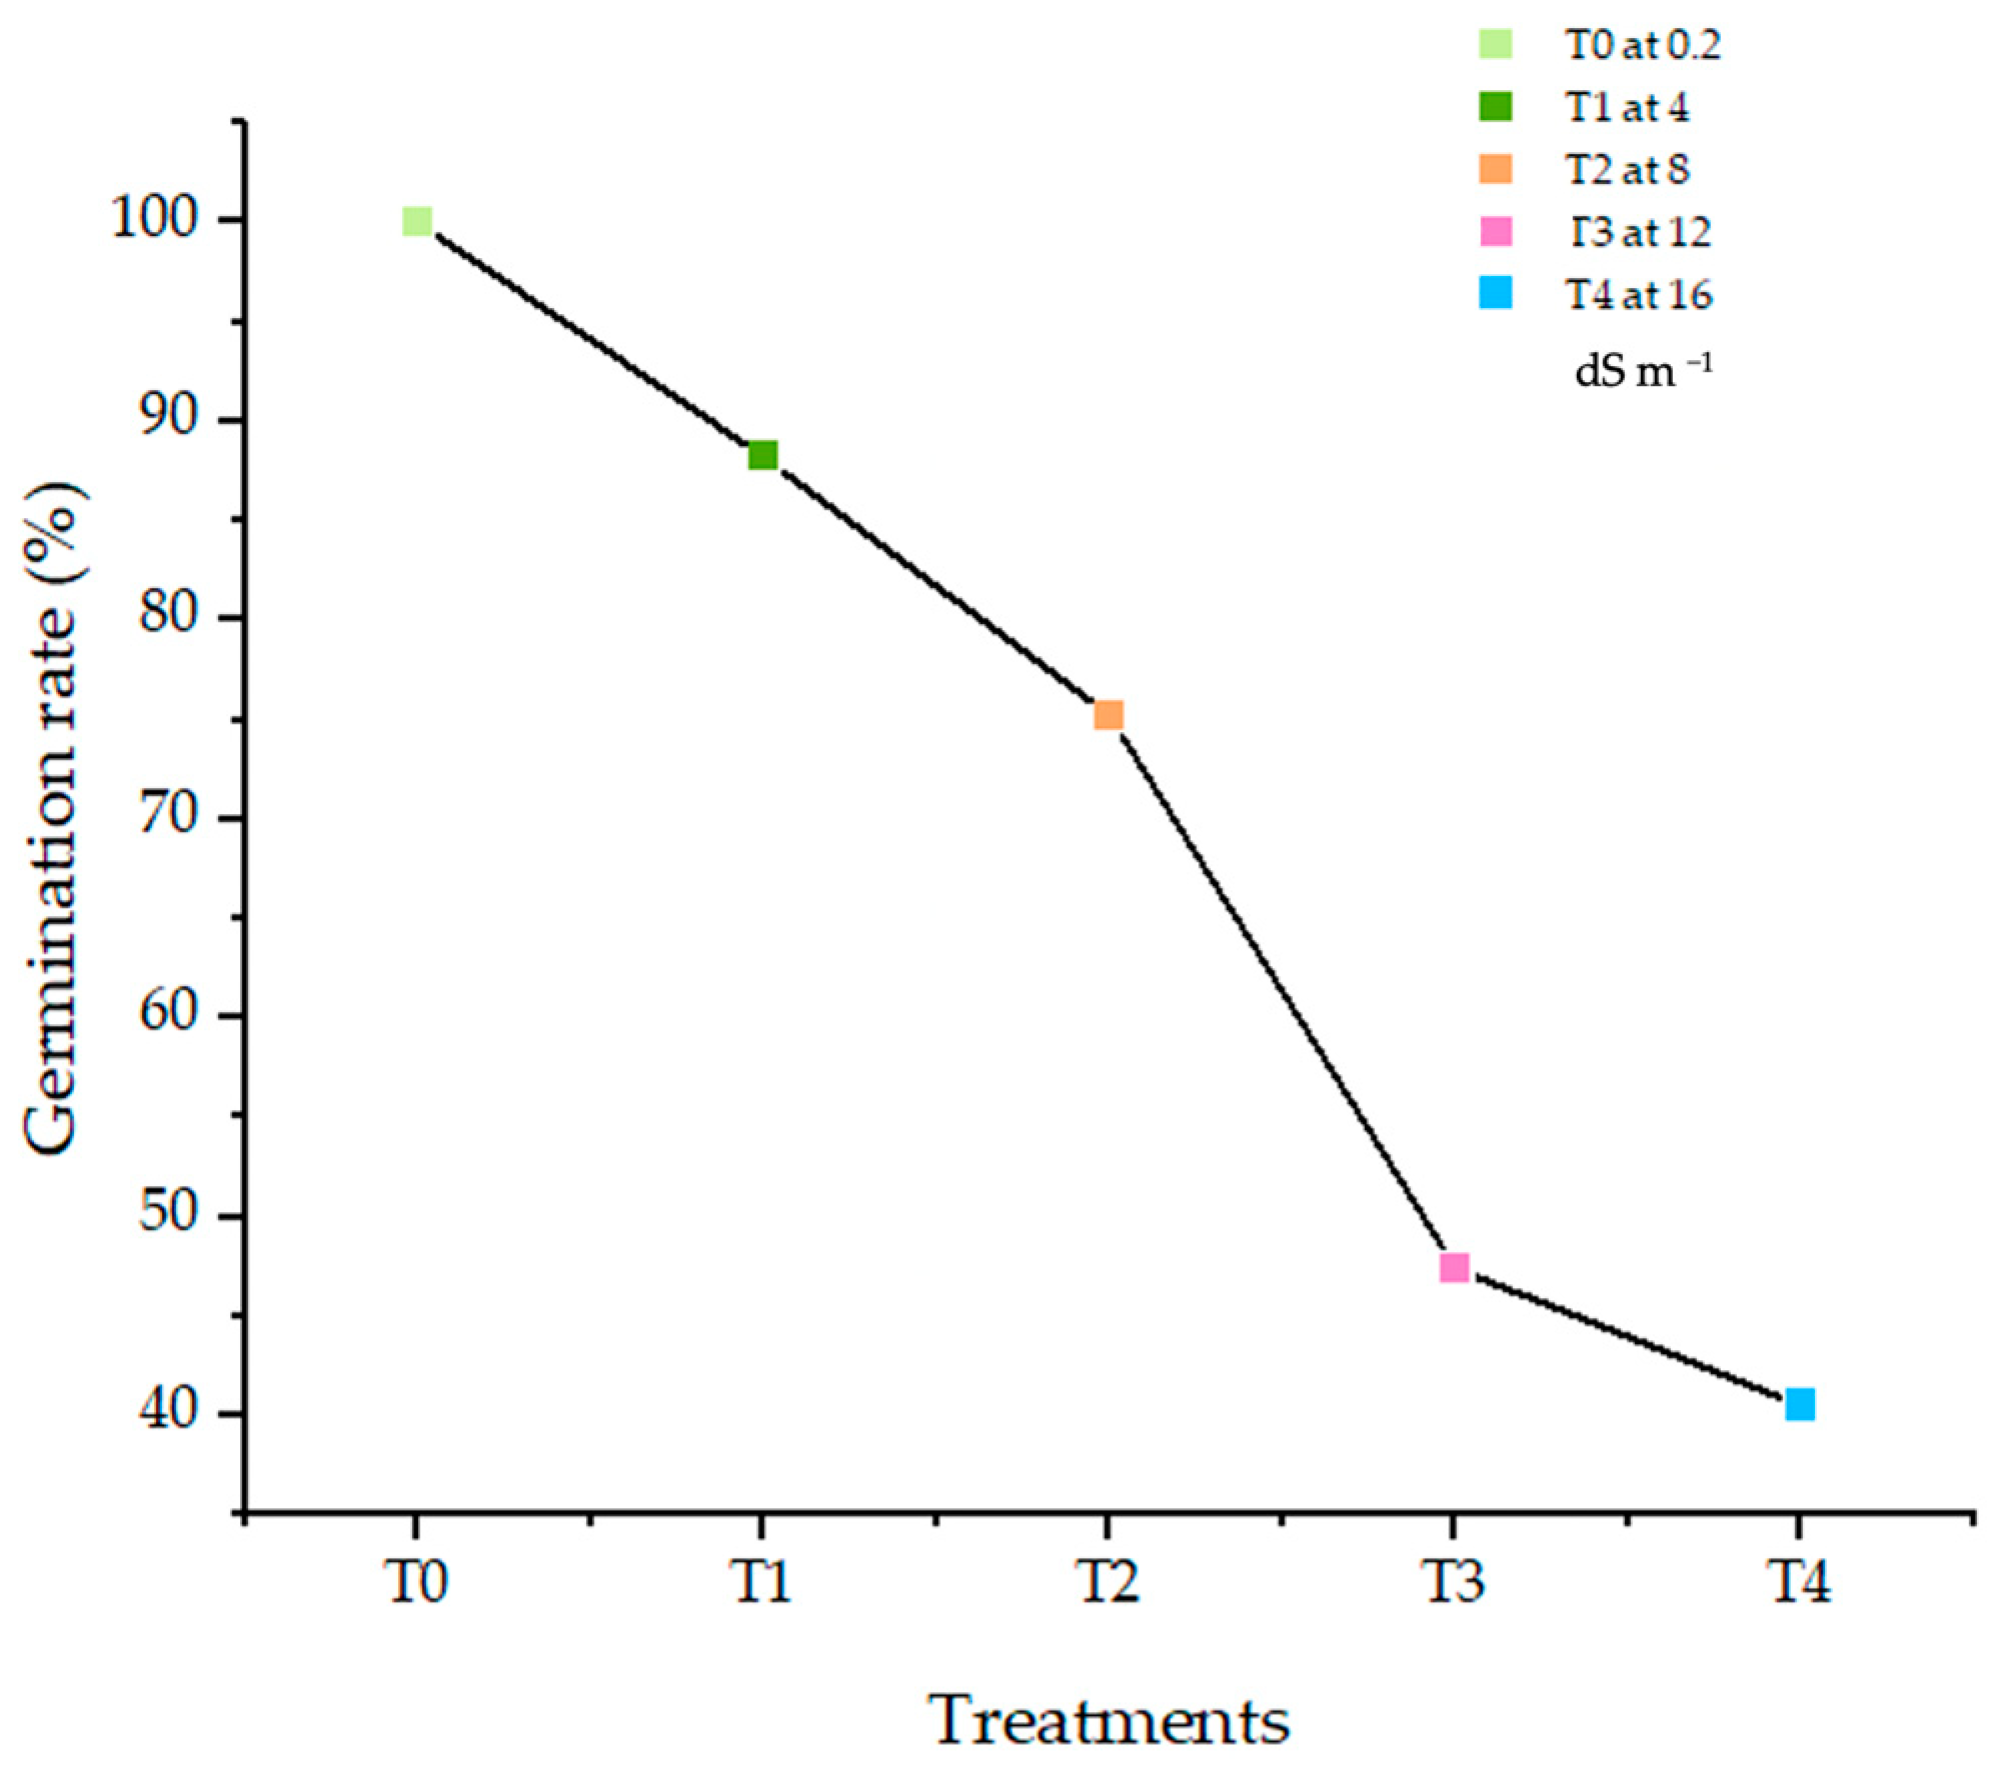
The results show a progressive decrease in the germination percentage of durum wheat seeds with increasing salinity levels (Figure 2): 98.7% at a salinity level of T0 (freshwater), and to 88.2, 75.2, 47.4, and 40.5% at 4, 8, 12, and 16 dS m−1, respectively. At 4 dS m−1, germination decreased slightly by 10.5% compared with the control, indicating moderate tolerance. At 8 dS m−1, although the reduction was more marked at 23.5%, the variety still appeared tolerant, with over 75% of seeds germinating, showing a notable ability to withstand salt stress. However, at higher salinity levels of 12 and 16 dS m−1, the decreases were significant, with reductions of 52% and 59%, respectively, showing that these salinity levels are highly stressful for the variety tested. These results suggest that the Faraj wheat variety tested has some salt tolerance up to 8 dS m−1, but shows increased sensitivity at higher salinity levels.
In previous research, work on eight durum wheat cultivars using NaCl concentrations ranging from 0 to 15.62 dS m−1 revealed that salinity delays germination and significantly reduces germination capacity. At low salinity levels, around 3.2 dS m−1, the osmotic effect predominates. This osmotic effect reduces water availability to the plants, limiting their ability to absorb water, which can hinder germination and early growth [42]. As salinity levels increase, particularly around 6.4 dS m−1 and 9.6 dS m−1, toxic effects become more dominant. These toxic effects arise from the accumulation of sodium and chloride ions in plant tissues, which can disrupt cellular functions and cause physiological damage.
Kandil et al. [43] observed a delay in sorghum seed germination, more pronounced in salt-sensitive accessions than in intermediate and salt-tolerant ones. Similarly, Chauhan et al. [44] noted that an increase in salt concentration reduced key parameters such as germination rate, root length, shoot length, and seedling biomass of sorghum cultivars at electrical conductivity ≥ 10 dS m−1, with these responses varying depending on the genotype.
Cereals, in general, show moderate tolerance to salinity, although this may vary according to vegetative development stages [45]. The germination stage is particularly sensitive to salinity, necessitating low soil electrical conductivity values to ensure successful seedling development [46]. Furthermore, studies have reported that the increase in salt concentration, as well as the degree of reduction, varied according to salinity levels and sorghum genotypes. A remarkable reduction in germination percentage was observed at higher salinity levels, ranging from 4 to 16 dS m−1, compared with the control. This finding aligns with previous studies on sorghum, which also demonstrated that low salinity (2 dS m−1) did not significantly impact germination, while higher levels (4, 8, and 16 dS m−1) markedly inhibited seed germination [47]. In addition, sodium ions have a toxic effect on seed germination, delaying and reducing the final germination percentage, as observed in cowpea [48]. This sensitivity of germination to soil salinity is confirmed by other studies, underlining the importance of selecting varieties adapted to such environmental conditions. High salt concentrations increase osmotic pressure in the soil, slowing down imbibition and limiting the water uptake required to initiate metabolic processes linked to germination [49,50].

3.3. Effect of Salt Stress on the Chemical Parameters of the Soil

Analysis of variance (ANOVA) results (Table 3) revealed a highly significant difference between the two soil types regarding pH (p-value < 0.001), with S2 exhibiting a higher mean value (7.9) compared to S1 (7.6).
There was also a highly significant difference observed among the five salinity levels (p-value < 0.001), with the highest mean values recorded at T4 = 16 dS m−1 (8.5 and 8.1 at S1 and S2, respectively), contrasting with the control (7.2 and 7.5). Regarding electrical conductivity (EC), the results indicated a significant interaction between the two factors, soil type and salinity level (p-value < 0.01), suggesting that soil EC increases with salinity stress intensity, but differently for the two soil types. Indeed, under control conditions (T0 = 0.2 dS m−1), the EC was higher for S2 (2.7 dS m−1) compared to S1 (1.3 dS m−1), while under high salinity (T4 = 16 dS m−1) soil S2 recorded a slightly higher average EC of 11.3 dS m−1 compared to S1 (10.9 dS m−1) (Table 4).
Initially, the rise in salt concentration resulted in a slight increase in soil pH. Łuczak et al. [51] have noted that elevated concentrations of sodium and chloride ions can elevate soil pH, potentially impeding the uptake of essential nutrients such as phosphate, iron, and zinc, thereby affecting plant growth negatively. On the contrary, the EC results are consistent with those reported by [52], who observed higher electrical conductivity values with increasing salt concentration in the treatment water. Additionally, the presence of soluble salts in the soil, especially sodium salts, is recognized as a contributing factor to poor soil fertility, aligning with the findings of [53].
As for potassium (K), calcium (Ca), and magnesium (Mg) concentrations, ANOVA indicated a highly significant interaction between soil types and salinity levels (p-value < 0. 001, p-value < 0.001, and p-value < 0.001), respectively, for K, Ca, and Mg, with the highest mean values observed at the highest salinity level (T4 = 16 dS m−1). These results suggest that this increase could be attributed to limited uptake of these essential cations by plants, leading to their accumulation in the soil.
In addition, it is widely recognized that elevated levels of sodium (Na) and chloride (Cl) ions in the growing medium lead to competition for K and Ca uptake sites [54]. However, ionic uptake capacity, a genetically determined characteristic, shows significant variation between species and varieties, according to the findings of [55]. In plants, particularly cereals, maintaining adequate K and Na selectivity in tissues can be considered an indicator of salt tolerance. Several studies have looked at the relationship between K and Na selectivity, and salt tolerance ability [56].

3.4. Relationship Between Salinity and Chemical Parameters

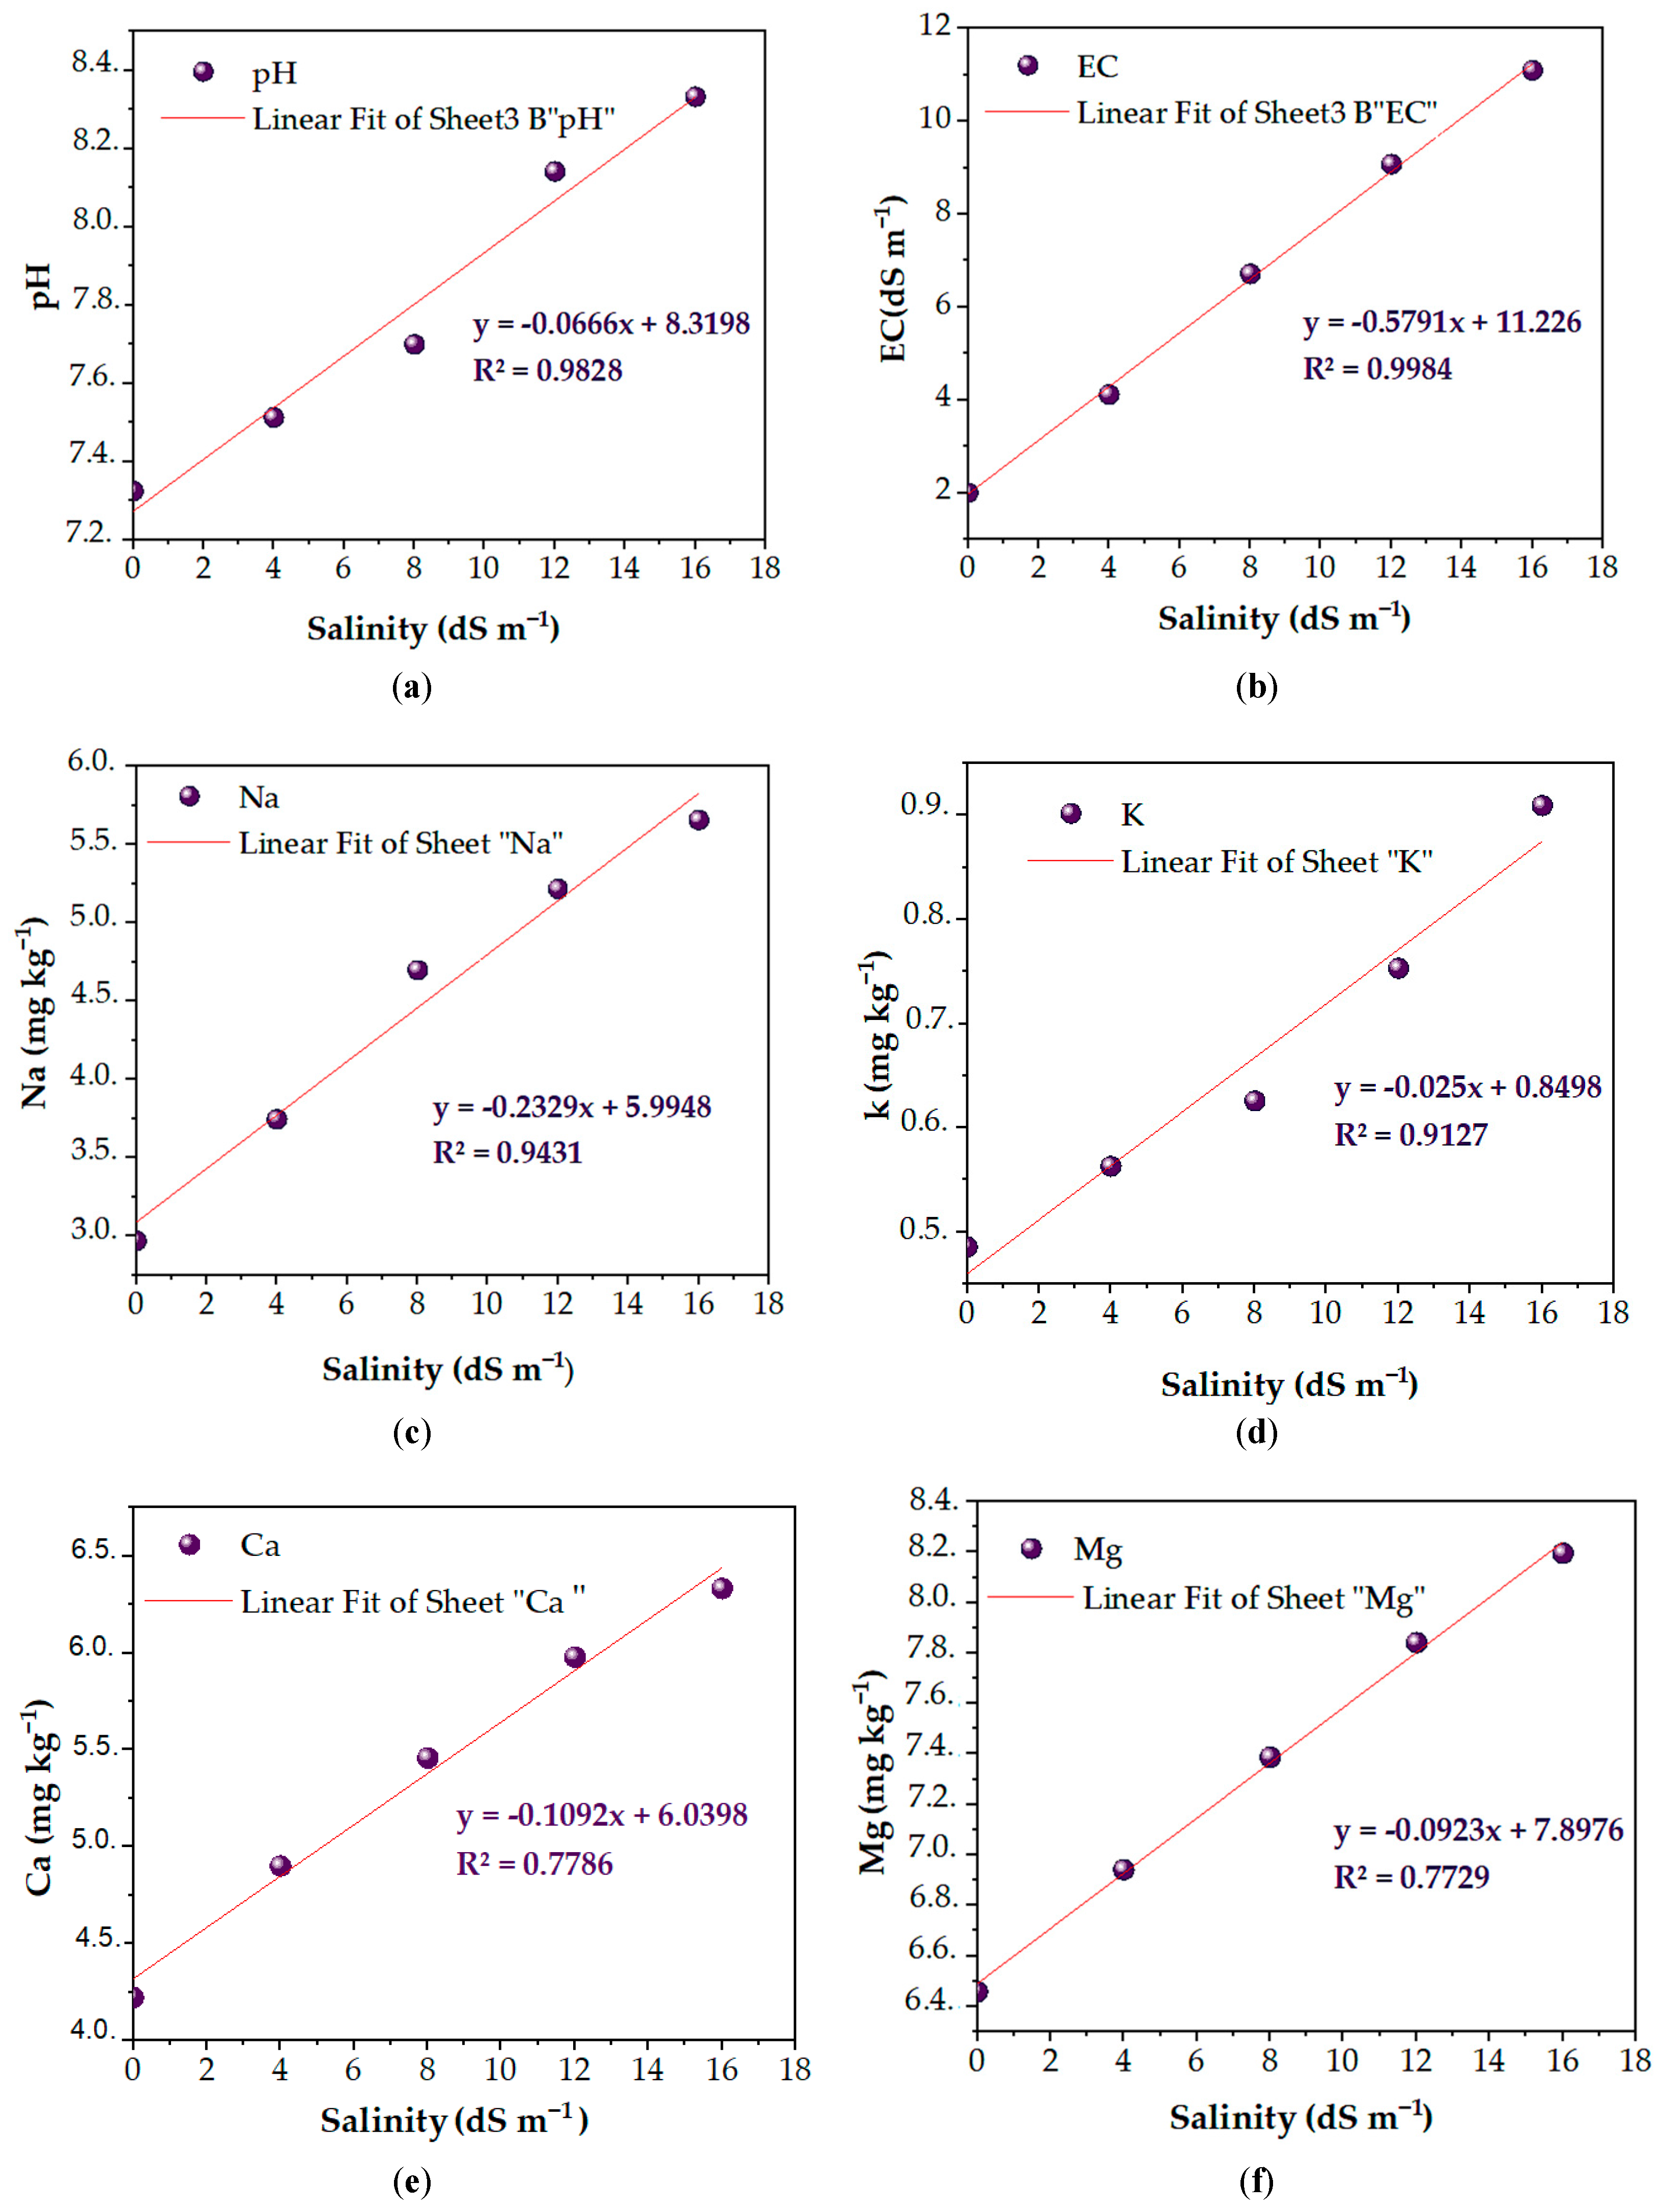
According to the regression graphs (Figure 3), a positive correlation was recorded between pH and salinity, with a determination coefficient of 0.98. This suggests that, as salinity levels increase, soil pH also tends to increase. These results are in line with those obtained by Rao et al. [57], who studied the impact of salinity on soil pH in arid zones. Their results revealed a positive correlation between soil salinity and alkalinity (pH increase) in highly saline areas. This increase in pH was explained by the substitution of sodium ions (Na) in soil exchange sites, thus reducing soil acidity.
A positive correlation was established between electrical conductivity (EC) and salinity, with a high determination coefficient of 0.99. Salinity also showed a positive correlation with Na. Several previous studies on salinity, including the work of Bohn et al. [58], as well as that of Sritongon et al. [59], have shown that sodium concentration (Na) and EC increase proportionally with increasing salt dose. These studies confirmed that the increasing addition of NaCl salts to soils simultaneously leads to a significant rise in Na concentration and EC parameters. In addition, K, Na, Ca, and Mg concentrations show a proportional increase with increasing soil salinity, confirmed by positive determination coefficients of 0.91, 0.70, and 0.77, respectively. However, plant responses to salinity can vary according to various factors, including wheat variety-specific tolerance, soil characteristics, and environmental conditions. The increase in these cations essential for plant growth could be explained by ion exchange reactions in the soil, where Na may compete with these cations essential for plant growth for cation exchange sites in the soil, thus preventing their uptake by plant roots and consequent accumulation in the soil [60].

3.5. Effect of Salt Levels on Growth Parameters and Photosynthetic Efficiency

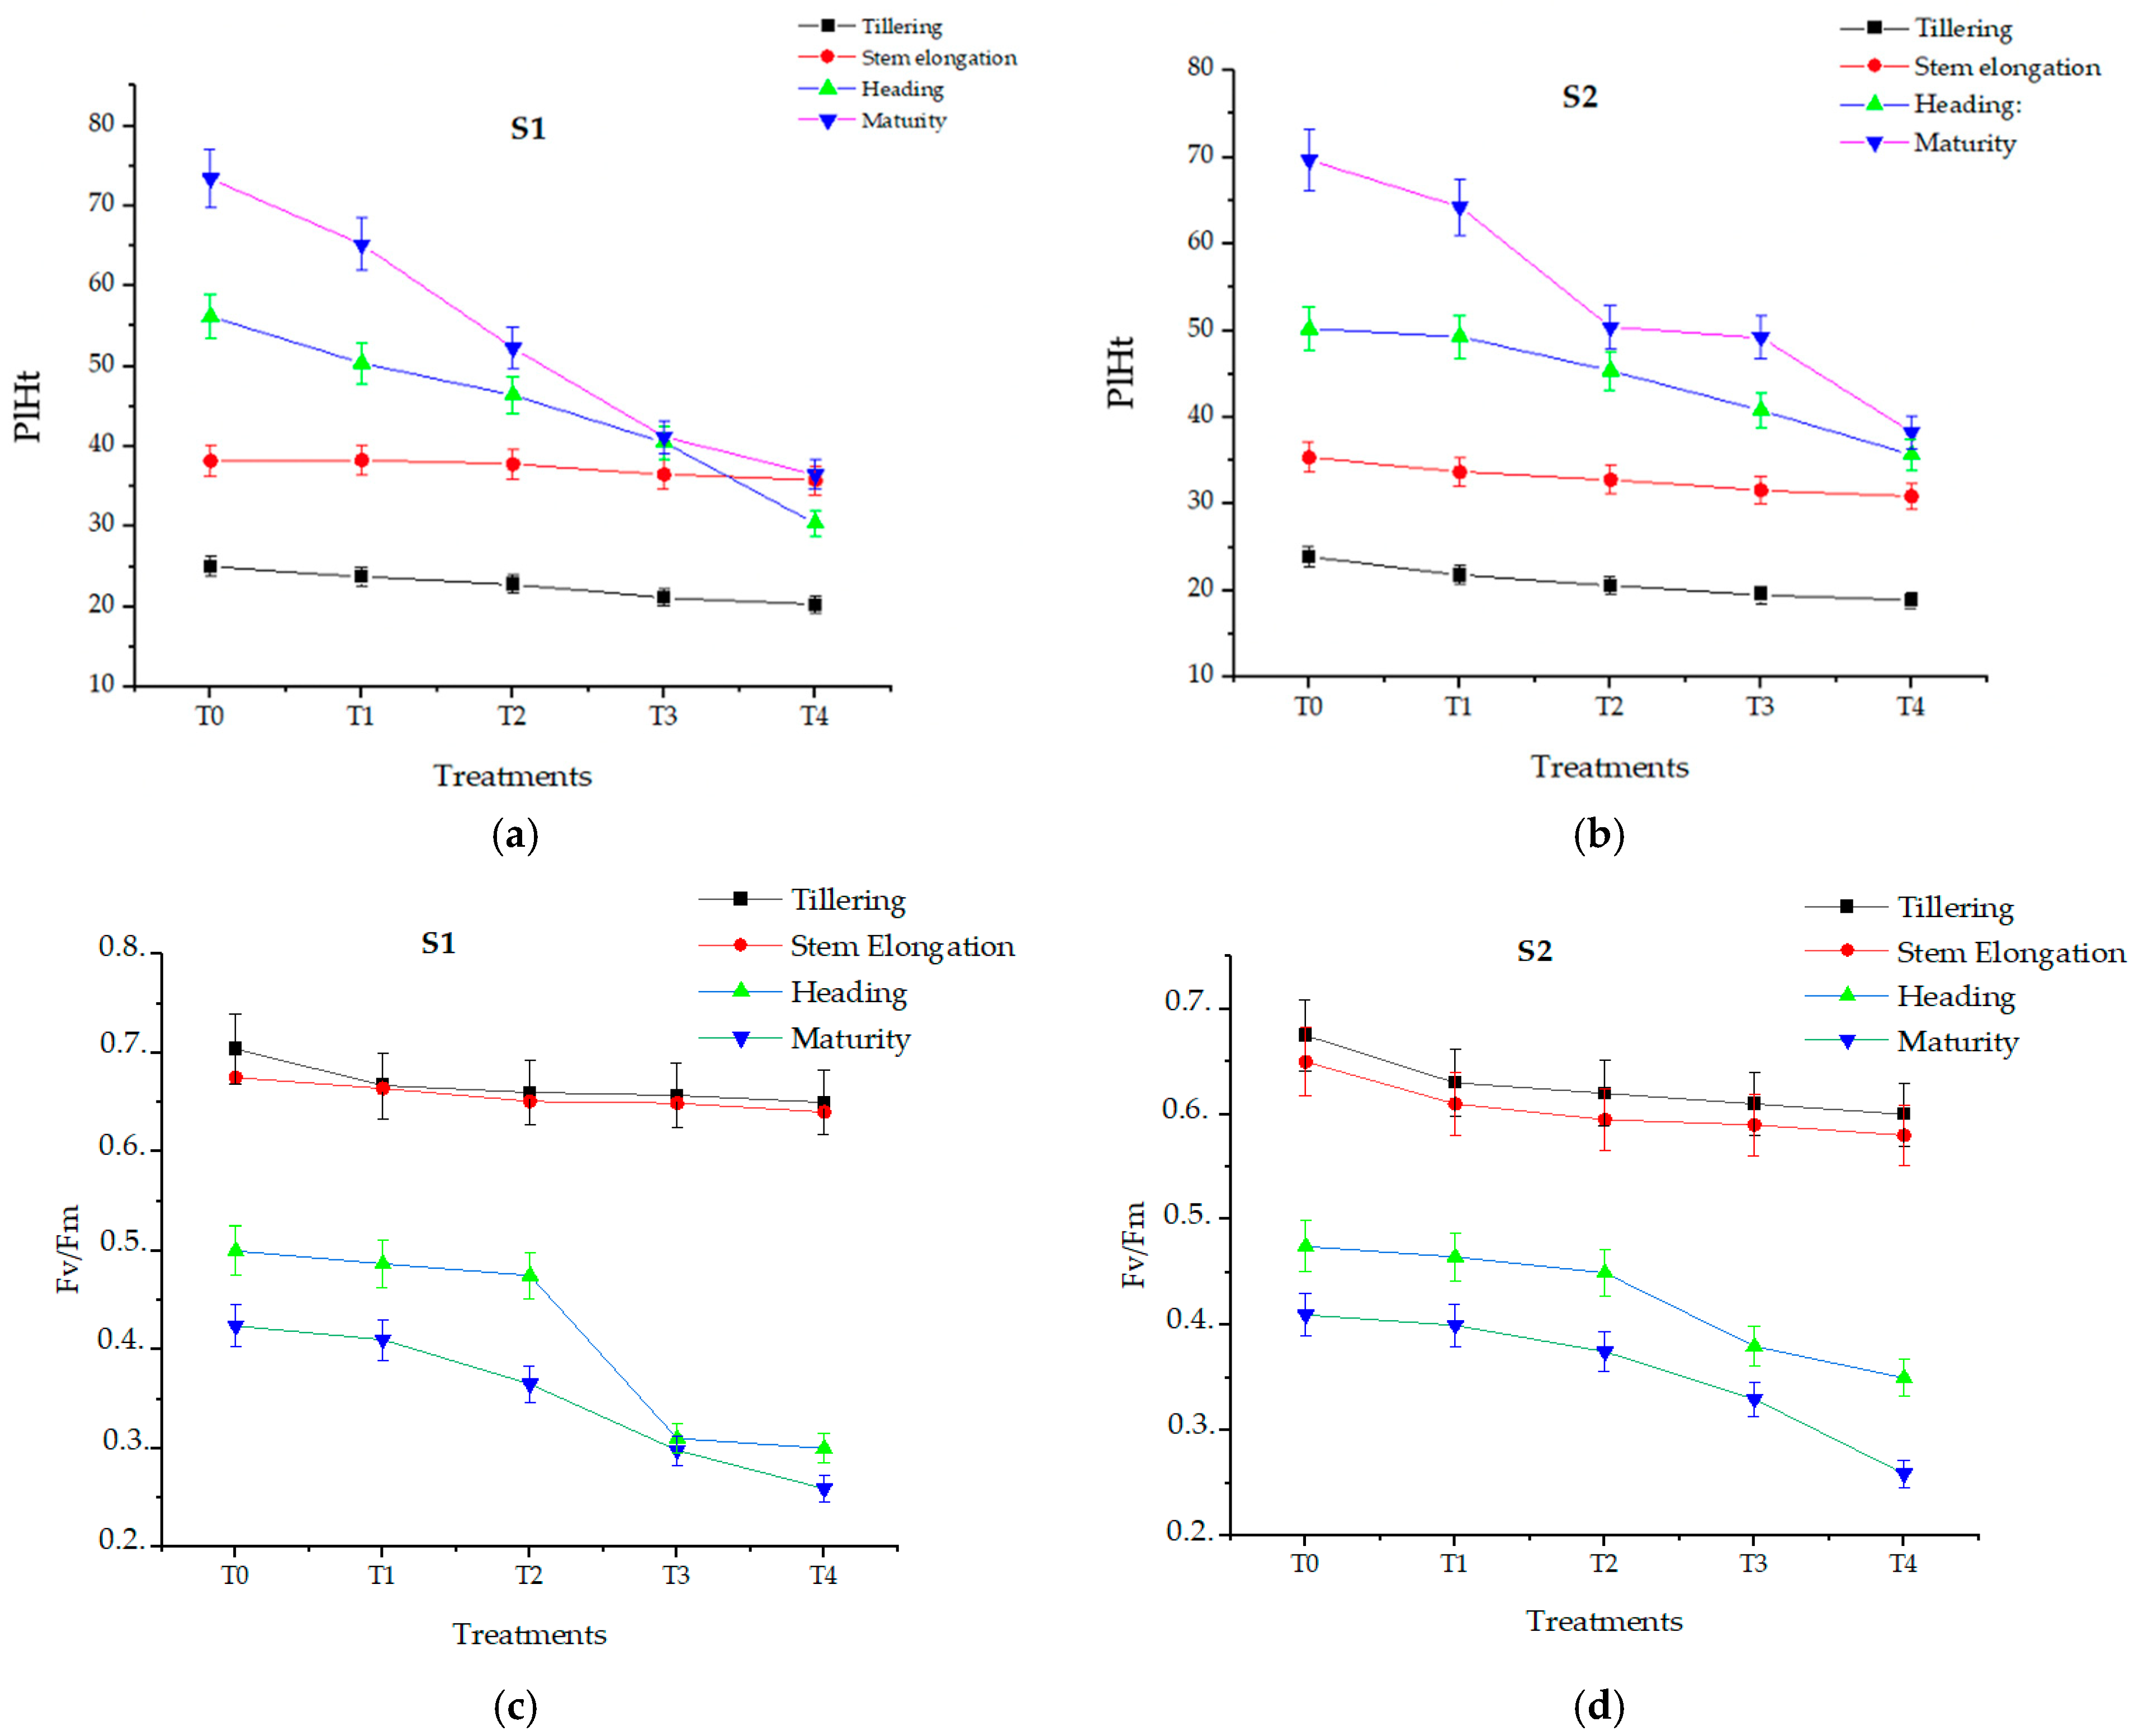
The increased intensity of salt stress at different growth stages leads to a progressive decrease in plant height at S1 and S2 (Figure 4). The tallest plant heights were observed in the control plants at T0, measuring 25.00 ± 0.02 cm at the booting stage and reaching a maximum average value of 73 ± 0.04 cm at the maturation stage for S1. In contrast, for S2, heights at T0 ranged from 23.00 ± 0.09 cm at the booting stage to a maximum of 69.00 ± 0.07 cm at the maturation stage. Despite applying increasing doses of NaCl, a slight stability in height was observed at the booting and stem elongation stages compared to the control. Heights at high salinity (16 dS m−1) were 20.00 ± 0.03 cm and 35.00 ± 0.08 cm, respectively, for S1. However, a decline in height growth was observed at the heading and maturation stages, recording heights of up to 36.00 ± 0.05 cm and 30.00 ± 0.04 cm at a salinity level of 16 dS m−1 for S1.
The significant reduction in plant height under increasing salt stress aligns with observations from [61], who recorded a marked decrease in plant height with higher salinity levels. This reduction is also supported by the findings of Xu et al. [62], who observed a significant decrease in plant height in response to increasing salinity across various plant species. These results underscore the critical role of salt stress in modulating plant height.
According to Lu et al. [63], the effect of salinity on plant height is primarily due to the osmotic action of dissolved salts in the soil, which disrupts water absorption by the roots and induces water stress. This stress alters the availability of water necessary for essential physiological processes, leading to reduced turgor pressure, diminished cell expansion, and ultimately decreased plant height. Their research highlights how salinity induced osmotic stress impairs water uptake and metabolic functions, affecting growth and yield. Similarly, Koyro [64] found that salinity affects various physiological processes, including growth, photosynthesis, and water relations in Plantago coronopus, demonstrating that salt stress significantly reduces plant height and productivity. These findings align with our study, which provides further insights into the impact of salt stress on chlorophyll concentration and overall plant performance. Together, these studies contribute to a deeper understanding of the mechanisms through which salt stress influences plant growth and yield.
Chlorophyll fluorescence was notably high in control plants, particularly at the tillering and jointing stages in the first soil type, S1, with values of 0.704 and 0.675 Fv/Fm, respectively. However, the variety demonstrated sensitivity to salinity at the heading and maturation stages (Figure 4). Irrigation with NaCl-rich water (12 and 16 dS m−1) resulted in a significant decrease in chlorophyll fluorescence (Fv/Fm), with values dropping from 0.500 Fv/Fm in the control group to 0.310 Fv/Fm at 16 dS m−1 during the ear stage for S1. At the maturation stage, chlorophyll fluorescence decreased further, reaching 0.298 and 0.259 Fv/Fm for S1 and S2, respectively, at the highest NaCl concentration.
The reduction in chlorophyll fluorescence parameter (Fv/Fm ratio) observed under high salinity aligns with findings from studies on various plant species, including sweet pepper plants. Research indicates that increased salinity levels lead to significant decreases in the Fv/Fm ratio, suggesting a decline in photosynthetic efficiency [65], and the research also noted a significant decrease due to salt stress. This decrease is corroborated by the work of [66], which attributes it to increased oxidation and degradation of chlorophyll caused by reactive oxygen species (ROS). Furthermore, these observations support the findings of [67,68], which demonstrated that high concentrations of NaCl cause severe damage to chloroplast structures and the photosynthetic apparatus, leading to a reduction in chlorophyll fluorescence. The decrease in this parameter observed in lettuce seedlings under elevated saline conditions reflects these findings, as major changes in chlorophyll fluorescence and other growth parameters have been reported [69]. This decline in chlorophyll a is also aligned with the results of [70], where the accumulation of saline ions inhibits the activity of enzymes crucial for nitrogen assimilation, which is essential for chlorophyll synthesis. This suggests that the effects observed are generally applicable across different plant species and saline conditions.
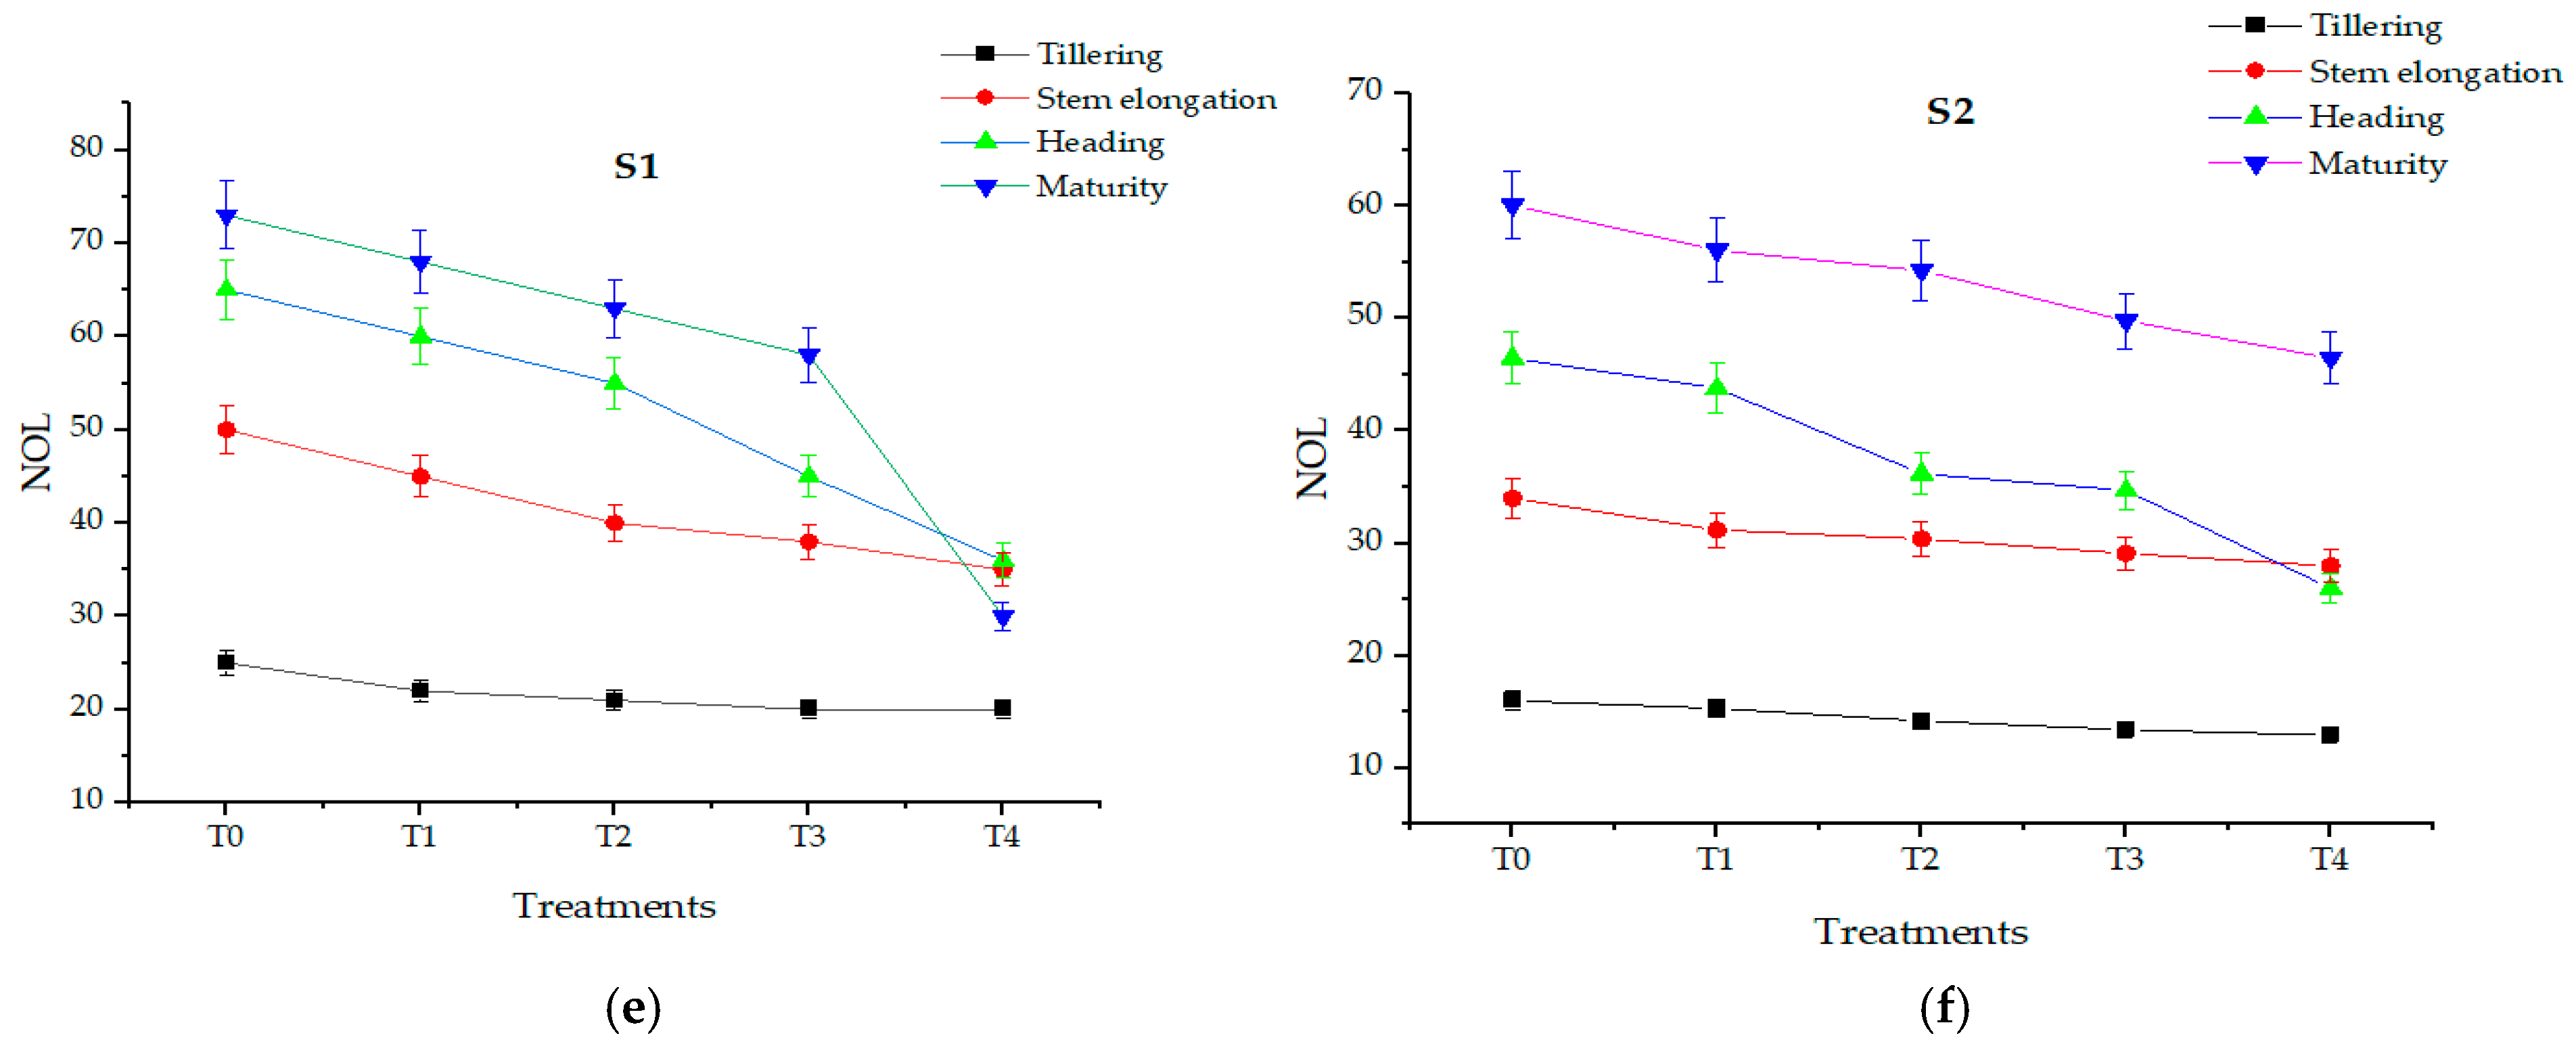
The number of leaves per plant was inversely proportional to salt concentration, with fewer leaves observed in S2 compared to S1. Under control conditions, the number of leaves increased to 35.00 ± 0.66 per plant at week 7, reaching a maximum of 62.00 ± 0.33 leaves per plant at grain maturation for S1. In S2, the leaf count was 34.00 ± 0.60 per plant at week 7, reaching a maximum of 60.00 ± 0.01 at maturity. At the highest NaCl concentration (16 dS m−1), the number of leaves decreased to 47.00 ± 0.05 for S1 and 46.00 ± 0.33 for S2 at maturity.
The decrease in the number of leaves with increasing salinity is consistent with findings from previous studies, which have shown that the increase in osmotic pressure due to NaCl leads to a reduction in leaf number [71]. The results of this study demonstrate a significant reduction in chlorophyll fluorescence, particularly in the Fv/Fm ratio, as NaCl concentrations increase, indicating degradation of photosystem II (PSII) [72]. This decline directly reflects the damage to photosynthetic efficiency, a phenomenon commonly observed under severe salt stress. Such stress impairs the plant’s ability to effectively capture and convert light energy into chemical energy, which negatively impacts both growth and productivity [73]. Research on other crops, particularly rice, has shown similar effects, where significant changes in photosynthetic performance have been observed under high salinity conditions [66]. These alterations lead to reduced energy efficiency, directly affecting ATP production and photophosphorylation. In addition to these photosynthetic impacts, the reduction in plant growth can be primarily attributed to the accumulation of Na+ and Cl ions in plant tissues. This accumulation disrupts the nutritional balance by hindering the uptake of essential nutrients such as Ca2+, Mg2+, and K+ due to mineral substitution or competition at membrane uptake sites [74,75]. The resulting imbalance exacerbates the negative effects on plant growth and productivity, as these nutrients are critical for maintaining cellular functions and metabolic processes.
Furthermore, studies on plant proteins under salt stress reveal significant modulation of stress response proteins, which are crucial for protecting cellular membranes and repairing oxidative damage [76]. These defense mechanisms are vital for plant survival in saline environments, particularly in crops like rice and wheat, where sustaining growth under such conditions is essential for productivity. The ability of plants to regulate protein expression in response to salt stress underscores the importance of adaptive mechanisms that enable survival in harsh conditions. Understanding these mechanisms opens the door to potential strategies for improving salinity tolerance through breeding and biotechnological advancements, ultimately enhancing agricultural resilience in salt-affected regions.
This reduction in growth is primarily attributed to the accumulation of Na and Cl ions in plant tissues, which disrupts the nutritional balance by affecting the uptake of essential nutrients such as Ca, Mg, and K due to mineral substitution or competition at membrane uptake sites [77,78]. Salt stress induces a range of physiological disruptions in plants. It affects the normal functioning of ion channels, leading to imbalances in ionic homeostasis. Consequently, essential nutrients may be substituted with less beneficial or even toxic ions. Additionally, salt stress causes membrane depolarization, which disrupts cellular function and integrity. These disturbances in ion balance and membrane potential impair the plant’s ability to uptake and assimilate nutrients effectively, ultimately affecting its overall growth and health [79,80].

3.6. Yield Parameters and Salt Tolerance Threshold of the Variety

The results of the analysis of the interaction between soil type and salinity levels on straw yield and grain yield, grain yield, and the weight of 200 grains indicate notable variations in yields depending on the different salinity conditions for each soil type (Table 5 and Table 6). For straw yield, the results highlighted that the interaction between soil type and salinity levels has a significant impact, as indicated by the results with a p-value of 0.005 (Table 6). ANOVA revealed a significant difference between the two studied factors (soil type and 5 salinity levels). Duncan’s post hoc test also identified four distinct groups, showing significant variations between salinity levels and soil types. At T0, the straw yield was higher for S1 (1.24 t ha−1) compared to S2 (1.16 t ha−1). Conversely, at a salinity level of 16 dS m−1, the lowest straw yield was recorded for S2 (0.20 t ha−1) compared to S1 (0.55 t ha−1). It is also noteworthy that the straw yield remains relatively high at a salinity level of 12 dS m−1, particularly for S1 (0.80 t ha−1). Regarding grain yield, there was no significant difference between S1 and S2 (p-value = 0.250), but the yield decreased significantly with increasing salinity levels (p-value = 0.001). For S1, the highest grain yield was observed at T0 (1.12 t ha−1) and the lowest at 16 dS m−1 (0.16 t ha−1). In contrast, for S2, the yields were 0.12 t ha−1 at T0 and 0.56 t ha−1 at 16 dS m−1. For the weight of 200-grain, ANOVA also revealed a significant difference (p-value = 0.001). Duncan’s test identified four distinct groups, highlighting notable variations between salinity levels and soil types. At T0, soil S1 produced heavier grains (67 g) compared to soil S2 (63.6 g). However, the grain weight significantly decreased at 16 dS m−1 for both soil types, reaching 11.6 g for S1 and 7.3 g for S2.
Several studies conducted on wheat varieties globally have demonstrated the negative impact of salinity on grain production, germination rate, and overall biological growth [81,82]. However, this effect varies depending on stress intensity and the specific wheat variety. In comparison to these studies, the Faraj variety stands out for its remarkable tolerance to salinity. While other varieties show significant reductions in yield and quality under similar salinity levels, Faraj maintains straw production up to 12 dS m−1 and grain yield up to 8 dS m−1. This ability to maintain agricultural performance even under high salinity stress highlights Faraj’s superiority over other varieties and underscores its potential for salinity-prone areas, offering a valuable option for farmers in these regions.
Cereals, in general, have a moderate tolerance to salinity, although this can vary according to the stage of vegetative development [83]. It is well known that the germination stage is particularly sensitive to salinity, requiring soil electrical conductivity levels of no more than 4 dS m−1 [84]. Furthermore, studies such as those by Abbas et al. [85] have highlighted the fact that sodium chloride-induced disturbances lead to a significant reduction in the number of filling sites, thus affecting wheat grain yield and quality deterioration, especially at a salinity of 15 dS m−1. Similarly, other research has mentioned that during the onset and development of salt stress within a plant, all major processes such as photosynthesis, protein synthesis, energy production, and lipid metabolism are affected [86]. The deterioration of these processes led to a decrease in yield and deterioration in wheat grain quality due to salinity in our study.
On the other hand, differences in soil type between S1 and S2 explain the variations in yield and quality observed. The data collected showed that the clayey soil in S1 produced higher yields and higher yield components than the sandy soil in S2. Plants grown in the clayey soil produced a higher number of grains per ear and a higher grain weight. This significant difference can be attributed to the clayey soil’s greater capacity to retain water and reduce the concentration of salts in the root zone, thus offering greater resistance to salt stress. These results underline the importance of soil type in crop response to salt stress, with clayey soil offering more favorable conditions for growing wheat in saline environments [87].

3.7. Relationship Between Salinity and Various Yield Components

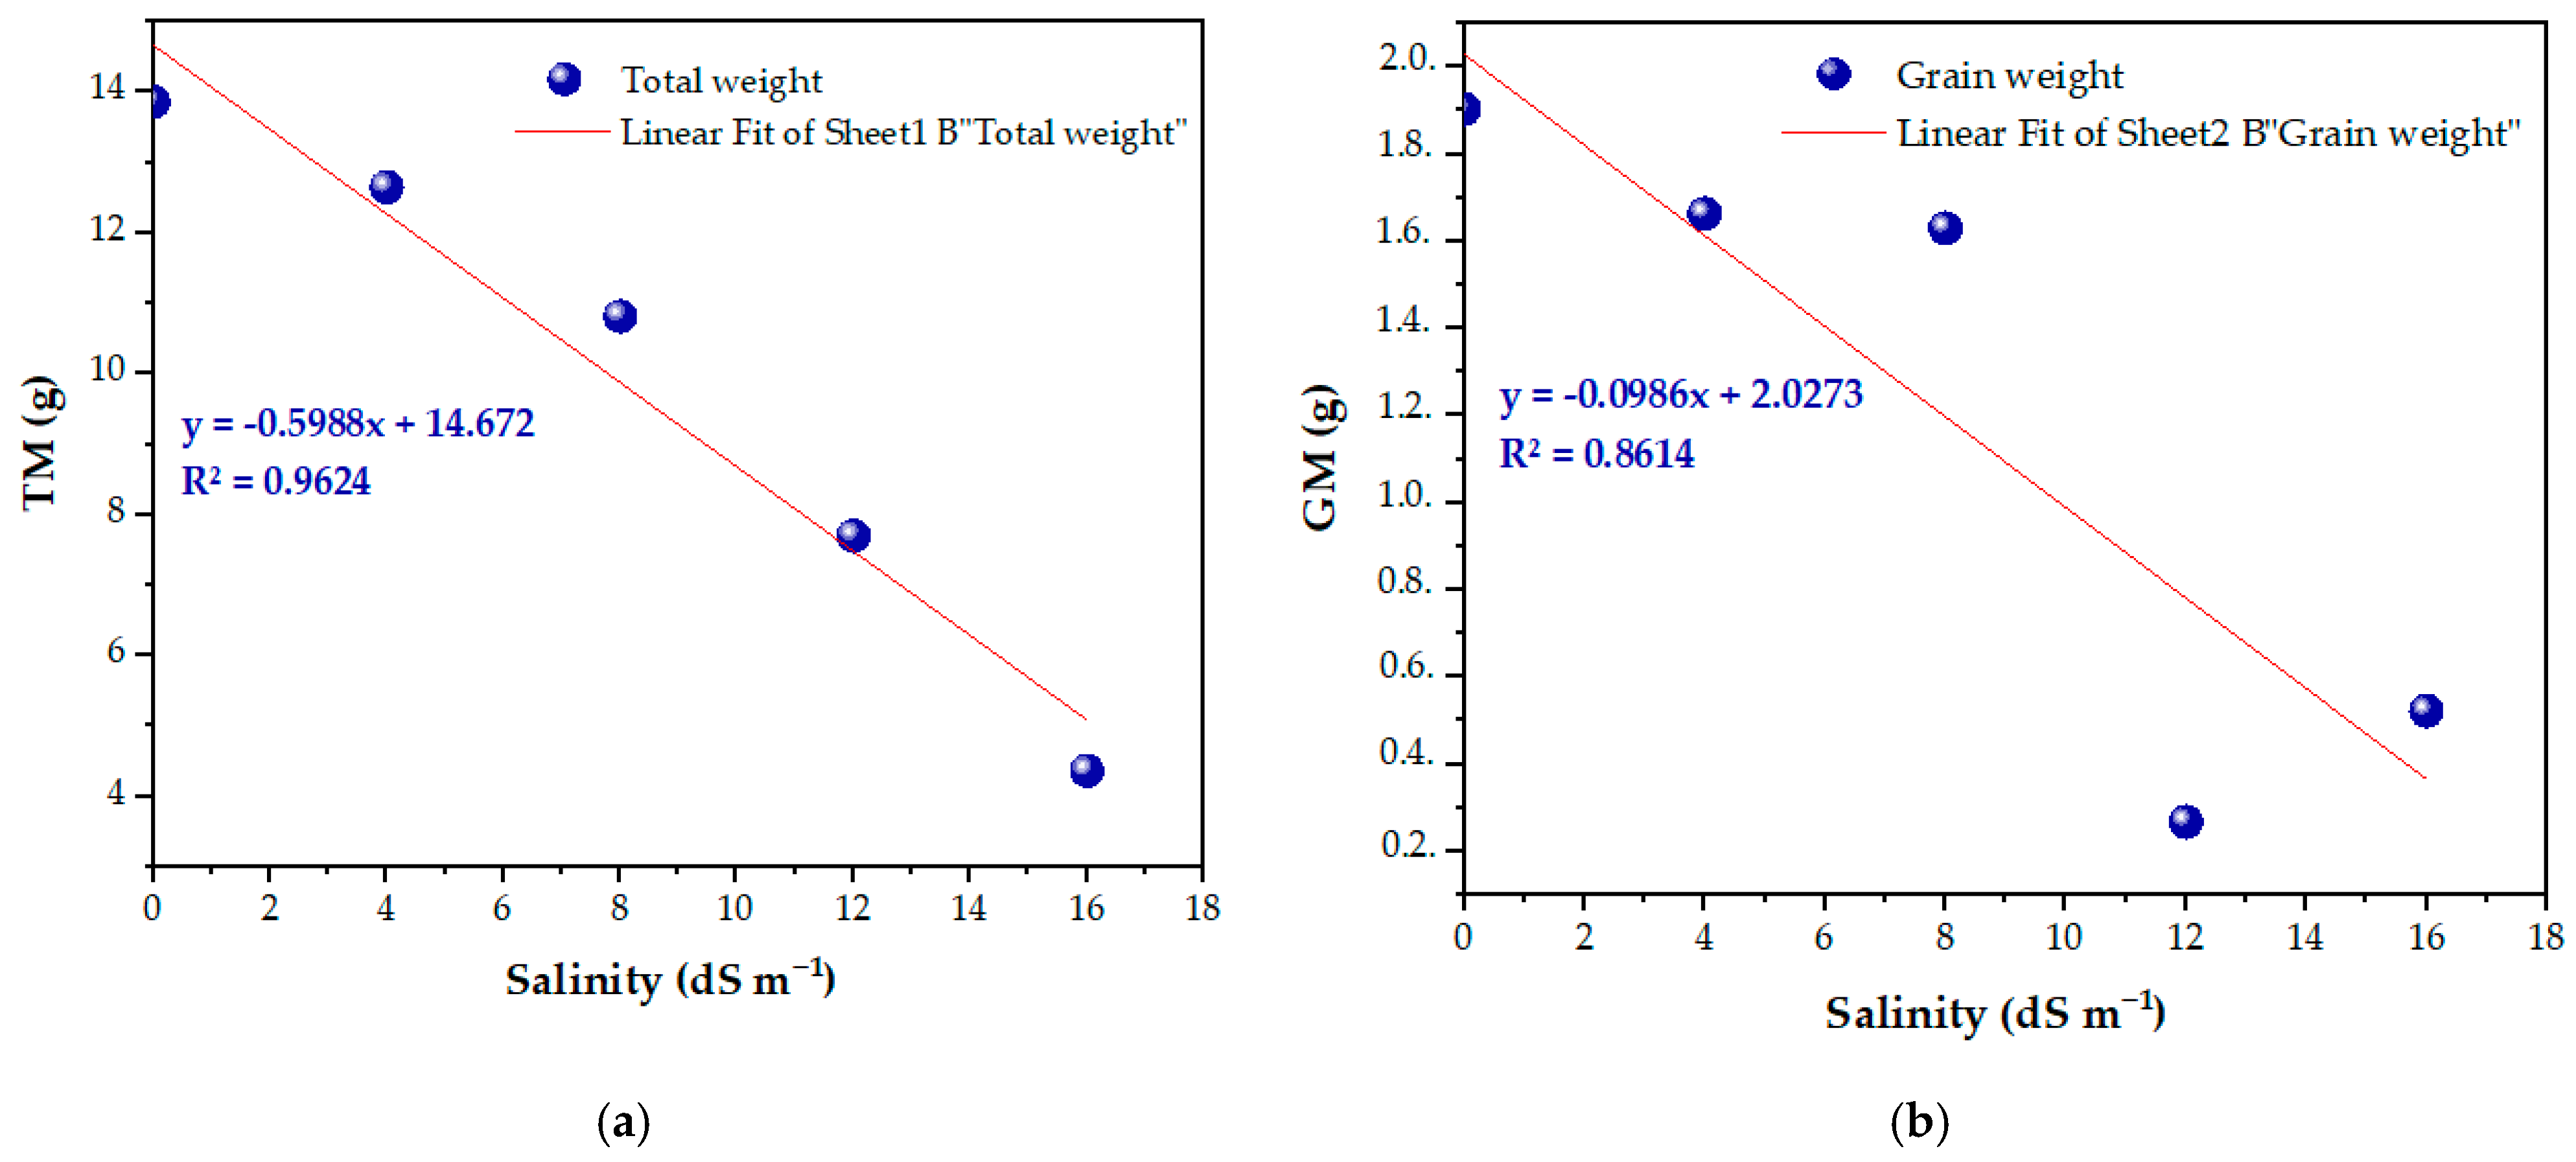
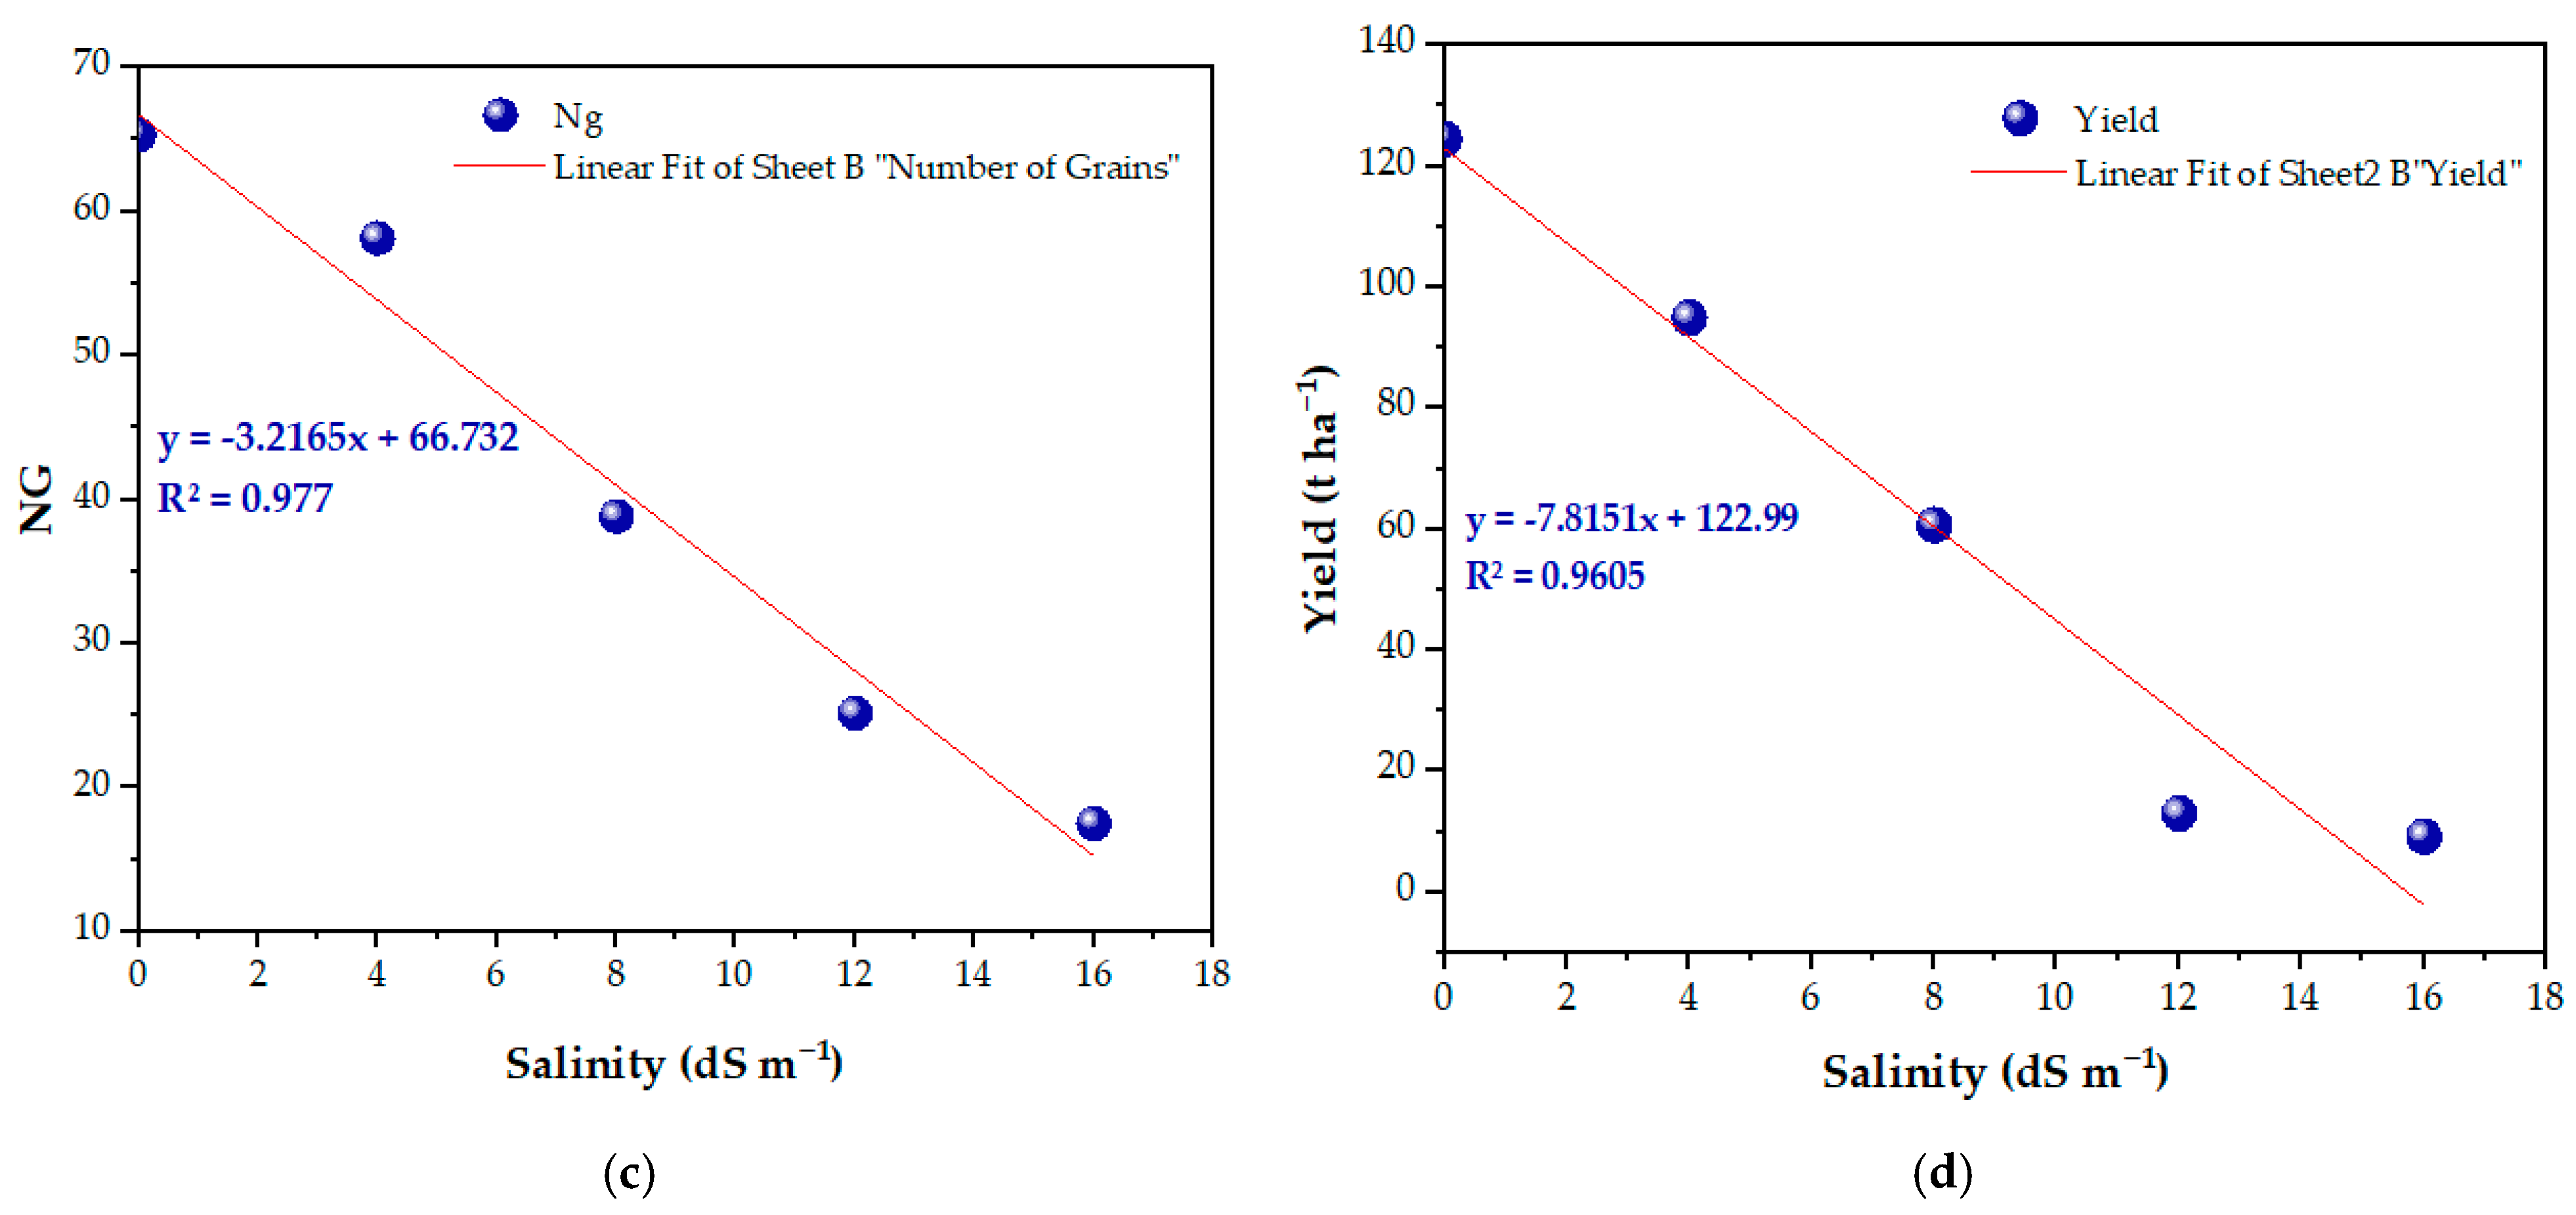
According to the regression graphs (Figure 5), negative correlations were identified between salinity and all yield components.
A negative correlation was observed between salinity and total mass, with a determination coefficient of 0.96 and a regression equation (y = −0.8988x + 14.672). This indicates that as salinity increases, the total mass of wheat tends to decrease. Similarly, salinity is correlated with grain mass, showing a determination coefficient of 0.86. Additionally, the number of grains was negatively correlated with salinity, with a high determination coefficient of 0.97. Yield also decreased significantly with increasing salinity, as confirmed by a determination coefficient of 0.96 and a negative slope (y = −7.8151x + 122.99).
These findings align with several authors’ observations. Sané et al. [88] noted a reduction in yield with increasing salinity stress, which mirrors our results. Moreover, studies by [89,90,91] support our finding that salinity negatively affects the growth and biomass production of wheat cultivars, exacerbating competition for major ions (Na and Cl) and leading to deficiencies in essential nutrients (K, Ca, and Mg). These disturbances can also result in ionic and nutritional imbalances, adversely affecting plant development and productivity [92,93]. The reduction in plant growth under salinity stress, attributed to disruptions in soil water balance caused by the osmotic effects of salts, is consistent with the findings reported in [77,94]. Similarly, the negative impact of salinity on wheat production, particularly on yield, total crop mass, grain mass, and number of grains, is supported by the results of Muhammad et al. [95]. These studies highlight how salinity alters soil properties and affects nutrient uptake, leading to the decreased growth and productivity of crops. Recent studies provide further insights into the impact of salinity on wheat and related crops. Dos Santos et al. [96] reported that high salinity levels impair wheat growth by disrupting cellular metabolism and nutrient assimilation, which further contributes to reduced biomass and yield. Parul et al. [97] demonstrated that salt stress leads to significant alterations in wheat root architecture and physiological responses, which are crucial for understanding the broader implications of salinity on wheat. Additionally, salinity, like drought, disrupts the uptake of essential minerals by plants, leading to reduced growth and productivity [98].

4. Concluding Remarks and Future Perspectives

This study assessed the effect of saline treatment on the durum wheat variety Faraj under greenhouse conditions, focusing on soil quality, growth parameters, and yields of grain and straw. The findings reveal that Faraj exhibits notable tolerance to salt stress, with high germination rates sustained up to 8 dS m−1. Beyond this level, a significant decline in germination rates was observed, indicating that 8 dS m−1 is a critical threshold for grain yield. For straw yield, Faraj shows tolerance up to 12 dS m−1, with yield reductions noted beyond this threshold. Saline treatment also significantly affects growth parameters such as plant height and leaf number, with substantial reductions observed during the later stages of plant development, particularly heading and maturity, under higher salinity concentrations. Additionally, chlorophyll fluorescence, an important indicator of plant health, decreases with increasing salinity, reflecting adverse effects on photosynthesis and overall plant vigor. The study highlights Faraj’s preference for silty-clay soils over sandy soils, emphasizing the importance of this soil type for optimizing plant growth and yield under saline conditions. It is recommended to promote the use of Faraj in silty-clay soils, where it demonstrates better resilience. Future research should focus on exploring the underlying mechanisms of salt tolerance by integrating genetic, physiological, and soil management approaches. Developing more salt-tolerant wheat varieties and enhancing salinity management strategies will be crucial for sustainable agricultural production. Additionally, improving irrigation practices and employing organic amendments will help mitigate salinity effects. Raising awareness among farmers about salt-tolerant varieties and advancing research on sustainable solutions are essential for maintaining agricultural productivity in saline-affected regions.

Author Contributions

Conceptualization, K.M.; methodology, K.M. and H.D.; software, K.M. and A.D.; resources, K.M., A.G. and I.H.; validation, K.M., H.D., D.H. and A.Z.; formal analysis, K.M., A.D., H.D., R.M. and A.Z.; writing—original draft preparation, K.M., D.H., H.D. and A.Z.; writing—review and editing, K.M., H.D., D.H., H.Y. and A.Z.; visualization, K.M. and A.Z.; supervision, D.H., H.Y. and A.Z.; funding acquisition, R.M. All authors have read and agreed to the published version of the manuscript.

Funding

This research was funded by “MCGP” project (INRA and ICARDA).

Data Availability Statement

The data used in this study are available upon request. We encourage interested researchers to contact us for further information.

Acknowledgments

The authors would like to thank all those who collaborated on this work, including field sampling, laboratory analysis, and manuscript preparation teams from the National Institute of Agricultural Research (INRA), the Research Unit of Environment and Conservation of Natural Resources (URECRN), and the International Center for Agricultural Research in the Dry Areas (ICARDA) in Morocco. We also express our gratitude to the “MCGP” project (INRA and ICARDA), as well as the EiA, Climber project, for their financial and technical support.

Conflicts of Interest

The authors declare no conflicts of interest.

References

  1. Pawlak, K.; Kołodziejczak, M. The Role of Agriculture in Ensuring Food Security in Developing Countries: Considerations in the Context of the Problem of Sustainable Food Production. Sustainability 2020, 12, 5488. [Google Scholar] [CrossRef]
  2. Munns, R.; Tester, M. Mechanisms of Salinity Tolerance. Annu. Rev. Plant Biol. 2008, 59, 651–681. [Google Scholar] [CrossRef] [PubMed]
  3. Manchanda, G.; Garg, N. Salinity and Its Effects on the Functional Biology of Legumes. Acta Physiol. Plant 2008, 30, 595–618. [Google Scholar] [CrossRef]
  4. Zörb, C.; Geilfus, C.-M.; Dietz, K.-J. Salinity and Crop Yield. Plant Biol. J. 2019, 21, 31–38. [Google Scholar] [CrossRef]
  5. Furtak, K.; Wolińska, A. The Impact of Extreme Weather Events as a Consequence of Climate Change on the Soil Moisture and on the Quality of the Soil Environment and Agriculture—A Review. CATENA 2023, 231, 107378. [Google Scholar] [CrossRef]
  6. Sanad, H.; Oueld Lhaj, M.; Zouahri, A.; Saafadi, L.; Dakak, H. Groundwater Pollution by Nitrate and Salinization in Morocco: A Comprehensive Review. J. Water Health 2024, 22, 1756–1773. [Google Scholar] [CrossRef]
  7. Zhang, C.; Li, L.; Lockington, D. Numerical Study of Evaporation-induced Salt Accumulation and Precipitation in Bare Saline Soils: Mechanism and Feedback. Water Resour. Res. 2014, 50, 8084–8106. [Google Scholar] [CrossRef]
  8. Rozema, J.; Flowers, T. Crops for a Salinized World. Science 2008, 322, 1478–1480. [Google Scholar] [CrossRef]
  9. Abdelmjid, Z.; Hallam, J.; Dakak, H.; Douaik, A.; Oumaima, I. Soil Salinity: A Challenge for the Resilience of Ecosystems and the Sustainability of Moroccan Agriculture. Afr. Med. Agric. J. 2024, 143, 135–155. [Google Scholar]
  10. Munns, R.; Gilliham, M. Salinity Tolerance of Crops—What Is the Cost? New Phytol. 2015, 208, 668–673. [Google Scholar] [CrossRef]
  11. Saddiq, M.S.; Afzal, I.; Basra, S.M.A.; Iqbal, S.; Ashraf, M. Sodium Exclusion Affects Seed Yield and Physiological Traits of Wheat Genotypes Grown Under Salt Stress. J. Soil Sci. Plant Nutr. 2020, 20, 1442–1456. [Google Scholar] [CrossRef]
  12. Chele, K.H.; Tinte, M.M.; Piater, L.A.; Dubery, I.A.; Tugizimana, F. Soil Salinity, a Serious Environmental Issue and Plant Responses: A Metabolomics Perspective. Metabolites 2021, 11, 724. [Google Scholar] [CrossRef] [PubMed]
  13. Kheiralipour, K.; Brandão, M.; Holka, M.; Choryński, A. A Review of Environmental Impacts of Wheat Production in Different Agrotechnical Systems. Resources 2024, 13, 93. [Google Scholar] [CrossRef]
  14. Fan, J.; Liu, C.; Xie, J.; Han, L.; Zhang, C.; Guo, D.; Niu, J.; Jin, H.; McConkey, B.G. Life Cycle Assessment on Agricultural Production: A Mini Review on Methodology, Application, and Challenges. Int. J. Environ. Res. Public Health 2022, 19, 9817. [Google Scholar] [CrossRef]
  15. Vinci, G.; Ruggieri, R.; Ruggeri, M.; Zaki, M.G. Application of Life Cycle Assessment (LCA) to Cereal Production: An Overview. IOP Conf. Ser. Earth Environ. Sci. 2022, 1077, 012004. [Google Scholar] [CrossRef]
  16. Nagothu, U.S. (Ed.) Agricultural Development and Sustainable Intensification: Technology and Policy Challenges in the Face of Climate Change, 1st ed.; Routledge: New York, NY, USA, 2018; ISBN 978-0-203-73330-1. [Google Scholar]
  17. Horrigan, L.; Lawrence, R.S.; Walker, P. How Sustainable Agriculture Can Address the Environmental and Human Health Harms of Industrial Agriculture. Environ. Health Perspect. 2002, 110, 445–456. [Google Scholar] [CrossRef]
  18. Khondoker, M.; Mandal, S.; Gurav, R.; Hwang, S. Freshwater Shortage, Salinity Increase, and Global Food Production: A Need for Sustainable Irrigation Water Desalination—A Scoping Review. Earth 2023, 4, 223–240. [Google Scholar] [CrossRef]
  19. Pramanick, B.; Kumar, M.; Naik, B.M.; Singh, S.K.; Kumar, M.; Singh, S.V. Soil Carbon-Nutrient Cycling, Energetics, and Carbon Footprint in Calcareous Soils with Adoption of Long-Term Conservation Tillage Practices and Cropping Systems Diversification. Sci. Total Environ. 2024, 912, 169421. [Google Scholar] [CrossRef] [PubMed]
  20. Uri, N. Cropland Soil Salinization and Associated Hydrology: Trends, Processes and Examples. Water 2018, 10, 1030. [Google Scholar] [CrossRef]
  21. Aguiriano, E.; Ruiz, M.; Fité, R.; Carrillo, J.M. Analysis of Genetic Variability in a Sample of the Durum Wheat (Triticum Durum Desf.) Spanish Collection Based on Gliadin Markers. Genet. Resour. Crop Evol. 2006, 53, 1543–1552. [Google Scholar] [CrossRef]
  22. Pastuszak, J.; Dziurka, M.; Hornyák, M.; Szczerba, A.; Kopeć, P.; Płażek, A. Physiological and Biochemical Parameters of Salinity Resistance of Three Durum Wheat Genotypes. Int. J. Mol. Sci. 2022, 23, 8397. [Google Scholar] [CrossRef] [PubMed]
  23. Hussain, N.; Ghaffar, A.; Zafar, Z.U.; Javed, M.; Shah, K.H.; Noreen, S.; Manzoor, H.; Iqbal, M.; Hassan, I.F.Z.; Bano, H.; et al. Identification of Novel Source of Salt Tolerance in Local Bread Wheat Germplasm Using Morpho-Physiological and Biochemical Attributes. Sci. Rep. 2021, 11, 10854. [Google Scholar] [CrossRef] [PubMed]
  24. Kotula, L.; Zahra, N.; Farooq, M.; Shabala, S.; Siddique, K.H.M. Making Wheat Salt Tolerant: What Is Missing? Crop J. 2024, in press. [Google Scholar] [CrossRef]
  25. Maher, H.; Moussadek, R.; Ghanimi, A.; Zouidi, O.; Douaik, A.; Dakak, H.; Amenzou, N.E.; Zouahri, A. Effect of Tillage and Nitrogen Fertilization on Soil Properties and Yield of Five Durum Wheat Germoplasms in a Dry Area of Morocco. Appl. Sci. 2023, 13, 910. [Google Scholar] [CrossRef]
  26. Working Group World Reference Base International Union of Soil Sciences World Reference Base for Soil Resources 2006: A Framework for International Classification, Correlation and Communication; FAO: Rome, Italy, 2006.
  27. Maas, E.V.; Lesch, S.M.; Francois, L.E.; Grieve, C.M. Contribution of Individual Culms to Yield of Salt-Stressed Wheat. Crop Sci. 1996, 36, 142–149. [Google Scholar] [CrossRef]
  28. Doran, J.C.; Gunn, B.V. Treatments to Promote Seed Germination in Australian Acacias; Australian Centre for International Agricultural Research (ACIAR): Canberra, Australia, 1986. [Google Scholar]
  29. Bouyoucos, G.J. Hydrometer Method Improved for Making Particle Size Analyses of Soils. Agron. J. 1962, 54, 464–465. [Google Scholar] [CrossRef]
  30. Rowell, D.L. Soil Science: Methods & Applications; Routledge: London, UK, 2014; ISBN 978-1-315-84485-5. [Google Scholar]
  31. Page, A.L. (Ed.) Methods of Soil Analysis: Part 2 Chemical and Microbiological Properties; Agronomy; American Society of Agronomy, Soil Science Society of America: Madison, WI, USA, 1983. [Google Scholar]
  32. Van Reeuwijk, L.P. Procedures for Soil Analysis; Technical Paper; International Soil Reference and Information Centre: Wageningen, The Netherlands, 1986. [Google Scholar]
  33. Jackson, M.L. Soil Chemical Analysis: Advanced Course: A Manual of Methods Useful for Instruction and Research in Soil Chemistry, Physical Chemistry of Soils, Soil Fertility, and Soil Genesis; UW-Madison Libraries Parallel Press: London, UK, 1958; ISBN 978-1-893311-47-3. [Google Scholar]
  34. Olsen, S.R.; Cole, C.V.; Watanabe, F.S.; Dean, L.A. Estimation of Available Phosphorus in Soils by Extraction with Sodium Bicarbonate; U.S. Department of Agriculture: Washington, DC, USA, 1954.
  35. Aggag, A.M.; Alharbi, A. Spatial Analysis of Soil Properties and Site-Specific Management Zone Delineation for the South Hail Region, Saudi Arabia. Sustainability 2022, 14, 16209. [Google Scholar] [CrossRef]
  36. Sahu, C.; Basti, S.; Pradhan, R. Kumar Physicochemical Properties of Soil under Different Land Use Practices Located near Bhawanipatna Town in Odisha, India. Int. J. Environ. Sci. 2016, 6, 941–953. [Google Scholar]
  37. Richards, L.A. Diagnosis and Improvement of Saline and Alkali Soils. US Department of Agriculture. Agricultural Handbook No. 60, Washington DC, 7-53. Soil Sci. 1954, 78, 154. [Google Scholar] [CrossRef]
  38. Kharal, S.; Khanal, B.R.; Panday, D. Assessment of Soil Fertility under Different Land-Use Systems in Dhading District of Nepal. Soil Syst. 2018, 2, 57. [Google Scholar] [CrossRef]
  39. Hazelton, P.; Murphy, B. Interpreting Soil Test Results: What Do All the Numbers Mean? CSIRO Publishing: Clayton, Australia, 2007; ISBN 978-0-643-09468-0. [Google Scholar]
  40. Szabolcs, I.; Várallyay, G. Review of Research on Salt-Affected Soils; Natural Resources Research; UNESCO: Paris, France, 1979; ISBN 978-92-3-101613-4. [Google Scholar]
  41. Baruah, T.C.; Barthakur, H.P. A Textbook of Soil Analysis; Vikas Publishing House PVT Ltd.: New Delhi, India, 1997. [Google Scholar]
  42. Hmissi, M.; Chaieb, M.; Krouma, A. Differences in the Physiological Indicators of Seed Germination and Seedling Establishment of Durum Wheat (Triticum durum Desf.) Cultivars Subjected to Salinity Stress. Agronomy 2023, 13, 1718. [Google Scholar] [CrossRef]
  43. Kandil, A.A.; Sharief, A.E.; Abido, W.A.E.; Ibrahim, M.M. Effect of Salinity on Seed Germination and Seedling Characters of Some Forage Sorghum Cultivars. Int. J. Agric. Sci. 2012, 4, 306–311. [Google Scholar] [CrossRef]
  44. Chauhan, R.R.; Chaudhry, R.; Singh, A.; Singh, P.K. Salt Tolerance of Sorghum Bicolor Cultivars during Germination and Seedling Growth. Res. J. Recent Sci. 2012, 2277, 2502. [Google Scholar]
  45. Maas, E.V.; Hoffman, G.J. Crop Salt Tolerance—Current Assessment. J. Irrig. Drain. Div. 1977, 103, 115–134. [Google Scholar] [CrossRef]
  46. Machado, R.; Serralheiro, R. Soil Salinity: Effect on Vegetable Crop Growth. Management Practices to Prevent and Mitigate Soil Salinization. Horticulturae 2017, 3, 30. [Google Scholar] [CrossRef]
  47. El Naim, A.M.; Mohammed, K.E.; Ibrahim, E.A.; Suleiman, N.N. Impact of Salinity on Seed Germination and Early Seedling Growth of Three Sorghum (Sorghum biolor L. Moench) Cultivars. SCIT 2012, 2, 16–20. [Google Scholar] [CrossRef]
  48. Troyo-Diéguez, E.; Murillo-Amador, B. Effects of Salinity on the Germination and Seedling Characteristics of Cowpea [Vigna unguiculata (L.) Walp.]. Aust. J. Exp. Agric. 2000, 40, 433. [Google Scholar] [CrossRef]
  49. Mbarki, S.; Skalicky, M.; Vachova, P.; Hajihashemi, S.; Jouini, L.; Zivcak, M.; Tlustos, P.; Brestic, M.; Hejnak, V.; Zoghlami Khelil, A. Comparing Salt Tolerance at Seedling and Germination Stages in Local Populations of Medicago ciliaris L. to Medicago intertexta L. and Medicago scutellata L. Plants 2020, 9, 526. [Google Scholar] [CrossRef]
  50. Alom, R.; Hasan, M.A.; Islam, M.R.; Wang, Q.-F. Germination Characters and Early Seedling Growth of Wheat (Triticum aestivum L.) Genotypes under Salt Stress Conditions. J. Crop Sci. Biotechnol. 2016, 19, 383–392. [Google Scholar] [CrossRef]
  51. Łuczak, K.; Czerniawska-Kusza, I.; Rosik-Dulewska, C.; Kusza, G. Effect of NaCl Road Salt on the Ionic Composition of Soils and Aesculus hippocastanum L. Foliage and Leaf Damage Intensity. Sci. Rep. 2021, 11, 5309. [Google Scholar] [CrossRef]
  52. Tuna, A.L.; Kaya, C.; Higgs, D.; Murillo-Amador, B.; Aydemir, S.; Girgin, A.R. Silicon Improves Salinity Tolerance in Wheat Plants. Environ. Exp. Bot. 2008, 62, 10–16. [Google Scholar] [CrossRef]
  53. Ketehouli, T.; Idrice Carther, K.F.; Noman, M.; Wang, F.-W.; Li, X.-W.; Li, H.-Y. Adaptation of Plants to Salt Stress: Characterization of Na+ and K+ Transporters and Role of CBL Gene Family in Regulating Salt Stress Response. Agronomy 2019, 9, 687. [Google Scholar] [CrossRef]
  54. Chartzoulakis, K.; Klapaki, G. Response of Two Greenhouse Pepper Hybrids to NaCl Salinity during Different Growth Stages. Sci. Hortic. 2000, 86, 247–260. [Google Scholar] [CrossRef]
  55. Huang, L.; Wu, D.; Zhang, G. Advances in Studies on Ion Transporters Involved in Salt Tolerance and Breeding Crop Cultivars with High Salt Tolerance. J. Zhejiang Univ. Sci. B 2020, 21, 426–441. [Google Scholar] [CrossRef]
  56. Khan, T.I.; Dular, A.K.; Solomon, D.M. Biodiversity Conservation in the Thar Desert; with Emphasis on Endemic and Medicinal Plants. Environmentalist 2003, 23, 137–144. [Google Scholar] [CrossRef]
  57. Rao, P.S.; Mishra, B.; Gupta, S.R. Effects of Soil Salinity and Alkalinity on Grain Quality of Tolerant, Semi-Tolerant and Sensitive Rice Genotypes. Rice Sci. 2013, 20, 284–291. [Google Scholar] [CrossRef]
  58. Bohn, H.; McNeal, B.; O’Connor, G. Soil Chemistry. Soil Sci. 1980, 129, 389. [Google Scholar] [CrossRef]
  59. Sritongon, N.; Sarin, P.; Theerakulpisut, P.; Riddech, N. The Effect of Salinity on Soil Chemical Characteristics, Enzyme Activity and Bacterial Community Composition in Rice Rhizospheres in Northeastern Thailand. Sci. Rep. 2022, 12, 20360. [Google Scholar] [CrossRef]
  60. Wang, R.; Wang, Y.; Zhang, Z.; Pan, H.; Lan, L.; Huang, R.; Deng, X.; Peng, Y. Effects of Exponential N Application on Soil Exchangeable Base Cations and the Growth and Nutrient Contents of Clonal Chinese Fir Seedlings. Plants 2023, 12, 851. [Google Scholar] [CrossRef]
  61. Acosta-Motos, J.; Ortuño, M.; Bernal-Vicente, A.; Diaz-Vivancos, P.; Sanchez-Blanco, M.; Hernandez, J. Plant Responses to Salt Stress: Adaptive Mechanisms. Agronomy 2017, 7, 18. [Google Scholar] [CrossRef]
  62. Xu, Y.; Bu, W.; Xu, Y.; Fei, H.; Zhu, Y.; Ahmad, I.; Nimir, N.E.A.; Zhou, G.; Zhu, G. Effects of Salt Stress on Physiological and Agronomic Traits of Rice Genotypes with Contrasting Salt Tolerance. Plants 2024, 13, 1157. [Google Scholar] [CrossRef] [PubMed]
  63. Lu, Y.; Fricke, W. Salt Stress—Regulation of Root Water Uptake in a Whole-Plant and Diurnal Context. Int. J. Mol. Sci. 2023, 24, 8070. [Google Scholar] [CrossRef] [PubMed]
  64. Koyro, H.-W. Effect of Salinity on Growth, Photosynthesis, Water Relations and Solute Composition of the Potential Cash Crop Halophyte Plantago coronopus (L.). Environ. Exp. Bot. 2006, 56, 136–146. [Google Scholar] [CrossRef]
  65. ALKahtani, M.D.F.; Attia, K.A.; Hafez, Y.M.; Khan, N.; Eid, A.M.; Ali, M.A.M.; Abdelaal, K.A.A. Chlorophyll Fluorescence Parameters and Antioxidant Defense System Can Display Salt Tolerance of Salt Acclimated Sweet Pepper Plants Treated with Chitosan and Plant Growth Promoting Rhizobacteria. Agronomy 2020, 10, 1180. [Google Scholar] [CrossRef]
  66. Zuo, G.; Huo, J.; Yang, X.; Mei, W.; Zhang, R.; Khan, A.; Feng, N.; Zheng, D. Photosynthetic Mechanisms Underlying NaCl-Induced Salinity Tolerance in Rice (Oryza sativa). BMC Plant Biol. 2024, 24, 41. [Google Scholar] [CrossRef]
  67. Roșca, M.; Mihalache, G.; Stoleru, V. Tomato Responses to Salinity Stress: From Morphological Traits to Genetic Changes. Front. Plant Sci. 2023, 14, 1118383. [Google Scholar] [CrossRef] [PubMed]
  68. Xing, W.; Wang, J.; Liu, H.; Zou, D.; Zhao, H. Influence of Natural Saline-Alkali Stress on Chlorophyll Content and Chloroplast Ultrastructure of Two Contrasting Rice (Oryza sativa L. Japonica) Cultivars. Aust. J. Crop Sci. 2013, 7, 289–292. [Google Scholar]
  69. Taïbi, K.; Taïbi, F.; Ait Abderrahim, L.; Ennajah, A.; Belkhodja, M.; Mulet, J.M. Effect of Salt Stress on Growth, Chlorophyll Content, Lipid Peroxidation and Antioxidant Defence Systems in Phaseolus vulgaris L. S. Afr. J. Bot. 2016, 105, 306–312. [Google Scholar] [CrossRef]
  70. Debouba, M.; Gouia, H.; Suzuki, A.; Ghorbel, M.H. NaCl Stress Effects on Enzymes Involved in Nitrogen Assimilation Pathway in Tomato “Lycopersicon esculentum” Seedlings. J. Plant Physiol. 2006, 163, 1247–1258. [Google Scholar] [CrossRef]
  71. Dikobe, T.B.; Mashile, B.; Sinthumule, R.R.; Ruzvidzo, O. Distinct Morpho-Physiological Responses of Maize to Salinity Stress. Am. J. Plant Sci. 2021, 12, 946–959. [Google Scholar] [CrossRef]
  72. Stefanov, M.A.; Rashkov, G.D.; Borisova, P.B.; Apostolova, E.L. Changes in Photosystem II Complex and Physiological Activities in Pea and Maize Plants in Response to Salt Stress. Plants 2024, 13, 1025. [Google Scholar] [CrossRef] [PubMed]
  73. Mehta, P.; Jajoo, A.; Mathur, S.; Bharti, S. Chlorophyll a Fluorescence Study Revealing Effects of High Salt Stress on Photosystem II in Wheat Leaves. Plant Physiol. Biochem. 2010, 48, 16–20. [Google Scholar] [CrossRef] [PubMed]
  74. Arif, Y.; Singh, P.; Siddiqui, H.; Bajguz, A.; Hayat, S. Salinity Induced Physiological and Biochemical Changes in Plants: An Omic Approach towards Salt Stress Tolerance. Plant Physiol. Biochem. 2020, 156, 64–77. [Google Scholar] [CrossRef]
  75. Shabala, S.; Munns, R. Salinity Stress: Physiological Constraints and Adaptive Mechanisms. In Plant Stress Physiology; Shabala, S., Ed.; CABI: London, UK, 2012; pp. 59–93. ISBN 978-1-84593-996-0. [Google Scholar]
  76. Singh, P.; Choudhary, K.K.; Chaudhary, N.; Gupta, S.; Sahu, M.; Tejaswini, B.; Sarkar, S. Salt Stress Resilience in Plants Mediated through Osmolyte Accumulation and Its Crosstalk Mechanism with Phytohormones. Front. Plant Sci. 2022, 13, 1006617. [Google Scholar] [CrossRef]
  77. Hu, Y.; Schmidhalter, U. Drought and Salinity: A Comparison of Their Effects on Mineral Nutrition of Plants. Z. Pflanzenernähr. Bodenk. 2005, 168, 541–549. [Google Scholar] [CrossRef]
  78. Goussi, R.; Manaa, A.; Derbali, W.; Cantamessa, S.; Abdelly, C.; Barbato, R. Comparative Analysis of Salt Stress, Duration and Intensity, on the Chloroplast Ultrastructure and Photosynthetic Apparatus in Thellungiella salsuginea. J. Photochem. Photobiol. B Biol. 2018, 183, 275–287. [Google Scholar] [CrossRef]
  79. Betzen, B.M.; Smart, C.M.; Maricle, K.L.; MariCle, B.R. Effects of Increasing Salinity on Photosynthesis and Plant Water Potential in Kansas Salt Marsh Species. Trans. Kans. Acad. Sci. 2019, 122, 49. [Google Scholar] [CrossRef]
  80. Shahid, S.A.; Zaman, M.; Heng, L. Soil Salinity: Historical Perspectives and a World Overview of the Problem. In Guideline for Salinity Assessment, Mitigation and Adaptation Using Nuclear and Related Techniques; Zaman, M., Shahid, S.A., Heng, L., Eds.; Springer International Publishing: Cham, Switzerland, 2018; pp. 43–53. ISBN 978-3-319-96190-3. [Google Scholar]
  81. Akbarimoghaddam, H.; Galavi, M.; Ghanbari, A.; Panjehkeh, N. Salinity Effects on Seed Germination and Seedling Growth of Bread Wheat Cultivars. Agronomy 2023, 10, 81. [Google Scholar] [CrossRef]
  82. Sihmar, M.; Sharma, J.K.; Rani Santal, A.; Singh, N.P. Assessment of salinity stress effect on six contrasting wheat genotypes during grain filling in simulated field growing conditions. Cereal Res. Commun. 2023, 52, 605–617. [Google Scholar] [CrossRef]
  83. Ayers, R.S. Westcot Water Quality for Agriculture; FAO Irrigation and Drainage Paper; FAO: Rome, Italy, 1994; ISBN 92-5-102263-1. [Google Scholar]
  84. Maas, E.V.; Grattan, S.R. Crop Yields as Affected by Salinity. In Agronomy Monographs; Skaggs, R.W., Van Schilfgaarde, J., Eds.; American Society of Agronomy, Crop Science Society of America, Soil Science Society of America: Madison, WI, USA, 2015; pp. 55–108. ISBN 978-0-89118-230-6. [Google Scholar]
  85. Abbas, G.; Saqib, M.; Rafique, Q.; Rahman, M.; Javaid, A.; Anwar-ul-Haq, M.; Nasim, M. Effect of Salinity on Grain Yield and Grain Quality of Wheat (Triticum aestivum L.). Pak. J. Agric. Res 2013, 50, 185–189. [Google Scholar]
  86. Hannachi, S.; Steppe, K.; Eloudi, M.; Mechi, L.; Bahrini, I.; Van Labeke, M.-C. Salt Stress Induced Changes in Photosynthesis and Metabolic Profiles of One Tolerant (‘Bonica’) and One Sensitive (‘Black Beauty’) Eggplant Cultivars (Solanum melongena L.). Plants 2022, 11, 590. [Google Scholar] [CrossRef] [PubMed]
  87. El-Ramady, H.; Prokisch, J.; Mansour, H.; Bayoumi, Y.A.; Shalaby, T.A.; Veres, S.; Brevik, E.C. Review of Crop Response to Soil Salinity Stress: Possible Approaches from Leaching to Nano-Management. Soil Syst. 2024, 8, 11. [Google Scholar] [CrossRef]
  88. Sané, A.K.; Diallo, B.; Kane, A.; Sagna, M.; Sané, D.; Sy, M.O. In Vitro Germination and Early Vegetative Growth of Five Tomato (Solanum lycopersicum L.). Am. J. Plant Sci. 2021, 12, 796–817. [Google Scholar] [CrossRef]
  89. Grieve, C.; Grattan, S. Mineral Nutrient Acquisition and Response by Plants Grown in Saline Environments. In Handbook of Plant and Crop Stress, 2nd ed.; Pessarakli, M., Ed.; Books in Soils, Plants, and the Environment; CRC Press: Boca Raton, FL, USA, 1999; Volume 19990540, pp. 203–229. ISBN 978-0-8247-1948-7. [Google Scholar]
  90. Munns, R.; Termaat, A. Whole-Plant Responses to Salinity. Funct. Plant Biol. 1986, 13, 143. [Google Scholar] [CrossRef]
  91. Cruz, J.L.; Coelho, E.F.; Coelho Filho, M.A.; Santos, A.A.D. Salinity Reduces Nutrients Absorption and Efficiency of Their Utilization in Cassava Plants. Cienc. Rural 2018, 48, e20180351. [Google Scholar] [CrossRef]
  92. Sanad, H.; Mouhir, L.; Zouahri, A.; Moussadek, R.; El Azhari, H.; Hasna, Y.; Ghanimi, A.; Oueld Lhaj, M.; Dakak, H. Assessment of Groundwater Quality Using the Pollution Index of Groundwater (PIG), Nitrate Pollution Index (NPI), Water Quality Index (WQI), Multivariate Statistical Analysis (MSA), and GIS Approaches: A Case Study of the Mnasra Region, Gharb Plain, Morocco. Water 2024, 16, 1263. [Google Scholar] [CrossRef]
  93. Oueld Lhaj, M.; Moussadek, R.; Mouhir, L.; Mdarhri Alaoui, M.; Sanad, H.; Iben Halima, O.; Zouahri, A. Assessing the Evolution of Stability and Maturity in Co-Composting Sheep Manure with Green Waste Using Physico-Chemical and. Biological Properties and Statistical Analyses: A Case Study of Botanique Garden in Rabat, Morocco. Agronomy 2024, 14, 1573. [Google Scholar] [CrossRef]
  94. Sanad, H.; Moussadek, R.; Dakak, H.; Zouahri, A.; Oueld Lhaj, M.; Mouhir, L. Ecological and Health Risk Assessment of HeavyMetals in Groundwater within an Agricultural Ecosystem Using GIS and Multivariate Statistical Analysis (MSA): A Case Study of the Mnasra Region, Gharb Plain, Morocco. Water 2024, 16, 2417. [Google Scholar] [CrossRef]
  95. Muhammad, M.; Waheed, A.; Wahab, A.; Majeed, M.; Nazim, M.; Liu, Y.-H.; Li, L.; Li, W.-J. Soil Salinity and Drought Tolerance: An Evaluation of Plant Growth, Productivity, Microbial Diversity, and Amelioration Strategies. Plant Stress 2023, 11, 100319. [Google Scholar] [CrossRef]
  96. dos Santos, T.B.; Ribas, A.F.; Hülse de Souza, S.G.; Budzinski, I.G.F.; Domingues, D.S. Physiological Responses to Drought, Salinity, and Heat Stress in Plants: A Review. Stresses 2022, 2, 113–135. [Google Scholar] [CrossRef]
  97. Parul, K.A.; Chourasia, S.; Kumar, R.; Devi, G.; Kumar, A.; Mann, A.; Sheoran, P.; Sanwal, S.K. Physiological, Biochemical, and Molecular Responses to Salt Stress and Seed Priming Approach to Enhance Salt Tolerance in Bread Wheat. In Salinity and Drought Tolerance in Plants; Kumar, A., Ed.; Springer: Singapore, 2023; pp. 61–86. [Google Scholar]
  98. Soni, S.; Jha, A.B.; Dubey, R.S.; Sharma, P. Nanowonders in Agriculture: Unveiling the Potential of Nanoparticles to Boost Crop Resilience to Salinity Stress. Sci. Total Environ. 2024, 925, 171433. [Google Scholar] [CrossRef] [PubMed]
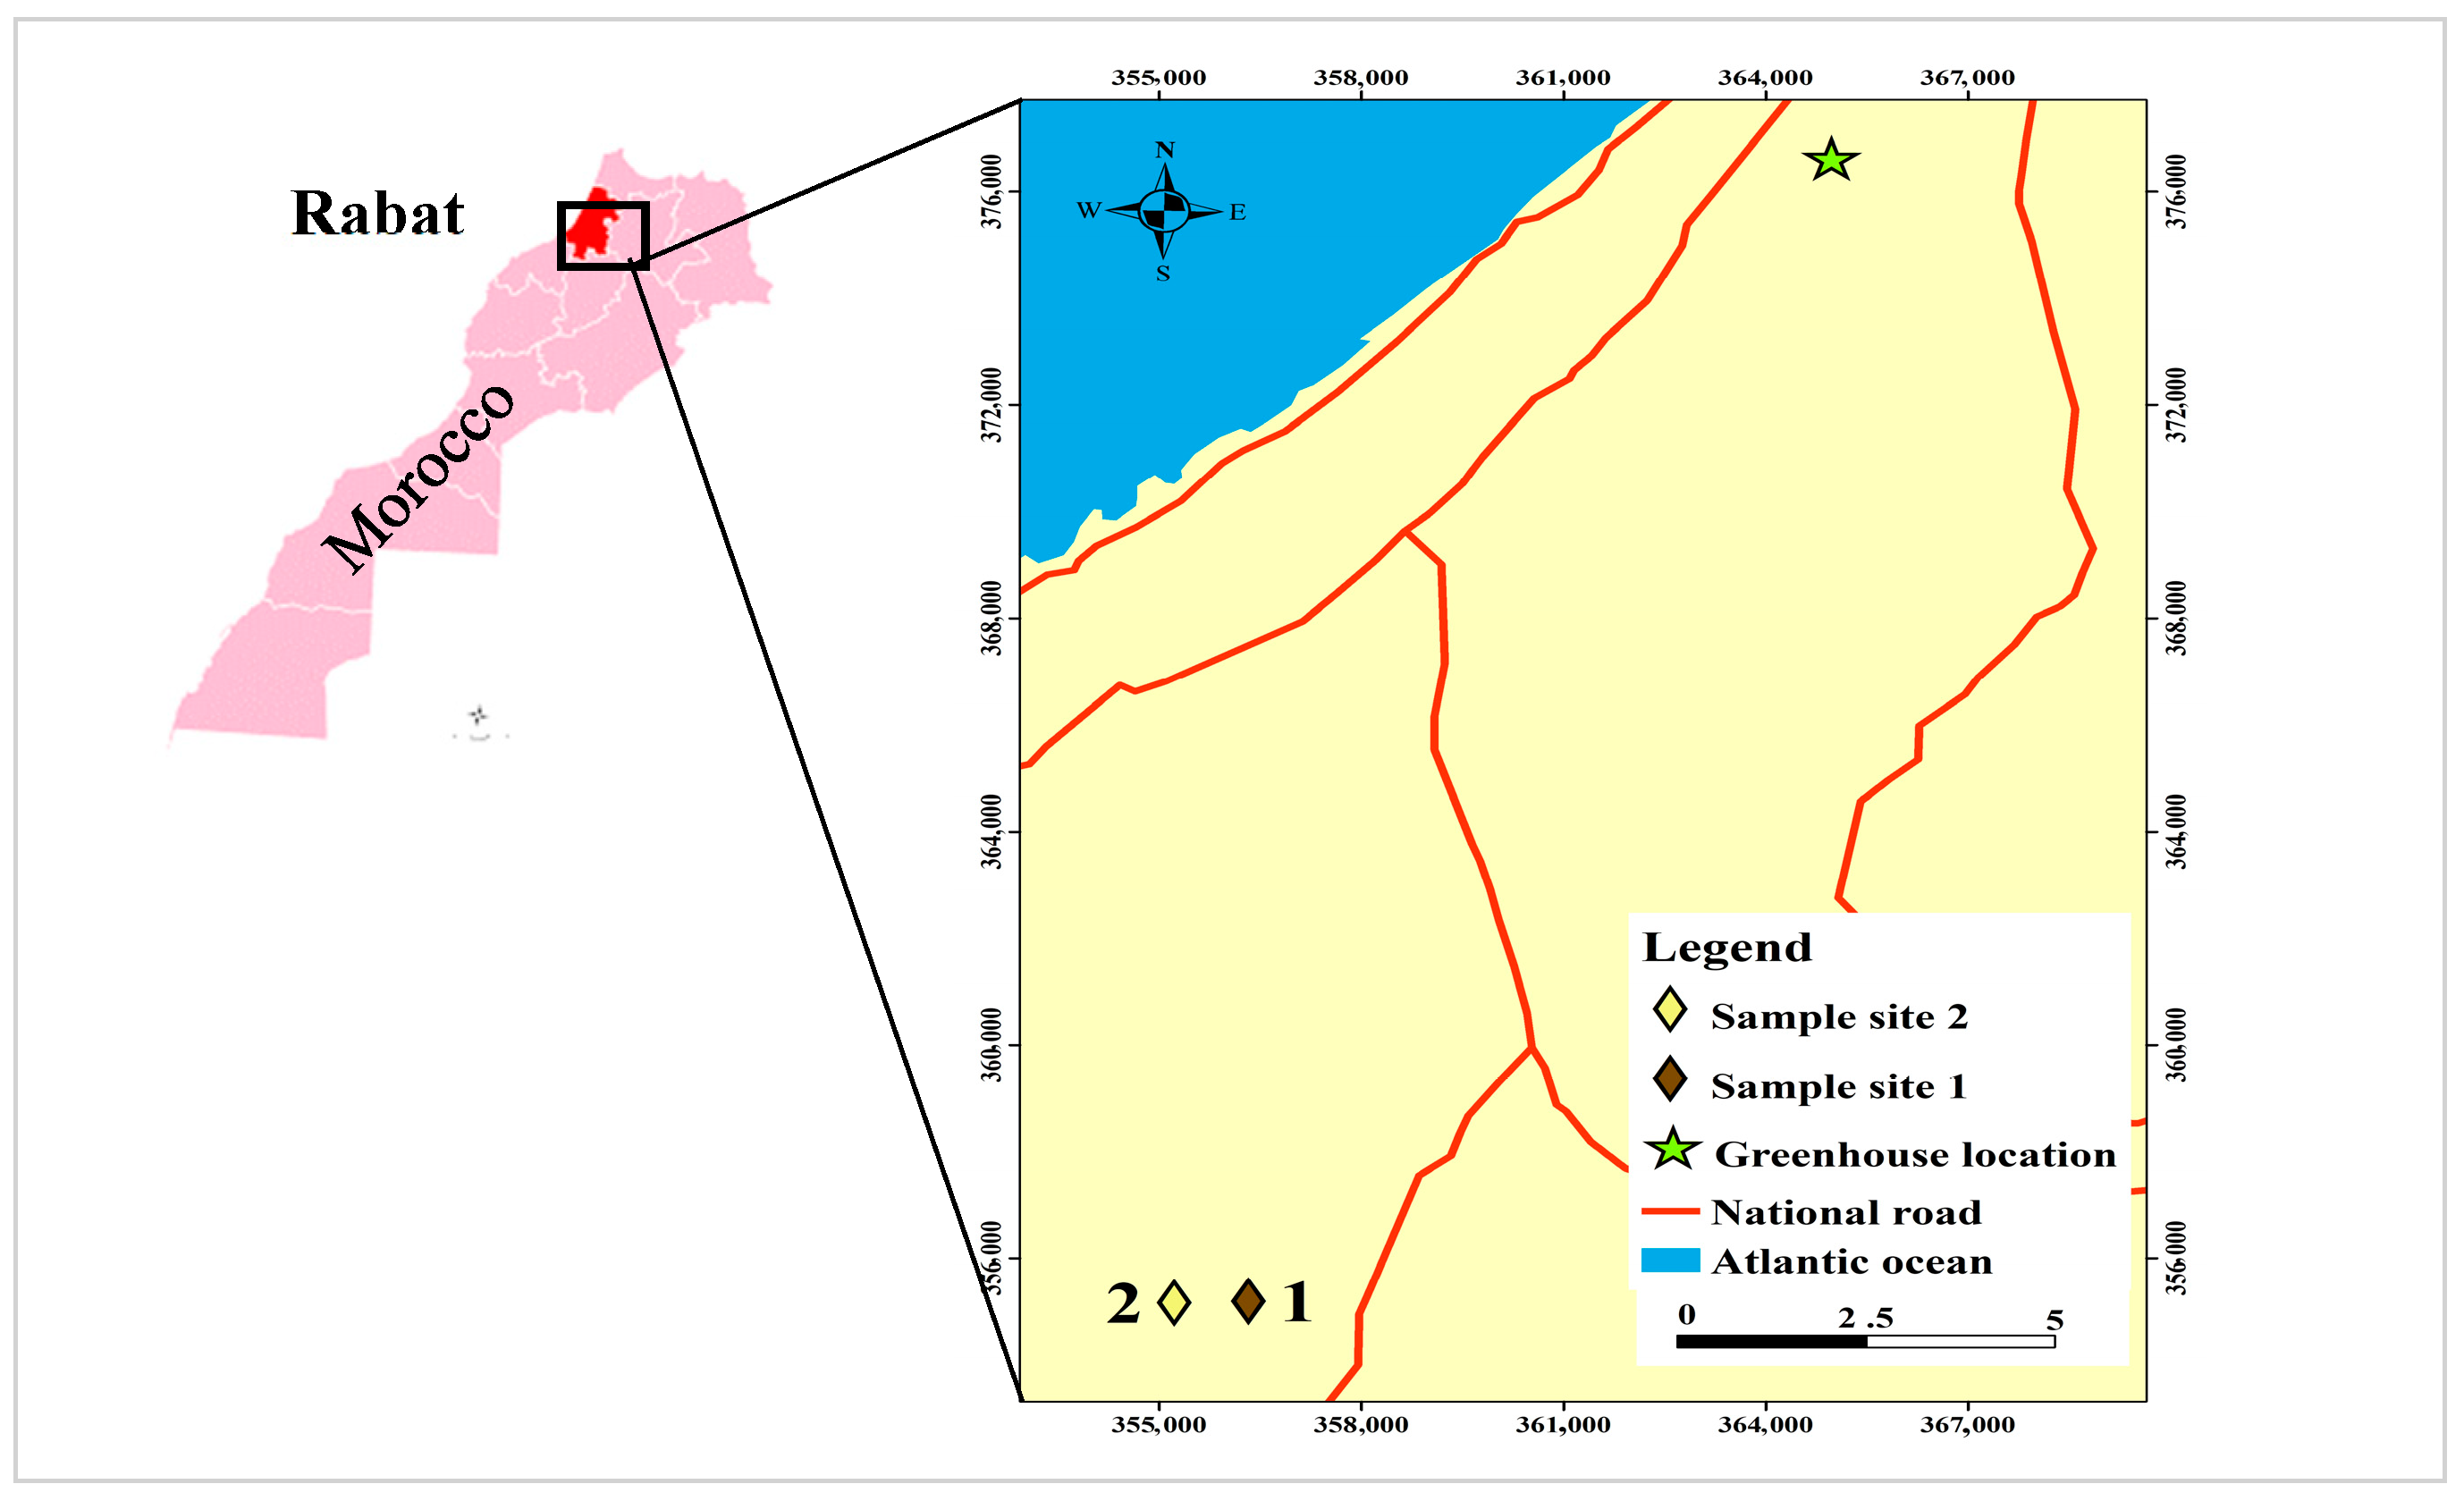
Figure 1. Geographical location of the experimental site and soil sampling points.
Agronomy 14 02865 g001
Figure 2. Salt stress effect on Faraj variety seed germination over a period of 8 days.
Agronomy 14 02865 g002
Figure 3. Relationship between various soil chemical parameters and different salinity levels in S1 soil: (a) pH; (b) electrical conductivity; (c) sodium; (d) potassium; (e) calcium; and (f) magnesium.
Agronomy 14 02865 g003
Figure 4. Representation of parameter averages with error bars during the plant’s developmental stages under different NaCl treatments: (a,b) plant height (PlHt); (c,d) chlorophyll fluorescence (Fv/Fm); and (e,f) number of leaves (NOL) for S1 (silty-clay) and S2 (sandy soil).
Agronomy 14 02865 g004aAgronomy 14 02865 g004b
Figure 5. Relationship between yield parameters in silty clay soil (S1) and various levels of salinity: (a) total mass; (b) grain mass; (c) number of grains; and (d) yield.
Agronomy 14 02865 g005aAgronomy 14 02865 g005b
Table 1. Principal attributes of the durum wheat variety.
Wheat VarietyFaraj
The official year of inscription2007
Quality:
* Quality characteristics15.3%
* Yellow index29
Drought resistanceModerately resistant
Cycle duration154 days
Yield (t ha−1):
* Favorable areas5.9
* Semi-arid areas3.8
The yellow index measures the color of the grain, which is an indicator of quality. The percentages represent the quality characteristics of the grain, and yields are specified for favorable and semi-arid areas [26]. * Values represent quality characteristics and yield measurements according to standard agricultural practices and protocols.
Table 2. Physicochemical properties and granulometric analysis of the two soils before experimentation.
GranulometryS1S2
Sand (%)13.187.6
Silt (%)34.36.40
Clay (%)52.66.00
Chemical Properties
pH7.808.40
EC (dS m−1)0.200.51
OM (%)1.331.18
CEC (cmol kg−1)0.650.40
Macronutrients of soils
N (%)0.0780.024
Av.P (mg kg−1)120140
Ex.K (mg kg−1)229325
Na (mg kg−1)1.502.50
Ca (mg kg−1)5.202.50
Mg (mg kg−1)5.002.50
Cl (mg kg−1)0.200.40
Table 3. ANOVA analysis of soil property measurements during the experimentation.
Chemical VariablespHECKNaCaMgCl
Variable Sourcep-Valuep-Valuep-Valuep-Valuep-Valuep-Valuep-Value
Sampling (S)<0.001
***
<0.001
***
<0.001
***
<0.001
***
<0.001
***
<0.001
***
<0.001
***
Soil (So)<0.001
***
<0.001
***
<0.001
***
<0.001
***
<0.001
***
<0.001
***
<0.001
***
Salinity (Sa)<0.001
***
<0.001
***
<0.001
***
<0.001
***
<0.001
***
<0.001
***
<0.001
***
S × So0.06 ns<0.001
***
<0.001
***
<0.001
***
<0.001
***
<0.001
***
<0.001
***
S × Sa<0.001
***
<0.001
***
<0.001
***
<0.001
***
0.005
**
0.002
**
<0.001
***
So × Sa0.006<0.001
***
<0.001
***
0.111 ns0.001
***
<0.001
***
0.013
*
S × So × Sa<0.001
***
<0.001
***
0.008
**
0.082 ns0.001
***
<0.001
***
0.002
**
ns: non-significant; * significant (p < 0.05); ** highly significant (p < 0.01); *** very highly significant (p < 0.001).
Table 4. Typical chemical parameters measured for each salinity level (dS m−1) and soil type.
Salinity (dS m−1)Soil TypepHEC
(dS m−1)
Na
(mg kg−1)
K
(dS m−1)
Ca
(dS m−1)
Mg
(dS m−1)
Cl
(dS m−1)
0.2S17.20 ± 0.141.28 ± 0.742.85 ± 1.040.45 ± 0.084.79 ± 0.756.86 ± 0.5912.45 ± 1.93
S27.45 ± 0.132.71 ± 1.523.09 ± 1.080.51 ± 0.073.65 ± 0.806.05 ± 0.4013.16 ± 1.70
4S17.35 ± 0.153.27 ± 1.283.64 ± 1.090.53 ± 0.075.25 ± 0.767.34 ± 0.5013.48 ± 1.66
S27.68 ± 0.084.25 ± 2.293.85 ± 1.280.59 ± 0.104.55 ± 0.876.54 ± 0.5913.97 ± 1.74
8S17.53 ± 0.166.05 ± 2.835.02 ± 1.310.60 ± 0.085.80 ± 0.827.91 ± 0.3415.95 ± 1.11
S27.86 ± 0.127.63 ± 3.674.82 ± 1.300.64 ± 0.125.11 ± 0.726.85 ± 0.7515.72 ± 0.68
12S17.93 ± 0.358.52 ± 4.085.02 ± 1.310.67 ± 0.106.32 ± 0.818.25 ± 0.3914.86 ± 1.47
S27.93 ± 0.359.62 ± 4.285.40 ± 1.470.83 ± 0.275.63 ± 0.767.43 ± 0.6916.35 ± 0.89
16S18.14 ± 0.3510.93 ± 5.165.50 ± 1.30.89 ± 0.236.62 ± 0.758.85 ± 0.4916.45 ± 1.23
S28.52 ± 0.3011.25 ± 5.135.81 ± 1.50.92 ± 0.316.04 ± 0.807.80 ± 0.7616.78 ± 1.14
Mean0.27.32 a2.00 a2.97 a0.48 a4.22 a6.45 a13.70 a
47.51 b3.76 b3.74 b0.56 b4.90 b6.94 b13.72 b
87.69 c6.84 c4.92 c0.62 c5.45 c7.38 c15.83 c
128.14 d9.07 d5.21 d0.75 d5.84 d7.84 d15.60 d
168.33 e11.09 e5.65 e0.90 e6.33 e8.32 e16.61 e
Means (with standard errors, n = 3) and standard deviations sharing the same letter indicate no statistically significant differences at the 0.05 significance level as determined by Duncan’s post hoc test. S1: clay soil; S2: sandy soil.
Table 5. Evaluation of yield parameters and straw yield at different salinity levels and soil types during the 2023–2024 cropping season.
Salinity
(dS m−1)
Soil TypeGrain Yield
(t ha−1)
200-Grain
Weight (g)
Straw
(t ha−1)
0.2S11.12 (1.80)67.00(1.00)1.24 (1.0)
S20.56 (13.70)63.6 (1.50)1.16 (1.1)
4S10.70 (15.60)38.5 (7.60)1.18 (0.4)
S20.40 (13.60)58.0 (4.30)1.03 (0.8)
8S10.38 (15.60)34.6 (1.50)0.97 (0.1)
S20.23 (9.90)29.0 (1.70)0.86 (0.1)
12S10.18 (0.20)29.3 (1.50)0.80 (0.7)
S20.14 (2.30)21.0 (2.00)0.65 (0.1)
T6S10.16 (0.10)11.6 (1.50)0.55 (0.3)
S20.12 (0.70)7.3 (2.50)0.20 (0.6)
Mean 0.20.84 a65.30 a1.20 a
40.55 b48.20 b1.10 b
80.30 c38.80 c0.91 c
120.16 d25.10 c0.72 c
160.14 d14.50 d0.37 d
Means (without standard deviations) sharing the same letter are not significantly different at the 0.05 level, as determined by Duncan’s post hoc test. The numbers in parentheses indicate the standard deviations for each measurement. S1: clayey soil; S2: sandy soil.
Table 6. ANOVA results for yield components evaluated during the experimentation.
Yield ParametersGrain Yield
(t ha−1)
200 Grain
Weight (g)
Straw
(t ha−1)
Variable Sourcep-Valuep-Valuep-Value
Soil (So)0.250 ns0.259 ns<0.001 ***
Salinity (Sa)<0.001 ***<0.001 ***<0.001 ***
So × Sa0.451 ns<0.001 ***0.005 **
ns: non-significant; ** Highly significant (p < 0.01); *** Very highly significant (p < 0.001).
Disclaimer/Publisher’s Note: The statements, opinions and data contained in all publications are solely those of the individual author(s) and contributor(s) and not of MDPI and/or the editor(s). MDPI and/or the editor(s) disclaim responsibility for any injury to people or property resulting from any ideas, methods, instructions or products referred to in the content.