Article

The Relationship Between Cover Crop Species and Soil Fungal Communities in Irrigated Vineyards in the Okanagan Valley, Canada

1
Department of Biology, The University of British Columbia Okanagan, Kelowna, BC V1V 1V7, Canada
2
Okanagan Institute for Biodiversity, Resilience, and Ecosystem Services, The University of British Columbia Okanagan, Kelowna, BC V1V 1V7, Canada
3
Summerland Research and Development Centre, Agriculture and Agri-Food Canada, Summerland, BC V0H 1Z0, Canada
4
Department of Computer Science, Math, Physics, and Statistics, The University of British Columbia Okanagan, Kelowna, BC V1V 1V7, Canada
*
Author to whom correspondence should be addressed.
Agronomy 2024, 14(12), 2835; https://doi.org/10.3390/agronomy14122835
Submission received: 30 October 2024 / Revised: 19 November 2024 / Accepted: 22 November 2024 / Published: 28 November 2024
(This article belongs to the Section Agroecology Innovation: Achieving System Resilience)

Abstract

:
Many techniques adopted by annual crop growers, addressing challenges such as disease, are not viable for perennial systems. Groundcover vegetation can be employed as a natural method for increasing soil health and perennial plant performance; however, cover crop species may differ in the plant–soil feedback effects that modulate the rhizosphere. To investigate the relationship between cover crop identity and soil microbial composition and to determine potential impacts of cover crop species on pathogen occurrence in perennial systems, we characterized the fungal communities in soil sampled from nine cover crop species used for under-vine groundcover at three separate Okanagan vineyards. Soil characteristics, particularly available phosphorus levels, varied significantly among sites, with SuRDC at 39.9 ppm, Covert at 140.1 ppm, and Kalala at 276.2 ppm. Of 1876 fungal species, SuRDC showed lower richness and diversity. A random forest model classified samples by site with 98.4% accuracy (p < 0.001), but cover crop classification was minimal (2.4% accuracy). Phacelia had significantly lower variance in Shannon’s (p = 2.35 × 10 7 ) and Simpson’s diversity (p = 3.59 × 10 12 ). Crescendo ladino clover had simpler fungal networks than buckwheat, with a negative correlation between fungal species count and co-occurrence affinity across cover crops (p < 0.001). We found that within sites, soil fungal communities did not vary greatly in composition and measures of community structure, regardless of cover crop identity. Nectriaceae were abundant across all samples, suggesting that cover crops may recruit certain fungal pathogens. Soil fungal communities were distinct across sites, indicating that site-specific conditions may play a larger role in shaping soil fungal communities in BC vineyards than cover crop–microbe interactions and that cover crops do not have consistent short-term (<1 year) effects on soil fungi across sites. Altogether, this research encourages careful consideration of both groundcover species and site-specific conditions when using cover crops in perennial agriculture.

1. Introduction

Annual cash crops use crop rotation to decrease pathogen build up by exploiting associations between plants and soil microbial communities [1]. For long-lived perennials, however, this is not an option. While growers of perennial crops cannot rely on crop rotation, they can manipulate non-crop vegetation (i.e., cover cropping) to help mitigate challenges with water management, organic pest control, and fostering soil communities that support plant productivity. Cover cropping is one of the most powerful tools available to perennial row crop growers. Cover cropping encompasses a range of practices aimed at maintaining and maximizing the duration of unharvested plant cover on soil for the growing season while providing ecological services that support the health of soil and harvested plants [2]. There is intense interest in cover crops due to their demonstrated ability to mediate a variety of growing challenges, including soil carbon storage [3,4], lowered N2O emissions by lowering the amount of fertilizer N required each year [5,6], increased soil water availability [7], increased soil nutrient availability [8], cascade effects reducing herbivory [9,10], and increased disease suppression [11].
While growers must address a range of different challenges, disease control is an especially important issue for perennial cropping systems, particularly during crop establishment. Soil-borne fungal pathogens can lead to specific replant disease [12]. These diseases are difficult to control and treat because they are considered “disease complexes” and tend to accumulate over time [12]. There is good reason to believe that cover crop identity may lead to disease suppressive soils. There is some evidence from natural systems showing that pathogens are reduced with increasing plant diversity [13]. Increased plant diversity leads to increased soil microbial diversity [14], and this relationship is based on the ability of plant species (or even varieties) to ‘culture’ specific rhizosphere communities based on root exudate composition and root architecture [15,16].
Specific cover crop taxa may also confer protective benefits to crop species. Many plants are known to produce biocidal compounds which inhibit soilborne pathogens. For example, members of the Brassicaceae and Capparidaceae produce glucosinolates, whose derivatives have been shown to have strong anti-fungal activity [11,17,18]. Plants in the Fabaceae, Alliaceae, Asteraceae, Polygonaceae, Polygalaceae, and Agavaceae produce steroidal saponins and triterpenoid saponins, which inhibit both herbivores and fungi [19,20]. Essential oils, particularly those in the Lamiaceae family, have similarly been shown to have strong antifungal activity in the soil [21]. Taken together, these results suggest that judicious choice of cover crops could help control soilborne pathogens. Traits that render cover crops good at fungal pathogen suppression may similarly inhibit beneficial fungi, such as arbuscular mycorrhizal fungi (AMF) [22]. AMF are root-dwelling fungi that form an essential symbiosis with several crop species [23]. They enhance host resilience to both biotic and abiotic stress directly through increased nutrient acquisition, improved water relations, and induced systemic resistance for a wide variety of pathogens and shoot and root herbivores [23,24]. An ideal cover crop would reduce the incidence of pathogens without impacting beneficial soil fungi [22]. Further, cover crops should not serve as an alternate host for plant pathogens. In a recent study, Rosa et al. [16] showed that some cover crops could serve as reservoirs for common vine pathogens, perhaps leading to pathogen spillover and increased soil pathogen load. Although existing asymptomatically within host plants, cover cropping with certain plant species, such as phacelia (Phacelia tanacetifolia) or buckwheat (Fagopyrum esculentum), could result in the buildup of microbes harmful to susceptible cash crops [16].
Yet, while the role of groundcover in improving plant performance and supplying soil nutrients is well studied [25] for certain perennials like grapevines (Vitis vinifera), effects on the soil microbiome are not well understood. It is therefore difficult for growers to identify specific cover crops that help promote crop performance across a variety of conditions. Cover crop taxa may not establish in all sites, even within geographically similar areas, due to soil type and microclimates [26]. Even if they do, they may affect soil communities differently due to differences in soil microbial communities, which we know vary across micro- and macro-scales [27,28].
Limited information is available on the interactions between cover crop species and soil fungal communities in perennial horticultural crops, particularly in vineyards. The goal of this paper is to test the efficacy of commonly used cover crops to influence soil community composition across the growing region. To identify cover crops that promote potentially suppressive soil fungal communities, we performed a field study manipulating cover crop identity in vine rows in three irrigated vineyards. We looked for changes in soil fungal community structure and the presence of key fungal taxa in the Okanagan wine growing region of British Columbia.

2. Methods

2.1. Study Area

To understand the role of the cover crop species on soil fungal communities, we conducted field trials of 9 cover crop species in three vineyards in the Okanagan Valley, British Columbia, Canada, beginning in May of the 2019–2020 crop year. The vineyards we studied included (i) 13-year-old Merlot vines planted in loamy sand soil at Covert Farms Family Estate (henceforth ‘Covert’), situated in Oliver BC, Canada (latitude 49°14′39.8″ N; longitude 119°32′42.7″ W); (ii) 2-year-old Riesling vines planted in loamy sand soil at an experimental farm Agriculture and Agri-food Canada’s Summerland Research and Development Centre (henceforth ‘SuRDC’), situated in Summerland BC, Canada (latitude 49°33′59″ N, longitude 119°38′12″ W); and (iii) 10-year-old Zweigelt vines planted in sandy loam soil texture at Kalala Organic Estate Winery (henceforth ‘Kalala’), situated in West Kelowna BC, Canada (latitude 49°50′31.2″ N; longitude 119°38′42″ W). Further details on site-specific growing conditions are provided in Table 1.
Soil sampling was conducted in May 2019, before seeding cover crops, at a depth of 0–15 cm within vine rows using a soil auger. Composite soil samples were created in each row plot by combining six row samples at each depth. Subsequently, these samples were transported from the field to the laboratory in coolers, sieved to a 2 mm size, and stored at −20 °C for subsequent analysis. A sub-sample was air-dried and sent to the lab for the determination of soil properties.
Macro- and micro-nutrients were extracted using Mehlich III solution [29] with a 1:10 soil-to-solution ratio and analyzed by ICP-OES (Teledyne Leeman Labs, Hudson, NH, USA), except for soil boron that was determined via hot water (80 °C) extraction. Soil pH was measured in 1:2 soil-to-water ratio after 15 min steering using a pH electrode.
The field experiment design consisted of in-row cultivation of 9 cover crops species: buckwheat (Fagopyrum esculentum), buffalo grass (Bouteloua dactyloides), crescendo ladino white clover (Trifolium repens cv. Ladino), field pea (Pisum sativum), white mustard (Sinapis alba), phacelia (Phacelia tanacetifolia), spring lentil (Lens culinaris), turnip (Brassica rapa subsp. Rapa), and Winfred brassica (Brassica napus cv. Winfred). These species were selected based on a preceding greenhouse study by Sharifi et al. [30], the literature [25,31,32], their function within the agroecological landscape, and in consultation with experts. The experimental design was a randomized complete block design (RCBD) with 9 treatments and 5 replications. The in-row and inter-row spacing were 1.2 × 2.7 m in the Covert and Kalala sites and 1.2 × 3.0 m at the SuRDC site. Each in-row plot consisted of 5-7 vines between two panels with a guard vine at each end of the plot. In-row cover crops were seeded on 26 May 2019, while inter-row cover crops were seeded on 10 June 2019. Cover crops were sampled at three time intervals (30 June, 10 August, and 1 October 2019) and mowed subsequently. All cover crops were irrigated with a drip irrigation system.

2.2. Soil Sampling DNA Extractions and Sequencing

Field soil samples were taken over six days during the last two weeks of August 2019 from the 0-20 cm layer. Each soil sample was comprised of five sub-samples mixed and immediately stored in ice at −20 °C and then frozen at −80 °C until DNA extraction. DNA from soil samples (0.25 g) was extracted using PowerSoil 96-well extraction kits (Qiagen) following the manufacturer’s instructions. After extraction, 10 µL volumes of each sample with concentration >10 ng/µL were sent to the Integrated Microbiome Resource (IMR) at Dalhousie University in Halifax, Nova Scotia, Canada for Internal Transcribed Spacer (ITS) amplification.

2.3. Data Processing

Sequences were returned as FASTQ files, which were filtered and denoised using the dada2 package (v1.28.0) [33] in R (v4.3.0) [34], following the workflow of Callahan et al. [35]. Samples that returned weak or failed sequencing reads were excluded from subsequent processing and analyses. Successful sequence reads were trimmed at nucleotide position 230 for forward reads and position 180 for reverse reads due to a decrease in average sequencing quality towards the ends of reads [35]. The first ten nucleotides for each read were also removed as they likely contained pathological errors [35]. Sequencing reads were subsequently filtered for a maximum of two expected errors per read and dereplicated to remove redundant comparisons for a quicker computation time when inferring amplicon sequence variants (ASVs) [35]. Using ASVs instead of operational taxonomic units (OTUs) allows sequence variants to be differentiated by single-nucleotide differences rather than dictating an arbitrary threshold used to group sequences into OTUs [36].
For microbiome genetic data processing and preliminary analyses, we used the mga() function from the mga package (v0.1.0) [37]. The steps undertaken by the mga() function, using default parameters, were as follows. Substitution errors were distinguished from errors in sequencing via the DADA2 method, which involves using a parameterized learning model for independent inference by sample, with non-pooled sequencing reads, to identify unique ASVs [35]. As the DADA2 output includes chimeras, sequence pairs were merged before removing the chimeric sequences from the resulting sequence table to produce the final ASVs and abundance counts for each.
The ASVs for each soil sample were assigned taxonomic classification with reference to the most recent (29 November 2022) UNITE General FASTA release for fungi at the time of analysis [38]. The DECIPHER package (v2.28.0) [39] was used for the multiple alignment of sequences prior to generating a neighbour-joining phylogenetic tree using the phangorn package (v2.11.1) [40]. The neighbour-joining tree served as a base structure to which a general time-reversible nucleotide substitution model with a gamma rate variation (GTR + G + I) and stochastic tree rearrangement were added. The model was adjusted according to the parameters set by Callahan et al. [35], where the number of intervals of the discrete gamma distribution (k) was set to 4, and a 0.2 proportion of invariable sites (inv) was allowed.
Using the phyloseq package (v1.44.0) [41], an individual co-occurrence network was constructed for each sample, where each vertex represents a unique ASV, and edges connecting vertices represent the association between two co-occurring ASVs. To build the networks, Jaccard’s dissimilarity index (J) was calculated for each pair of ASVs to determine the distance between pairs, forming edges when less than 0.35, the maximum ecological distance set for Jaccard’s dissimilarity by the authors of [41].
All sample sequence tables, taxonomic classifications, phylogenetic trees, and metadata were stored in a list of phyloseq-class() objects to facilitate data retrieval and handling in subsequent analyses [35]. Individual phyloseq-class() objects were merged to combine all sample data into a single object for global analyses, while the data were also restructured to form site-specific objects. Phylogenetic trees were excluded from the composite objects as it is not possible to merge networks with different numbers of nodes representing branching events and ASVs.

2.4. Statistical Analyses

2.4.1. Does Site Affect Soil Fungal Communities?

For an overview of the fungal communities across sites, a Venn diagram was generated using the ggvenn package (v0.1.10) [42]. This initial comparison distinguished the number of unique species found in each of the three sampling sites, Covert, Kalala, and SuRDC, and the species shared between two or all sites.

2.4.2. Does Cover Crop Identity Affect Soil Fungal Communities?

To describe the fungal community composition of each soil sample at a higher-order taxonomic rank, relative ASV abundances were agglomerated by fungal class to construct a stacked bar plot, with samples grouped by cover crop species.
To understand the possible differences in the mycorrhizal communities between and within cover crop species, measures of community structure were extracted from the results produced from our mga analysis of ASV abundances and phylogenetic trees for each sample, aggregated at the species level. Alpha species richness was calculated as the total species count per sample after agglomerating ASV abundances by species. The total read count and number of unique ASVs were summed per sample. Species alpha diversity within each sample was estimated using Shannon’s and Simpson’s indices [43] and calculated using the phyloseq package [41]. Phylogenetic diversity (PD) was calculated as the sum of branch lengths derived from the phylogenetic tree corresponding to each sample [44]. These measures of community ecology were visualized in boxplots to compare mean and variance values across cover crop species.
To determine any significant differences in the mean and variance of each richness and diversity measure between cover crops regardless of the site location, a generalized additive model was generated for each measure as a function of cover crop species, with random effects on the site variable. A gamma location-scale model was specified for all measures, except for Simpson’s index, for which a beta location-scale model was employed because it was calculated as a proportion with values ranging from 0 to 1.

2.4.3. Community Structure

To further investigate how cover crop identity could affect fungal community structure, measures of network topology were gleaned from the co-occurrence network built for each sample via mga: the number of vertices, network nodes equal to the number of unique ASVs; the total number of edges connecting vertices in the graphical model, indicating co-occurrence of ASVs; network connectivity; connectance; and the degree of each vertex per sample. The number of vertices (v) and edges (e) was provided by the vcount() and ecount() functions in the igraph package (v1.4.2) [45], and the degree, representing the number of edges extending from each individual vertex, was calculated using the same package. Network connectivity is the average number of associations between ASVs, calculated as the number of edges in the graphical model divided by the total number of vertices (e/v) [46]. Network connectance is the proportion of edges inferred at the predetermined maximum distance threshold out of all possible edges, calculated as the number of edges divided by the square of the total number of vertices (e/v2) [46]. Both network connectivity and connectance give an estimate of the complexity of fungal community structure for each sample. A generalized additive model was also generated for measures of network topology, extracted at the sample level, across cover crop species, with random effects on the site variable to determine effects of cover crop identity on community structure. All models employed a gamma location scale distribution, with the exception of network connectance, calculated as a proportion, for which a beta location scale distribution was specified due to values ranging between 0 and 1.
As an alternative intercommunity statistic to beta diversity, co-occurrence affinity (α) [47] was calculated to compare the tendency of mycorrhizal species to co-occur across cover crop species. The co-occurrence affinity statistic was newly proposed by Mainali et al. [47] as an improved index used to measure co-occurrence of species between pairs of sites; comparisons between α, Jaccard’s index (J), and the Sørensen–Dice index (S-D) revealed α to be insensitive to prevalences, making it a better estimator of intercommunity diversity than traditional beta diversity indices. The corresponding CooccurrenceAffinity package (v1.0) [47], developed by the authors, was used to verify the structure of the species occurrence matrices fed into the analysis and to calculate α for each unique pair of cover crop species. A lower triangle heat map of pair-wise cover crop α values was also generated to better reveal cover crop species of interest.
Three different gamma location scale generalized linear models (GLMs) were constructed using the nlme package (v3.1-162) [48] to visualize trends in both the mean and variance in α for pairings made by each cover crop and the overall trend of all pairs: α as a function of the summed occurrences for each cover crop in a pair with no random effects, added random effects for cover crop, and added random effects for cover crop using the summed occurrences as the intercepts. The support for these models was then evaluated via AIC.
We complemented these statistical analyses with a within-sample random forest classification analysis. Random forest models were used to classify soil samples (n = 123) by cover crop and site and to determine sorting success upon comparing model categorization results to the actual cover crops and sites to which each sample belongs. A species abundance matrix was prepared by summing the species abundances for each sample to be sorted by the random forest. The possible categories were set by two separate single-column data frames which tabulated the actual cover crops each sample was taken from: buckwheat (n = 15), buffalo grass (n = 14), crescendo ladino clover (n = 13), field pea (n = 15), white mustard (n = 15), phacelia (n = 15), spring lentil (n = 15), turnip (n = 9), and Winfred brassica (n = 12) and the actual site of each sample: Covert (n = 43), Kalala (n = 44), and SuRDC (n = 36). A model for cover crop categorization and a model for site categorization were built using the randomForest package (v4.7-1.1) [49]. The species abundance matrix and the corresponding data frame of actual cover crops or sites was fed into the models for analysis. For each model, a forest of 2000 trees was specified, with 5 variables allowed at each branching split. Variable importance plots were produced for the two random forest model outputs.
To expose any sample clustering from the random forest models, principal component analyses (PCAs) were conducted for each, formed from the proximity coordinates of each sample across each dimension of the PCA. The two PCAs were separately plotted using the FactoMineR package (v2.8) [50] to show any overlap in the clusters. Density plots made with ggridges (v0.5.4) [51] allowed for closer examination of the expression of the top two species from each PCA. The abundances of the top 50 species ranked by importance from the cover crop random forest model were displayed in a heat map built using the ComplexHeatmap package (v2.16.0) [52]. Heat map columns were annotated by true cover crop and site, and dendrograms were added for both samples in columns and species in rows.

2.4.4. Role of Cover Crop/Site on Occurrence of Putative Pathogens/Beneficials

Pathogens of concern for vine health, including fungi in the Nectriaceae, Ilyonectria, Diatrypaceae, and Botryosphaeriaceae families, have been previously highlighted [53,54,55]. These key vine pathogens were identified from the taxonomy table at decreasing order of taxonomic level, from family to species, to visualize the differences in the relative and absolute abundance of pathogenic fungi across cover crops and sites.
All statistical analyses were performed in R (v4.3.0) and the scripts required to reproduce these analyses can be found in the File S1 and in the GitHub repository at https://github.com/ErikaYLin/Cover-Crop-Study (accessed on 29 October 2024).

3. Results

3.1. Overall Soil Properties and Fungal Communities

Table 2 and Figure 1 provide an overview of the general soil characteristics found at each site. Covert and SuRDC soils were similar in composition and had the same soil classification of loamy sand, while Kalala soils were classified as sandy loam due to greater average clay content (Table 2). The soil pH did not vary greatly within each site and was measured to be slightly acidic. The phosphorus content in the soil decreased with sample depth and was consistent for all cover crops within each site. Kalala soils exhibited greater percentages of total nitrogen and organic carbon than the other two sites, as well as higher soil conductivity. Similar trends were observed for soil nutrients, where Kalala soils were more nutrient-rich on average, followed by Covert and SuRDC, respectively (Figure 1). In particular, the average amount of phosphorus measured at SuRDC (39.9 ppm) was significantly less than both Covert (140.1 ppm) and Kalala (276.2). Overall, characteristic dissimilarities between sites may have either contributed to or resulted from any differences in the soil microbial communities between the three sites. Full site-wide soil chemistry data can be found in Table S1. Soil total nitrogen (N) and organic carbon (C) can be found in Table S2 (Covert), Table S3 (Kalala), and Table S4 (SuRDC).
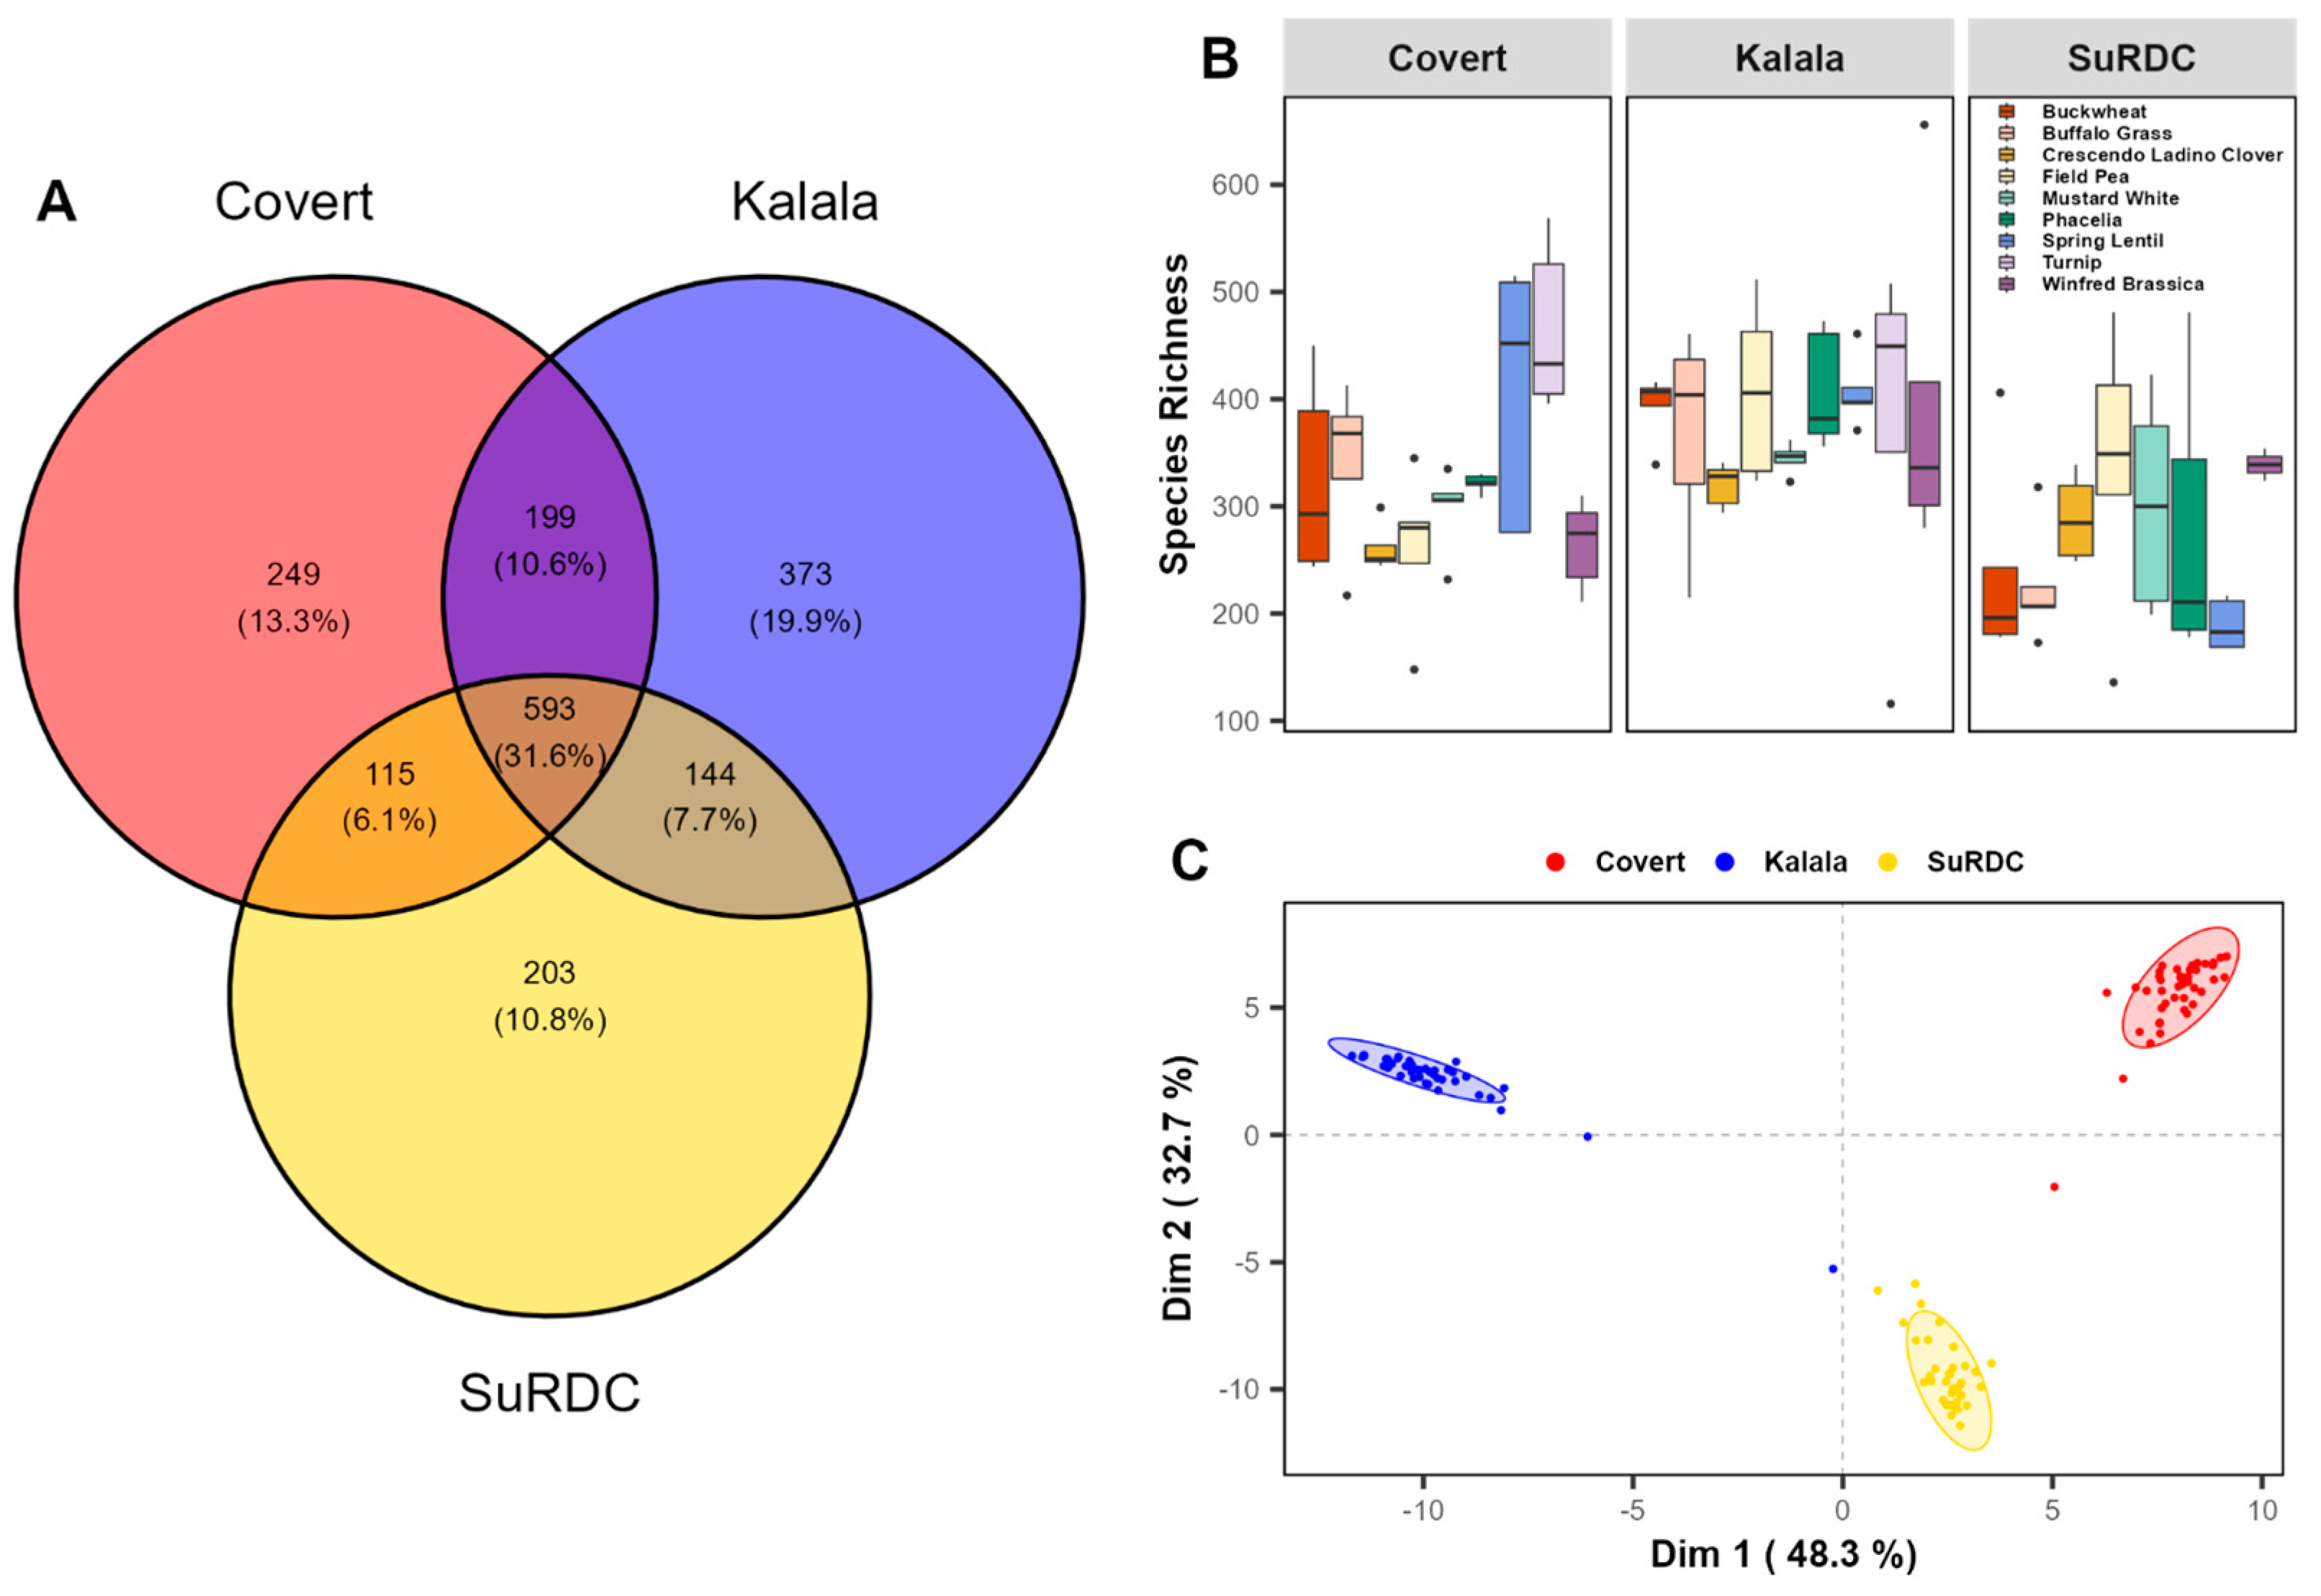
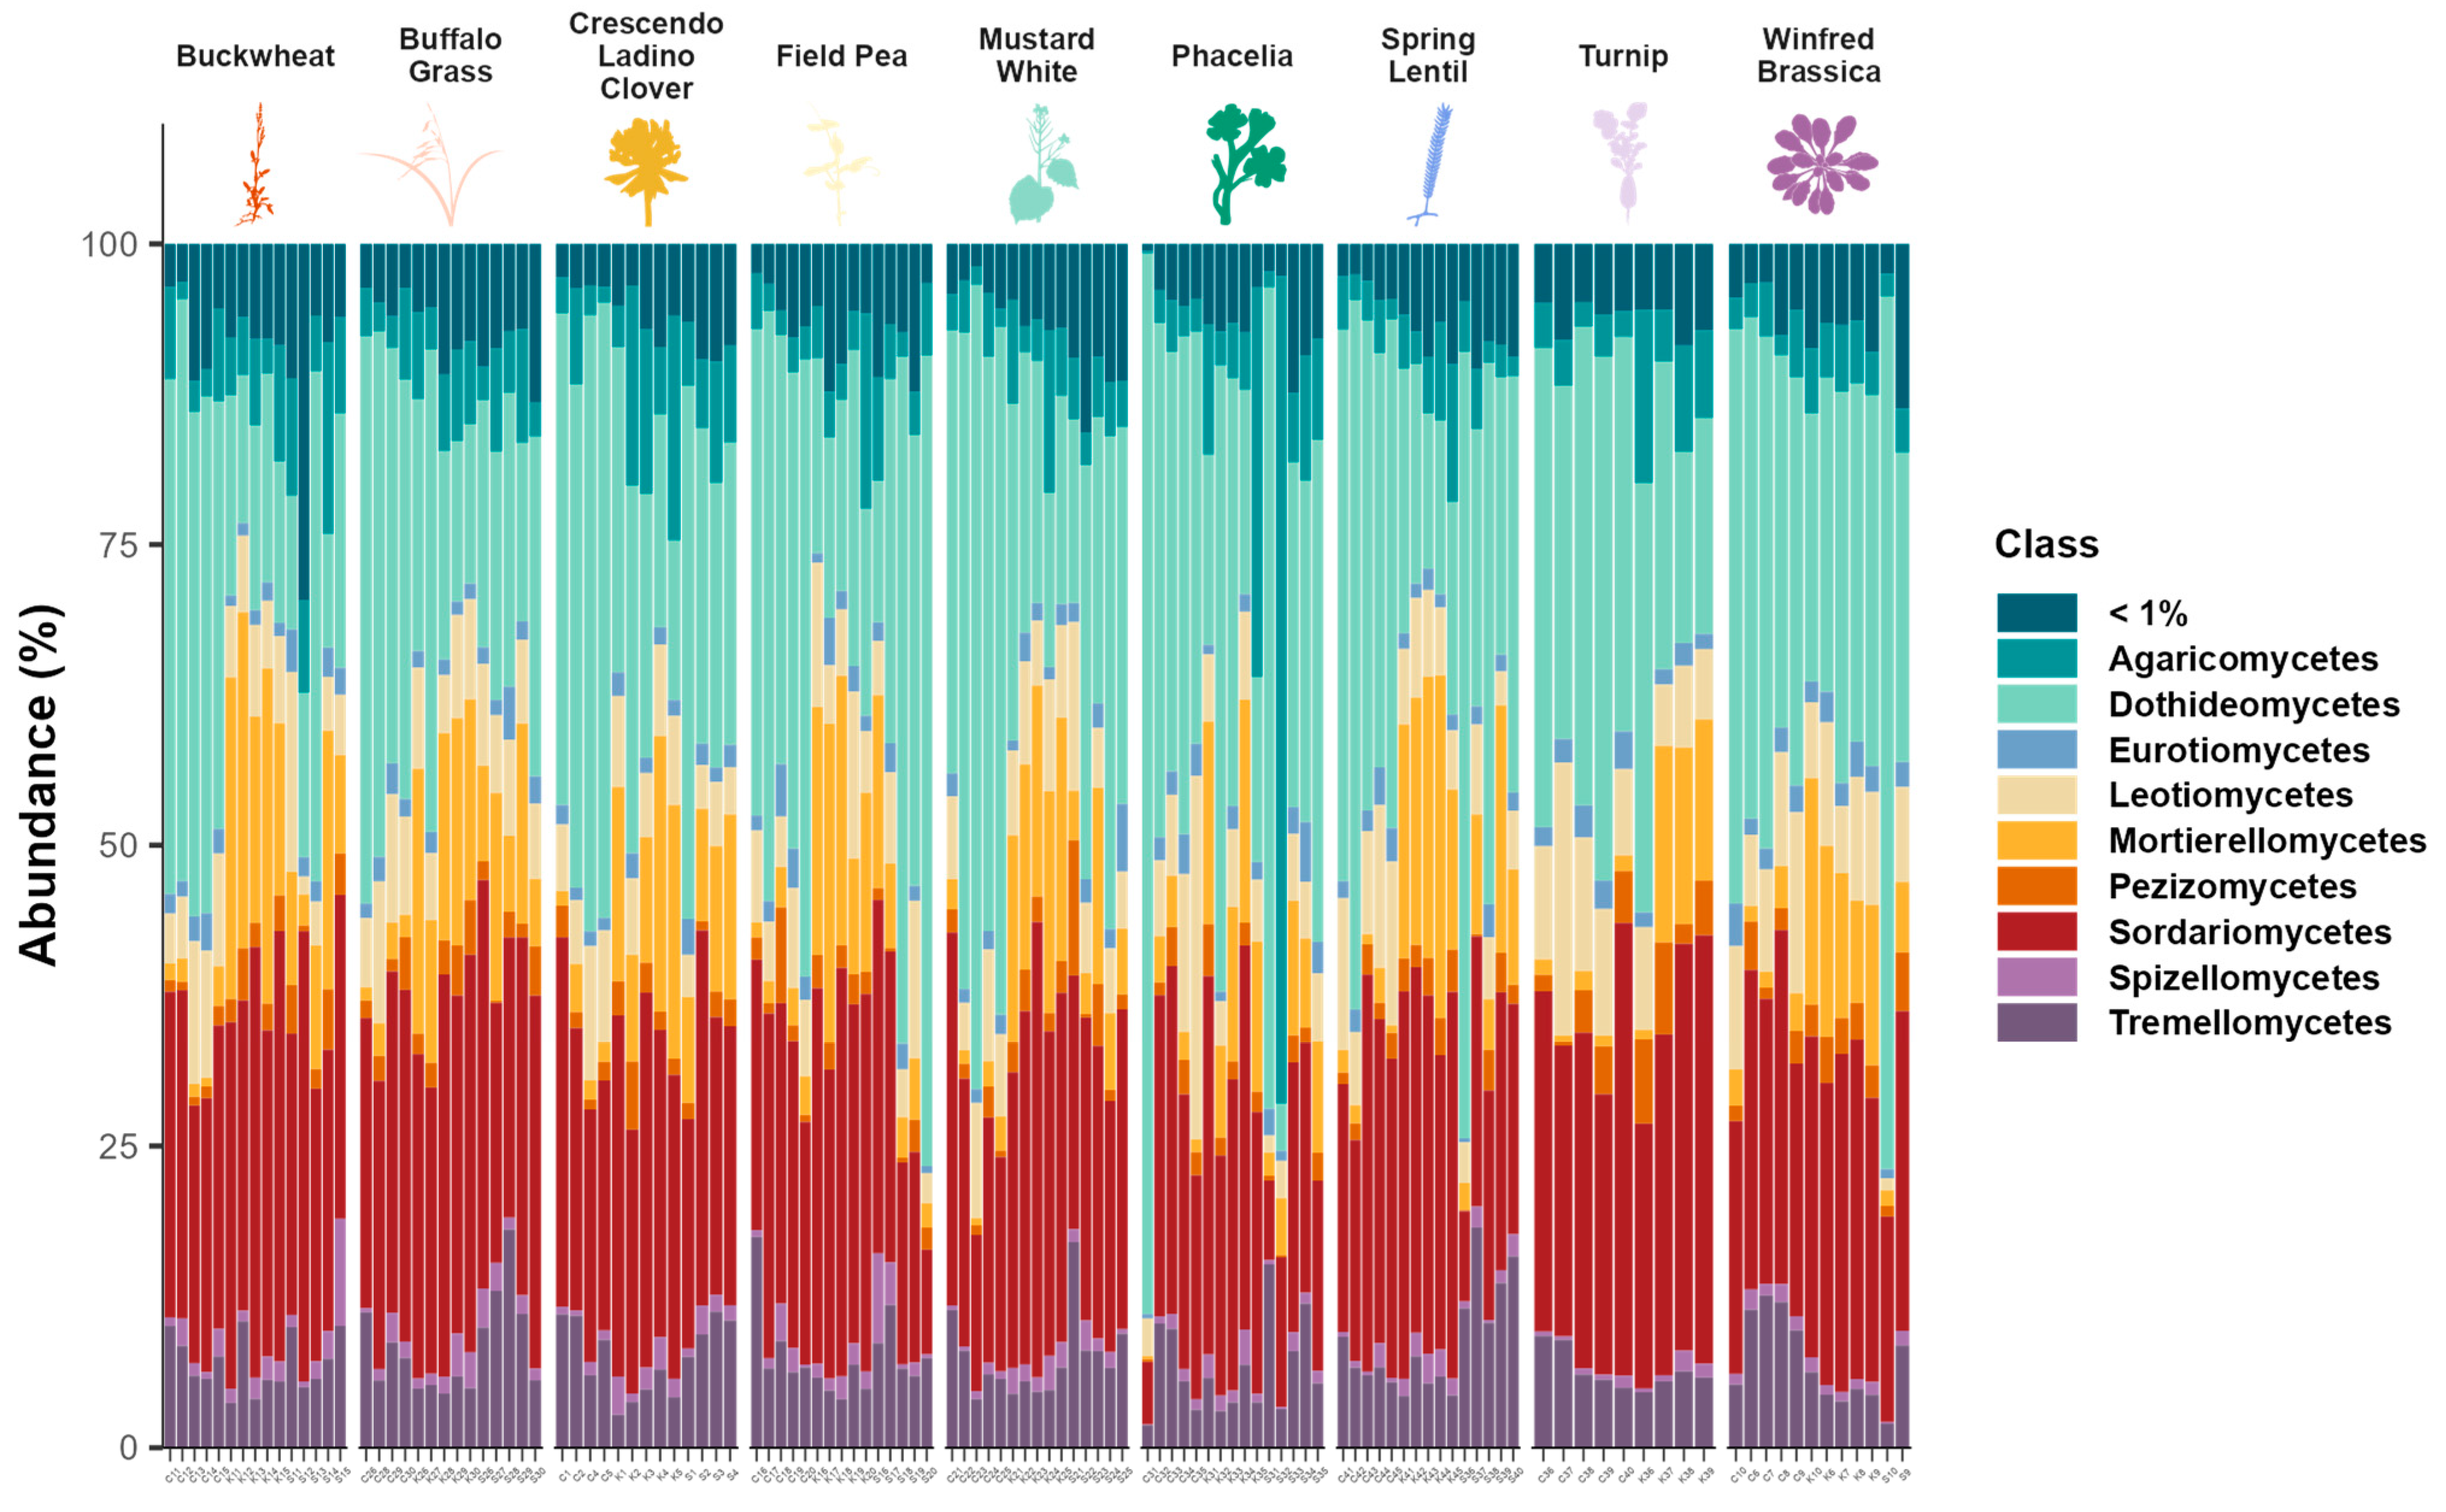
From amplicon sequencing, we identified a total of 1876 unique fungal species across the 123 soil samples, with 1051 (~56.0%) of these being identified at multiple sites, and a further 593 (~31.6%) being found in all three (Figure 2A). The most abundant classes of soil fungi found in samples were Agaricomycetes, Dothideomycetes, Eurotiomycetes, Leotiomycetes, Mortierrellomycetes, Pezizomycetes, Sordariomycetes, Spizellomycetes, and Tremellomycetes (Figure 2). An additional 4981 classes were identified that each represented less than 1% of the total abundance of fungi. These latter classes were grouped together in subsequent analyses.
Though a substantial proportion of fungal species were found across all sites, there were nonetheless clear differences in community composition between the sites. In particular, SuRDC showed lower species richness and diversity on average as compared to Covert and Kalala (Figure 2B). Differences in community composition between sites were confirmed by our random forest model, which was able to classify the samples by site with an accuracy of 98.4%. Indeed, only two samples, one each from Covert and Kalala, were sorted incorrectly into SuRDC. A PCA on the proximity matrix of the site-classification model showed three distinct clusters, one for each site, with no overlap (Figure 2C).

3.2. Cover Crop Choice and Soil Fungal Community Structure

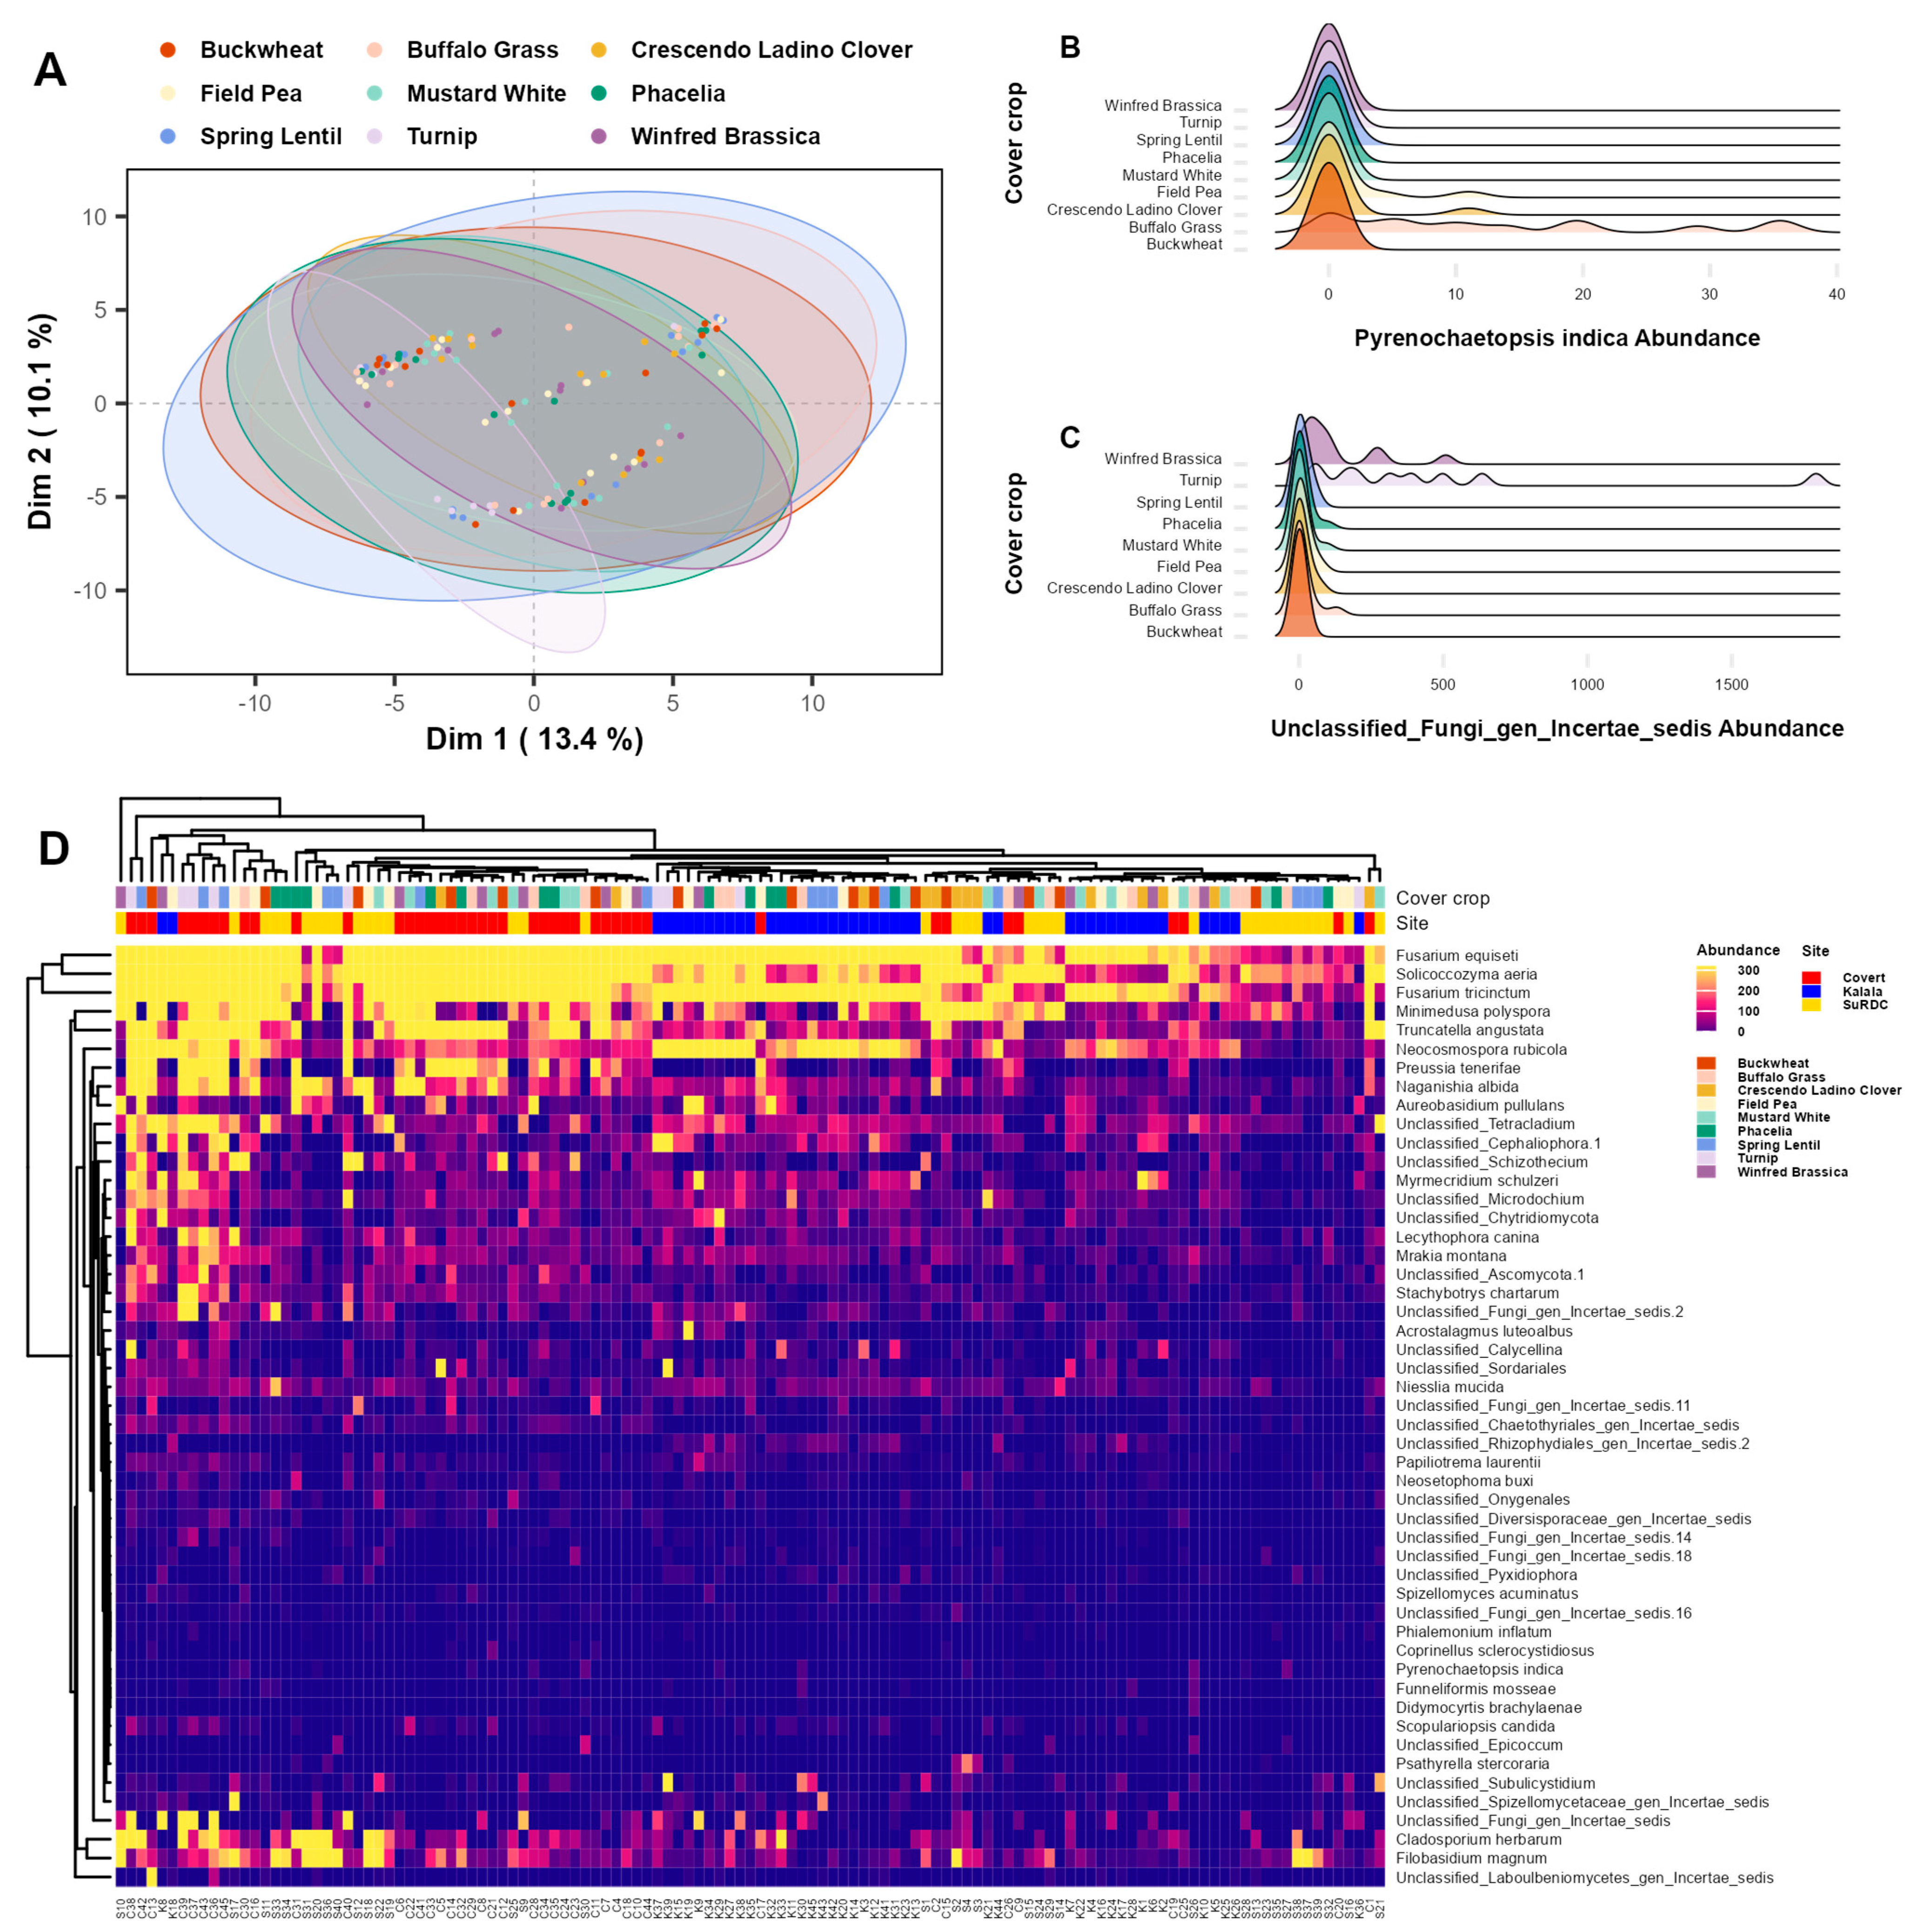
Although soil samples from the three sites displayed clear differences in community structure and composition, we found very few pronounced differences in the mean alpha diversity measures between cover crops (Figure 3; see also Supplementary Materials). However, more cover crops differed significantly in the variance of these measures (Figure 2B; Table S6). In particular, we found significantly lower variance in both Shannon’s (β = 4.06, Z = 5.17, p = 2.35 × 10 7 ) and Simpson’s (β = 3.85, Z = 6.95, p = 3.59 × 10 12 ) diversity in soil fungal communities with phacelia as a cover crop (Table S6). The minimal difference in community composition between cover crop types was further confirmed by a random forest model that exhibited an accuracy of only 2.4% when sorting samples between cover crops. Indeed, a PCA on the proximity matrix of the cover crop classification model showed no clear separation, with the only structure being three clusters of points that ran parallel to each other along a diagonal, likely corresponding to the three sampling sites (Figure 4A). The lack of any clear differences across cover crop types is exemplified via the abundances of Pyrenochaetopsis indica (Figure 4B) and an unclassified fungal species (Figure 4C). Though these two fungal species were identified by the random forest model as the primary predictors of cover crop difference, they exhibited near identical abundances across most cover crop species. A heat map was made to visualize the abundances of the 50 species identified by the random forest model as the primary predictors for cover crop sorting (Figure 4D). Unsurprisingly, abundances varied greatly by species, cover crop, and site, ranging from 0 (i.e., absent) to over a thousand counts. Here, again, there were no clear clustering patterns of fungal species by cover crop, though there was a tendency for samples from the same site to cluster.
A heat map was made to visualize the abundances of the 50 species identified by the random forest model as the primary predictors for cover crop sorting (Figure 4D). Abundances varied greatly by species, cover crop, and site, ranging from 0 (i.e., absent) to over a thousand. Here again, there were no clear patterns for clustering important species by cover crop, though there was a tendency for samples from the same site to be clustered, indicated by the larger blocks of red, blue, and yellow grouped together.
Although there were few differences in community diversity across cover crops, trends in the community structure determined by co-occurrence network topology were more apparent (Table S6). For all measures of network topology modeled, including the total vertex and edge counted from network graphs, the connectivity, and connectance, fungal communities sampled under crescendo ladino clover were significantly different from buckwheat and from other cover crops (File S1 Figure S4; Table S6). Crescendo ladino clover communities had lower mean values and less variance than other cover crop communities in terms of the number of vertices (equal to species count), the number of edges, and connectivity, indicating lower network complexity and likely reduced community structure among fungal species found in clover samples. Turnip soil samples were also found to have much greater variance in network topology; however, this may have resulted from having fewer samples for turnips due to weak or failed sequencing reads.
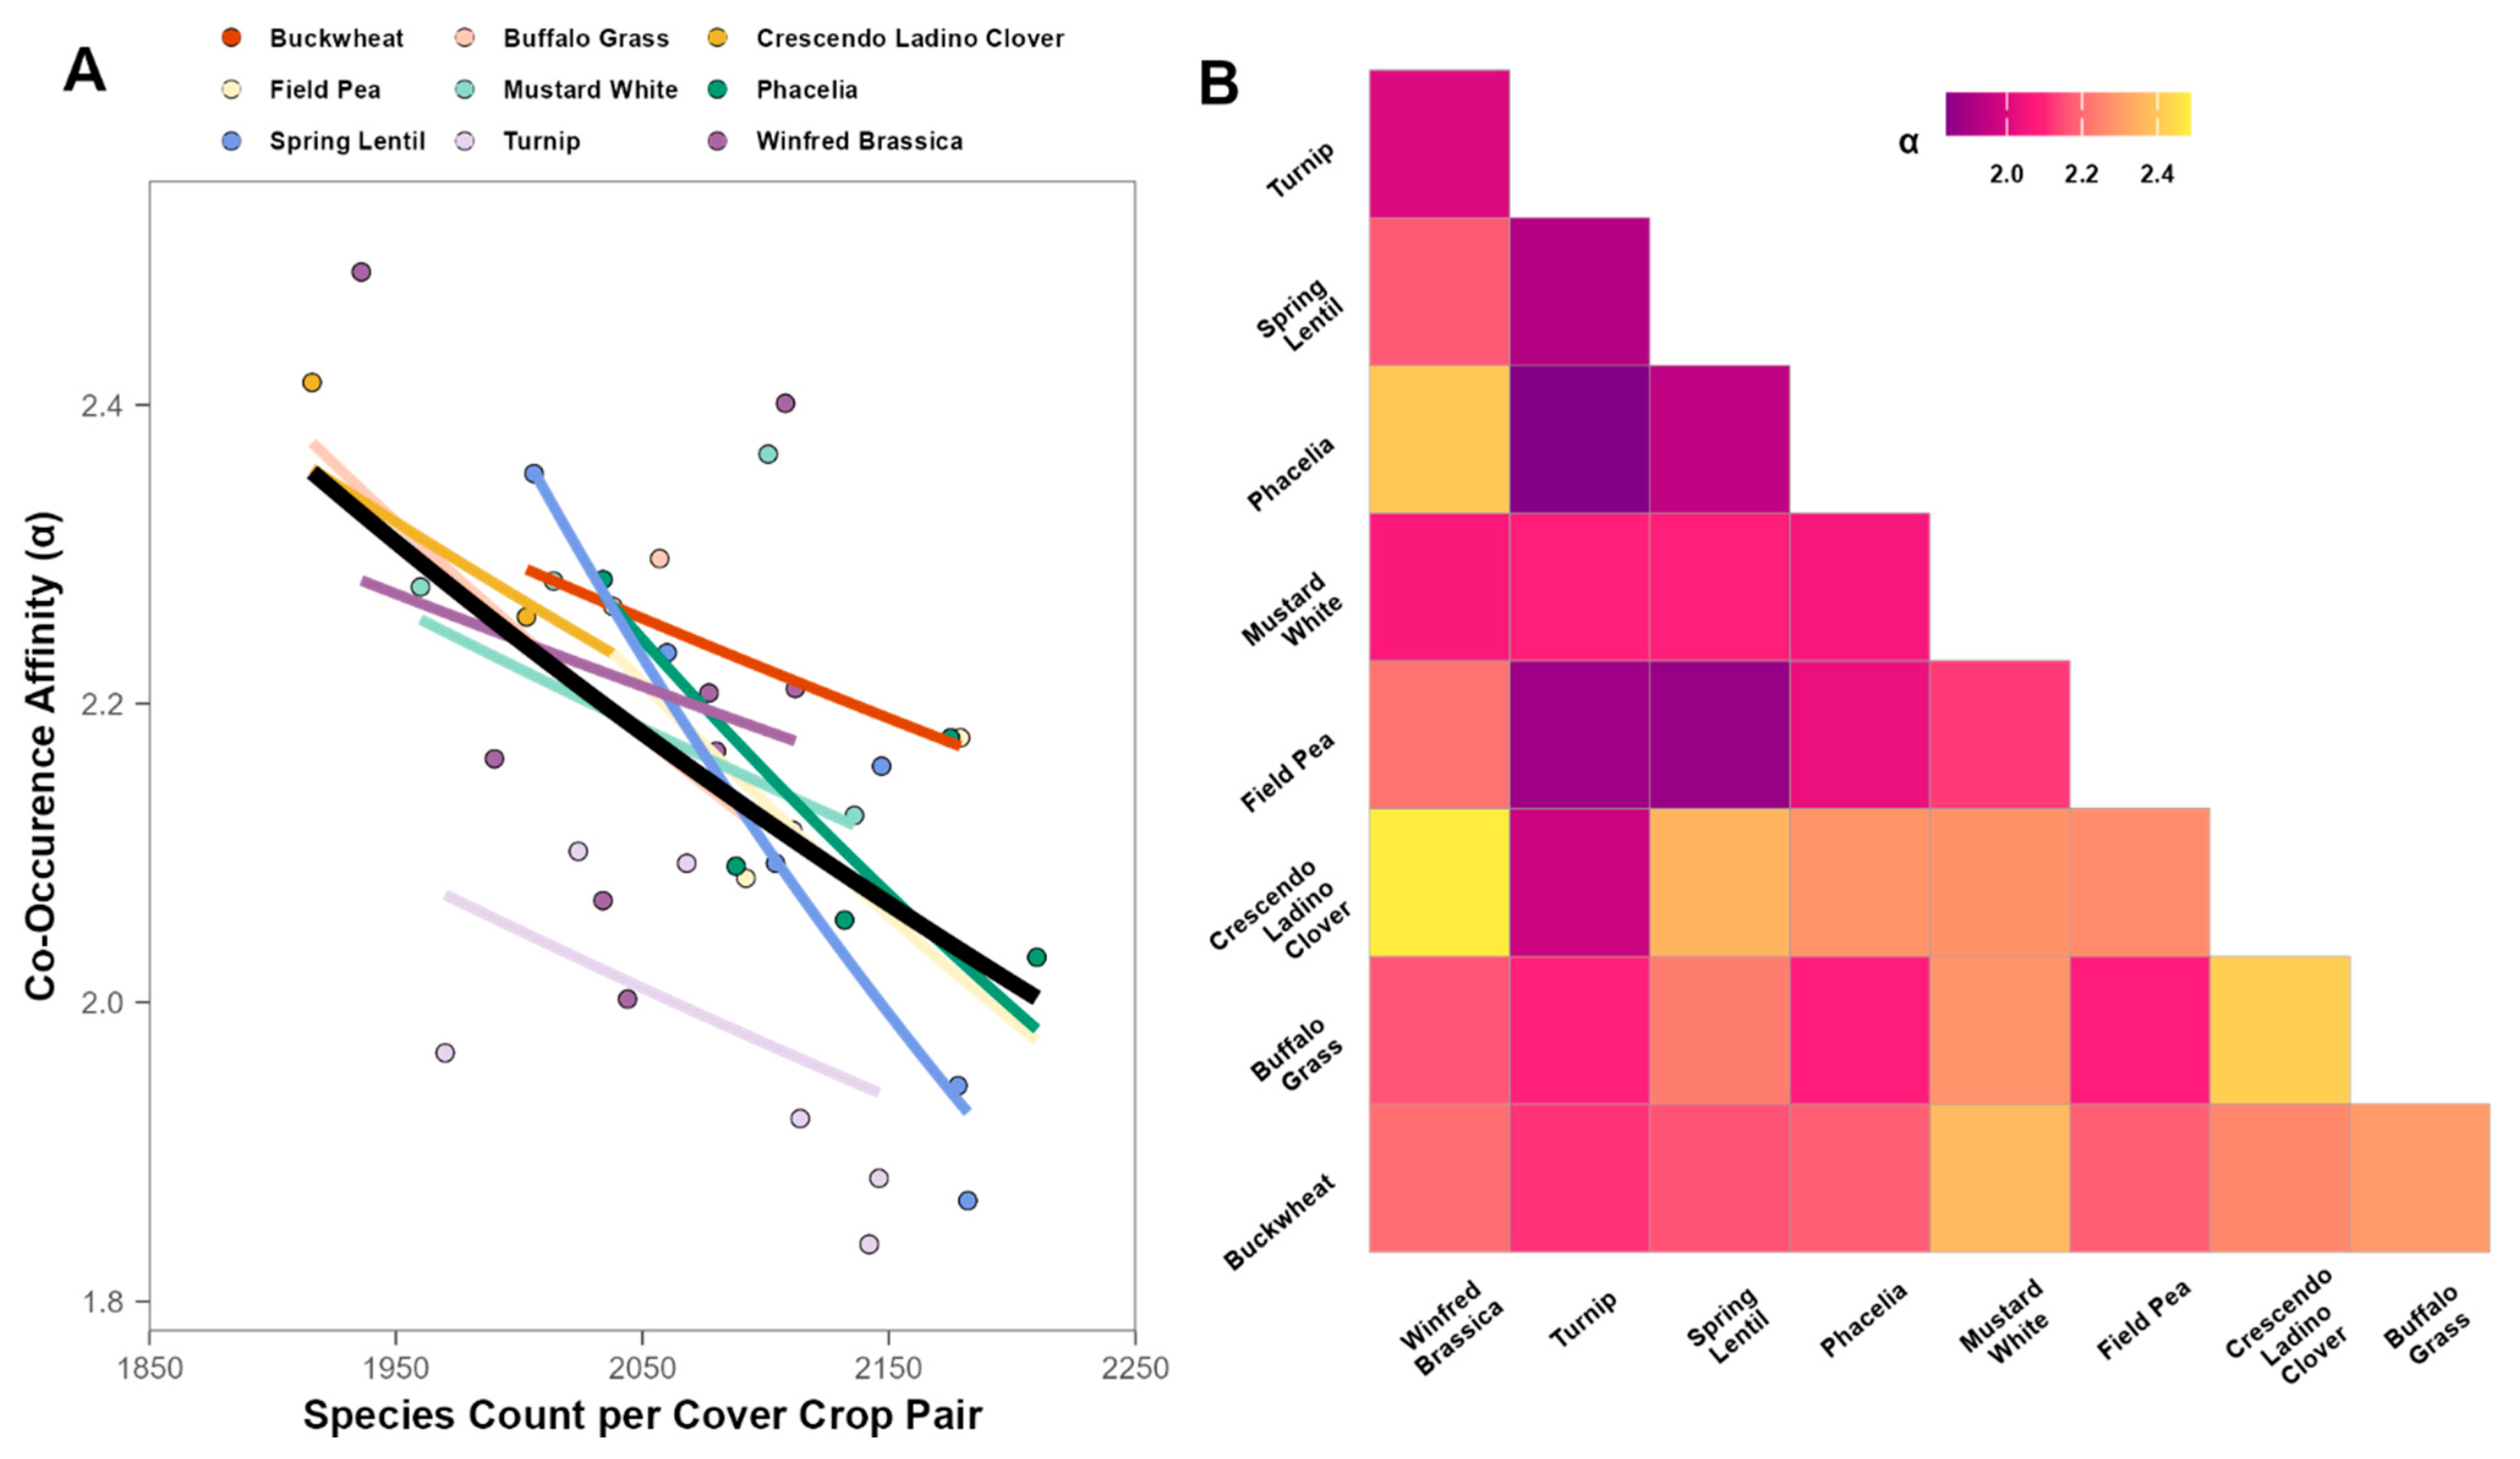
Finally, in terms of patterns of co-occurrence affinity, α values did not differ greatly between pairs of cover crops and species were generally likely to be found in both cover crop species of a pair. For all combinations of cover crop pairs, we found a significant negative relationship between the total number of fungal species in the soil and co-occurrence affinity (β = 1.19 × 10 3 , t70 = 5.44 , p < 0.001; Figure 5A). This trend was consistent for all pairings of cover crops and α depreciated at a comparable rate for all, as seen by the slopes in Figure 5. The only cover crop pairings that showed appreciable differences in the co-occurrence affinity of fungal species were those that included turnips, which tended to have lower α values.

3.3. Pathogens and Beneficials

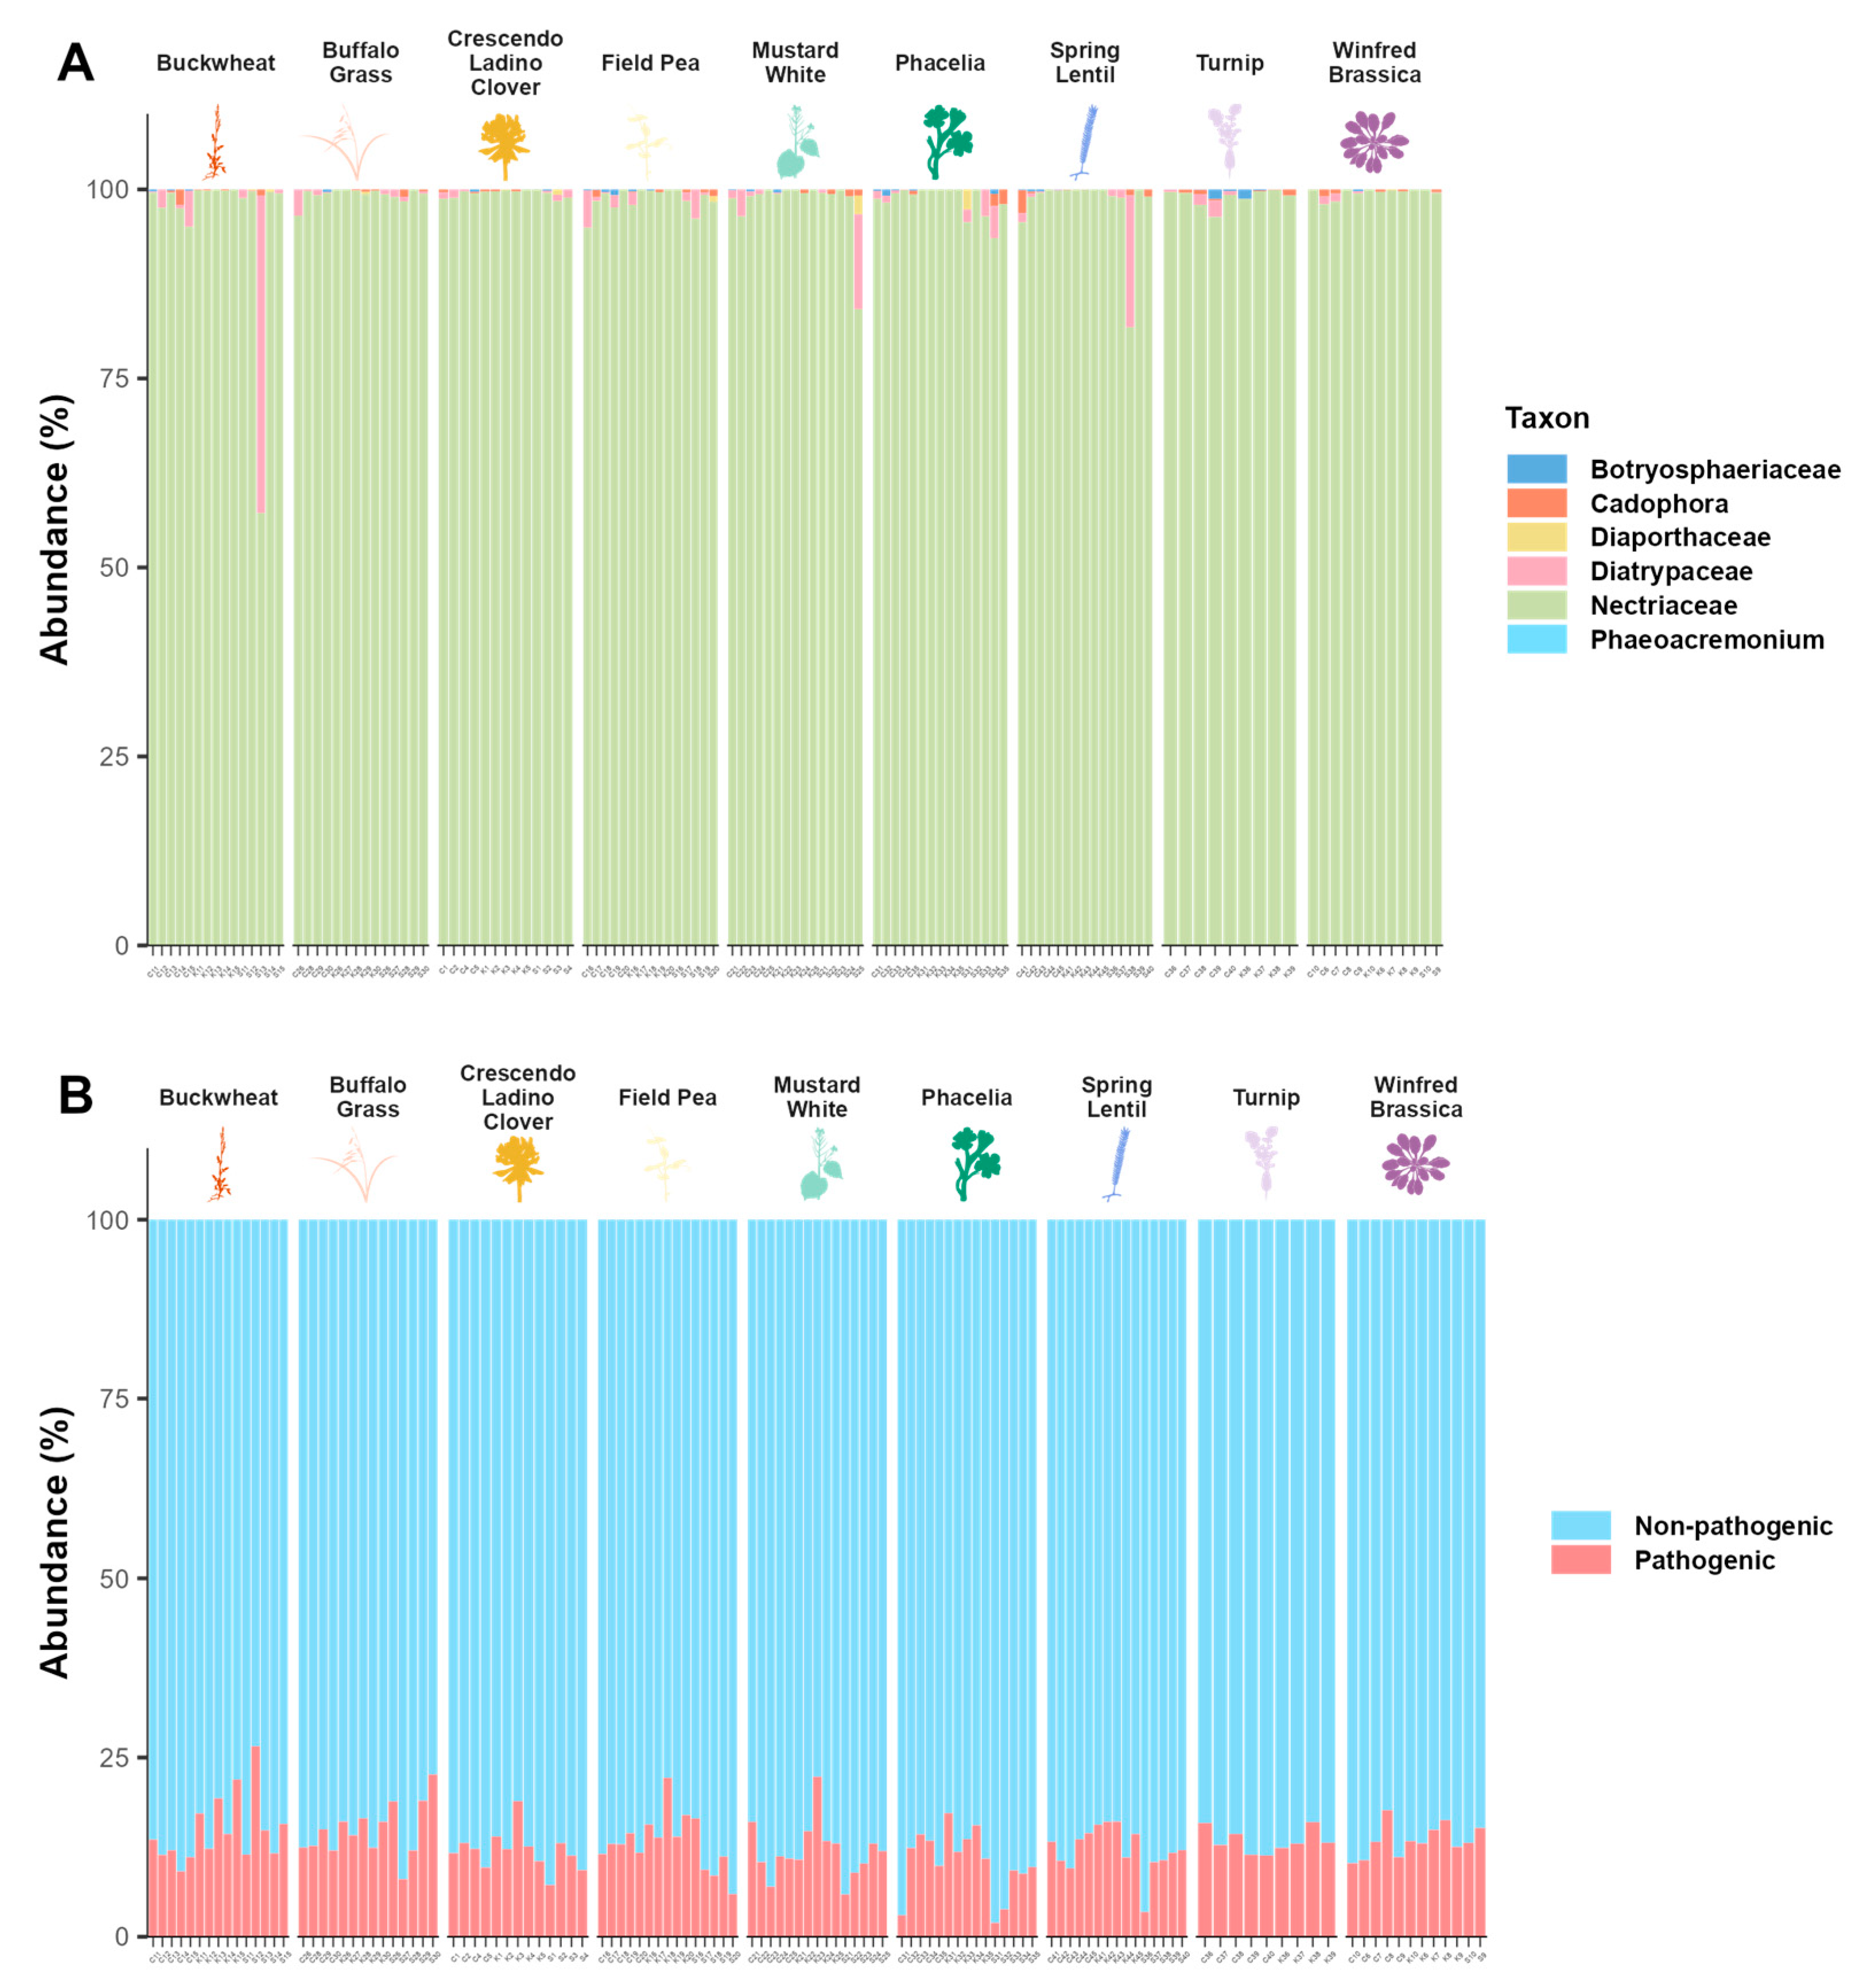
The ratio of putative pathogenic to non-pathogenic fungal taxa was comparable across cover crop species and site, with less than 30% of taxa being pathogenic in each soil sample measured (Figure 6B). Overall, Nectriaceae was the most abundant group of pathogens, identified based on a compiled list of taxa (Figure 6A). This family of fungi was present in every sample, with the exception of SuRDC turnips, as these samples were excluded from the main analysis. Other taxa that were found include, in no particular order, Botryosphaeriaceae, Cadophora, Diaporthaceae, Diatrypaceae, and Phaeoacremonium.
Of all sites, Covert and Kalala appeared to have the greatest overall abundances of pathogens compared with SuRDC, except for buckwheat, buffalo grass, and Winfred brassica. Field pea, phacelia, and spring lentil samples from SuRDC had the lowest abundance of pathogens (Figure 6). Three individual samples from SuRDC, one each from buckwheat, white mustard, and spring lentil, also consisted of a greater relative abundance of species from the Diatrypaceae family than samples for other cover crops and the other two sites (Covert and Kalala; Figure 6A).
Glomeromycota, a known beneficial taxon which constitutes the fungal partner in AMF symbiosis, were not among the most abundant fungal taxa in the community compositions (Figure 3). Due to their relatively rarer abundance, the Glomeromycota were grouped with other fungal classes that comprised <1% of the total fungal communities.

4. Discussion

Determining how cover crops may affect soil microbial communities at micro- and macro-scales can benefit agricultural systems by allowing grape and other perennial crop growers to make conscious decisions about the crop species used for groundcover. Cover crops have been shown to confer benefits to perennial crop growth through mycorrhizal interactions (i.e., AMF symbioses) [56], anti-microbial effects against soil-borne pathogens (i.e., Brassicaceae and Capparidaceae) [11,17], and protection against herbivory (i.e., Fabaceae, Alliaceae, Asteraceae, Polygonaceae, Polygalaceae and Agavaceae) [19,20]. Groundcover may also modulate the abundance of fungal pathogens that could negatively affect vine performance (i.e., Nectriaceae) [53,54,55]. Our field study was conducted to identify potential effects of cover crop identity on soil fungi, with a focus on known fungal vine pathogens. We further discuss the interaction of cover crops with environmental variables that may influence soil microbiota on a site-wide level and extend our findings beyond the Okanagan Valley vineyards sampled to consider general implications for perennial systems.

4.1. Cover Crop Host Effects

Overall, characterization of the soil fungal profile across common cover crop species did not find any significant differences in fungal communities between crop species within each site, suggesting that cover crops have consistent short-term (<1 year) effects on soil fungal communities, regardless of crop identity. This was further supported by our analysis of co-occurrence affinity (α) between pairs of cover crop species, which found α to be similarly negatively correlated with species count per cover crop pair for all possible pairings. As pairwise α generally showed similar slopes across species, this indicated that soil fungal species were comparably likely to co-occur for most cover crop species [47]. Additionally, we used a machine learning approach, random forest [49], to determine any clustering of soil samples by site or cover crop. Random forest classification attempted to sort samples by cover crop species with a high error rate, 97.6%. The poor accuracy in matching sample to cover crop implied a high degree of likeness in soil fungal communities across cover crops, as cover crop hosts did not have sufficiently large effects on their soil microbiomes for a machine learning process to successfully distinguish the fungal communities between hosts. Thus, our findings provide little evidence for strong cover crop host effects on soil fungal communities.
Interestingly, comparing α across cover crops revealed lower α for crops paired with turnips, indicating that soil fungi for each groundcover species differed more greatly from turnip fungal communities than when assessed against any other cover crop species. Likewise, our random forest analysis for cover crops more distinctly characterized turnip soil samples, as visualized in the PCA clustering patterns. These results could suggest that turnips foster soil communities containing more unique fungal species than other widely used cover crops, perhaps partly due to anti-fungal properties exhibited by brassicaceous crops [18]. Indeed, pairings with white mustard, another brassicaceous species, for co-occurrence affinity analyses also had relatively lower α, though this finding was not consistent across all brassicaceous cover crops tested. We caution, also, that turnip soil samples from SuRDC were excluded due to weak sequencing outputs, which reduced our sample size, the remaining samples belonging to only two of the three total sites. As such, we do not exclude the possibility that this limitation could have conflated any results related to the turnip crops. Our results from this study did not find any clear advantages nor disadvantages for selecting certain cover crop species, such as turnips. We do, however, caution that while turnips established well in all sites, they were an apparent attractant for wireworms, which could cause potential plant damage as previously studied in common crops, such as wheat seedlings [57], maize [58], and potato tubers [59]. Thus, while the use of turnips may contribute to differences in grapevine performance attributed to a greater inconsistency of their soil fungal communities with other cover crops, further investigation is needed to better understand whether the variance in fungal taxa observed between turnips and other cover crops does indeed lead to differing perennial productivity. Future studies are also needed to ascertain the conditions during which growers may benefit or be disadvantaged from choosing turnips for groundcover over other crops. For example, studies for selecting optimal cover crop species using the closely related winter turnip rape (Brassica rapa subsp. oleifera) found that the turnip rape improves nutrient uptake and may be particularly suitable at northern latitudes [60,61].

4.2. Site Effects

Taxonomic classification and counts of unique fungal species per site revealed that there were distinct differences between the communities across the sites. As mean species richness and community diversity were found to be similar between cover crop species but were distinct across sites, it is likely that site-specific differences account for variation in soil fungal communities. Indeed, this matches with what was observed for site-specific soil chemistry, where soil acidity and nutrients differed between sites. Specifically, SuRDC soil was more nutrient-rich overall compared to Covert and Kalala for both plant macronutrients and micronutrients. Notably, SuRDC soil samples contained greater amounts of phosphorus than the other two sites, while Kalala soils were coarser and sandier in texture and composition, which could have affected soil hydrology, specifically water retention [62,63]. It is worth noting that differences in soil treatment (i.e., use of fertilizers [64], irrigation regime [65], vine treatment [64], and other variables) and soil sampling protocol (composite or individual) between the two commercial farms, Covert and Kalala, and the research centre, SuRDC, may have impacted the soil chemistry data and observed fungal communities. Moreover, soil properties were determined from alleyway samples to provide an overview of major site-wide soil characteristics; however, properties may differ somewhat between alleyway data and under-vine soils from which we sampled for fungal community analysis.
Furthermore, the marginal error rate (98.4%) of the random forest classification by site showed that fungal communities differed significantly between sites, regardless of cover crop species, such that the random forest model was able to classify samples by site with high accuracy [49]. The clear overlap of sample clusters in the PCA plot defined by cover crop species emphasized that within each site, the soil fungal community of a given cover crop species was not distinctly different from that of any other cover crop species; however, as indicated by the three nondelineated clusters running parallel to each other across dimensions, soil communities were distinguishable according to the three sites. This finding was also confirmed by the clustering of samples by site in the column annotation of the corresponding heatmap generated for the top 50 most important species in the random forest model. Therefore, soil fungal communities differed greatly across sites, but communities resembled each other across cover crop species within each site, suggesting that common cover crops have consistent short-term effects on soil fungi within sites. As such, a chosen cover crop species may not produce the same soil fungal communities when planted at different locations. Future work and long-term studies are needed to elucidate the degree to which soil cultures of the same cover crop vary across environmental conditions and over longer periods.

4.3. Fungal Community Composition and Key Fungal Taxa

Overall, our diversity and taxonomic analyses found that soil fungal communities differed significantly across sites but had similar taxa for various cover crop species within each site. These results revealed that despite there being substantial differences in soil fungal communities between sites, the cover crop choice itself may have little impact on soil fungal communities over periods shorter than a year. Although average community diversity metrics were relatively stable across cover crop, these measures exhibited differences in variance, which could indicate that site-specific conditions, such as soil chemistry, play a greater role than cover crop in modulating soil microbiota.
Previous research has shown that common cover crops, such as buckwheat and phacelia, can serve as hosts for grapevine pathogens [16]. Upon filtering our results for putative fungal vine pathogens, such as species belonging to the Nectriaceae family [53,54,55], no particular groundcover species appeared to culture proportionally more or less pathogens on average. Cover crop identity coupled with site conditions did, however, appear to influence the occurrence of specific pathogenic taxa, such as elevating the relative abundance of Diatrypaceae at SuRDC, albeit only for a few samples. While field pea, phacelia, and spring lentil had the lowest relative abundance of pathogens at SuRDC, this was not a trend exhibited at all sites as putative pathogens were relatively more abundant at Kalala for all three cover crop species and at Covert for field pea samples. Thus, differences in pathogen abundance may be more heavily attributed towards site environments. Regardless, as Nectriaceae were present and abundant across all cover crops and sites, it is possible that either all cover crops studied promote the proliferation of Nectriaceae, as reported by Rosa et al. [16], or that fungi in this family occur naturally in Okanagan soils at greater relative abundances. This high relative abundance of Nectriaceae could also be attributed to the higher taxonomic level (family) at which the data were filtered compared to other key taxa specified at the genus and species level; Nectriaceae is known to be a large fungal family, containing 69 recognized genera and about 1336 species as recorded in 2020 [66].

5. Conclusions

The use of cover cropping demands knowledge of the cover crop–soil effects on below-ground microbial communities which can impact cash crop growth, especially regarding the potential for cover crops and site-wide conditions to culture plant beneficials and pathogens. This study reveals that, in vineyard systems, site-specific soil conditions have a stronger influence on soil fungal communities than cover crop species, underscoring the need for tailored cover crop strategies. While cover crops can enhance soil health, their impact on the fungal soil microbiome appears minimal in the short term, suggesting that long-term studies are needed. Species like crescendo ladino clover, which promotes simpler fungal networks, may be beneficial for stable soil health without promoting pathogens. For sustainable vineyard management, it is recommended to select cover crops based on site-specific soil conditions, especially phosphorus levels, and consider species like crescendo ladino clover to support resilient soil microbial communities. This approach could reduce pathogen risk and support sustainability in perennial agriculture. Further investigation is necessary to elucidate the effects of soil fungal communities on the productivity of grapevines as a representative cash crop for perennial systems.

Supplementary Materials

The following supporting information can be downloaded at: https://www.mdpi.com/article/10.3390/agronomy14122835/s1, File S1: Cover Crop Fungal Community Analysis; Table S1: Soil Characterization Results; Table S2: Covert Soil Organic Carbon and Nitrogen; Table S3: Kalala Soil Organic Carbon and Nitrogen; Table S4: Summerland RDC Soil Organic Carbon and Nitrogen; Table S5: Soil Characterization Mean and Range; Table S6: Model Summary for Diversity and Network Measures.

Author Contributions

Conceptualization, D.R., M.J.N., and M.H.; Methodology, E.Y.L., D.R., M.S., and M.J.N.; Software, E.Y.L.; Validation, M.S. and M.J.N.; Formal Analysis, E.Y.L.; Investigation, D.R. and M.S.; Resources, D.R., M.S., and M.J.N.; Data Curation, E.Y.L., M.S.; Writing—Original Draft Preparation, E.Y.L.; Writing—Review and Editing, M.S., M.J.N., and M.H.; Visualization, E.Y.L.; Supervision, M.J.N. and M.H.; Project Administration, M.J.N. and M.H.; Funding Acquisition, E.Y.L., M.S., and M.J.N. All authors have read and agreed to the published version of the manuscript.

Funding

This research was funded by the Natural Sciences and Engineering Research Council of Canada (NSERC) Discovery Grant [RGPIN-2021-02758] to M.J.N., as well as the Canadian Foundation for Innovation. E.Y.L. was supported by the University of British Columbia Okanagan, and an NSERC USRA grant [2024-593696]. The field study was funded by Agriculture and Agri-Food Canada (AAFC) and the British Columbia Wine Grape Council (BCWGC) through the Canadian Agricultural Partnership Program (CAP- Organic Science Cluster III—ASC13—Activity 15A; AAFC Project ID: J-002172). The Organic Science Cluster III projects were administered by the Organic Agriculture Centre of Canada (OACC).

Data Availability Statement

Data will be made available on request.

Acknowledgments

The authors would like to thank NSERC and the University of British Columbia Okanagan for funding this research. Additionally, the authors thank the Quantitative Ecology Lab, Hart Lab, and the Okanagan Institute for Biodiversity, Resilience, and Ecosystem Services at the University of British Columbia Okanagan, as well as the Summerland Research and Development Centre for Agriculture and Agri-Food Canada for supporting data collection and research analysis.

Conflicts of Interest

The authors declare no conflicts of interest.

References

  1. Zohry, A.; Ouda, S. Crop Rotation Defeats Pests and Weeds. In Crop Rotation; Springer International Publishing: Cham, Switzerland, 2018; pp. 77–88. ISBN 978-3-030-05350-5. [Google Scholar]
  2. Dzvene, A.R.; Tesfuhuney, W.A.; Walker, S.; Ceronio, G. Management of Cover Crop Intercropping for Live Mulch on Plant Productivity and Growth Resources: A Review. Air Soil Water Res. 2023, 16, 11786221231180079. [Google Scholar] [CrossRef]
  3. Jian, J.; Du, X.; Reiter, M.S.; Stewart, R.D. A Meta-Analysis of Global Cropland Soil Carbon Changes Due to Cover Cropping. Soil Biol. Biochem. 2020, 143, 107735. [Google Scholar] [CrossRef]
  4. McClelland, S.C.; Paustian, K.; Schipanski, M.E. Management of Cover Crops in Temperate Climates Influences Soil Organic Carbon Stocks: A Meta-analysis. Ecol. Appl. 2021, 31, e02278. [Google Scholar] [CrossRef] [PubMed]
  5. Helgason, B.L.; Janzen, H.H.; Chantigny, M.H.; Drury, C.F.; Ellert, B.H.; Gregorich, E.G.; Lemke, R.L.; Pattey, E.; Rochette, P.; Wagner-Riddle, C. Toward Improved Coefficients for Predicting Direct N2O Emissions from Soil in Canadian Agroecosystems. Nutr. Cycl. Agroecosyst. 2005, 72, 87–99. [Google Scholar] [CrossRef]
  6. Wang, H.; Beule, L.; Zang, H.; Pfeiffer, B.; Ma, S.; Karlovsky, P.; Dittert, K. The Potential of Ryegrass as Cover Crop to Reduce Soil N2O Emissions and Increase the Population Size of Denitrifying Bacteria. Eur. J. Soil Sci. 2021, 72, 1447–1461. [Google Scholar] [CrossRef]
  7. Zhang, H.; Ghahramani, A.; Ali, A.; Erbacher, A. Cover Cropping Impacts on Soil Water and Carbon in Dryland Cropping System. PLoS ONE 2023, 18, e0286748. [Google Scholar] [CrossRef]
  8. Wang, Q.; Li, Y.; Klassen, W. Influence of Summer Cover Crops on Conservation of Soil Water and Nutrients in a Subtropical Area. J. Soil Water Conserv. 2005, 60, 58–63. [Google Scholar]
  9. Murrell, E.G.; Ray, S.; Lemmon, M.E.; Luthe, D.S.; Kaye, J.P. Cover Crop Species Affect Mycorrhizae-Mediated Nutrient Uptake and Pest Resistance in Maize. Renew. Agric. Food Syst. 2020, 35, 467–474. [Google Scholar] [CrossRef]
  10. Rosado, M.D.C.; Araújo, G.J.D.; Pallini, A.; Venzon, M. Cover Crop Intercropping Increases Biological Control in Coffee Crops. Biol. Control 2021, 160, 104675. [Google Scholar] [CrossRef]
  11. Berlanas, C.; Andrés-Sodupe, M.; López-Manzanares, B.; Maldonado-González, M.M.; Gramaje, D. Effect of White Mustard Cover Crop Residue, Soil Chemical Fumigation and Trichoderma spp. Root Treatment on Black-foot Disease Control in Grapevine. Pest. Manag. Sci. 2018, 74, 2864–2873. [Google Scholar] [CrossRef]
  12. Mazzola, M.; Manici, L.M. Apple Replant Disease: Role of Microbial Ecology in Cause and Control. Annu. Rev. Phytopathol. 2012, 50, 45–65. [Google Scholar] [CrossRef] [PubMed]
  13. Latz, E.; Eisenhauer, N.; Rall, B.C.; Scheu, S.; Jousset, A. Unravelling Linkages between Plant Community Composition and the Pathogen-Suppressive Potential of Soils. Sci. Rep. 2016, 6, 23584. [Google Scholar] [CrossRef] [PubMed]
  14. Berg, G.; Smalla, K. Plant Species and Soil Type Cooperatively Shape the Structure and Function of Microbial Communities in the Rhizosphere: Plant Species, Soil Type and Rhizosphere Communities. FEMS Microbiol. Ecol. 2009, 68, 1–13. [Google Scholar] [CrossRef] [PubMed]
  15. Aleklett, K.; Hart, M. The Root Microbiota—A Fingerprint in the Soil? Plant Soil 2013, 370, 671–686. [Google Scholar] [CrossRef]
  16. Rosa, D.; Sharifi, M.; Hart, M.M. Cover Crops as Reservoirs for Young Vine Decline Pathogens. Agronomy 2022, 12, 2422. [Google Scholar] [CrossRef]
  17. Bleach, C.M. Management of Cylindrocarpon Black Foot Disease in New Zealand Nurseries and Vineyards. Ph.D. Thesis, Lincoln University, Christchurch, New Zealand, 2013. [Google Scholar]
  18. Richards, A.; Estaki, M.; Úrbez-Torres, J.R.; Bowen, P.; Lowery, T.; Hart, M. Cover Crop Diversity as a Tool to Mitigate Vine Decline and Reduce Pathogens in Vineyard Soils. Diversity 2020, 12, 128. [Google Scholar] [CrossRef]
  19. Shen, B.-B.; Yang, Y.-P.; Yasamin, S.; Liang, N.; Su, W.; Chen, S.-H.; Wang, X.-J.; Wang, W. Analysis of the Phytochemistry and Bioactivity of the Genus Polygonum of Polygonaceae. Digit. Chin. Med. 2018, 1, 19–36. [Google Scholar] [CrossRef]
  20. Sparg, S.G.; Light, M.E.; Van Staden, J. Biological Activities and Distribution of Plant Saponins. J. Ethnopharmacol. 2004, 94, 219–243. [Google Scholar] [CrossRef]
  21. Mohammadi, A.; Hashemi, M.; Hosseini, S.M. Comparison of Antifungal Activities of Various Essential Oils on the Phytophthora Drechsleri, the Causal Agent of Fruit Decay. Iran. J. Microbiol. 2015, 7, 31–37. [Google Scholar]
  22. O’Farrell, C.; Forge, T.; Hart, M.M. Using Brassica Cover Crops as Living Mulch in a Vineyard, Changes over One Growing Season. Int. J. Plant Biol. 2023, 14, 1105–1116. [Google Scholar] [CrossRef]
  23. Jung, S.C.; Martinez-Medina, A.; Lopez-Raez, J.A.; Pozo, M.J. Mycorrhiza-Induced Resistance and Priming of Plant Defenses. J. Chem. Ecol. 2012, 38, 651–664. [Google Scholar] [CrossRef]
  24. Nader, A.A.; Hauka, F.I.A.; Afify, A.H.; El-Sawah, A.M. Drought-Tolerant Bacteria and Arbuscular Mycorrhizal Fungi Mitigate the Detrimental Effects of Drought Stress Induced by Withholding Irrigation at Critical Growth Stages of Soybean (Glycine max, L.). Microorganisms 2024, 12, 1123. [Google Scholar] [CrossRef]
  25. Guerra, B.; Steenwerth, K. Influence of Floor Management Technique on Grapevine Growth, Disease Pressure, and Juice and Wine Composition: A Review. Am. J. Enol. Vitic. 2012, 63, 149–164. [Google Scholar] [CrossRef]
  26. White, C.A.; Holmes, H.F.; Morris, N.L.; Stobart, R.M. A Review of the Benefits, Optimal Crop Management Practices and Knowledge Gaps Associated with Different Cover Crop Species; AHDB Cereals & Oilseeds; Agriculture and Horticulture Development Board (AHDB): Coventry, UK, 2016; pp. 1–92. [Google Scholar]
  27. Ettema, C.; Wardle, D.A. Spatial Soil Ecology. Trends Ecol. Evol. 2002, 17, 177–183. [Google Scholar] [CrossRef]
  28. Philippot, L.; Chenu, C.; Kappler, A.; Rillig, M.C.; Fierer, N. The Interplay between Microbial Communities and Soil Properties. Nat. Rev. Microbiol. 2024, 22, 226–239. [Google Scholar] [CrossRef]
  29. Mehlich, A. Mehlich 3 Soil Test Extractant: A Modification of Mehlich 2 Extractant. Commun. Soil Sci. Plant Anal. 1984, 15, 1409–1416. [Google Scholar] [CrossRef]
  30. Sharifi, M.; Salimi, K.; Rosa, D.; Hart, M. Screening Cover Crops for Utilization in Irrigated Vineyards: A Greenhouse Study on Species’ Nitrogen Uptake and Carbon Sequestration Potential. Plants 2024, 13, 1959. [Google Scholar] [CrossRef]
  31. Tompkins, J.M. Ecosystem Services Provided by Native New Zealand Plants in Vineyards. Ph.D. Thesis, Lincoln University, Christchurch, New Zealand, 2010. [Google Scholar]
  32. Olmstead, M.A.; Wample, R.L.; Greene, S.L.; Tarara, J.M. Evaluation of Potential Cover Crops for Inland Pacific Northwest Vineyards. Am. J. Enol. Vitic. 2001, 52, 292–303. [Google Scholar] [CrossRef]
  33. Callahan, B.J.; McMurdie, P.J.; Rosen, M.J.; Han, A.W.; Johnson, A.J.A.; Holmes, S.P. DADA2: High-Resolution Sample Inference from Illumina Amplicon Data. Nat. Methods 2016, 13, 581–583. [Google Scholar] [CrossRef]
  34. R Core Team. R: A Language and Environment for Statistical Computing; R Foundation for Statistical Computing: Vienna, Austria, 2023. [Google Scholar]
  35. Callahan, B.J.; Sankaran, K.; Fukuyama, J.A.; McMurdie, P.J.; Holmes, S.P. Workflow for Microbiome Data Analysis: From Raw Reads to Community Analyses. Available online: https://bioconductor.org/help/course-materials/2017/BioC2017/Day1/Workshops/Microbiome/MicrobiomeWorkflowII.html (accessed on 11 May 2023).
  36. Callahan, B.J.; McMurdie, P.J.; Holmes, S.P. Exact Sequence Variants Should Replace Operational Taxonomic Units in Marker-Gene Data Analysis. ISME J. 2017, 11, 2639–2643. [Google Scholar] [CrossRef]
  37. Lin, E.Y.; Noonan, M.J. Mga: User-Friendly R Package for Microbial Genetic Analysis for Amplicon Data; Canadian Journal of Undergraduate Research: Vancouver, BC, Canada, 2024; Volume MURCxCJUR. [Google Scholar]
  38. Abarenkov, K.; Zirk, A.; Piirmann, T.; Pöhönen, R.; Ivanov, F.; Nilsson, R.H.; Kõljalg, U. UNITE General FASTA Release for Fungi; UNITE Community. 2022. Available online: https://cir.nii.ac.jp/crid/1370013198746680974 (accessed on 29 October 2024). [CrossRef]
  39. Wright, E. Using DECIPHER v2.0 to Analyze Big Biological Sequence Data in R. R J. 2016, 8, 352–359. [Google Scholar] [CrossRef]
  40. Schliep, K.P. Phangorn: Phylogenetic Analysis in R. Bioinformatics 2011, 27, 592–593. [Google Scholar] [CrossRef]
  41. McMurdie, P.J.; Holmes, S. Phyloseq: An R Package for Reproducible Interactive Analysis and Graphics of Microbiome Census Data. PLoS ONE 2013, 8, e61217. [Google Scholar] [CrossRef]
  42. Yan, L. Ggvenn: Draw Venn Diagram by “Ggplot2”, version 0.1.10; MIT License: Cambridge, MA, USA, 2023. [Google Scholar]
  43. Fedor, P.; Zvaríková, M. Biodiversity Indices. In Encyclopedia of Ecology; Earth Systems and Environmental Sciences; Elsevier: Amsterdam, The Netherlands, 2019; Volume 1, pp. 337–346. ISBN 978-0-444-64130-4. [Google Scholar]
  44. Safi, K.; Cianciaruso, M.V.; Loyola, R.D.; Brito, D.; Armour-Marshall, K.; Diniz-Filho, J.A.F. Understanding Global Patterns of Mammalian Functional and Phylogenetic Diversity. Phil. Trans. R. Soc. B 2011, 366, 2536–2544. [Google Scholar] [CrossRef]
  45. Csárdi, G.; Nepusz, T.; Müller, K.; Horvát, S.; Traag, V.; Zanini, F.; Noom, D. Igraph for R: R Interface of the igraph Library for Graph Theory and Network Analysis, Version 1.4.2. 2024. Available online: https://zenodo.org/records/10369053 (accessed on 29 October 2024). [CrossRef]
  46. Lurgi, M. Networks as Graphs. Available online: https://mlurgi.github.io/networks_for_r/lesson-4.html (accessed on 12 October 2024).
  47. Mainali, K.P.; Slud, E.; Singer, M.C.; Fagan, W.F. A Better Index for Analysis of Co-Occurrence and Similarity. Sci. Adv. 2022, 8, eabj9204. [Google Scholar] [CrossRef]
  48. Pinheiro, J.; Bates, D. R Core Team Nlme: Linear and Nonlinear Mixed Effects Models, version 3.1-162; Free Software Foundation, Inc.: Boston, MA, USA, 2012. [Google Scholar]
  49. Breiman, L. Random Forests. Mach. Learn. 2001, 45, 5–32. [Google Scholar] [CrossRef]
  50. Lê, S.; Josse, J.; Husson, F. FactoMineR: An R Package for Multivariate Analysis. J. Stat. Soft. 2008, 25, 1–18. [Google Scholar] [CrossRef]
  51. Wilke, C.O. Ggridges: Ridgeline Plots in Ggplot2, version 0.5.4; Free Software Foundation, Inc.: Boston, MA, USA, 2022. [Google Scholar]
  52. Gu, Z.; Eils, R.; Schlesner, M. Complex Heatmaps Reveal Patterns and Correlations in Multidimensional Genomic Data. Bioinformatics 2016, 32, 2847–2849. [Google Scholar] [CrossRef]
  53. Bekris, F.; Vasileiadis, S.; Papadopoulou, E.; Samaras, A.; Testempasis, S.; Gkizi, D.; Tavlaki, G.; Tzima, A.; Paplomatas, E.; Markakis, E.; et al. Grapevine Wood Microbiome Analysis Identifies Key Fungal Pathogens and Potential Interactions with the Bacterial Community Implicated in Grapevine Trunk Disease Appearance. Environ. Microbiome 2021, 16, 23. [Google Scholar] [CrossRef]
  54. Travadon, R.; Lawrence, D.P.; Moyer, M.M.; Fujiyoshi, P.T.; Baumgartner, K. Fungal Species Associated with Grapevine Trunk Diseases in Washington Wine Grapes and California Table Grapes, with Novelties in the Genera Cadophora, Cytospora, and Sporocadus. Front. Fungal Biol. 2022, 3, 1018140. [Google Scholar] [CrossRef]
  55. Úrbez-Torres, J.R.; Haag, P.; Bowen, P.; O’Gorman, D.T. Grapevine Trunk Diseases in British Columbia: Incidence and Characterization of the Fungal Pathogens Associated with Black Foot Disease of Grapevine. Plant Dis. 2014, 98, 456–468. [Google Scholar] [CrossRef]
  56. Chen, M.; Arato, M.; Borghi, L.; Nouri, E.; Reinhardt, D. Beneficial Services of Arbuscular Mycorrhizal Fungi–From Ecology to Application. Front. Plant Sci. 2018, 9, 1270. [Google Scholar] [CrossRef]
  57. Van Herk, W.G.; Vernon, R.S. Wireworm Damage to Wheat Seedlings: Effect of Temperature and Wireworm State. J. Pest. Sci. 2013, 86, 63–75. [Google Scholar] [CrossRef]
  58. Poggi, S.; Le Cointe, R.; Riou, J.-B.; Larroudé, P.; Thibord, J.-B.; Plantegenest, M. Relative Influence of Climate and Agroenvironmental Factors on Wireworm Damage Risk in Maize Crops. J. Pest. Sci. 2018, 91, 585–599. [Google Scholar] [CrossRef]
  59. Hermann, A.; Brunner, N.; Hann, P.; Wrbka, T.; Kromp, B. Correlations between Wireworm Damages in Potato Fields and Landscape Structure at Different Scales. J. Pest. Sci. 2013, 86, 41–51. [Google Scholar] [CrossRef]
  60. Toom, M.; Talgre, L.; Mäe, A.; Tamm, S.; Narits, L.; Edesi, L.; Haljak, M.; Lauringson, E. Selecting Winter Cover Crop Species for Northern Climatic Conditions. Biol. Agric. Hortic. 2019, 35, 263–274. [Google Scholar] [CrossRef]
  61. Mäkelä, P.S.A.; Tuulos, A.; Turakainen, M.; Santanen, A.; Stoddard, F.L. Revitalizing the Winter Turnip Rape Crop in the Northern Latitudes. Acta Agric. Scand. Sect B 2011, 61, 195–201. [Google Scholar] [CrossRef]
  62. Gupta, S.C.; Larson, W.E. Estimating Soil Water Retention Characteristics from Particle Size Distribution, Organic Matter Percent, and Bulk Density. Water Resour. Res. 1979, 15, 1633–1635. [Google Scholar] [CrossRef]
  63. Saxton, K.E.; Rawls, W.J. Soil Water Characteristic Estimates by Texture and Organic Matter for Hydrologic Solutions. Soil Sci. Soc. Am. J. 2006, 70, 1569–1578. [Google Scholar] [CrossRef]
  64. Ferreira, C.S.; Veiga, A.; Caetano, A.; Gonzalez-Pelayo, O.; Karine-Boulet, A.; Abrantes, N.; Keizer, J.; Ferreira, A.J. Assessment of the Impact of Distinct Vineyard Management Practices on Soil Physico-Chemical Properties. Air Soil Water Res. 2020, 13, 1178622120944847. [Google Scholar] [CrossRef]
  65. Hannam, K.D.; Neilsen, G.H.; Forge, T.A.; Neilsen, D.; Losso, I.; Jones, M.D.; Nichol, C.; Fentabil, M.M. Irrigation Practices, Nutrient Applications, and Mulches Affect Soil Nutrient Dynamics in a Young Merlot (Vitis vinifera L.) Vineyard. Can. J. Soil. Sci. 2016, 96, 23–36. [Google Scholar] [CrossRef]
  66. Wijayawardene, N.N.; Hyde, K.D.; Al-Ani, L.K.T.; Tendersoo, L.; Haelewaters, D.; Rajeshkumar, K.C.; Zhao, R.L.; Aptroot, A.; Leontyev, D.V.; Saxena, R.K.; et al. Outline of Fungi and Fungus-like Taxa. Mycosphere 2020, 11, 1060–1456. [Google Scholar] [CrossRef]
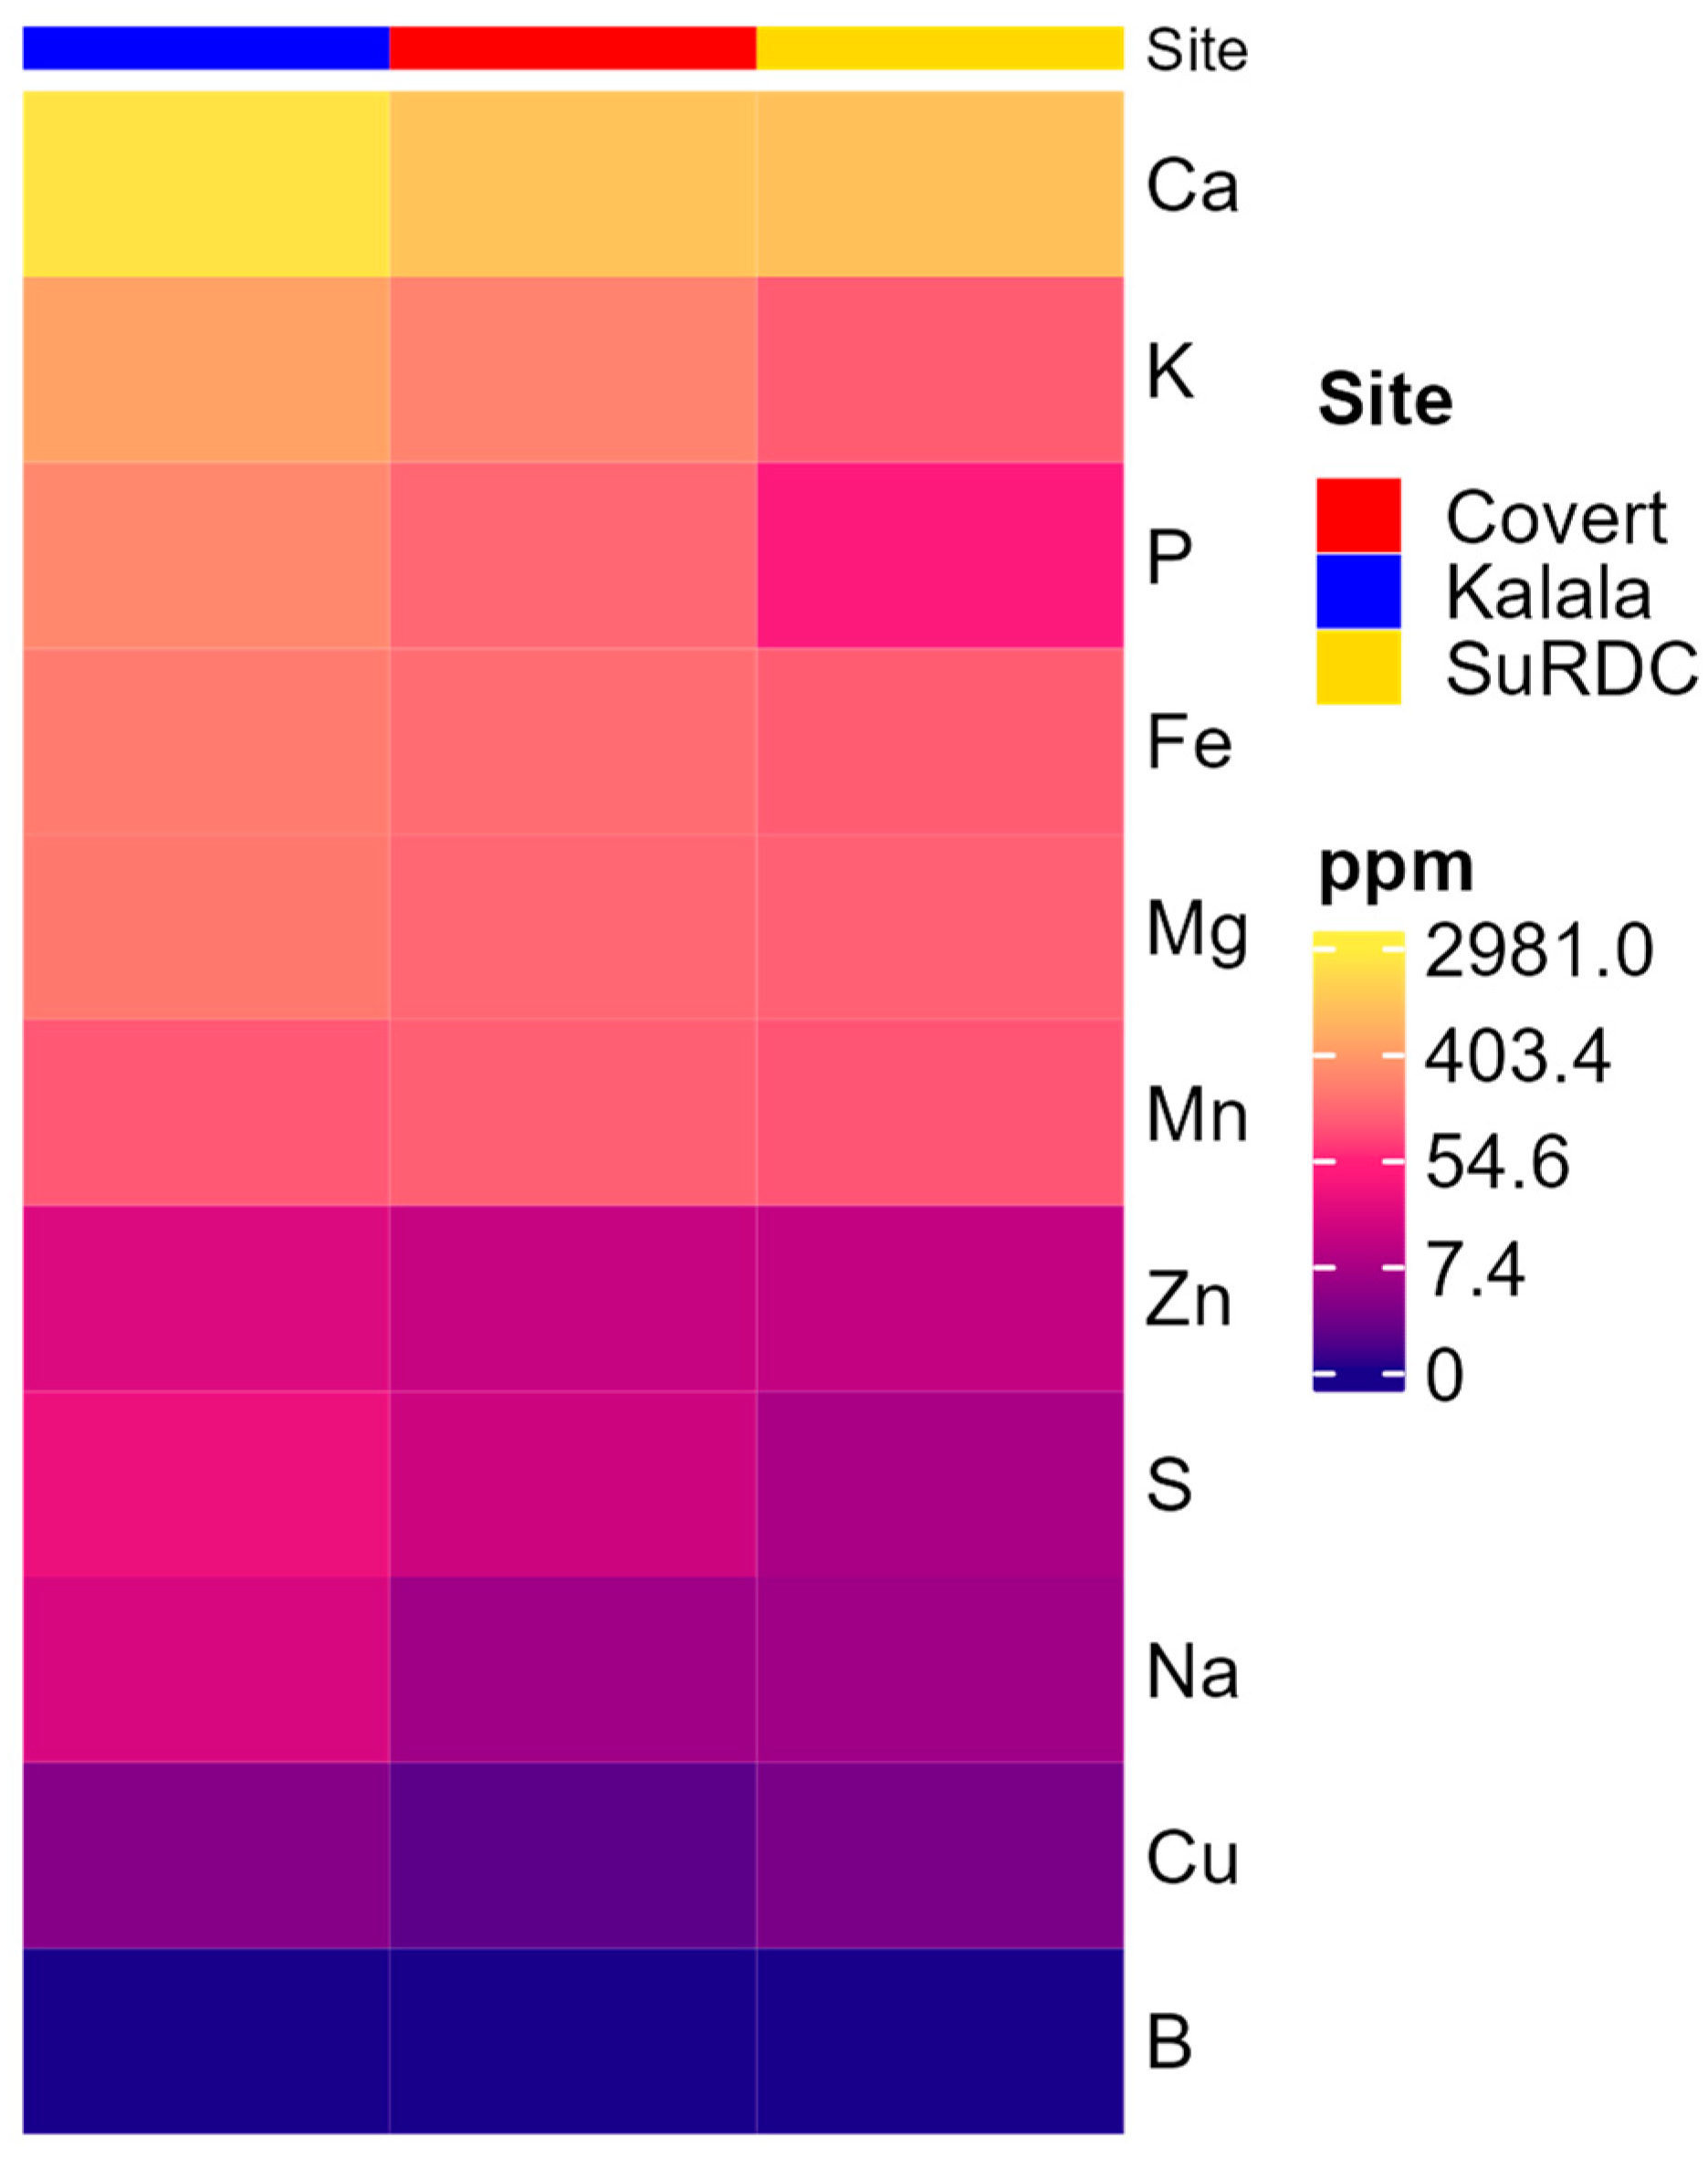
Figure 1. Heat map displaying the mean content of micro- and macro-nutrients for samples collected at a depth of 0–15 cm within each of the three sites. Results were reported on an oven (105 °C) dry weight basis in units of parts per million (ppm).
Agronomy 14 02835 g001
Figure 2. An overall comparison of soil sample fungal communities between sites. (A) Venn diagram counting the unique fungal species found in soil samples from each site, as well as species shared across sites. (B) Boxplots grouped by site, showing the relationship between mycorrhizal communities for each cover crop species and species richness. All turnip (light purple) samples from SuRDC were excluded due to weak sequencing results. (C) PCA on the proximity matrix of the site-classification random forest model showing clusters formed from sorting results.
Agronomy 14 02835 g002
Figure 3. Bar plot describing the community composition in soil sampled from nine under-vine cover crops. Relative abundances are grouped by cover crop species and coloured according to fungal class.
Agronomy 14 02835 g003
Figure 4. Our random forest analysis examined how similar soil fungal communities are between cover crop species, from which the effect of cover crop identity on soil fungal community was inferred. (A) PCA showing the clustering results from a random forest analysis of samples for each cover crop, with density plots (B,C) visualizing the abundance of the top two fungal species ranked by importance in the random forest classification. (D) Heat map of the abundances of the top 50 fungal species ranked by importance in the random forest analysis of cover crop classification, annotated by site and cover crop. Fungal species have comparable abundance patterns across soil samples, and the cover crop annotations do not show patterns of clustering, while the samples appear more distinctly grouped within sites.
Agronomy 14 02835 g004
Figure 5. The co-occurrence affinity (α) of fungal species was calculated for cover crop pairs to visualize the similarity across cover crop fungal communities as an alternative measure to beta diversity. (A) Generalized linear regression model with a Gamma distribution and log link showing α of fungi between cover crop species pairs. The overall trend for α across all cover crop pairs is indicated by the solid black line. (B) Corresponding heat map of the α values for each pair of cover crop species in a matrix.
Agronomy 14 02835 g005
Figure 6. We profiled taxa considered to be fungal vine pathogens to determine if cover crop identity affected soil pathogen load and communities. (A) Stacked bar plot of the relative abundance of fungal vine pathogens from various taxonomic levels (family, genus, species) for each cover crop. (B) Bar plot comparing the relative abundances of pathogenic and non-pathogenic fungal species in each sample, grouped by cover crop.
Agronomy 14 02835 g006
Table 1. Summary of selected experimental sites’ description and management history in Okanagan Valley, British Columbia, CAN.
SiteLatitude and Longitude (°N, °W)Growing Season Rainfall (mm)Mean Growing Season Air Temperature (°C)Fertilizer Rates Applied (kg ha−1)Starter N Applied (kg N ha−1)Grape VarietySoil TypeManagement Practices
Covert49°14′39.8″
119°32′42.7″
13410.7None applied (organic)None applied13-yr old MerlotLoamy sandDrip irrigation, Overhead sprinkler
SuRDC49°33′49.2″
119°38′19.0″
22515.6107 N
8.00 P
54 K
2-yr old RieslingLoamy sandDrip irrigation
Kalala49°50′31.2″
119°38′42″
14318.6None applied (organic)10-yr old ZweigeltSandy loamDrip irrigation, Overhead sprinkler
From May to October: https://climate.weather.gc.ca/historical_data/search_historic_data_e.html (accessed on 29 October 2024).
Table 2. Mean and range in parentheses (min, max) of soil properties sampled at a depth of 0–15 cm within each of the three vineyards, including soil texture and classification.
SiteElecterdial Conductivity (EC) (μS/cm)pH%C%NC/N% Clay% Silt% SandClassification
Covert148
(115, 167)
6.34
(6.30, 6.40)
0.813
(0.510, 1.356)
0.0716
(0.0446, 0.1199)
11.5
(10.4, 13.2)
6.00
(4.67, 6.87)
9.72
(6.30, 12.39)
84.27
(80.73, 89.03)
Loamy sand
Kalala262
(70, 91)
6.31
(6.03, 6.63)
1.492
(0.958, 2.075)
0.1258
(0.0865, 0.1678)
11.9
(11.1, 12. 7)
14.00
(11.72, 16.12)
32.64
(27.39, 37.33)
53.36
(46.55, 60.89)
Sandy loam
SuRDC228
(188, 272)
6.32
(6.22, 6.39)
0.7843
(0.586,1.050)
0.0604
(0.0452, 0.0782)
13.0
(11.1, 16.2)
5.86
(4.90, 7.73)
13.67
(11.51, 17.85)
80.47
(74.43, 83.58)
Loamy sand
Disclaimer/Publisher’s Note: The statements, opinions and data contained in all publications are solely those of the individual author(s) and contributor(s) and not of MDPI and/or the editor(s). MDPI and/or the editor(s) disclaim responsibility for any injury to people or property resulting from any ideas, methods, instructions or products referred to in the content.