Article

Impact of Drying–Wetting Cycles on Nitrification Inhibitors (DMPP and DMPSA) in a Greenhouse Experiment with Two Contrasting Mediterranean Soils

by
Laura Sánchez-Martin
1,2,*,
Adrián Bozal-Leorri
3,
Janaina M. Rodrigues
4,
Carmen González-Murua
3,
Pedro Aparicio
4,
Sonia García-Marco
1,2 and
Antonio Vallejo
1,2
1
Departamento de Química y Tecnología de Alimentos, Escuela Técnica Superior de Ingeniería Agronómica, Alimentaria y de Biosistemas, Universidad Politécnica de Madrid, Ciudad Universitaria, 28040 Madrid, Spain
2
Centro de Estudios e Investigación para la Gestión de Riesgos Agrarios y Medioambientales (CEIGRAM), Universidad Politécnica de Madrid, 28040 Madrid, Spain
3
Department of Plant Biology and Ecology, Faculty of Science and Technology, University of the Basque Country (UPV/EHU), 48940 Leioa, Spain
4
Institute for Multidisciplinary Research in Applied Biology (IMAB), Public University of Navarre, 31006 Pamplona, Spain
*
Author to whom correspondence should be addressed.
Agronomy 2024, 14(11), 2620; https://doi.org/10.3390/agronomy14112620
Submission received: 3 October 2024 / Revised: 30 October 2024 / Accepted: 4 November 2024 / Published: 6 November 2024
(This article belongs to the Section Soil and Plant Nutrition)

Abstract

:
Studies of the impact of nitrification inhibitors (NIs), specifically DMPP and DMPSA, on N2O emissions during “hot moments” have produced conflicting results regarding their effectiveness after rewetting. This study aimed to clarify the effectiveness of NIs in reducing N2O emissions by assessing residual DMP concentration and its influence on ammonia-oxidizing bacteria (AOB) in two pot experiments using calcareous (Soil C, Calcic Haploxerept) and acidic soils (Soil A, Dystric Xerochrepts). Fertilizer treatments included urea (U), DMPP, and DMPSA. The experiments were divided into Phase I (water application to dry period, 44 days) and Phase II (rewetting from days 101 to 121). In both phases for Soil C, total N2O emissions were reduced by 88% and 90% for DMPP and DMPSA, respectively, compared with U alone. While in Phase I, the efficacy of NIs was linked to the regulation of AOB populations, in Phase II this group was not affected by NIs, suggesting that nitrification may not be the predominant process after rewetting. In Soil A, higher concentrations of DMP from DMPP were maintained compared to Soil C at the end of each phase. Despite this, NIs had no significant effect due to low nitrification rates and limited amoA gene abundance, indicating unfavorable conditions for nitrifiers. The study highlights the need to optimize NIs to reduce N2O emissions and improve nitrogen efficiency, while understanding their interactions with the soil. This knowledge is necessary in order to design fertilization strategies that improve the sustainability of agriculture under climate change.

1. Introduction

Anthropogenic climate change is predicted to increase the intensity and frequency of extreme weather events such as flooding, storms, and drought in many areas of the world [1]. These events impact crop production and the interactions between soil, water, microorganisms, plants, and the atmosphere, all of which are highly sensitive to these changes [2]. Drought reduces the activity of soil microorganisms involved in processes such as nitrification, denitrification, and nitrifying denitrification, which are crucial for providing plant-available nitrogen.
This indirectly affects crop production and directly influences nitrous oxide (N2O) emissions, a potent greenhouse gas. Many studies have documented large N2O emissions after the rewetting of dry soil, known as ‘hot moments after rewetting’ [3,4,5]. These hot moments, lasting 3–7 days, significantly contribute to annual N2O fluxes in agricultural soils. Barrat et al. [3] suggest that the greater the difference between the dry state of the soil and its saturation after rewetting, the larger the hot moment. This may be due to soil microorganisms utilizing substrates (organic and mineral) from the cell lysis of dead microorganisms or root decomposition [3,6], but also may be because higher soil water content (higher WFPS) enhances denitrification by reducing accumulated nitrates produced by nitrification during drought periods.
Several studies indicate that denitrification is most likely the primary process contributing to N2O production among three possible processes [7,8]. Leitner et al. [9], in laboratory experiments, found that 80% of N2O was generated through denitrification, with nitrification contributing 10%, particularly in the initial hours following rewetting.
Although both ammonia-oxidizing archaea (AOA) and bacteria (AOB) initiate and regulate the rate-limiting step of autotrophic nitrification [10], different studies [11,12] suggest that fertilization tends to significantly increase nitrifying bacterial populations, with limited effects on archaea in various soil types (acidic and alkaline). Xu et al. [13] also highlight that AOB populations exhibit greater resilience than AOA under drought, particularly with urea and manure treatments. Additionally, these authors observed that the application of dicyandiamide (DCD), an effective nitrification inhibitor (NI), reduced AOB abundance both after application and during rewetting.
The inhibition of nitrification using chemical compounds NIs after the application of urea or ammonium-based fertilizers has been demonstrated as an effective strategy to mitigate N2O emissions after fertilization [14,15]. The inhibitors, DMPP (3,4-dimethyl-1H-pyrazole dihydrogen phosphate) and DMPSA (2-(3,4-dimethyl-1H-pyrazol-1-yl)-succinic acid isomeric mixture), are two of the current generation of inhibitors. Both NIs, deactivate the enzyme responsible for the first step of nitrification, i.e., the oxidation of ammonium (NH4+) to hydroxylamine (NH2OH). Their molecular structure, which is based on a pyrrolic ring, makes them resistant to degradation in the soil [16,17,18]. Several studies demonstrate that both inhibitors exhibit a similar response in mitigating N2O emissions, with average reductions of 90% observed in some cases [19,20]. Recently, under field conditions, various authors [4,5] have found in studies with a soil similar to that of this study (Soil C), a reduction in N2O emissions during the “hot moment” in treatments with NIs compared with urea alone, 5 months after application. Nevertheless, a clear conclusion cannot be made on the capacity of DMP-based NIs, such as DMPP and DMPSA, after rewetting due to contrasting results from studies by the same authors [19].
In a meta-analysis, Abalos et al. [21] demonstrated that soil nitrifying activity is clearly influenced by soil pH. It is well known that NIs are generally more effective in neutral and alkaline soils [22]. On the other hand, recent studies [23], underscore the importance of also considering soil physicochemical properties, such as electrical conductivity and organic carbon content, in the design of strategies to improve inhibitor effectiveness. However, the effect of soil texture on moisture dynamics during drying–rewetting cycles and its impact on NI performance remains largely unexplored. Therefore, the aim of this study was to evaluate the impact of drying–rewetting cycles on the efficacy of NIs (DMPP and DMPSA) applied to two contrasting Mediterranean soils. The study also included an analysis of how factors such as soil pH and texture influence microbial activity and the mitigation of N2O emissions. The ultimate goal of this line of research is to optimize the use of these inhibitors under diverse agricultural and climatic conditions.

2. Materials and Methods

2.1. Soil Preparation and Soil Selection

The study is based on two simultaneous pot experiments from October to March 2021 with wheat, using two different soils with the same fertilizer treatments. Calcareous soil, Soil C, was a Calcic Haploxerept, previously cultivated with wheat from the experimental field station ‘El Encín’ (Madrid, Spain; 40°32′ N, 3°17′ W). Samples were collected from a soil depth of 0–25 cm. This soil had a loam texture (clay, 28%; silt, 17%; sand, 55%) and a pH of 8.3. Acid soil, Soil A, was a grassland soil from Colmenar Viejo (Madrid) (40°65′ N, 3°70′ W) and samples were also collected from a soil depth of 0–25 cm. This soil was a Dystric Xerochrepts [24], with a sandy loam texture (clay, 14%; silt, 25%; sand, 61%) and a pH of 5.6. Total N and total organic carbon were 0.11% and 1.78% for Soil C and 0.1% and 1.79% for Soil A. The samples of both soil types were air-dried, sieved (4 mm), and mixed homogeneously.

2.2. Experimental Procedure and Conditions

The experiment was carried out in an open greenhouse in the agricultural experimental facility at the Technical University of Madrid (Madrid, Spain; 40°26′ N, 3°44′ W). Each experiment used a factorial randomized complete block design with four fertilizer treatments and three replicates, utilizing PVC pots (25 cm diameter, 12.5 cm height) filled with a mixture of 6 kg of soil and pure sand (5:1 ratio). The fertilizer treatments were (1) Urea (U); (2) Urea + DMPP (U+DMPP); (3) Urea + DMPSA (U+DMPSA); (4) Control without U or NIs (C). Urea was applied at a rate of 120 kg N ha−1 (0.56 g N pot−1) for all the treatments except the control. Fertilizers with inhibitors were provided by EuroChem Agro, Mannheim, Germany. The DMPP and DMPSA content was 0.5% and 0.8% of the nitrogen content, respectively, and both were present as a coating on the urea granules. Before sowing and the application of fertilizer treatments, soils were kept for 1 week at field capacity to reactivate soil microorganisms. After this period, fertilizers were applied and incorporated by hand. Subsequently, a thin layer of soil was added to bury it. Wheat seeds (Triticum aestivum L. ‘Ingenio’) were then sown at a depth of 2 cm below the soil surface at a rate of 140 kg seed ha−1. The amount of fertilizer and number of seeds follow the normal dose applied in the crop fields.
Five hours after fertilization, deionized water was added to start the experiment (Phase I) at 50% of water-filled pore space (WFPS). During this initial period, no more additional water was added, and soils were kept dry until the beginning of the rewetting phase (Phase II), day 101. The experiment finished when GHG emissions returned to background levels (approximately 125 DAF). The open greenhouse protected the pots from the rain whilst maintaining a similar temperature to the exterior (with a temperature variation <5 °C). For each soil type, 36 PVC pots were arranged into three sets of 12 pots, with each set consisting of four treatments and three replicates. The first set of 12 pots was used to measure greenhouse gases (GHG) in Phases I and II for each soil. These pots were the non-soil-destructive sample set. The second and third sets of 12 pots were used to take soil-destructive samples in Phases I and II, respectively. Throughout the experiment, all pots were kept under uniform conditions, received similar management, and rotated weekly in order to avoid the effect of position. Soil samples, from the second and third sets of pots, were analyzed for moisture content, NH4+, NO3, total soil bacteria abundance (expressed as 16S rRNA), and the nitrifying communities in AOB (expressed as amoA). Additionally, the residual amount of DMP from DMPP and DMPSA was measured at various depths in the corresponding treatments for Phase I and Phase II.

2.3. Soil N-min Sampling and Analysis

Two soil cores per pot were taken on each sample date, using a 2 cm diameter soil auger to the depth of the pot. The hole produced was refilled with pure-dry sand in order to maintain the rest of the soil structure. Soil mineral N (NH4+-N and NO3-N) was determined by extracting 8 g soil with 50 mL of KCl (1 M), filtering and measuring with automated colorimetric determination using a flow injection analyzer provided with a UV–Vis spectrophotometer detector (FIAS 400 Perkin Elmer, Shelton, CT, USA). Soil moisture was expressed as WFPS and calculated by dividing the volumetric water content by total soil porosity. Total soil porosity was calculated from the measured bulk density according to the relationship: soil porosity = 1 − (soil bulk density/2.65), assuming a particle density of 2.65 Mg m−3 [25]. All soil parameters were determined from the same cores used for measuring mineral N. Soil samples were taken weekly after fertilizer application, coinciding with gas sampling days.

2.4. GHG Sampling and Analysis

Emissions of GHG were measured using the static chamber method [26]. Each pot was used as a chamber by closing it for 40 min with a perfectly fitting lid, giving a headspace of approximately 8 L. Gas samples were taken using a 100 mL syringe and stored in 20 mL chromatography vials at 0, 20, and 40 min after closing through a three-way valve, which was previously installed in the lid. In this case, as recommended by Pavelka et al. [27], the ratio between the total volume of the chamber and the total volume of the sample air taken for GHG measurement was higher than 25. The closure period was selected after testing the linearity of gas concentrations inside the chambers. However, samples that did not exhibit linearity on each sampling day were rejected. Concentrations of N2O and CO2 were quantified by gas chromatography, using an HP-6890 gas chromatograph (GC; Agilent Technologies, Barcelona, Spain) equipped with a Turbomatrix autoanalyzer (Perkin Elmer, Madrid, Spain). Gas samples were injected through HP Plot-Q capillary columns into a 63Ni electron-capture detector (ECD) to analyze N2O concentrations and into a flame-ionization detector (FID) fitted with a methanizer for CO2 concentrations. Helium was used as carrier gas and the oven was kept at a constant temperature of 35 °C. GHG flux rates were calculated from the change in gas concentration in the headspace air during the sampling period (difference between concentrations at 0 and 40 min. after closing). Gas samples were taken three times per week during the first month following irrigation and once or twice (depending on the gas emission pattern) per week at other times.

2.5. Soil Inhibitor Concentration Sampling and Analysis

One soil core per pot of the DMPP and DMPSA treatments was taken at the end of Phases I and II to study the residual concentration of inhibitors along the soil profile. The cores were taken using a 5 cm diameter soil auger (10 cm long). These samples were cut at different soil depths (0–2.5 cm; 2.5–5 cm; 5–7.5 cm; and 7.5–10 cm) after freezing them at −20 °C. DMP from DMPP and DMPSA within each soil depth was extracted following Benckiser et al. [28]. The samples were analyzed by HPLC (Waters 2690 separation module with a Waters 2487 dual λ absorbance detector, Waters, Milford, MA, USA) using a 5 μm 25 cm × 4 mm Tracer Excel column and a TR-C-160-1 pre-column (Teknokroma, Sant Cugat del Vallés, Spain). For technical details and calibration see Rodrigues et al. [16]. The proportion of DMPP remaining was calculated as the DMP concentration averaged over all soil layers (since all soil layers had the same volume) divided by the initial concentration.

2.6. Sampling and Analysis of Soil Nitrification Microorganisms

The DNA analysis was carried out for the soil samples taken on the days with the highest N2O emissions (Phase I) and at the end of rewetting (Phase II). Two grams of soil, sampled as described in the Section on soil N-min sampling and analysis, were weighed, frozen in liquid nitrogen, and stored at −80 °C until extraction and analysis. DNA was extracted from 0.25 g of dry soil using the PowerSoil DNA Isolation Kit (MO BIO Laboratories, Carlsbad, CA, USA), including some modifications described in Harter et al. [29]. Extracted DNA concentration and quality were determined spectrophotometrically (NanoDrop® 1000, Thermo Scientific, Waltham, MA, USA). Quantitative polymerase chain reactions (qPCR) were performed using SYBR® Premix Ex TaqTM II (Takara-Bio Inc., Kusatsu, Japan) and gene-specific primers to amplify and quantify total bacteria abundance expressed as 16S rRNA gene and nitrification-involved amoA gene. Each sample was quantified using the StepOne PlusTM Real-Time PCR System and data analysis was carried out using the StepOnePlusTM Software 2.3 (Thermo Scientific) [11]. Standard curves were prepared from serial dilutions of 107 to 102 gene copies µL−1 of linearized plasmids with insertions of the target gene. The copy number of target gene per gram of dry soil was calculated according to a modified equation described in Behrens et al. [30]: [(number of target gene copies per reaction × volume of DNA extracted)/(volume of DNA used per reaction × gram of dry soil extracted)]/DNA concentration. The amoA relative abundance was calculated as (amoA absolute abundance/16S rRNA absolute abundance) × 100.
AOA have a peak activity at NH4+ concentrations of approximately 0.03 mM, while AOB activity continues to rise with increasing NH4+ levels [31]. This suggests that AOB play a more significant role in nitrification under high ammonia conditions [32,33], as observed in this experiment with NH4+-based fertilizer. Furthermore, as mentioned previously, studies have shown a substantial increase in nitrifying bacterial populations following fertilization, with minimal or no impact on the abundance of nitrifying archaea in both acidic and alkaline soils [11,12]. For these reasons, only bacterial amoA gene abundance was measured.

2.7. Calculations and Statistical Analysis

Data analysis was performed using Statgraphics Plus v.5.1. A multifactorial ANOVA analysis for all the variables was performed. Data distribution normality and variance uniformity were previously assessed by the Shapiro–Wilk test and Levene’s statistic, respectively, and log-transformed before analysis when necessary. The means were separated by the LSD test at α < 0.05. For non-normally distributed data, the Kruskal–Wallis test was used on non-transformed data to evaluate the differences at α < 0.05.
The cumulative gas emissions were calculated for Phases I and II, as well as the total emissions produced for each type of soil. These calculations were estimated by successive linear interpolations between the sampling dates.
Correlation analyses were also performed to determine whether N2O emissions were related to soil NH4+-N, NO3-N, and DMP content, and amoA relative abundance, but only the most relevant results are discussed.

3. Results

3.1. Temperature and Soil Moisture Conditions

Mean daily temperatures ranged between 2 and 24 °C (Figure S1) with a mean value of 11 °C. At the beginning of each phase, the moisture of each soil was adjusted to 50% WFPS. Figure 1 shows how Soil A exhibited lower moisture compared to Soil C throughout each phase. Both soils ended each phase with a WFPS of less than 20%.

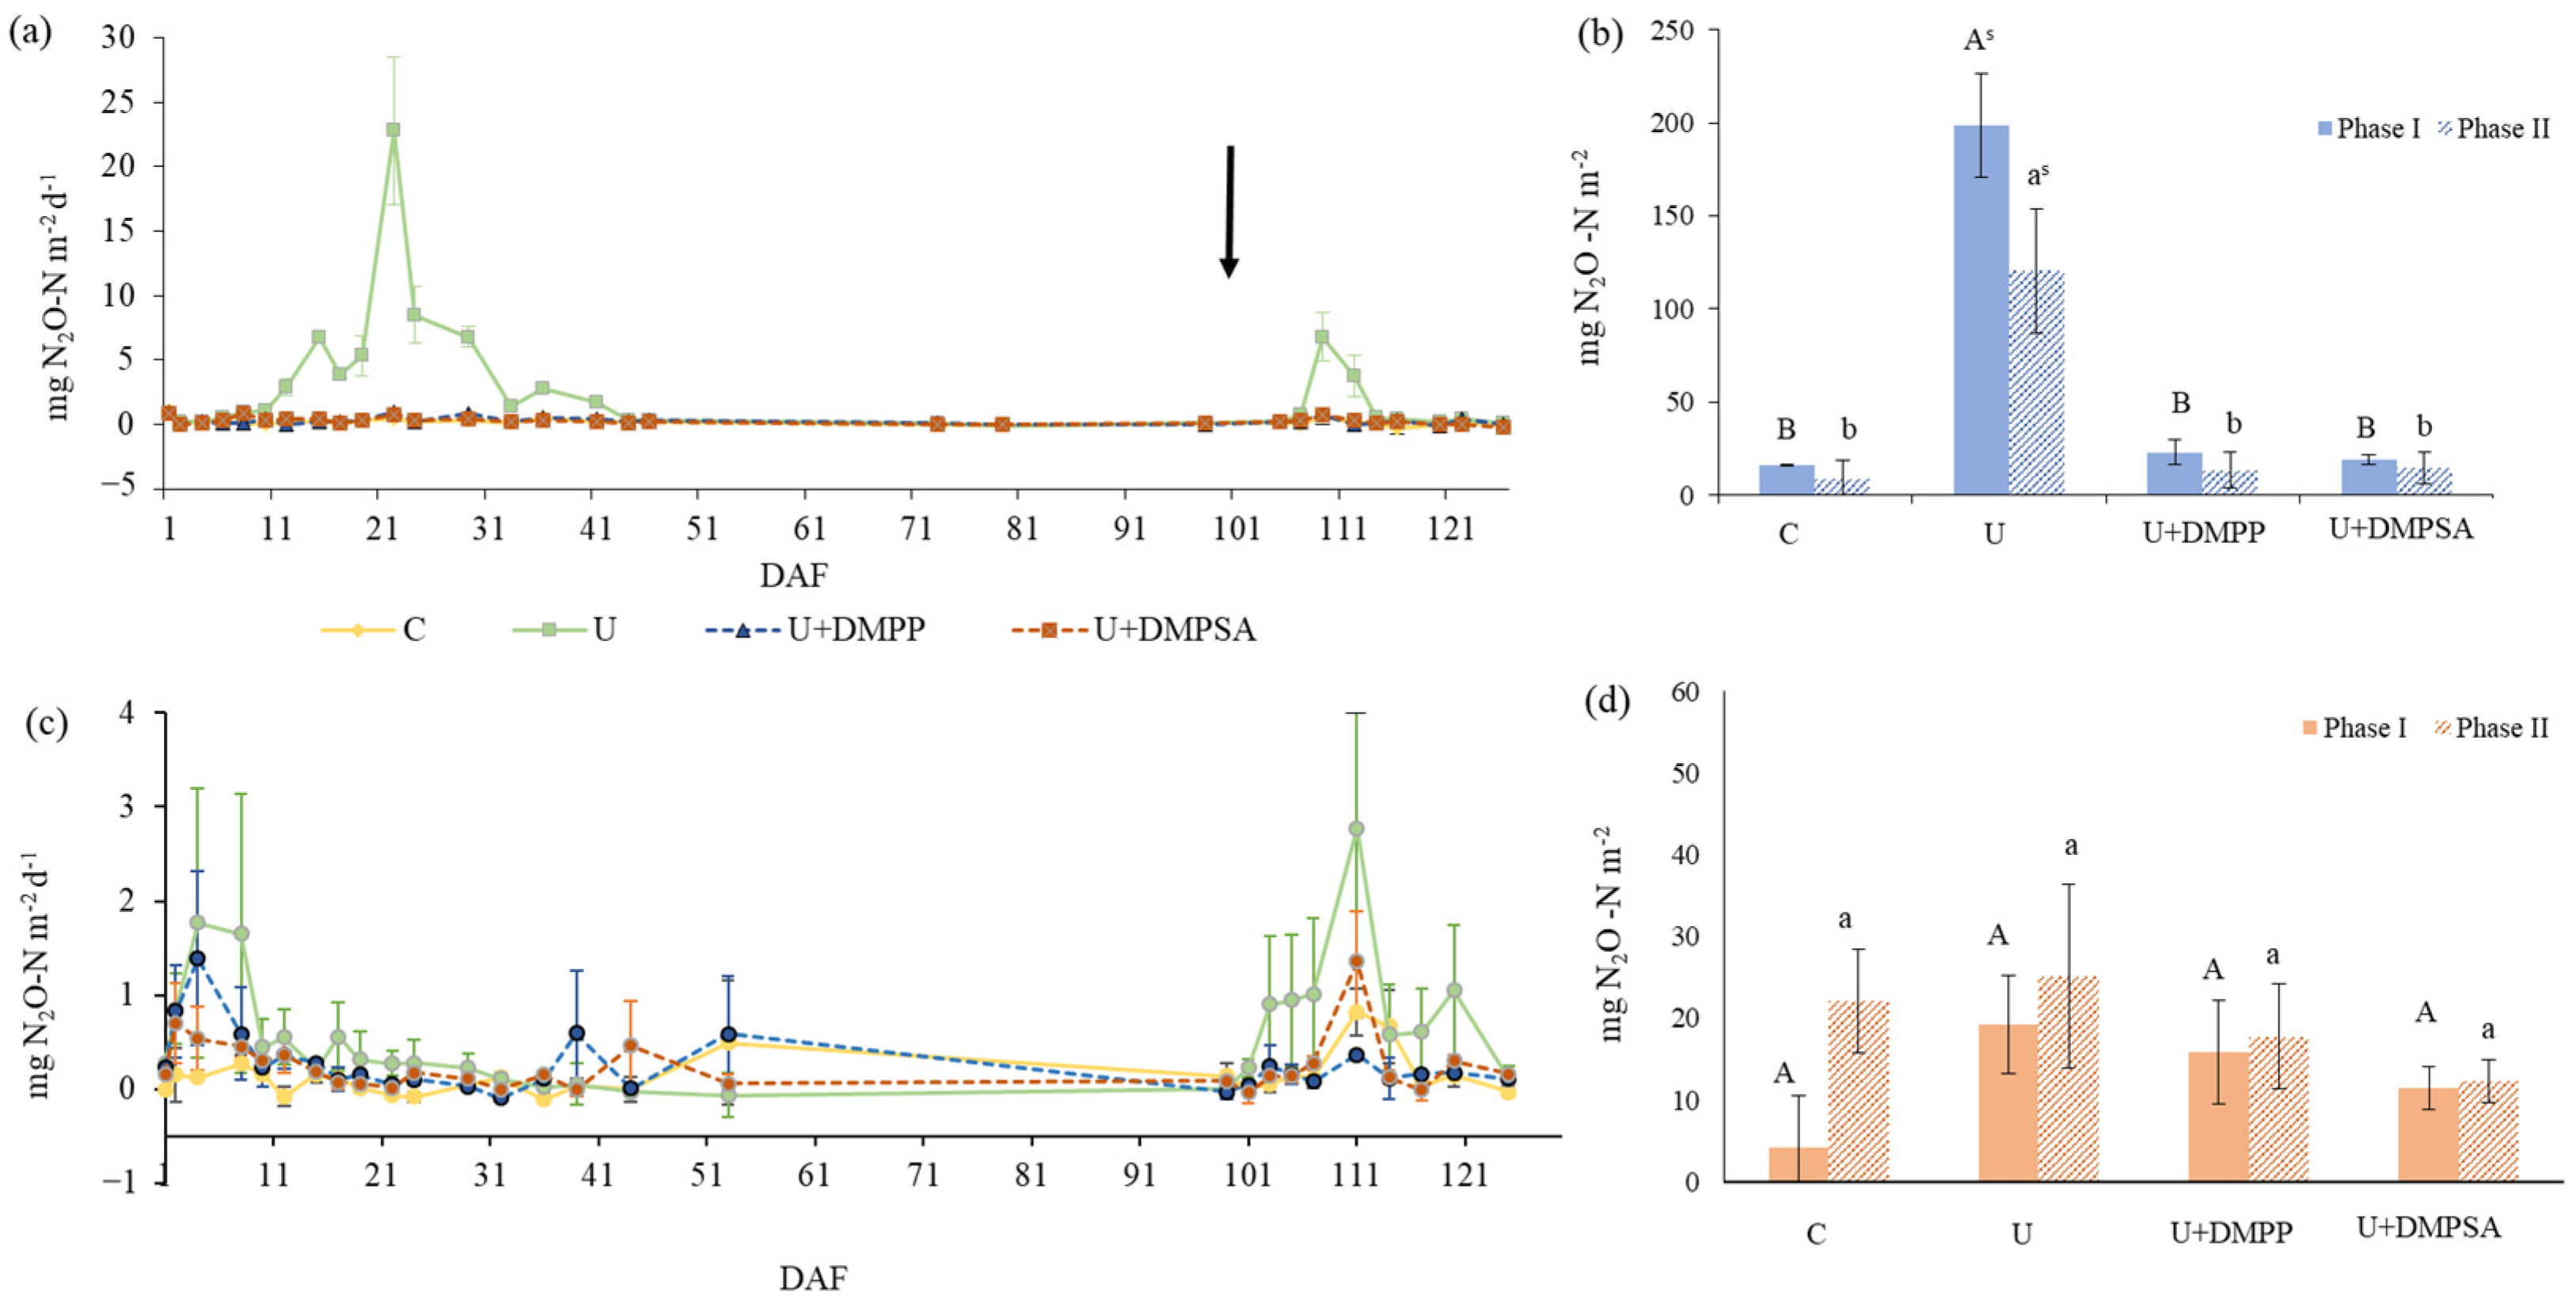
3.2. Soil GHG Emissions (N2O and CO2)
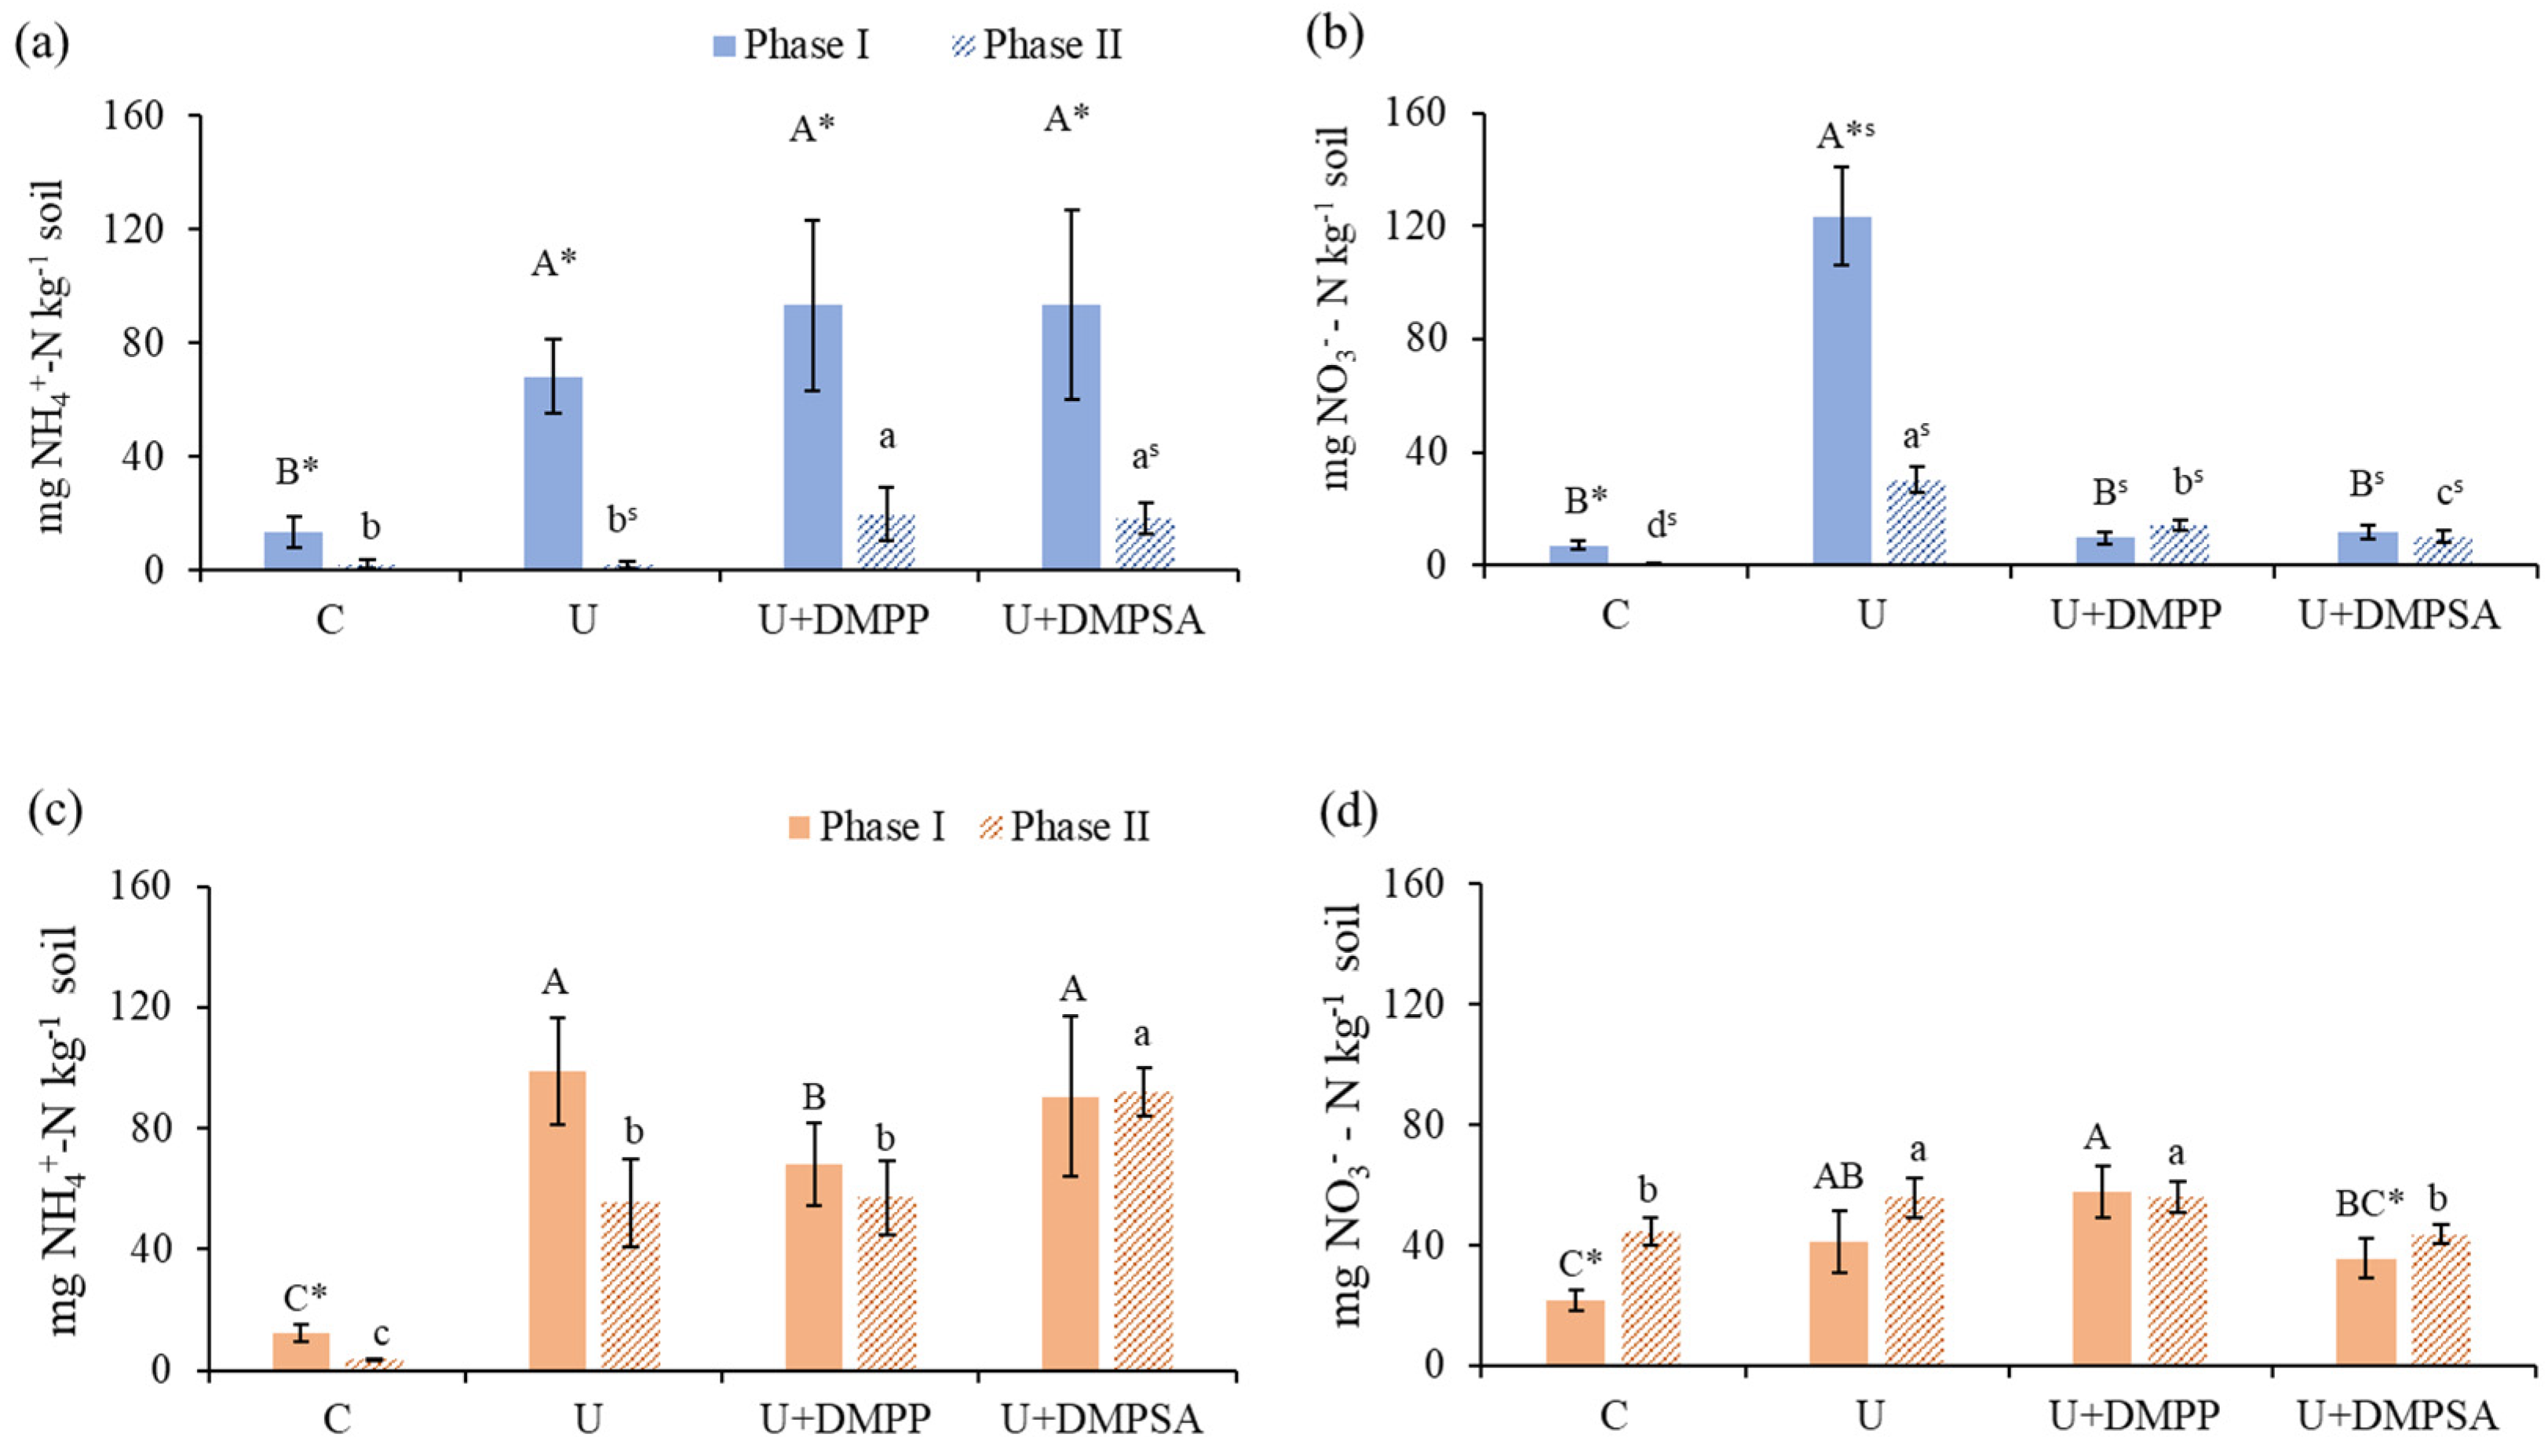
The emission patterns of N2O fluxes were affected by soil type and fertilizer treatments, both in Phases I and II. In soil C (calcareous), maximum fluxes were observed for urea 15 days after fertilization (DAF), reaching 22.8 mg N2O-N m2d1 in Phase I and 6.7 mg N2O-N m2 d1 in Phase II (Figure 2a). Fluxes for C, U+DMPP, and U+DMPSA were lower than 1 mg N2O-N m2d1 and were significantly lower than those of the U treatment from 8 to 41 DAF. In Phase II, treatments with NIs continued to have significantly lower N2O emissions compared with the U treatment, and no differences were found with respect to the control treatment. The cumulative N2O emissions from the U treatment were the highest in both Phases I and II (Figure 2b) with emissions that were 10 times higher than the other treatments, including the control.
The highest N2O flux for soil A (acidic) in Phase I occurred 4 DAF in the U treatment, 1.7 mg N2O-N m2d1 (Figure 2c). Treatments with NIs also peaked on this date but with fluxes slightly lower than U treatment; 1.4 and 0.53 mg N2O-N m2d1 for DMPP and DMPSA, respectively. Nevertheless, no significant differences were found between the treatments including the control. In Phase II, all treatments peaked at 111 DAF, but again there were no significant differences between treatments, although the U treatment had the highest N2O peak. There were also no significant differences between treatments for Phases I and II in the cumulative N2O emissions (Figure 2d).
The multifactorial analysis of cumulative N2O emissions revealed a significant interaction of fertilizer treatment × soil (α < 0.05), mainly due to the U treatment, which gave the highest emission for soil C. Treatments with NIs or the control had low cumulative N2O emissions without significant differences between soils (Figure 2b,d).
In both soils, a reactivation of microbial activity, as shown by soil respiration, was principally observed after the addition of N fertilizers in the first phase and after rewetting in the second phase (Figure S2). In the acid soil, microbial reactivation was instantaneous, with CO2 peaking on the first day after fertilization (Figure S2c). However, in the calcareous soil, microbial reactivation was progressive with the highest emission peak 21 DAF (Figure S2a).
For both soils, cumulative emissions were significantly lower in the second phase than in Phase I (Figure S2b,d). In Phase II, soil respiration was significantly higher (α< 0.05) in the calcareous soil than in the acid soil (Figure S2b,d) for all treatments except for the control, indicating that conditions in soil C were more suitable for the reactivation of microorganism activity.

3.3. Soil N-min

Mean soil NH4+ concentrations in Phase I were significantly affected by fertilizer treatment but not by soil type. In soil C, the application of urea increased soil mean NH4+ content by a factor of six with respect to the control treatment in Phase I (Figure 3a). There were no significant differences in soil NH4+ content between fertilizer treatments with or without inhibitors during this phase. In soil A, the application of urea with or without NIs also increased (nine times) the mean NH4+ content (Figure 3c). In Phase II significant differences were observed both between fertilizer treatment and soil. The interaction fertilizer treatment × soil was significant mainly because of the U and U+DMPSA treatments (Figure 3a,c).
Soil NO3 content during Phase I was mainly affected by fertilizer treatment, but not by soil type. In soil C, the U treatment had 10 times more NO3 in the soil than the U+DMPP and U+DMPSA treatments (Figure 3b), whereas in soil A significantly higher amounts were found for the U and U+DMPP treatments than in the control or U+DMPSA. In Phase II, soil A had a higher mean soil NO3 content than soil C. Differences between U+DMPP and U+DMPSA were only observed for soil A in this rewetting phase (Figure 3d).
It is worth mentioning that the mean soil NO3 content of the U treatment was 67% lower in soil A compared with soil C in Phase I and 85% higher in Phase II (Figure 3b,d).

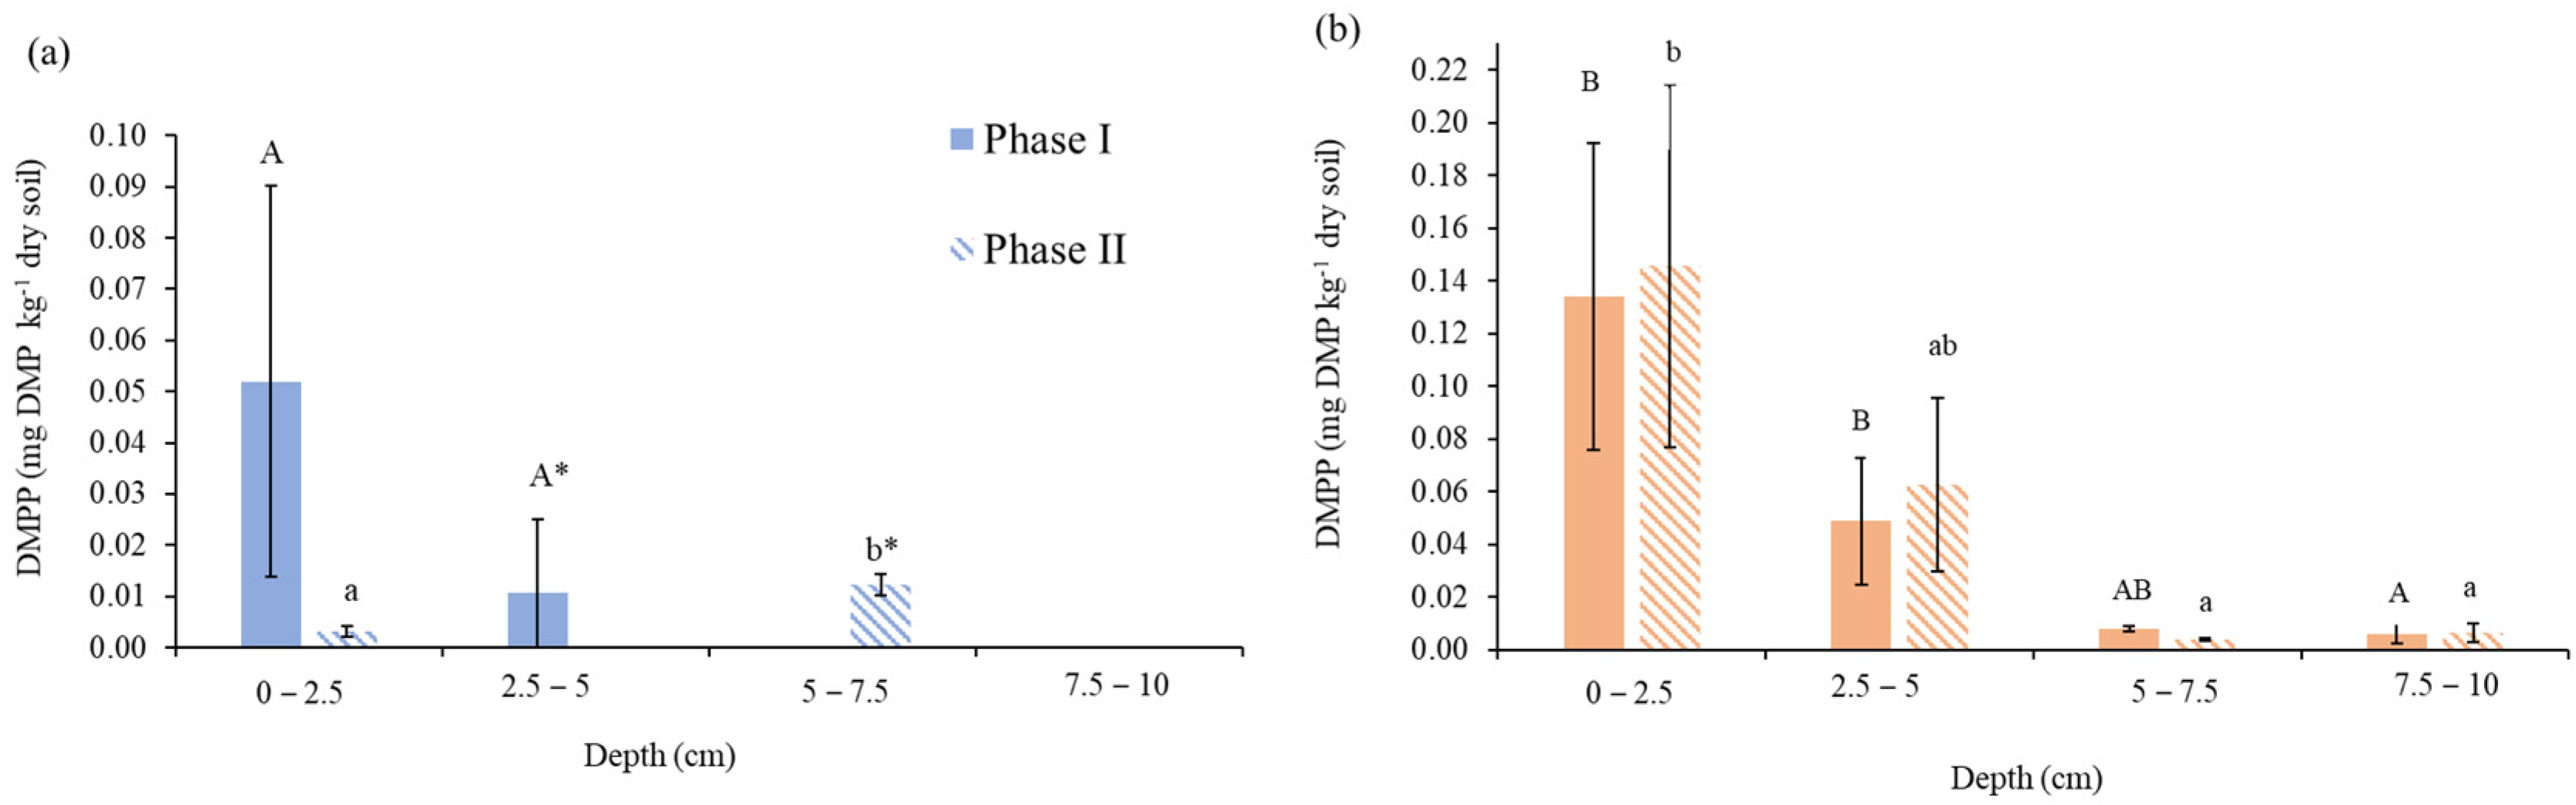
3.4. Persistence of DMPP in the Soil Profile

In both soil types, most DMP (derived from DMPP applied, 0.475 mg DMPP kg−1 soil) remained in the first 5 cm of soil (Figure 4). At the end of Phase I in soil C, the total DMP concentration found in all depths was 0.016 mg DMP kg−1 soil, which was only 3.3% of the total amount of DMPP applied (Figure 4a). In Phase II, most of the DMP disappeared and only 0.003 mg DMP kg−1 soil remained in the upper layer. However, in this last phase, DMP mobility might have occurred because higher concentrations (0.012 mg DMP kg−1 soil) were found at 5–7.5 cm depth. Considering that 96.7% of DMPP was degraded in Phase I and 2.5% more during Phase II, it can be inferred that 99.2% of the DMPP was degraded by the end of the experiment (137 DAF).
Under the acid conditions of soil A, the DMP molecule was found at all soil depths (Figure 4b), even in Phase II. At a depth of 0–2.5 cm, the DMP concentration was 22 times higher than that found at 7.5–10 cm. The concentrations of DMP were not significantly different between both phases of the experiment indicating that degradation also occurred but it was slower than in soil C. At the end of the experiment (137 DAF), the degradation of the DMPP molecule in soil A was 88.5%.
The analysis of DMP from the DMPSA treatment detected peaks that did not have the 20:80 ratio of the two DMPSA isomers. In addition, there was no correlation of higher DMPSA in the treatments where DMPSA was added. Although Bozal-Leorri et al. [17] successfully measured DMP from DMPSA using the extraction method proposed by Benckiser for analyzing DMP from DMPP, unfortunately, our data were not conclusive. Therefore, we decided not to include these data.

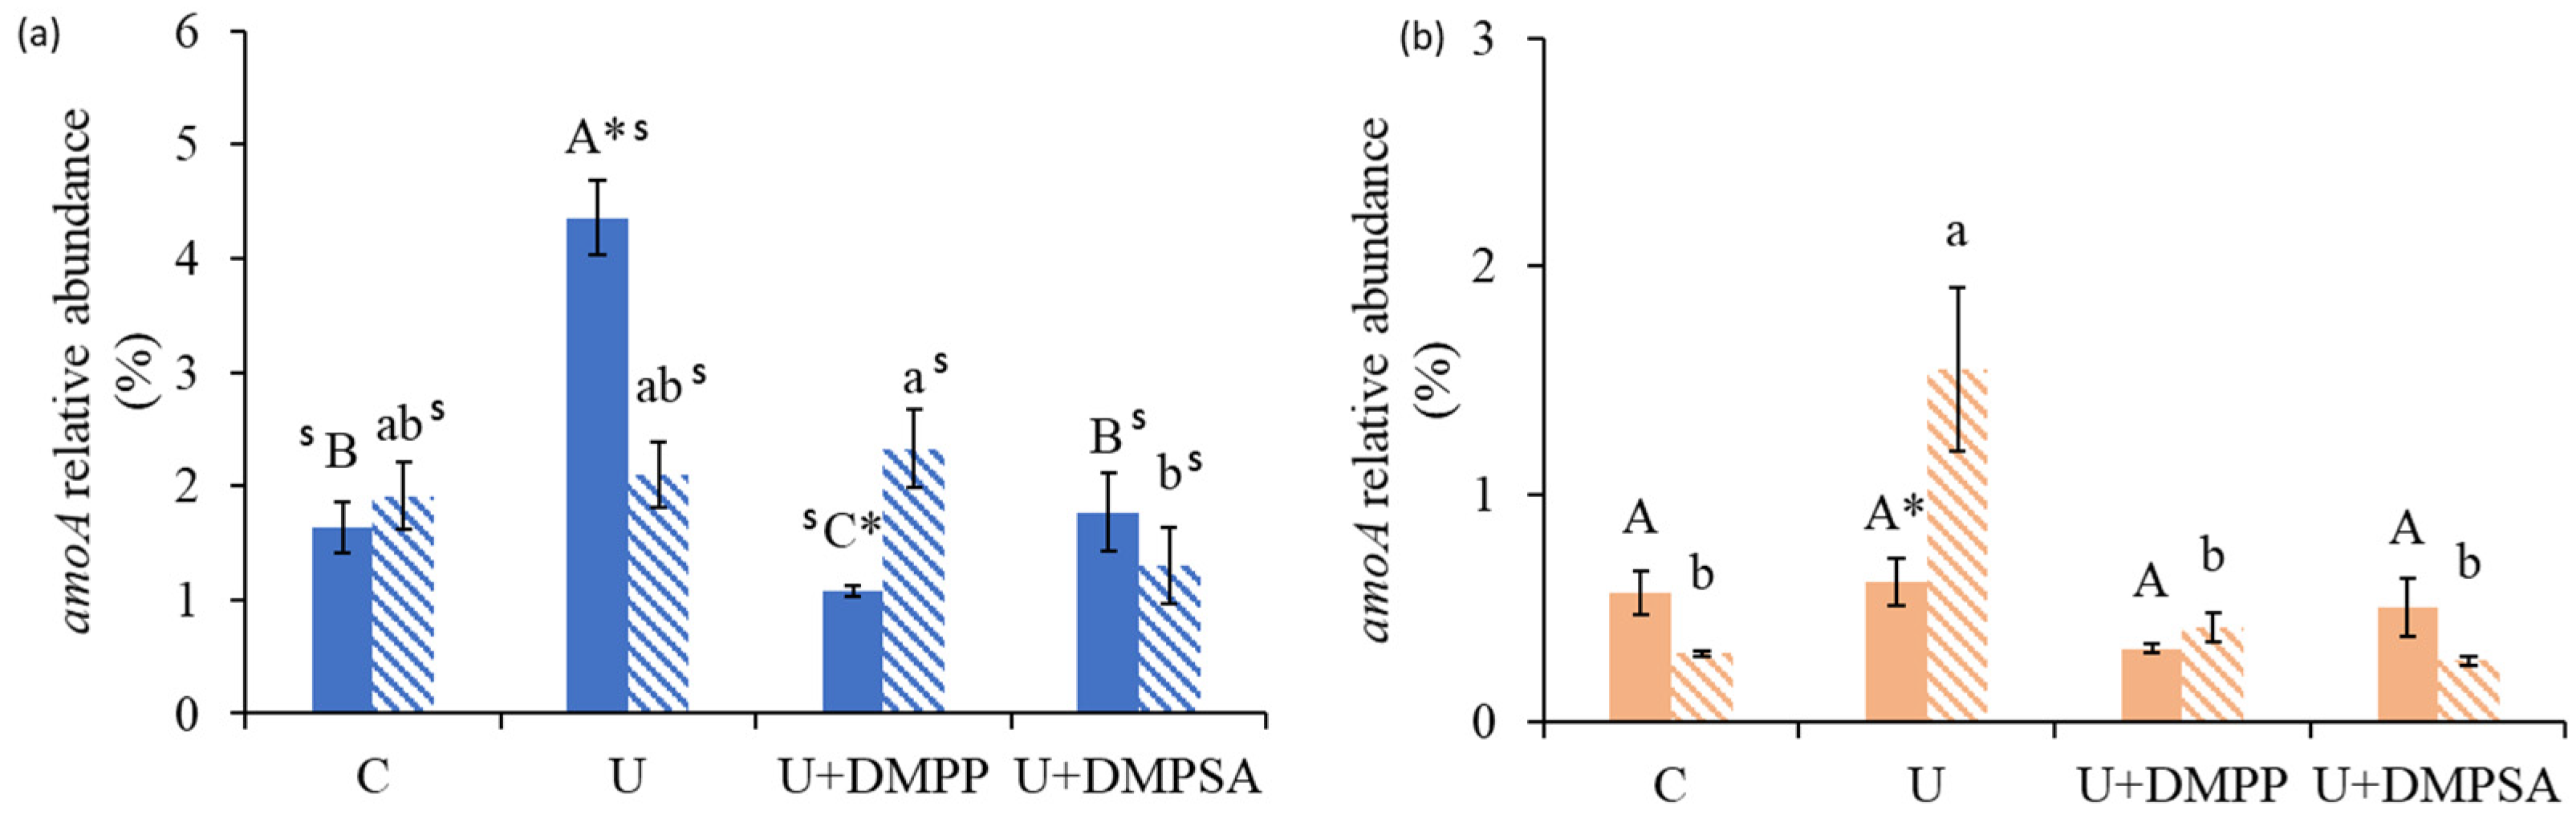
3.5. Abundances of Nitrifying Genes at Different Stages of the Experiments

No significant differences were found in total bacteria abundance (measured as the abundance of the 16S rRNA gene) between treatments in either phase of either soil (Figure S3). However, the multifactorial ANOVA analysis shows a significantly higher abundance of the 16S rRNA gene in soil C compared with soil A, in both phases.
The amoA relative abundance was significantly affected by the type of soil and fertilizer treatments both in Phases I and II. In soil C, the U treatment had a significantly higher amoA relative abundance in Phase I with respect to the other treatments (Figure 5a). Treatments with NIs reduced the abundance by 75% and 60% for U+DMPP and U+DMPSA, respectively, with respect to U. In Phase II, the amoA relative abundance was similar for all treatments, with a slighter lower value in the U+DMPSA treatment. In Phase I for soil A, there were no differences in amoA relative abundance (Figure 5b). Nevertheless, in Phase II, the amoA relative abundance of the U treatment increased significantly, whereas the values for U+DMPP and U+DMPSA were similar to the control treatment, being 73% and 83% lower than U, respectively. A significant interaction of fertilizer treatment and soil was observed in both phases, this difference was produced mainly by the U treatment. A positive correlation between N2O emission and the abundance of amoA genes in the first phase of soil C was found, r = 0.970, α = 0.02.

4. Discussion

In our study, the application of NIs to Soil C proved to be more effective than when applied to Soil A, maintaining their effectiveness for up to three months after application. In Soil C, total N2O emissions were 9.5 and 8.6 times higher in the U treatment than in the NI treatments during phases I and II, respectively. These findings are in agreement with those of Montoya et al. [5], who observed that five months after applying fertilizers to a canola crop, the nitrification inhibitor DMPSA reduced N2O emissions during “hot moments”, with respect to soils treated with urea only. The authors suggested that this prolonged nitrification inhibition effect was due to a reduction in amoA abundance in the NI treatments with respect to the urea-only treatment.
Soil moisture conditions, from the water application until drying, maintained Soil C’s WFPS between 55% and 10%, which, as expected, favored nitrification as the primary N2O production pathway [34], especially during phase I (Figure 2b). During this phase, the NIs maintained soil amoA abundance at similar levels to that of the control. The positive correlation between relative amoA abundance and N2O emissions backs up the assertion that nitrification was the primary process in this phase.
During phase II (Rewetting) of Soil C, the U treatment had higher N2O emissions than the other treatments, but the relative abundance of amoA in this treatment was similar to that of the control. This may indicate that the emissions in this phase were not related to an increase in nitrifiers. According to Harris et al. [8] and Montoya et al. [35], pulses following rewetting are mainly produced through the denitrification process. This aligns with studies by other authors [6,7], who concluded that nitrification is not the primary process during “hot moments”. However, the soil NO3 concentration in the NI treatments was significantly lower than that of the urea treatments, suggesting that the effect of inhibitors in phase II could be related to their prior effect on NO3 formation in the soil rather than their presence during that phase.
Previous studies indicate that in field trials, the positive effect of NIs after rewetting can last up to five months in a canola crop [5], but no effect was observed seven months after NI application in a wheat crop [19]. According to Menéndez et al. [36], environmental conditions (moisture and temperature) can significantly influence the effectiveness of NIs. A comparison of our results with those of field studies is not straightforward, since field studies have high soil heterogeneity (both in moisture and distribution of inputs, such as ammonium or the inhibitor itself) and also temporal variability of meteorological conditions.
During phase I in Soil C, DMP (the active component of DMPP) was only detected in surface layers to a depth of 7 cm. Previous studies have shown that DMPP, with a positive charge, tends to adhere to the soil mineral fraction, especially clay particles [37,38]. The high clay content of Soil C in our study, therefore, likely limited its mobility to deeper layers, thus accumulating in the first 5 cm. This may have helped to improve its effectiveness. Despite the small amount remaining in the soil at the beginning of phase II (Figure 4), the DMPP treatment reduced N2O emissions by nearly 90% with respect to the U treatment, in this phase, likely due to the prior inhibition of nitrification that led to the differences in NO3 content during phase I.
Although we did not obtain consistent data on the amount of DMPSA in the soil, the lack of significant N2O emissions and the reduction in amoA in Soil C during phase II with respect to the DMPP treatment suggest that DMPSA was more effective at inhibiting nitrification than DMPP in this soil, under these conditions (Figure 5a). Its acidic nature makes it more stable in alkaline soils [18], which possibly contributed to prolonging its effectiveness in this soil.
By contrast, in Soil A, with a sandier texture, DMP was found up to a depth of 10 cm. In this soil, the amounts of DMP during phases I and II were similar, indicating that degradation was favored less than in Soil C. According to Sidhu et al. [39], DMP degradation primarily occurs through chemical reactions initiated by reactive oxygen species, rather than by microbial processes. However, Doran et al. [40] state that microbial degradation is the main factor determining DMPP persistence and is influenced by soil moisture and temperature. In our experiment, we observed greater DMPP degradation in Soil C than in Soil A. The higher clay content of Soil C, which retained more water, favored slower wet–dry cycles with respect to the sandier Soil A [41]. This higher moisture level combined with alkaline pH likely enhanced both NI effectiveness [42] and microbial degradation ([41,42]).
Contrary to expectations, in Soil A, with higher levels of DMP than in Soil C, there was no inhibitor effect, as all treatments, including U, had N2O emissions similar to those of the control (Figure 2). This effect can be attributed to soil pH, as the nitrification rate is reduced in soils with acidic pH [43]. According to Li et al. [44], bacterial N2O reductase activity is inhibited under low pH conditions. Additionally, under these conditions, the nitrifying activity of AOB is reduced as it ceases to be the predominant nitrifying population [45], which aligns with the lower amoA abundance we observed in Soil A with respect to that of Soil C (Figure 5).
Although the rewetting (phase II) of Soil A increased amoA abundance in the urea treatment, the N2O emissions were not significantly different from the other treatments. It is possible that the low N2O fluxes emitted from this soil could have been produced by ammonia-oxidizing archaea (AOA) or by pathways unrelated to nitrification [13], thus without an NI effect. However, this cannot be confirmed since, as noted in Section 2.6, only AOB were analyzed. In any case, the N2O emissions from Soil A were on average 4.5 times lower than those of Soil C.
Although moisture is crucial for activating nitrification and denitrification, studies such as that by Gao et al. [46] have found a positive correlation between DMPP inhibition rates and soil pH. This suggests that under certain circumstances, pH may be the most influential factor for the effectiveness of NIs. Their study relied on two key concepts: the microbial action of DMPP and its chemical reactions with soil compounds. The first is supported by Benckiser et al. [47], who found that DMPP is more effective in high pH soils than in low pH soils, as it acts more directly in alkaline conditions on AOB associated with the nitrification process. The second concept is supported by studies that have shown that the active part of the inhibitor is hydrolyzed DMP, whose decomposition is faster in soils with high OH concentrations [47,48]. The results of our AOB analysis and the amount of DMP present in Soil C at the end of each phase are consistent with these results.
This study highlights the potential variability in NI responses in regions with marked wet–dry cycles, underscoring the importance of an application strategy adapted to local edapho-climatic conditions. It shows how a high pH soil improves nitrifying activity by enhancing the efficacy of the inhibitors, but the coarse texture can help to distribute NIs throughout the soil profile. Based on these results, we suggest that the optimal combination for prolonging the effectiveness of NIs in the soil would be to apply them to soils with lower clay contents than those of Soil C under non-acidic pH conditions (above 6). Therefore, developing strategies that integrate key soil factors, such as pH and texture, and consider the specific climatic conditions, could optimize NI effectiveness in the long term and significantly reduce N2O emissions during critical high-emission periods.

5. Conclusions

This study demonstrates that the effectiveness of nitrification inhibitors (NIs) depends on specific soil characteristics, such as pH and texture, especially in Mediterranean regions with pronounced wet–dry cycles. The results show that in a soil with alkaline pH and high clay content (Soil C), NIs (DMPP and DMPSA) were highly effective in reducing N2O emissions, even three months after application. By contrast, the low pH and sandy texture of an acidic soil (Soil A) led to greater vertical mobility of DMPP within the soil profile, maintaining higher DMP concentrations than Soil C throughout the experiment. However, the low nitrification rates, resulting from its low pH, reduced the effectiveness of the inhibitor.
Our results suggest that favorable conditions for prolonging the effectiveness of NIs in a Mediterranean climate could be the combination of a soil with less clay content than soil C used in this study with a pH above six. These findings highlight the need to optimize the use of these inhibitors, especially in soils prone to drying and rewetting cycles, where “hot moments” account for between 50% and 80% of annual emissions in fertilized soils. Understanding how NIs interact with soil properties is essential in the context of global climate change, underscoring the need for tailored fertilization strategies to maximize their benefits for sustainable agricultural practices.

Supplementary Materials

The following supporting information can be downloaded at: https://www.mdpi.com/article/10.3390/agronomy14112620/s1, Figure S1: Daily mean air temperature in the open greenhouse during the experiment. Figure S2: Daily (a,c) and cumulative (b,d) CO2 emissions from the calcareous (a,b) and acidic (c,d) soils. DAF: days after fertilization. Black arrows indicate the rewetting. For cumulative emissions, significant differences (α < 0.05) between treatments within the same phase are indicated with capital and lowercase letters for phases I and II, respectively. Asterisks (*) indicate significant differences between the two phases for the same treatment (α < 0.05). Significant interactions (α = 0.05) between treatment and soil type in each phase are indicated with a (S). Figure S3: Total bacterial abundance, expressed as 16S rRNA per gram of dry soil, in the calcareous (a) and acidic (b) soils, respectively. Significant differences (α < 0.05) between treatments within the same soil are indicated with capital and lowercase letters for phases I and phase II, respectively. Asterisks (*) indicate significant differences between the two phases for the same treatment (α < 0.05). Significant interactions (α = 0.05) between treatment and soil type in each phase are indicated with a (S). Figure S4: Overview of the main results of the experiment including the concentration of DMP from DMPP at different depths (0–10 cm) during the 2 phases in the different soils and their effect on amoA gen abundances and their influence on N2O cumulative fluxes.

Author Contributions

Conceptualization, P.A., A.V., C.G.-M. and L.S.-M.; methodology, L.S.-M., A.B.-L. and J.M.R.; designed the research, L.S.-M., A.B.-L. and S.G.-M.; data analysis; L.S.-M., A.B.-L., S.G.-M. and J.M.R.; writing—original draft preparation, L.S.-M. and A.B.-L.; writing—review; P.A., A.V. and C.G.-M.; project administration and funding acquisition, P.A., A.V. and C.G.-M. All authors have read and agreed to the published version of the manuscript.

Funding

This research was funded by Agencia Estatal de Investigacion (AEI)- Ministerio de Ciencia, Innovación y Competitividad and Fondo Europeo de Desarrollo Regional (RTI2018-096267-B-I00 MCIU/AEI/FEDER, UE), the Comunidad de Madrid (Spain) and Structural Funds 2014–2020 (ERDF and ESF) (project AGRISOST-CM S3018/BAA-4330).

Data Availability Statement

The datasets used and/or analyzed during the current study are available from the corresponding author on reasonable request.

Acknowledgments

We thank EuroChemAgro GmbH, who provided nitrification inhibitors. Adrian Bozal-Leorri is grateful for the Margarita Salas postdoctoral fellowship funded by the Ministry of Universities (Government of Spain) and by the EU “NextGenerationEU” program. Special thanks are also extended to the technicians at the Department of Chemistry and Food Technology of ETSIAAB (particularly Ana Ros, Estrella Revenga, and Rocío Rodríguez) for their collaboration in sampling and analyses. Special thanks are given to Mark R. Theobald who revised the English in the submitted version.

Conflicts of Interest

The authors declare that they have no competing interests.

References

  1. Stocker, T. Climate Change 2013: The Physical Science Basis: Working Group I Contribution to the Fifth Assessment Report of the Intergovernmental Panel on Climate Change; Cambridge University Press: Cambridge, UK, 2014. [Google Scholar]
  2. Meisner, A.; Snoek, B.L.; Nesme, J.; Dent, E.; Jacquiod, S.; Classen, A.T.; Priemé, A. Soil microbial legacies differ following drying-rewetting and freezing-thawing cycles. ISME J. 2020, 14, 2879–2893. [Google Scholar] [CrossRef] [PubMed]
  3. Barrat, H.A.; Evans, J.; Chadwick, D.R.; Clark, I.M.; Le Cocq, K.; Cardenas, L. The impact of drought and rewetting on N2O emissions from soil in temperate and Mediterranean climates. Eur. J. Soil Sci. 2020, 72, 2504–2516. [Google Scholar] [CrossRef]
  4. Guardia, G.; García-Gutiérrez, S.; Rodríguez-Pérez, R.; Recio, J.; Vallejo, A. Increasing N use efficiency while decreasing gaseous N losses in a non-tilled wheat (Triticum aestivum L.) crop using a double inhibitor. Agric. Ecosyst. Environ. 2021, 319, 107546. [Google Scholar] [CrossRef]
  5. Montoya, M.; Guardia, G.; Recio, J.; Castellano-Hinojosa, A.; Gines, C.; Bedmar, E.J.; Álvarez, J.M.; Vallejo, A. Zinc-nitrogen co-fertilization influences N2O emissions and microbial communities in an irrigated maize field. Geoderma 2021, 383, 114735. [Google Scholar] [CrossRef]
  6. Fierer, N.; Schimel, J.P.; Holden, P.A. Influence of drying–rewetting frequency on soil bacterial community structure. Microb. Ecol. 2003, 45, 63–71. [Google Scholar] [CrossRef]
  7. Borken, W.; Matzner, E. Reappraisal of drying and wetting effects on C and N mineralization and fluxes in soils. Glob. Chang. Biol. 2009, 15, 808–824. [Google Scholar] [CrossRef]
  8. Harris, E.; Diaz-Pines, E.; Stoll, E.; Schloter, M.; Schulz, S.; Duffner, C.; Li, K.; Moore, K.L.; Ingrisch, J.; Reinthaler, D.; et al. Denitrifying pathways dominate nitrous oxide emissions from managed grassland during drought and rewetting. Sci. Adv. 2021, 7, eabb7118. [Google Scholar] [CrossRef]
  9. Leitner, S.; Homyak, P.M.; Blankinship, J.C.; Eberwein, J.; Jenerette, G.D.; Zechmeister-Boltenstern, S. Linking NO and N2O emission pulses with the mobilization of mineral and organic N upon rewetting dry soils. Soil Biol. Biochem. 2017, 115, 461–466. [Google Scholar] [CrossRef]
  10. Liu, R.; Hayden, H.; Suter, H.; He, J.; Chen, D. The effect of nitrification inhibitors in reducing nitrification and the ammonia oxidizer population in three contrasting soils. J. Soils Sediments 2015, 15, 1113–1118. [Google Scholar] [CrossRef]
  11. Bozal-Leorri, A.; Subbarao, G.V.; Kishii, M.; Urmeneta, L.; Kommerell, V.; Karwat, H.; Braun, H.-J.; Aparicio-Tejo, P.M.; Ortiz-Monasterio, I.; González-Murua, C.; et al. Biological nitrification inhibitor-trait enhances nitrogen uptake by suppressing nitrifier activity and improves ammonium assimilation in two elite wheat varieties. Front. Plant Sci. 2022, 13, 1034219. [Google Scholar] [CrossRef]
  12. Huérfano, X.; Estavillo, J.M.; Torralbo, F.; Vega-Mas, I.; González-Murua, C.; Fuertes-Mendizábal, T. Dimethylpyrazole-based nitrification inhibitors have a dual role in N2O emissions mitigation in forage systems under Atlantic climate conditions. Sci. Total Environ. 2022, 807, 150670. [Google Scholar] [CrossRef] [PubMed]
  13. Xu, X.; Liu, X.; Li, Y.; Ran, Y.; Liu, Y.; Zhang, Q.; Li, Z.; He, Y.; Xu, J.; Di, H. High temperatures inhibited the growth of soil bacteria and archaea but not that of fungi and altered nitrous oxide production mechanisms from different nitrogen sources in an acidic Soil. Soil Biol. Biochem. 2017, 107, 168–179. [Google Scholar] [CrossRef]
  14. Qiao, C.; Liu, L.; Hu, S.; Compton, J.E.; Greaver, T.L.; Li, Q. How inhibiting nitrification affects nitrogen cycle and reduces environmental impacts of anthropogenic nitrogen input. Glob. Chang. Biol. 2015, 21, 1249–1257. [Google Scholar] [CrossRef]
  15. Yang, M.; Fang, Y.; Sun, D.; Shi, Y. Efficiency of two nitrification inhibitors (dicyandiamide and 3, 4-dimethylpyrazole phosphate) on soil nitrogen transformations and plant productivity: A meta-analysis. Sci. Rep. 2016, 6, 22075. [Google Scholar] [CrossRef]
  16. Rodrigues, J.; Lasa, M.B.; Aparicio-Tejo, P.M.; González-Murua, C.; Marino, D. 3,4-Dimethylpyrazole phosphate and 2-(N-3,4-dimethyl-1H-pyrazol-1-yl) succinic acid isomeric mixture nitrification inhibitors: Quantification in plant tissues and toxicity assays. Sci. Total Environ. 2018, 624, 1180–1186. [Google Scholar] [CrossRef]
  17. Bozal-Leorri, A.; Corrochano-Monsalve, M.; Vega-Mas, I.; Aparicio-Tejo, P.M.; González-Murua, C.; Marino, D. Evidences towards deciphering the mode of action of dimethylpyrazole-based nitrification inhibitors in soil and pure cultures of Nitrosomonas europaea. Chem. Biol. Technol. Agric. 2022, 9, 56. [Google Scholar] [CrossRef]
  18. Torralbo, F.; Menéndez, S.; Barrena, I.; Estabillo, J.M.; Marino, D.; Gonzalez-Murua, C. Dimethyl pyrazol-based nitrification inhibitors effect on nitrifying and denitrifying bacteria to mitigate N2O emission. Sci. Rep. 2017, 7, 13810. [Google Scholar] [CrossRef]
  19. Guardia, G.; Cangani, M.T.; Andreu, G.; Sanz-Cobena, A.; García-Marco, S.; Álvarez, J.M.; Recio-Huetos, J.; Vallejo, A. Effect of inhibitors and fertigation strategies on GHG emissions, NO fluxes and yield in irrigated maize. Field Crops Res. 2017, 204, 135–145. [Google Scholar] [CrossRef]
  20. Corrochano-Monsalve, M.; Huérfano, X.; Menéndez, S.; Torralbo, F.; Fuertes-Mendizábal, T.; Estavillo, J.M.; González-Murua, C. Relationship between tillage management and DMPSA nitrification inhibitor efficiency. Sci. Total Environ. 2020, 718, 134748. [Google Scholar] [CrossRef]
  21. Abalos, D.; Jeffery, S.; Sanz-Cobena, A.; Guardia, G.; Vallejo, A. Meta-analysis of the effect of urease and nitrification inhibitors on crop productivity and nitrogen use efficiency. Agric. Ecosyst. Environ. 2014, 189, 136–144. [Google Scholar] [CrossRef]
  22. Cui, L.; Li, D.; Wu, Z.; Xue, Y.; Xiao, F.; Zhang, L.; Song, Y.; Li, Y.; Zheng, Y.; Zhang, J.; et al. Effects of Nitrification Inhibitors on Soil Nitrification and Ammonia Volatilization in Three Soils with Different pH. Agronomy 2021, 11, 1674. [Google Scholar] [CrossRef]
  23. Guan, T.; Lei, J.; Fan, Q.; Liu, R. Soil Factors Key to 3,4-Dimethylpyrazole Phosphate (DMPP) Efficacy: EC and SOC Dominate over Biotic Influences. Microorganisms 2024, 12, 1787. [Google Scholar] [CrossRef]
  24. Soil Survey Staff. Keys to Soil Taxonomy; USDA, Natural Resources Conservation Service: Washington, DC, USA, 2014.
  25. Danielson, R.E.; Sutherland, P.L. Porosity. In Methods of Soil Analysis, Part 1—Physical and Mineralogical Methods; Klute, A., Ed.; American Society of Agronomy: Madison, WI, USA, 1986; pp. 443–460. [Google Scholar]
  26. Sanchez-Martín, L.; Beccaccia, A.; De Blas, C.; Sanz-Cobena, A.; García-Rebollar, P.; Estellés, F.; Marsden, K.; Chadwick, D.; Vallejo, A. Diet management to effectively abate N2O emissions from surface-applied pig slurry. Agric. Ecosyst. Environ. 2007, 239, 1–11. [Google Scholar] [CrossRef]
  27. Pavelka, M.; Acosta, M.; Kiese, R.; Altimir, N.; Brümmer, C.; Crill, P.; Darenova, E.; Fuß, R.; Gielen, B.; Graf, A.; et al. Standardisation of chamber technique for CO2, N2O and CH4 fluxes measurements from terrestrial ecosystems. Int. Agrophys. 2018, 32, 569–587. [Google Scholar] [CrossRef]
  28. Benckiser, G.; Christ, E.; Herbert, T.; Weiske, A.; Blome, J.; Hardt, M. The nitrification inhibitor 3,4-dimethylpyrazole-phosphate (DMPP)—Quantification and effects on soil metabolism. Plant Soil 2013, 371, 257–266. [Google Scholar] [CrossRef]
  29. Harter, J.; Krause, H.M.; Schuettler, S.; Ruser, R.; Fromme, M.; Scholten, T.; Kappler, A.; Behrens, S. Linking N2O emissions from biochar-amended soil to the structure and function of the N-cycling microbial community. ISME J. 2014, 8, 660–674. [Google Scholar] [CrossRef]
  30. Behrens, S.; Azizian, M.F.; McMurdie, P.J.; Sabalowsky, A.; Dolan, M.E.; Semprini, L.; Spormann, A.M. Monitoring abundance and expression of “Dehalococcoides” species chloroethene-reductive dehalogenases in a tetrachloroethene-dechlorinating flow column. Appl. Environ. Microbiol. 2008, 74, 5695–5703. [Google Scholar] [CrossRef]
  31. Ouyang, Y.; Norton, J.M.; Stark, J.M.; Reeve, J.R.; Habteselassie, M.Y. Ammonia-oxidizing bacteria are more responsive than archaea to nitrogen source in an agricultural Soil. Soil Biol. Biochem. 2016, 96, 4–15. [Google Scholar] [CrossRef]
  32. Guo, J.; Ling, N.; Chen, H.; Zhu, C.; Kong, Y.; Wang, M.; Shen, Q.; Guo, S. Distinct drivers of activity, abundance, diversity and composition of ammonia-oxidizers: Evidence from a long-term field experiment. Soil Biol. Biochem. 2017, 115, 403–414. [Google Scholar] [CrossRef]
  33. Taylor, A.E.; Vajrala, N.; Giguere, A.T.; Gitelman, A.I.; Arp, D.J.; Myrold, D.D.; Sayavedra-Soto, L.; Bottomley, P.J. Use of aliphatic n-alkynes to discriminate soil nitrification activities of ammonia-oxidizing thaumarchaea and bacteria. Appl. Environ. Microbiol. 2013, 79, 6544–6551. [Google Scholar] [CrossRef]
  34. Davidson, E.A.; Hart, S.C.; Shanks, C.A.; Firestone, M.K. Measuring gross nitrogen mineralization, and nitrification by ¹⁵N isotopic pool dilution in intact soil cores. Eur. J. Soil Sci. 1991, 42, 335–349. [Google Scholar] [CrossRef]
  35. Montoya, M.; Juhanson, J.; Hallin, S.; García-Gutiérrez, S.; García-Marco, S.; Vallejo, A.; Recio, J.; Guardia, G. Nitrous oxide emissions and microbial communities during the transition to conservation agriculture using N-enhanced efficiency fertilisers in a semiarid climate. Soil Biol. Biochem. 2022, 170, 108687. [Google Scholar] [CrossRef]
  36. Menéndez, S.; Barrena, I.; Setien, I.; González-Murua, C.; Estavillo, J.M. Efficiency of nitrification inhibitor DMPP to reduce nitrous oxide emissions under different temperature and moisture conditions. Soil Biol. Biochem. 2012, 53, 82–89. [Google Scholar] [CrossRef]
  37. Barth, G.; von Tucher, S.; Schmidhalter, U. Influence of soil parameters on the effect of 3,4-dimethylpyrazole-phosphate as a nitrification inhibitor. Biol. Fertil. Soils 2001, 34, 98–102. [Google Scholar] [CrossRef]
  38. Barth, G.; von Tucher, S.; Schmidhalter, U. Effectiveness of 3,4-dimethylpyrazole phosphate as nitrification inhibitor in soil as influenced by inhibitor concentration, application form, and soil matric potential. Pedosphere 2018, 18, 378–385. [Google Scholar] [CrossRef]
  39. Sidhu, P.K.; Taggert, B.I.; Chen, D.; Wille, U. Degradation of the nitrification inhibitor 3, 4-dimethylpyrazole phosphate in soils: Indication of chemical pathways. ACS Agric. Sci. Technol. 2021, 1, 540–549. [Google Scholar] [CrossRef]
  40. Doran, G.S.; Condon, J.R.; Kaveney, B.F. Rapid analysis of the nitrification inhibitor 3,4-dimethylpyrazole phosphate in soil using LC-MS/MS. J. Environ. Anal. Chem. 2018, 98, 606–621. [Google Scholar] [CrossRef]
  41. Bond, W. Soil Physical Methods for Estimating Recharge-Part 3; CSIRO Publishing: Melbourne, Australia, 1998. [Google Scholar]
  42. Congreves, K.A.; Phan, T.; Farrell, R.E. Revisiting the relationship between soil moisture and N2O production pathways by measuring 15N2O isotopomers. Soil 2019. in review. [Google Scholar] [CrossRef]
  43. Zebarth, B.J.; Forge, T.A.; Goyer, C.; Brin, L.D. Effect of soil acidification on nitrification in Soil. Can. J. Soil Sci. 2015, 95, 359–363. [Google Scholar] [CrossRef]
  44. Li, Z.; Xu, P.; Bo, X.; Wu, J.; Han, Z.; Guo, S.; Li, K.; Shen, M.; Wang, J.; Zou, J. Soil pH-dependent efficacy of DMPP in mitigating nitrous oxide under different land uses. Geoderma 2024, 449, 117018. [Google Scholar] [CrossRef]
  45. Nicol, G.W.; Leininger, S.; Schleper, C.; Prosser, J.I. The influence of soil pH on the diversity, abundance and transcriptional activity of ammonia oxidizing archaea and bacteria. Environ. Microbiol. 2008, 10, 2966–2978. [Google Scholar] [CrossRef] [PubMed]
  46. Gao, J.; Luo, Y.; Lindsey, S.; Shi, Y.; Wei, Z.; Wang, L.; Zhang, L. Effects of soil properties on urea-N transformation and efficacy of nitrification inhibitor 3,4-dimethylpyrazole phosphate (DMPP). Soil Sci. Plant Nutr. 2021, 68, 228–237. [Google Scholar] [CrossRef]
  47. Benckiser, G.; Schartel, T.; Weiske, A. Control of NO3 and N2O emissions in agroecosystems: A review. Agron. Sustain. Dev. 2015, 35, 1059–1074. [Google Scholar] [CrossRef]
  48. McCarty, G.W. Modes of action of nitrification inhibitors. Biol. Fertil. Soils 1999, 29, 1–9. [Google Scholar] [CrossRef]
Figure 1. Weekly estimates of water-filled pore space (WFPS) in the calcareous (blue color) and acidic (orange color) soils during both phases: Phase I (from 0 to 44 days) and Phase II, rewetting (from 101 to the end of the experiment). DAF: days after fertilization. The vertical bars indicate standard errors (n = 3).
Agronomy 14 02620 g001
Figure 2. Daily (a,c) and cumulative (b,d) N2O emissions from the calcareous (a,b) and acidic (b,d) soils. DAF: days after fertilization. Black arrows indicate the rewetting. For cumulative emissions, significant differences (α < 0.05) between treatments within the same soil are indicated with capital and lowercase letters for Phases I and II, respectively. The vertical bars indicate standard errors (n = 3). Significant interactions (α = 0.05) between treatment and soil type in each phase are indicated with a (S).
Agronomy 14 02620 g002
Figure 3. Soil mean of NH4+ (a,c) and NO3 (b,d) concentrations in the first and second phases in the calcareous (a,b) and acidic (c,d) soils. Significant differences (p < 0.05) between treatments within the same phase are indicated with capital and lowercase letters for Phases I and II, respectively. Asterisks (*) indicate significant differences between the two phases for the same treatment in (α < 0.05). The vertical bars indicate standard errors (n = 3). Significant interactions (α = 0.05) between treatment and soil type in each phase are indicated with a (S).
Agronomy 14 02620 g003
Figure 4. DMP (from DMPP) concentrations at different soil depths at the end of each phase in both experiments: calcareous soil (a) and acidic soil (b). Different letters above the bars indicate significant differences (α < 0.05) between depths within the same phase (capital and lowercase letters for Phases I and II, respectively). Asterisks (*) indicate significant differences (α < 0.05) between phases at the same depth. The vertical bars indicate standard errors (n = 3).
Agronomy 14 02620 g004
Figure 5. Ammonia oxidizing bacteria (AOB) relative abundance (measured as the relative abundance of the amoA gene), in the calcareous (a) and acidic soils (b), respectively. Significant differences (α < 0.05) between treatments within the same soil are indicated with capital and lowercase letters for Phase I and Phase II, respectively. Asterisks (*) indicate significant differences between the two phases within the same treatment (α < 0.05). The vertical bars indicate standard errors (n = 3). Significant interactions (α = 0.05) between treatment and soil type in each phase are indicated with a (S).
Agronomy 14 02620 g005
Disclaimer/Publisher’s Note: The statements, opinions and data contained in all publications are solely those of the individual author(s) and contributor(s) and not of MDPI and/or the editor(s). MDPI and/or the editor(s) disclaim responsibility for any injury to people or property resulting from any ideas, methods, instructions or products referred to in the content.

