Article

Impact of Climate Change on the Winter Wheat Productivity Under Varying Climate Scenarios in the Loess Plateau: An APSIM Analysis (1961–2100)

1
College of Water Conservancy, North China University of Water Resources and Electric Power, Zhengzhou 450045, China
2
School of Water Resources and Environment Engineering, Nanyang Normal University, Nanyang 473061, China
3
Henan Key Laboratory of Water-Saving Agriculture, Zhengzhou 450045, China
4
College of Water Resources and Civil Engineering, China Agricultural University, Beijing 100083, China
5
Institute of Water-Saving Agriculture in Arid Areas of China (IWSA), Northwest A&F University, Yangling 712100, China
*
Authors to whom correspondence should be addressed.
Agronomy 2024, 14(11), 2609; https://doi.org/10.3390/agronomy14112609
Submission received: 5 October 2024 / Revised: 25 October 2024 / Accepted: 3 November 2024 / Published: 5 November 2024
(This article belongs to the Section Farming Sustainability)

Abstract

:
Consideration of crop yield variability caused by long-term climate change offers a way to quantify the interplay between climate change, crop growth, and yield. This study employed the APSIM model to simulate the potential winter wheat yield under varying climate scenarios in 1961–2100 in the Loess Plateau. It also evaluated the long-term response and adaptation differences of winter wheat yield to climate change. The results show that there is a slight downward trend in inter-annual precipitation during the winter wheat growth period, with a reduction of −2.38 mm·decade−1 under the S245 scenario (abbreviated SSP2-4.5) and −2.74 mm·decade−1 under the S585 scenario (abbreviated SSP5-8.5). Interestingly, the actual yield of winter wheat was positively correlated with precipitation during the growth period but not with temperature. By contrast, climatic yield exhibits a significant correlation with both factors, suggesting that future crop yield will largely depend on its sensitivity to climate change. In addition, climate change may marginally improve yield stability, although regional variations are evident. Notably, potential yields in water-restricted areas, such as Qinghai and Gansu, are significantly influenced by precipitation. This study provides an important reference for formulating long-term adaptation strategies to enhance the resilience of agricultural production against climate change.

1. Introduction

With the background of global warming, climate change poses a significant impact on agricultural production, particularly in areas with rainfed agriculture that are heavily dependent on climatic conditions [1]. The Loess Plateau, a quintessential example of such an area [2], widely cultivates winter wheat in various varieties due to its substantial commercial value. The sown area of winter wheat reaches 4.3 million ha, accounting for 40% of the grain crops in this region [3]. However, the climate resources of the Loess Plateau have undergone substantial changes in recent decades, posing direct implications for the winter wheat production in this region; the decreasing trend of precipitation in the Loess Plateau in recent decades was −7.51 × 10⁻¹ mm·a−1 (p < 0.05) [4,5]. Increased precipitation variability means that the global climate system is becoming more variable and uneven [6], which will directly affect the winter wheat production in this region. Therefore, it is of great importance to study the change characteristics of meteorological elements and their impact on agricultural production for predicting future climate development and formulating sustainable agricultural production plans [7].
According to the Intergovernmental Panel on Climate Change (IPCC) Assessment Report 6 (AR6) (2022), the average global surface temperature has increased by 0.99 °C from 2001 to 2020 compared with the period from 1850 to 1900. It is expected that by 2050, the increased temperature could lead to a 2.6% increase in wheat yields at low altitudes and a 6.0% increase in yields at high altitudes within the study area [8]. However, contrasting reports have suggested that a 1 °C increase in temperature results in a yield loss of about 4% under conditions of elevated CO2 [9]. Bouroncle et al. (2019) reported that inter-annual climate change had mostly negative effects on crop growth and product quality [10]; Yang et al. (2020) reported that crop productivity in the Loess Plateau was affected by climate change, and the average yield under the Representative Concentration Pathway (abbreviated RCP) scenario decreased by 1.7% to 23.6% [11].
The majority of research has focused on improving crop production under the future climate change scenario in the Loess Plateau by changing agricultural management practices [12,13]. For specific production areas of a single crop, methods such as adjusting planting structure [14], changing mulching practices [15], and adjusting the sowing date of winter wheat [16] have been proposed to adapt to climate change. As research methods have advanced, more and more studies have been conducted on the impact of climate change on crop production at both regional and global scales [11,17]. Farrell et al. (2023) and Sun et al. (2018) utilized crop models to simulate the crop growth dynamics and forecast agricultural production under climate change conditions, relying on process-based mechanisms [18,19]. Dettori et al. (2017) simulated the effects of climate change on wheat production and phenology in the Mediterranean region, revealing that warm and dry climates had extremely adverse effects on wheat production [20]. Wang et al. (2017) reported an average increase in the length of growing period (LGP) during 1991–2012; changes in management have larger impacts than climate change for early and single rice [21].
In the realm of agrometeorological research, crop growth models have been widely used to dynamically simulate crop growth process and yield formation [22], predict crop production potential, and provide guidance for farmland management practices [23,24]. Existing studies have used crop models such as TBLSHAW, DSSAT, SWAP, and RZWQM to simulate crop growth and estimate possible yield, yielding a series of valuable results [25,26,27]. The actual relationship between agricultural production and climate change is very complicated, and some simplification is often performed in the model so that agricultural research problems and mathematical models can be well-integrated and easy to follow [28]. The APSIM model is suitable for evaluating the production potential of agricultural systems and the impact of management measures on climate change [11,29]. It has been applied in many countries and regions worldwide, offering significant guidance for exploring efficient agricultural management measures under the condition of precipitation change [30].
This paper endeavored to assess the process and mechanism of winter wheat adaptation to climate change in the Loess Plateau while also conducting a systematic study on the potential effects of climate change on winter wheat yield. Thus, we utilized the APSIM model to simulate winter wheat productivity under different climate scenarios in 1961–2100 and analyze the changes in agro-climatic resources during the growth period of winter wheat under future climate scenarios.

2. Materials and Methods

2.1. Description of the Study Area

The Loess Plateau, located between longitudes 100°52′–114°33′ E and latitudes 33°41′–41°16′ N (Figure 1a), is the largest region of loess deposits in the world. It spans over 1000 km from east to west and 750 km from north to south, covering seven provinces and autonomous regions. It lies west of Taihang Mountain in China, east of Riyue Mountain in Qinghai Province, north of Qinling Mountain, and south of the Great Wall. The altitude is 800–3000 m. On the Loess Plateau of China, crop yields are mainly constrained by available water. It is characterized by arid and semi-arid continental climates, with annual average temperatures from 4.3 °C to 14.3 °C and annual precipitation ranging from 200 to 750 mm, increasing from northwest to southeast. This region boasts abundant sunlight, with an annual sunshine duration of 2200–2800 h. Figure 1b illustrates the trend of the annual average precipitation and the historical winter wheat yield from 1961 to 2015. It is evident that the precipitation followed a fluctuating cycle and showed an overall downward trend, while the yield remained relatively stable and primarily increased over this period.
The Loess Plateau, positioned in the transitional zone between semi-humid and semi-arid regions, is a typical rainfed agricultural region. Winter wheat is one of the main grain crops in the Loess Plateau area, and its yield directly affects the grain supply and security in the central and western regions of China. Therefore, this paper focused on winter wheat planting and selected seven provinces on the Loess Plateau as the study subject.

2.2. Data Collection

In this study, meteorological data spanning from 2015 to 2100 were obtained from the General Circulation Models (GCMs) of the Coupled Model Intercomparison Project Phase 6 (CMIP6). The aim was to evaluate meteorological changes and crop production in the Loess Plateau under two shared socioeconomic pathways (SSP2-4.5 and SSP5-8.5). In the CMIP6, RCP is used to describe the impact of human activities in future scenarios, which increases the consideration of social and economic development compared with the Fifth Coupled Model Intercomparison Project (CMIP5) [31]; the CMIP6 enhances the consideration of social and economic development. The SSP, the abbreviation for Shared Socioeconomic Pathway, combines with RCPs to provide comprehensive view of future change scenarios [32]. According to IPCC (AR6), SSP1, SSP2, SSP3, SSP4, and SSP5 represent five paths of sustainable development, moderate development, partial development, unbalanced development, and conventional development, respectively. Among the five distinct paths to socioeconomic development outlined by the SSP [33], SSP5 describes a future under a high-risk scenario with high challenges for mitigation and low challenges for adaptation. On the other hand, SSP2 represents a balanced “middle-of-the-road” scenario with medium challenges for both mitigation and adaptation. SSP2-4.5 and SSP5-8.5 were coupled with the scenarios of regional vegetation restoration projects to reflect future land use changes and climate change. In addition, the change characteristics of spatio-temporal distribution of the other meteorological resources and potential yield of winter wheat were also comprehensively investigated according to CMIP6 in this paper.
The historical meteorological data of 56 national-level basic meteorological stations in the Loess Plateau, covering daily records spanning from 1961 to 2014, were retrieved from the China Meteorological Data Sharing Network (accessed on date: http://data.cma.cn/, accessed on 1 September 2024). The comprehensive dataset encompasses daily records of various meteorological elements, including maximum temperature, minimum temperature, relative humidity, rainfall, sunshine duration, and so on. These data can be used for comparison and verification with simulated changes in agricultural meteorological resources under future climate conditions. In this study, the historical winter wheat yield data of the Loess Plateau were sourced from the official website of the National Bureau of Statistics of China (accessed on date: http://www.stats.gov.cn/, accessed on 1 September 2024). In particular, statistical yearbooks of seven provinces and 46 prefecture-level divisions together with rural statistical yearbooks of the Loess Plateau were consulted to ensure the comprehensiveness of the winter wheat trial and yield data. To achieve the target of remote sensing monitoring in time series, a 16-Day synthesis MODISNDVI data with a special resolution of 145 m by 250 m (http://modis.gsfc.nasa.gov, accessed on 1 September 2024) was downloaded, and the MODIS data processing was completed.

2.3. Model Configuration Parameter

The APSIM-wheat model, an agricultural production system simulator with modified parameters, has been employed to simulate the rainfed potential yield, along with the photosynthetic and temperature potential yield of winter wheat. Taking into account the actual conditions of different meteorological stations in each province, this study selected a local common winter wheat planting cultivar as a representative cultivar for simulation purposes; see details in Table 1. The range of cultivar parameters for these representative winter wheat cultivars was mainly obtained from the published literature. In this study, crop cultivars were assumed to remain unchanged in each decade, while the seeding density, row spacing, and other farmland management measures were referenced from recent publications by the research team [34,35].

2.4. Change Trend of Meteorological Data

The trend of each meteorological indicator over time is expressed by the climate tendency rate. This rate was estimated by the least square estimate (LS); that is, the unitary linear regression equation of time and each element was established [36]:
x i = a t i + b   ·   t   =   1 ,   2 ,   3 , n
where t i represents the year; x i represents the values of each element; a represents the regression coefficient of the equation; and b stands for intercept. Taking 10 a as the climate tendency rate, that is, this index represents the variability of 10 a. If the climate tendency rate is greater than 0, it means that it increases with increasing time; otherwise, it decreases.
The coefficient of variation is used to evaluate the stability of winter wheat yield under future climate change scenarios. The smaller the coefficient of variation, the better the stability will be, and vice versa. The coefficient of variation is calculated by Equation (2):
C V = 1 n i = 1 n ( x i x ¯ ) 2 x ¯
x i is the value of element in year i , and x ¯ is the multi-year average value.

3. Results

3.1. Spatial Distribution of Historical Meteorological Resources

This study provides a comprehensive summary and analysis of several key meteorological factors that influenced crop yields from 1961 to 2015. The corresponding spatial distribution map was created using ArcGIS 10.2 software. Figure 2a presents the trend of annual average precipitation over this period, revealing a fluctuating cycle with an overall decreasing pattern. The accumulated temperature distribution map (Figure 2b) highlights two distinct concentration areas: the southwest of Shanxi and the intersection of Shaanxi and Gansu. The highest accumulated temperature was recorded at Sanmenxia Station in Henan Province, while the lowest was at Xinghai Station in Qinghai Province. The average annual evaporation of the Loess Plateau exceeded 1500 mm, with the highest daily evaporation concentrated in Gansu Province. The peak value of 5.88 mm per day was recorded at Minqin Station; see this in Figure 2c–e, which present the trend of daily evaporation, annual radiation, and sunshine hours, respectively, showing that their distributions are similar to the variation of the accumulated temperature distribution. The Normalized Difference Vegetation Index (NDVI), an indicator reflecting the growth of green plants, can be integrated with crop models to predict crop yield. As depicted in Figure 2f, the NDVI across the Loess Plateau increases from northwest to southeast, with denser vegetation coverage in the middle reaches of the Yellow River than in other regions. This finding is consistent with the distribution of precipitation.
Correlation analysis is a statistical analysis method that can intuitively quantify correlation coefficients between factors. Consequently, this method was employed to explore the interplay among the main meteorological factors affecting the yield, and the historical statistical yield of winter wheat in 1961–2100 was investigated using correlation analysis, as shown in Figure 3. The results show that there is a significant positive correlation between sunshine duration (ssd) and total solar radiation (ra). Conversely, annual accumulated temperature (T_A) and mean annual air temperature (T_mean) are negatively correlated with ra, attributing to the inverse relationship between temperature and radiation wavelength. In addition, both annual precipitation (Pre_1) and growth period precipitation (Pre_2) show a negative correlation with evaporation (vep). The actual harvest yield of winter wheat (Yield_A) exhibits a positive correlation with both Pre_1 and Pre_2, with a more substantial correlation with Pre_2. However, the correlations between Yield_A and T_A or T_mean are insignificant. Notably, the isolated climate trend yield (Yield_C) is significantly correlated with Pre_1, Pre_2, T_A, and T_mean.

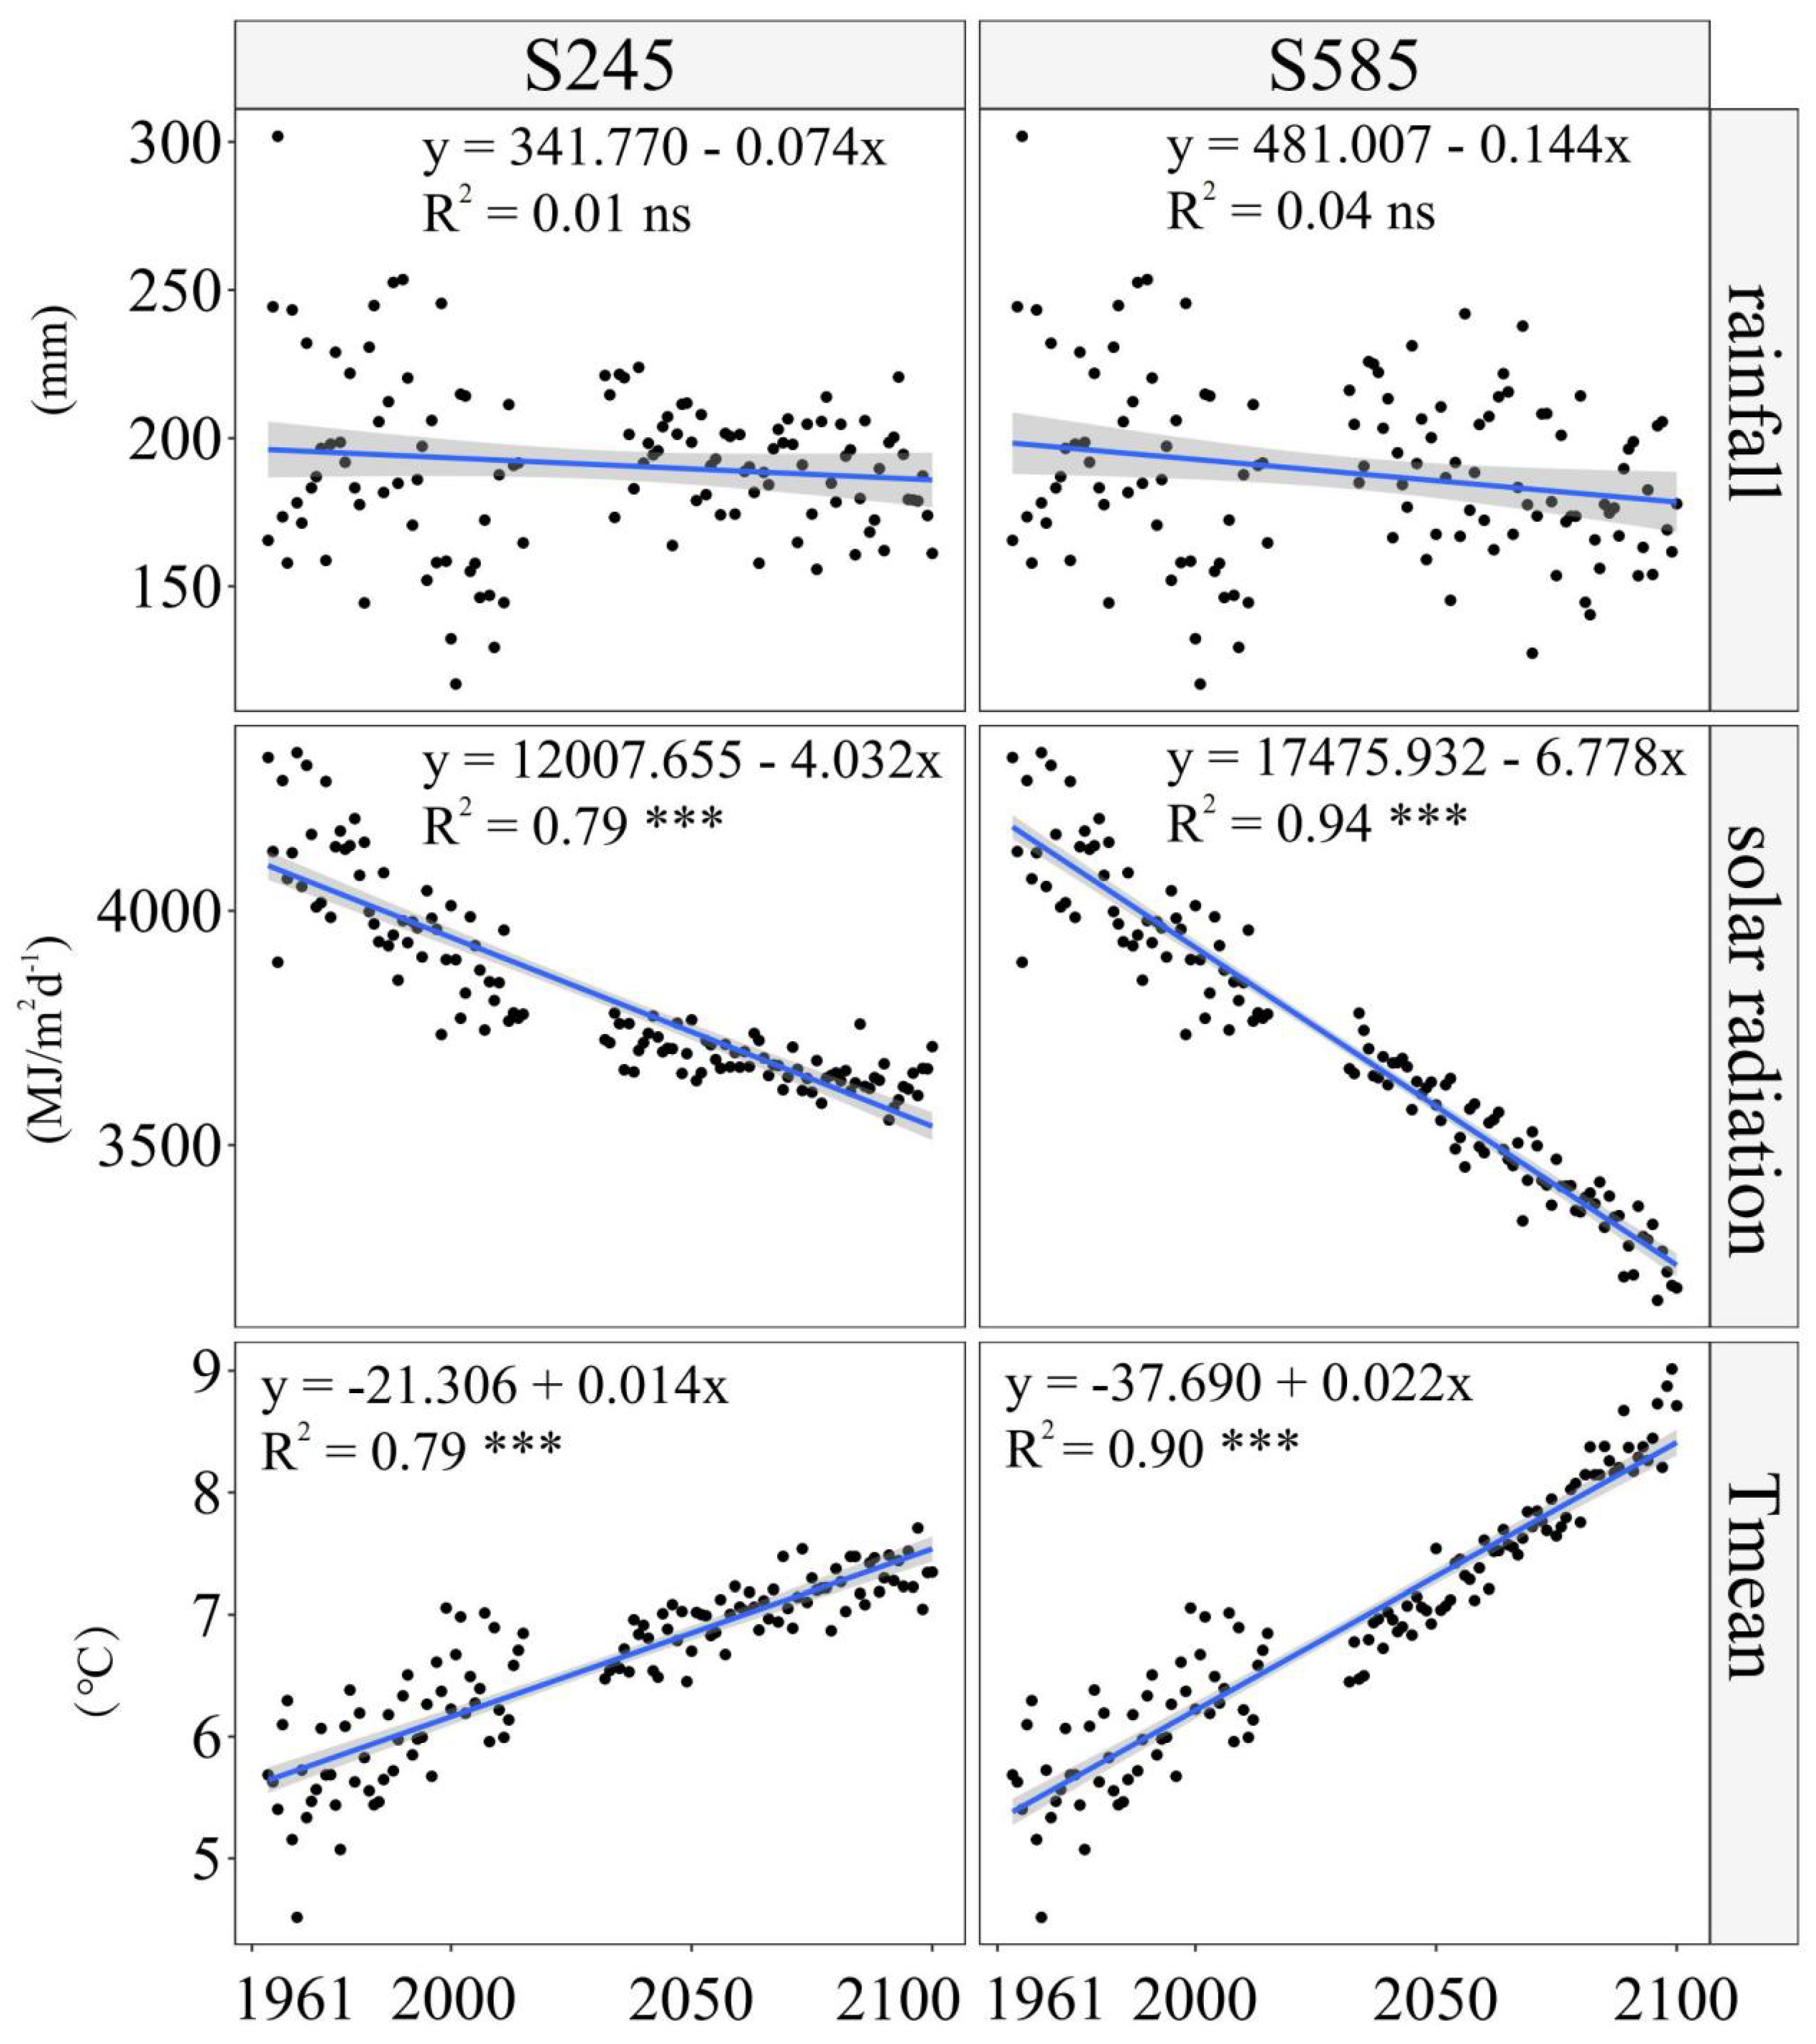
3.2. Change Characteristics of Meteorological Resources Under Future Climate Scenarios

Figure 4 shows the variations in three types of agro-climatic resources during the winter wheat growth period across different timeframes from 1961 to 2100 under SSP2-4.5 (abbreviated S245) and SSP5-8.8 (abbreviated S585) climate scenarios, respectively. As can be seen, the inter-annual precipitation fluctuated greatly during the winter wheat growth period in the study area from 2016 to 2100, with no clear linear trend but a slight overall decline. Specifically, the decline rate is about −2.38 mm·decade−1 under the S245 scenario and −2.74 mm·decade−1 under the S585 scenario. Under both scenarios, the annual total solar radiation during the growth period of winter wheat in the study area shows an increasing trend, with values of −37.61 MJ·m−2·10a−1 and −73.80 MJ·m−2·10a−1, respectively. The annual average temperature demonstrates a rising trend, with an increase of 0.13 °C·10a−1 under S245 and 0.26 °C·10a−1 under S585.
In general, the change in agro-climatic resources under future climate scenarios is also depicted in Table 2. Specifically, it indicates that annual precipitation and total solar radiation both decreased, with the S245 scenario experiencing slightly higher values than S585, Conversely, the mean temperature increases, with S585 exhibiting higher values than S245.

3.3. Changes in Yield Under Rainfed Conditions in Future Climate Scenarios

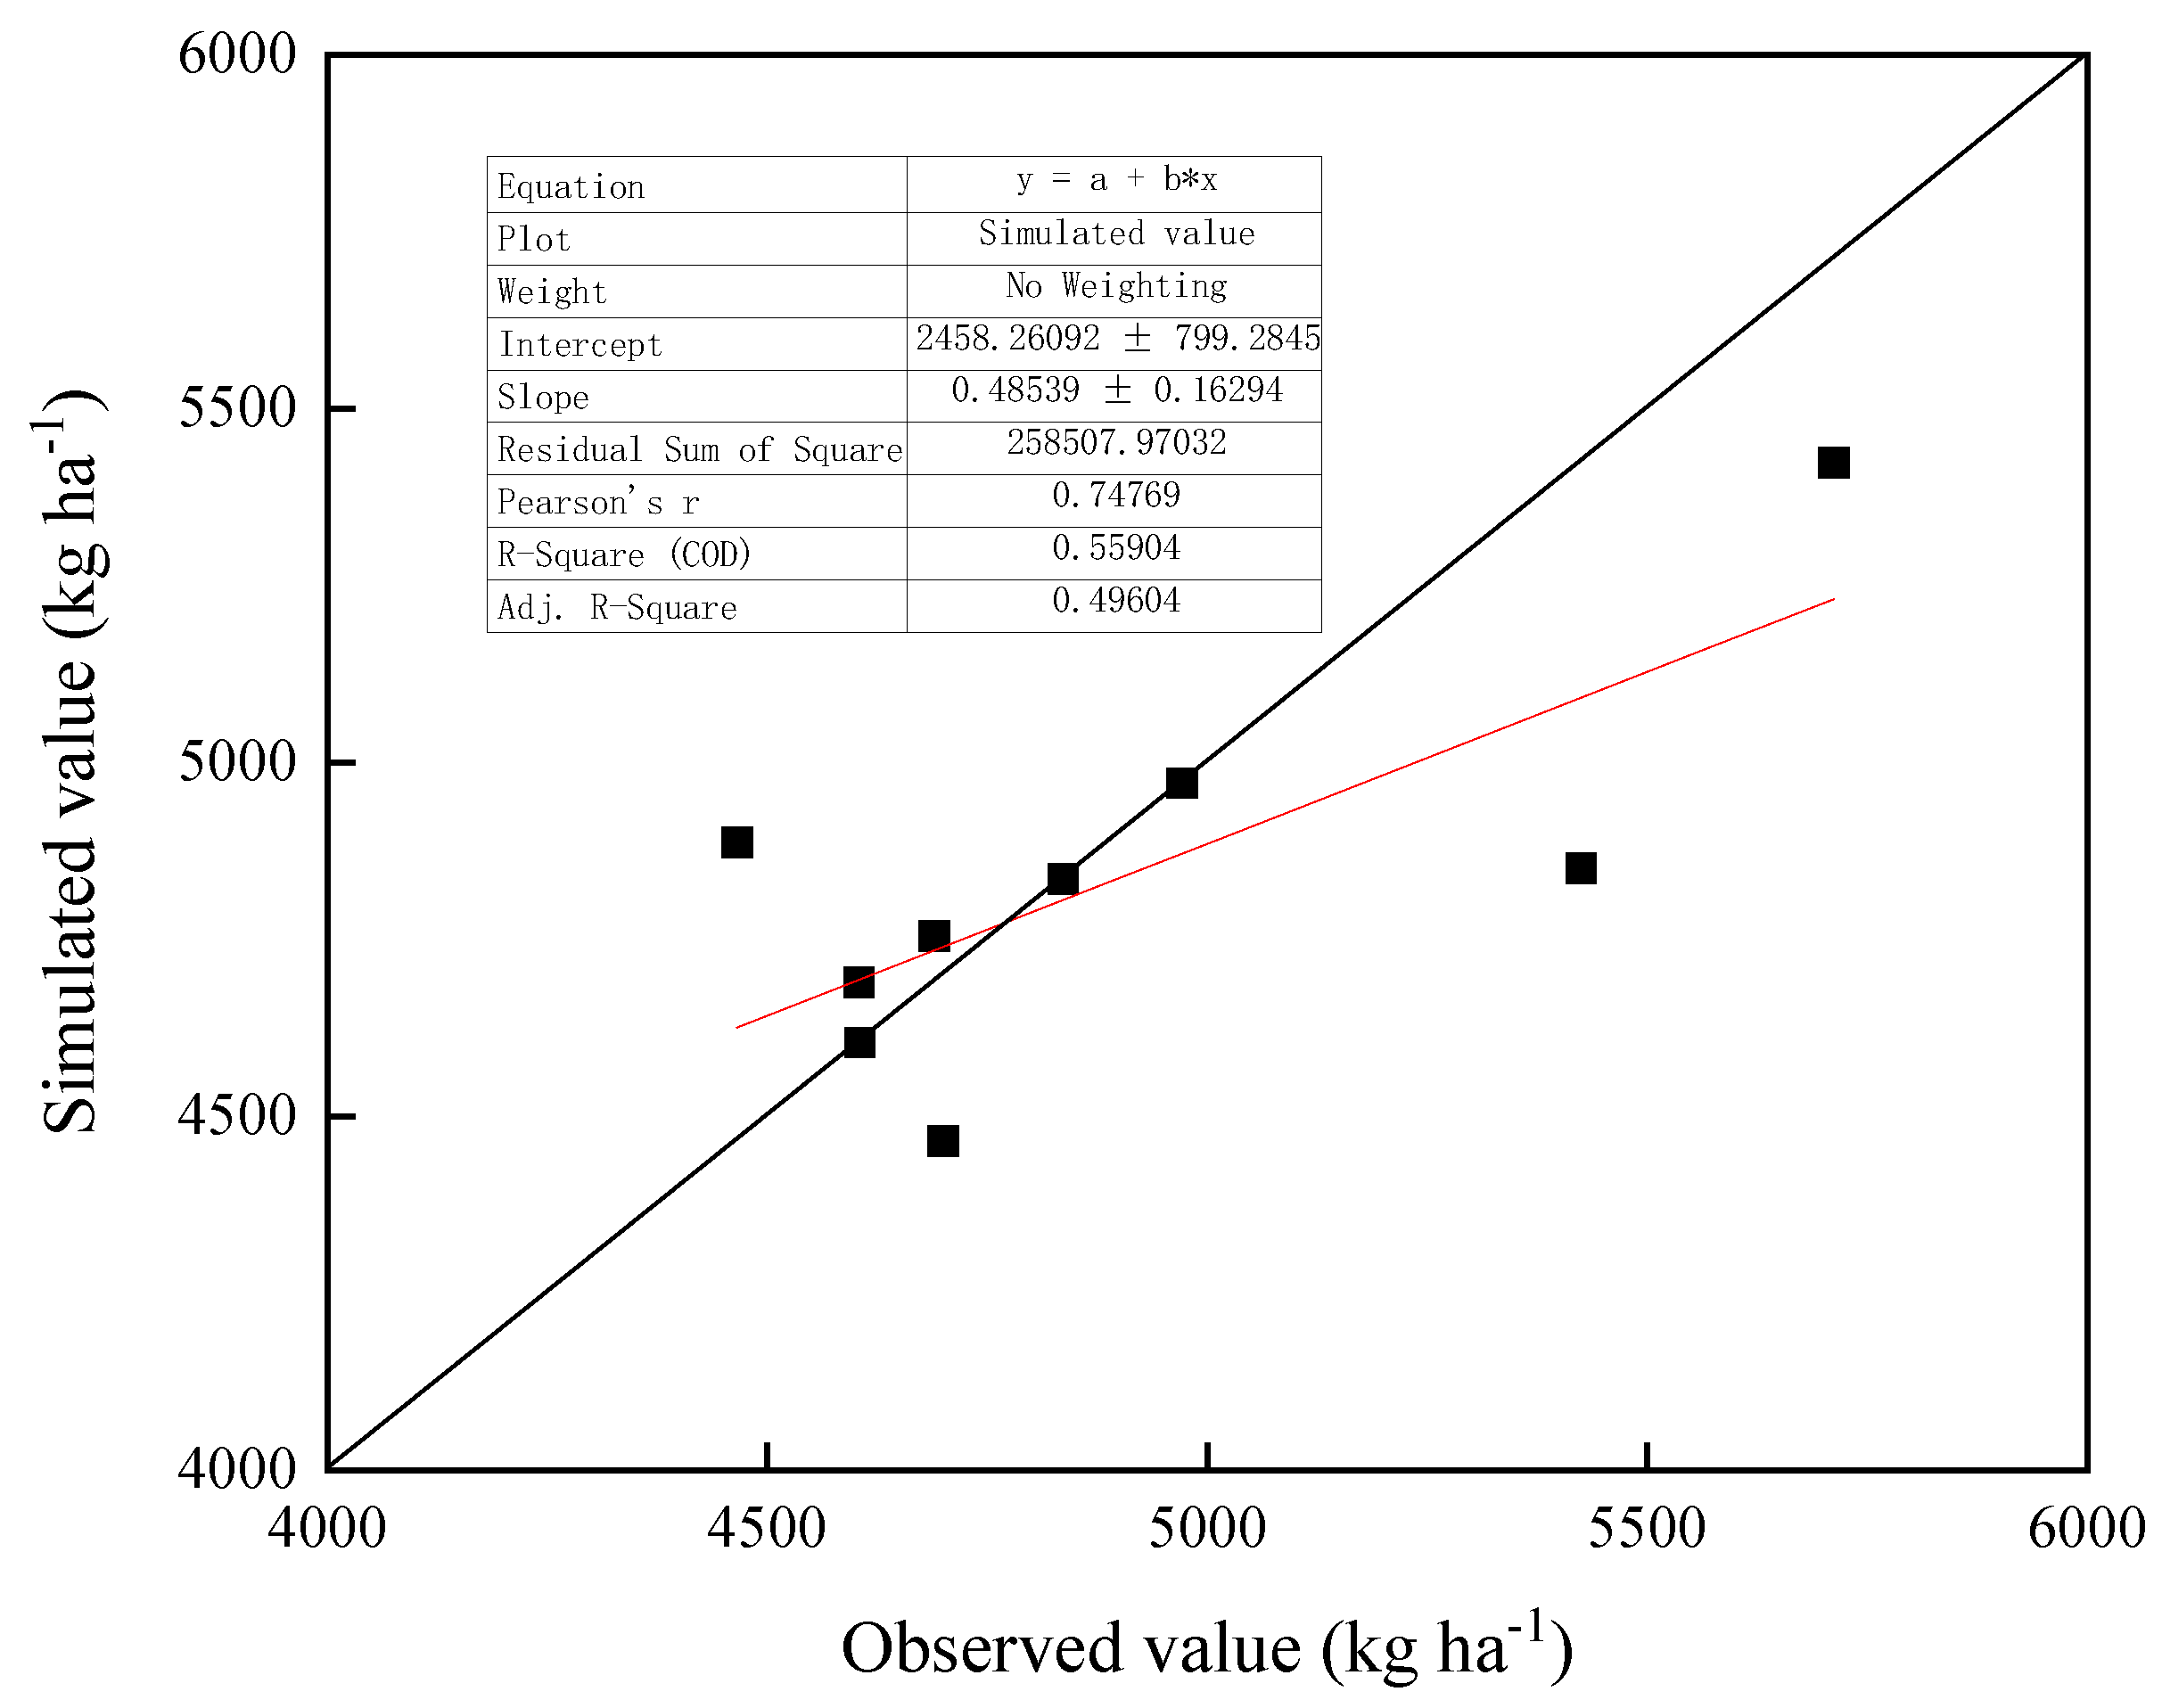
3.3.1. Calibration and Validation of Simulated Yield with the Field Experiment Data

To minimize the discrepancy between simulated and observed values, the crop variety parameters in the APSIM model were calibrated and verified by using the winter wheat (Xiaoyan 22) test data of the three seasons from 2013 to 2016 in Yangling district, alongside statistical yield data from 2013 to 2019 in the corresponding regions. The verified simulated results for winter wheat yield are presented in Figure 5. It can be seen that the simulated value of winter wheat yield is basically consistent with the observed value, confirming the efficiency of the APSIM model in simulating the growth process and yield of winter wheat in this particular region.

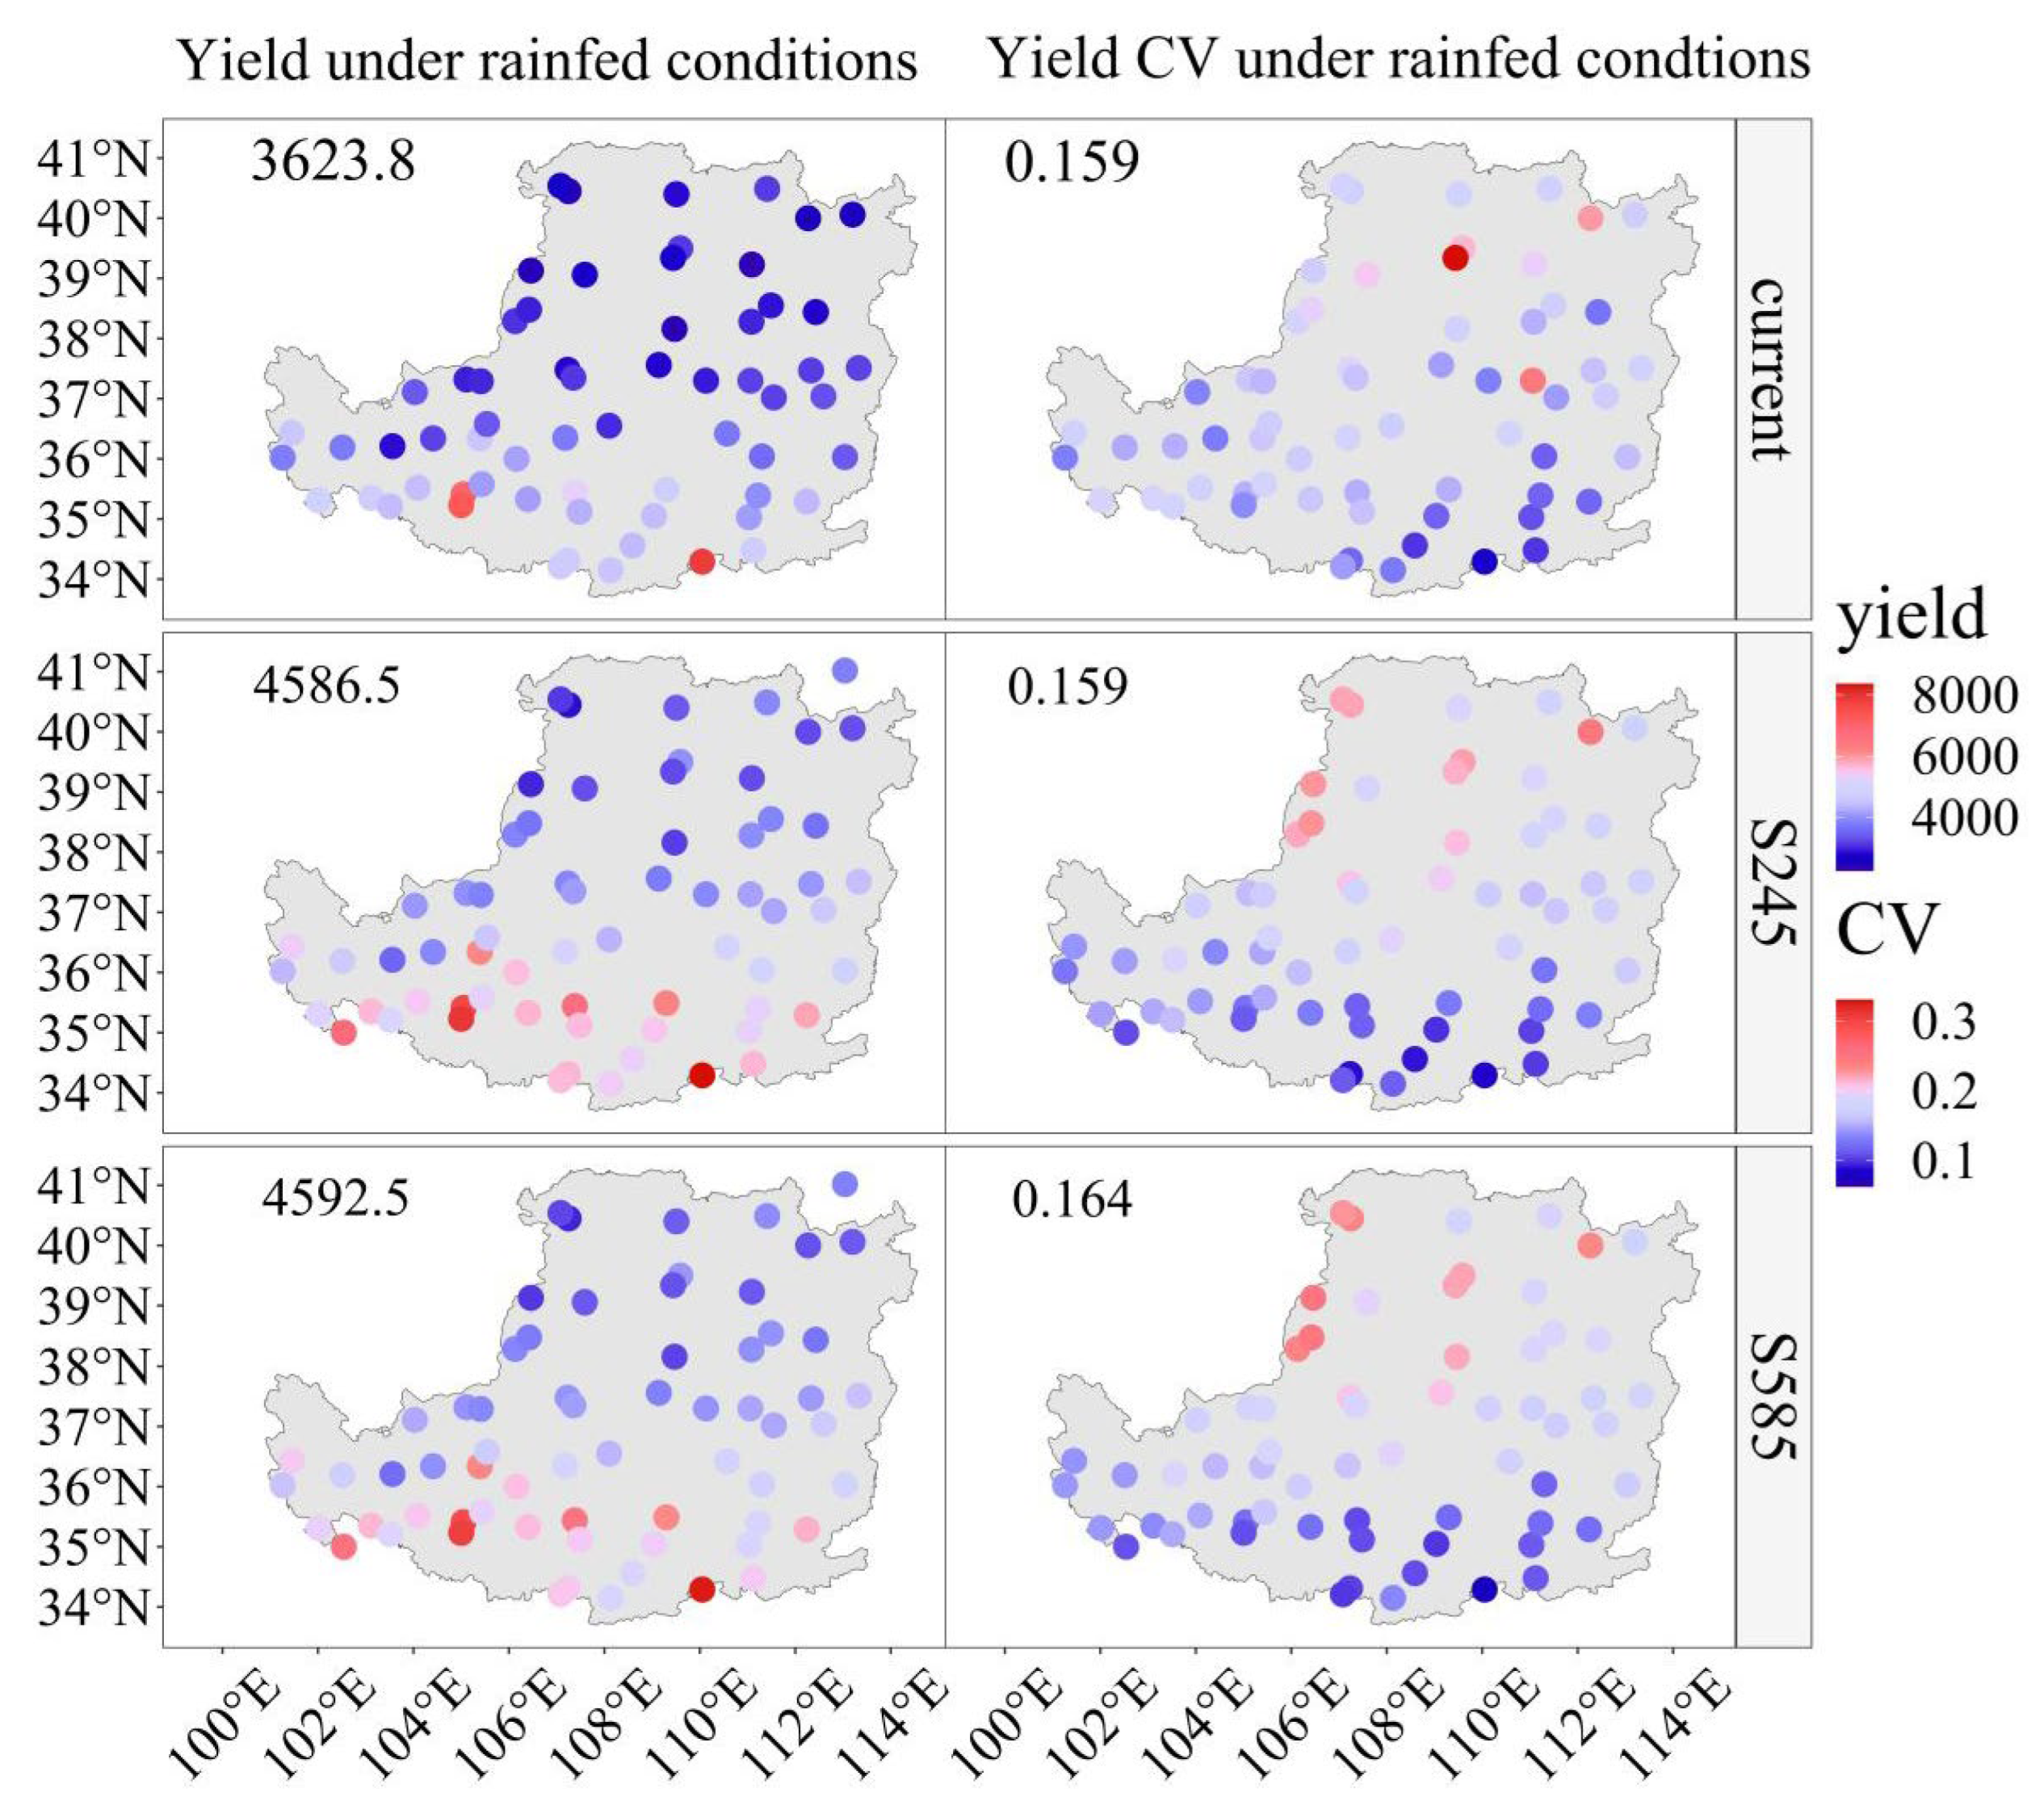
3.3.2. Potential Yield of Winter Wheat Under Rainfed Conditions Under Future Climate Scenarios

Figure 6 shows the mean annual value and coefficient of variation for the winter wheat rainfed potential yield predicted under different climate scenarios from 2015 to 2100, utilizing statistics from the period 1961–2014. The yield values in the figure are measured in kg·ha−1. Compared with the current scenario, the yield under rainfed conditions is higher than under the two scenarios S245 and S585. However, there is no significant difference among the three scenarios in the coefficient of variation. In general, the distribution of rainfed potential yield and the distribution of coefficient of variation exhibit the opposite trend from south to north in geographical position.
Figure 7 shows the variation in the mean annual winter wheat rainfed potential yield and its coefficient of variation from 2015 to 2100 relative to the base period of 1961–2014. The spatial distribution of yield difference under rainfed conditions is generally consistent with the pattern observed in Figure 5. The analysis reveals that, in the absence of adaptation measures, the rainfed potential yield of winter wheat under the S585 scenario is the largest compared with the current and S245 scenarios, with an increasing trend from north to south.
As presented in Table 3, a comparison of the average values of potential yield under rainfed conditions across three climate scenarios reveals the following order: S585 > S245 > current. Specifically, under the S585 scenario, the predicted winter wheat yields of Henan and Shaanxi provinces are higher than those of the other provinces. Notably, Gansu province experiences the most significant yield change, potentially caused by the local climate of drought and water shortage. Consequently, the local crop yield in Gansu is highly susceptible to climate change.
The principal component analysis (PCA) method, a statistical technique used to examine the interrelations among a set of variables in order to identify the underlying structure of those variables, was applied to study the effects of some key factors. In this paper, we performed PCA by considering the meteorological factor variables related to the potential actual yield (Figure 8a) and the isolated climate trend yield (Figure 8b). The data used for analysis were the mean annual values of these factors during 2015–2100 under the current scenario. In Figure 8, Axis 1 and Axis 2 accounted for 78.8% and 71.7% of the variation for the potential actual yield and the isolated climate trend yield, respectively. As can be seen in Figure 8a, the distributions of the Pre_1 and Pre_2 are very close to the potential actual yield, and win and T_A, T_mean are the next closest. For the isolated climate trend yield (Figure 8b), T_A, T_mean, and Pre_1 make positive contributions.

4. Discussion

4.1. Effects of Climate Change on Agro-Climatic Resources Under Different Climate Scenarios

The global average surface temperature has risen at an average rate of 0.17 °F per decade since 1901 [37]. Warming temperatures, changing precipitation, and extreme weather events pose new challenges to global crop cultivation, distribution, and ecosystem functionality. In the Loess Plateau, changes in agricultural climate resources (annual mean temperature, precipitation, and solar radiation) due to global warming have inevitable impacts on agricultural production and planting, as illustrated in Figure 2. Notably, the distribution of NDVI is basically the same as that of the precipitation pattern from 1961 to 2015, indicating that precipitation is a major driver of vegetation coverage increase in this region. This finding is supported by the research of Gong et al. (2022), who suggested that annual mean temperature (TEMP) and annual solar radiation (SRAD) are relatively important and sensitive among several environmental variables [36]. Kirchmeier-Young et al. (2022) and Gampe et al. (2021) highlighted that global climate change is altering precipitation patterns, including the amount, intensity, and frequency of precipitation events, with these changes anticipated to intensify in the future [38,39]. While meteorological elements like precipitation and temperature have a profound impact on winter wheat planting area changes, their specific effects have not been comprehensively isolated and evaluated within the context of local climate change in the Loess Plateau.
This paper assesses the variation in key agricultural climate resources under three future climate change scenarios from 1961 to 2100 in the Loess Plateau, China. The results, as shown in Figure 4, exhibit slight discrepancies compared with those reported by Sun et al. (2018) [19]. Their study observed increasing trends in temperature, effective precipitation, and relative humidity in northern Shanxi under scenarios RCP2.6, RCP4.5, and RCP8.5, accompanied by a slight decline in wind speed and an uncertain trend in sunshine duration. In general, rising temperatures lead to an accelerating developmental rate and a shortened growing season [40,41,42,43]. However, our study shows that precipitation in the Loess Plateau exhibits a slight downward trend under both the S245 and S585 scenarios. In summary, future increases in crop productivity are highly contingent on the crop’s sensitivity to climate change [44]. Therefore, future policymakers should prioritize enhancing the monitoring of climate change impact [45], facilitate scientific planning and designing for agricultural development of nature reserves, and improve the ability of agricultural production to adapt to climate change.

4.2. Effects of Climate Change on Potential Yield of Winter Wheat Under Future Climate Scenarios

Within the context of climate change, the production of winter wheat continues to dominate the cropland in the rainfed Loess Plateau region in China [44]. Over the past few decades, the area planted with winter wheat in China has demonstrated an increasing trend (R2 > 0.86, RE < 5%), particularly from 2009 to 2013 [46]. The results of our study (Table 3) show that the winter wheat yield in the Qinghai Loess Plateau region is higher than that in the low-altitude Loess Plateau region under the rainfed condition with no adaptation measures. Climate change has led to increased weather variability and more frequent, severe climate-related hazards, such as droughts and crop yield reduction [26,47]. This highlights the importance of directing climate change research toward the Loess Plateau where agriculture is heavily climate-dependent [48,49].
Previous research has documented the adverse effects of climate change on crop yields [50,51,52]. In our study, we employed the APSIM model to simulate winter wheat potential yield across different climate scenarios over 1961–2100 (Figure 6). The results show a geographical decrease in rainfed potential yield from south to north. Similarly, Gong et al. (2022) reported that future climate change may slightly improve the stability of yield with regional variations [36]. This aligns with our results. Jiang et al., (2023) compared the predictions of different crop models in predicting winter wheat yield under future climate change scenarios [53]. They discovered that two models (Ceres-Wheat and Lintul4-NL) forecasted a decrease in yield (−12.9%~−8.9% and −32.5%~−10.6%), while other models, including APSIM, projected a yield increase ranging from 0% to 47.0%. This difference could be attributed to the diverse crop varieties (one is corn and the other is winter wheat) and the regional scope studied.

5. Conclusions

Understanding how climate change affects agricultural production is crucial for formulating sustainable agricultural development strategies. This study conducted a comprehensive assessment of the adaptation process and mechanism to climate change of winter wheat in the Loess Plateau and predicted the effects of climate change on winter wheat productivity under future climate scenarios. The key findings are:
(1)
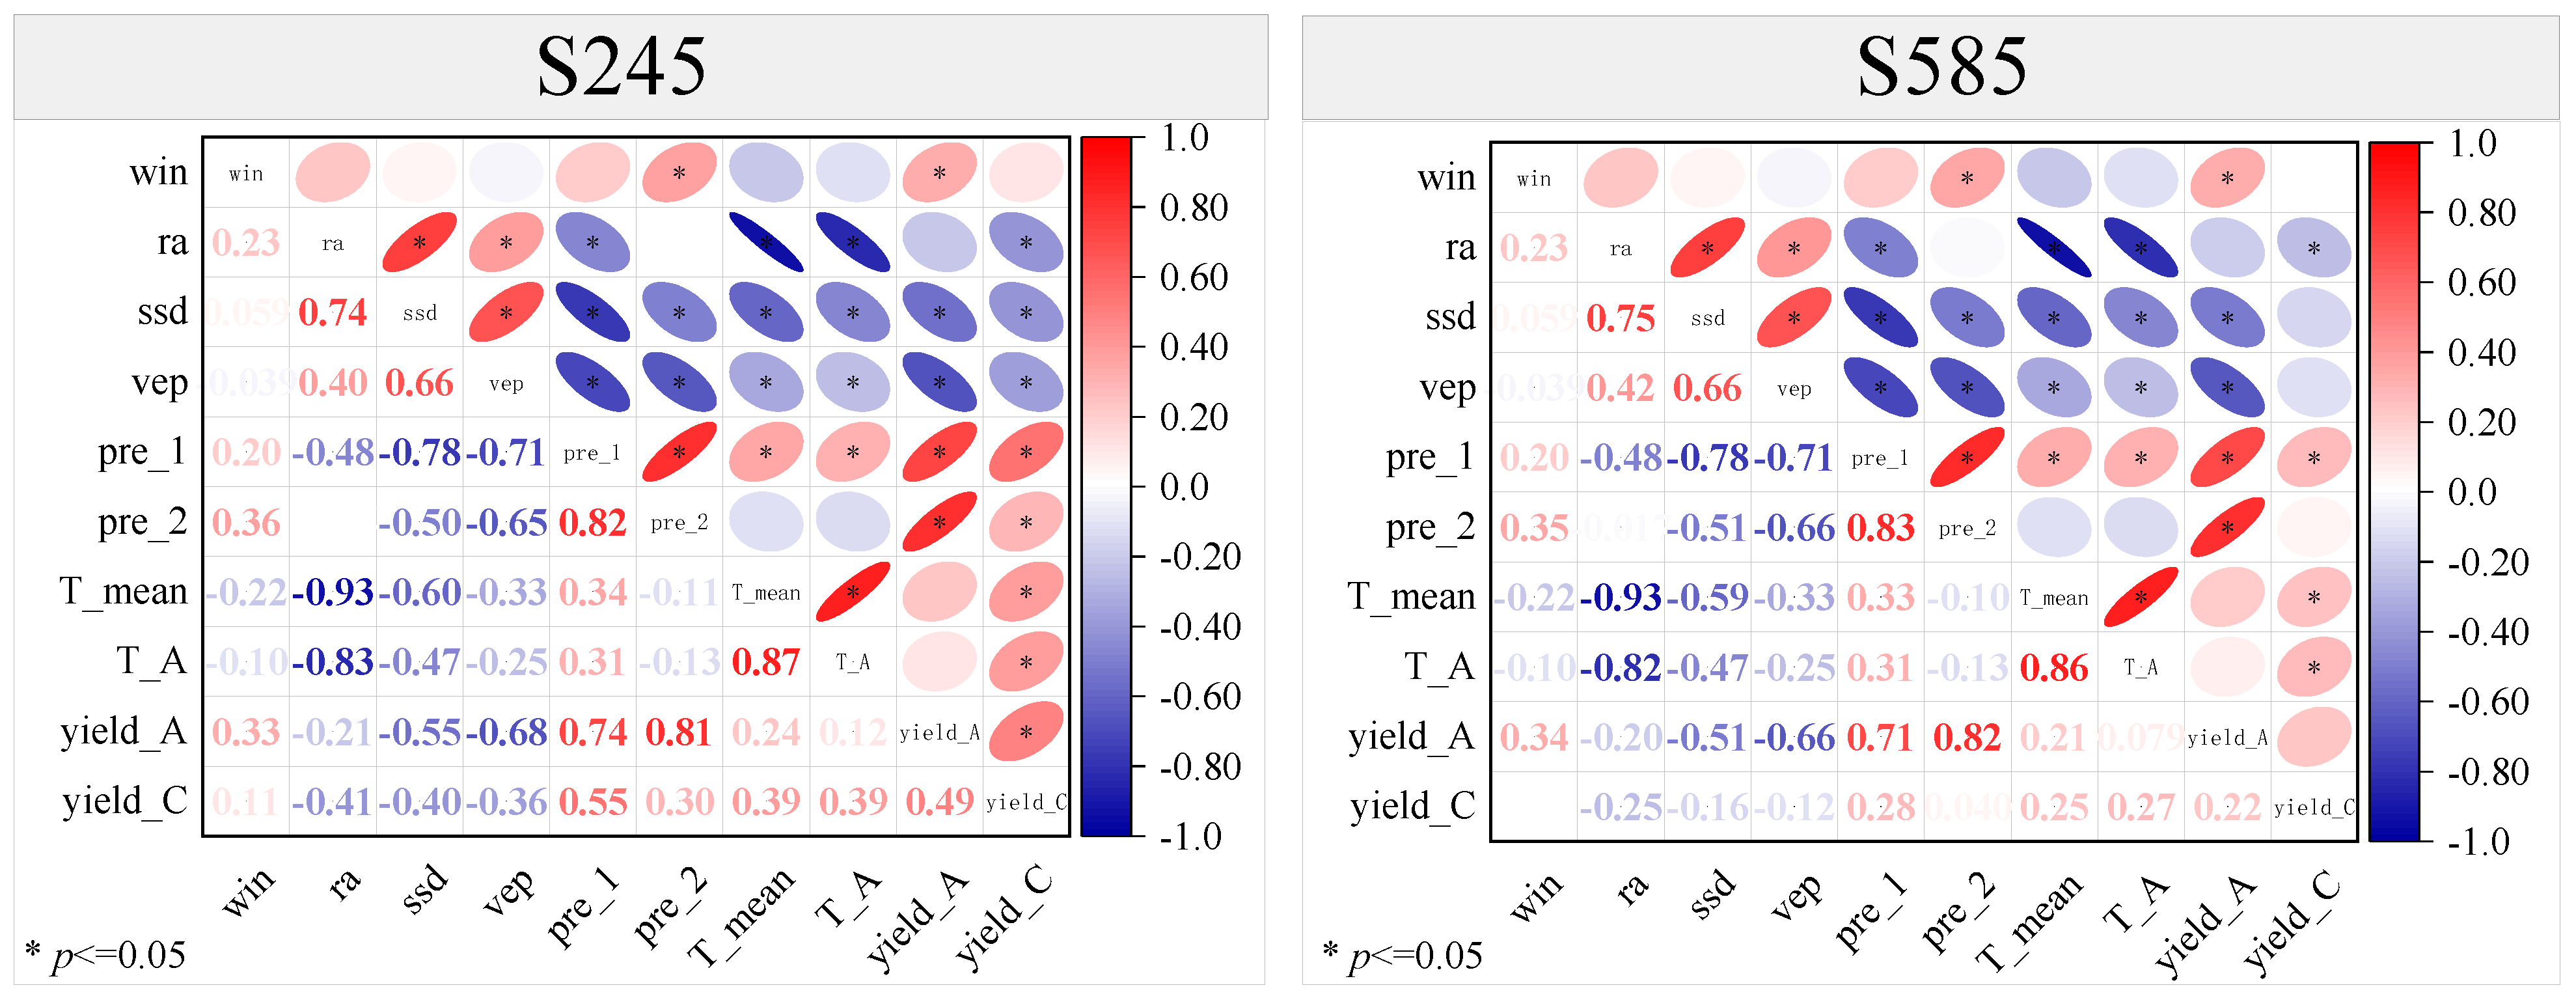
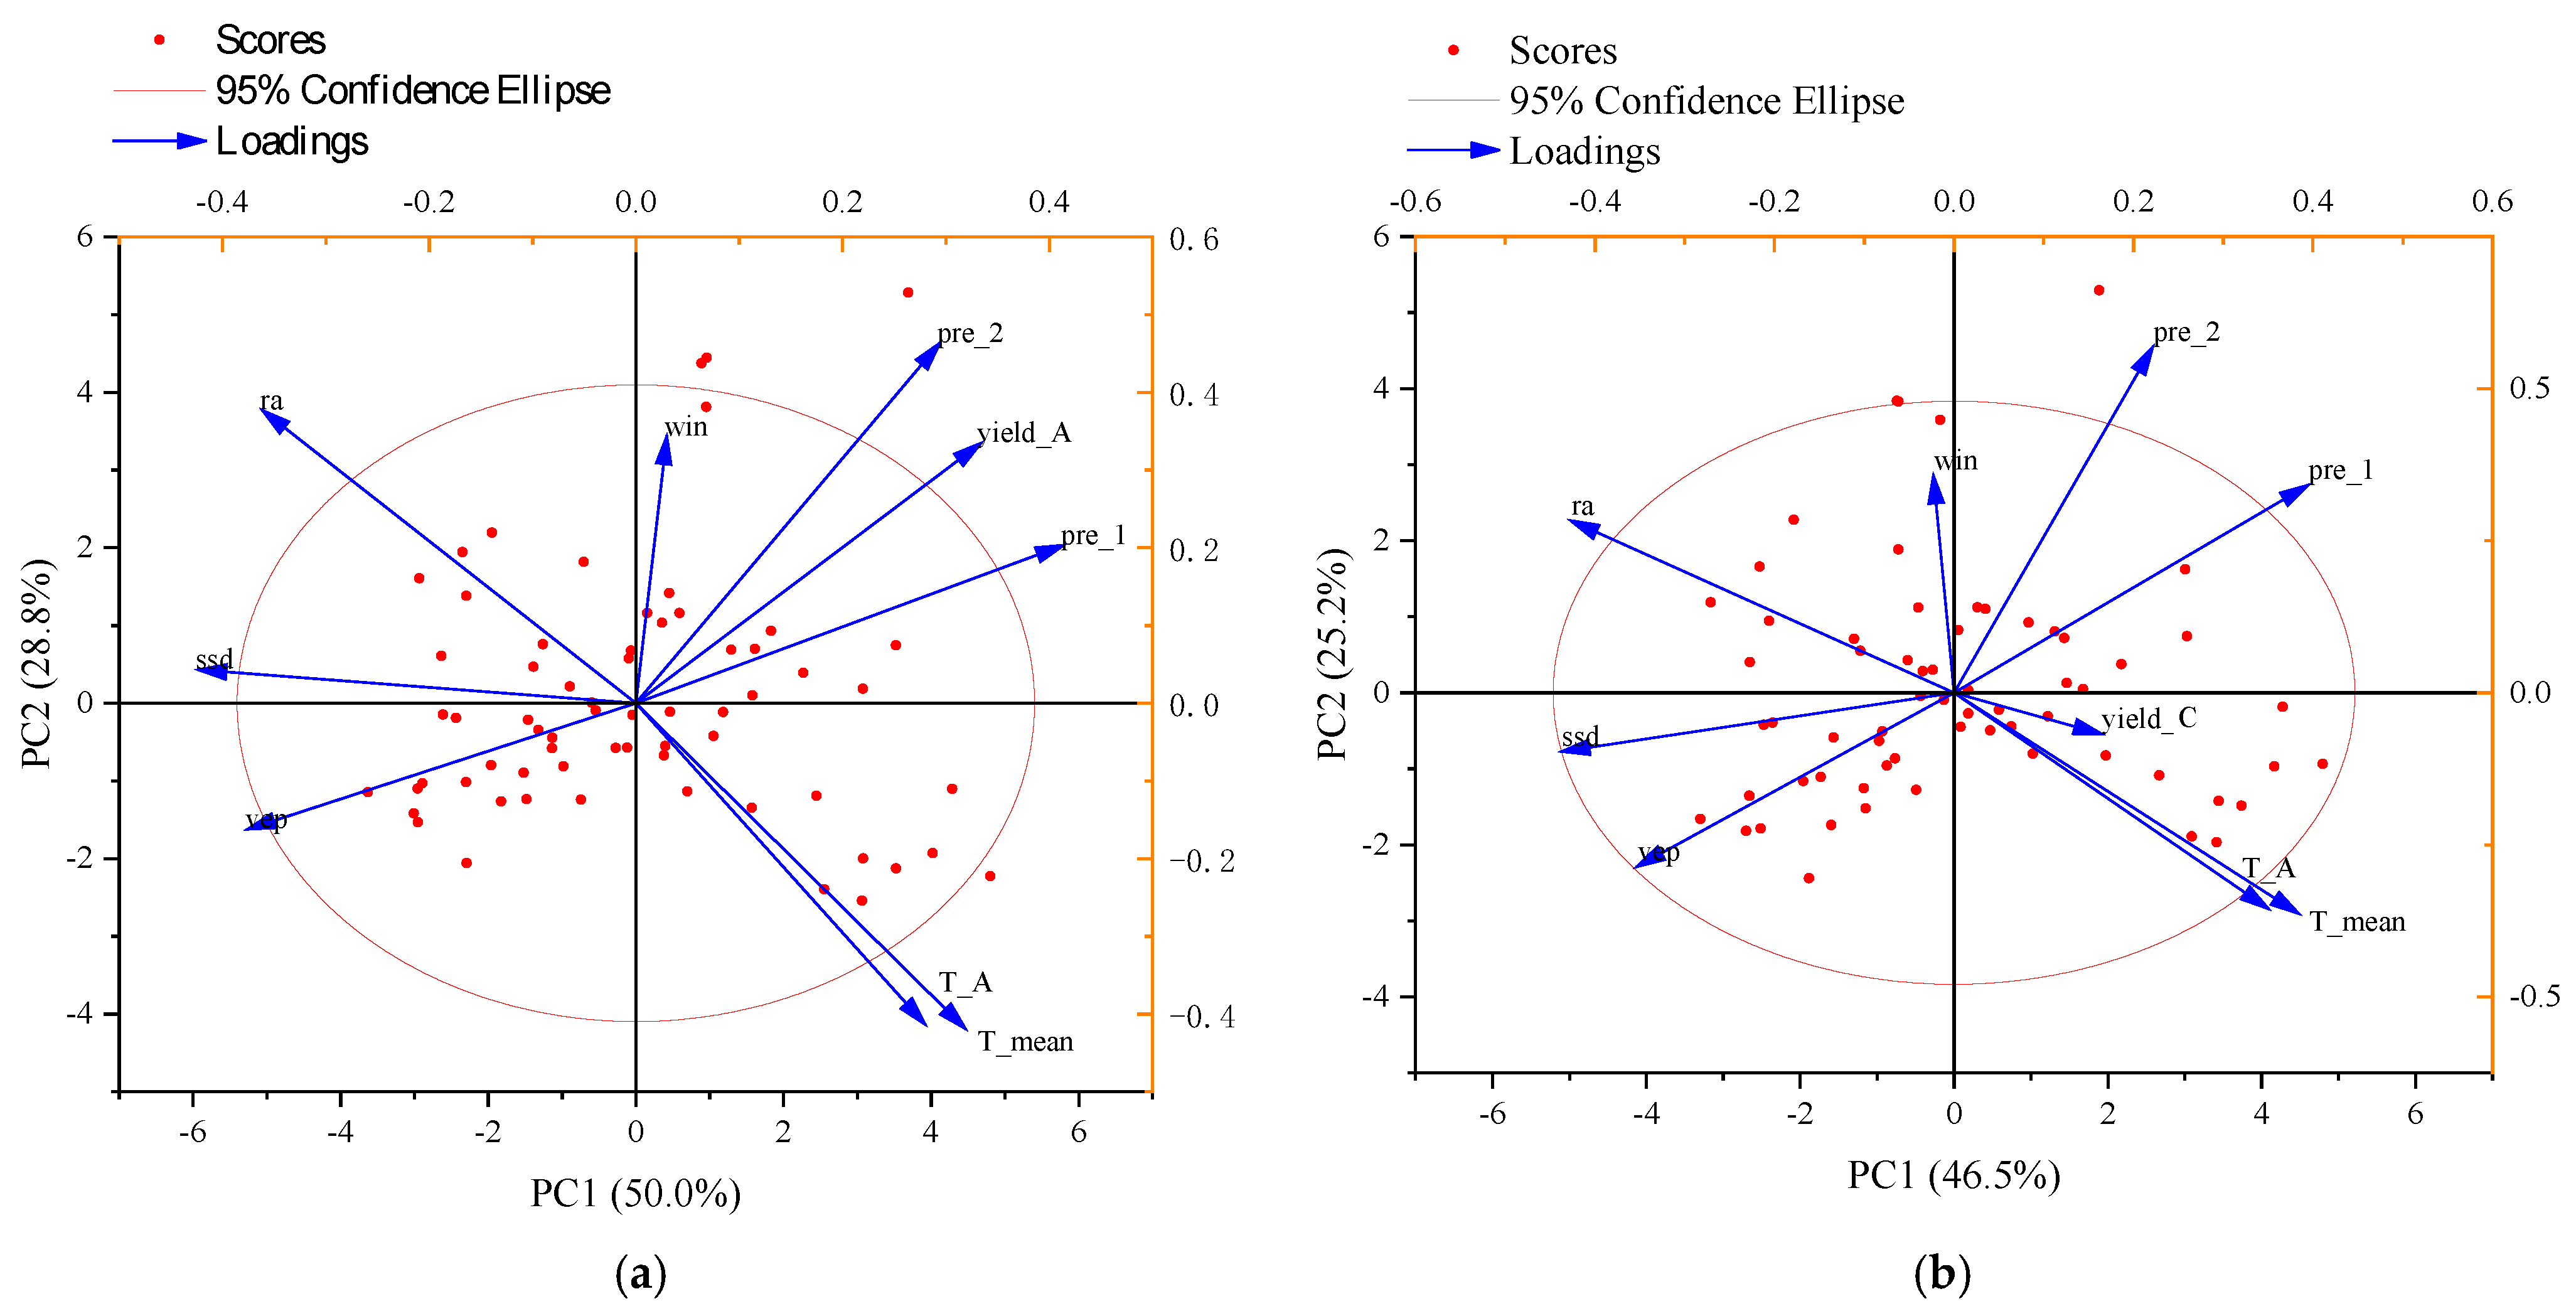
Agro-climatic resources in the Loess Plateau have undergone significant changes during 1961–2014 and 2015–2100, inevitably influencing the agricultural production and planting in the region. Correlation analysis showed that precipitation during the winter wheat growing period, as well as temperature, were positively correlated with both actual and climatic yield.
(2)
The average potential yields were compared under three climate scenarios, and the results indicate that S585 > S245 > current. The predicted potential yield fluctuates, with both the S245 and S585 scenarios being significantly larger than the current scenario.
(3)
Climate change has a profound impact on agricultural production, necessitating the consideration of more climate factors in future agricultural policy formulation. In conclusion, this study provides valuable insights for exploring effective agricultural management measures in the Loess Plateau under evolving climatic conditions.

Author Contributions

D.W. and S.L. conceived the study, led the research, and wrote the paper. M.G., J.L., S.W., Y.C., and S.L. carried out data analysis and created the figures. D.W., M.G., and L.S. contributed to writing and editing. S.W., Y.C., and J.G. also carried out data analysis and contributed to writing and editing. S.L., Q.D., Y.L., F.W., and T.J. contributed to the development of the study and writing and editing. All authors have read and agreed to the published version of the manuscript.

Funding

This work was supported by the Henan Province Key R&D and Promotion Special Project (Science and Technology Targeted) (232102111117, 232102321101), the National Natural Science Foundation of China (52179015), the National Key Research and Development Program of China (2022YFD1900402), and the Zhongyuan Science and Technology Innovation Leadership Project (194200510008).

Data Availability Statement

Data are contained within the article.

Acknowledgments

We appreciate the technical help from Guangguang Yang, Foshan University, and Shiren Li, Sun Yat-sen University. We thank the anonymous reviewers for their valuable reviews and comments on the manuscript.

Conflicts of Interest

The authors declare that they have no known competing financial interests or personal relationships that could have appeared to influence the work reported in this paper.

References

  1. Patrick, L.; Jäckel, G.; Tingem, R.M.; Kunstmann, H. Impact of climate change on agricultural productivity under rainfed conditions in Cameroon—A method to improve attainable crop yields by planting date adaptations. Agric. For. Meteorol. 2010, 150, 1258–1271. [Google Scholar] [CrossRef]
  2. Li, Z.; Yang, P.; Tang, H.; Wu, W.; Yin, H.; Liu, Z.; Zhang, L. Response of maizephenology to climate warming in Northeast China between 1990 and 2012. Reg. Environ. Change 2014, 14, 39–48. [Google Scholar] [CrossRef]
  3. Li, X.; Gong, J.D. Effects of different ridge: Furrow ratios and supplemental irrigation on crop production in ridge and furrow rainfall harvesting system with mulches. Agric. Water Manag. 2002, 54, 243–254. [Google Scholar] [CrossRef]
  4. Duan, J.J.; Wang, X.L.; Gao, Z.L. Dynamics and trends analysis of annual precipitation in the Loess Plateau for 50 years. J. Soil Water Conserv. 2009, 23, 143–146. [Google Scholar] [CrossRef]
  5. Zhang, Y.H.; Liang, K.; Liu, C.M. Time distribution pattern and spatial heterogeneity of hourly scale event-based extreme precipitation in China. J. Hydrol. 2023, 622 Pt A, 129712. [Google Scholar] [CrossRef]
  6. Zhang, W.X.; Kalli, F.; Wu, P.L.; Zhou, T.; Chadwick, R.; Marzin, C.; Rostron, J.; Sexton, D. Increasing precipitation variability on daily-to-multiyear timescales in a warmer world. Sci. Adv. 2021, 7, eabf8021. [Google Scholar] [CrossRef]
  7. Gu, C.J.; Mu, X.M.; Gao, P. Characteristics of temporal variation in precipitation and temperature in the Loess Plateau from 1961 to 2014. J. Arid Land Resour. Environ. 2017, 31, 136–143. [Google Scholar] [CrossRef]
  8. Guo, E.L.; Wang, Y.F.; Jirigala, B.; Jin, E. Spatiotemporal variations of precipitation concentration and their potential links to drought in mainland China. J. Clean. Prod. 2020, 267, 122004. [Google Scholar] [CrossRef]
  9. Lenka, N.K.; Lenka, S.; Yashona, D.S.; Jat, D. Elevated temperature and low nitrogen partially offset the yield, evapotranspiration, and water use efficiency of winter wheat under carbon dioxide enrichment. Agric. Water Manag. 2021, 250, 106856. [Google Scholar] [CrossRef]
  10. Bouroncle, C.; Müller, A.; Giraldo, D.; Rios, D.; Imbach, P.; Girón, E.; Portillo, F.; Boni, A.; van Etten, J.; Ramirez-Villegas, J. A systematic approach to assess climate information products applied to agriculture and food security in Guatemala and Colombia. Clim. Serv. 2019, 16, 100137. [Google Scholar] [CrossRef]
  11. Yang, X.; Li, Z.; Cui, S.; Cao, Q.; Deng, J.; Lai, X.; Shen, Y. Cropping system productivity and evapotranspiration in the semiarid Loess Plateau of China under future temperature and precipitation changes: An APSIM-based analysis of rotational vs. continuous systems. Agric. Water Manag. 2020, 229, 105959. [Google Scholar] [CrossRef]
  12. Gao, Z.Z.; Wang, C.; Zhao, J.C. Adopting different irrigation and nitrogen management based on precipitation year types balances winter wheat yields and greenhouse gas emissions. Field Crops Res. 2022, 280, 108484. [Google Scholar] [CrossRef]
  13. Qi, Z.; Feng, H.; Zhao, Y.; Zhang, T.; Zhang, Z. Spatial distribution and simulation of soil moisture and salinity undermulched drip irrigation combined with tillage in an arid salineirrigation district, northwest China. Agric. Water Manag. 2018, 201, 219–231. [Google Scholar] [CrossRef]
  14. Meisinger, J.J.; Palmer, R.E.; Timlin, D.J. Effects of tillage practices on drainage and nitrate leaching from winter wheat in the Northern Atlantic Coastal-Plain USA. Soil Tillage Res. 2015, 151, 18–27. [Google Scholar] [CrossRef]
  15. Ali, S.; Xu, Y.Y.; Jia, Q.M.; Ma, X.C.; Ahmad, I.; Adnan, M.; Gerard, R.; Ren, X.L.; Zhang, P.; Cai, T.; et al. Interactive effects of plastic film mulching with supplemental irrigation on winter wheat photosynthesis, chlorophyll fluorescence and yield under simulated precipitation conditions. Agric. Water Manag. 2018, 207, 1–14. [Google Scholar] [CrossRef]
  16. Zhang, L.L.; Feng, H.; Dong, Q.G.; Jin, N.; Zhang, T. Mapping irrigated and rainfed wheat areas using high spatial-temporal resolution data generated by MODIS and Landsat. J. Appl. Remote Sens. 2019, 12, 046023. [Google Scholar] [CrossRef]
  17. Lobell, D.B.; Burke, M.B.; Tebaldi, C.; Mastrandrea, M.D.; Falcon, W.P.; Naylor, R.L. Prioritizing climate change adaptation needs for food security in 2030. Science 2008, 319, 607–610. [Google Scholar] [CrossRef]
  18. Farrell, A.D.; Deryng, D.; Neufeldt, H. Modelling adaptation and transformative adaptation in cropping systems: Recent advances and future directions. Curr. Opin. Environ. Sustain. 2023, 61, 101265. [Google Scholar] [CrossRef]
  19. Sun, S.K.; Li, C.; Wu, P.T.; Zhao, X.N.; Wang, Y.B. Evaluation of agricultural water demand under future climate change scenarios in the Loess Plateau of Northern Shaanxi, China. Ecol. Indic. 2018, 84, 811–819. [Google Scholar] [CrossRef]
  20. Dettori, M.; Cesaraccio, C.; Duce, P. Simulation of climate change impacts on production and phenology of durum wheat in Mediterranean environments using CERES-Wheat model. Field Crops Res. 2017, 206, 43–53. [Google Scholar] [CrossRef]
  21. Wang, X.H.; Philippe, C.; Laurent, L.; Ruget, F.; Vuichard, N.; Viovy, N.; Zhou, F.; Chang, J.; Wu, X.; Zhao, H.; et al. Management outweighs climate change on affecting length of rice Growing period for early rice and single rice in China during 1991–2012. Agric. For. Meteorol. 2017, 233, 1–11. [Google Scholar] [CrossRef]
  22. Hou, Y.Y.; He, L.; Jin, N.; Zheng, C.L.; Liu, W.; Zhang, L. Establishment and application of crop growth simulating and monitoring system in China. Trans. Chin. Soc. Agric. Eng. (Trans. CSAE) 2018, 34, 165–175, (In Chinese with English abstract). [Google Scholar] [CrossRef]
  23. Mark, W.Y.; Ewen, M.; Geoffrey, R.S. Environmental risk assessment of blight-resistant potato: Use of a crop model to quantify nitrogen cycling at scales of the field and cropping system. Environ. Sci. Pollut. Res. 2017, 24, 21434–21444. [Google Scholar] [CrossRef]
  24. Blanc, É. Statistical emulators of maize, rice, soybean and wheat yields from global gridded crop models. Agric. For. Meteorol. 2017, 236, 145–161. [Google Scholar] [CrossRef]
  25. Yang, Q.; Zuo, H.; Xiao, X.; Wang, S.; Chen, B.; Chen, J. Modelling the effects of plastic mulch on water, heat and CO2 fluxes over cropland in an arid region. J. Hydrol. 2012, 452, 102–118. [Google Scholar] [CrossRef]
  26. Yao, Y.; Lu, Y.H.; Liu, S.N. Modelling the impact of climate change and tillage practices on soil CO2 emissions from dry farmland in the Loess Plateau of China. Ecol. Model. 2023, 478, 110276. [Google Scholar] [CrossRef]
  27. Malone, R.W.; Nolan, B.T.; Ma, L.; Kanwar, R.S.; Pederson, C.; Heilman, P. Effects of tillage and application rate on atrazine transport to subsurface drainage: Evaluation of RZWQM using a six-year field study. Agric. Water Manag. 2014, 132, 10–22. [Google Scholar] [CrossRef]
  28. Ma, L.W.; Lajpat, R. Mathematical modeling for system analysis in agricultural research: Karel, D. Vohnout, Elsevier Science, Amsterdam, The Netherlands, 2003, 452 pp. ISBN: 0-444-51268-3. Agric. Syst. 2004, 81, 273–274. [Google Scholar] [CrossRef]
  29. Chimonyo, V.G.P.; Modi, A.T.; Mabhaudhi, T. Simulating yield and water use of a sorghum–cowpea intercrop using APSIM. Agric. Water Manag. 2016, 177, 317–328. [Google Scholar] [CrossRef]
  30. Gaydon, D.S.; Singh, B.; Wang, E.; Poulton, P.L.; Ahmad, B.; Ahmed, F.; Akhter, S.; Ali, I.; Amarasingha, R.; Chaki, A.K.; et al. Evaluation of the APSIM model in cropping systems of Asia. Field Crops Res. 2017, 204, 52–75. [Google Scholar] [CrossRef]
  31. Zhou, Z.Q.; Ding, Y.B.; Fu, Q.; Wang, C.; Wang, Y.; Cai, H.J.; Liu, S.N.; Huang, S.Z.; Shi, H.Y. Insights from CMIP6 SSP scenarios for future characteristics of propagation from meteorological drought to hydrological drought in the Pearl River Basin. Sci. Total Environ. 2023, 899, 165618. [Google Scholar] [CrossRef] [PubMed]
  32. Hurtt, G.C.; Chini, L.; Sahajpal, R.; Frolking, S.; Bodirsky, B.L.; Calvin, K.; Doelman, J.C.; Fisk, J.; Fujimori, S.; Klein Goldewijk, K.; et al. Harmonization of global land use change and management for the period 850–2100 (LUH2) for CMIP6. Geosci. Model Dev. 2020, 13, 5425–5464. [Google Scholar] [CrossRef]
  33. Popping, A.; Calvin, K.; Fujimori, S.; Havlik, P.; Humpenöder, F.; Stehfest, E.; Bodirsky, B.L.; Dietrich, J.P.; Doelmann, J.C.; Gusti, M.; et al. Land-use futures in the shared socio-economic pathways. Glob. Environ. Change 2017, 42, 331–345. [Google Scholar] [CrossRef]
  34. Wang, J.; Ghimire, R.; Fu, X.; Sainju, U.M.; Liu, W. Straw mulching increases precipitation storage rather than water use efficiency and dryland winter wheat yield, Contents lists available at Science Direct. Agric. Water Manag. 2018, 106, 95–101. [Google Scholar] [CrossRef]
  35. Wang, Y.X.; Xu, Y.R.; Guo, Q.; Zhang, P.; Cai, T.; Jia, Z.K. Advantages of deep fertilizer placement in environmental footprints and net ecosystem economic benefits under the variation of precipitation year types from winter wheat fields. Field Crops Res. 2023, 303, 109142. [Google Scholar] [CrossRef]
  36. Gong, X.W.; Li, Y.Q.; Wang, X.Y.; Zhang, Z.S.; Lian, J.; Ma, L.; Chen, Y.; Li, M.Y.; Si, H.T.; Cao, W.J. Quantitative assessment of the contributions of climate change and human activities on vegetation degradation and restoration in typical ecologically fragile areas of China. Ecol. Indic. 2022, 144, 109536. [Google Scholar] [CrossRef]
  37. Malakouti, S.M. Utilizing time series data from 1961 to 2019 recorded around the world and machine learning to create a Global Temperature Change Prediction Model. Case Stud. Chem. Environ. Eng. 2023, 7, 100312. [Google Scholar] [CrossRef]
  38. Kirchmeier-Young, M.C.; Wan, H.; Zhang, X.B. Using a model comparison to support the interpretation of extreme event attribution. Weather Clim. Extrem. 2022, 36, 100444. [Google Scholar] [CrossRef]
  39. Gampe, D.; Zscheischler, J.; Reichstein, M.; O’Sullivan, M.; Smith, W.K.; Sitch, S.; Buermann, W. Increasing impact of warm droughts on northern ecosystem productivity over recent decades. Nat. Clim. Change 2021, 11, 772–779. [Google Scholar] [CrossRef]
  40. Liu, Y.; Li, S.; Chen, F.; Yang, S.; Chen, X. Soil water dynamics and water use efficiency in spring maize (Zea mays L.) fields subjected to different water management practices on the Loess Plateau, China. Agric. Water Manag. 2010, 97, 769–775. [Google Scholar] [CrossRef]
  41. Tao, F.; Zhang, S.; Zhang, Z. Spatiotemporal changes of wheat phenology in China under the effects of temperature, day length and cultivar thermal characteristics. Eur. J. Agron. 2012, 43, 201–212. [Google Scholar] [CrossRef]
  42. Zhang, T.; Huang, Y.; Yang, X. Climate warming over the past three decadeshas shortened rice growth duration in China and cultivar shifts have furtheraccelerated the process for late rice. Glob. Change Biol. 2013, 19, 563–570. [Google Scholar] [CrossRef]
  43. Oteros, J.; García-Mozo, H.; Botey, R.; Mestre, A.; Galán, C. Variations in cereal crop phenology in Spain over the last twenty-six years (1986–2012). Clim. Change 2015, 130, 545–558. [Google Scholar] [CrossRef]
  44. Mo, F.; Sun, M.; Liu, X.Y.; Wang, J.Y.; Zhang, X.C.; Ma, B.L.; Xiong, Y.C. Phenological responses of spring wheat and maize to changes in crop management and rising temperatures from 1992 to 2013 across the loess plateau. Field Crops Res. 2016, 196, 337–347. [Google Scholar] [CrossRef]
  45. Zhang, Y.G.; Liu, F.; Wang, X.L.; Zhou, J.H.; Liu, M.C.; Zhang, J.T.; Wang, W.T.; Li, D.Q. The impact investigation and adaptation strategy analysis of climate change on nature reserve in China. Acta Ecol. Sin. 2014, 34, 106–109. [Google Scholar] [CrossRef]
  46. Ren, S.; Guo, B.; Wu, X.; Zhang, L.; Wang, J. Winter wheat planted area monitoring and yield modeling using MODIS data in the Huang-Huai-Hai Plain, China. Comput. Electron. Agric. 2021, 182, 106049. [Google Scholar] [CrossRef]
  47. Hallegatte, S.; Vogt-Schilb, A.; Rozenberg, J.; Bangalore, M.; Beaudet, C. From poverty to disaster and back: A review of the literature. Econ. Disasters Clim. Change 2020, 4, 223–247. [Google Scholar] [CrossRef]
  48. Opoku Mensah, S.; Akanpabadai, T.A.B.; Diko, S.K.; Okyere, S.A.; Benamba, C.; Chandrakanth, M.G.; Rajasekhar, D.; Inbanathan, A.; Madheswaran, S. Prioritization of climate change adaptation strategies by smallholder farmers in semi-arid savannah agro-ecological zones: Insights from the Talensi District, Ghana. J. Soc. Econ. Dev. 2022, 25, 232–258. [Google Scholar] [CrossRef]
  49. Kogo, B.K.; Kumar, L.; Koech, R. Climate change and variability in Kenya: A review of impacts on agriculture and food security. Environ. Dev. Sustain. 2021, 23, 23–43. [Google Scholar] [CrossRef]
  50. Gourdji, S.; Läderach, P.; Valle, A.M.; Martinez, C.Z.; Lobell, D.B. Historical climate trends, deforestation, and maize and bean yields in Nicaragua. Agric. For. Meteorol. 2015, 200, 270–281. [Google Scholar] [CrossRef]
  51. Lobell, D.B.; Schlenker, W.; Costa-Roberts, J. Climate trends and globalcrop production since 1980. Science 2011, 333, 616–620. [Google Scholar] [CrossRef] [PubMed]
  52. Rowhani, P.; Lobell, D.B.; Linderman, M.; Ramankutty, N. Climate variability and crop production in Tanzania. Agric. For. Meteorol. 2011, 151, 449–460. [Google Scholar] [CrossRef]
  53. Jiang, T.C.; Wang, B.; Duan, X.N.; Liu, D.L.; He, J.Q.; He, L.; Jin, N.; Feng, H.; Yu, Q. Prioritizing agronomic practices and uncertainty assessment under climate change for winter wheat in the loess plateau, China. Agric. Syst. 2023, 212, 103770. [Google Scholar] [CrossRef]
Figure 1. Location of the study area and the monitoring sites (a) and curves of the annual precipitation and yield in the study area from 1961 to 2015 (b).
Agronomy 14 02609 g001
Figure 2. Distribution of the annual precipitation during wheat growth period (a), accumulated temperature (b), evaporation (c), radiation (d), sunshine hours (e), and normalized difference vegetation Index (NDVI, (f)) in the study area from 1961 to 2015.
Agronomy 14 02609 g002
Figure 3. Correlation analysis of the main meteorological factors (win for wind, ra for solar radiation, ssd for sunshine durations, vep for evaporation, Pre_1 for annual precipitation, Pre_2 for precipitation during winter wheat growth periods, T_mean for mean temperature, T_A for accumulated temperature, Yield_A for the actual harvest yield of winter wheat, and Yield_C for the isolated climate trend yield) and the historical statistical yield of winter wheat in 1961–2015.
Agronomy 14 02609 g003
Figure 4. The simulated change trend of three kinds of agro-climatic resources: precipitation, radiation, and average temperature during winter wheat growing period under two climate scenarios (ns, not significant; ***, significant at p < 0.001).
Agronomy 14 02609 g004
Figure 5. Comparison of simulated and observed values of winter wheat yield in 2013~2019.
Agronomy 14 02609 g005
Figure 6. Average potential yield prediction and coefficient of variation (CV) of winter wheat under rainfed conditions in 2015–2100.
Agronomy 14 02609 g006
Figure 7. Yield difference under rainfed conditions and the coefficient of variation from 2016 to 2100 compared with 1961–2015.
Agronomy 14 02609 g007
Figure 8. Principal component analysis (PCA) of meteorological factor variables with the potential actual yield (a) and the isolated climate trend yield (b), respectively, under the current scenario.
Agronomy 14 02609 g008
Table 1. Parameters and corresponding data of representative cultivars of winter wheat in the study area.
CultivarsPlanting AreaParameterValue
Xifeng 24Gansu;
Qinghai;
Ningxia
vern_sens
photop_sens
potential_grain_filling_rate
tt_start_grain_fill
tt_end_grain_fill
tt_startgf_to_mat
2
2.0
0.0025
617.5
32.5
650
Changwu 89134Gansu;
Qinghai
vern_sens
photop_sens
potential_grain_filling_rate
tt_start_grain_fill
tt_end_grain_fill
tt_flowering
2
3.0
0.0025
545
35
120
1.9
Xiaoyan 22Shannxi;
Henan
vern_sens
photop_sens
potential_grain_filling_rate
grain_per_gram_stem
max_ grain_size
1.9
3.0
0.0035
26
0.042
Jinmai 47Shanxi;
Inner Mongolia
vern_sens
photop_sens
tt_floral_initiation
tt_end_of_juvenile
tt_end_grain_fill
tt_flowering
4.0
2.8
414.5
426.6
570.8
92.8
Table 2. Modeling trends of agricultural climate resources during the winter wheat growing period under two climate scenarios.
SSP-RCPAgePrecipitation
(mm)
STDEVTotal Solar Radiation
(102 MJ)/(m2·d)
STDEVMean Temperature
(°C)
STDEV
SSP2-4.52030s202.1416.8337.190.396.730.21
2050s189.7515.1036.700.377.080.19
2080s186.2115.6636.360.417.330.18
SSP5-8.52030s197.8522.2936.720.556.850.21
2050s186.8126.7334.830.787.570.27
2080s174.7721.1733.120.738.350.29
Note: SSP and RCP refer to Shared Socioeconomic Pathway and Representative Concentration Pathway, respectively.
Table 3. Average values and coefficient of variation (cv) of the potential yield under rainfed(yield-rainfed) and under adequate hydrothermal conditions (yield-irrigated) in seven provinces (56 monitoring sites) of Loess Plateau in 1961–2100.
Province
(Numbers of Sites)
SSPYield-Rainfed
Average YieldYield-cvYield Differencecv Difference
Inner Mongolia
(7)
Current2813.140.21250.540.05
S2453452.010.20413.960.02
S5853516.580.21390.230.02
Ningxia
(9)
Current3339.340.17695.910.01
S2454381.350.18986.170.03
S5854441.200.20952.330.03
Shaanxi
(11)
Current4087.190.141456.480.03
S2455153.720.141335.190.05
S5855062.220.141270.130.05
Shanxi
(12)
Current3275.600.16568.160.04
S2454382.860.17764.250.03
S5854382.450.17688.770.03
Qinghai
(5)
Current4230.670.16529.250.02
S2454878.510.14460.990.01
S5854984.500.14451.660.00
Gansu
(11)
Current4033.720.141517.550.03
S2454908.870.141717.080.02
S5854929.570.151595.060.03
Henan
(1)
Current4672.990.10554.570.03
S2455331.260.091005.510.00
S5855428.960.11755.970.01
Disclaimer/Publisher’s Note: The statements, opinions and data contained in all publications are solely those of the individual author(s) and contributor(s) and not of MDPI and/or the editor(s). MDPI and/or the editor(s) disclaim responsibility for any injury to people or property resulting from any ideas, methods, instructions or products referred to in the content.

