Article

Harvesting Light: The Interrelation of Spectrum, Plant Density, Secondary Metabolites, and Cannabis sativa L. Yield

1
Agronomy, Institute of Crop Science, University of Hohenheim, 70599 Stuttgart, Germany
2
Biostatistics, Institute of Crop Science, University of Hohenheim, 70599 Stuttgart, Germany
*
Author to whom correspondence should be addressed.
Agronomy 2024, 14(11), 2565; https://doi.org/10.3390/agronomy14112565
Submission received: 26 September 2024 / Revised: 23 October 2024 / Accepted: 28 October 2024 / Published: 1 November 2024

Abstract

:
The approaching legalisation and associated increasing demand for medicinal and recreational Cannabis sativa L. will lead to a growing relevance for lighting systems designed for Cannabis sativa L. The interplay between plant density, light spectrum, light distribution, yield, and secondary metabolite distribution within the plant has not yet been studied. To fill this knowledge gap, a CBD-dominant Cannabis sativa L. strain was grown in a greenhouse experiment with two plant densities (2.66 and 12 plants −1 m−2) under two different light spectra. The chosen light spectra were two LED fixtures, Solray385 (SOL) and AP67, with an R: FR ratio of 12.9 and 3.7, respectively. The results indicated that light-induced effects on individual plants can be transferred to the plant stock. A low R: FR ratio induced a 16% increase in dry flower yield in the last ten days of flowering, while a change in the light spectrum could increase the potential maximum plant density per square metre. The two spectra did not affect (CBD + CBDA) yield, as a lower flower yield compensated for a higher concentration. CBDA concentration was not significantly affected by plant density. In contrast, the higher density led to an increased total cannabidiol concentration (CBD + CBDA) and altered the distribution of terpenes. Here, the light distribution over the plant stock is particularly decisive, as a more homogenous illumination led to an increased terpene concentration of up to 41%. A Photon Conversion Efficacy (PCE) of 0.05 g mol−1 under SOL and 0.06 g mol−1 under AP67 was achieved. Plants in the centre under the highest light intensity of 1200 PAR showed up to 48% reduced efficacy. These results strongly suggest that light intensity needs to be fine-tuned to the cultivation system to prevent a reduction in efficacy, resulting in yield and quality losses.

1. Introduction

Lighting is a central element in the cultivation system of Cannabis sativa L. (abr. C. sativa) and influences both yield and secondary metabolism [1,2,3,4]. Established lighting technologies in the C. sativa industry include ceramic metal halide lamps (CHD), high-pressure sodium (HPS) and light-emitting diodes (LED). Currently, a shift towards LED is occurring due to their reduced energy consumption, prolonged operating times, and more homogeneous illumination of the plant stock [5]. Due to the changing regulatory regime in Europe towards legalisation and the associated increase in cultivation, it can be expected that lighting systems developed specifically for the medicinal and recreational C. sativa industry will gain importance. Therefore, the influence of light spectra on secondary metabolism and yield is an area of particular research interest, which is also reflected in a significant increase in publications in recent years [2].
Secondary metabolites of C. sativa accumulate mainly in the trichomes of the female flowers and the leaves surrounding the inflorescences [6]. The formation of these compounds is preceded by a cascade of metabolic processes that can be divided into three different pathways: (i) Polyketide synthase (PKS) for cannabinoids, (ii) Mevalonic acid (MVA) for sesquiterpenes, and (iii) Plastidial methylerythritol pathway (MEP) for monoterpenes. MEP synthesises geranyl diphosphate (GPP) from dimethylallyl diphosphate (DMPP), and GPP, together with olivetolic acid (OLA), forms cannabigerolic acid (CBGA), the precursor of all cannabinoids [7].
The terpene synthesis (TPS), which is responsible for C. sativa aroma [8,9] is influenced by external factors, such as light [10], temperature [11], nutrition [12], and abiotic and biotic stresses [13]. Furthermore, the terpene profile is altered with the onset of ripening [14]. The TPS is more energy-demanding than the biosynthesis of most other carbon-based secondary metabolites [15]. Considering the high production of secondary metabolites in C. sativa—particularly the metabolic cost of TPS—light spectra and intensity are key factors to ensure a high photosynthetic rate throughout the growth to satisfy the primary and secondary metabolism demand.
The amount and concentration of individual cannabinoids and terpenes is determined mainly by the pedigree of a C. sativa strain [16]. An important characteristic is the CBD-to-THC concentration ratio used for chemotype classification [17,18,19]. Besides the pedigree, the cultivation system can have an additional significant influence on cannabinoid and terpene concentration. This has been demonstrated for various cultivation factors such as fertilisation [12,20,21], pruning techniques [22], harvest time [23], and light spectra [3,24]. In general, C. sativa is cultivated in plant stocks of varying density (2–16 plants per m2), which may result in shading of lower inflorescences by the canopy at higher plant densities [25] and, consequently, heterogeneous concentrations of secondary metabolites over the whole plant [26]. In addition, the lighting source and its light emission pattern can create zones of high and low light intensity [27]. Increased plant density in C. sativa cultivation is associated with increased yield per square metre (m2); however, it also leads to a more variable distribution of cannabinoids [28]. This within-plant heterogeneity of cannabinoid concentrations at higher plant densities may be due to uneven light distribution within the plant stock, which is influenced by factors such as plant morphology, density, and lighting source. For terpenes, the effect of plant density on their distribution remains in its infancy in C. sativa research.
Light distribution within the plant stock affects photosynthetic rates, and the differences in the dynamics of carbon and light limitation can modify the concentration of secondary metabolites in different parts of the plant [29]. Therefore, one aim of cultivation is to achieve a closed canopy with a maximum proportion of fully illuminated leaf area to increase homogeneity in light intensity within the plant stock and efficiently utilise the emitted light. Plant morphology is, therefore, critical to any cultivation system, as the strain habitus determines the plant density, maximising yield and the homogeneity in light distribution within the plant stock. Therefore, to achieve a uniform plant stock, i.e., uniformity of single plants in growth rate, size and morphology, the cultivation process may require time-consuming management procedures, such as pruning. For instance, rapidly growing strains with long branches may require more frequent pruning to achieve a uniform plant stock. Conversely, compact strains may require less pruning.
Besides light intensity and its distribution within the plant stock, the light spectrum can also influence plant morphology, which, in turn, might alter the optimal plant density. The spectral effect on plant morphology is mediated through activating various photoreceptors by specific wavelengths [30]. Each photoreceptor has a specific response spectrum that includes the following wavelengths: far-red light (710–850 nm), red light (620–700 nm), green light (480–560 nm), blue light (410–500 nm), UV-A (320–370 nm), and UV-B radiation (290–320 nm). In addition, each wavelength has a different ability to stimulate photosynthesis, with blue and red light being the most effective due to the absorption spectra of chlorophyll a and b in these specific wavelengths. [31,32,33]. Considering the spectral composition in publications of C. sativa, it is noticeable that mainly full-spectrum lights were applied [34,35,36], which triggered multiple photoreceptors. In recent studies, monochromatic lights have increasingly facilitated a better interpretation [24,37,38]. The spectra of the two LED light sources used in this study differ mainly in the R: FR ratio and their proportion of green light.
For the perception of red (R) and far-red (FR) light, phytochromes regulate photomorphogenesis through the interconversion of two forms: the inactive Pr, which absorbs red light, and the active Pfr, which absorbs far-red light [39,40,41]. The R:FR ratio affects this balance, influencing shade avoidance and flowering processes. In cannabis cultivation, the phytochromes apoproteins PHYA, PHYB, and PHYC are of importance [42]. These apoproteins play a key role in shade avoidance, flowering and xylem development [25,42]. These processes are modulated by phytochrome interacting factors (PIFs) [43], which can also affect terpene synthesis [44]. Therefore, the R: FR ratio is a vital light signal for plant development and can significantly affect plant morphology in C. sativa [27,34]. A low R: FR ratio can increase stem elongation and leaf expansion, resulting in higher biomass due to increased light interception [34]. However, an increase in inflorescence biomass can reduce secondary metabolites due to dilution effects [45,46]. Based on decreasing concentrations with decreasing yield, C. sativa also showed this dilution effect [10,12,26].
The green light perception in plants is mediated by the photoreceptor cryptochromes (Cry) and phytochrome, which play a role in stomatal opening and circadian regulation [47], mainly when blue light is limited [48]. Additional green light potentially reverses the effects of blue and red light as a signalling mechanism due to overlapping action spectra with Cry and phototropin [49,50,51,52]. In contrast to R and FR light, the influence of green light on secondary metabolism is often associated with contradictory results for C. sativa [34,53]. A possible explanation might be that green light strongly drives photosynthesis under exposure to high light intensities above 1000 μmol m−2 s−1 of photosynthetic photon flux density (PPFD) [54,55,56]. PPFD is a measure for the amount of photons within the Photosynthetically Active Radiation (PAR) range from 400 to 700 nm, covering the visible spectrum with blue, green and red light. The effect of light spectra especially green light, seems dependent on PPFD. Especially at low PPFD, C. sativa grown under a high proportion of green light can display a lower yield level [27] and reduced photosynthesis rates [26]. Green light could be particularly relevant for C. sativa cultivation in high densities, as green light can penetrate deeper into the canopy due to its lower absorbance [57] and enhance growth, yield and secondary metabolites [58,59], especially under high light intensities [56,60]. The potential positive effect of green light on secondary metabolites has already been demonstrated in C. sativa and in other crops. Green light in C. sativa enhances the accumulation of carotenoids (Car) due to its absorbance range extending into the green region (400–500 nm, peaking at around 470 nm) [48] and increases the chlorophyll a/b ratio [61]. This is in line with Lactuca sativa, as a higher carotenoid content was found as well when green light was added [62]. A higher level of carotenoids is important as they act as a protection system for reactive photoproducts due to excessive light intensity [63]. Particularly as C. sativa is grown under high light intensities, protection of PSII by carotenoids may be important to facilitate consistently high photosynthetic rates. Additionally, green light can increase bioactive phytochemicals in microgreens [64].
Thus, this study aimed to investigate the effect of two LED light sources differing in their proportion of green light and R: FR ratio on morphology, growth dynamics, inflorescence yield, CBD and especially terpene concentration of C. sativa grown in different plant densities. The driving hypotheses were as follows: (I) a low R: FR ratio increases plant height, leaf area and dry flower yield, resulting in higher biomass production; (II) a higher proportion of green light increases CBD and terpene concentration; (III) a higher plant density decreases the individual yield per plant; (IV) within a plant stock, increased yields and secondary metabolite concentrations reflect the area with the highest light intensity; and (V) the positive effects of green light on secondary metabolites are more pronounced at high plant densities and shaded flower positions.

2. Materials and Methods

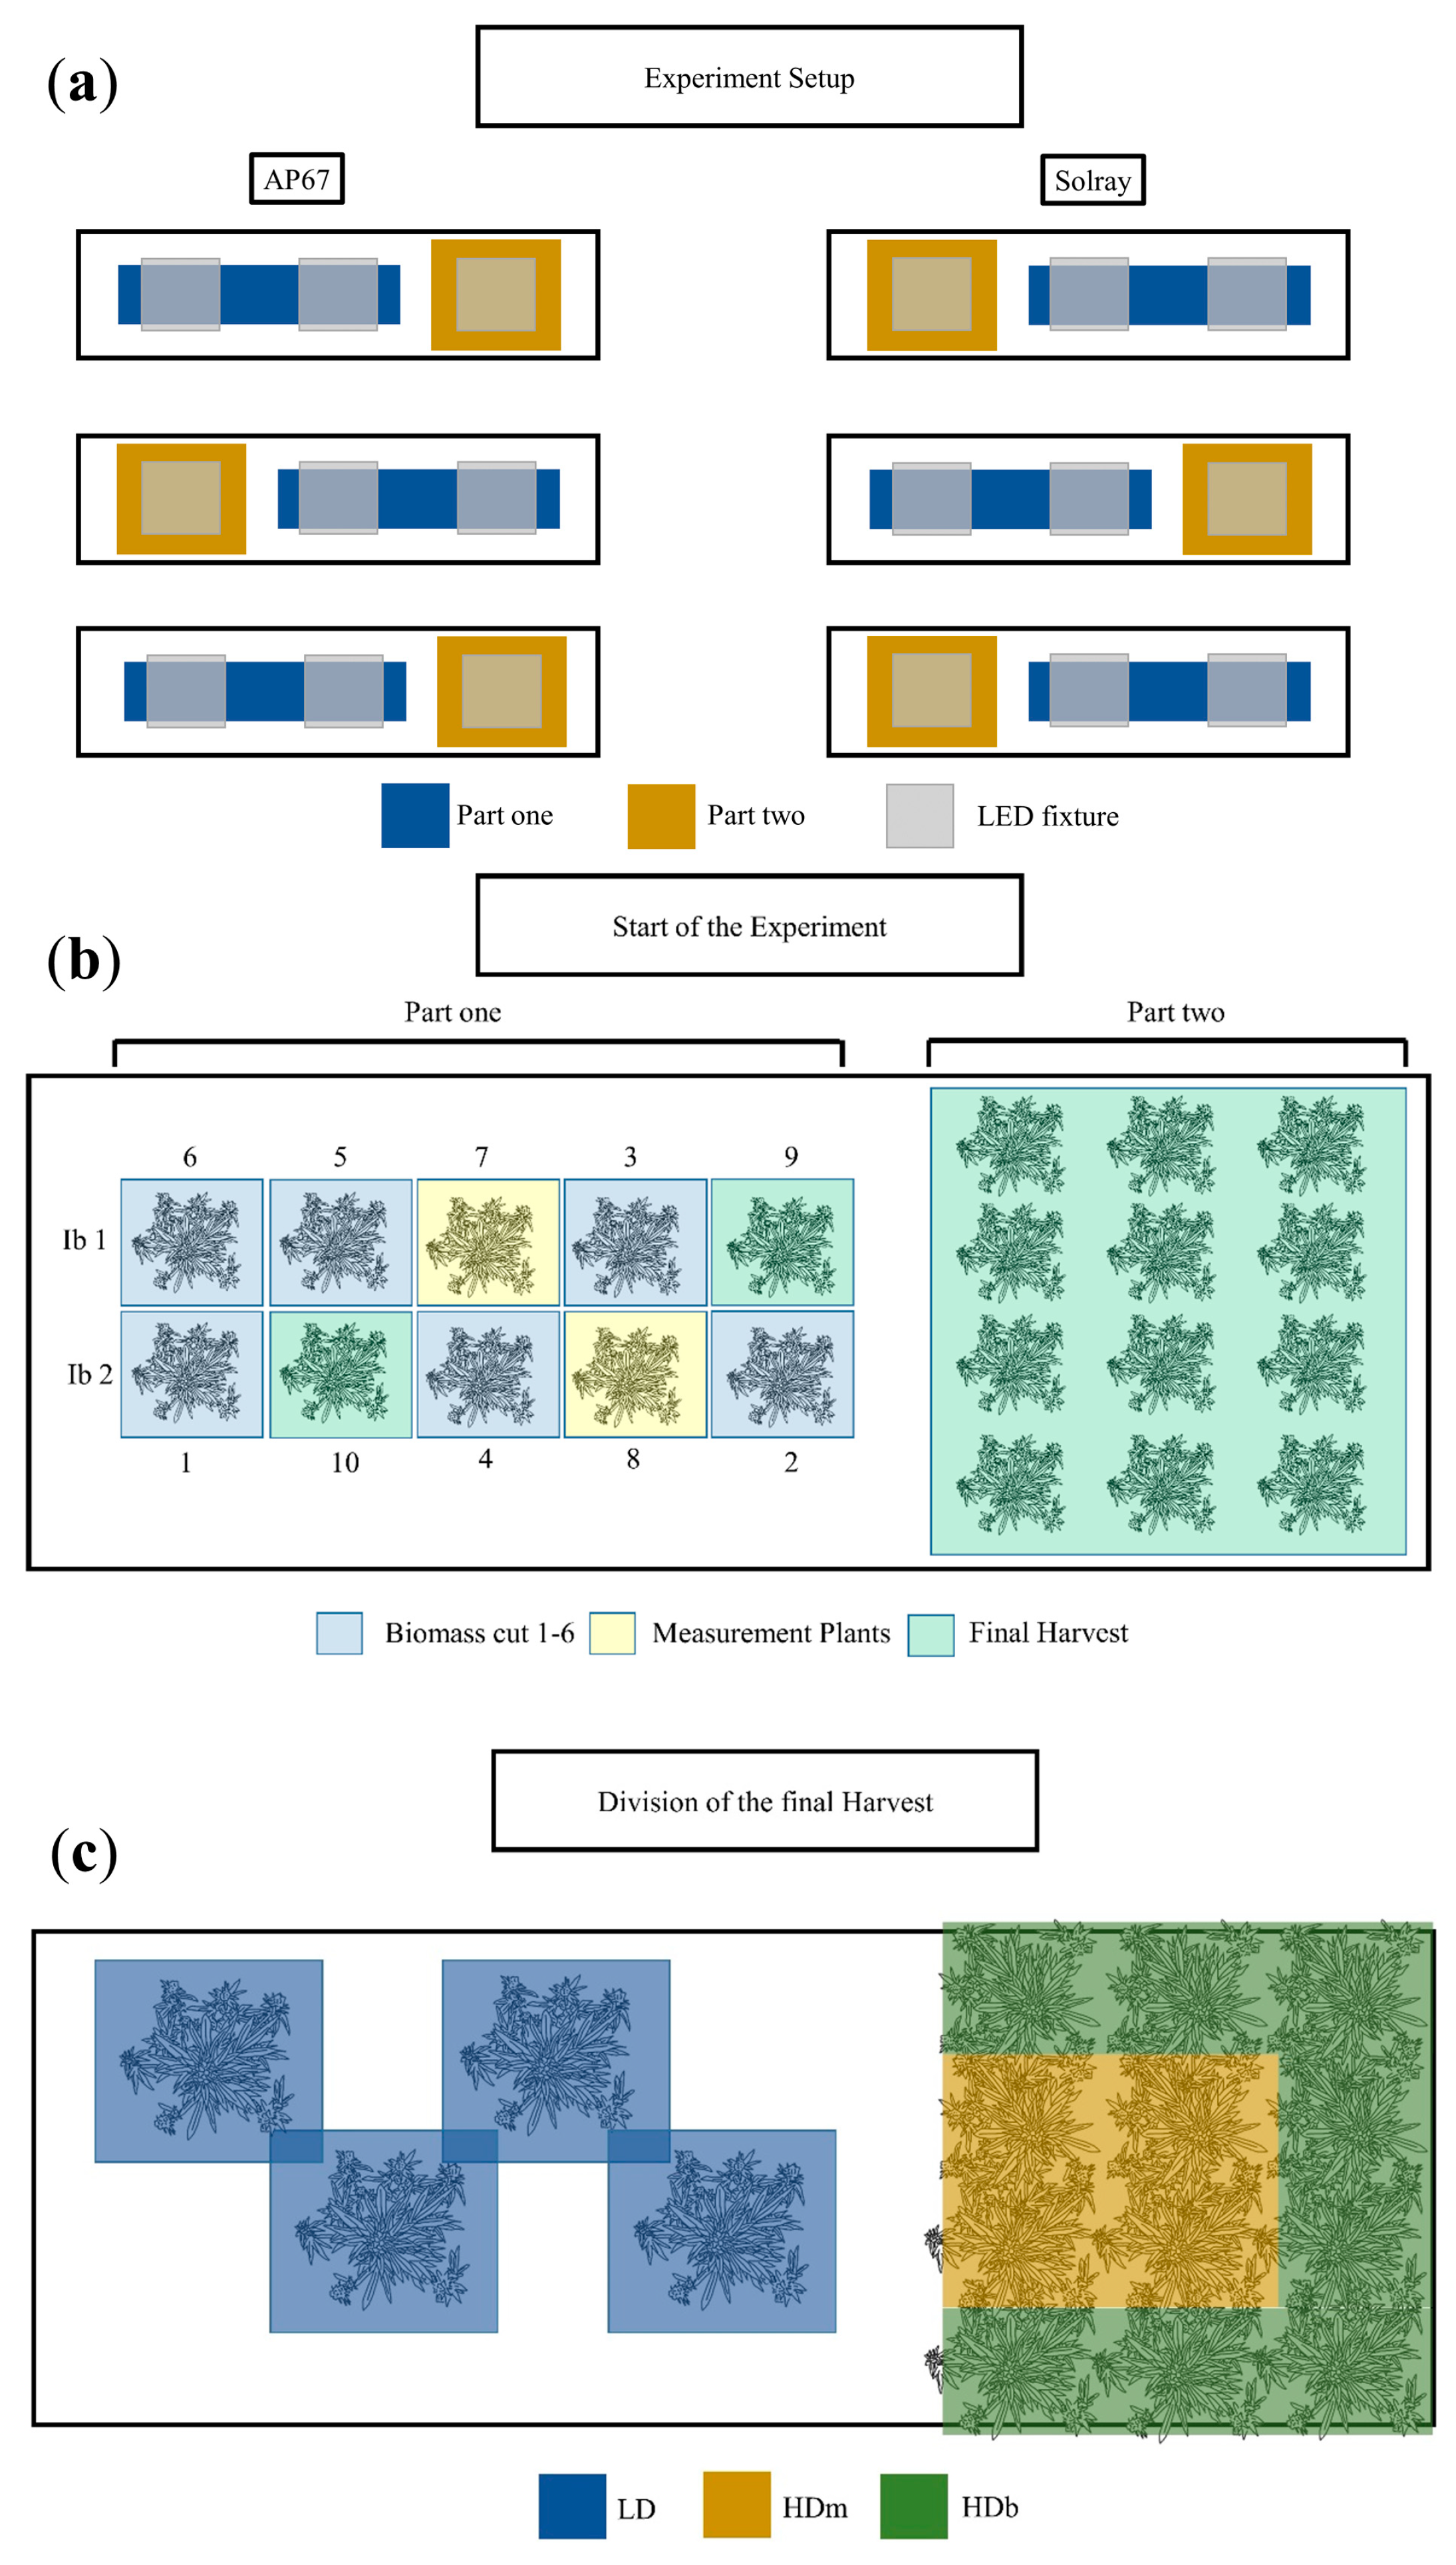
2.1. Experimental Setup

A greenhouse experiment was conducted at the University of Hohenheim from 12 January to 2 April 2022. C. sativa plants from the strain Kanada (KAN; AI FAME, Wald-Schönengrund, Switzerland) were grown under two different light sources, namely Solray385 with 630 W (SOL) and AP67 with 530 W (Valoya Oy, Helsinki, Finland). Light treatments were tested in three rooms serving as replicates. Each replicate had two tables, one for each light treatment. Light treatments were allocated to tables according to a randomised complete block design. Within a table, plants were split into two parts. In part one, growth dynamics were observed. In part two, plants were harvested at the final harvest (FH) to investigate the influence of a photon flux density gradient. Plants for growth dynamics were harvested at seven biomass cuts, with one plant per cut for the first six cuts and two plants per cut at the final harvest. Another two plants were used for non-destructive measures, resulting in ten plants for growth dynamics. Treatments within the growth dynamic part were allocated to plant positions on the table according to an α-design with two incomplete blocks (Figure 1b). Note that plant density was reduced during the experiment due to cutting plants with a final density at FH of 2.66 plants per m2 (LD = low density, 4 plants on 1.5 m2). Throughout the experiment in part one, the plants were positioned so that they did not touch neighbouring plants and the intensity was dimmed to the same intensity per plant in part one.
In part two, 12 plants were allocated to three rows, each with four plants (Figure A1a,b). This aimed to achieve an optimal plant density of 12 plants per square meter for C. sativa, based on the recommendations of [65]. The plant density remained constant throughout the experiment. In addition, in the part two, plants were divided into two categories: four plants in the middle under high light intensity (HDm) surrounded by eight border plants under lower light intensity (HDb) (Figure 1c).
The temperature throughout the experiment was 22 °C during the light and 18 °C during the dark period. Relative humidity was aimed at 60%. To supervise these parameters, the temperature and the relative humidity were recorded in each parcel by Tinytag Plus 2 (Gemini Data Loggers Ltd., Chichester, West Sussex, UK) data loggers.

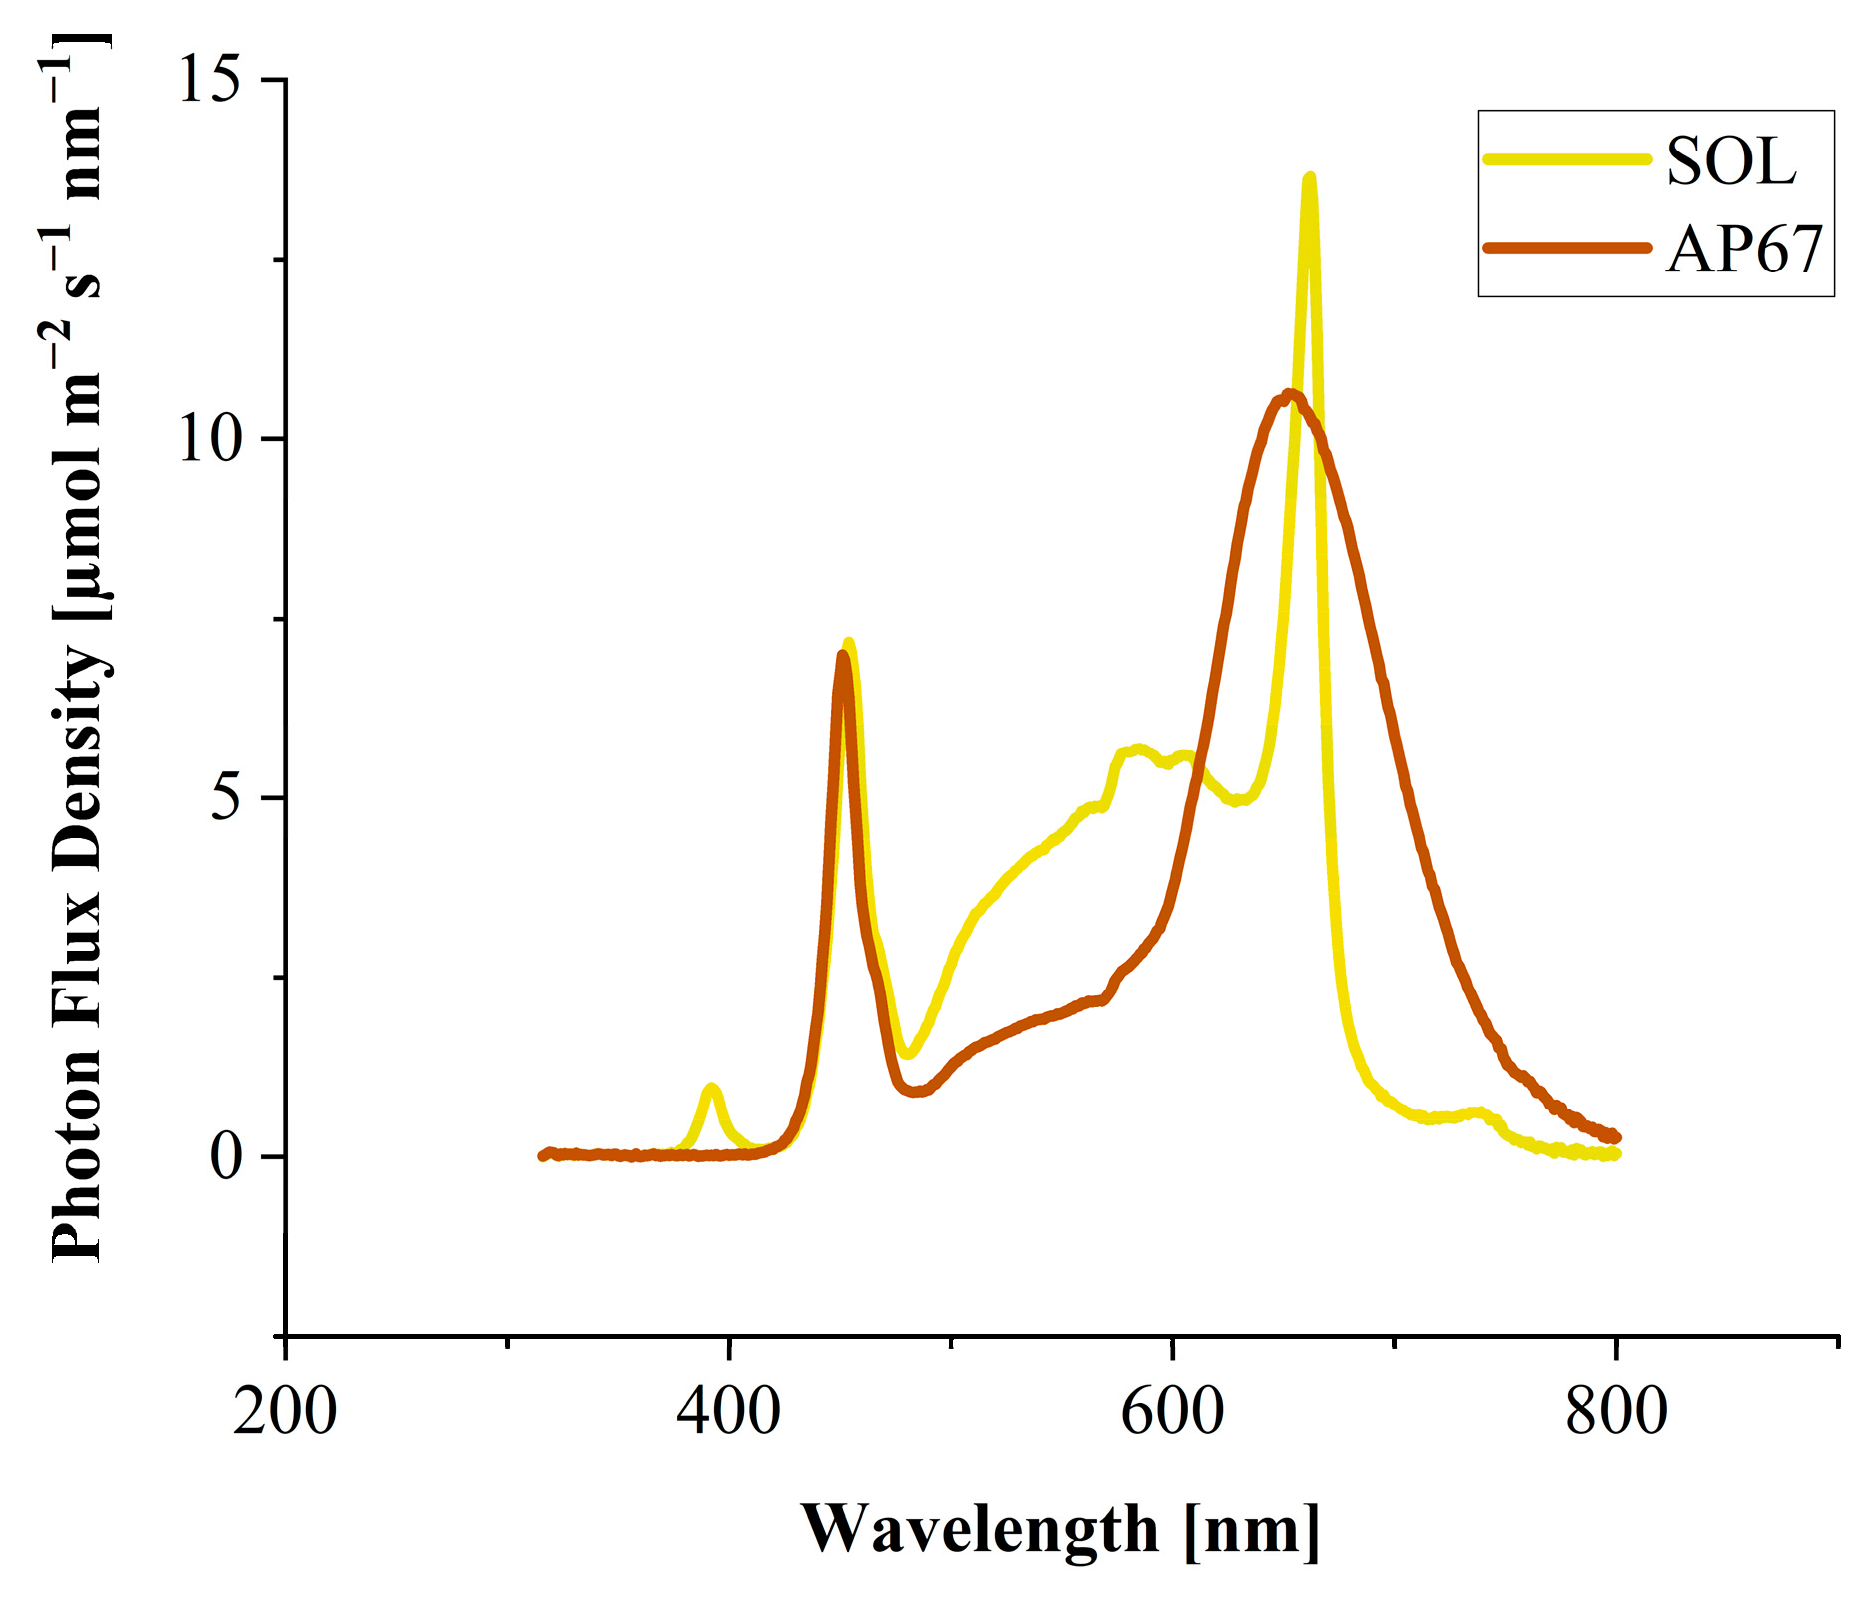
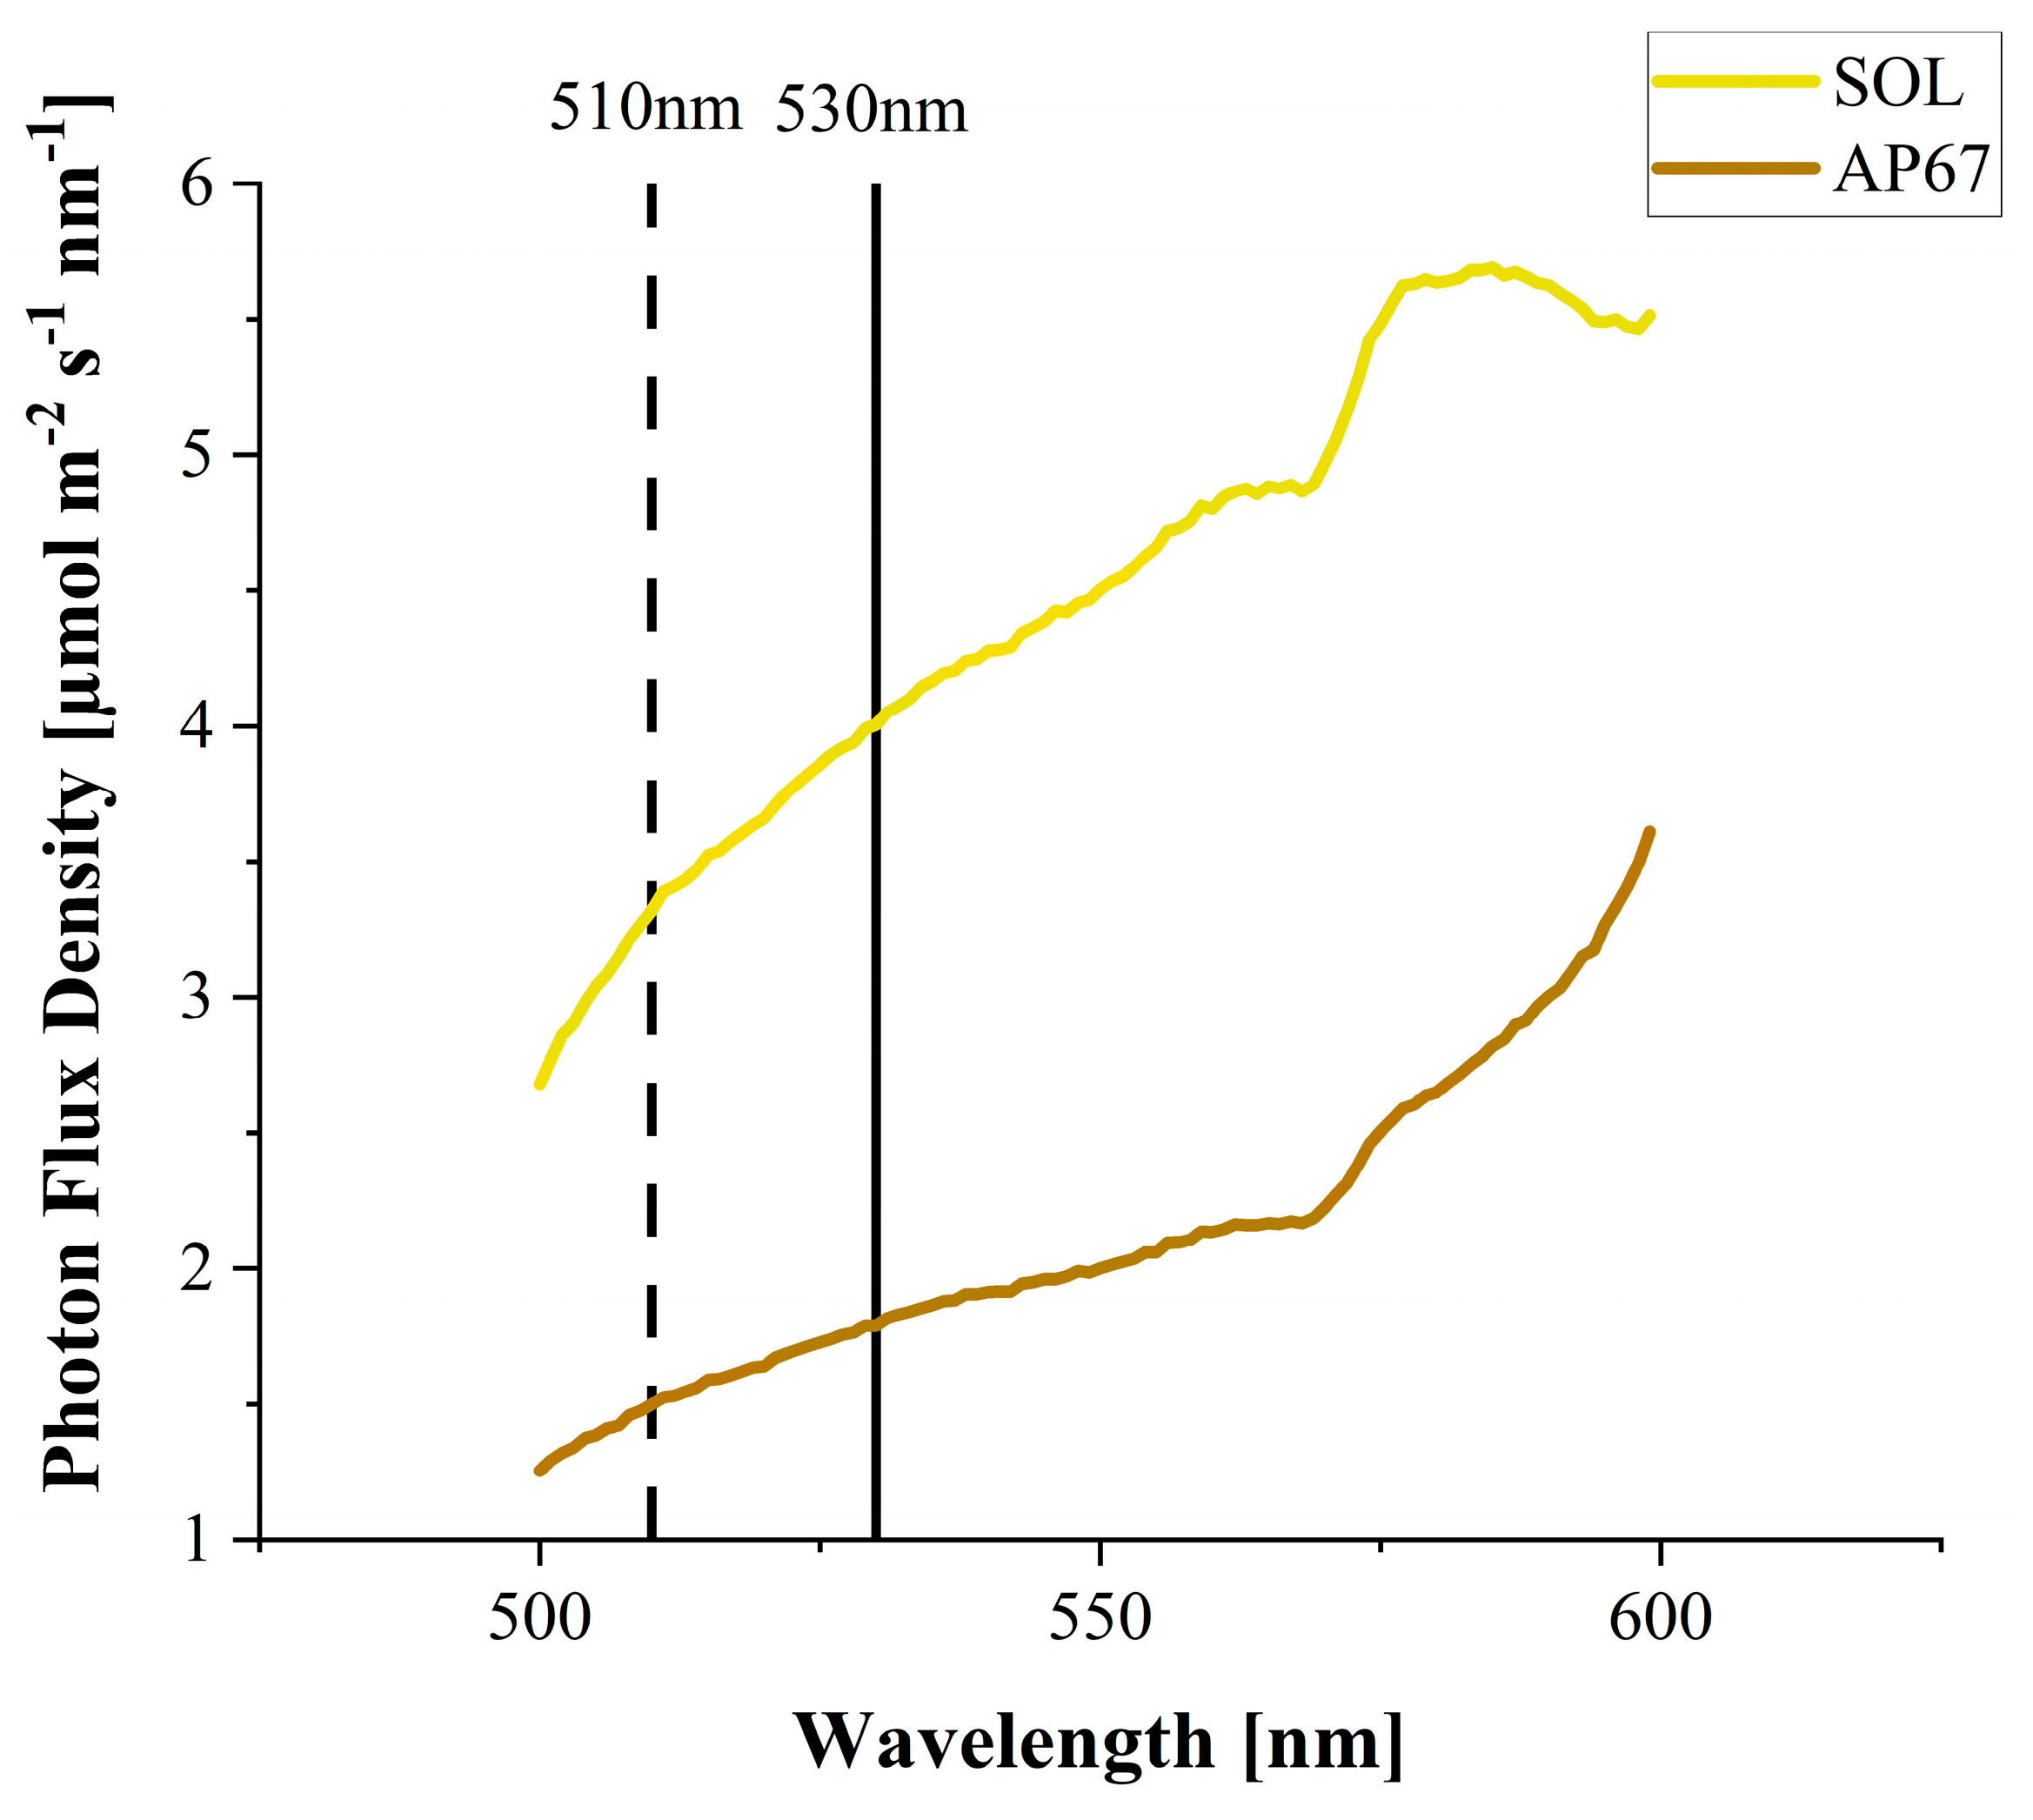
2.2. Light Treatments

The spectrum of the used light sources SOL and AP67 was similar in the proportion of most wavelengths, except for the red to far-red ratio (R:FR) and the proportion of green light (Figure 2). AP67 has an R: FR ratio of 3.7 at canopy height, whereas SOL has a considerably higher R:RF ratio of 12.9. The proportion of green light is 36% for SOL and 16% for AP67 (Table 1).
All spectral measurements were performed with the FLAME-S-XR1-ES spectrometer (Ocean Optics Germany GmbH, Ostfildern, Germany). The intensity of the light sources was dimmed constantly over the growth period to reach a PPFD of 750 µmol m−2 s−1 at canopy height during the vegetative phase under 18 h of light and 1200 µmol m−2 s−1 during flowering under short-day conditions of 12 h.
In part one, plants within the two incomplete blocks were placed in the centre of the table in the area of the highest PPFD with 1200 µmol m−2 s−1. In part two, the lamp’s scattering resulted in a heterogeneous light distribution. Here, the light was dimmed to 1200 PPFD above the plant stock. Due to the heterogeneous distribution, the four central plants (HDm) received an average of 1000 PPFD over all replicates and light spectra. Due to the light scattering, the light intensity to the eight border plants (HDb) was reduced by about 32% to 650 PPFD.

2.3. Growing Conditions

Plants were propagated from standardised three-month-old Kanada mother plants. To keep transpiration low in the cuttings during the rooting phase, the number of leaves was reduced to three, and the leaf tips were trimmed. To facilitate rooting, cuttings were placed into 55 mm × 31 mm Eazy Plug® seed cubes (Eazy Plug, HJ Goirle, The Netherlands) and treated with Clonex Rooting Gel (Growth Technology Ltd., Taunton, UK, 3.3 g/L indolylbutyric acid). During the rooting period, cuttings were exposed to a photoperiod of 18 h of light with an intensity of 150 µmol m−2 s−1 PAR emitted by a ceramic metal halide light source CHD Agro 400 (DH Licht GmbH, Wülfrath, Germany) under a relative humidity of 70–90%. After a rooting period of 21 days, cuttings were transplanted into pots with unfertilised substrate 5 (Klasmann-Deilmann, Geeste, Germany) +10% perlite and distributed randomly on both parts. Flowering was initiated after another 21 days of vegetative growth. The final harvest was after 82 days after planting (DAP) [23]. Throughout the growth period, the plants were watered based on weight to keep the soil water content between 60% and 70% and fertilised three times a week. The fertiliser solution was based on a modified Hoagland solution (Table 2) with an EC of 1.6.
The modified Hoagland solution (Table 2) consisted of a basic stock with Plantaactive, Type B (Hauert, Grossaffoltern, Switzerland) EPSO Top (K+S Aktiengesellschaft, Kassel, Germany), TENSO IRON (YARA GmbH & Co. KG, Dülmen, Germany) and Fetrilon Combi 1 (COMPO EXPERT GmbH, Münster, Germany). Nitrogen was added based on YaraTera Calcinite (YARA GmbH & Co. KG, Dülmen, Germany) and Domogran 45 ammonium sulphate (DOMO Caproleuna GmbH, Leuna, Germany). The primary stock solution and the ammonium and nitrate fertiliser solutions were stored in separate tanks, and the complete fertiliser solutions were prepared at each fertiliser application.

2.4. Data Acquisition

2.4.1. Destructive Sampling

In part one, the plants were sampled destructively seven times (including the final harvest) during the experiment to gain insight into the growth dynamics (Table 3). At each sampling, plants were separated into primary leaves, branch leaves, branches, main stem (the latter two including the leaf petioles) and, if flowers were present, main top bud (MTB), side top buds (STB) and side buds (SB) according to [27]. In addition, the leaf area (LA) of the main and branch leaves was measured using an LI-3100 Area Meter (LI-COR, Lincoln, NE, USA). The dry matter of leaves, branches, and stems was determined by drying them at 65 °C for two days until a constant weight was reached. The flowers were air-dried at 22 °C and 40% relative humidity for 14 days. The measured leaf area was then used to calculate the specific leaf area (SLA, cm2 g−1) by dividing the leaf area by the dry matter of the leaves. Plants from both parts were fragmented identically at the final harvest (FH).

2.4.2. Non-Destructive Measurements

Two plants per light treatment and repetition were used to assess weekly growth dynamics in part one (Table 4). For this purpose, plant height, number of nodes, length of internodes, number of branches emerging from the main stem nodes and their length, and the stem width at 2 cm above the soil surface were measured. The numbers of leaf tips (all leaves) and only fully developed leaves on the main stem and the branch were counted.

2.5. Cannabinoid and Terpene Analysis

2.5.1. Terpene Analysis

The terpene analysis method described in [68] was used for the study. Two Agilent 20 mL headspace vials for each sample were filled with 50 mg of dried and ground material. Analysis was performed on an Agilent 8860 GC system (Agilent, Santa Clara, CA, USA) consisting of an Agilent 7697A Headspace Sample (Agilent, Santa Clara, CA, USA), an Agilent 5977B GC/MSD (Agilent, Santa Clara, CA, USA) (residual solvent analyser), and an Agilent VF-35 column (Agilent, Santa Clara, CA, USA) (30 m × 0.25 mm, 0.25 µm). A temperature gradient programme was used to separate mono- and sesquiterpenoids. The vial equilibration step consisted of 10 min at 60 °C. The temperature was then ramped up at 45 °C per minute until 150 °C was reached, with no hold time. This was followed by a second ramp of 35 °C per minute until 250 °C was reached, with a 0.5 min hold. The total run time for the analysis was 16 min. During the analysis, the maximum injector temperature was set at 260 °C, and a split ratio of 100:1 was used. Helium was the carrier gas with a 3.0 mL/min column flow rate. The MSD source temperature was set at 300 °C, the quadrupole temperature at 150 °C, and the transfer line temperature at 260 °C. A seven-point calibration curve was generated from 10 ppm to 1250 ppm for quantification using terpene standard #1 from Restek (Bellefonte, PA, USA). The calibration points were 0, 20, 50, 100, 200, 500, 750, 1000, 1250, 1500, and 1750 ppm. Quantifier and qualifier ions for each compound were selected based on the methodology described in [69].

2.5.2. Cannabinoid Analysis

The air-dried flower material was subjected to cannabinoid analysis using high-performance liquid chromatography (HPLC) following the method described by [70] and [23]. The HPLC system utilised was Agilent’s 1290 Infinity II LC System (Santa Clara, CA, USA).
Two vials containing approximately 100 ± 10 mg of milled sample were prepared for each sample. The samples were dissolved in 100 mL of a composite solution consisting of 90% methanol and 10% chloroform (v/v) in a 9:1 ratio. The extraction process took place in an ultrasonic bath for 30 min at 30 °C. Subsequently, the cooled-down extract was filtered through polytetrafluoroethylene (PTFE) syringe filters with a pore size of 0.45 μm (Macherey-Nagel GmbH & Co. KG, Dueren, Germany) into an HPLC vial. The filtered extract was then injected into the HPLC system for analysis. Cannabinoids in the samples were quantified using a detection wavelength of 230 nm. An external calibration method was employed to perform the quantification. Two standards, CAN1 and CAN2, containing the target compounds, were used for calibration. The CAN1 standard included CBD (2%) from Lipomed (Arlesheim, Switzerland), and CBDA (10%), while the CAN2 standard included CBG (2%) and CBGA (2%) from Echo Pharmaceuticals BV (Weesp, the Netherlands). A seven-point calibration curve was created from diluted standard solutions with a coefficient of determination of 1.0 for both CBD and CBDA

2.6. Data Analysis

2.6.1. Photon Conversion Efficacy

We used a FLAME-S-XR1-ES spectrometer (Ocean Optics Germany GmbH, Ostfildern, Germany) to assess the intensity of light received by each plant. Considering four different measuring points around each plant provided a comprehensive 360° view of the average light intensity (µmol−1 m−2) per plant. Based on these measurements the Photon Conversion Efficacy (PCE) was calculated according to [35], including the lower PPFD of the 21-day vegetative period.
Photon   Conversion   Efficacy   ( PCE ) = D r y   F l o w e r   Y i e l d   ( g m 2 d a y ) D a i l y   L i g h t   I n t e g r a l   ( D L I ) ( m o l m 2 d a y )

2.6.2. Statistical Analysis

All measured traits were analysed using three mixed models in SAS 9.4 (SAS Institute, Cary, NC, USA, 2016). Traits can be split into three types: destructive measures from part one, non-destructive measures from part one, and destructive measures at final harvest from both parts. For each type, a separate model was fitted. For the destructive measurements in the first part (cut 1 to 6), the following model was fitted:
y i j l m o p = μ + r i + t i j + b i j l + τ m + ρ o + τ ρ m o + e i j l m o p
where y i j l m o p is the observation of the pth plant at the other cut in the lth incomplete block on the jth table of the ith room treated with mth light spectrum at the nth flower position; μ is the intercept; and r i , t i j , and b i j l are the random block effects of the ith room, the jth table in room I, and the lth incomplete block on table j in room i. The terms τ m , and ρ o denoted the fixed effects of the mth light spectrum, and the oth cut, τ ρ m o is the fixed two-way interaction effect between the corresponding factors involved, and e i j l m o p is the error of y i j l m o p . Heterogeneous variances across cuts were fitted if this resulted in a better model fit measured via smaller AIC. Note that the number of observations per treatment may vary between treatments. The mixed model accounts for the unbalancedness of the data by fitting different standard errors of means.
For non-destructive measurements in part one, error and incomplete block effect were confounded. Additionally, data of plants were repeatedly measured from plants across DAP. Therefore, model (1) needed to be modified as follows: first, arbitrarily, the effects for incomplete blocks were dropped. Second, ρ o and τ ρ m o now denoted the effect of the oth DAP and its interactions with light spectra. Third, a first-order autocorrelation with heterogeneous variances was fitted to error effects within a plant. In all cases, measurements performed at different flower positions were analysed separately.
To further analyse the influence of the plant density on flower yield, cannabinoid and terpene concentration measured at final harvest at both parts on the table, another mixed model was fitted:
y i j k m n p q = μ + r i + t i j + p i j k + τ m + φ n + ω q + τ φ m n + τ ρ m q + φ ρ n q + τ φ ρ m n q + e i j k m n p q ,
where y i j k m n p q is the observation of the plant p in the kth part at the jth table of the ith room treated with the qth density, mth light spectrum, and nth flower position. μ is the intercept, and r i , t i j , and p i j k are the random block effects of the ith room, the jth table in the ith room, and the kth part of the jth table of the ith room. τ m and ω q are the fixed effects of the mth light spectrum, nth flower position, and qth density.   τ φ m n , τ ω m q , φ ω n q , and τ φ ω m n q are the fixed two- and three-way interaction effects between the corresponding factors involved, and e i j k m n o p q is the error of y i j k m n o p q .
For both models, error effects were allowed to have heterogeneous variances if this increased the model fit via AIC. Normal distribution and homogeneous variance of residuals were checked graphically via residual plots. Least square means were compared using Fisher’s LSD test, and a letter display was derived [71].

3. Results

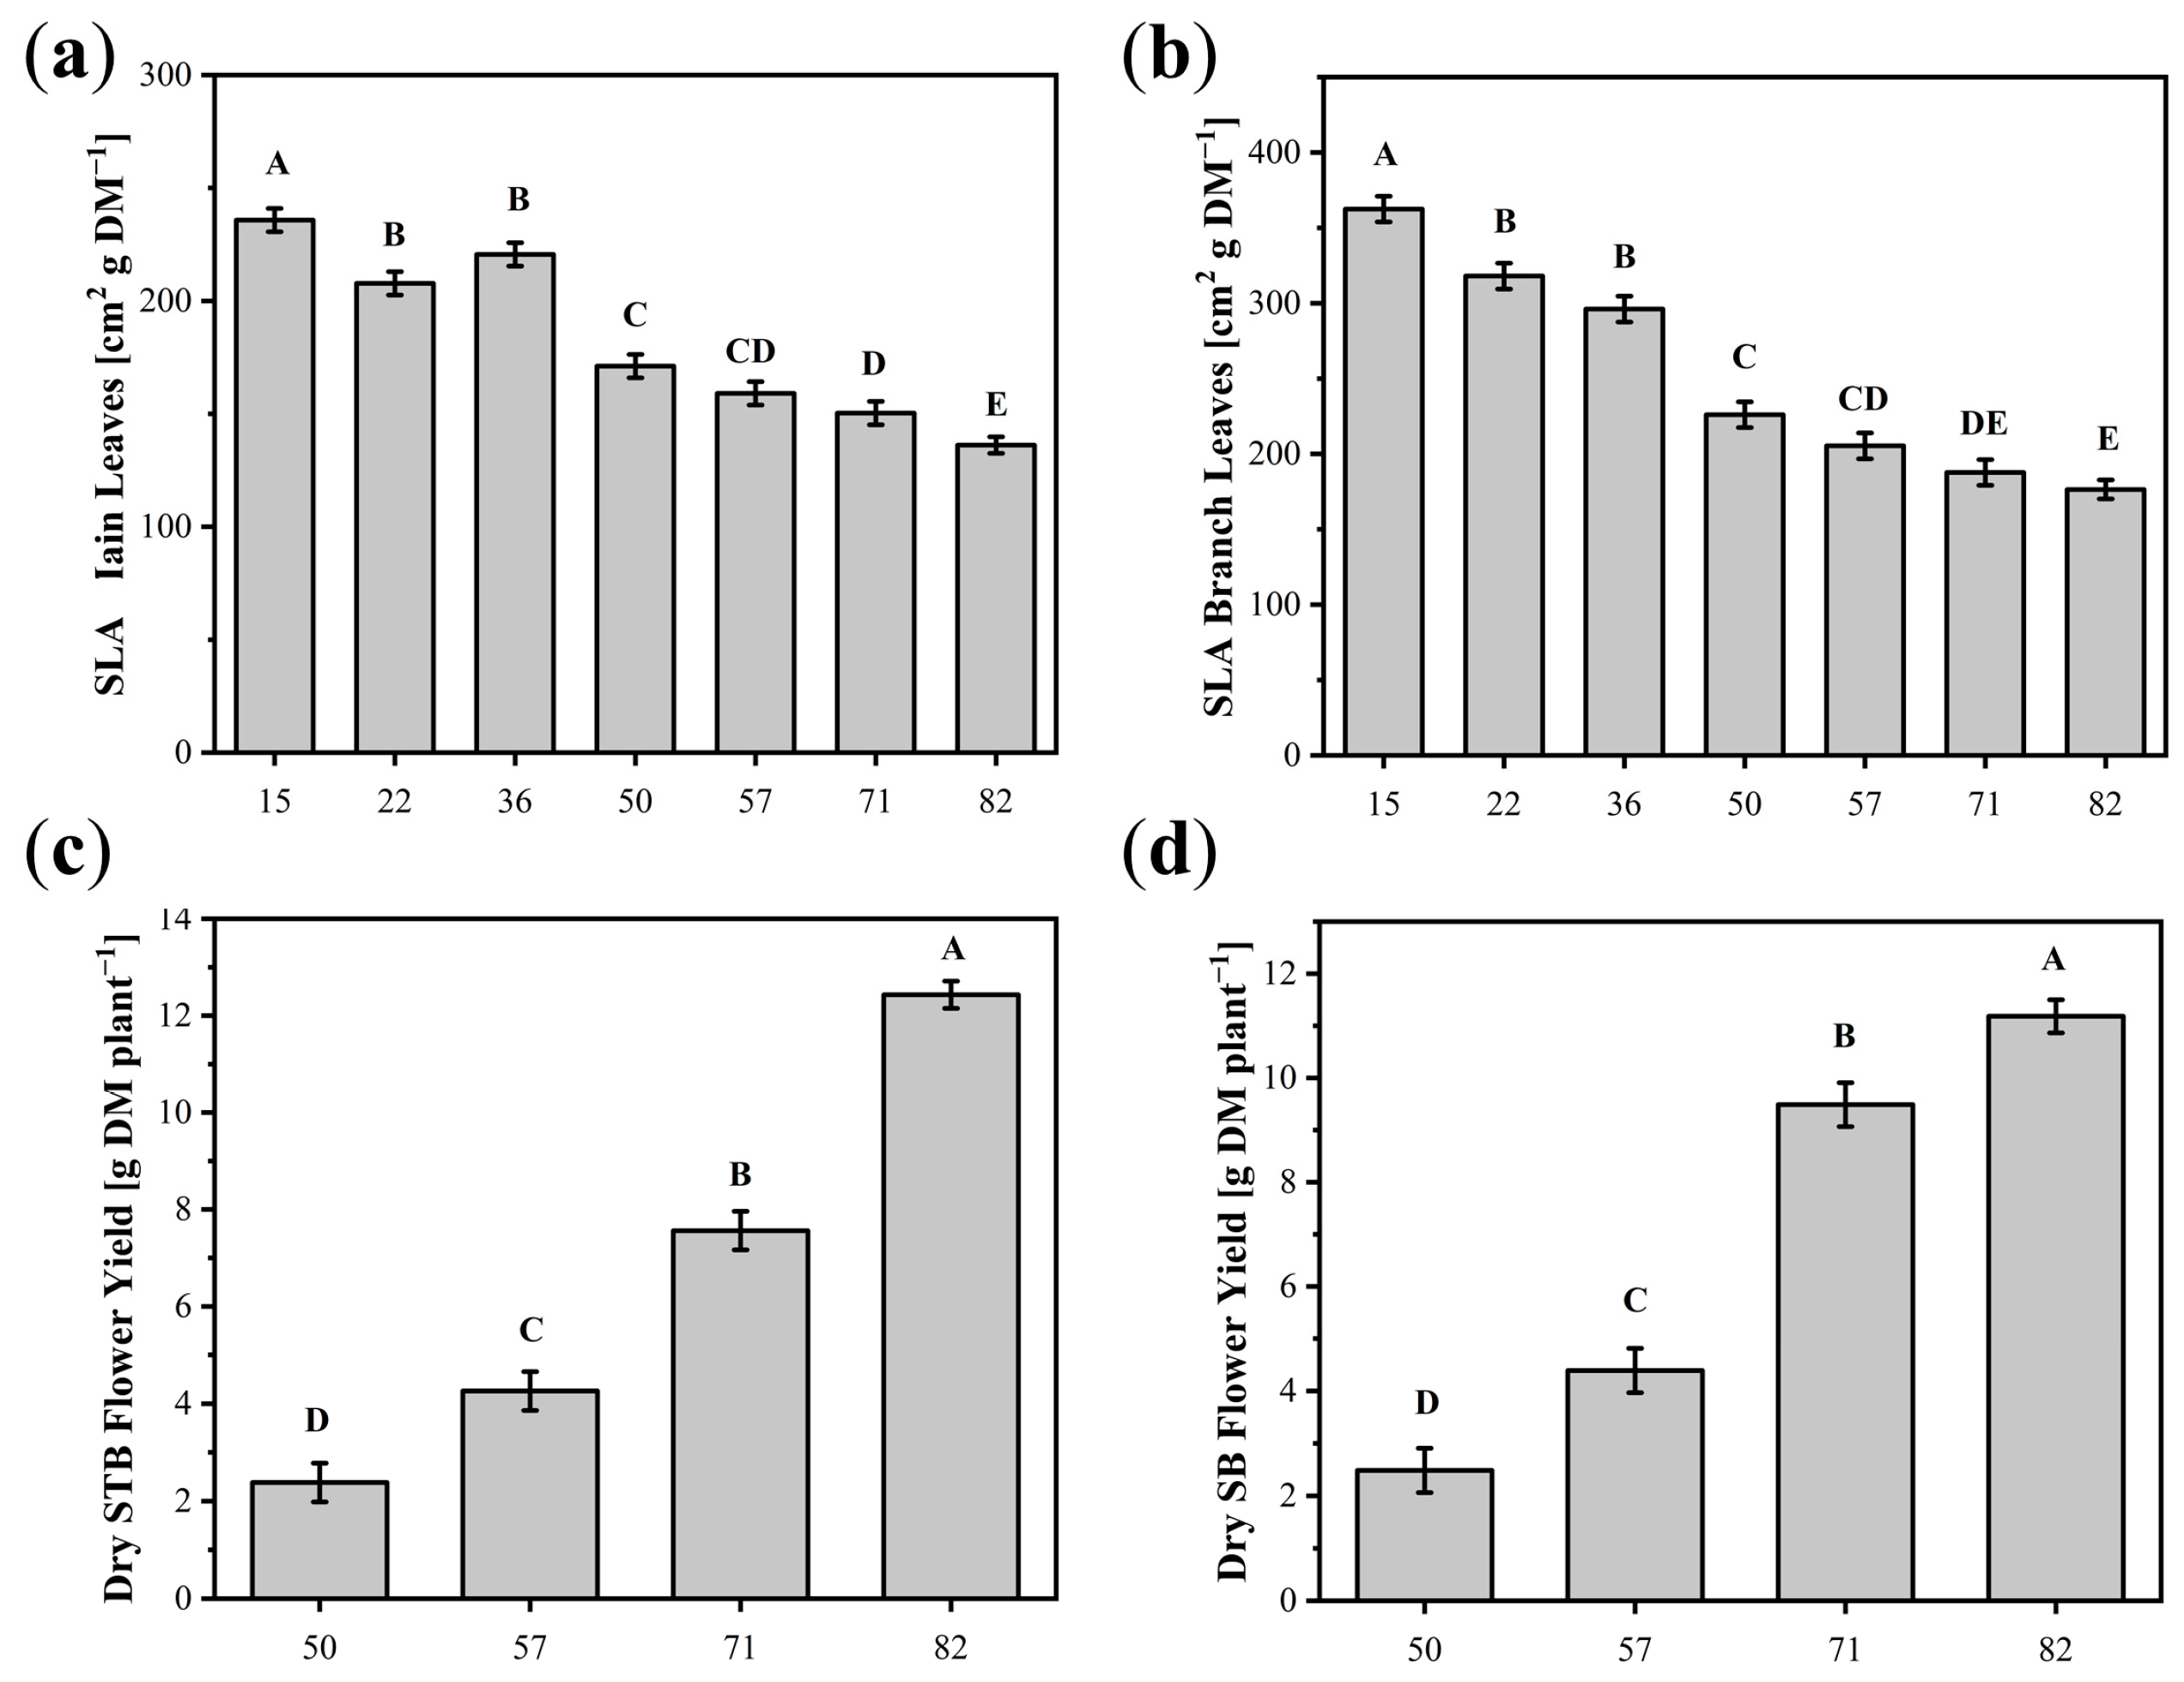
3.1. Morphology and Growth

3.1.1. Influence of DAP

No significant influence of light spectra was detected on the following morphological properties in part one, such as the number of leaf tips, stem width, and mean internode length. However, significant changes were observed over time (Figure A1), with the stem width and mean internode length increasing until their maximum at day 42 and 35 after planting, respectively, and then stabilising until the final harvest. In contrast, leaf formation continued to increase steadily, as evidenced by the emergence of new leaf tips, primarily on the inflorescences, during the later growth period. The specific leaf area (SLA) significantly decreased between the destructive samplings (Figure A2a). The reduction ranged from 42% for the main leaves (236 to 136 cm2 g DM) to approximately 51% for the branch leaves (362 to 176 cm2 g DM−1) between 15 DAP and the final harvest at 82 DAP. The first dry flower harvest was at 50 DAP, and dry flower yield continued to increase steadily until the final harvest. During this period, dry flower yield for side top buds (STB) and side buds (SB) increased by over 400% and 350%, respectively (Figure A2c,d).

3.1.2. Influence of Light Spectrum

Nevertheless, significant differences between the light spectra were observed for the non-destructive measurements of plant height, number of nodes, mean length, and number of branches per plant (Figure 3a–d). Only small significant differences were found between the spectra for number of nodes and number of branches. Both spectra showed the same number of branches at DAP 42 and only differed at DAP 25 and 35 (Figure 3d). AP67 showed significantly more nodes at DAP 42 (Figure 3b). On the other hand, there were clear differences in the height of the plants and the mean branch length. Plant height increased under both light spectra until 49 DAP and reached its maximum 28 days after the initiation of the flowering phase (56 DAP). Plants grown under AP67 reached a maximum height of 59.6 cm, which was 18% higher than plants grown under SOL (50.4 cm) (Figure 3a). In addition to the taller plants, 17% longer side shoots were observed under AP67 at DAP 42 (Figure 3a). There were no significant differences between the light spectra for leaf area (LA) based on the leaf area of the main and branch leaves and for the specific leaf area (SLA), which decreased steadily over the experimental period in part one (Figure 3e,f). There was continuous leaf development until days 56 and 49, with a maximum number of 127 and 131 fully developed leaves under SOL and AP67, respectively. Dry matter accumulation revealed a light-induced change throughout the plant (Figure 4a–f). The first significant change due to the light spectra was detected at 50 DAP (Figure 4a). The weight of the main stem, branch stems, main leaves and branch leaves increased until 71 DAP and then stagnated with no significant change until the final harvest (Figure 4a–d). In contrast, the dry matter of key parameters, such as the main leaves, increased over the whole measurement period. AP67 led to significantly increased biomass accumulation. This was also evident in the dry flower yield of the whole plant and the main top buds (MTBs). However, these differences became apparent only in the last half of the growth period, with the last 11 days being essential for flower yield (Figure 4e–f). At the final harvest (82 DAP), both parameters were significantly elevated under AP67, with a difference of 16.1% for total dry flower yield and up to 35.7% for MTB.

3.2. Plant Density

The light spectrum plays an important role in C. sativa cultivation and significantly influences biomass accumulation, yield parameters, and growth trajectory in part one. However, it is essential to note that these plants were not exposed to shading or competition from neighbouring plants, as they were grown at a density of 2.66 plants per m2 (LD) at the final harvest (Figure 1c). The following section analyses and compares the interaction between light gradient and light spectra under a higher plant density of 12 plants per m2 on yield and secondary metabolites in part two with part one. The plants of part two were divided into two categories (HDm, HDb) and compared with the plants in the lower density (LD) (Figure 1c).

3.2.1. Dry Flower Yield

The plant density had a notable impact on yield composition (Figure 5), with significant differences detected between the various plant densities primarily at the flower positions STBs and SBs. The comparison of the dry flower yield at different flower positions showed that the light spectrum most influenced the yield of the SBs under LD. Specifically in the SBs in the LD treatment, AP67 led to a 21% larger flower yield than SOL (Figure 6a). In particular, the outer plants under lower intensities (HDb) that surrounded the plants in the middle under the highest intensities (HDm) accumulated less total dry flower yield (Figure 6b) over both light spectra. This reduction accounted for 11% under SOL and 16% under AP67. On the other hand, the plants in the middle of the square meter (HDm) and the plants at the lower density (LD) mostly showed a similar distribution of dry flower yield, except for the SB flower yield (Figure 6b). Upon considering the yields of the respective flower positions, it became evident that the MTB dry flower yield was consistently lower compared to the SBs and STBs and a significant proportion of the total yield accumulated on these flower positions.

3.2.2. CBD and CBDA

The CBDA concentration was not significantly affected by the plant density. In contrast, the sum of CBD and CBDA was significantly impacted by plant density. Here, the higher density increased the CBDA + CBD concentration for both HDb and HDm (Table 5). In addition, there were significant differences in CBDA and CBDA + CBD concentration between flower positions, with SBs showing lower concentrations than MTBs and STBs (Table 5). When considering the cannabinoid yield of CBD and CBDA in part two, the highest yield was observed in the STBs, while the lowest yield occurred in the MTBs. Consequently, STBs and SBs are critical in determining the cannabinoid yield. Additionally, a 17% higher CBD concentration was observed under the light spectrum SOL compared to AP67 on average across all flower positions (Figure 7a). Both flower position and light treatment significantly influenced and interacted with CBD concentration (Figure 7a), and AP67 resulted in a more heterogeneous distribution. The same distribution was found when looking at the CBD + CBDA concentration, where SOL resulted in a more homogeneous distribution between MTBs and STBs (Figure 7b).

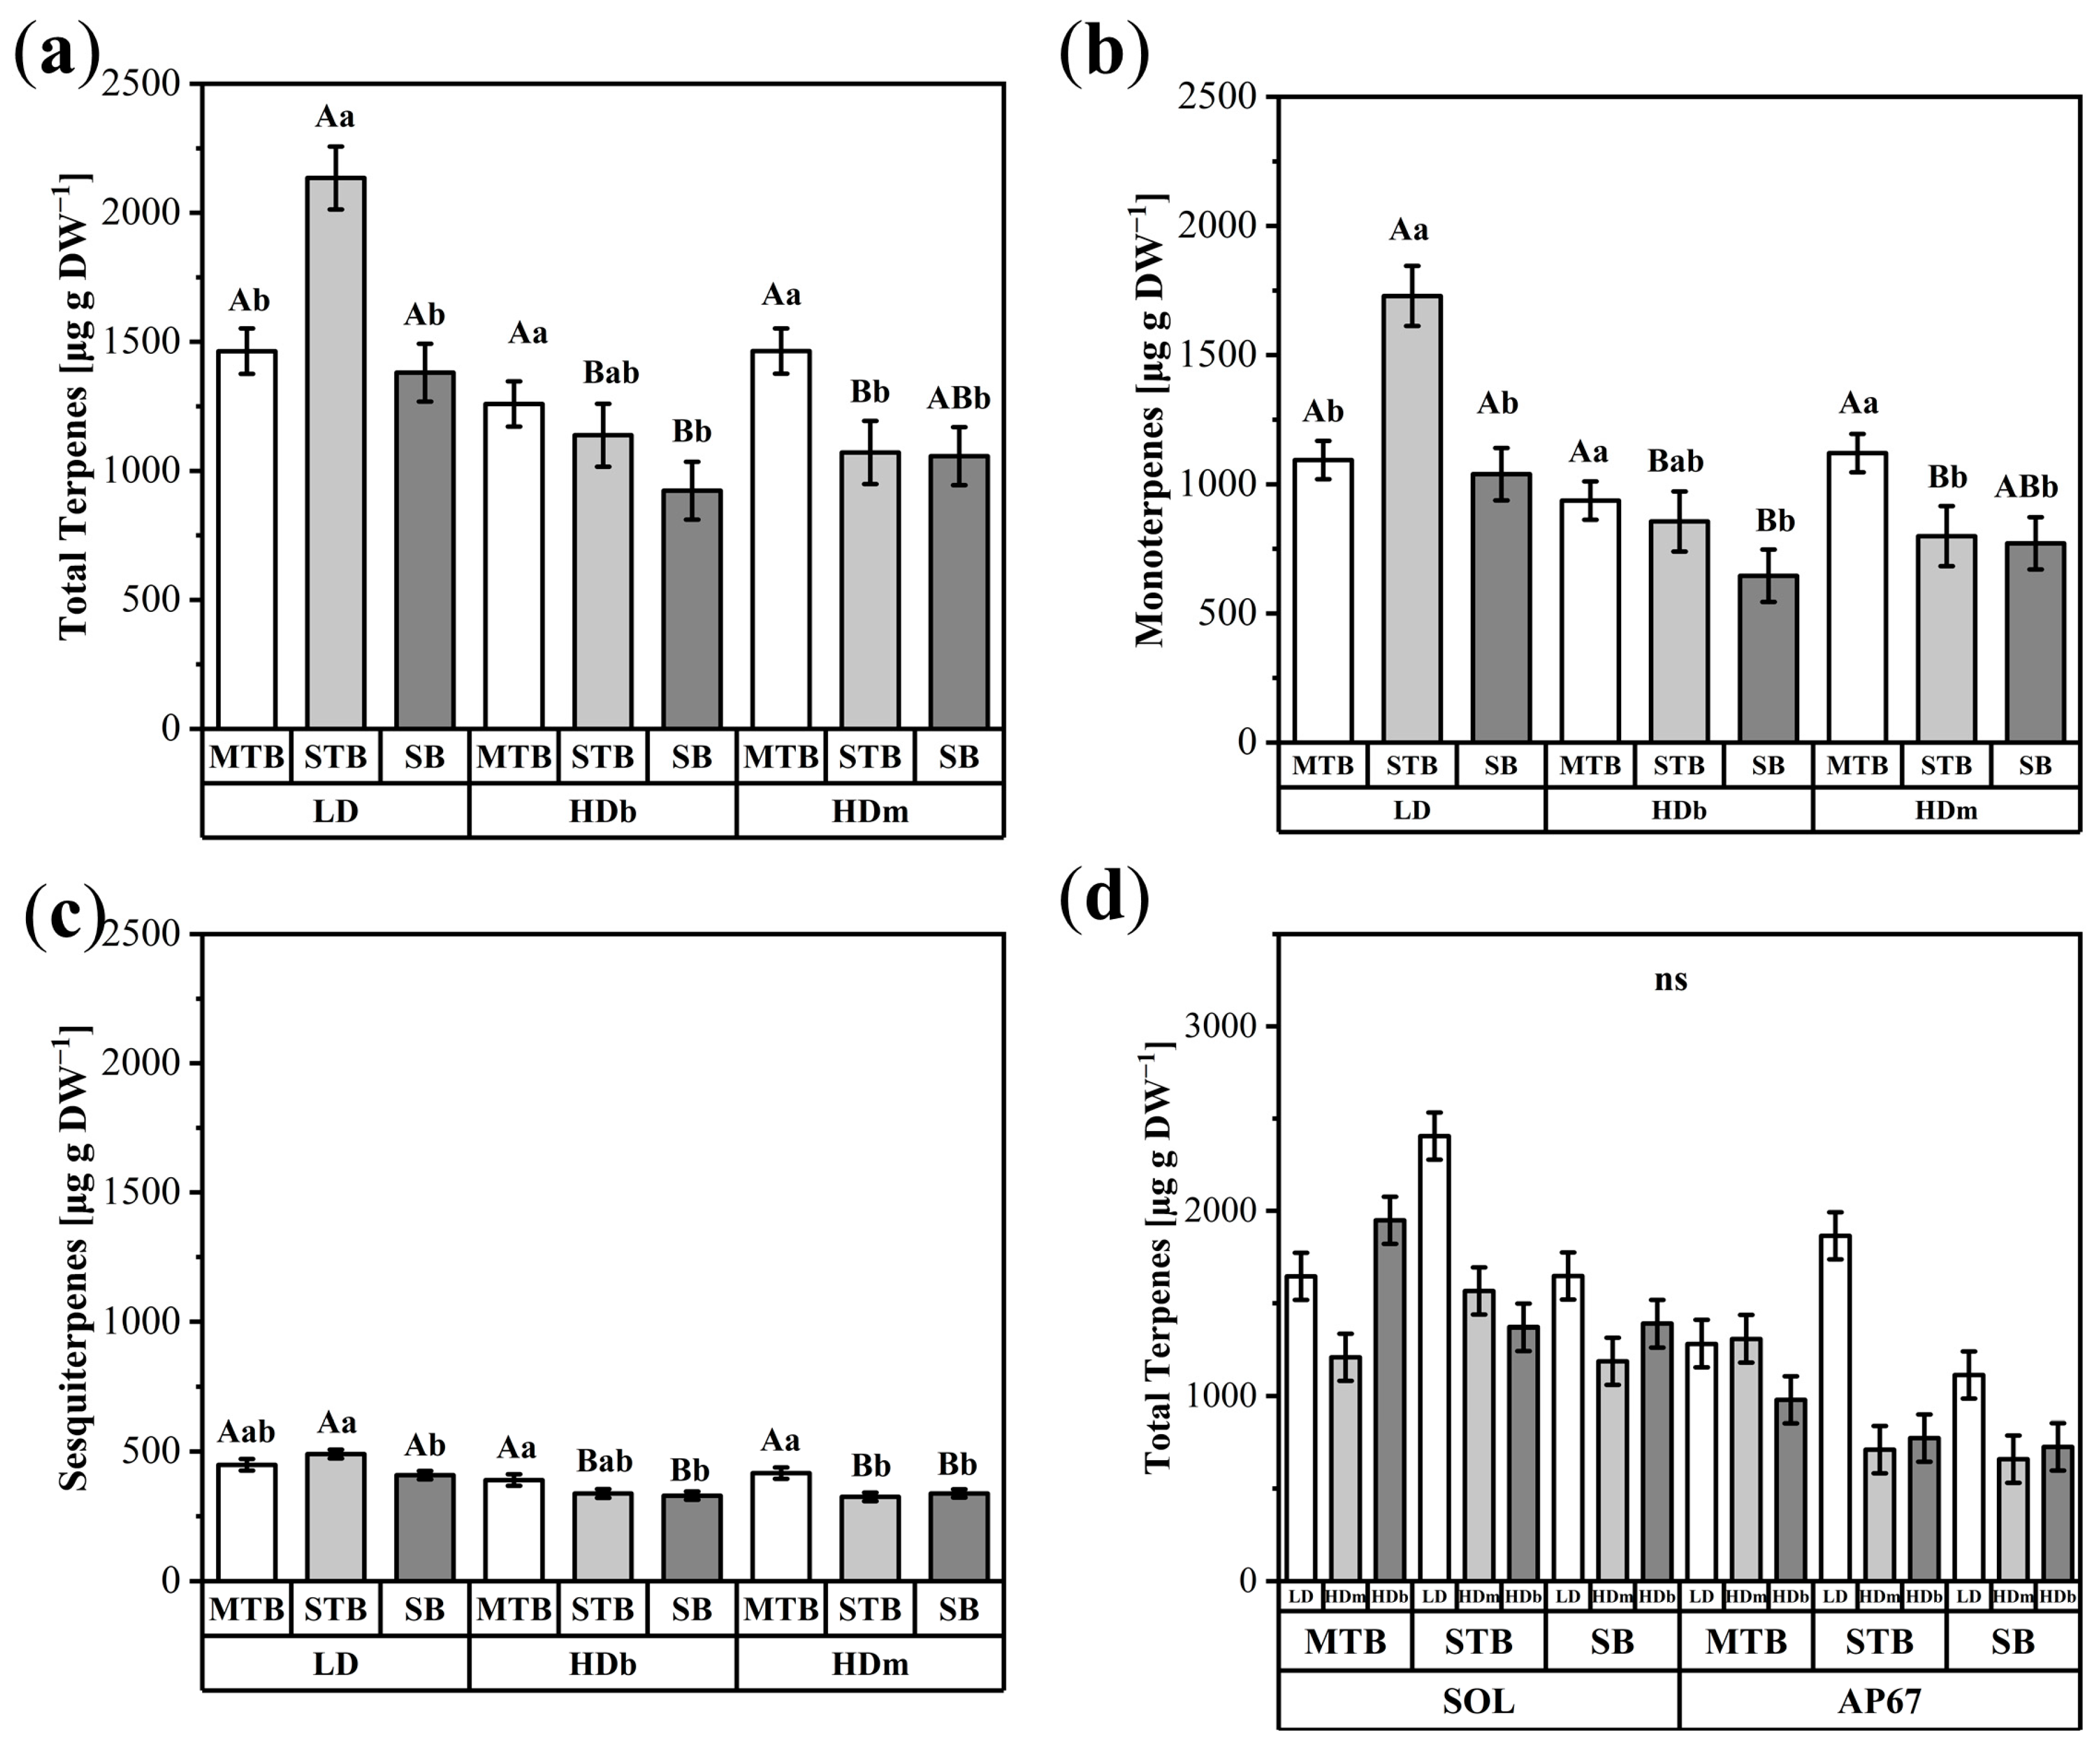
3.2.3. Terpene Flower Position and Density

In both parts, terpenes were detected using our mixed standard with a 50 µg g−1 DW threshold. This standard included six monoterpenes (α-Pinene, β-Myrcene, β-Pinene, Ocimene, Terpinolene, and Linalool) and three sesquiterpenes (Caryophyllene, α-Humulene, and Nerolidol). Terpenes were divided into three groups for a simplified representation: total terpenes, monoterpenes, and sesquiterpenes (Table 6). A significant two-way interaction between density and flower position was found for the concentrations of total terpenes, monoterpenes, and sesquiterpenes (Figure 8a–c). Related to the flower position, the SBs never contained a significantly higher terpene concentration compared to the other flower positions in the same density category. For all three terpene groups, plants at the lower density (LD) tended to achieve higher concentrations, especially in the STBs, probably due to better illumination (Figure 8a–c). However, there was a different distribution for sesquiterpenes, where the highest concentration was still found in STBs, but the comparison with MTBs was not significant. It is also evident that sesquiterpenes were distributed more homogeneously across all flower positions, with a maximum difference of 20% compared to 67% for monoterpenes. Spectral effects were limited to monoterpenes, thus affecting total terpene concentration. Overall, the light spectra AP67 led to lower total terpene and monoterpene concentrations than SOL (Table 6). Flowers grown under SOL showed the smallest increase, 36%, for total terpenes, and the largest increase, 50%, for monoterpenes compared to AP67. As previously indicated, the concentrations of sesquiterpenes were not significantly influenced by the light spectra (Table 6). Looking at the reciprocal effect between light spectrum, flower position, and density, it can be noticed that SOL enhanced the concentration of monoterpenes in the STBs and SBs of plants grown at HDm and HDb compared to AP67, respectively. It was also observed that the concentration of terpenes in the main top bud (MTB) within the high-density category (HDm) under SOL lighting resulted in lower values compared to other density categories at the same flower position (Figure 8d). The highest concentration of terpenes in the MTBs was found in the HDb under SOL. Thus, the final terpene concentration depends on the light spectrum and the interaction between density and flower position, whereby high densities allow for a more homogeneous distribution.

3.3. Light Distribution in the Square Meter

The average PPFD in part two at canopy height ranged from 300 to 1200 µmol m−2 s−1, depending on the position within the row-column design (Figure 9a,b). PPFD under SOL was higher and more homogeneously distributed compared with AP67. This was due on the one hand to the light source and on the other to the measurement method, as PPFD measurements were taken above the respective plant tip and the plants under AP67 had a more heterogeneous growth type, resulting in lower average PPFD values at the same position than under SOL. Additionally, PPFD was drastically reduced through the interception by the canopy, with values ranging from 50 to 400 µmol m−2 s−1 (Figure 9c,d). The more homogenous shorter and compact plant growth (Figure 5) led to higher median PPFD at the canopy and substrate surface (Figure 9d).
Interestingly, the hotspots of PPFD at canopy height did not coincide with the highest dry flower yield (Figure 9e,f). However, the spots with the lowest PPFD overlapped with the lowest dry flower yield, especially under AP67. Based on the light intensity and the yield per m2 (272 g m−2 under SOL and 289 g m−2 under AP67) a Photon Conversion Efficacy (PCE) of 0.05 g mol−1 under SOL and 0.06 g mol−1 under AP67 was achieved.

4. Discussion

This is the first study investigating interactions between flower position, light spectrum and plant density in C. sativa. Significant differences in plant growth parameters, dry matter accumulation, and yield were observed between the different light spectra. Specifically, plants under AP67 showed increased plant height, more nodes, longer branches, and a greater number of branches per plant than those under SOL. Main stem, branch stems, main leaves, and branch leaves showed continuous dry matter accumulation up to 71 DAP, with AP67 resulting in significantly increased biomass accumulation. Dry flower yield and main top bud (MTB) yield were significantly higher under AP67, with the last ten days being the critical period when significant spectral influences on dry flower yield, due to the lower R: FR ratio, became evident. Cannabinoid concentrations were influenced by flower position, with MTBs and side top buds (STBs) having significantly higher concentrations than side buds (SBs). CBD concentration was higher under SOL than AP67 in the SBs and STBs. The CBDA concentration was only significantly influenced by flower position, increasing in SB < STB < MTB. In contrast, the CBD + CBDA concentration was significantly affected by density, and higher densities resulted in higher concentrations. Terpene concentrations varied between flower positions and were influenced by the light spectrum, with SOL leading to higher concentrations of total terpenes and monoterpenes compared to AP67. Sesquiterpenes were not significantly affected by light spectra. Lower plant densities (LDs) led to higher terpene concentrations, and higher densities (HDs) led to a more homogeneous distribution. Plant density significantly affected yield composition, with SBs under LD influenced considerably by the light spectrum, with a 21% greater flower yield under AP67. Overall, the light spectrum significantly influenced plant growth, dry matter accumulation, yield parameters, and cannabinoid and terpene concentrations, with complex interactions between flower position, light spectrum, and plant density.

4.1. Influence of Light

Light is one of the most important factors for the cultivation of Cannabis, as the spectral composition can affect morphology (Figure 3), yield (Figure 4) [27] and the accumulation of secondary metabolites (Table 5 and Table 6). PPFD is the gold standard in light experiments to measure light intensity, including wavelengths from 400 nm to 700 nm [32]. In our study, we used the relative Yield Photon Flux (rYPF) as a more refined measure of comparison. Relative YPF considers photons in the 400–700 nm range and weights each photon based on its efficacy in plant photosynthesis. This approach allows us to better capture the effects of different wavelengths on C. sativa cultivation [35], and overcomes some of the limitations associated with conventional PPFD measurements. Consequently, we opted for two LED spectra closely aligned in their rYPF within the PPFD range (Table 1). This decision allowed us to more clearly attribute the observed effects to light distribution within the plant stock and the resulting morphological changes.
Radiation triggers metabolic pathways through the activation of specific photoreceptors that are present in a variety of plant species. Therefore, results from other well-researched cultures can partly be transferred to C. sativa. For instance, several authors (e.g., [72,73]) attested a low R: FR ratio to increase biomass production while at the same time reducing the production of secondary metabolites. This aligns with our results, as AP67, with the lower R: FR ratio compared to SOL, led to an increase in biomass and a decrease in secondary metabolites, which aligns with previous studies using AP67 [26,27]. However, a recent study on C. sativa showed a 68% reduction in yield at an R: FR ratio of 1 compared with an R: FR of 11 [74], which is consistent with studies on Helianthus annuus L., which also showed a reduction of up to 20% at an R: FR of 0.3 [75]. Both studies demonstrated that the increased length growth, due to the low R: FR [25], resulted in competition between the reproductive organ and the stem and a decrease in dry flower yield. This is evident in the C. sativa plants of [74]. Additionally, a low R: FR of 0.3 was found to restrict nitrogen assimilation in Triticum aestivum L. [76]. Under our R: FR of 3.7 (Figure 5) the increased length growth was not as pronounced as in [74], so we can argue that there was no competition between the reproductive organ and the stem, but rather the positive influence of the less compact growth habit resulting in better light penetration and light utilisation (Figure 9c), which led to an increase in dry flower yield. Hence, we can confirm hypothesis 1 that the lower R: FR ratio of 3.7 increased plant height and higher biomass production and R: FR <1 can be detrimental to flower yield. Surprisingly, the effect of AP67 on increasing dry flower yield appears to be noticeable only in the last ten days of flowering (Figure 4). In addition to [27], who pointed out that the last four weeks were crucial to affect morphology with light, our results indicated a significant effect on morphology after induction of the short day (21 DAP) (Figure 3). Here, we hypothesise that due to the higher light intensity applied as [27], 1200 in this study compared to 650 PPFD in [27], the morphological changes based on spectral effect, especially due to the lower R: FR, manifested themselves more rapidly, as the effect of specific wavelengths on the primary metabolism change with the light intensity [54].
One key driving force of secondary metabolism is light intensity and spectra, especially for the synthesis of monoterpenes, as the responsible DOXP/MEP pathway is light-dependent [77,78] contrary to the MAV pathway, which synthesises sesquiterpenes [79]. This was proven for C. sativa and is in line with our study, as the light treatments did not significantly influence the concentration of sesquiterpenes, whereas significant changes were noticeable for monoterpenes (Table 6).
The SOL spectrum exhibited a higher proportion of green light and more uniform average illumination, along with higher average PPFD levels due to more homogenous growth (Figure 9). Surprisingly, no significant difference in CBD + CBDA concentration between SOL and AP67 was observed (Figure 7b), indicating that light intensity may play a lesser role in cannabinoid formation. This finding aligns with previous studies by [10], [80] and recently [81], which suggested that overall light intensity may not be strongly associated with increased cannabinoid production. Instead, the higher concentration of terpenes under SOL (Figure 8d) could be attributed to its higher share of green light. Green light is known to penetrate deeper into the canopy due to its lower absorbance [57], positively influencing growth, yield, and secondary metabolites [58,59], especially under high light intensities [56,60]. Moreover, the effects of green light on these factors can be more significant than those of red light [54]. The short-wavelength green light at 510 nm could be responsible for these effects [55], as a peak at 510 nm not only increased transpiration rate and stomatal conductance in Lactuca sativa, but also increased photosynthetic rates, especially at higher light intensities.
Although green light shows promise for enhancing cannabinoid concentration in C. sativa, its exact influences are not yet entirely conclusive [34,82]. However, a positive effect of additional green light, with a peak at 510 nm, on terpenes and cannabinoids was already detectable under a relatively low light intensity of 500 PPFD [53]. A possible explanation for the potential negative impact on THC in [34] could be related to the use of mostly longer green wavelengths (<530 nm), which have been found to have less impact on enhancing photosynthetic rates compared to 510 nm [55]. The same can be applied to [81], where an increase in green content to 40%, at 1200 PPFD, showed a higher light use efficiency and a higher photosynthetic rate than the light spectra with less green content (20%). On the other hand, there was no effect on total cannabinoid content, but an increase in terpene content with higher green content. When comparing our light spectra SOL and AP67, there were notable differences in their PPFD levels in the green light region (Figure 10). Although both spectra shared the same proportion of 6.6% (500–510 nm) and 22.5% (500–530 nm), SOL exhibited significantly higher PPFD values in these specific areas, registering 45% higher values (30 and 104 PPFD, respectively). This green light content discrepancy could account for the elevated CBD content in the STBs (Figure 7b) and especially the terpene levels (Table 5).
Nevertheless, it is difficult to clarify whether green light is responsible for the higher cannabinoid concentration or whether an accumulation under SOL occurred due to the significantly lower total dry flower yield. This hypothesis is supported by the lack of a significant difference in CBD + CBDA yield, demonstrating that both spectra showed no significant difference in mg CBD + CBDA per plant. Thus, a dilution effect might have occurred under AP67, which has already been proven for C. sativa [10,26]. In addition, it is difficult to attribute the positive effect to green light alone. This is because the 510 nm peak light in [55] had a share of blue light, which could also be absorbed by phototropin, a blue light receptor. Therefore, hypothesis II, which states a positive effect of higher green light on cannabinoid and terpene concentrations, cannot be answered, as it is difficult to pinpoint positive effects on green light alone, as several photoreceptors may be activated and interact under full light spectra.

4.2. Interaction Between Light and Plant Density

The spectral effects observed in part one could be transferred to part two. Across all three factors (light, plant density, and flower position), SOL exhibited a trend towards reduced yield compared to AP67. A significant difference in total CBD + CBDA yield per m2 was not detected in both parts. The border plants (HDb) under both spectra yielded significantly less, particularly in the shaded flower positions (SBs and STBs). Conversely, plants exposed to the highest intensity in part two (HDm) achieved yield levels equivalent to those in part one (LD), as both were grown at the same PPFD levels. Hypothesis III, which states that a higher plant density decreases the individual yield per plant, can be partially confirmed, as especially the flower position SB was more shaded. However, no difference could be found between LD and HDm, grown under the same PPFD levels, regarding the yield of individual plants. However, the marginal plants (HDb) showed a significant yield decrease in both spectra at positions STB and SB. We suspect this is due to the significantly lower PPFD levels in the border area.
Concerning secondary metabolism, no significant effects or interactions were observed between density categories and light spectra on CBDA concentration. In contrast, CBD + CBDA concentration was significantly affected by density, and higher densities resulted in higher concentrations. The flower positions revealed a significant discrepancy in accumulation, with notably lower concentrations in SBs, aligning with part two and previous findings [26]. In contrast to the CBD + CBDA concentration, a significant two-way interaction was found for the concentration of total terpenes and monoterpenes between density and flower position. Nevertheless, the terpene concentration should be interpreted with the average PPFD distribution in part two (Figure 9a–d). SOL consistently demonstrated higher terpene concentrations in both the lower density (LD) categories and across the two higher density categories (HDm, HDb) (Figure 8d). AP67 and SOL exhibited a concentration gradient following the sequence LD > HDm > HDb. This gradient implies that the reduction in light intensity due to shading from neighbouring plants was associated with a decrease in monoterpene concentration. This outcome aligns with the expected light-dependent nature of the monoterpene synthase pathway. The higher terpene concentration under SOL can be attributed to its provision of a more average PPFD distribution, as evidenced in Figure 9. When examining the point with the highest light intensity and correlating it with the terpenes accumulated in the MTB-HDm, a shift in the concentration gradient became evident under SOL. Instead of the previously observed LD > HDm > HDb pattern, the gradient is altered to HDb > LD > HDm. This shift might indicate light stress, limiting terpene synthesis in MTB, which even the higher green content in SOL could not mitigate [63]. While a higher overall light intensity tends to enhance the MEP pathway [77], it is essential to note that terpene emission can be considerably downregulated under excessive light conditions [83]. Given our cultivation conditions with ambient CO2 levels, we assume that the light intensity of 1200 PPFD was excessive. This theory is supported by the observation that the area with the highest yield did not coincide with the zone of maximum PPFD but rather fell within the range of 900–1000 PPFD (Figure 9), leading us to reject Hypothesis IV that within the plant stock, the area with the highest light intensity is reflected in increased yields and secondary metabolite concentrations. In addition, the excessive light theory provides an understanding of why under SOL, in the LD and HDm categories, the highest terpene concentrations were found in the STBs and not in the higher, better-lit MTBs. Interestingly, the border plants (HDb) under the lower PPFD levels showed the highest concentrations in the MTBs. This observation reinforces the idea that, in both LD and HDm scenarios under SOL, the light intensity in the upper part of the plant at 1200 PPFD may have been too high, having a potential adverse effect on terpene concentration in the highest flower position (MTB).
According to Vanhove et al. [84], the impact of plant density on dry flower yield depends on the specific strain. In the context of C. sativa, it was shown that terpene concentration decreases with increasing plant densities [85]; in addition, the heterogeneity concerning secondary metabolites in the flower positions increases [28]. Our findings align with the observations of [84,85], where a lower plant density also led to a higher dry flower yield per plant than the border plants and higher total terpene concentration, respectively. Furthermore, this study supports that CBDA concentration is not influenced by plant density, consistent with previous findings by [84], although different from recent results [28]. However, when looking at the total cannabinoid concentration, plant density has a positive influence, whereby a higher plant density has a higher CBD + CBDA concentration.
In addition, the experiment allows us to develop spectral theories further, particularly with the green spectrum. Despite the more compact growth with comparable leaf area and the potentially more substantial shading of SB, there was a significant increase in monoterpene content under SOL compared to AP67 (Table 5). A higher green light content and an improved light penetration of green light due to its lower absorbance [57] could be responsible for this. However, as this effect could also be due to an interaction between light intensity and morphology, we cannot fully confirm hypothesis IV, that the positive effects of green light on secondary metabolites are more pronounced at high plant densities and shaded flower positions.

4.3. Practical Application

Both light spectra and light sources play an important role in any C. sativa cultivation system. Our results underline the importance of considering light intensity and scattering, as these factors significantly influence final terpene concentrations and flower yield. Increased light intensities correlate with decreased terpene levels and decreased efficacy in plant organs closer to the light source. It should be noted that our PCE was four times lower than [35,81]. We attribute this to our fertilisation, as we did not use a pre-fertilised substrate or fertigation to achieve comparable fertilisation under both light spectra detached from water consumption. Conversely, the reduced cannabinoid and terpene concentrations in shaded SBs due to lower light intensities (Figure 8) could be managed by pruning techniques such as topping or partial defoliation to increase light penetration into the canopy. In terms of intensity, our study, using the same KAN strain as [26] but with an intensity of 1200 compared to 650 PPFD and adapted nutrition, reached a 2.8-fold yield increase compared to [26], aligning with findings by [10,38]. Remarkably, both cannabinoid and terpene concentrations also increased. We can, therefore, conclude that light intensity is the key factor in increasing yield, secondary metabolites and even flower compactness [81]. Inter-canopy lighting could be an alternative solution, especially with the ability to dim LED light sources and their low heat dissipation, allowing a little difference between top and inter-canopy PPFD levels.
Based on the results of previous C. sativa experiments and the findings of our study, a light spectrum that combines an R: FR ratio in the range of 3.7 with a significant proportion of short wavelength green light (>530 nm) and a high blue content appears promising for achieving uniformly structured plants with consistently high secondary metabolite concentrations. In addition, a higher proportion of FR correlates with an increase in yield during the last ten days of flowering, providing a basis for applying different spectra throughout the growth stages. Considering the average bottom light distribution under SOL (Figure 9d), it seems plausible that plant density can be increased up to 16 plants per m2 to achieve the same PPFD at the substrate level as under AP67. This could compensate for the reduction in yield per plant and equalise the flower yield per m2 between SOL and AP67. This increase in density could potentially raise the CBD + CBDA concentration as the higher density (HDm and HDb) significantly increased CBD + CBDA concentration in this study (Table 5). This is particularly important as growers are paid in % CBD per kg. As no differences in CBD + CBDA yield (mg m2) were found between the spectra (Table 5), it seems logical to choose SOL and increase the plant density to obtain a high dry flower yield and concentration of secondary metabolites per m2.

5. Conclusions

Light is one of the most important factors for cultivating C. sativa, as intensity and spectral composition affect the entire plant. Concerning spectral effects, the higher the intensity, the more pronounced the effect. In addition, a low R: FR ratio of 3.7 seems to increase yield significantly in the last ten days of flowering. However, more trials are needed to further determine the timing at which higher FR content provides benefits up to the final harvest. The positive impact of green light can neither be invalidated nor confirmed. However, the groundbreaking research by [81], which found that white light with distinct peaks at 640 and 660 nm could increase dry flower yield and light use efficiency, lays the groundwork for future research on lighting with distinct peaks of short green wavelength. In our study, the CBDA concentration was not density-dependent compared to the terpenes. Here, the apparent influence of light intensity, which is responsible for the heterogeneous distribution over all flower positions, was seen. Furthermore, the 1200 PPFD in our cultivation system seemed excessive, which was reflected in a significantly lower terpene concentration in the MTBs in the density category LD. We hypothesise that although photosynthetic rates increased up to 1200 PPFD in our ambient CO2 conditions, we could not create an optimal microclimate to facilitate these intensities, which is also reflected in the lower efficacy of the lamps with increasing intensity. Based on our results, we can assume that the light intensity must be adjusted to the existing cultivation system and that excessive light intensities will be reflected in reduced yield and secondary metabolites. Light is a controversial issue in C. sativa since, up to recently, mainly full spectral lamps have been used, making it challenging to isolate single spectral effects and leading to conflicting results. However, results based on monochromatic lights are being applied increasingly in current publications but do not yet cover all spectra and secondary metabolites. Therefore, a primary focus of future research should be on monochromatic lights and the associated photosynthetic rate.

Author Contributions

Conceptualization, P.R., S.M., and J.H.; Data curation, P.R.; Formal analysis, J.H.; Funding acquisition, S.G.-H.; Methodology, P.R. and S.M.; Project administration, S.G.-H.; Resources, P.R.; Software, P.R. and J.H.; Supervision, S.G.-H.; Validation, J.H.; Visualization, P.R.; Writing—original draft, P.R.; Writing—review and editing, S.M., J.H., and S.G.-H. All authors have read and agreed to the published version of the manuscript.

Funding

This research was funded by the German Federal Ministry for Economic Affairs and Energy within the Central Innovation Program for SMEs (16KN089625).

Data Availability Statement

Data is contained within the article.

Acknowledgments

Special mention goes to Melissa Wannenmacher for her excellent assistance and outstanding Master’s thesis. We thank the greenhouse staff for their indispensable support in the agronomic management of the experiment.

Conflicts of Interest

The authors declare no conflicts of interest.

Appendix A

Figure A1. (a) Number of leaf tips [n plant−1], (b) stem width [mm] and (c) mean internode length [cm] in dependence of days after planting (DAP). Error bars represent the standard deviation. Values are the average of SOL and AP67. Within each figure, values sharing the same letter do not differ significantly from each other (α = 0.05).
Agronomy 14 02565 g0a1
Figure A2. Specific leaf area [SLA, cm2/g DM] of (a) main leaves and (b) branch leaves and the dry flower yield [g DM/plant] of (c) STB and (d) SB in dependence of days after planting (DAP). Error bars represent the standard deviation. Within each figure, values sharing the same letter do not differ significantly from each other (α = 0.05).
Agronomy 14 02565 g0a2

References

  1. Eichhorn Bilodeau, S.; Wu, B.-S.; Rufyikiri, A.-S.; MacPherson, S.; Lefsrud, M. An Update on Plant Photobiology and Implications for Cannabis Production. Front. Plant Sci. 2019, 10, 296. [Google Scholar] [CrossRef] [PubMed]
  2. Aliferis, K.A.; Bernard-Perron, D. Cannabinomics: Application of Metabolomics in Cannabis (Cannabis sativa L.) Research and Development. Front. Plant Sci. 2020, 11, 554. [Google Scholar] [CrossRef] [PubMed]
  3. Desaulniers Brousseau, V.; Wu, B.-S.; MacPherson, S.; Morello, V.; Lefsrud, M. Cannabinoids and Terpenes: How Production of Photo-Protectants Can Be Manipulated to Enhance Cannabis sativa L. Phytochemistry. Front. Plant Sci. 2021, 12, 620021. [Google Scholar] [CrossRef] [PubMed]
  4. Danziger, N.; Bernstein, N. Light matters: Effect of light spectra on cannabinoid profile and plant development of medical cannabis (Cannabis sativa L.). Ind. Crop. Prod. 2021, 164, 113351. [Google Scholar] [CrossRef]
  5. Akvilė, V.; Margit, O.; Pavelas, D. LED Lighting in Horticulture. In Light Emitting Diodes for Agriculture; Springer: Singapore, 2017; pp. 113–147. [Google Scholar]
  6. Livingston, S.J.; Quilichini, T.D.; Booth, J.K.; Wong, D.C.J.; Rensing, K.H.; Laflamme-Yonkman, J.; Castellarin, S.D.; Bohlmann, J.; Page, J.E.; Samuels, A.L. Cannabis glandular trichomes alter morphology and metabolite content during flower maturation. Plant J. 2020, 101, 37–56. [Google Scholar] [CrossRef]
  7. Fellermeier, M.; Zenk, M.H. Prenylation of olivetolate by a hemp transferase yields cannabigerolic acid, the precursor of tetrahydrocannabinol. FEBS Lett. 1998, 427, 283–285. [Google Scholar] [CrossRef]
  8. Chen, F.; Tholl, D.; Bohlmann, J.; Pichersky, E. The family of terpene synthases in plants: A mid-size family of genes for specialized metabolism that is highly diversified throughout the kingdom. Plant J. 2011, 66, 212–229. [Google Scholar] [CrossRef]
  9. Karunanithi, P.S.; Zerbe, P. Terpene Synthases as Metabolic Gatekeepers in the Evolution of Plant Terpenoid Chemical Diversity. Front. Plant Sci. 2019, 10, 1166. [Google Scholar] [CrossRef]
  10. Rodriguez-Morrison, V.; Llewellyn, D.; Zheng, Y. Cannabis Yield, Potency, and Leaf Photosynthesis Respond Differently to Increasing Light Levels in an Indoor Environment. Front. Plant Sci. 2021, 12, 646020. [Google Scholar] [CrossRef]
  11. Kawoosa, T.; Singh, H.; Kumar, A.; Sharma, S.K.; Devi, K.; Dutt, S.; Vats, S.K.; Sharma, M.; Ahuja, P.S.; Kumar, S. Light and temperature regulated terpene biosynthesis: Hepatoprotective monoterpene picroside accumulation in Picrorhiza kurrooa. Funct. Integr. Genom. 2010, 10, 393–404. [Google Scholar] [CrossRef]
  12. Saloner, A.; Bernstein, N. Nitrogen supply affects cannabinoid and terpenoid profile in medical cannabis (Cannabis sativa L.). Ind. Crop. Prod. 2021, 167, 113516. [Google Scholar] [CrossRef]
  13. Klepzig, K.D.; Kruger, E.L.; Smalley, E.B.; Raffa, K.F. Effects of biotic and abiotic stress on induced accumulation of terpenes and phenolics in red pines inoculated with bark beetle-vectored fungus. J. Chem. Ecol. 1995, 21, 601–626. [Google Scholar] [CrossRef] [PubMed]
  14. Chen, X.; Fedrizzi, B.; Kilmartin, P.A.; Quek, S.Y. Development of volatile organic compounds and their glycosylated precursors in tamarillo (Solanum betaceum Cav.) during fruit ripening: A prediction of biochemical pathway. Food Chem. 2021, 339, 128046. [Google Scholar] [CrossRef] [PubMed]
  15. Gershenzon, J. Metabolic costs of terpenoid accumulation in higher plants. J. Chem. Evol. 1994, 20, 1281–1328. Available online: https://docksci.com/metabolic-costs-of-terpenoid-accumulation-in-higher-plants_5cec1aebd64ab23b6f2b7a79.html (accessed on 23 August 2022). [CrossRef]
  16. Barcaccia, G.; Palumbo, F.; Scariolo, F.; Vannozzi, A.; Borin, M.; Bona, S. Potentials and Challenges of Genomics for Breeding Cannabis Cultivars. Front. Plant Sci. 2020, 11, 573299. [Google Scholar] [CrossRef]
  17. Hillig, K.W. Genetic evidence for speciation in Cannabis (Cannabaceae). Genet. Resour. Crop. Evol. 2005, 52, 161–180. [Google Scholar] [CrossRef]
  18. Small, E. Evolution and Classification of Cannabis sativa (Marijuana, Hemp) in Relation to Human Utilization. Bot. Rev. 2015, 81, 189–294. [Google Scholar] [CrossRef]
  19. Romero, P.; Peris, A.; Vergara, K.; Matus, J.T. Comprehending and improving cannabis specialized metabolism in the systems biology era. Plant Sci. 2020, 298, 110571. [Google Scholar] [CrossRef]
  20. Saloner, A.; Bernstein, N. Nitrogen Source Matters: High NH4/NO3 Ratio Reduces Cannabinoids, Terpenoids, and Yield in Medical Cannabis. Front. Plant Sci. 2022, 13, 830224. [Google Scholar] [CrossRef]
  21. Saloner, A.; Bernstein, N. Response of Medical Cannabis (Cannabis sativa L.) to Nitrogen Supply Under Long Photoperiod. Front. Plant Sci. 2020, 11, 572293. [Google Scholar] [CrossRef]
  22. Danziger, N.; Bernstein, N. Plant architecture manipulation increases cannabinoid standardization in ‘drug-type’ medical cannabis. Ind. Crop. Prod. 2021, 167, 113528. [Google Scholar] [CrossRef]
  23. Crispim Massuela, D.; Hartung, J.; Munz, S.; Erpenbach, F.; Graeff-Hönninger, S. Impact of Harvest Time and Pruning Technique on Total CBD Concentration and Yield of Medicinal Cannabis. Plants 2022, 11, 140. [Google Scholar] [CrossRef] [PubMed]
  24. Morello, V.; Brousseau, V.D.; Wu, N.; Wu, B.-S.; MacPherson, S.; Lefsrud, M. Light Quality Impacts Vertical Growth Rate, Phytochemical Yield and Cannabinoid Production Efficiency in Cannabis sativa. Plants 2022, 11, 2982. [Google Scholar] [CrossRef] [PubMed]
  25. Casal, J.J. Photoreceptor Signaling Networks in Plant Responses to Shade. Annual Review of Plant Biology. Annu. Rev. Plant Biol. 2013, 64, 403–427. [Google Scholar] [CrossRef] [PubMed]
  26. Reichel, P.; Munz, S.; Hartung, J.; Kotiranta, S.; Graeff-Hönninger, S. Impacts of Different Light Spectra on CBD, CBDA and Terpene Concentrations in Relation to the Flower Positions of Different Cannabis sativa L. Strains. Plants 2022, 11, 2695. [Google Scholar] [CrossRef]
  27. Reichel, P.; Munz, S.; Hartung, J.; Präger, A.; Kotiranta, S.; Burgel, L.; Schober, T.; Graeff-Hönninger, S. Impact of Three Different Light Spectra on the Yield, Morphology and Growth Trajectory of Three Different Cannabis sativa L. Strains. Plants 2021, 10, 1866. [Google Scholar] [CrossRef]
  28. Danziger, N.; Bernstein, N. Too Dense or Not Too Dense: Higher Planting Density Reduces Cannabinoid Uniformity but Increases Yield/Area in Drug-Type Medical Cannabis. Front. Plant Sci. 2022, 13, 713481. [Google Scholar] [CrossRef]
  29. Harrison, E.L.; Arce Cubas, L.; Gray, J.E.; Hepworth, C. The influence of stomatal morphology and distribution on photosynthetic gas exchange. Plant J. 2020, 101, 768–779. [Google Scholar] [CrossRef]
  30. Bugbee, B. Toward an optimal spectral quality for plant growth and development: The importance of radiation capture. In Proceedings of the ISHS Acta Horticulturae 1134: VIII International Symposium on Light in Horticulture, East Lansing, MI, USA, 22–26 May 2016; pp. 1–12. [Google Scholar] [CrossRef]
  31. Inada, K. Action spectra for photosynthesis in higher plants. Plant Cell Physiol. 1976, 17, 355–365. [Google Scholar] [CrossRef]
  32. McCree, K.J. The action spectrum, absorptance and quantum yield of photosynthesis in crop plants. Agricultural Meteorology. Agric. Meteorol. 1971, 9, 191–216. [Google Scholar] [CrossRef]
  33. Lundegårdh, H. Action Spectra and the Role of Carotenoids in Photosynthesis. Physiol. Plant. 1966, 19, 754–769. [Google Scholar] [CrossRef]
  34. Magagnini, G.; Grassi, G.; Kotiranta, S. The Effect of Light Spectrum on the Morphology and Cannabinoid Content of Cannabis sativa L. Med. Cannabis Cannabinoids 2018, 1, 19–27. [Google Scholar] [CrossRef] [PubMed]
  35. Westmoreland, F.M.; Kusuma, P.; Bugbee, B. Cannabis lighting: Decreasing blue photon fraction increases yield but efficacy is more important for cost effective production of cannabinoids. PLoS ONE 2021, 16, e0248988. [Google Scholar] [CrossRef] [PubMed]
  36. Namdar, D.; Charuvi, D.; Ajjampura, V.; Mazuz, M.; Ion, A.; Kamara, I.; Koltai, H. LED lighting affects the composition and biological activity of Cannabis sativa secondary metabolites. Ind. Crop. Prod. 2019, 132, 177–185. [Google Scholar] [CrossRef]
  37. Cheng, X.; Wang, R.; Liu, X.; Zhou, L.; Dong, M.; Rehman, M.; Fahad, S.; Liu, L.; Deng, G. Effects of Light Spectra on Morphology, Gaseous Exchange, and Antioxidant Capacity of Industrial Hemp. Front. Plant Sci. 2022, 13, 937436. [Google Scholar] [CrossRef]
  38. Llewellyn, D.; Golem, S.; Foley, E.; Dinka, S.; Jones, A.M.P.; Zheng, Y. Indoor grown cannabis yield increased proportionally with light intensity, but ultraviolet radiation did not affect yield or cannabinoid content. Front. Plant Sci. 2022, 13, 974018. [Google Scholar] [CrossRef]
  39. Shinomura, T.; Uchida, K.; Furuya, M. Elementary processes of photoperception by phytochrome A for high-irradiance response of hypocotyl elongation in Arabidopsis. Plant Physiol. 2000, 122, 147–156. [Google Scholar] [CrossRef]
  40. Casal, J.J. Shade avoidance. Arab. Book 2012, 10, e0157. [Google Scholar] [CrossRef]
  41. Llorente, B.; D’Andrea, L.; Ruiz-Sola, M.A.; Botterweg, E.; Pulido, P.; Andilla, J.; Loza-Alvarez, P.; Rodriguez-Concepcion, M. Tomato fruit carotenoid biosynthesis is adjusted to actual ripening progression by a light-dependent mechanism. Plant J. 2016, 85, 107–119. [Google Scholar] [CrossRef]
  42. Endo, M.; Tanigawa, Y.; Murakami, T.; Araki, T.; Nagatani, A. PHYTOCHROME-DEPENDENT LATE-FLOWERING accelerates flowering through physical interactions with phytochrome B and CONSTANS. Proc. Natl. Acad. Sci. USA 2013, 110, 18017–18022. [Google Scholar] [CrossRef]
  43. Leivar, P.; Monte, E. PIFs: Systems integrators in plant development. Plant Cell 2014, 26, 56–78. [Google Scholar] [CrossRef] [PubMed]
  44. Chenge-Espinosa, M.; Cordoba, E.; Romero-Guido, C.; Toledo-Ortiz, G.; León, P. Shedding light on the methylerythritol phosphate (MEP)-pathway: Long hypocotyl 5 (HY5)/phytochrome-interacting factors (PIFs) transcription factors modulating key limiting steps. Plant J. 2018, 96, 828–841. [Google Scholar] [CrossRef] [PubMed]
  45. Li, Q.; Kubota, C. Effects of supplemental light quality on growth and phytochemicals of baby leaf lettuce. Environ. Exp. Bot. 2009, 67, 59–64. [Google Scholar] [CrossRef]
  46. Alokam, S.; Chinnappa, C.C.; Reid, D.M. Red/far-red light mediated stem elongation and anthocyanin accumulation in Stellaria longipes: Differential response of alpine and prairie ecotypes. Can. J. Bot. 2002, 80, 72–81. [Google Scholar] [CrossRef]
  47. Battle, M.W.; Jones, M.A. Cryptochromes integrate green light signals into the circadian system. Plant Cell Environ. 2020, 43, 16–27. [Google Scholar] [CrossRef]
  48. Smith, H.L.; McAusland, L.; Murchie, E.H. Don’t ignore the green light: Exploring diverse roles in plant processes. J. Exp. Bot. 2017, 68, 2099–2110. [Google Scholar] [CrossRef]
  49. Folta, K.M.; Maruhnich, S.A. Green light: A signal to slow down or stop. J. Exp. Bot. 2007, 58, 3099–3111. [Google Scholar] [CrossRef]
  50. Talbott, L.D.; Hammad, J.W.; Harn, L.C.; Nguyen, V.H.; Patel, J.; Zeiger, E. Reversal by green light of blue light-stimulated stomatal opening in intact, attached leaves of Arabidopsis operates only in the potassium-dependent, morning phase of movement. Plant Cell Physiol. 2006, 47, 332–339. [Google Scholar] [CrossRef]
  51. Talbott, L.D.; Nikolova, G.; Ortiz, A.; Shmayevich, I.; Zeiger, E. Green light reversal of blue-light-stimulated stomatal opening is found in a diversity of plant species. Am. J. Bot. 2002, 89, 366–368. [Google Scholar] [CrossRef]
  52. Frechilla, S.; Talbott, L.D.; Bogomolni, R.A.; Zeiger, E. Reversal of blue light-stimulated stomatal opening by green light. Plant Cell Physiol. 2000, 41, 171–176. [Google Scholar] [CrossRef]
  53. Hawley, D.; Graham, T.; Stasiak, M.; Dixon, M. Improving Cannabis Bud Quality and Yield with Subcanopy Lighting. HortScience 2018, 53, 1593–1599. [Google Scholar] [CrossRef]
  54. Terashima, I.; Fujita, T.; Inoue, T.; Chow, W.S.; Oguchi, R. Green light drives leaf photosynthesis more efficiently than red light in strong white light: Revisiting the enigmatic question of why leaves are green. Plant Cell Physiol. 2009, 50, 684–697. [Google Scholar] [CrossRef] [PubMed]
  55. Johkan, M.; Shoji, K.; Goto, F.; Hahida, S.; Yoshihara, T. Effect of green light wavelength and intensity on photomorphogenesis and photosynthesis in Lactuca sativa. Environ. Exp. Bot. 2012, 75, 128–133. [Google Scholar] [CrossRef]
  56. Liu, J.; van Iersel, M.W. Photosynthetic Physiology of Blue, Green, and Red Light: Light Intensity Effects and Underlying Mechanisms. Front. Plant Sci. 2021, 12, 619987. [Google Scholar] [CrossRef] [PubMed]
  57. Brodersen, C.R.; Vogelmann, T.C. Do changes in light direction affect absorption profiles in leaves? Funct. Plant Biol. 2010, 37, 403. [Google Scholar] [CrossRef]
  58. Kim, H.-H.; Goins, G.D.; Wheeler, R.M.; Sager, J.C. Green-light Supplementation for Enhanced Lettuce Growth under Red- and Blue-light-emitting Diodes. HortScience 2004, 39, 1617–1622. [Google Scholar] [CrossRef]
  59. Lanoue, J.; Little, C.; Hawley, D.; Hao, X. Addition of green light improves fruit weight and dry matter content in sweet pepper due to greater light penetration within the canopy. Sci. Hortic. 2022, 304, 111350. [Google Scholar] [CrossRef]
  60. Cao, B.; Lv, X.; Chen, Z.; Xu, K. Supplementing green light under strong sunlight improves growth and functional ingredients of ginger (Zingiber officinale Rosc.) in summer. Ind. Crop. Prod. 2021, 167, 113527. [Google Scholar] [CrossRef]
  61. Islam, M.J.; Ryu, B.R.; Azad, M.O.K.; Rahman, M.H.; Rana, M.S.; Kang, C.-W.; Lim, J.-D.; Lim, Y.-S. Comparative Growth, Photosynthetic Pigments, and Osmolytes Analysis of Hemp (Cannabis sativa L.) Seedlings under an Aeroponics System with Different LED Light Sources. Horticulturae 2021, 7, 239. [Google Scholar] [CrossRef]
  62. Liu, H.; Fu, Y.; Wang, M. Green light enhances growth, photosynthetic pigments and CO2 assimilation efficiency of lettuce as revealed by ‘knock out’ of the 480–560 nm spectral waveband. Photosynthetica 2017, 55, 144–152. [Google Scholar] [CrossRef]
  63. Sandmann, G. Antioxidant Protection from UV- and Light-Stress Related to Carotenoid Structures. Antioxidants 2019, 8, 219. [Google Scholar] [CrossRef] [PubMed]
  64. Orlando, M.; Trivellini, A.; Incrocci, L.; Ferrante, A.; Mensuali, A. The Inclusion of Green Light in a Red and Blue Light Background Impact the Growth and Functional Quality of Vegetable and Flower Microgreen Species. Horticulturae 2022, 8, 217. [Google Scholar] [CrossRef]
  65. Backer, R.; Schwinghamer, T.; Rosenbaum, P.; McCarty, V.; Eichhorn Bilodeau, S.; Lyu, D.; Ahmed, M.B.; Robinson, G.; Lefsrud, M.; Wilkins, O.; et al. Closing the Yield Gap for Cannabis: A Meta-Analysis of Factors Determining Cannabis Yield. Front. Plant Sci. 2019, 10, 495. [Google Scholar] [CrossRef] [PubMed]
  66. Sellaro, R.; Crepy, M.; Trupkin, S.A.; Karayekov, E.; Buchovsky, A.S.; Rossi, C.; Casal, J.J. Cryptochrome as a sensor of the blue/green ratio of natural radiation in Arabidopsis. Plant Physiol. 2010, 154, 401–409. [Google Scholar] [CrossRef] [PubMed]
  67. Sager, J.C.; Smith, W.O.; Edwards, J.L.; Cyr, K.L. Photosynthetic Efficiency and Phytochrome Photoequilibria Determination Using Spectral Data. Trans. ASAE 1988, 31, 1882–1889. [Google Scholar] [CrossRef]
  68. Honnold, R.; Kubas, R.; Macherone, A. Analysis of Terpenes in Cannabis Using the Agilent 7697A/7890B/5977B Headspace GC-MSD System; Agilent Application Notes; Agilent Technologies, Inc.: Santa Clara, CA, USA, 2017; p. 10. [Google Scholar]
  69. Jin, D.; Dai, K.; Xie, Z.; Chen, J. Secondary Metabolites Profiled in Cannabis Inflorescences, Leaves, Stem Barks, and Roots for Medicinal Purposes. Sci. Rep. 2020, 10, 3309. [Google Scholar] [CrossRef]
  70. Burgel, L.; Hartung, J.; Pflugfelder, A.; Graeff-Hönninger, S. Impact of Growth Stage and Biomass Fractions on Cannabinoid Content and Yield of Different Hemp (Cannabis sativa L.) Genotypes. Agronomy 2020, 10, 372. [Google Scholar] [CrossRef]
  71. Piepho, H.P.; Buchse, A.; Emrich, K. A Hitchhiker’s Guide to Mixed Models for Randomized Experiments. J. Agron. Crop. Sci. 2003, 189, 310–322. [Google Scholar] [CrossRef]
  72. Halliday, K.; Koornneef, M.; Whitelam, G. Phytochrome B and at Least One Other Phytochrome Mediate the Accelerated Flowering Response of Arabidopsis thaliana L. to Low Red/Far-Red Ratio. Plant Physiol. 1994, 104, 1311–1315. [Google Scholar] [CrossRef]
  73. Smith, H. Sensing the light environment: The functions of the phytochrome family. In Photomorphogenesis in Plants, 2nd ed.; Kendrick, R.E., Kronenberg, G.H.M., Eds.; Kluwer Academic Publishers: Dordrecht, The Netherlands, 1998; pp. 377–416. ISBN 978-0-7923-2551-2. [Google Scholar]
  74. Kotiranta, S.; Pihlava, J.-M.; Kotilainen, T.; Palonen, P. The morphology, inflorescence yield, and secondary metabolite accumulation in hemp type Cannabis sativa can be influenced by the R:FR ratio or the amount of short wavelength radiation in a spectrum. Ind. Crop. Prod. 2024, 208, 117772. [Google Scholar] [CrossRef]
  75. Libenson, S.; Rodriguez, V.; Pereira, M.L.; Sánchez, R.A.; Casal, J.J. Low Red to Far-Red Ratios Reaching the Stem Reduce Grain Yield in Sunflower. Crop. Sci. 2002, 42, 1180–1185. [Google Scholar] [CrossRef]
  76. Lei, K.; Hu, H.; Chang, M.; Sun, C.; Ullah, A.; Yu, J.; Dong, C.; Gao, Q.; Jiang, D.; Cao, W.; et al. A low red/far-red ratio restricts nitrogen assimilation by inhibiting nitrate reductase associated with downregulated TaNR1.2 and upregulated TaPIL5 in wheat (Triticum aestivum L.). Plant Physiol. Biochem. 2024, 206, 107850. [Google Scholar] [CrossRef]
  77. Mongélard, G.; Seemann, M.; Boisson, A.-M.; Rohmer, M.; Bligny, R.; Rivasseau, C. Measurement of carbon flux through the MEP pathway for isoprenoid synthesis by (31)P-NMR spectroscopy after specific inhibition of 2-C-methyl-d-erythritol 2,4-cyclodiphosphate reductase. Effect of light and temperature. Plant Cell Environ. 2011, 34, 1241–1247. [Google Scholar] [CrossRef]
  78. Srinath, M.; Shailaja, A.; Bindu, B.B.V.; Giri, C.C. Comparative analysis of biomass, ethrel elicitation, light induced differential MVA/MEP pathway gene expression and andrographolide production in adventitious root cultures of Andrographis paniculata (Burm. F.) Nees. Plant Cell Tiss. Organ Cult. 2022, 149, 335–349. [Google Scholar] [CrossRef]
  79. Vranová, E.; Coman, D.; Gruissem, W. Network analysis of the MVA and MEP pathways for isoprenoid synthesis. Annu. Rev. Plant Biol. 2013, 64, 665–700. [Google Scholar] [CrossRef]
  80. Potter, D.J.; Duncombe, P. The effect of electrical lighting power and irradiance on indoor-grown cannabis potency and yield. J. Forensic Sci. 2012, 57, 618–622. [Google Scholar] [CrossRef]
  81. Holweg, M.M.; Kaiser, E.; Kappers, I.F.; Heuvelink, E.; Marcelis, L.F.M. The role of red and white light in optimizing growth and accumulation of plant specialized metabolites at two light intensities in medical cannabis (Cannabis sativa L.). Front. Plant Sci. 2024, 15, 1393803. [Google Scholar] [CrossRef]
  82. Hawley, D. The Influence of Spectral Quality of Light on Plant Secondary Metabolism and Photosynthetic Acclimation to Light Quality. Ph.D. Thesis, University of Guelph, Guelph, ON, Canada, 2018. [Google Scholar]
  83. Behnke, K.; Kaiser, A.; Zimmer, I.; Brüggemann, N.; Janz, D.; Polle, A.; Hampp, R.; Hänsch, R.; Popko, J.; Schmitt-Kopplin, P.; et al. RNAi-mediated suppression of isoprene emission in poplar transiently impacts phenolic metabolism under high temperature and high light intensities: A transcriptomic and metabolomic analysis. Plant Mol. Biol. 2010, 74, 61–75. [Google Scholar] [CrossRef]
  84. Vanhove, W.; van Damme, P.; Meert, N. Factors determining yield and quality of illicit indoor cannabis (Cannabis spp.) production. Forensic Sci. Int. 2011, 212, 158–163. [Google Scholar] [CrossRef]
  85. André, A.; Leupin, M.; Kneubühl, M.; Pedan, V.; Chetschik, I. Evolution of the Polyphenol and Terpene Content, Antioxidant Activity and Plant Morphology of Eight Different Fiber-Type Cultivars of Cannabis sativa L. Cultivated at Three Sowing Densities. Plants 2020, 9, 1740. [Google Scholar] [CrossRef]
Figure 1. Experimental setup. (a) Distribution of the LEDs across the growing tables and replicates. Randomized distribution of the LEDs in parts one and two. (b) Plant distribution at the beginning of the experiment as an example for one table; parts one and two were randomised for each table. (c) Plant density and number of plants at the time of the final harvest with the distribution of the harvest highlighted.
Agronomy 14 02565 g001
Figure 2. PPFD per wavelength for SOL and AP67.
Agronomy 14 02565 g002
Figure 3. (a) Plant height [cm], (b) number of nodes [n plant−1], (c) mean branch length [cm], (d) number of branches [n plant−1], (e) leaf area (LA) [cm2 plant−1], and (f) specific leaf area [cm2 g DM−1] in dependence of days after planting (DAP) under the light sources SOL and AP67 for part one. Error bars represent the standard deviation. Within each figure, values sharing the same letter do not differ significantly from each other (α = 0.05). Upper-case letters compare means of the light treatments at the same DAP. Lower-case letters compare values between different DAP within one light treatment. The abbreviation ‘ns’ means ‘not significant’.
Agronomy 14 02565 g003
Figure 4. Dry matter [g DM/plant] of (a) the main stem, (b) the branch stems, (c) the main leaves, (d) the branch leaves, (e) the dry flower yield of main top buds (MTB), and (f) total dry flower yield in dependence of days after planting (DAP) under the light sources SOL and AP67. Error bars represent the standard deviation. Values sharing the same letter do not differ significantly from each other (α = 0.05). Upper-case letters compare values between light treatments within one DAP; lower-case letters compare values between different DAPs within one light treatment.
Agronomy 14 02565 g004
Figure 5. Pictures of representative plants of part two at the final harvest (a) grown under SOL (left) and AP67 (right) and final plant stock at the same height in part two (b) grown under SOL and (c) grown under AP67. The white bar indicates a length of 10 cm.
Agronomy 14 02565 g005
Figure 6. (a) Dry flower yield [g DM plant−1] for the light treatments SOL and AP67, the density categories LD, HDb, and HDm, and the flower positions MTB, STB, and SB with standard deviation. (b) Dry flower yield [g DM plant−1] for the density categories LD, HDb, and HDm and the flower positions MTB, STB and SB with standard deviation. Values sharing the same letter do not differ significantly from each other (α = 0.05). Upper-case letters compare values between different light treatments within one density category and within one flower position. The upper lower-case letters compare values between different density categories within one light treatment and within one flower position. The italic lower-case letters compare values between different flower positions within one light treatment and within one density category. The abbreviation ‘ns’ means ‘not significant’.
Agronomy 14 02565 g006
Figure 7. Concentration of (a) CBD [%] and (b) CBD and CBDA concentration in dependence on the light sources SOL and AP67, the flower positions MTB, STB and SB. Error bars represent the standard deviation. Values sharing the same letter do not differ significantly from each other (α = 0.05). Upper-case letters compare values between different light treatments within one flower position; the lower lower-case letters compare values between different flower positions within one light treatment. The abbreviation ‘ns’ means ‘not significant’.
Agronomy 14 02565 g007
Figure 8. Concentrations of the terpenes [µg g DW−1]. (a) Total terpenes, (b) monoterpenes, and (c) sesquiterpenes in dependence on density categories LD, HDm, and HDb and the flower positions MTB, STB, and SB. (d) Total terpenes in dependence on the light sources SOL and AP67, the flower positions, and density categories. Error bars represent the standard deviation. Values sharing the same letter do not differ significantly from each other (α = 0.05). Upper-case letters compare values between different density categories within one flower position; the lower-case letters compare values between different flower positions within one density category. The abbreviation ‘ns’ means ‘not significant’.
Agronomy 14 02565 g008
Figure 9. Average PPFD [µmol m−2 s−1] distribution in part two for (a) AP67 at canopy height, (b) SOL at canopy height, (c) AP67 at the soil surface, (d) SOL at the soil surface and the average dry flower yield [g plant−1] distribution in the square meter plot and the average dry flower yield [g plant-1] distribution in the square meter for (e) AP67 and (f) SOL.
Agronomy 14 02565 g009
Figure 10. PPFD per wavelength from 500 to 600 nm for SOL and AP67.
Agronomy 14 02565 g010
Table 1. Spectral characteristics in % of the two LED light sources, Solray385 (SOL) and AP67. R: FR photon ratios were calculated according to [66]. Relative Yield Photon Flux (rYPF) based on [67].
SOLAP67
% UV (<400 nm)20
% Blue (400–500 nm)1712
% Green (501–600 nm)3616
% Red (601–700 nm)4057
% Far Red (701–750 nm)315
rYPF (400–700 nm)0.880.87
R:FR ratio (650–670 nm/720–750 nm)12.93.7
B:G ratio0.50.8
B:R ratio0.470.21
Table 2. Nutrient concentrations of the modified Hoagland fertiliser solution [mg L−1].
NNO3-NNH4-N% NH4PKMgCaSFeZnCuBMoMn
200.0160.439.619.8247.0134.140.0155.536.51.500.0540.2150.1080.0540.269
Table 3. Days after planting (DAP) and the respective growing degree days (GDDs) for the destructive samplings in part one.
DAP15223650577182 (FH)
GDD23735157379991511461339
Table 4. DAP and the respective GDD for the non-destructive sampling.
DAP9142128354249566378
GDD13722033544755867078289810151267
Table 5. CBDA and CBD + CBDA concentration over parts 1 and 2 [%] and cannabinoid (CBD and CBDA) yield [mg m−2] of part two, according to the three flower positions MTB, STB, and SB and plant densities LD, HDb, HDm, and respective p-values. For CBD + CBDA yield, only part two between light spectra was compared, therefore density could not be taken into account. Within one column, values sharing the same letter do not differ significantly from each other (α = 0.05). The abbreviation ‘ns’ means ‘not significant’.
Factor CBDACBD + CBDACBD + CBDA Yield
[%]mg m−2
Flower positionMTB6.80 a7.13 a2248 c
STB6.57 a6.89 a9207 a
SB5.61 b5.88 b7051 b
LD6.14 ns6.42 b
DensityHDb6.40 ns6.71 a
HDm6.44 ns6.77 a
Flower position0.0010.0010.003
pLight spectra0.3540.0900.828
Density0.1450.011
Light   spectra   × position0.2740.3370.661
Light   spectra   × density0.9040.927
Position   × density0.4080.323
Light   ×   density   × position0.2570.482
Table 6. Terpene concentration [µg g DW−1] under the light sources SOL and AP67 in part two with p-values for the factors flower position, light treatment, and their interaction. For each factor within one column, values sharing the same letter do not differ significantly from each other (α = 0.05). The abbreviation ‘ns’ means ‘not significant’.
Factor Total TerpenesMonoterpenesSesquiterpenes
ug g DW−1
Light spectrumSOL1596 a1271 a390 ns
AP671045 b726 b383 ns
pFlower position0.0570.0690.044
Light spectra0.0040.0090.693
Density0.0010.0010.001
Light   spectra   × position0.5280.6120.175
Light   spectra   × density0.0660.0980.150
Position   × density0.0110.0190.005
Light   ×   density   × position0.0750.0880.538
Disclaimer/Publisher’s Note: The statements, opinions and data contained in all publications are solely those of the individual author(s) and contributor(s) and not of MDPI and/or the editor(s). MDPI and/or the editor(s) disclaim responsibility for any injury to people or property resulting from any ideas, methods, instructions or products referred to in the content.

