Article

Spectroscopy Technologies to Screen Peanut Seeds with Superior Vigor Through “Chemical Fingerprinting”

by
Gustavo Roberto Fonseca de Oliveira
1,
Welinton Yoshio Hirai
2,
Dennis Silva Ferreira
3,
Karolyne Priscila Oliveira Mota da Silva
1,
Giovani Chaves Silva
4,5,
Tiago Bueno Moraes
6,
Clissia Barboza Mastrangelo
7,
Fabiola Manhas Verbi Pereira
4,5,
Edenir Rodrigues Pereira-Filho
3 and
Edvaldo Aparecido Amaral da Silva
1,*
1
Department of Crop Science, School of Agricultural Sciences, São Paulo State University, Botucatu 18610-034, SP, Brazil
2
Department of Exacts Sciences, College of Agriculture “Luiz de Queiroz”, University of São Paulo, Piracicaba 13418-900, SP, Brazil
3
Group of Analytical Instrumental Analysis, Chemistry Department, Federal University of São Carlos, São Carlos 13565-905, SP, Brazil
4
Group of Alternative Analytical Approaches, Bioenergy Research Institute, Institute of Chemistry, São Paulo State University, Araraquara 14800-060, SP, Brazil
5
National Institute of Alternative Technologies for Detection Toxicological Assessment and Removal of Micropollutants and Radioactive Substances, Araraquara 14800-060, SP, Brazil
6
Department of Biosystems Engineering, College of Agriculture “Luiz de Queiroz”, University of São Paulo (USP), Piracicaba 13418-900, SP, Brazil
7
Laboratory of Radiobiology and Environment, Center for Nuclear Energy in Agriculture, University of São Paulo, Piracicaba 13416-000, SP, Brazil
*
Author to whom correspondence should be addressed.
Agronomy 2024, 14(11), 2529; https://doi.org/10.3390/agronomy14112529
Submission received: 31 August 2024 / Revised: 10 October 2024 / Accepted: 17 October 2024 / Published: 28 October 2024
(This article belongs to the Special Issue Agrotechnics in Seed Quality: Current Progress and Challenges)

Abstract

:
Peanut seeds are harvested at different development stages (early and late) due to their uneven maturation. At the time of harvest, approximately 30% of the seeds are still immature, meaning they are not completely filled with compounds (e.g., oil and minerals) and exhibit reduced vigor. Hypothetically, these compounds can be detected as a “chemical fingerprinting” to classify seed maturation stages. Here, we investigated whether non-destructive techniques such as benchtop nuclear magnetic resonance (NMR), laser-induced breakdown spectroscopy (LIBS), and energy-dispersive X-ray fluorescence (ED-XRF) can identify chemical patterns unique to mature seeds with superior vigor. Field-grown seeds were classified into early (R5 and R6) and late (R7, R8, and R9) stages. Seed weight, germination, vigor, H2O2, and MDA (oxidative stress) were analyzed. Oil, potassium (K), and calcium (Ca) were measured digitally using spectroscopy techniques. We found that: (i) oxidative stress and K levels were higher in seeds from the early stages; (ii) seed oil and Ca were proportional to high-vigor seedlings and successful plant establishment in the field; and (iii) the seed chemical composition could be identified autonomously with 87% to 100% accuracy. In conclusion, LIBS, ED-XRF, and NMR technologies can effectively screen peanut seeds with superior vigor through “chemical fingerprinting”.

Graphical Abstract

1. Introduction

The peanut is one of the most important legumes grown in the world [1]. Its crops produce kernels rich in protein, healthy fats, and essential minerals [2,3] while contributing to soil health (e.g., N-fixation and microbiome enhancement) and promoting sustainable agricultural practices [4]. Globally, peanut cultivation has increased, and it serves as a reliable nutritional food source in many regions [5,6]. In this context, seeds constitute the central basis of the peanut production chain, as they are the starting point for establishing the new crop cycle [7,8]. Therefore, seed performance (i.e., vigor) has great economic relevance since it is key for peanut-based products.
For peanuts to be harvested as efficiently as possible, the seeds must be fully mature, which means that they need to be sufficiently developed to have acquired the necessary vigor to generate new plants in the field [9,10]. Peanut development is divided into early (R5 and R6) and late (R7, R8 and R9) stages, which have remarkable physiological and chemical differences [11,12]. Firstly, seeds from the early stages are more immature, which means they do not tolerate desiccation, have limited storage time (low longevity), and have low vigor [13,14]. On the other hand, late-stage seeds are more mature, therefore having high viability after drying, and have a complete chemical composition (i.e., oil, sugars, and proteins), in addition to having superior vigor and longevity [9,11,15]. The greatest issue in the peanut production system is the unevenness of maturation. At the end of a best-scenario harvest cycle, around 30% of the seeds (Runner type) are in the early stages and 70% are in the late stages [8]. As a significant portion of the peanut harvest is immature, the implementation of fast, non-destructive, and portable technologies that optimize the selection of late-stage seeds would greatly benefit the peanut industry globally.
A strategic way to selectively screen late-stage seeds from early ones is to explore differences in their chemical composition [16,17]. This is because a diversity of compounds accumulates in an orderly manner during seed development, creating chemical reserves for future germination [11,18]. For example, oil constitutes around 48% of these reserves, acting as stored energy for peanut seedling growth [17,19]. Regarding mineral reserves, potassium (K) is one of the most abundant elements in peanut seeds and primarily functions in enzymatic activity, ionic homeostasis, and tolerance to oxidative stress [20,21]. Another important chemical element is calcium (Ca), which plays a general role in maintaining cell wall integrity and a specific role in the formation of peanut fruits and seeds [22,23]. Thus, considering the chemical differences during peanut seed development, we wonder the following: could we use non-invasive spectroscopy technologies to screen harvested peanut seeds into early and late stages based on oil content, K, and Ca? The hypothesis is that chemical changes occurring in the developing seed can be detected post-harvest as a “chemical fingerprint”. These “fingerprints” (data) generate unique patterns to classify peanut maturation stages.
In the field of spectroscopy, studies have shown that benchtop nuclear magnetic resonance (NMR), laser-induced breakdown spectroscopy (LIBS), and energy-dispersive X-ray fluorescence (ED-XRF) are promising techniques for detecting chemical compounds in plant tissues through digital and non-destructive methods [24,25]. For instance, the NMR technique is based on the interactions of electromagnetic radiation through radio frequencies with matter (i.e., parts of the plant), resulting in data about the oil content [26,27]. Regarding elemental chemical composition, LIBS analyzes the nutrient profile (i.e., Ca and K in kernels) with results that are quite consistent with destructive methods [28,29,30]. Another example is ED-XRF, which allows for the precise inspection of minerals without destroying the samples, through the fluorescence emitted by them when exposed to X-rays [31,32,33]. Additionally, by analyzing seed chemistry, the synergy between the data generated non-destructively by these techniques and computer logic (algorithms) could sustainably optimize seed analyses autonomously [34,35]. Here, we investigated whether techniques such as NMR, LIBS, and ED-XRF can identify chemical patterns unique to seeds with superior vigor (late stages).

2. Materials and Methods

2.1. Biomaterial

This research was conducted using peanut seeds (Arachis hypogaea L.) belonging to the cultivar IAC OL3 (Virginia Group, Runner type). We chose this cultivar because it is one of the most cultivated in Brazil due to its high yield.

2.2. Seed Production in the Field

The seeds were produced during the 2021/2022 growing season (November 2021 to March 2022, Lageado Experimental Farm, Brazil). The experimental area (1000 m2) had soil with a productive history of ruzigrass (Urochloa ssp.), cowpea, and soybean, in addition to soil characteristics of an Oxisol [36]. Soil samples were taken (0 to 20 cm layer) and the following attributes were analyzed: pH CaCl2: 5.69; organic matter: 25.76 g dm−3; P resin: 14.07 mg dm−3; H+Al3+: 33.54 mmolc dm−3; K: 1.85 mmolc dm−3; Ca: 22.95 mmolc dm−3; Mg: 9.48 mmolc dm−3; sum of bases: 34.27 mmolc dm−3; CTC: 67.82 mmolc dm−3; base saturation: 50.54%. Soil preparation consisted of plowing, rotary hoe, and harrowing operations. Additionally, dolomitic lime application (2 tons ha−1) and fertilization in the planting (120 kg ha−1 of a fertilizer with 4% nitrogen, 30% phosphorus pentoxide, and 10% potassium oxide) were implemented according to the guidelines for growing peanuts [37]. Temperature, relative humidity (RH), precipitation, and thermal sum were monitored throughout the plant cycle (Supplementary Figure S1) [38]. The seeds were categorized into five stages at harvest (R5, R6, R7, R8, and R9) and processed according to the detailed descriptions by [8]. The characteristics of each seed stage (R5–R9) are also presented in Supplementary Table S1. The seeds, with a moisture content of 7%, underwent the following analyses.

2.3. Seed Analysis

2.3.1. Seed Weight

Five replicates of 15 seeds from each development stage were used to determine weight (n = 375). The seeds were weighed on a precision analytical balance (0.0001 g).

2.3.2. Hydrogen Peroxide (H2O2)

H2O2 was quantified from three 100 mg samples for each stage. Each sample was obtained from 15 seeds of each development stage (n = 225) macerated in liquid N2. These were homogenized in 1 mL of 0.1% trichloroacetic acid (TCA) and centrifuged at 12,000 g-force, 4 °C, for 15 min. An aliquot of 0.075 mL of the supernatant was added to the reaction medium, consisting of 0.075 mL of 10 mmol L−1 potassium phosphate buffer solution (pH 7.0) and 0.150 mL of 1 mol L−1 potassium iodide (KI) solution. The mixture was incubated for one hour on ice without light. Then, the absorbance reading was performed on a spectrophotometer at 390 nm. The concentration of H2O2 was calculated using the standard curve at 1000 µmol mL−1. The results were expressed in µmol g−1 [39].

2.3.3. Lipid Peroxidation: Malondialdehyde (MDA)

MDA was quantified in three 100 mg samples. Each sample was obtained from 15 seeds of each development stage (n = 225) homogenized in 1 mL of 50 mmol L−1 phosphate buffer (pH 7.0) containing 0.67% TCA and centrifuged at 15,000 g-force, at 4 °C, for 15 min. Aliquots of 1.0 mL of the supernatants were added to 2.0 mL of 0.5% (m/v) 2-thiobarbituric acid (TBA) solution prepared in 20% TCA (m/v) and incubated at 90 °C for 20 min. Next, the reaction was halted by placing the mixture in an ice bath for 10 min. Following this, the samples were centrifuged at 15,000 g-force and 4 °C for 20 min. Absorbances were determined using a spectrophotometer at 532 and 660 nm. The acid concentration of MDA was calculated using the molar extinction coefficient of 155 mmol L−2 cm−1 and expressed as MDA nmol g−1 [40].

2.3.4. Seed Germination

A total of 125 seeds from each development stage, divided into five groups of 25 each, were utilized (n = 625). The seeds were initially pre-moistened on paper towels for 16 h, with 8 h in darkness at 20 °C followed by 8 h under light at 30 °C (Tubular Fluorescent Lamp 20W T1 with a fluence rate of 30 µmol m−2 s−1 at the bench level). The relative humidity in the chamber was 83%. After pre-moistening, the seed coats were removed, and the seeds were sterilized by soaking them in a 1% hypochlorite solution for 2 min. Subsequently, the seeds were arranged in rolled paper towels that had been dampened with deionized water (1: 2.5, g: mL). Seeds were kept at 20 °C for 12 h without light and at 30 °C for 12 h with light. Germination (radicle ≥ 2 mm) was evaluated 10 days after test installation [8].

2.3.5. Germination Rate

Seed vigor based on germination rate was evaluated with five replicates of 25 seeds from each development stage (n = 625). The seed coat removal and seed sterilization procedures mentioned above were adopted [8]. The paper roll germination test was installed as previously described (12 h without light at 20 °C/12 h with light at 30 °C). Following 24 h of setup, germination was assessed every 4 h, with radicle lengths of 2 mm or more being noted. The time required to achieve 50% germination (t50) was then determined using Germinator software 1.0 [41].

2.3.6. Normal Seedlings: The Strongest Ones

Five replicates of 25 seeds from each development stage (n = 625) were pre-moistened on paper towels for 16 h as previously described (8 h without light at 20 °C and 8 h with light at 30 °C). Next, the seed coat was manually removed, and the seeds were sterilized (1% sodium hypochlorite for 2 min) and subjected to the above-described germination test. After 10 days, the number of strong normal seedlings (i.e., perfectly formed shoot, presence of main root, and developed secondary roots) was determined. The results were expressed as a percentage [8,42].

2.3.7. Post-Storage Seed Germination

Five replicates of 25 seeds each (totaling 125 seeds from each development stage; n = 625) were placed on a 12 cm by 10 cm fabric screen, which was fastened with rubber bands to the top of a plastic container measuring 8.5 × 6.0 × 2.5 cm. This container was filled with a saturated sodium chloride solution. The hermetically closed box was kept at 35 °C and 75% relative humidity. After 71 days, the seeds had their seed coat removed, were sterilized, and were subjected to the germination test as previously described. The percentage of germination (radicle ≥ 2 mm) was evaluated at 10 days [8].

2.3.8. Seedling Length Analysis

A total of 50 seeds from each development stage, divided into five groups of 10, were utilized (n = 250). The sterilized seeds, with the seed coat removed as described earlier, were arranged on the top third of moistened paper under identical conditions to the germination test. Two rows of 10 seeds each were oriented with the hilum facing down. The paper rolls were then enclosed in transparent plastic bags, which were sealed with rubber bands. The material was kept at 20 °C for 12 h without light and at 30 °C for 12 h with light, as previously described. After 7 days, the total length of the shoot and root part of the seedlings was measured in centimeters [8].

2.3.9. Plant Establishment and Shoot Dry Weight

Five replicates of 20 seeds from each development stage (n = 500) were used. The seeds had been kept for 12 months at 10 °C and 55% relative humidity, without any chemical treatments, and with the seed coats intact. In the region where the seeds were cultivated, soil preparation was repeated as per the previously outlined methods, except for liming. Five parallel lines with a length of 1 m and spaced 90 cm from each other were made and the seeds were distributed equidistantly in the sowing furrow. A water application of about 15 mm was administered through spraying. The number of established plants was recorded 40 days after sowing, based on the appearance of the first fully developed leaves. The data were reported as the percentage of plants successfully established in the field. Furthermore, the shoots of the plants from each line were cut to evaluate the weight of each stand. The material was dried in an oven (60 °C/72 h) to obtain a constant weight in grams [8,42].

2.4. Spectroscopy Technologies

2.4.1. Nuclear Magnetic Resonance (NMR)

Analyses were conducted using five groups of 15 seeds from each development stage, totaling 375 seeds. The determination of oil content was performed using a non-destructive method by 1H time domain benchtop nuclear magnetic resonance (NMR) measurements, using an 11.3 MHz benchtop spectrometer, SLK-200 (SpinLock, Malagueño Córdoba, Argentina), equipped with a 30 mm probe, at 30 °C. Calibration curves were obtained by spin echo pulse sequence methodology, following the ISO 10565:1998 protocol (https://www.iso.org/obp/ui). The spin echo sequence was executed using 90° and 180° pulses of 9.0 and 19.0 μs, respectively, with an echo time of t = 4.0 ms and a recycle delay of 5 s, for a total of 16 scans, using cyclops phase cycling. The spin echo data were processed in OriginLab 9.0 software to extract the amplitudes for the calibration curve [43,44].

2.4.2. Laser-Induced Breakdown Spectroscopy (LIBS)

We examined 22 seeds from each development stage, totaling 110 seeds, using LIBS technology (Applied Spectra, model J200, Fremont, CA, USA). An Nd:YAG laser source emitting a laser pulse at 1064 nm was used for data acquisition. The detector was a charge-coupled device, and the laser pulse duration was around 10 nanoseconds. The spectrometer had six channels, with a resolution of 0.08–0.1 nm in channels 1 (186.940–311.195 nm) to 4 (591.426–693.690 nm), and a resolution of 0.11–0.14 nm in channels 5 (693.807–884.407 nm) and 6 (884.509–1042.026 nm). The settings on the equipment were as follows: (I) laser Nd:YAG with 1064 nm; (II) laser spot size of 50 µm; (III) delay time of 1.9 µs; and (IV) laser pulse energy of 53 mJ. A total of 2000 spectra were obtained using the raster analysis mode. The K and Ca emission lines obtained were identified with Aurora software version 1.0016 (Applied Spectra, West Sacramento, CA, USA). Microsoft Excel® version 2409 and MATLAB (R2019b, The Mathworks, Natick, MA, USA) were used to process the data [45]. The LIBS results obtained for K and Ca were expressed as emission signals in arbitrary units (a.u.).

2.4.3. Energy-Dispersive X-Ray Fluorescence (ED-XRF)

Analyses were conducted on 3 seeds per development stage, with a total of 15 seeds examined. A commercial ED-XRF spectrometer model NEX QC+ (Rigaku, Austin, TX, USA) equipped with an X-ray tube with an Ag target and a Be detection window that can be operated at a maximum voltage of 50 kV was used. The samples were analyzed separately under three different instrumental conditions: I) high atomic number (Ru to Pr and K to Br), 50 kV voltage, 10 μA current, and type B filter; II) intermediate atomic number (K to Mo and Sn to U), 30 kV voltage, 10 μA current, and type A filter; and III) low atomic number (Sn to U and Na to Cl), 6.5 kV voltage, 50 μA current, and no filter. The spectra generated covered the range from 0 to 49.94 keV (resolution of 0.024 keV), resulting in the acquisition of 2048 energy channels (keV) for each of the specified instrumental conditions. The ED-XRF spectra obtained for K and Ca were expressed as emission signals in arbitrary units (a.u.) [46].

2.5. Statistical Analysis

2.5.1. ANOVA

The data were examined using a fully randomized design that included five development stages (R5, R6, R7, R8, and R9). The number of replicates was variable according to the seed analysis. Analysis of variance (ANOVA) was then performed on the data. Means were compared using the Scott Knott test with a probability of 5%. The analyses were conducted using R software version 4.4.1 [47].

2.5.2. Principal Component Analysis and Correlation

The data were subjected to principal component analysis (PCA). The data obtained by the following techniques—ED-XRF, LIBS, and NMR—were highlighted, along with conventional physical characteristics data such as seed weight, which were evaluated for their ability to differentiate between early stages (R5 and R6) and later stages (R7, R8, and R9). Following this, the data underwent correlation analysis using the Spearman method, with the focus on variables observed in the PCA being preserved as described. R software version 4.4.1 was used for the analyses [47].

2.5.3. Quadratic Discriminant Analysis (QDA) and Confusion Matrix

The QDA method was used to classify the qualitative responses of the seed maturation into early and late stages [48,49]. The data were grouped into these two scenarios based on the results obtained with PCA analyses. The combinations of predictor variables for the different models were related to the different technologies studied, such as LIBS with K + Ca (first model); ED-XRF with K + Ca (second model); and NMR with weight and seed oil (third model). The confusion matrix was calculated from the values predicted by the QDA models about the classification responses of the two groups (early and late stages). The sample sizes used with data from each technology were: (i) n = 110 (LIBS); (ii) n = 15 (ED-XRF); and (iii) n = 75 (NMR). The results were expressed in percentage precision values (marginal to the real classification values) of the supervised models, and scatter plots to visualize the hit-and-miss patterns of the groups [50]. R software version 4.4.1 was used [47].

3. Results

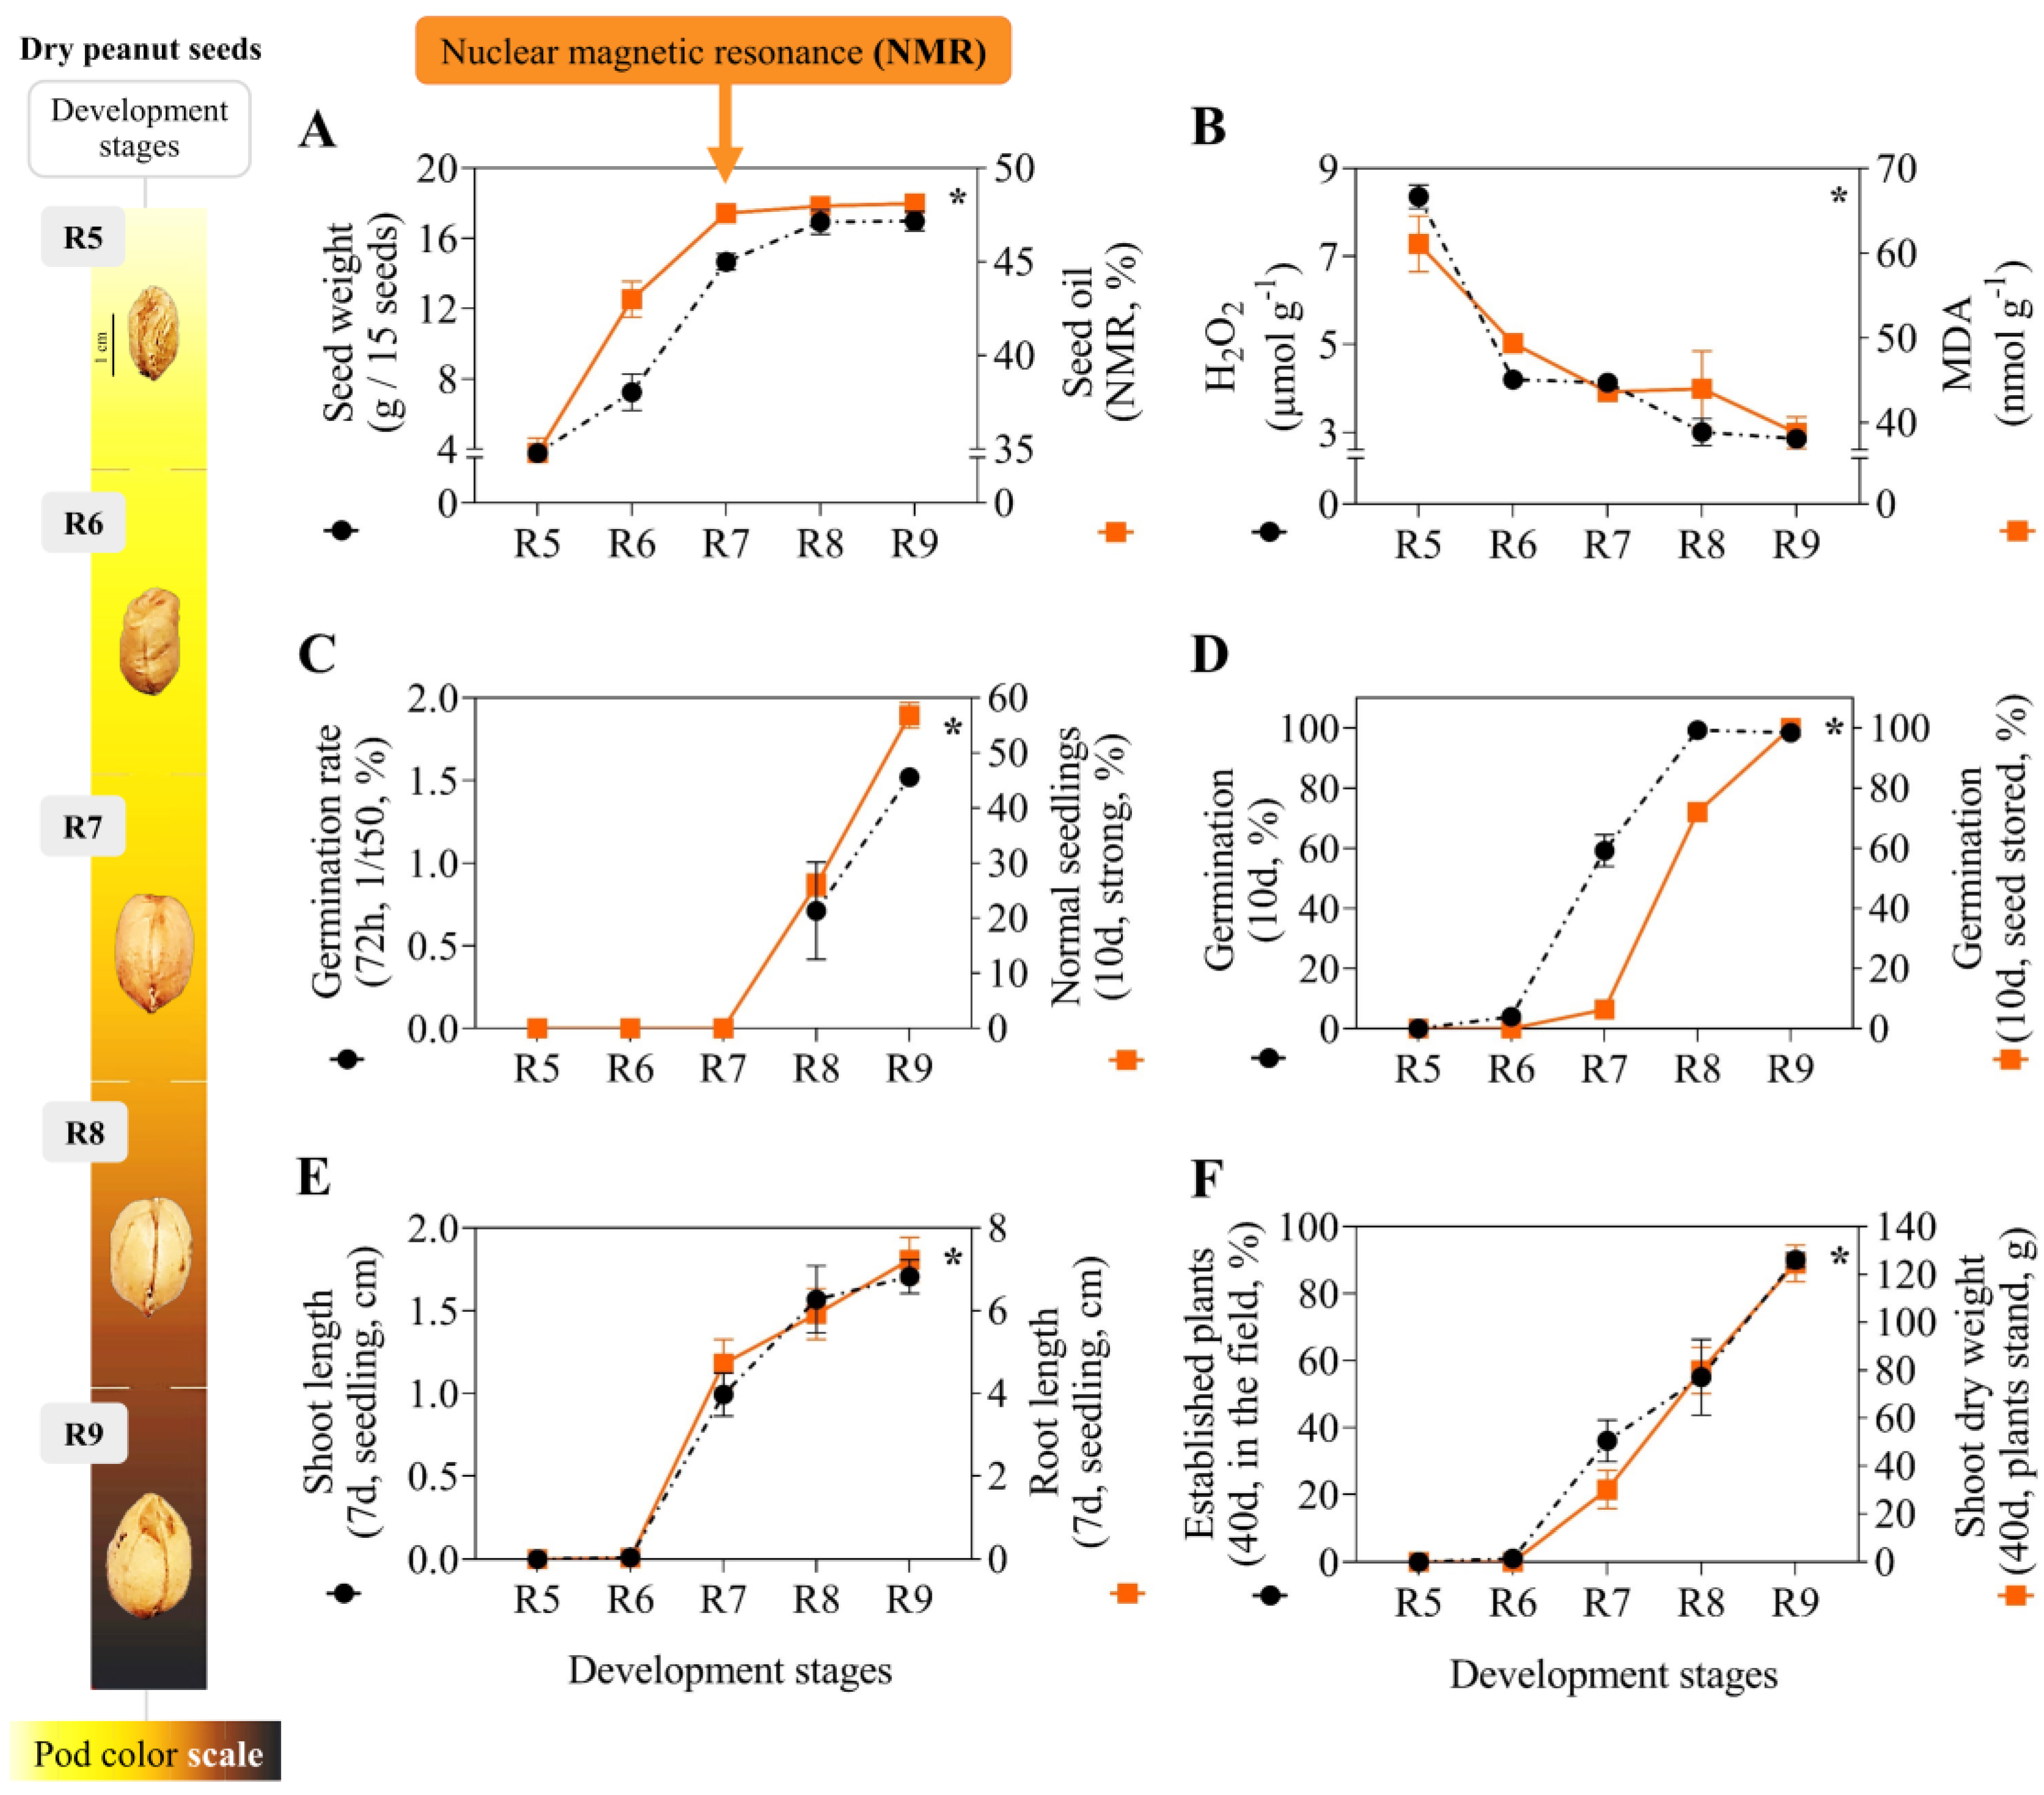
3.1. Physical, Chemical, Physiological Parameters and Oxidative Stress

Seeds from the early and late stages showed distinct weight and oil content (Figure 1A). Oil accumulation occurred up to the point of stability at the R7 stage (mass maturity). The seeds from stages R5 and R6 had diminished weights (3.8 g and 7.2 g, respectively) and had lower oil content (34.9% and 42.9%, respectively). The maximum weight (~17 g in R8 and R9) and oil content (~48% in R7, R8, and R9) were observed at the late stages (Supplementary Table S2).
Changes in the oxidative status were dependent on seed maturity (Figure 1B), segregating the seeds into three groups for H2O2 concentration (Supplementary Table S2): (i) R5; (ii) R6 and R7; and (iii) R8 and R9. There was a gradual reduction in H2O2 as the seed development stages progressed. In the immature tissues (R5 stage), the levels of H2O2 (8.4 µmol g−1) and lipid peroxidation (MDA: 61.1 nmol g−1) were maximum. However, MDA values remained stable at around 38.8 to 49.3 nmol g−1 from stage R6 onwards (p-value > 0.05). In the R8 and R9 stages, the H2O2 results were minimal (around 3.0 µmol g−1) and without significant variations (Supplementary Table S2).
Seeds at the R9 stage germinated more quickly (72 h), which highlighted their superior vigor (Figure 1C; Supplementary Table S2). The maximum formation of strong normal seedlings (56.8%) was also exclusive to R9 stage seeds (Figure 1C). In the early stages (R5 and R6), germination was either absent or significantly reduced (0% and 4%, respectively), particularly after storage (Figure 1D). For seeds from the later maturation stages, the post-storage conditions were as follows: (i) at stage R7, germination was reduced from 59% to 6%; (ii) at stage R8, the reduction was from 99% to 72%; and (iii) at stage R9, there was no reduction and germination was 100%. Overall, seed vigor throughout storage was significantly higher for the late stages (Supplementary Table S2).
The early-stage seeds (R5 and R6) showed lower vigor, which was evident in the seedlings’ reduced growth performance (Figure 1E). For the later development stages, the lengths of shoots and roots were as follows: (i) stage R7, 0.9 cm and 4.7 cm; (ii) stage R8, 1.6 cm and 5.9 cm; and (iii) stage R9, 1.7 cm and 7.2 cm. The seeds from stages R5 and R6 did not produce any plants in the field after 40 days. The results for plant establishment and shoot dry weight at late stages were as follows, respectively: (i) stage R7, 36% and 30.1 g; (ii) 55% and 79.8 g; and (iii) 90% and 124.5 g. Exclusive to the R9 stage was the superior potential to start a new plant cycle in the field, with good performance sustained even following 12 months of seed storage (Supplementary Table S2).

3.2. LIBS and ED-XRF: Seed Minerals

Ca and K were the elements detected by both techniques with the potential to differentiate the peanut seed stages (Figure 2A,B). The signals were higher for Ca and lower for K as seed maturation advanced (Figure 2C,D).
Seeds at the early stages (R5 and R6) displayed consistent results, for Ca (393.366 nm) around 1580 and 1752 (a.u.), and for K (766.490 nm) around 17,830 and 15,510 (a.u.), respectively (Supplementary Table S2). The emission signals for Ca (393.366 nm) were at their highest in the late stages (R7, R8, and R9), with measurements varying from 2332 to 2722 (a.u.). The lowest emission signals detected for K (766.490 nm) were from stages R8 and R9 (4651 and 5952 (a.u.), respectively) (Figure 2C) (Supplementary Table S2). The mineral patterns detected with the ED-XRF technique were very similar to those observed with LIBS; i.e., they were lower emission signals for Ca (Kα: 3.691 keV) and higher for K (Kα: 3.313 keV). However, although stage R5 showed the highest K signal for LIBS and ED-XRF, and stages R8 and R9 the lowest, groups R6 and R7 presented different intensity patterns when comparing both techniques (Figure 2D) (Supplementary Table S2). Overall, both techniques were effective in detecting the chemical composition of seeds according to patterns in the early and late maturation stages.

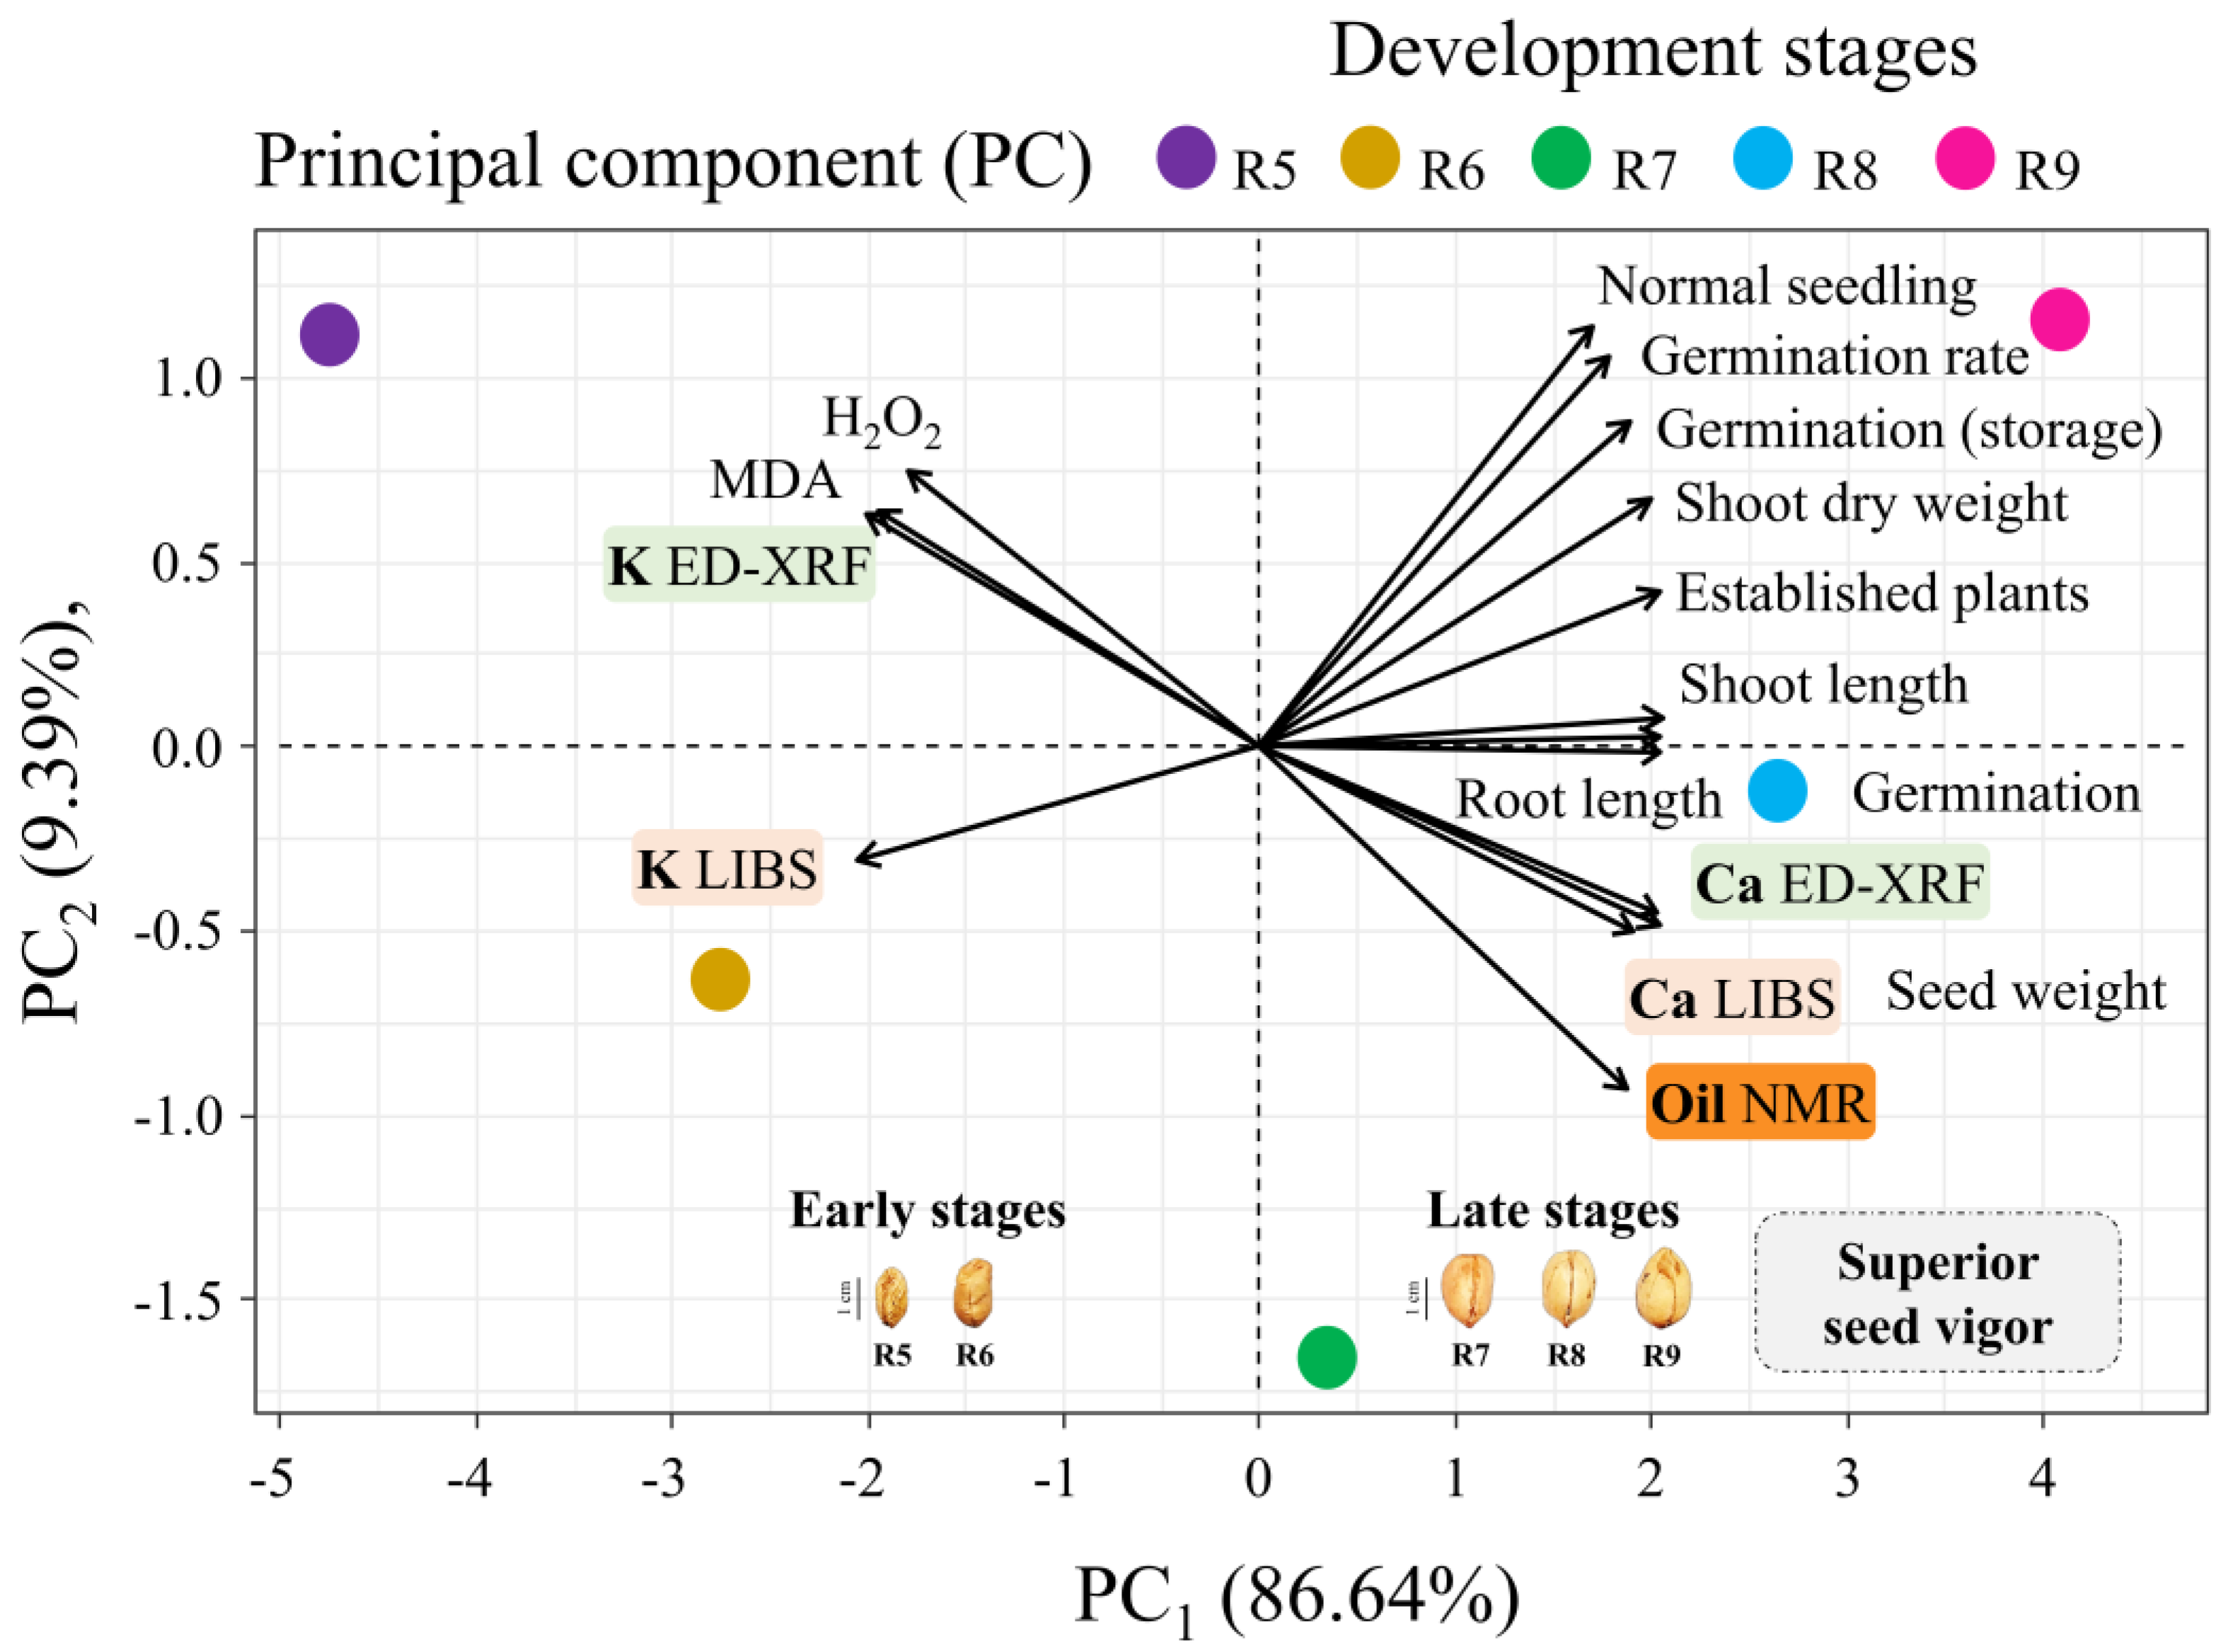
3.3. Principal Component Analysis

It was evident that the results of the tested techniques were strictly correlated to the seed vigor and oxidative stability variables. Two groups appeared (early and late stages) with explanation percentages of 86.64% and 9.39% in principal components 1 and 2, respectively. The K data (ED-XRF and LIBS) were vectorially related to the H2O2 and MDA (oxidative stress) results of the early stages. All seed vigor variables, weight, Ca (ED-XRF and LIBS), and oil (NMR) levels, were linked with the late stages of maturation (Figure 3).

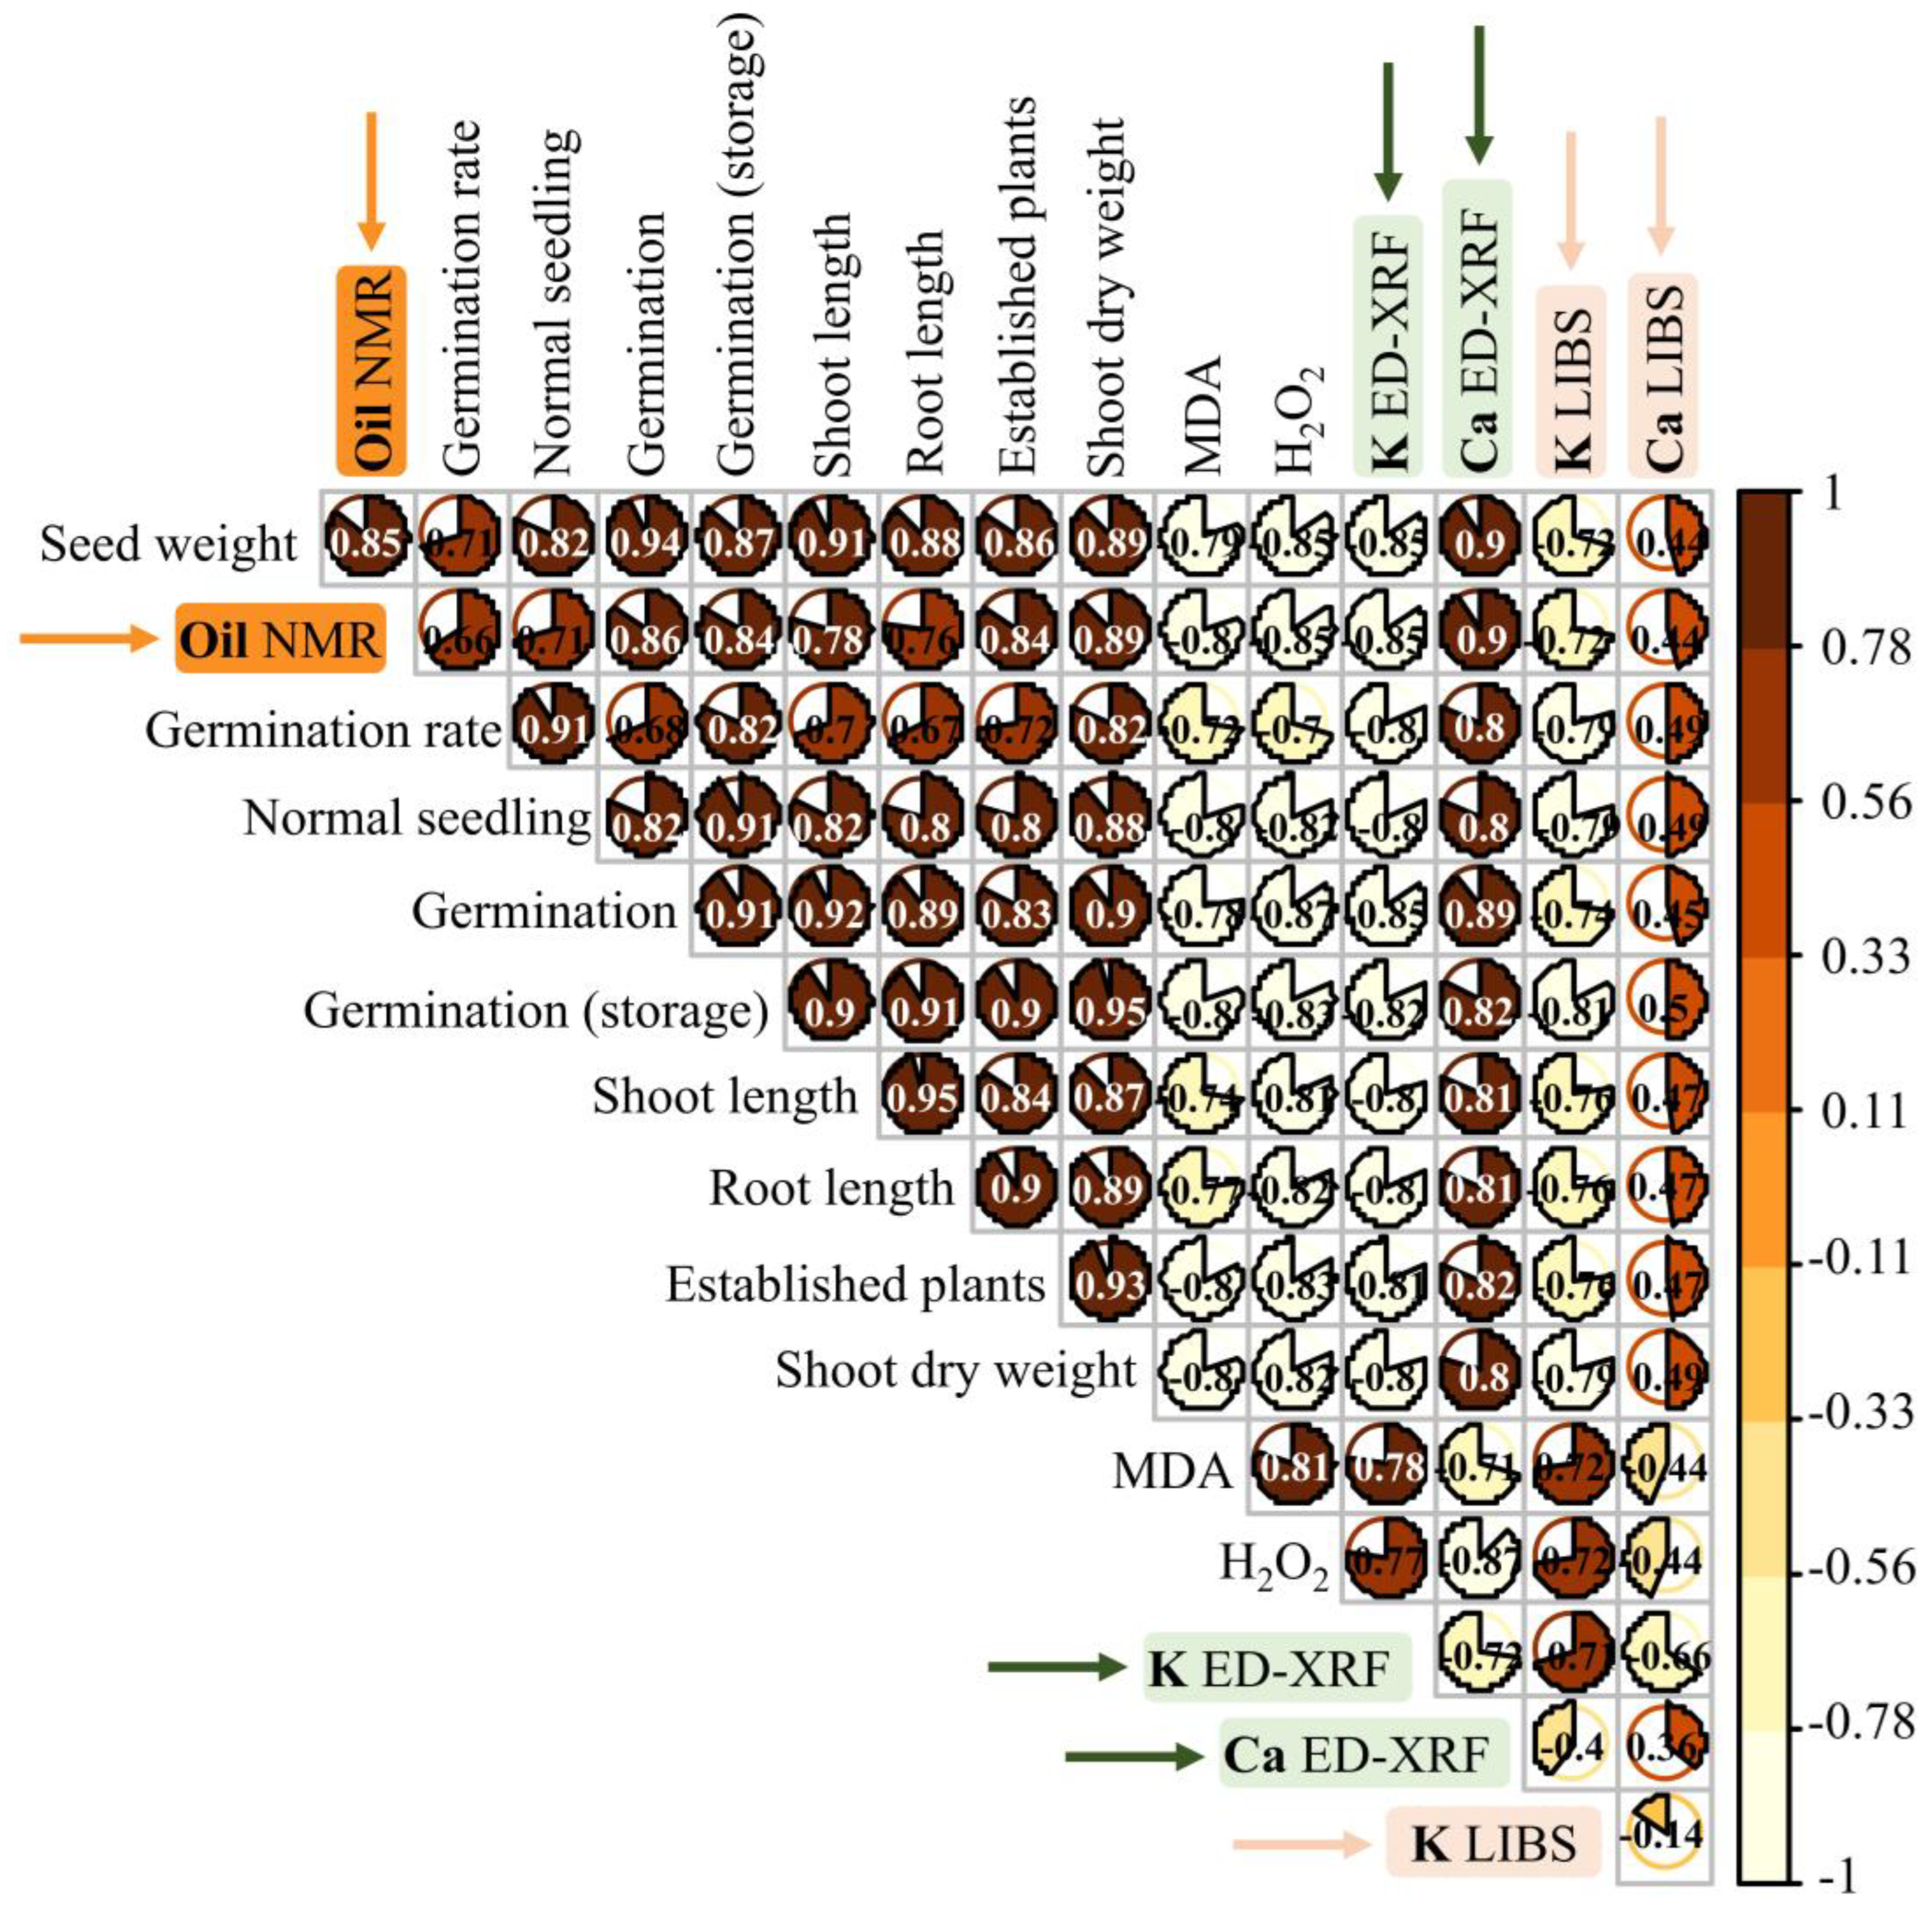
3.4. Correlation Analysis

For the weight and oil variables, the following correlation results were obtained: (i) positive correlation of weight (0.71 ≥ r ≤ 0.91) and oil content (0.66 ≥ r ≤ 0.89) with germination and vigor; and (ii) negative correlation of weight (−0.79 ≤ r ≥ −0.85) and oil content (−0.8 ≤ r ≥ −0.85) with oxidative stress. Regarding Ca signals, the following were observed: (i) positive correlation of ED-XRF (0.8 ≥ r ≤ 0.9) and LIBS (0.45 ≥ r ≤ 0.5) data with seed vigor; and (ii) negative correlation of ED-XRF (−0.71 ≤ r ≥ −0.87) and LIBS (r = −0.44) data with oxidative stress. In the case of K, the results were as follows: (i) negative correlations between ED-XRF (−0.8 ≤ r ≥ −0.85) and LIBS (−0.74 ≤ r ≥ −0.81) data with vigor; and (ii) positive correlations of data obtained for ED-XRF (0.77 ≥ r ≤ 0.78) and LIBS (r = 0.72) with the oxidative stress variables. Overall, the late stages were positively correlated with superior vigor, higher weight, oil, and Ca content, as well as lower oxidative stress and K signals (Figure 4).

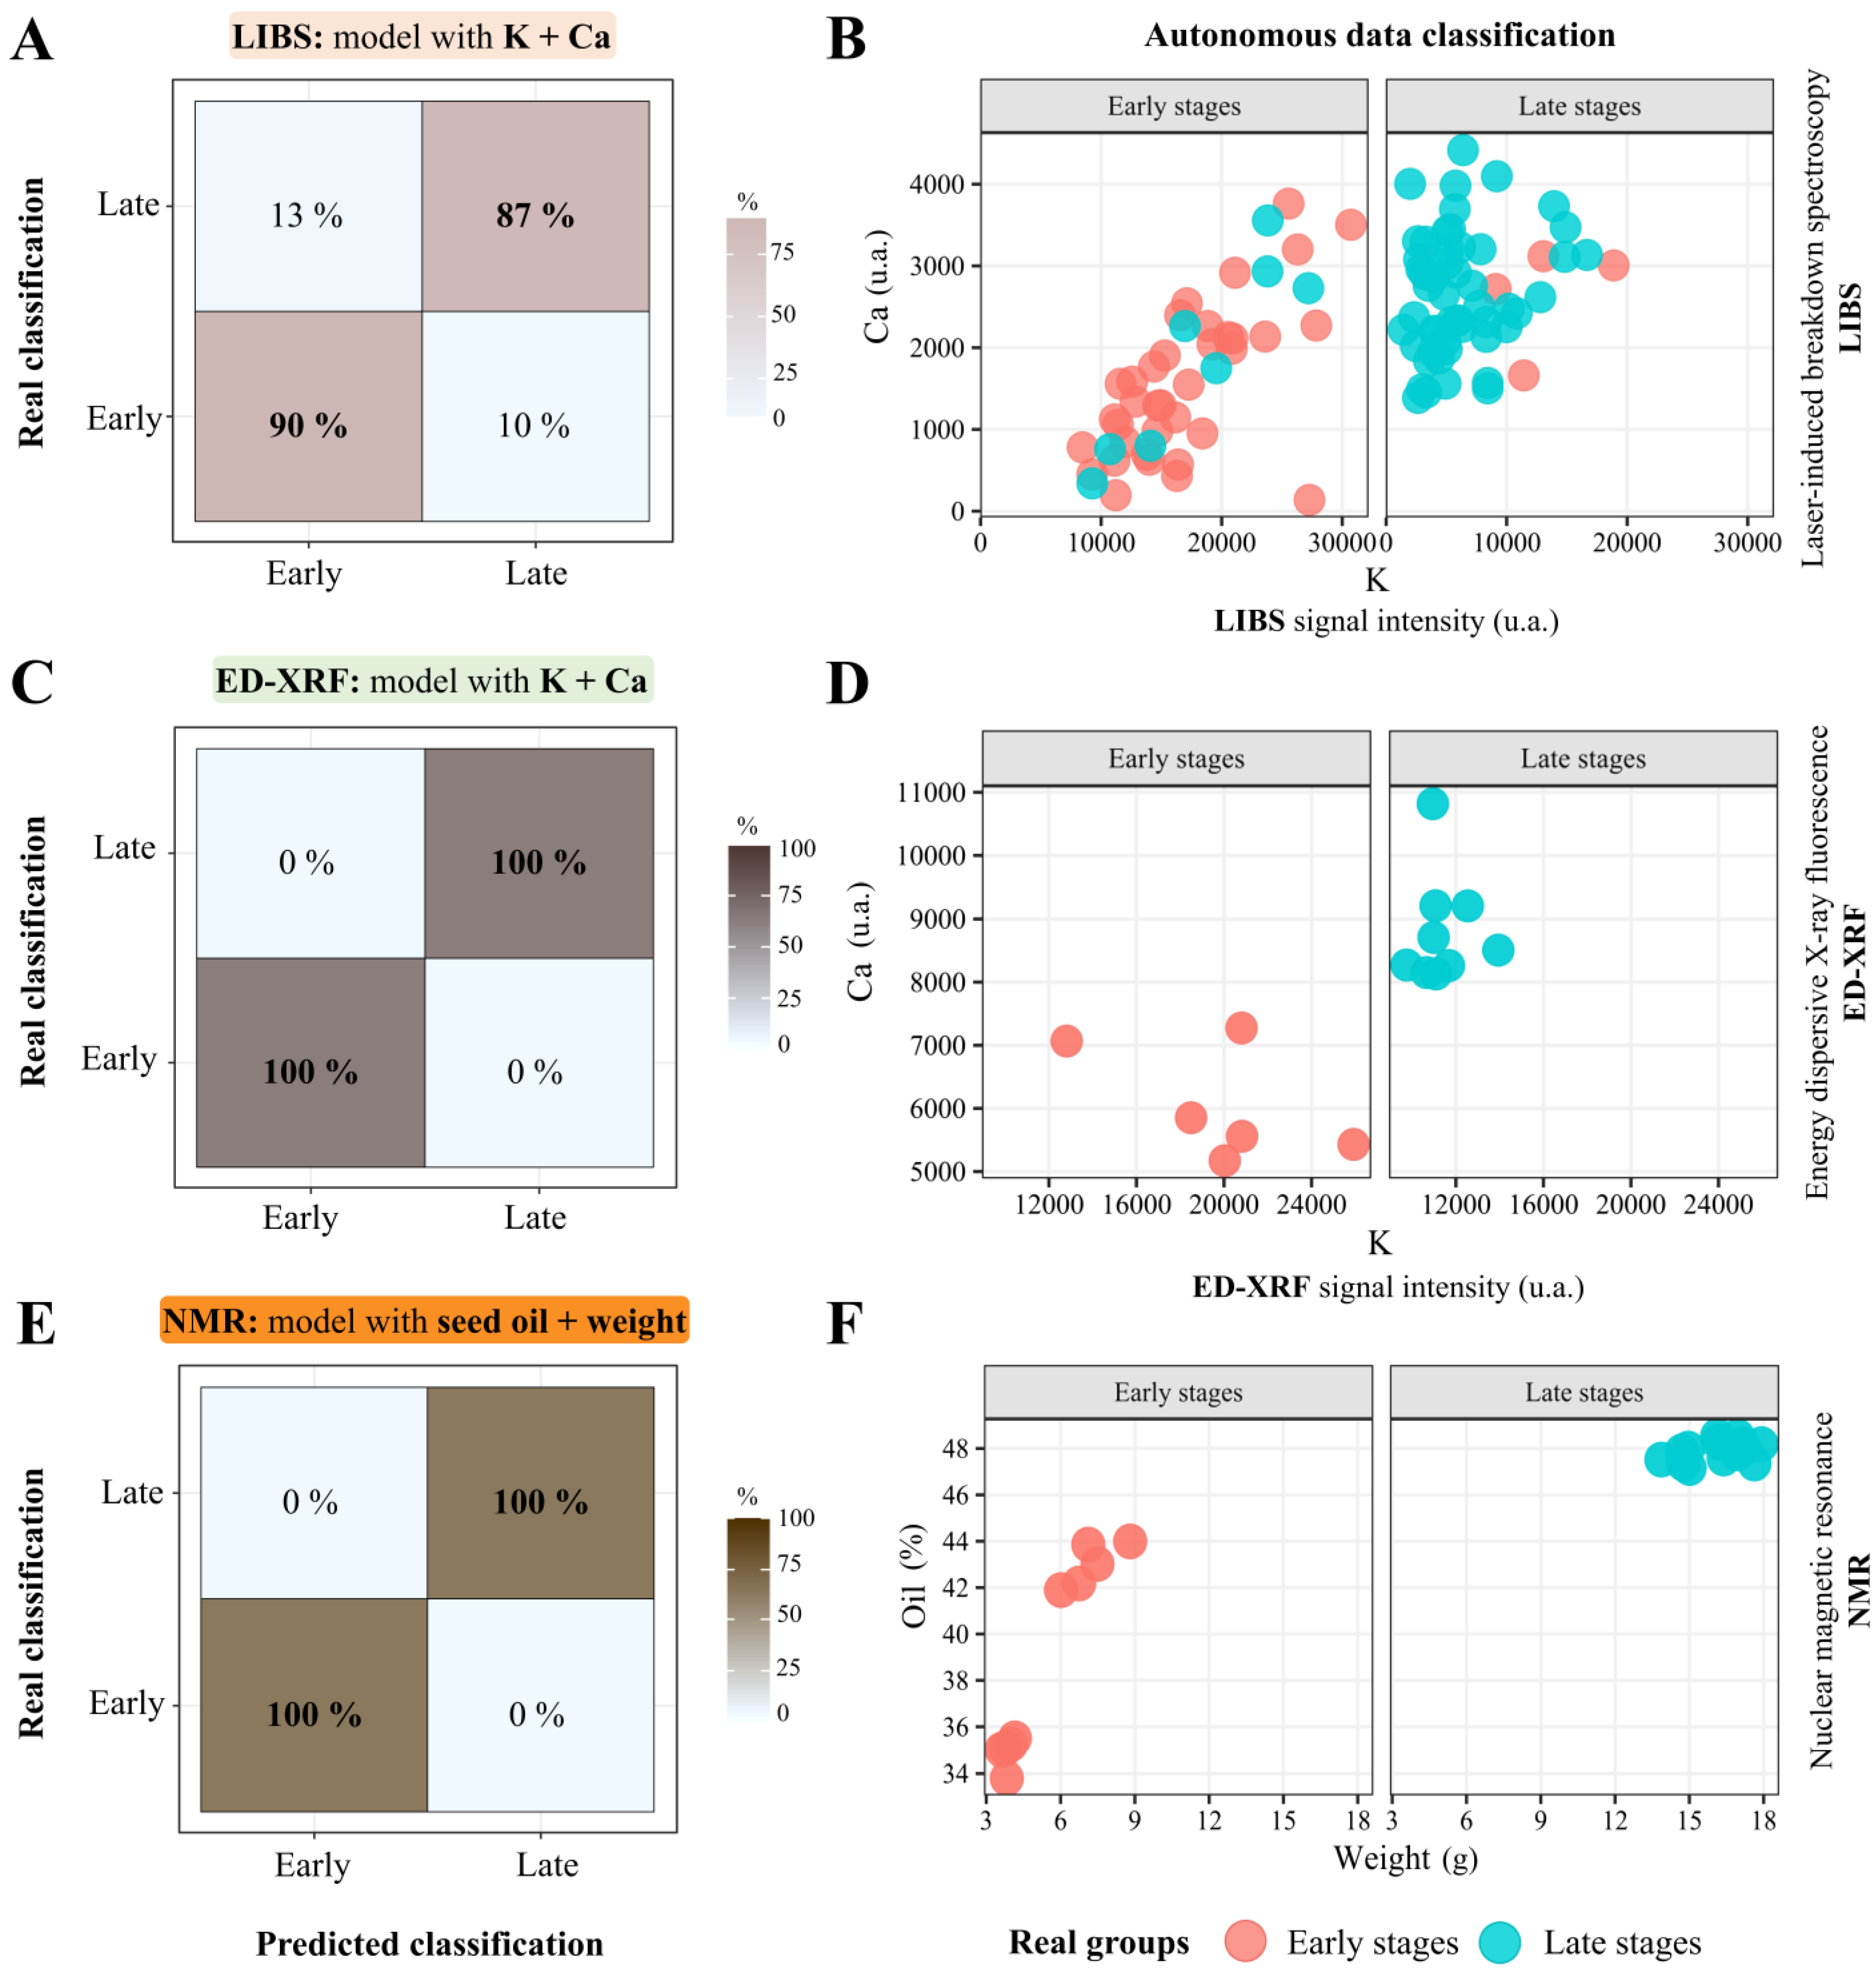
3.5. Predicting the Seed Chemical Autonomously

The first model with LIBS (K + Ca) correctly classified 90% of the early stages and 87% of the late stages. For instance, (i) 10% of data from early stages were incorrectly classified (predicted classification) as being from late stages, and (ii) the model incorrectly recognized 13% of data from late stages as information from early stages (Figure 5A). The K signals correctly associated with the early stages were between 10,000 and 30,000 (a.u.). As for Ca, signals between 1000 and 4000 (a.u.) were associated with the real classification of late stages (Figure 5B).
The ED-XRF data-based model correctly classified 100% of the data for both early and late maturation stages (Figure 5C). The X-ray fluorescence signals above 12,000 (a.u.) for K highlighted exclusively early-stage seeds (Figure 5D). In addition, the X-ray fluorescence signals for Ca were around 8000 (a.u.), and can predict the late stages with 100% accuracy. Finally, the third model with NMR correctly recognized 100% of the early- and late-stage patterns (Figure 5E). Data for around 46% oil were associated with seeds with higher weight and advanced maturity (Figure 5F).

4. Discussion

4.1. Oil Through NMR: Biological Relationships with Seed Development and Applications

Peanut seed development is marked by changes that define its physical structure and chemical reserve compounds [11,18] (Figure 1A). As confirmed in other studies, we showed that when the filling phase ends, the seeds become autonomous from the mother plant and also acquire vigor and storability [8,51] (Figure 1C–F). At this point, the seed has its maximum accumulation of oil content, a chemical compound that fundamentally contributes to its vigor [18,52] (Figure 1A). Two notable examples of these contributions are: (i) protection against reactive oxygen species (ROS) to delay cellular aging during storage (e.g., tocopherol) [19,53]; and (ii) serving as an energy source for the establishment of high-performance seedlings months after harvesting [14,54] (Figure 1F). Notably, the contributions of oil reserves to ROS stability are exclusive to seeds at late stages [9,55]. This indicates that the high levels of oxidative stress in early stages can be explained by the absence of oil compounds with antioxidant roles [15,56] (Figure 1). Overall, the NMR technique allows us to demonstrate a remarkable correlation between superior vigor and oil content obtained digitally and non-destructively (Figure 4) [44]. This context opens new possibilities for applying these findings in the peanut industry, such as: (i) screening of oil dynamics to identify seeds that can guarantee a new cultivation cycle; (ii) selection of varieties in plant breeding programs aimed at producing oilseeds with high vigor; and (iii) selection of kernels enriched in lipids with superior nutritional value.

4.2. K Spectral Dynamics and Seed Oxidative Stability

In the early stages, the higher K signal emission coincided with increased levels of oxidative stress and low seed vigor (Figure 1, Figure 2, Figure 3 and Figure 4). K is highly mobile in plants and does not constitute the basic structure of tissues or membranes, which makes its accumulation variable depending on biological demand [57,58]. One common scenario for K demand is related to ionic homeostasis and the maintenance of excess ROS in cells [59]. Notably, the increased K in the early-stage seeds may result from the biological response to high oxidative instability [60]. This indicates that, in an attempt to mitigate cellular stress and ensure osmoregulation, potassium could be directed by the plant system to the most immature seeds during their development process [20,21]. However, the mineral remains accumulated in the dry matter of the seeds after drying (Figure 2C,D), and this K enhancement allows the LIBS and ED-XRF techniques to detect seed maturation stages precisely (Figure 2C,D) [29,30]. Understandably, the high K signals are inversely proportional to seed vigor and have a strong correlation with H₂O₂ and MDA concentrations (Figure 3 and Figure 4). Furthermore, only seeds from late maturation stages have sufficient molecular defenses to mitigate excess ROS and ensure metabolic stability during storage (Figure 1B–F) [61,62]. As a result, early-stage seeds, even with potassium enrichment, are prone to intensified aging as they lack the organic tools to promote ROS balance, drastically reducing their performance post-harvest (Figure 1) [63,64]. Therefore, in an innovative way, spectroscopy techniques make it possible to screen: (i) seed development stages; (ii) seed physiological quality (i.e., vigor); and (iii) embryonic oxidative stability.

4.3. Ca Chemical “Fingerprints”: Technological Insights into Seed Vigor

The findings generated through spectroscopy for Ca have a notable biological link to seed vigor (Figure 1C–F and Figure 4) [35,65]. This is reinforced by the fact that the peanut plant accumulates Ca in its draining organs as it matures [22,66]. Furthermore, Ca is a structural element of plant tissues, a constituent of the cell wall and membrane system, and also contributes to overall peanut development [22,67]. In seeds, Ca enrichment is associated with: (i) preservation of vigor during storage [63,64]; (ii) bioprotection against pathogens [8,68]; and (iii) energy reserves for germination [23,69]. It is logical, then, that the Ca signals (LIBS and ED-XRF) reflect the low performance of immature seeds and the superior vigor of late-stage ones (Figure 1 and Figure 2) [8,12]. Additionally, the results obtained digitally are connected to plant emergence in the field, opening up an unprecedented possibility of predicting the establishment of future crops (Figure 1, Figure 2, Figure 3 and Figure 4) [70,71]. This understanding allows for the optimization of industrial strategies, such as: (i) individualized seed selection with favorable calcium profiles to maintain seed performance throughout storage; (ii) ensuring the production of resilient seeds with enhanced organic defenses to overcome climate extremes in global agriculture [72]; and (iii) selecting calcium-enriched seeds/kernels to create nutritional-oriented products. Therefore, the chemical “fingerprints” of Ca represent a technological step toward identifying seeds capable of efficiently generating a new crop (Graphic abstract), which can strengthen strategic food security programs [13].

4.4. Screening Seed Vigor Through Spectral Chemical Patterns: Perspectives

By automating the recognition of chemical element patterns, an innovative computational path has been created to trace seeds with high vigor (Figure 5) [34,73]. The changes that occur in the chemistry of the seeds during their development alter the light dynamics and magnetic frequency in the embryo (Figure 1 and Figure 2). This event makes it possible to classify the degree of maturity and/or seed vigor with remarkable accuracy (Figure 5), as has been done in other species [34,65,74,75]. This means that applying this knowledge in the peanut industry could potentially lead to products with more desirable chemical enhancements, such as oil and minerals that can be serially selected at the processing stage [2,76]. Interestingly, the light reactions generated and detected by LIBS, the elemental fluorescence events captured via ED-XRF, and the NMR electromagnetic waves that escape the human eye were presented for the first time in the context of peanut seeds. About this, we can add some perspectives that could improve the research findings across different scenarios in the peanut chain. For instance, there are certainly differences between peanut varieties regarding oil, Ca, and K content in their seeds, even with the same degree of maturity. To address this, we could suggest exploring the patterns for these new varieties to precisely adjust the automatic classification threshold for early and late stages, using the proposed techniques. Additionally, another possibility could be to explore different kinds of artificial intelligence tools to expand the capacity to identify seeds with higher vigor [77]. Overall, the autonomous interpretation of seed vigor through the “chemical fingerprint” represents a new opportunity for the application of spectroscopy in modern agriculture worldwide.

5. Conclusions

LIBS, ED-XRF, and NMR technologies screen peanut seeds with superior vigor through “chemical fingerprinting”. Late seed stages show increased signals for Ca and oil, which are directly proportional to weight, vigor (seedling formation), and peanut plant establishment in the field. Seeds from the early stages exhibit low vigor and have higher K signals, as well as excess oxidative stress. From the variables K, Ca, seed weight, and oil content, the patterns of the early and late stages of the seed can be classified autonomously with 87% to 100% accuracy. In the context of the global peanut industry, portable and benchtop spectroscopy techniques are highly promising for the assisted selection of seeds and kernels using mineral and lipid composition markers.

Supplementary Materials

The following supporting information can be downloaded at https://www.mdpi.com/article/10.3390/agronomy14112529/s1: Figure S1: Environmental conditions during seed production (crop season 2021/2022); Table S1: Characteristics of seed stages; Table S2: Statistical data.

Author Contributions

Conceptualization, G.R.F.d.O. and E.A.A.d.S.; supervision and project administration, E.A.A.d.S.; methodology, G.R.F.d.O., K.P.O.M.d.S., D.S.F., G.C.S., T.B.M., F.M.V.P. and E.R.P.-F.; formal analysis, G.R.F.d.O. and W.Y.H.; data curation, G.R.F.d.O.; investigation, G.R.F.d.O. and E.A.A.d.S.; visualization, F.M.V.P., E.R.P.-F., T.B.M. and C.B.M.; writing—original draft preparation, G.R.F.d.O.; review and editing, F.M.V.P., E.R.P.-F., C.B.M., G.C.S., D.S.F., T.B.M. and E.A.A.d.S. All authors have read and agreed to the published version of the manuscript.

Funding

This research was funded by São Paulo Research Foundation—FAPESP (grant number 2020/14050-3, 2021/07331-9, 2023/00435-9, 2022/02232-5, 2021/10882-7, 2019/01102-8, and 2014/50945-4).

Data Availability Statement

The datasets for this study are available in this manuscript and the Supplementary Materials.

Acknowledgments

We are thankful to Roger Hutchings for the English review of the manuscript. We also thank COPERCANA (https://copercana.com.br/) (peanut seed company, São Paulo, Brazil) for their support throughout the experiments. The authors are also grateful to the National Council for Scientific and Technological Development (CNPq), grant nos. 142236/2020-9, 306611/2022-8, 302085/2022, 302719/2020-2, 314305/2021-1, 140867/2021-0, 311526/2021-7, and 465571/2014-0, 160797/2022-5, and the Coordination for the Improvement of Higher Education Personnel (CAPES)—Finance Code 001 and grant no. 88887136426/2017/00.

Conflicts of Interest

The authors declare that this research was conducted in the absence of any commercial or financial relationships that could be construed as a potential conflict of interest.

References

  1. U.S. Department of Agriculture. Peanut Explorer. Available online: https://ipad.fas.usda.gov/cropexplorer/cropview/commodityView.aspx?cropid=2221000 (accessed on 9 October 2024).
  2. Bonku, R.; Yu, J. Health Aspects of Peanuts as an Outcome of Its Chemical Composition. Food Sci. Hum. Wellness 2020, 9, 21–30. [Google Scholar] [CrossRef]
  3. Nakagawa, J.; Rosolem, C.A. O Amendoim; FEPAF: Botucatu, SP, Brazil, 2011; ISBN 978-85-98187-29-7. [Google Scholar]
  4. Qiao, M.; Sun, R.; Wang, Z.; Dumack, K.; Xie, X.; Dai, C.; Wang, E.; Zhou, J.; Sun, B.; Peng, X.; et al. Legume Rhizodeposition Promotes Nitrogen Fixation by Soil Microbiota under Crop Diversification. Nat. Commun. 2024, 15, 2924. [Google Scholar] [CrossRef] [PubMed]
  5. USDA Oilseeds: World Markets and Trade. Available online: https://fas.usda.gov/data/oilseeds-world-markets-and-trade-06122024 (accessed on 9 October 2024).
  6. FAO. Food and Agriculture Organization of the United Nations. Crops and Livestock Products. Available online: https://www.fao.org/faostat/en/#data/QCL/visualize (accessed on 7 October 2024).
  7. Stalker, H.T.; Wilson, R.F. Peanuts: Genetics, Processing, and Utilization; Academic Press: Cambridge, MA, USA; AOCS Press: Champaign, IL, USA, 2016; ISBN 9781630670382. [Google Scholar]
  8. Fonseca de Oliveira, G.R.; Amaral da Silva, E.A. Tropical Peanut Maturation Scale for Harvesting Seeds with Superior Quality. Front. Plant Sci. 2024, 15, 1376370. [Google Scholar] [CrossRef] [PubMed]
  9. Groot, S.P.C. Seed Maturation and Its Practical Implications. Seed Sci. Technol. 2022, 50, 141–151. [Google Scholar] [CrossRef]
  10. Finch-Savage, W.E.; Bassel, G.W. Seed Vigour and Crop Establishment: Extending Performance beyond Adaptation. J. Exp. Bot. 2016, 67, 567–591. [Google Scholar] [CrossRef]
  11. Pattee, H.E.; Johns, E.B.; Singleton, J.A.; Sanders, T.H. Composition Changes of Peanut Fruit Parts During Maturation. Peanut Sci. 1974, 1, 57–62. [Google Scholar] [CrossRef]
  12. Moreno, L.; Santos, A.F.; Tubbs, R.S.; Grey, T.L.; Monfort, W.S.; Lamb, M.C.; Pilon, C. Physiological Components of Seed Quality in Runner-type Peanut during Seed Formation. Agron. J. 2023, 116, 189–201. [Google Scholar] [CrossRef]
  13. de Aguila Moreno, L.; Fonseca de Oliveira, G.R.; Batista, T.B.; Bossolani, J.W.; Ducatti, K.R.; Guimarães, C.C.; da Silva, E.A.A. Quality of Cowpea Seeds: A Food Security Strategy in the Tropical Environment. PLoS ONE 2022, 17, e0276136. [Google Scholar] [CrossRef]
  14. Song, Y.; Rowland, D.L.; Tillman, B.L.; Wilson, C.H.; Sarnoski, P.J.; Zurweller, B.A. Impact of Seed Maturity on Season-Long Physiological Performance and Offspring Seed Quality in Peanut (Arachis hypogaea L.). F. Crop Res. 2022, 288, 108674. [Google Scholar] [CrossRef]
  15. Leprince, O.; Pellizzaro, A.; Berriri, S.; Buitink, J. Late Seed Maturation: Drying without Dying. J. Exp. Bot. 2017, 68, 827–841. [Google Scholar] [CrossRef]
  16. Chatelain, E.; Hundertmark, M.; Leprince, O.; Gall, S.L.; Satour, P.; Deligny-Penninck, S.; Rogniaux, H.; Buitink, J. Temporal Profiling of the Heat-Stable Proteome during Late Maturation of Medicago truncatula Seeds Identifies a Restricted Subset of Late Embryogenesis Abundant Proteins Associated with Longevity. Plant Cell Environ. 2012, 35, 1440–1455. [Google Scholar] [CrossRef] [PubMed]
  17. Bewley, J.D.; Bradford, K.J.; Hilhorst, H.W.M.; Nonogaki, H. Seeds: Physiology of Development, Germination and Dormancy, 3rd ed.; Springer: New York, NY, USA, 2013; Volume 4, ISBN 9781461446927. [Google Scholar]
  18. Cao, D.; Ma, Y.; Cao, Z.; Hu, S.; Li, Z.; Li, Y.; Wang, K.; Wang, X.; Wang, J.; Zhao, K.; et al. Coordinated Lipid Mobilization during Seed Development and Germination in Peanut (Arachis hypogaea L.). J. Agric. Food Chem. 2024, 72, 3218–3230. [Google Scholar] [CrossRef] [PubMed]
  19. Sattler, S.E.; Gilliland, L.U.; Magallanes-Lundback, M.; Pollard, M.; DellaPenna, D. Vitamin E Is Essential for Seed Longevity and for Preventing Lipid Peroxidation during Germination. Plant Cell 2004, 16, 1419–1432. [Google Scholar] [CrossRef] [PubMed]
  20. Che, Y.; Yao, T.; Wang, H.; Wang, Z.; Zhang, H.; Sun, G.; Zhang, H. Potassium Ion Regulates Hormone, Ca2+ and H2O2 Signal Transduction and Antioxidant Activities to Improve Salt Stress Resistance in Tobacco. Plant Physiol. Biochem. 2022, 186, 40–51. [Google Scholar] [CrossRef] [PubMed]
  21. Patel, M.; Fatnani, D.; Parida, A.K. Potassium Deficiency Stress Tolerance in Peanut (Arachis hypogaea) through Ion Homeostasis, Activation of Antioxidant Defense, and Metabolic Dynamics: Alleviatory Role of Silicon Supplementation. Plant Physiol. Biochem. 2022, 182, 55–75. [Google Scholar] [CrossRef]
  22. Kadirimangalam, S.R.; Sawargaonkar, G.; Choudhari, P. Morphological and Molecular Insights of Calcium in Peanut Pod Development. J. Agric. Food Res. 2022, 9, 100320. [Google Scholar] [CrossRef]
  23. Li, Y.; Meng, J.; Yang, S.; Guo, F.; Zhang, J.; Geng, Y.; Cui, L.; Wan, S.; Li, X. Transcriptome Analysis of Calcium-and Hormone-Related Gene Expressions during Different Stages of Peanut Pod Development. Front. Plant Sci. 2017, 8, 1241. [Google Scholar] [CrossRef]
  24. de Carvalho, L.C.; Pereira, F.M.V.; de Morais, C.D.L.M.; de Lima, K.M.G.; de Almeida Teixeira, G.H. Assessment of Macadamia Kernel Quality Defects by Means of near Infrared Spectroscopy (NIRS) and Nuclear Magnetic Resonance (NMR). Food Control 2019, 106, 106695. [Google Scholar] [CrossRef]
  25. Santos, J.F.; Godoy, I.J.; Moraes, R.A.; Doniseti Michelotto, M.; Mello Martins, A.L.; Bolonhezi, D. Métodos De Avaliação De Maturação De Linhagens De Amendoim Em Colheita Antecipada. Encontro Sobre Cult. Amend. 2017, 1, 4–8. [Google Scholar] [CrossRef]
  26. Borisjuk, L.; Rolletschek, H.; Fuchs, J.; Melkus, G.; Neuberger, T. Low and High Field Magnetic Resonance for In Vivo Analysis of Seeds. Materials 2011, 4, 1426–1439. [Google Scholar] [CrossRef]
  27. Song, C.; Xiang, D.B.; Yan, L.; Song, Y.; Zhao, G.; Wang, Y.H.; Zhangb, B.L. Changes in Seed Growth, Levels and Distribution of Flavonoids during Tartary Buckwheat Seed Development. Plant Prod. Sci. 2016, 19, 518–527. [Google Scholar] [CrossRef]
  28. Mikkelsted, F.N.; Adén, D.; Nikolajsen, T.; Laursen, K.H. A Novel LIBS Method for Quantitative and High-Throughput Analysis of Macro and Micronutrients in Plants. J. Anal. At. Spectrom. 2024, 39, 2008–2020. [Google Scholar] [CrossRef]
  29. Gamela; Costa, V.C.; Babos, D.V.; Araújo, A.S.; Pereira-Filho, E.R. Direct Determination of Ca, K, and Mg in Cocoa Beans by Laser-Induced Breakdown Spectroscopy (LIBS): Evaluation of Three Univariate Calibration Strategies for Matrix Matching. Food Anal. Methods 2020, 13, 1017–1026. [Google Scholar] [CrossRef]
  30. Gamela; Costa, V.C.; Sperança, M.A.; Pereira-Filho, E.R. Laser-Induced Breakdown Spectroscopy (LIBS) and Wavelength Dispersive X-Ray Fluorescence (WDXRF) Data Fusion to Predict the Concentration of K, Mg and P in Bean Seed Samples. Food Res. Int. 2020, 132, 109037. [Google Scholar] [CrossRef]
  31. Li, F.; Meng, L.; Ding, W.; Wang, J.; Ge, L. Review of Energy-Dispersive X-Ray Fluorescence on Food Elements Detection. X-Ray Spectrom. 2022, 51, 346–364. [Google Scholar] [CrossRef]
  32. Guild, G.E.; Stangoulis, J.C.R. Screening Ca Concentration in Staple Food Crops with Energy Dispersive X-Ray Fluorescence (EDXRF). Plant Soil 2022, 473, 659–667. [Google Scholar] [CrossRef]
  33. Guild, G.E.; Stangoulis, J.C.R. EDXRF for Screening Micronutrients in Lentil and Sorghum Biofortification Breeding Programs. Plant Soil 2021, 463, 461–469. [Google Scholar] [CrossRef]
  34. Barboza da Silva, C.; Bianchini, V.J.M.; Medeiros, A.D.; Moraes, M.H.D.; Marassi, A.G.; Tannús, A. A Novel Approach for Jatropha Curcas Seed Health Analysis Based on Multispectral and Resonance Imaging Techniques. Ind. Crops Prod. 2021, 161, 113186. [Google Scholar] [CrossRef]
  35. Cioccia, G.; Pereira de Morais, C.; Babos, D.V.; Milori, D.M.B.P.; Alves, C.Z.; Cena, C.; Nicolodelli, G.; Marangoni, B.S. Laser-Induced Breakdown Spectroscopy Associated with the Design of Experiments and Machine Learning for Discrimination of Brachiaria Brizantha Seed Vigor. Sensors 2022, 22, 5067. [Google Scholar] [CrossRef]
  36. USDA. Illustrated Guide to Soil Taxonomy; Version 2; US Department of Agriculture, Natural Resources Conservation Service, National Soil Survey Center: Lincoln, NE, USA, 2015. [Google Scholar]
  37. Quaggio, J.A.; Zambrosi, F.C.B.; Cantarella, H.; Godoy, I.J.; Crusciol, C.A.C.; Bolonhezi, D. Amendoim (Arachis hypogaea). In Boletim 100: Recomendaçõesde Adubação e Calagem Para o Estado de São Paulo; IAC: Campinas, Brazil, 2022; pp. 243–244. [Google Scholar]
  38. Prela, A.; Ribeiro, A.M.A. Soma de Graus-Dia Para o Sub-Período Semeadura-Maturação Do Amendoinzeiro. Rev. Bras. Agrometeorol. 2000, 8, 321–324. [Google Scholar]
  39. Alexieva, V.; Sergiev, I.; Mapelli, S.; Karanov, E. The Effect of Drought and Ultraviolet Radiation on Growth and Stress Markers in Pea and Wheat. Plant Cell Environ. 2001, 24, 1337–1344. [Google Scholar] [CrossRef]
  40. Heath, R.L.; Packer, L. Photoperoxidation in Isolated Chloroplasts. Arch. Biochem. Biophys. 1968, 125, 189–198. [Google Scholar] [CrossRef] [PubMed]
  41. Joosen, R.V.L.; Kodde, J.; Willems, L.A.J.; Ligterink, W.; Van Der Plas, L.H.W.; Hilhorst, H.W.M. Germinator: A Software Package for High-Throughput Scoring and Curve Fitting of Arabidopsis Seed Germination. Plant J. 2010, 62, 148–159. [Google Scholar] [CrossRef] [PubMed]
  42. Krzyzanowski, F.C.; França-Neto, J.B.; Gomes-Junior, F.G.; Nakagawa, J. Testes de Vigor Baseado Em Desempenho de Plântulas. In Vigor de Sementes: Conceitos e Testes; Abrates: Londrina, PR, Brazil, 2020; pp. 79–140. [Google Scholar]
  43. Chinachoti, P.; Peter, H. Krygsman Application of Low-Resolution Nmr for Simultaneous Moisture and Oil Determination in Food (Oilseeds). In Current Protocols in Food Analytical Chemistry; John Wiley & Sons: New York, NY, USA, 2001. [Google Scholar]
  44. Moraes, T.B.; Colnago, L.A. Noninvasive Analyses of Food Products Using Low-Field Time-Domain NMR: A Review of Relaxometry Methods. Braz. J. Phys. 2022, 52, 43. [Google Scholar] [CrossRef]
  45. Castro, J.P.; Pereira-Filho, E.R. Twelve Different Types of Data Normalization for the Proposition of Classification, Univariate and Multivariate Regression Models for the Direct Analyses of Alloys by Laser-Induced Breakdown Spectroscopy (LIBS). J. Anal. At. Spectrom. 2016, 31, 2005–2014. [Google Scholar] [CrossRef]
  46. Rodrigues, L.; Pereira-Filho, E.R.; Pereira, F.M.V. Analytical Chemistry Nutritional Insights: Exploring ED-XRF, LIBS, and Chemometric Techniques for Macronutrient Determination in Non-Conventional Food Plants (PANC). Food Anal. Methods 2024, 17, 358–365. [Google Scholar] [CrossRef]
  47. R Core Team. A Language and Environment for Statistical Computing: R Foundation for Statistical Computing. Available online: https://www.r-project.org/ (accessed on 3 August 2024).
  48. Hastie, T.; Tibshirani, R.; Friedman, J.H. The Elements of Statistical Learning: Data Mining, Inference, and Prediction, 2nd ed.; Springer: Berlin/Heidelberg, Germany, 2009. [Google Scholar]
  49. James, G.; Witten, D.; Hastie, T.; Tibshirani, R. An Introduction to Statistical Learning with Applications in R; Springer: New York, NY, USA, 2021. [Google Scholar] [CrossRef]
  50. Clarke, W.R.; Lachenbruch, P.A.; Broffitt, B. How Non-Normality Affects the Quadratic Discriminant Function. Commun. Stat. Theory Methods 1979, 8, 1285–1301. [Google Scholar] [CrossRef]
  51. Ellis, R.H. Temporal Patterns of Seed Quality Development, Decline, and Timing of Maximum Quality during Seed Development and Maturation. Seed Sci. Res. 2019, 29, 135–142. [Google Scholar] [CrossRef]
  52. Zhou, W.; Branch, W.D.; Gilliam, L.; Marshall, J.A. Phytosterol Composition of Arachis hypogaea Seeds from Different Maturity Classes. Molecules 2019, 24, 106. [Google Scholar] [CrossRef]
  53. Ramtekey, V.; Cherukuri, S.; Kumar, S.; V, S.K.; Sheoran, S.; K, U.B.; K, B.N.; Kumar, S.; Singh, A.N.; Singh, H.V. Seed Longevity in Legumes: Deeper Insights into Mechanisms and Molecular Perspectives. Front. Plant Sci. 2022, 13, 918206. [Google Scholar] [CrossRef]
  54. Rehmani, M.S.; Xian, B.S.; Wei, S.; He, J.; Feng, Z.; Huang, H.; Shu, K. Seedling Establishment: The Neglected Trait in the Seed Longevity Field. Plant Physiol. Biochem. 2023, 200, 107765. [Google Scholar] [CrossRef] [PubMed]
  55. Sano, N.; Rajjou, L.; North, H.M.; Debeaujon, I.; Marion-Poll, A.; Seo, M. Staying Alive: Molecular Aspects of Seed Longevity. Plant Cell Physiol. 2016, 57, 660–674. [Google Scholar] [CrossRef] [PubMed]
  56. Kumar, S.P.J.; Rajendra Prasad, S.; Banerjee, R.; Thammineni, C. Seed Birth to Death: Dual Functions of Reactive Oxygen Species in Seed Physiology. Ann. Bot. 2015, 116, 663–668. [Google Scholar] [CrossRef] [PubMed]
  57. Sardans, J.; Peñuelas, J. Potassium Control of Plant Functions: Ecological and Agricultural Implications. Plants 2021, 10, 419. [Google Scholar] [CrossRef]
  58. Ragel, P.; Raddatz, N.; Leidi, E.O.; Quintero, F.J.; Pardo, J.M. Regulation of K + Nutrition in Plants. Front. Plant Sci. 2019, 10, 281. [Google Scholar] [CrossRef]
  59. Hasanuzzaman, M.; Bhuyan, M.H.M.B.; Nahar, K.; Hossain, M.S.; Al Mahmud, J.; Hossen, M.S.; Masud, A.A.C.; Moumita; Fujita, M. Potassium: A Vital Regulator of Plant Responses and Tolerance to Abiotic Stresses. Agronomy 2018, 8, 31. [Google Scholar] [CrossRef]
  60. Liu, C.; Liao, W. Potassium Signaling in Plant Abiotic Responses: Crosstalk with Calcium and Reactive Oxygen Species/Reactive Nitrogen Species. Plant Physiol. Biochem. 2022, 173, 110–121. [Google Scholar] [CrossRef]
  61. Buitink, J.; Leprince, O. Glass Formation in Plant Anhydrobiotes: Survival in the Dry State. Cryobiology 2004, 48, 215–228. [Google Scholar] [CrossRef]
  62. Buitink, J.; Leprince, O. Intracellular Glasses and Seed Survival in the Dry State. Comptes Rendus Biol. 2008, 331, 788–795. [Google Scholar] [CrossRef]
  63. Li, W.; Niu, Y.; Zheng, Y.; Wang, Z. Advances in the Understanding of Reactive Oxygen Species-Dependent Regulation on Seed Dormancy, Germination, and Deterioration in Crops. Front. Plant Sci. 2022, 13, 826809. [Google Scholar] [CrossRef]
  64. Kurek, K.; Plitta-Michalak, B.; Ratajczak, E. Reactive Oxygen Species as Potential Drivers of the Seed Aging Process. Plants 2019, 8, 174. [Google Scholar] [CrossRef] [PubMed]
  65. Larios, G.S.; Nicolodelli, G.; Senesi, G.S.; Ribeiro, M.C.S.; Xavier, A.A.P.; Milori, D.M.B.P.; Alves, C.Z.; Marangoni, B.S.; Cena, C. Laser-Induced Breakdown Spectroscopy as a Powerful Tool for Distinguishing High- and Low-Vigor Soybean Seed Lots. Food Anal. Methods 2020, 13, 1691–1698. [Google Scholar] [CrossRef]
  66. Crusciol, C.A.C.; Portugal, J.R.; Bossolani, J.W.; Moretti, L.G.; Fernandes, A.M.; Garcia, J.L.N.; Garcia, G.L.d.B.; Pilon, C.; Cantarella, H. Dynamics of Macronutrient Uptake and Removal by Modern Peanut Cultivars. Plants 2021, 10, 2167. [Google Scholar] [CrossRef] [PubMed]
  67. Thor, K. Calcium—Nutrient and Messenger. Front. Plant Sci. 2019, 10, 440. [Google Scholar] [CrossRef]
  68. Yang, S.; Wang, J.; Tang, Z.; Guo, F.; Zhang, Y.; Zhang, J.; Meng, J.; Zheng, L.; Wan, S.; Li, X. Transcriptome of Peanut Kernel and Shell Reveals the Mechanism of Calcium on Peanut Pod Development. Sci. Rep. 2020, 10, 15723. [Google Scholar] [CrossRef]
  69. Verma, G.; Khan, S.; Agarwal, S.K.; Sharma, S. Role of Apoplastic Calcium during Germination and Initial Stages of Seedling Establishment in Vigna radiata Seeds. J. Plant Physiol. 2019, 236, 66–73. [Google Scholar] [CrossRef]
  70. Ebone, L.A.; Caverzan, A.; Tagliari, A.; Chiomento, J.L.T.; Silveira, D.C.; Chavarria, G. Soybean Seed Vigor: Uniformity and Growth as Key Factors to Improve Yield. Agronomy 2020, 10, 545. [Google Scholar] [CrossRef]
  71. Bagateli, J.R.; Dörr, C.S.; Schuch, L.O.B.; Meneghello, G.E. Productive Performance of Soybean Plants Originated from Seed Lots with Increasing Vigor Levels. J. Seed Sci. 2019, 41, 151–159. [Google Scholar] [CrossRef]
  72. Reed, R.C.; Bradford, K.J.; Khanday, I. Seed Germination and Vigor: Ensuring Crop Sustainability in a Changing Climate. Heredity 2022, 128, 450–459. [Google Scholar] [CrossRef]
  73. Galletti, P.A.; Carvalho, M.E.A.; Hirai, W.Y.; Brancaglioni, V.A.; Arthur, V.; Barboza da Silva, C. Integrating Optical Imaging Tools for Rapid and Non-Invasive Characterization of Seed Quality: Tomato (Solanum lycopersicum L.) and Carrot (Daucus carota L.) as Study Cases. Front. Plant Sci. 2020, 11, 577851. [Google Scholar] [CrossRef]
  74. Elmasry, G.; Mandour, N.; Wagner, M.H.; Demilly, D.; Verdier, J.; Belin, E.; Rousseau, D. Utilization of Computer Vision and Multispectral Imaging Techniques for Classification of Cowpea (Vigna unguiculata) Seeds. Plant Methods 2019, 15, 24. [Google Scholar] [CrossRef] [PubMed]
  75. Hu, X.; Yang, L.; Zhang, Z. Non-Destructive Identification of Single Hard Seed via Multispectral Imaging Analysis in Six Legume Species. Plant Methods 2020, 16, 116. [Google Scholar] [CrossRef] [PubMed]
  76. Arya, S.S.; Salve, A.R.; Chauhan, S. Peanuts as Functional Food: A Review. J. Food Sci. Technol. 2016, 53, 31–41. [Google Scholar] [CrossRef] [PubMed]
  77. Batista, T.B.; Mastrangelo, C.B.; de Medeiros, A.D.; Petronilio, A.C.P.; Fonseca de Oliveira, G.R.; Santos, I.L.; Crusciol, C.A.C.; Amaral da Silva, E.A. A Reliable Method to Recognize Soybean Seed Maturation Stages Based on Autofluorescence-Spectral Imaging Combined with Machine Learning Algorithms. Front. Plant Sci. 2022, 13, 914287. [Google Scholar] [CrossRef]
Figure 1. Analysis of physical, chemical, and physiological characteristics, including MDA-induced lipid peroxidation and hydrogen peroxide (H2O2) production in developing peanut seeds (* F-test, p-value < 0.05). Seed weight and oil content based on nuclear magnetic resonance—NMR (A); H2O2 and MDA (B); germination rate and normal seedlings (C); germination before and after seed storage (D); shoot and root length (E); plant establishment and shoot dry weight measured after seed storage for 12 months (F). The pod color scale is the criterion used to classify the seed development stages.
Agronomy 14 02529 g001
Figure 2. Mineral signals collected via laser-induced breakdown spectroscopy (LIBS) (A) and energy-dispersive X-ray fluorescence (ED-XRF) (B) in peanut seeds. Quantitative analysis of Ca and K (a.u.: arbitrary units) obtained with LIBS (C) and ED-XRF technologies (D) depending on the development stages of the collected seeds (* F-test, p-value < 0.05).
Agronomy 14 02529 g002
Figure 3. Principal component analysis made with physical, chemical, and physiological parameters from peanut seeds at five developmental stages (R5, R6, R7, R8, and R9).
Agronomy 14 02529 g003
Figure 4. Spearman correlation analysis made with all data from the research including seed vigor, lipid peroxidation (MDA), hydrogen peroxide (H2O2), oil, potassium, and calcium levels (NMR, LIBS, and ED-XRF data). The results obtained with LIBS, ED-XRF, and NMR technologies are highlighted.
Agronomy 14 02529 g004
Figure 5. Quadratic Discriminant Analysis (QDA method). Prediction models were designed to identify and distinguish between the early and late maturation stages of peanut seeds. From three combinations of data, the following models were generated: (i) LIBS for K + Ca data (A,B); (ii) ED-XRF for K + Ca data (C,D); and (iii) NMR for oil + seed weight data (E,F).
Agronomy 14 02529 g005
Disclaimer/Publisher’s Note: The statements, opinions and data contained in all publications are solely those of the individual author(s) and contributor(s) and not of MDPI and/or the editor(s). MDPI and/or the editor(s) disclaim responsibility for any injury to people or property resulting from any ideas, methods, instructions or products referred to in the content.

