Abstract
Soil salinity is a major soil threat, causing severe environmental problems. Soil salt stress limits N uptake and cotton growth, especially in arid regions. However, the mechanism underlying stress tolerance in cotton plants under different soil salinity levels has not been fully elucidated. Therefore, the aim of this study was to examine the proportion and mechanism of cotton N uptake and transport under salt stress using the 15N isotope labeling technique. Cotton plants were grown in four undisturbed loamy soils (CK, non-salinity, <2 dS m−1; C1, low salinity, 2–4 dS m−1; C2, mid-salinity, 4–8 dS m−1; and C3, high salinity, 8–15 dS m−1) in the test pit experiments. The findings indicated that the cotton N uptake was limited by the soil salt stress and total N content, and the cotton 15N use efficiency decreased by 25–27% with increasing salinity (>4.0 dS m−1). The N transported to cotton from the 0–20 cm soil layer in C1 treatment was higher than from the 40–60 cm layer. Furthermore, the cotton fruit cultivated in C1 exhibited a notably elevated dry matter content compared to those cultivated in the control treatment. As the soil salt stress increased from the control treatment to C1, the cotton stems and fruits demonstrated a gradual enhancement in their N uptake and regulatory capabilities, albeit with a slight decrease observed in the leaves. These findings emphasize that soil salt stress diminishes cotton nitrogen uptake and transport, potentially exacerbating nitrogen pollution in the absence of optimized nitrogen fertilization.
1. Introduction
Soil salt stress is a significant abiotic stress and a constraining factor that hinders the sustainable utilization of cropland [1]. The accumulation of salt in the soil is a consequence of continuous irrigation and fertilization practices in farmland [2]. In arid regions, there has been a noticeable upward trend in rhizosphere salt levels [3]. It is estimated that over one billion hectares of land may be affected by salinization [4,5], which would further limit the available land for crop growth [6]. Cotton, a crop known for its salt tolerance, is extensively cultivated for its natural fibers, particularly in the textile industry. Nevertheless, the expansion of suitable cultivation areas for cotton has significantly diminished due to the adverse impacts of escalating soil salinity [7]. Furthermore, higher soil salinity levels can affect the efficiency of cotton N uptake because these effects can reduce fertilizer utilization efficiency and cause N2O volatilization. Therefore, soil salt stress and low N fertilizer utilization are the major factors limiting cotton growth.
Nitrogen (N) is an efficient means for nucleic acids, enzymes, plant hormones, proteins, and chlorophyll biosynthesis, as well as being an essential requirement for cotton growth. Previous studies have substantially examined the effects of N application rates, timing, and management on the performance of cotton plants. In their study, Reddy et al. [8] investigated the impact of nitrogen fertilizer application on the physiological attributes of cotton. The findings revealed a positive correlation between cotton photosynthetic characteristics and nitrogen uptake. Similarly, Li et al. [9] proposed that the pre-frost cotton harvest index and nitrogen recovery efficiency declined as nitrogen utilization increased. Prior research has elucidated the approaches to irrigation and fertilization needed to optimize cotton growth. Bange et al. [10] observed a significant association between nitrogen fertilizer application and dry matter, as well as the number of cotton buds and bolls.
Cotton is mainly cultivated in the inland arid regions of China, which coincide with a high soil salt content and low N areas. The predominant adverse effects of soil salt stress on cotton biological processes include seed germination, seedling growth, dry matter partitioning, photosynthesis, and yield and quality [11,12]. Previous research has primarily concentrated on the effects of osmotic stress, ionic stress (resulting from elevated levels of Na+ and Cl− in the soil), and nutrient uptake stress caused by salt stress. These stressors have been found to impede the growth of cotton [13]. However, the investigations conducted thus far have only examined the impact of exogenously applied NaCl and Na2SO4 on the creation of saline soils, thereby limiting our understanding of the mechanisms underlying cotton growth and nutrient absorption in a soil salinity environment. The primary aims of this study were twofold: firstly, to ascertain the impact of varying levels of soil salinity on the distribution of nutrients in cotton plants through the utilization of the 15N isotopic tracer technique; secondly, to assess the growth of cotton, lint yield, and nitrogen use efficiency in the presence of soil salt stress. The findings of this research have the potential to offer valuable insights into the optimization of cotton nutrient utilization and the development of strategies for ameliorating saline soil conditions in arid regions.
2. Materials and Methods
2.1. Site Description
The field experiments were conducted in the Manas River Basin (44°19′ N, 85°59′ E; 412 m asl) in arid areas of northwest China from 2019 to 2021. This region is located on the periphery of the Gurbantunggut Desert and exhibits a typical temperate-arid continental climate. Throughout the duration of the field study, the average annual temperature was recorded as 18.6 °C, with an average annual rainfall of 170 mm and an annual evaporation rate of 1890 mm. During the summer months, relative humidity ranged between 30% and 50%, while the average annual sunshine duration was 2447.9 h. The groundwater depth during irrigation ranged from 7 to 10 m.
2.2. Test Pit Experiment Design and Crop Management
In previous works [4,5,14,15,16,17], the assessment of salinity hazard levels based on soil electrical conductivity (EC, ds m−1) has been commonly employed, with a threshold of 2 ds m−1 being utilized to define saline soils. In light of this, the present study devised four distinct salinity levels (CK, non-salinity, <2 dS m−1; C1, low salinity, 2–4 dS m−1; C2, mid-salinity, 4–8 dS m−1; and C3, high salinity, 8–15 dS m−1) for implementation in twelve test pit experiments (Figure 1).

Figure 1.
Schematic diagram of the experimental arrangement.
Each test pit was constructed with dimensions of 2.0 m width and 2.0 m length, and a brick concrete structure with a thickness of 0.3 m was implemented between plots to mitigate the influence of boundaries. The soils utilized in this study, classified as typic secondary salinity, were obtained from a saline cotton field under mulch drip irrigation in the Manas River irrigation area on 6 October 2018. These soils possessed the following characteristics: (1) the soil samples were obtained from a homogeneous irrigation area characterized by saline cultivation and similar planting years; (2) the farmland from which the samples were collected followed comparable management practices, including irrigation, fertilization, and tillage. Furthermore, prior to soil collection, we assessed the soil texture at the sampling sites and classified all four soils as loamy according to the USDA standard classification system 22 [18]. The soil water holding capacity was between 23 and 29% (volumetric water content). The soil pH values ranged from 6.3 to 7.6, while the bulk densities ranged from 1.34 to 1.53 g cm−3 (Table 1). The initial organic matter content ranged from 0.9 to 1.8%, and the total N content ranged from 784.1 to 1348.4 mg kg−1.

Table 1.
Soil’s physical and chemical properties.
The bulk soil samples underwent a series of procedures, including air-drying, grinding, and passing through a 2 mm screen. Subsequently, the soil was backfilled layer by layer into the test pit. Following the completion of backfilling, all test pits were subjected to a month-long irrigation with water, commencing on 10 October 2018 and concluding on 10 November 2018.
In the study, the cotton seeds were annually sown in April from 2019 to 2021 in a designated test pit, and the designated growing season for the cotton crop spanned from 20 April to 30 September. The selected cotton variety for this investigation was Xinluzao No. 66 (Huiyuan®, Urumqi, China). The experimental plots were equipped with a mulch-drip irrigation system, wherein drip irrigation with tape and drippers were spaced at 70 cm and 30 cm, respectively. The cotton was planted in a narrow row spacing of 50 cm and 30 cm and a plant spacing of 8 cm. The field plots were irrigated utilizing submersible pumps and fertilization systems. The primary sources of irrigation water were derived from groundwater, which exhibited a mineralization degree of 0.15 g L−1. Throughout the growth period of the cotton, the nitrogen supply consisted of urea, amounting to 300 kg ha−1, the irrigation intervals were set to every 7–20 days, and the total irrigation quota was consistently maintained at 4500 m3 ha−1. Following the sowing of cotton, a total of nine irrigations were administered.
Each drip irrigation was treated with ammonium-15N-labeled urea, with a 5% atom enrichment and a rate of 300 kg ha−1. Additionally, a compound fertilizer totaling 380 kg ha−1 was applied: 67% 15N-labeled urea, 15% P2O5, 10% K2O, 9% ZnSO4·7(H2O), and 9% H3BO3.
2.3. Methods of Plant and Soil Sampling
In the present study, a total of four cotton plants were chosen in a random manner along the diagonal orientation of the test pit, and the objective was to assess the dry matter mass (expressed in grams per plant) as well as the nutrient status of the cotton plants.
Each plant material collected roots, stems, leaves, and fruit samples. These samples were subjected to air-drying at an indoor temperature of 23 °C in a well-ventilated room with a relative humidity of 40%. Subsequently, all plant materials were weighted five times using a balance (Radwag, WL-219-0003, Radom, Poland) with a precision of 0.01 g to determine the dry matter mass [19]. The lint cotton yield of each test pit was determined through three rounds of manual harvesting conducted during the initial phase (20 September to 5 October every year from 2019–2021).
In the study of cotton, various parameters, including emergence rate, survival rate, plant height, leaf area index, and chlorophyll concentration (SPAD index), were assessed at different growth stages across three distinct locations. The emergence rate and survival rate of cotton were measured after the first irrigation at the seedling stage (21 April). The emergence rate denotes the ratio of germinated seeds to the total number of seeds sown, which was determined through the random selection of three rectangular areas measuring 2 m × 2 m. The survival percentage represents the proportion of surviving seedlings to the initial number of seedlings and was measured at three-day intervals.
The plant height, leaf area index, and chlorophyll concentration were measured at the end of the boll opening (20 September). To capture the overall growth pattern, three representative oil sunflowers were chosen at each growth stage, and their plant height was measured from the main stem. The leaf area index was measured using a cotton leaf area meter (TOP-3000, Shandong Holde, Qingdao, China), and the chlorophyll concentration was measured using SPAD.
Soil samples were collected three times at 0–20 (S1), 20–40 (S2), and 40–60 cm (S3) layers before the cotton first irrigation (21 April) and two days after the last irrigation (1 September) each year. The sampling sites were located in the wide cotton rows, narrow rows, and bare ground in the test pit, with a total of 324 soil samples. Soil electrical conductivity (EC, dS m−1) was measured using an EC meter (Model DDS-11A, Leici, Shanghai, China), and the total nitrogen (N) content in the soil was analyzed using an elemental analyzer (EL III, Elementar, Langenselbold, Germany).
2.4. Cotton N Uptake
The 15N abundance of cotton organs and soil samples was analyzed using an isotopic ratio mass spectrometer (Thermo-Fisher Scientific, Waltham, MA, USA). The N content in various organs of cotton was calculated using the following equation:
where is the N accumulation in various organs of cotton (roots, stems, leaves, and fruits, mg plant−1), is the N content (mg g−1), and is the dry matter mass (mg plant−1).
All indicators related to 15N isotopes in cotton and soil were calculated using Formulas (2)–(4), respectively. Including the proportion of N absorbed by various organs of cotton derived from the 15N-labeled urea (NDFF, %), 15N use efficiency by various organs of cotton (, %, 15N isotopic tracer method) the formula was shown as follows:
where is the 15N abundance of the treated cotton sample (roots, stems, leaves, and fruits, %), is the 15N abundance of cotton grown in unlabeled soil (background value about 0.3663 atom %15N, %), is the 15N abundance of the applied fertilizer (%), and is the amount of 15N-labeled urea applied to the N fertilizer.
2.5. Statistical Analysis
The normality of soil and cotton N data was assessed using the Kolmogorov–Smirnov test and the Shapiro–Wilk normality test. One-way analysis of variance (ANOVA) of all the data was performed using SPSS 19.0 (SPSS, Institute Inc.®, Chicago, IL, USA) to compare means of differential N uptake, soil electrical conductivity, and dry matter mass. The test results were tested by a Gaussian distribution and variance test. Significance was set to p < 0.05 (* indicates p < 0.05, ** indicates p < 0.01, *** indicates p < 0.001), the different letters or different group of letters indicate that they are significantly different. Correlations were evaluated using the Pearson product moment correlation test.
3. Results
3.1. N Use Efficiency from Various Cotton Organs
3.1.1. The Proportion of 15N from Fertilizers in Various Organs of Cotton
The NDFF, commonly interpreted as the proportion of nitrogen (N) absorbed by crops originating from 15N-labeled urea, serves as a measure of the extent to which the amount of 15N-labeled fertilizer absorbed and distributed by crops contributes to the total nitrogen content of the organ. By discerning the distribution of 15N isotopes, the capacity of different crop organs to uptake and regulate nitrogen from 15N-labeled fertilizer can be assessed. Notably, the NDFF of cotton roots in the C2 and C3 treatments exhibited a significantly lower value compared to the other treatments within the 40–60 cm soil layer (Figure 2). Nevertheless, no significant difference in NDFF between the treatments in the 0–20 cm soil layer was detectable (p > 0.05), with values ranging from 2.1% to 2.6%, respectively. The soil salt stress resulted in smaller differences in the NDFF of the control treatment and C1, with a range of 0.3% to 0.8%. However, the disparity in cotton fruits between the control treatment and C4 treatments was 2.8%. As the soil salt stress increased from the control treatment to C1, the capacity of cotton stems and fruits to uptake and regulate nitrogen strengthened gradually, while the leaves decreased slightly. The NDFF of cotton aboveground organs (stem, leaf, and fruit) in the C2 treatment exhibited a significant decrease compared to the other three treatments. This observation suggests that the capacity of cotton to uptake and regulate nitrogen was weakened under the C2 treatment, or alternatively, it suggests that the direct contribution rate of fertilizer to cotton was the least pronounced under C2 conditions.
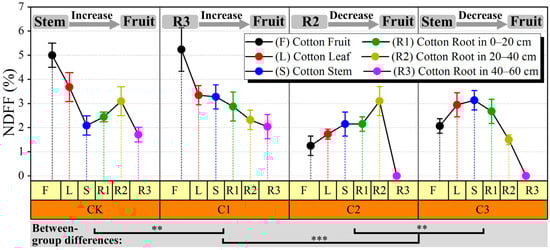
Figure 2.
Effect of salt stress on cotton NDFF (%).
3.1.2. Subsubsection
The 15N use efficiency (NUE) of the cotton leaves and fruit ranged from 3.1 to 18.7% across the treatments, which was significantly affected by the soil salt stress (Figure 3b,c). The root NUE of plants in the C2 and C3 treatments was significantly different (p < 0.05) at a sampling depth of 20–60 cm. Overall, the cotton fruit NUE in the control treatment was significantly different from that of the C2 and C3 treatments, and the C1 treatment was 52.1% higher than that of the fruit NUE in the control treatment. There was a significant decrease in the root NUE with the increase in soil depth (Figure 3d–f). From 2020 to 2021, The root NUE in the control treatment at 40–60 cm soil layer was significantly higher than in the other treatments; however, the root NUE in the control treatment and C1 treatments at 0–20 cm soil layers was not significantly different.
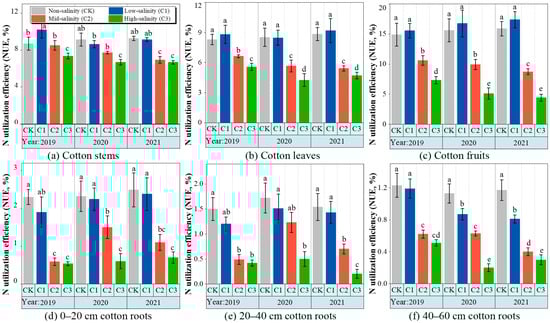
Figure 3.
The changes in nitrogen utilization efficiency in different organs of cotton under soil salt stress from 2019 to 2021. See Figure 2 for abbreviations of reclamation types.
3.2. Cotton Growth and Lint Yield
The lint yield and growth index of cotton from 2019 to 2021 are presented in Table 2. In the stage of cotton seedling emergence, the average seedling emergence rates of the C1, C2, and C3 treatments were found to be 15.3%, 14.6%, and 36.4% lower than the control treatment. Additionally, the 3-year average survival rates for the C1, C2, and C3 treatments were recorded as 75.5%, 71.0%, and 33.4%, respectively. During the cotton boll opening stage, the plant height and chlorophyll content of the control treatment were found to be significantly different compared to those of the C2 and C3 treatments. Conversely, the C1 treatment exhibited the highest leaf area index and lint yield, reaching 2896.6 kg ha−1 in 2021. These findings suggest that an increase in soil electrical conductivity (EC) from 1.0 to 4.0 dS m−1 (the control treatment to C1) may limit the emergence rate of cotton as well as its plant height and chlorophyll content. Additionally, the leaf area index and lint yield of cotton showed a slight increase over the years (from 2019 to 2021), although this growth was not statistically significant (p < 0.05).
Table 2.
The aboveground biomass index of cotton during the boll opening period under salt stress.
3.3. Total N Contents in Cotton
The findings presented in Figure 4 illustrate the impact of soil salt stress on the overall nitrogen content (TN) of cotton, encompassing its roots, stems, leaves, and fruits. Notably, the TN levels of the roots were 3–10 times lower than those of the stem, leaf, and fruit. This discrepancy was particularly pronounced in the C3 treatments, where the roots in the 40–60 cm soil layer exhibited no biomass. The cotton fruit in the C1 treatment exhibited the highest TN content (28.9 mg g−1) with statistical significance (p < 0.05). Moreover, the TN content in cotton stems, leaves, and fruits under the C1 treatment was marginally higher compared to the control treatment (p < 0.05) but significantly higher than the C2 and C3 treatments (p < 0.001). When the soil salt stress increased from soil C1 to C2 or C3, there was a significant decrease in the TN content in all organs of cotton (p < 0.001). In general, the effects of different soil salinity levels on the total nitrogen content of cotton organs were significantly different (Table 3). The interannual variability of TN content in cotton fruit was significantly affected by soil salt stress. Specifically, the TN content of cotton fruit treated with C2 exhibited an increase from 19.7 mg g−1 in 2019 to 26.5 mg g−1 in 2021, resulting in an average annual increase of 35.1%.
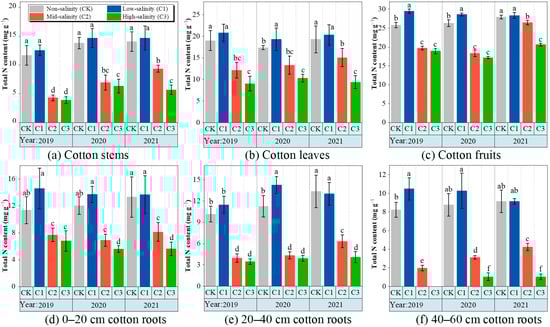
Figure 4.
The changes in total nitrogen content in different organs of cotton under soil salt stress from 2019 to 2021. CK, non-salinity; C1, low salinity; C2, mid-salinity; and C3, high salinity. values followed by different letters in the same column are significantly different at p < 0.05 (LSD test).
Table 3.
Variance analysis of total N content (TN) in cotton.
3.4. The Total Nitrogen Accumulated in the Soils
The accumulation of 15N between the treatments primarily occurred within the 0–40 cm soil layer (Figure 5), with the C3 treatment exhibiting a value of 1.9 mg g−1. Moreover, the accumulation rate reached 3.6%, surpassing that of the C1 treatment (1.5 mg g−1). It is noteworthy that the risk of nitrogen accumulation in soils increases with higher levels of soil salt stress. Furthermore, the total N content in soils was not of the same order of magnitude as that of cotton stems, leaves, and fruits (Figure 2). In comparison to the C2 and C3 treatments, the control treatment exhibited a statistically significant disparity (p < 0.001) in terms of total nitrogen content. Conversely, the control treatment demonstrated no significant distinction when compared to the C1 treatment. Nevertheless, as the soil salinity level increased, the total nitrogen content in the uppermost soil layer (0–20 cm) also increased, resulting in a more pronounced discrepancy in total nitrogen content across each soil layer.
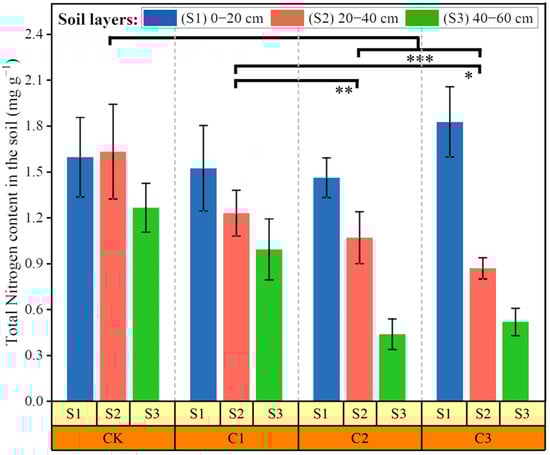
Figure 5.
The amount of total nitrogen content in the soils: S1, 0–20 cm soil layer; S1, 20–40 cm soil layer; and S3, 40–60 cm soil layer.
3.5. Regression Analysis between Cotton NUE, Lint Yield, and Soil EC
The regression analysis between cotton lint yield, nitrogen use efficiency (NUE), and soil electrical conductivity (EC) is depicted in Figure 6 through regression analysis. The results indicate significant quadratic correlations (p < 0.01) between the lint yields of cotton (y2, %) and soil EC (x, dS·m−1), and soil EC (x, dS·m−1), as well as between cotton NUE (y1, %) and soil EC (x, dS·m−1). Specifically, when cotton NUE (y1, %) and lint yields (y2, %) reached 95% of the theoretical maximum value, the soil EC was 4.2 and 3.7 dS·m−1; while the cotton NUE (y1, %) and lint yields (y2, %) reached 90% of the theoretical maximum value, the soil EC was 4.1 and 5.6 dS·m−1.
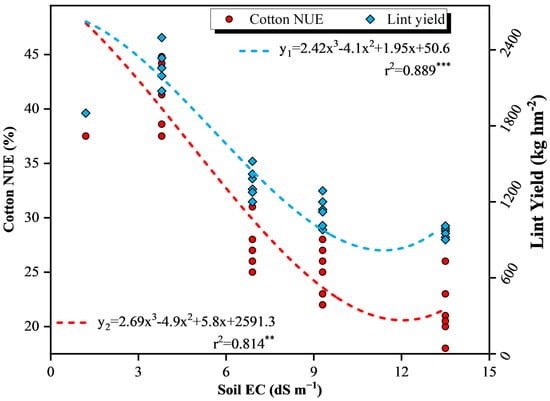
Figure 6.
Regression analysis between the relative lint yield and cotton N use efficiency (NUE) of the soil electrical conductivity (EC).
4. Discussion
4.1. Effects of Soil Salt Stress on Cotton Growth and Total N Content
Soil salinity stress has been found to significantly decrease the rate of seedling emergence and plant height while also severely inhibiting the uptake of nitrogen by cotton roots [20,21]. The attainment of optimal root distribution and the establishment of a favorable growth environment for the canopy, stems, and leaves of cotton plants are essential factors for achieving high yields [22]. Cotton, as a straight-rooted plant, possesses a root system that is both extensive and deep, consisting primarily of primary roots, lateral roots, and hairy roots. The primary roots of the cotton plant exhibit a growth of 10 cm, which subsequently gives rise to the development of lateral roots [19]. Consequently, the electronic endoscope is limited to scanning the lateral roots and hairy roots exclusively [23]. In the non-salinity test pit (CK), the length of the cotton plant’s lateral roots surpassed that of the other three treatments, predominantly occupying the 20–40 cm soil layer. However, the distribution area of the lateral roots was significantly lower compared to the low-salinity treatment (C1). In the C1 test pit, the cotton plant’s lateral roots primarily exhibited vertical growth. Among the observed roots, it was found that the hairy roots in the soil layer of 10–20 cm predominantly exhibited a nearly horizontal growth pattern, whereas the hairy roots in the soil layer of 20–40 cm displayed a more uniform lateral growth. The C2 treatment applied to cotton resulted in a reduced presence of hairy roots, with a prevalence of lateral roots. These lateral roots exhibited a curved shape, either white or dark yellow in color, which indicated a limited capacity of cotton lateral roots to generate additional hairy roots in moderately salinized soil. These results reflect those of Hu et al. [24], who also found that the primary root length and density of cotton would decrease with an increase in the soil salinity in the root zone. Furthermore, the transmission of diseases from saline soil to lateral roots increased the likelihood of verticillium wilt in cotton roots [25]. C3 treatment resulted in a decrease in root biomass in the soil layer of 0–40 cm, with some lateral roots being fractured and primarily located in the 10–20 cm soil layer.
The uptake of nitrogen (N) by cotton from its stems, leaves, fruits, and roots in different soil layers can be attributed to two sources. One source is the direct uptake of mineral N present in the soil, while the other source is the uptake of N from fertilizer. In their study, Li et al. [9] demonstrated the efficacy of the 15N-labeled technique in discerning the N uptake of cotton originating from soil mineral N and fertilizer sources. Notably, the N fertilizer needs to undergo two transportation processes before being absorbed by cotton. The specific process consisted of the following: (1) The introduction of N fertilizer into distinct soil strata via irrigation and other methodologies; (2) Initially, cotton roots assimilated a minor portion of N from each soil layer, while the majority of N was subsequently conveyed to the cotton stem through the root system for absorption, ultimately disseminating to the leaves and fruits via the cotton stems [26]. In the present study, C1 treatment had the largest proportion of N content of cotton fruits in 2019, which was 29.7 mg g−1, and the smallest was cotton roots 40–60 cm soil layer. C2 and C3 had the largest proportion of N uptake by cotton leaves in 2019–2021; however, both two scenarios were less than C1 and the control treatment (Figure 4). Moreover, the total N content of cotton roots in low-salinity (C1) soils was higher than that in non-salinity (C1) soil and mainly concentrated in 0–40 cm soil depth. Similar to this, Hou et al. [27] conducted a study that revealed that the total nitrogen content of cotton roots at the low-salinity level was comparatively higher than that of the non-salinity control group (CK). However, the disparity between these two groups did not reach statistical significance (p > 0.05).
4.2. Effects of Soil Salt Stress on Cotton Lint Yield and Nitrogen Content
The cotton plant demonstrates a notable level of salt tolerance, making it suitable for cultivation in arid, saline environments. Zhang et al. [13] reported that cotton seeds have the ability to germinate in soils with low electrical conductivity and moderate salinity levels (4–8 dS m−1). Similarly, Akhtar et al. [28] have determined that the critical value for cotton seed germination was 8 dS m−1. In the present study, the seeds planted in C2 and C3 soil types exhibited an electrical conductivity ranging from 4 to 15 dS m−1. Based on the research conducted by Qayyum and Malik [29], it was observed that the seed cotton yield under low-salinity conditions (C1, 2–4 dS m−1) experienced a significant decrease of 41% compared to non-salinity conditions (CK, 0–2 dS m−1). Furthermore, their study indicated that the seed cotton yield in the C2 treatment (2–4 dS m−1) exhibited a modest increase of 5% when compared to the CK treatment. This discrepancy can be attributed to two potential factors. Firstly, the utilization of unaltered soil from the field may have introduced alterations to the underground soil conditions at the research site. Secondly, in the evaluation of cotton tolerance traits in saline regions, it is crucial to consistently consider the genetic makeup of the salt-tolerant parent genotype. The discrepancy observed in seed cotton yield between the C1 treatment and the CK treatment in this study can be attributed to fluctuations in groundwater level and the specific cotton genotype utilized.
4.3. Effects of Soil Salt Stress on Cotton NUE
Xinjiang is the largest salinization area in northwest China, with a typical continental drought climate. The absorption and utilization of fertilizer nitrogen by cotton are adversely impacted by excessive soil salinity. Zhang et al. [30] demonstrated that the biomass of cotton subjected to severe salt stress was comparatively lower than that under moderate salt stress, while the harvest index exhibited an increase of 8%. This study observed significant variations in cotton’s nitrogen use efficiency across different levels of soil salinity. Specifically, as soil salinity increased, both cotton’s nitrogen absorption and lint yield experienced significant reductions. Villa-Castorena et al. [31] reached the conclusion that the excessive application of fertilizer in the initial phases of plant growth could potentially lead to elevated soil salinity levels and a reduction in chili pepper pod yield. Additional research indicates that, in situations of low-salinity stress, nutrient deficiency has a greater impact on plant growth than salinity itself, and a favorable interaction or an enhanced response to salt tolerance may occur [32]. The present results show that the cotton NUE exhibited a slight increase when the soil salinity level was low (2–4 dS m−1). However, as the soil salinization level increased to mid- or high-salinity levels, the NUE of cotton significantly decreased. The similarity in the low-salinity soil stress of NaCl between the findings of Mahmood et al., who observed that the plants were able to absorb and utilize fertilizer N more effectively, particularly Na+ and K+ ions. The low salt stress (2–4 dS m−1) also facilitated plant cell protoplasm flow and photosynthesis.
5. Conclusions
The purpose of the current study was to investigate the impact of varying levels of soil salinity on the distribution of nutrients in cotton plants, employing the 15N isotopic tracer technique. The findings revealed notable disparities in the nitrogen uptake of cotton roots, stems, leaves, and fruits under soil salt stress. Specifically, the nitrogen content in cotton roots was found to be significantly lower, ranging from 3 to 10 times less, compared to that in stems, leaves, and fruit organs. The capacity of cotton organs to absorb and regulate fertilizer nitrogen in test pits with mid- and high-salinity levels was found to be weak. Heightened soil salt stress poses a greater risk of nitrogen accumulation in the soil, particularly in the surface soil layer (0–20 cm). To guarantee that the cotton’s nitrogen utilization efficiency and lint yield do not fall below 95% of the theoretical maximum, it is imperative to manage the soil salinity levels at or below 4.2 dS m−1. Additional investigation is warranted to gain a deeper comprehension of the factors contributing to secondary salinization of the soil and to establish effective measures for regulating farmland soil salinity.
Author Contributions
Conceptualization, methodology, software, formal analysis, data curation, writing original draft, visualization, T.H.; investigation, resources, supervision, Y.M.; methodology, validation, P.A.; data curation, Z.L.; writing original draft, M.W.; formal analysis, C.L. All authors have read and agreed to the published version of the manuscript.
Funding
This research was funded by the Major Science and Technology Projects of Xinjiang Uygur Autonomous Region (grant number 2022A02003-6); China Postdoctoral Science Foundation (2023M740980); Scientific research projects of universities in autonomous regions (XJEDU2021Y024); Ten-zan youth programmes (2020Q078).
Data Availability Statement
The original contributions presented in the study are included in the article, further inquiries can be directed to the corresponding author.
Acknowledgments
The authors are grateful to the anonymous reviewers and the corresponding editor for their helpful and constructive comments and suggestions for improving the manuscript.
Conflicts of Interest
The authors declare no conflicts of interest.
References
- Shrivastava, P.; Kumar, R. Soil salinity: A serious environmental issue and plant growth promoting bacteria as one of the tools for its alleviation. Saudi J. Biol. Sci. 2015, 22, 123–131. [Google Scholar] [CrossRef] [PubMed]
- Du, L.; Zheng, Z.C.; Li, T.X.; Zhang, X.Z. Effects of irrigation frequency on transportation and accumulation regularity of greenhouse soil salt during different growth stages of pepper—Sciencedirect. Sci. Hortic. 2019, 256, 108568. [Google Scholar] [CrossRef]
- Mittal, D.; Sharma, N.; Sharma, V.; Sopory, S.K.; Sanan, N. Role of microRNAs in rice plant under salt stress. Ann. Appl. Biol. 2016, 168, 2–18. [Google Scholar] [CrossRef]
- Hopmans, J.W.; Qureshi, A.S.; Kisekka, I.; Munns, R.; Taleisnik, E. Critical knowledge gaps and research priorities in global soil salinity. Adv. Agron. 2021, 169, 1–191. [Google Scholar]
- Singh, A. Soil salinization management for sustainable development: A review. J. Environ. Manag. 2021, 277, 111383. [Google Scholar] [CrossRef] [PubMed]
- Mostek, A.; Börner, A.; Badowiec, A.; Weidner, S. Alterations in root proteome of salt-sensitive and tolerant barley lines under salt stress conditions. J. Plant Physiol. 2015, 174, 166–176. [Google Scholar] [CrossRef] [PubMed]
- Lin, X.; Wang, Z.; Li, J. Identifying the factors dominating the spatial distribution of water and salt in soil and cotton yield under arid environments of drip irrigation with different lateral lengths. Agric. Water Manag. 2021, 250, 106834. [Google Scholar] [CrossRef]
- Reddy, A.R.; Reddy, K.R.; Padjung, R. Nitrogen nutrition and photosynthesis in leaves of Pima cotton1. J. Plant Nutr. 2008, 19, 755–770. [Google Scholar] [CrossRef]
- Li, P.; Dong, H.; Zheng, C.; Miao, S.; Liu, A.; Wang, G.P.; Liu, S.; Zhang, S.; Chen, J.; Li, Y. Optimizing nitrogen application rate and plant density for improving cotton yield and nitrogen use efficiency in the North China Plain. PLoS ONE 2017, 12, e0185550. [Google Scholar] [CrossRef]
- Bange, M.P.; Deutscher, S.A.; Larsen, D.; Linsley, D.; Whiteside, S. A handheld decision support system to facilitate improved insect pest management in Australian cotton systems. Comput. Electron. Agric. 2004, 43, 131–147. [Google Scholar] [CrossRef]
- Adeli, A.; Brooks, J.P.; Miles, D.; Misna, T.; Feng, G.; Jenkins, J.N. Combined effects of organic amendments and fertilization on cotton growth and yield. Agron. J. 2022, 21178. [Google Scholar] [CrossRef]
- Dai, J.; Tian, L.; Zhang, Y.; Zhang, D.; Xu, S.; Cui, Z.; Li, Z.; Li, W.; Zhan, L.; Li, C. Plant topping effects on growth, yield, and earliness of field-grown cotton as mediated by plant density and ecological conditions. Field Crops Res. 2022, 275, 108337. [Google Scholar] [CrossRef]
- Zhang, H.; Li, D.; Zhou, Z.; Chen, B.; Meng, Y. Soil water and salt affect cotton (Gossypium hirsutum L.) photosynthesis, yield and fiber quality in coastal saline soil. Agric. Water Manag. 2017, 187, 112–121. [Google Scholar] [CrossRef]
- Hassani, A.; Azapagic, A.; Shokri, N. Global predictions of primary soil salinization under changing climate in the 21st century. Nat. Commun. 2021, 12, 6663. [Google Scholar] [CrossRef] [PubMed]
- Singh, A. Soil salinity: A global threat to sustainable development. Soil Use Manag. 2022, 38, 39–67. [Google Scholar] [CrossRef]
- Ali, Y.; Aslam, Z.; Hussain, F. Genotype and environment interaction effect on yield of cotton under naturally salt stress condition. Int. J. Environ. Sci. Technol. 2005, 2, 169–173. [Google Scholar] [CrossRef][Green Version]
- Ali, M.H. Management of Salt–Affected Soils. Practices of Irrigation & On–Farm Water Management: Volume 2; Springer: New York, NY, USA, 2011. [Google Scholar]
- Moreno, J.; Alonso, J. Evaluation of the usda soil texture triangle through atterberg limits and an alternative classification system. Appl. Clay Sci. 2022, 229, 106689. [Google Scholar] [CrossRef]
- Hulugalle, N.R.; Weaver, T.B.; Finlay, L.A.; Lonergan, P. Soil properties, black root-rot incidence, yield, and greenhouse gas emissions in irrigated cotton cropping systems sown in a Vertosol with subsoil sodicity. Soil Res. 2012, 50, 278. [Google Scholar] [CrossRef]
- Beyyavas, V.; Ramazanoglu, E.; Sakin, E.; Cevheri, C.I.; Seyrek, A. Responses of some soil enzymes and cotton plant to foliar application of ferrous sulfate in a calcareous alkaline soil. J. Plant Nutr. 2023, 46, 3421–3434. [Google Scholar] [CrossRef]
- Filippi, P.; Cattle, S.R.; Bishop, T.F.; Matthew, J.J.; Edward, J. Monitoring changes in soil salinity and sodicity to depth, at a decadal scale, in a semiarid irrigated region of Australia. Soil Res. 2018, 56, 696–711. [Google Scholar] [CrossRef]
- Quijano, M.; Teresa, T.; Ted, C.J.; Paula, G.; Luca, C.; Jose, C.M.; Xoaquin, A.R. Effects of soil salinity on the expression of direct and indirect defences in wild cotton Gossypium hirsutum. J. Ecol. 2021, 109, 354–368. [Google Scholar] [CrossRef]
- Chen, W.; Chen, F.; Lai, S.; Jin, M.; Xu, S.; Liu, Y.; Liang, X.; Ferré, T. Spatial distribution and dynamics of cotton fine root under film-mulched drip irrigation. Ind. Crops Prod. 2022, 179, 1146931. [Google Scholar] [CrossRef]
- Hu, S.; Shen, Y.; Chen, X.; Gan, Y.; Wang, X. Effects of saline water drip irrigation on soil salinity and cotton growth in an Oasis Field. Ecohydrology 2013, 6, 1021–1030. [Google Scholar] [CrossRef]
- Bhute, N.; Vamadevaih, H.M.; Katageri, I.S. In vitro screening for salinity stress at seedling stage of cotton. Karnataka J. Agric. Sci. 2012, 25, 39–42. [Google Scholar]
- Malik, K.; Mehta, A.K.; Thakra, S.K. Quality parameters, nitrogen content and uptake of cotton cultivar h-1098(i) and nutrient status of soil influence by different spacing and nitrogen applicationion. Int. J. Curr. Microbiol. Appl. Sci. 2021. [Google Scholar] [CrossRef]
- Hou, Z.; Chen, W.; Li, X.; Xiu, L.; Wu, L.S. Effects of salinity and fertigation practice on cotton yield and 15N recovery. Agric. Water Manag. 2009, 96, 1483–1489. [Google Scholar] [CrossRef]
- Akhtar, N.; Masahiro, Y.; Hidetoshi, I.; Daiki, H.; Taisuke, K.; Takeshi, I. Effects of ozone on growth, yield and leaf gas exchange rates of two bangladeshi cultivars of wheat (Triticum aestivum L.). Environ. Pollut. 2010, 158, 1763–1767. [Google Scholar] [CrossRef]
- Qayyum, M.A.; Malik, M.D. Farm production losses in salt affected soils. First Natl. Congr. Soil Sci. 1988, 12, 6–8. [Google Scholar]
- Zhang, D.; Li, W.; Xin, C.; Wei, T.; Eneji, A.; Dong, H. Lint yield and nitrogen use efficiency of field-grown cotton vary with soil salinity and nitrogen application rate. Field Crops Res. 2012, 138, 63–70. [Google Scholar] [CrossRef]
- Villa-Castorena, M.; Ulery, A.L.; Catalan-Valencia, E.A.; Remmenga, M.D. Salinity and nitrogen rate effects on the growth and yield of chili pepper plants. Soil Sci. Soc. Am. J. 2003, 67, 1781–1789. [Google Scholar] [CrossRef]
- Heng, T.; He, X.; Yang, G.; Tian, L.; Li, F.; Yang, L.; Zhao, L.; Feng, Y.; Xu, X. Growth and nitrogen status of cotton (Gossypium hirsutum L.) under salt stress revealed using 15N-labeled fertilizer. J. Plant Ecol. 2022, 15, 1213–1226. [Google Scholar] [CrossRef]
Disclaimer/Publisher’s Note: The statements, opinions and data contained in all publications are solely those of the individual author(s) and contributor(s) and not of MDPI and/or the editor(s). MDPI and/or the editor(s) disclaim responsibility for any injury to people or property resulting from any ideas, methods, instructions or products referred to in the content. |
© 2024 by the authors. Licensee MDPI, Basel, Switzerland. This article is an open access article distributed under the terms and conditions of the Creative Commons Attribution (CC BY) license (https://creativecommons.org/licenses/by/4.0/).