1. Introduction
Wheat is one of the food crops with the largest planting area in China [
1]. Fertilization can maintain high and stable wheat yield by influencing the components of the wheat [
2,
3]. Because of the excessive pursuit of high wheat yield, farmers increase the amount of fertilizer applied; this unreasonable over-application of fertilizer not only reduces the fertilizer utilization rate but also promotes soil acidification and salinization, which have adverse consequences [
4,
5,
6].
For this reason, Meng et al. found that the application of organic fertilizer can increase the available nutrients in the soil, enhance the ability of soil water and fertilizer retention, and promote the development of soil microorganisms. Reproduction alleviates the problems caused by excessive fertilization such as soil acidification and soil nutrient loss [
7,
8,
9]. Organic fertilizers not only contain a variety of organic nutrients but also contain a variety of inorganic nutrients and a large number of enzymes and microorganisms, which can be provided in a comprehensive and balanced way. Nutrients are required by different growth stages. The application of organic fertilizer can increase the number of ears, yield, above-ground dry matter accumulation, and nitrogen accumulation of wheat and reduce the harvest index [
10,
11,
12]. The content of organic matter in soil is straightforward. It affects the water and fertility retention, buffering, and aeration of soil [
13]. Organic fertilizer affects these factors more. The biggest advantage of fertilizer is that it can increase the content of organic matter in the soil and improve the fertility of the soil [
14]. Owing to the slow effect of organic fertilizer, during the growing season, its application alone cannot meet the needs of farmers to increase crop production [
15]. Therefore, the effect of organic fertilizer will not be the same as that of chemical fertilizer, requiring the same replacement proportion to alleviate the loss of soil nutrients and meet the needs of farmers to increase wheat production.
Researchers have long been concerned about the reasonable allocation of organic and inorganic fertilizers such that the maximum extent of increased wheat yield, improved soil fertility, and increased fertilizer utilization can be achieved. Studies have shown that different proportions of organic fertilizer as a replacement for inorganic fertilizer have significant effects on the total nitrogen, phosphorus, and potassium availability in soil. The higher the proportion of organic fertilizer, the higher the content of total nitrogen, phosphorus, available potassium, and organic matter. Some organic fertilizer substitution treatments have significantly improved the utilization rate, absorption, and physiological utilization [
16,
17,
18]. When organic fertilizer is used with chemical fertilizer, the application of machine fertilizer does not require a higher proportion but rather a better mix in the right proportion [
19].
Organic fertilizer with varying substitution ratios is suitable for various crops under different soil fertility levels and locations. Prior to this study, there were few consecutive years of site-specific experimental studies on the effects of different organic fertilizer replacement rates on spring wheat in Xinjiang, so the organic fertilizer replacement rates of spring wheat in Xinjiang were also unknown. Therefore, to determine the effects of different organic fertilizer replacement rates on soil nutrient content and spring wheat plant nutrition in an oasis farmland in Xinjiang, exploring the effects on absorption, fertilizer utilization, and yield is essential. This study was conducted to determine the best proportion of organic fertilizer necessary to replace chemical fertilizer. This study aims to provide a basis for the amount of organic fertilizer required to decrease the chemical fertilizer application necessary for wheat growth.
2. Materials and Methods
2.1. Experiment Design
The experiment was conducted at the College of Agriculture, Shihezi University (44°31′ N, 86°05′ E), from 2018 to 2020. The soil type in the test area was irrigated grey desert soil with 20.5 g kg−1 organic matter (SOM), 64.6 mg kg−1 alkali-hydrolyzed nitrogen (AH-N), 32.4 mg kg−1 available phosphorus (Pav), 203 mg kg−1 available potassium (Kav), and a pH of 7.87. The test crop was a spring wheat variety called Xinchun 38. The varieties were selected and bred by the Crop Institute of Xinjiang Academy of Agricultural Reclamation Sciences, Shihezi City, Xinjiang, China. The experimental land is owned by Shihezi University, and the experiment was carried out with the permission of the College of Agriculture of Shihezi University.
Six treatments were used in this experiment: the control group with no fertilizer (CK), a group that uses normal nitrogen and phosphorus fertilizer (CF), and the treatments, where 6%, 12%, 18%, and 24% of N and P from mineral fertilizers were substituted with an equivalent dose of these macronutrients introduced with the organic fertilizer (SF6, SF12, SF18, and SF24). The total amount of nitrogen and phosphorus was the same for each treatment group and amounted to 300 kg of N hm−2 and 133 kg P hm−2. The treatments each had three repetitions in a random block arrangement in a residential area of 16.8 m2 (2.4 m × 7 m). The wheat was planted in 16 rows with 15 cm spacing; the seeding amount was 300 kg hm−2. For watering, we used drip irrigation with one pipe every four rows and a total volume of irrigation water of 6000 m3 hm−2. Urea (N, 46%) was used as the N fertilizer, and heavy superphosphate (P, 44%) and monoammonium phosphate (N, 12%; P, 61%) were used as the base and topdressing P fertilizers, respectively. The commercial organic fertilizer (N, 1.78%; P, 1.96%; K, 0.53%; organic matter, 48.5%) used in the base fertilizer was a solid granular fertilizer of uniform size processed using soybean meal and maize straw as raw materials, which was provided by Zeshang Fertilizer Co., Ltd. (Shihezi City, Xinjiang, China).
The test was conducted at the same location for three consecutive years. A total application of 24% of the fertilizer was treated as the base fertilizer, and the remaining fertilizer was applied with the water droplets during the growth period, which had five fertilization points: seedling (10%), flowering (applied 10% of the fertilizer), filling (6%), jointing (30%), and booting (20%). Other cultivation management measures were at the local level, and all straw was returned to the field after the wheat harvest.
The crop samples were collected and evaluated In 2020. Moreover, soil samples (0–20 cm) from the experimental field were collected before each period: seedling (late April), jointing (mid-May), booting (early June), flowering (mid-June), grouting (late June), and harvest (mid-July). The five-point method was collected near the drip irrigation belt in each district for the soil samples. The debris was removed, and the samples were air-dried, ground, and sifted for preservation before the soil nutrients were determined.
2.2. Soil Nutrient Contents
Soil-available nutrients refer to nutrients that can be directly absorbed and utilized by crops in the current season. The level of available nutrients is an indicator of the intensity of soil nutrient supply and a basic guarantee for crops to obtain a high yield [
20]. For verification:
Soil alkaliolytic nitrogen (AH-N) was measured using the alkaliolytic diffusion method: An air-dried soil sample of 2 g was weighed and placed in the diffusion chamber, the H3BO3- indicator was applied to the inner chamber, ground glass was bonded with an alkaline adhesive solution, and 10 mL of NaOH was added to the outer chamber. In a 40 ± 1 °C incubator, the NH3 was removed after 24 ± 0.5 h of alkaline hydrolysis diffusion, and the NH3 in the absorption solution in the inner chamber was determined with 0.005 mol L−1 (1/2 H2SO4) standard liquid.
Soil available phosphorus (Pav) was extracted using the NaHCO3 and molybdenum antimony resistance colorimetric method: We weighed 2.5 g of air-dried soil sample into a 150 mL triangular bottle, added 50 mL of 0.5 mol L−1 NaHCO3 solution, and then filtered the filtrate into a 100 mL triangular bottle after shaking for 30 min on the oscillator. We then absorbed 10 mL of the filtrate into a 150 mL triangular bottle, accurately added 35 mL of distilled water, and then added 5 mL of the Mo antimony anti-reagent. It was shaken well and compared using a spectrophotometer (Shanghai Yidang Analytical Instrument Co., Ltd., Shanghai, China).
Soil available potassium (Kav) was determined using ammonium acetate extraction and flame spectrophotometry: We weighed 5 g of air-dried soil in a 100 mL triangle bottle and extracted it with an ammonium acetate solution. Available potassium was determined by a flame photometer.
Soil organic matter (SOM) was determined using the potassium dichromate oxidation external heating method: We weighed 0.5 g of air-dried soil in a hard test tube, added 5 mL of 0.8 mol L−1 potassium dichromate standard solution, added 5 mL of the concentrated H2SO4 solution, heated the oil bath (oil bath temperature 180 °C, boiling for 5 min), and then used a ferrous sulfate solution to determine the remaining potassium dichromate content and calculate the organic carbon content.
2.3. Fertilizer and Wheat Indices
Fertilizer utilization efficiency is the main index reflecting the absorption and utilization of fertilizers by crops. Agronomic utilization efficiency is a more accurate index for evaluating increases in fertilizer yield. Partial productivity is an important index that reflects the comprehensive effects of basic soil nutrient levels and fertilizer application. Reducing the application of chemical fertilizers is an effective way to improve their utilization.
The formula involved is as follows:
RE: Recovery efficiency;
PAF: Plant nutrient accumulation in the fertilized area;
PAU: Plant nutrient accumulation in the unfertilized area;
TAA: Total nutrient application amount;
PEP (kg·kg−1): Partial factor productivity;
YF: Yield of fertilized plot;
NA: Nutrient application rate;
AUE: Agronomic use efficiency;
YF: Yield of fertilized plot;
YWF: yield in plots without fertilization;
To determine the wheat yield, at the time of wheat harvest, three small 1 m2 plots were randomly selected to determine the panicle number, grain number per panicle, 1000-grain weight, and yield.
2.4. Data Analysis
The precision (X ± SD) of the test results is expressed by the arithmetic mean and standard error. Microsoft Excel 2010 software (Microsoft, Redmond, WA, USA) and SPSS 19.0 data analysis software (IBM Inc., Amok, NC, USA) were used for statistical calculation, statistical inspection, and square difference of test data Analysis and other work. Origin 2018 (OriginLab Inc., Northampton, MA, USA) was used to make a columnar accumulation chart.
3. Results
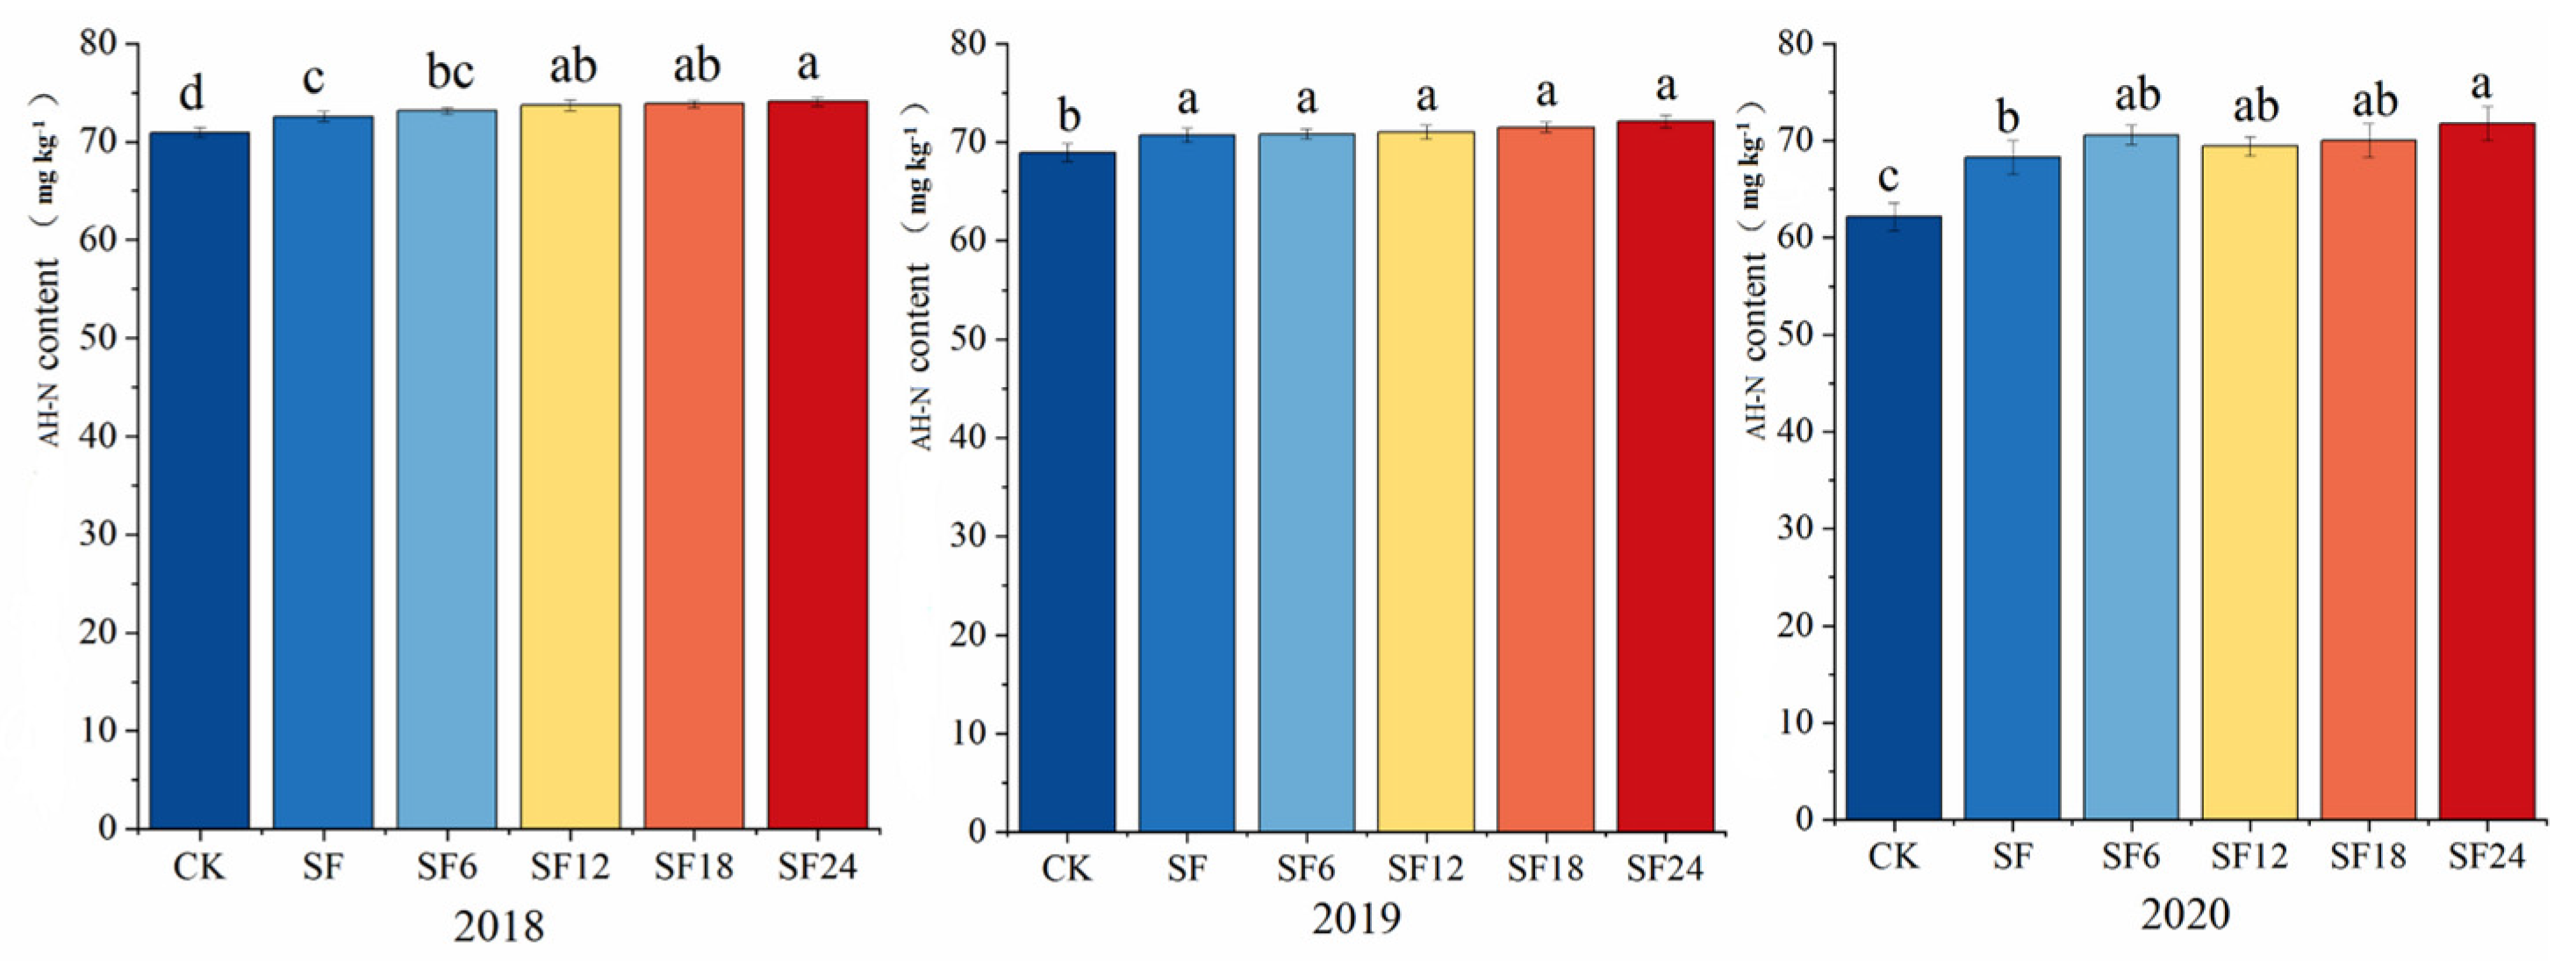
3.1. Soil Alkaline Hydrolyzable Nitrogen (AH-N) Content
Figure 1 shows that the application of organic fertilizer significantly increased the soil AH-N content compared with conventional fertilizers, with the AH-N content increasing with an increase in the organic fertilizer substitution ratio. In 2018, the SF24, SF12, and SF18 treatments showed no significant differences, having significantly higher AH-N content than the other experimental treatments. SF24, SF12, and SF18 also did not have significant differences in 2019, showing significantly higher amounts of AH-N content than the CK treatment. After three consecutive years of the experimental treatment, the SF24 treatment significantly increased the soil AH-N content by 15.39% and 5.13% compared with the CK and CF treatments, respectively. The other organic fertilizer substitution treatments showed no significant differences in soil AH-N content. The SF18 and CF treatments did not exhibit significant differences; however, compared with CF, soil AH-N content increased by 12.58%. Therefore, although soil AH-N content increased with an increase in the organic fertilizer substitution ratio, the increase was not significant.
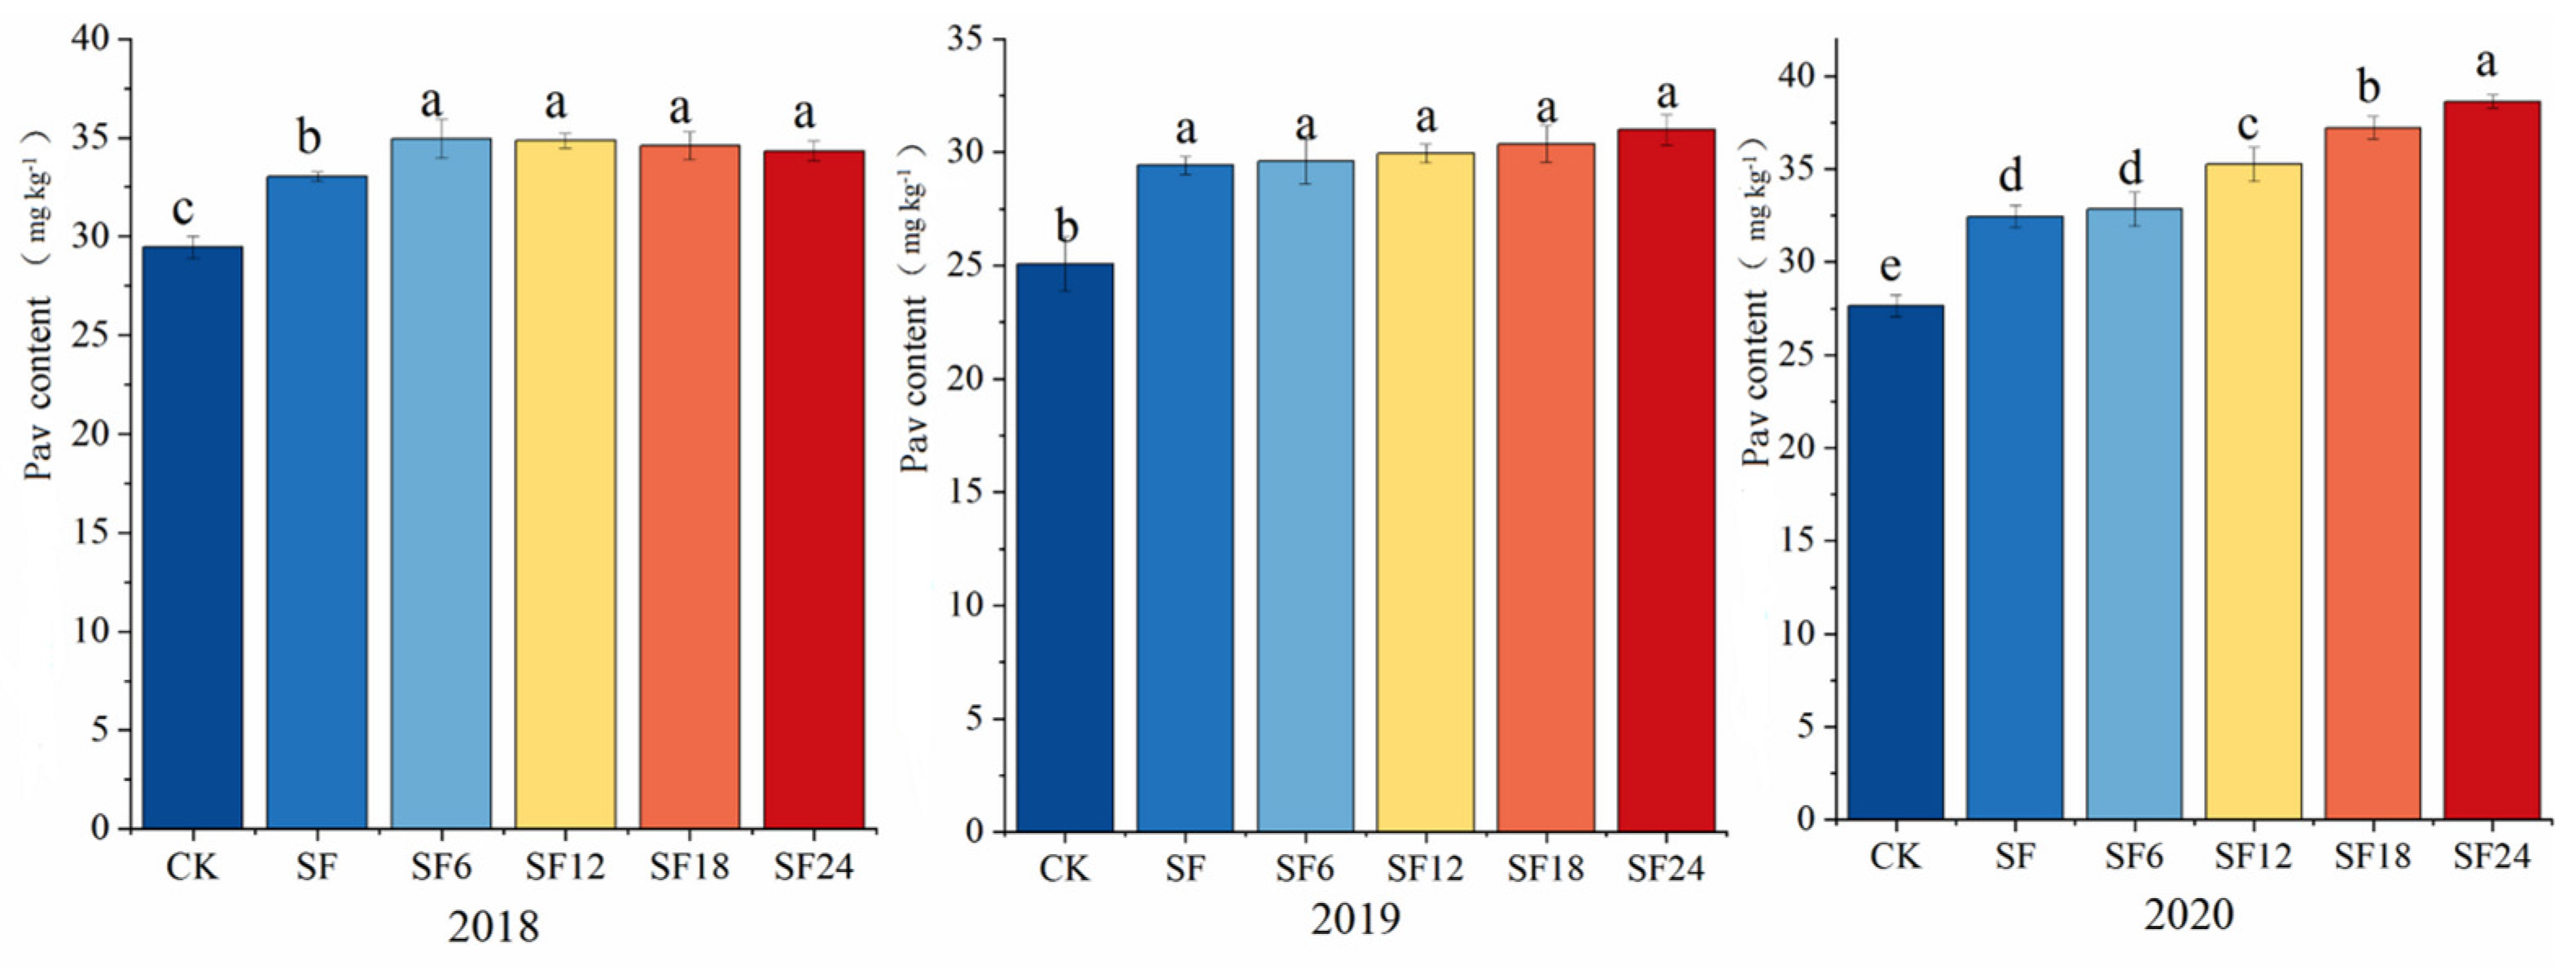
3.2. Soil Available Phosphorus Content
The Pav content in the soil was affected by the increase in the substitution ratio of organic fertilizer, with the Pav content in the soil increasing with increasing experimental years. In the 2018 experiment, the different organic fertilizer substitution treatments did not exhibit any significant differences in Pav content, but they were significantly higher than those in the CK and CF treatments. In particular, the SF18 treatment significantly increased the soil Pav content by 17.41% and 4.72% compared with the CK and CF treatments, respectively. In 2019, the fertilization treatments also showed no significant differences, but the Pav content was significantly higher than that in the CK treatment. In 2020, the soil available phosphorus under each fertilization treatment increased in the order of SF24 > SF18 > SF12 > SF6 ≈ SF > CK. Compared with SF18, SF12, SF6, CF, and CK treatments, the SF24 treatment increased by 3.76%, 9.62%, 17.63%, 19.08%, and 39.71%, respectively, and there were significant differences. The SF18 treatment significantly increased the available phosphorus by 5.64%, 13.37%, 14.77%, and 34.65% compared with SF12, SF6, CF, and CK, respectively (
Figure 2).
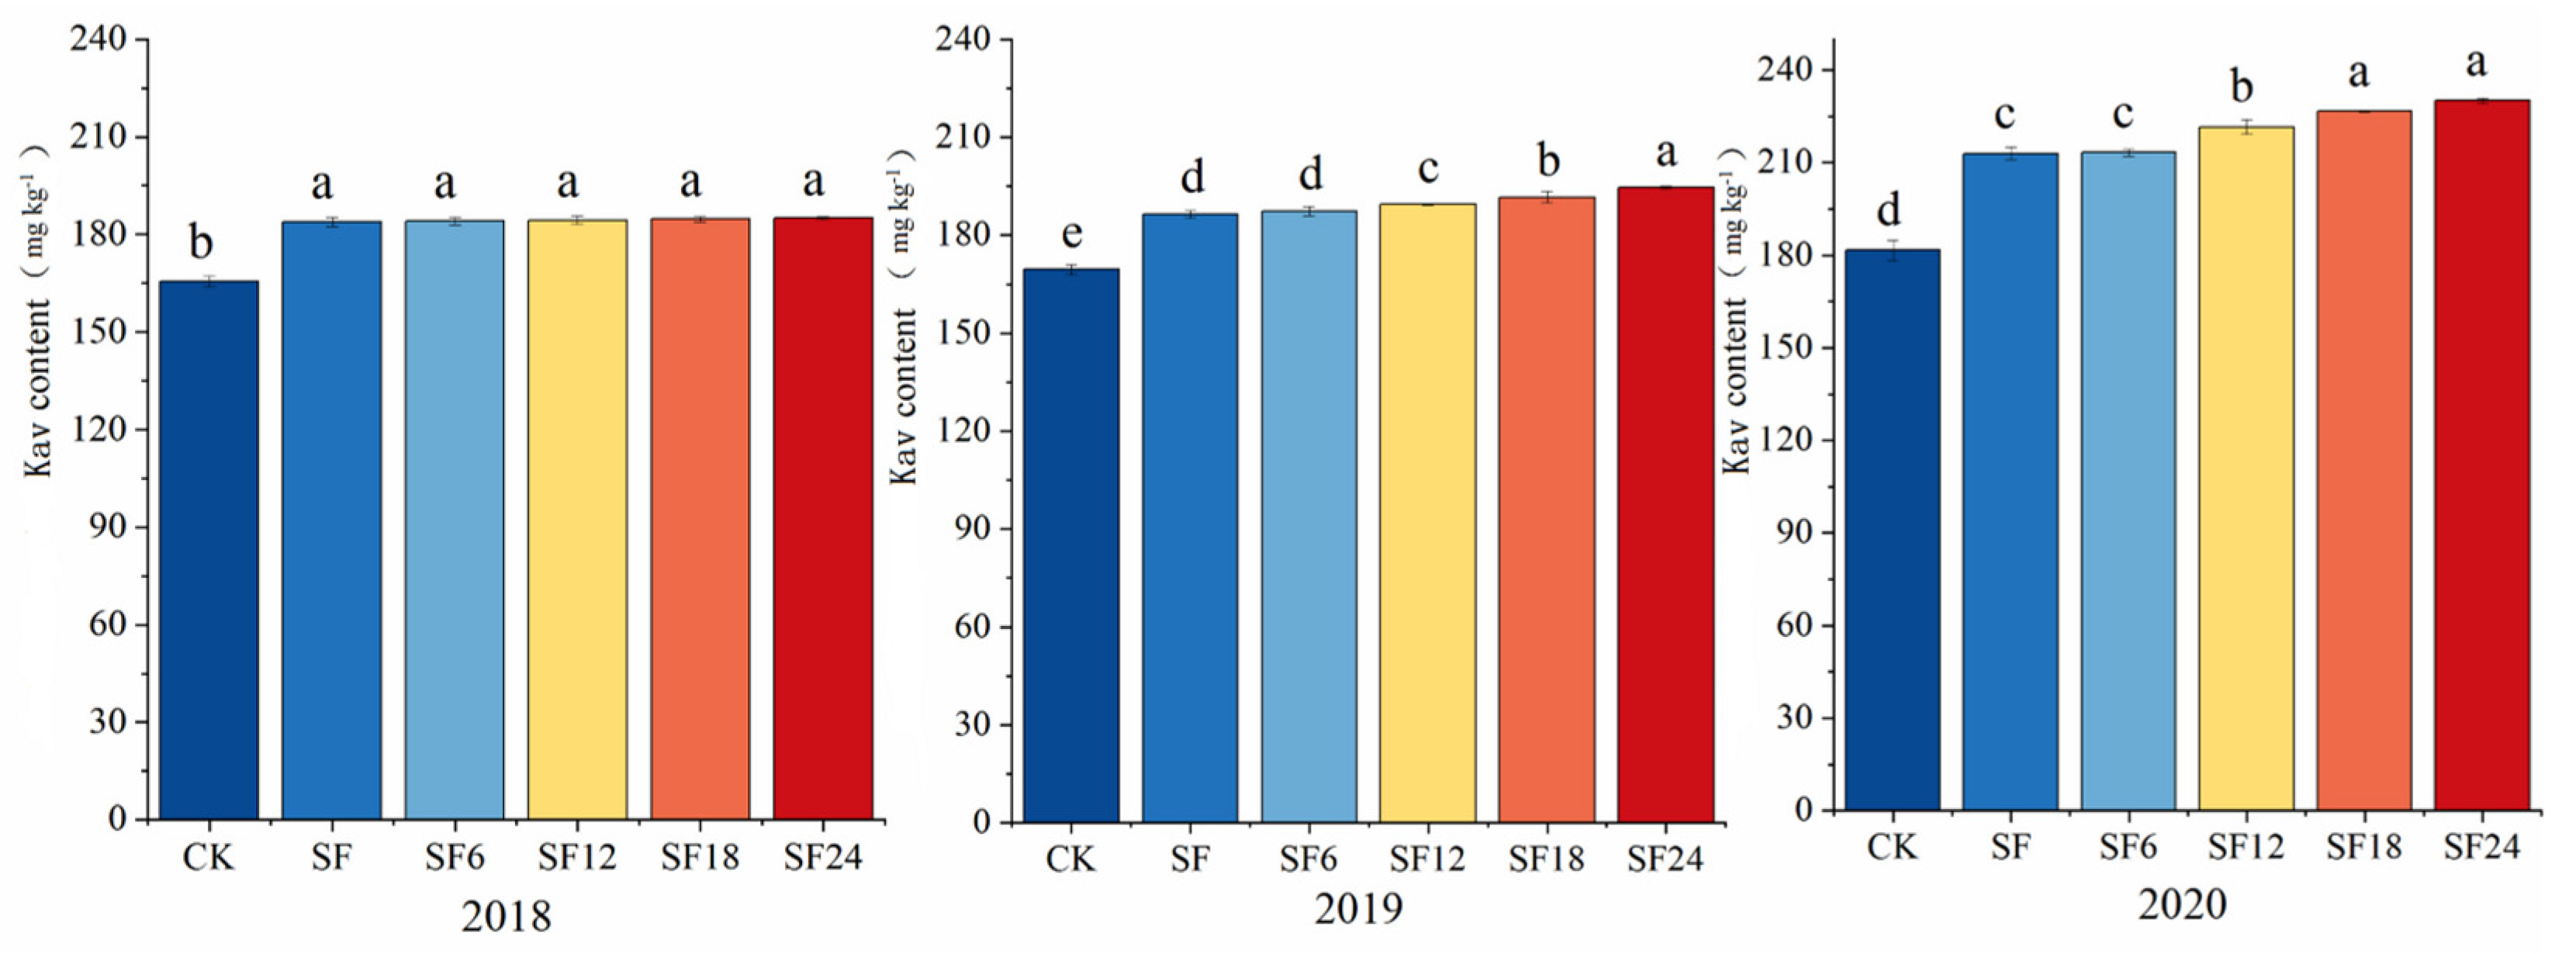
3.3. Soil Available Potassium Content
As shown in
Figure 3, in the first year of the experimental treatment, the soil Kav content did not significantly differ among the fertilization treatments, but it was significantly higher than that of the CK treatment. In 2019, except for the CF and SF6 treatments, the Kav content in the other treatments differed significantly, with the SF24 and SF18 treatments significantly increasing by 14.83% and 4.41% and 13.08% and 2.81% compared with the CK and CF treatments, respectively. In 2020, the difference between the SF18 and SF24 treatments was not significant, but their Kav contents were significantly higher than those in the other treatments. Compared with the SF12, SF6, and CF treatments, SF24 significantly increased the soil Kav content by 3.84%, 7.87%, and 8.04%, respectively, and SF18 by 2.32%, 6.29%, and 6.46%, respectively. The available potassium using the SF6 and CF treatments did not differ significantly but was significantly higher than the CK treatment. Therefore, the application of organic fertilizers was conducive to increasing the Kav content in the soil.
3.4. Soil Organic Matter Content
As shown in
Figure 4, after three years of continuous treatment with organic fertilizer instead of chemical fertilizer, the SOM content in each treatment increased to different degrees with an increase in the proportion of organic fertilizer. In 2018, the organic matter content using the SF24 treatment was significantly higher than the other treatments, with increases of 8.38% and 17.34% compared with the CF and CK treatments, respectively. In 2019, the SF12, SF18, and SF24 treatments exhibited no significant differences, but their SOM contents were significantly higher than the other treatments, except for the SF24 treatment, which increased SOM content by 5.84%, 6.59%, and 15.54% compared with the SF6, CF, and CK treatments, respectively. Moreover, the SF18 treatment significantly increased the organic matter by 3.73%, 4.46%, and 13.24% compared with the SF6, CF, and CK treatments, respectively. In 2020, the SOM content using the SF24 and SF18 treatments showed no significant difference; in particular, SF24 significantly increased SOM content by 21.33% and 7.54% compared with the CK and CF treatments. Meanwhile, the SF18 treatment increased the organic matter by 20.68% and 6.96% compared with the CK and CF treatments, respectively, which was also significant.
3.5. Wheat Fertilizer Utilization Rate
Table 1 shows the effects of replacing chemical fertilizer with different proportions of organic fertilizer on the utilization rate of wheat fertilizer for three consecutive years. The replacement of chemical fertilizers with organic fertilizers significantly improved the fertilizer utilization rate while reducing the application of chemical fertilizers. In 2018, the nitrogen efficiencies of the SF12 and SF24 treatments were significantly higher than those of the CF treatment. The utilization rate of phosphorus fertilizer in the SF12, SF18, and SF24 treatments was significantly higher than that in the CF treatment. Moreover, the utilization rate of nitrogen fertilizer did not significantly differ among treatments. The agronomic utilization rate of phosphorus fertilizers treated with SF12 and SF18 and partial productivity of nitrogen and phosphate fertilizers was significantly higher than that of the CF treatment. In 2019, the nitrogen utilization rate of the SF12 and SF24 treatments was significantly higher than that of the CF treatment, with the agricultural utilization rate of nitrogen and phosphorus fertilizers and partial productivity of nitrogen and phosphorus fertilizers showing that the organic fertilizer replacement fertilizer treatment was significantly higher than that of the CF treatment. The increase in agricultural utilization rate (35.09% and 34.82%, respectively) and partial productivities (32.23% and 32.23%, respectively) of the nitrogen and phosphorus fertilizers under SF24 treatment was significantly higher than that under CF treatment.
In 2020, the use of organic fertilizer instead of chemical fertilizer significantly improved the fertilizer utilization rate of wheat while reducing chemical fertilizer application. The utilization rate of nitrogen in the organic fertilizer treatment was significantly higher than that in the CF treatment, and compared with it, the utilization rates in the SF12 and SF24 treatments significantly increased by 32.35% and 70.48%, respectively. The utilization rate of the phosphorus fertilizer increased with an increase in the organic fertilizer replacement ratio. The utilization rates of the SF12, SF18, and SF24 treatments were significantly higher than the CF treatment, increasing by 79.99%, 95.88%, and 122.11%, respectively. Compared with the CF treatment, the agronomic utilization rate of nitrogen fertilizer in the SF18 and SF24 treatments significantly increased by 68.25% and 63.50%, respectively, and that of phosphate fertilizer significantly increased by 68.17% and 64.80%, respectively. The partial productivity of nitrogen fertilizer under the SF12, SF18, and SF24 treatments significantly increased by 21.74%, 37.07%, and 41.98%, respectively, compared with the CF treatment. The partial productivity of phosphate from the organic fertilizer treatments also significantly differed from that under the CF treatment. The relationship of the partial productivity of phosphate fertilizer among all treatments was SF24 > SF18 > SF12 > SF6 > CF > CK, among which the SF18 and SF24 treatments were significantly higher than the CF and SF6 treatments, whereas the SF12, SF6, and SF18 treatments were not significantly different. Therefore, the substitution of organic fertilizers with chemical fertilizers can significantly increase the fertilizer utilization rate, fertilizer agronomic utilization rate, and fertilizer partial productivity; in particular, fertilizer partial productivity increases with an increase in the substitution ratio of organic fertilizers.
3.6. Wheat Yield and Its Constituent Factors
As shown in
Table 2, the yield and its component factors under different fertilization treatments were significantly higher than those without a fertilization treatment. Organic fertilizer as a replacement for chemical fertilizer increased the number of spikes, 1000-grain weight, and crop yield of the wheat. In 2018, the yield, 1000-grain weight, and grain number per spike of each fertilization treatment were significantly higher than that of the CK treatment and exhibited no significant differences between the number of spike and kernels per spike. The 1000-grain weight of wheat under the SF24 treatment was significantly lower than that under the other fertilization treatments. In addition, the yield using SF18 significantly increased by 31.33%, 3.09%, 2.58%, and 3.36% compared with that of CK, CF, SF6, and SF24, respectively. In 2019, the kernels per spike and yield of each fertilizer treatment were significantly higher than those of the CK treatment, exhibiting no significant differences between each fertilizer treatment.
In 2020, the number of wheat spikes in the SF18 treatment was 19.82% and 4.89% higher than that in the CK and CF treatments, respectively. Other organic fertilizer replacement treatments were higher than the conventional fertilization treatments, but the difference was not significant. The substitution of organic fertilizer with chemical fertilizer also increased the 1000-grain weight of wheat; however, the differences in the SF18 treatments were not significant; in particular, SF18 significantly increased the 1000-grain weight of wheat by 3.79% and 15.47% compared with CF and CK, respectively. The application of organic fertilizer also significantly increased wheat yield, with SF18 increasing it by 36.20%, 4.31%, and 4.66% compared with the CK, CF, and SF6 treatments, respectively.
4. Discussion
In the present study, after replacing chemical fertilizer with organic fertilizer for three consecutive years, soil AH-N, available phosphorus, available potassium, and SOM significantly increased, similar to the results of previous studies [
21]. This may be because the application of organic fertilizer improves soil structure, provides trace elements and humus, and provides soluble nutrients. The effect of substituting 24% of the fertilizer with organic fertilizer was better than that of substituting with other proportions of organic fertilizers and significantly better than that of conventional fertilizers. Wei et al. [
22] reported that both AH-N and available phosphorus contents increased with an increase in the replacement ratio of organic fertilizer; the SOM content and available potassium stabilized after 70% of the mineral fertilizer was replaced with organic fertilizer. Ji et al. [
23] proposed after nearly 20 years of positioning experiments that under the condition of equal nutrients, the combination of organic and inorganic fertilizers can significantly increase the soil nutrient content, which increases with an increase in fertilization years. The fact that farmers do not use potassium fertilizer in conventional fertilization, and commercial organic fertilizer contains a small amount of potassium, is one of the important reasons why the application of commercial organic fertilizer significantly increases the soil available potassium content compared with conventional fertilization. The content of available potassium in CF treatment is higher than that in CK treatment. The main reason for this test result may be that the straw that is returned to the field for three consecutive years causes most of the free potassium ions in the straw to dissolve into the soil, which significantly increases the content of available potassium in the soil [
24]. Because this study conducted a three-year positioning experiment, SF24 had the largest replacement ratio of organic fertilizer. Whether a higher replacement ratio of organic fertilizers can better increase soil nutrients requires further research.
This study found that compared with conventional fertilizer treatment, organic fertilizer instead of chemical fertilizer treatment increased the number of ears and 1000-grain weight of wheat, and there was no significant difference in the number of grains per ear. The main reason is that organic fertilizer instead of chemical fertilizer can advance the reproductive growth period of wheat, which can significantly increase the number of ears and 1000-grain weight of wheat, and the number of grains per ear is not significantly affected by ear density. The yield of the SF24 treatment was lower than that of the SF18 treatment because excessive application of organic fertilizer would lead to late ripening and lodging of wheat, etc., resulting in an increase in the proportion of organic fertilizer application without increasing or even decreasing the yield [
25]. The replacement of chemical fertilizer with organic fertilizer can significantly increase the utilization rate of fertilizer, the agronomic utilization rate of fertilizer, and the partial productivity of fertilizer while reducing the application rate of chemical fertilizer. The partial productivity of fertilizer increases with the increase in the replacement ratio of organic fertilizer, which is consistent with the results of previous studies [
26]. Therefore, the application of organic fertilizers can promote the growth and development of crops and increase the demand for fertilizer, thereby promoting the absorption and utilization of nutrients by crops, reducing the loss of fertilizer, increasing yield, and improving the utilization rate of fertilizer, partial productivity, and agricultural use efficiency. In this study, according to various fertilizer utilization indices, the fertilizer utilization rate, fertilizer agronomic utilization rate, and fertilizer partial productivity of the SF18 and SF24 were superior to those of other fertilization treatments.
5. Conclusions
Under equal nutrient conditions, organic fertilizer can reduce the amount of conventional fertilizer required by wheat and increase soil available nutrients such as alkali-hydrolytic nitrogen, available phosphorus, available potassium, and soil organic matter. The SF18 and SF24 treatments were better than the other treatments in increasing the available soil nutrients. The replacement of organic fertilizer with chemical fertilizer can also increase the wheat yield by increasing the panicle number, 1000-grain weight, and other yield components; in particular, SF18 and SF24 can increase wheat yield by 3.72% and 4.31%, respectively, compared with conventional fertilizer when used for three consecutive years. Therefore, the replacement of chemical fertilizers with organic fertilizers can improve the content of available soil nutrients, promote the absorption and utilization of nitrogen, phosphorus, and potassium in wheat, and improve the utilization rate of fertilizers.


