Article

The Effect of Soil Microbial Residues-Mediated Nitrogen Conservation and Supply during the Growing Season on Nitrogen Uptake by Wheat

1
College of Resources and Environmental Sciences, Hebei Agricultural University, Baoding 071000, China
2
Center for Agricultural Resources Research, Shijiazhuang 050022, China
3
Hebei GEO University, Shijiazhuang 050022, China
4
Insitute of Geographical Science, Henan Academy of Sciences, Zhengzhou 450052, China
5
Hebei Food Safety Key Laboratory, Key Laboratory of Special Food Supervision Technology for State Market Regulation, Hebei Engineering Research Center for Special Food Safety and Health, Hebei Food Inspection and Research Institute, Shijiazhuang 050227, China
6
Institute of Applied Ecology, Chinese Academy of Sciences, Shenyang 110016, China
*
Authors to whom correspondence should be addressed.
Agronomy 2024, 14(1), 193; https://doi.org/10.3390/agronomy14010193
Submission received: 13 December 2023 / Revised: 6 January 2024 / Accepted: 13 January 2024 / Published: 15 January 2024
(This article belongs to the Section Agroecology Innovation: Achieving System Resilience)

Abstract

:
Microbial residue nitrogen can indicate soil quality and is crucial for soil nitrogen retention and supply. However, it is still unclear how the dynamic changes in soil microbial residue nitrogen affect crop nitrogen uptake in agricultural practice. Based on a long-term wheat-maize rotation experiment with different nitrogen application rates (150 kg N ha−1, 200 kg N ha−1, and 300 kg N ha−1), 15N-labeled nitrogen fertilizer was applied during the wheat season to track the dynamics of soil microbial residue nitrogen and its mediated fertilizer nitrogen. The results showed that nitrogen addition was beneficial to the accumulation of microbial residue nitrogen (mainly fungal microbial residue nitrogen). Its contribution rate to soil total nitrogen is 54.87–56.55%, and the fertilizer nitrogen allocated to it accounts for 27.10–47.50% of the remaining fertilizer nitrogen in the soil. Ultimately, 6.77–10.24% of the nitrogen fertilizer applied remained in the soil as microbial residue nitrogen. In addition, microbial residue nitrogen is mainly mineralized during the jointing and filling stages of wheat. In a word, the accumulation and mineralization of soil microbial residue nitrogen during the application of 200 kg N ha−1 better guaranteed the uptake of nitrogen by wheat, which provided a reliable basis for guiding farmland fertility improvement and nitrogen fertilizer reduction in the North China Plain.

1. Introduction

The application of nitrogen fertilizer is an important measure to maintain food production and thus meet the increasing human demand for food [1], for which more than 100 million tons of nitrogen fertilizer are applied to global farmland every year [2]. By 2050, the United Nations predicts that the global population will increase by 2 to 3 billion, which means that the demand for nitrogen fertilizer in agriculture may increase significantly [3]. However, the current average seasonal nitrogen use efficiency in global agroecosystems is less than 50% [4]. Fertilizer nitrogen loss poses a great threat to the environment. If the current agricultural nitrogen management measures continue, it is expected that by 2050, the nitrogen pollution level will be 150% higher than that in 2010 [5]. In order to reduce the adverse effects of nitrogen fertilizer on the above problems, nitrogen fertilizer management should be reasonably carried out in production practice.
Crop uptake of nitrogen is mainly supplied by the soil nitrogen pool, and even with heavy nitrogen fertilization, the proportion of soil nitrogen supply in crop nitrogen uptake can still exceed 50% or even 80% [6,7]. Excessive nitrogen application leads to increased soil nitrogen availability and mineralization loss of soil organic carbon and nitrogen [8,9], which destroys soil aggregates and has negative effects on soil organic matter accumulation, thereby damaging soil fertility [10,11,12]. Although reducing nitrogen application can significantly improve nitrogen use efficiency, long-term nitrogen deficiency in the soil can also lead to a decrease in nitrogen availability and accelerate the depletion of the soil nitrogen pool [13]. Therefore, when evaluating nitrogen management measures, attention should be focused on the conservation and supply of nitrogen in the soil. Nitrogen transformation in the soil mainly relies on the driving force of related microorganisms. Previous studies have suggested that microorganisms mainly act as decomposers in soil nitrogen transformation, and their fixation on nitrogen is mainly for the formation of their own biomass [14,15,16]. In recent years, Liang et al. developed the “soil microbial carbon pump” theory with microbial residues as the core, emphasizing that microbial residues are important contributors to soil organic matter accumulation and pointing out that microbial residues contribute more than 50% to soil organic matter [17,18]. Microbial residues not only contribute to long-term carbon (C) and nitrogen (N) storage but also participate in mineralization processes to balance carbon and nitrogen stoichiometry [19,20,21]. Amino sugar is currently the most widely used specific biomarker for microbial residues [22,23]. Among them, only the cell wall acid derived from bacterial residues (MurN) is used to estimate bacterial residue nitrogen, while amino glucose derived from fungal residues (GluN) is used to estimate fungal residue nitrogen, and their sum is the microbial residue nitrogen [24].
As commonly found in some long-term field location experiments, nitrogen addition can increase soil microbial residue content, and there is a positive correlation between soil microbial residue accumulation and crop yield; however, soil microbial residue accumulation does not continue to increase with nitrogen fertilizer input, indicating that high nitrogen fertilization triggers the upper limit of the “microbial carrying capacity” [25,26,27,28,29]. These studies focus on the construction of soil organic matter pools using microbial residue, while there are few studies on the mineralization of microbial residue on crop growth, especially in the short term to verify the impact of microbial residue mineralization on crop nutrient absorption. The North China Plain is one of the regions with the highest degree of agricultural intensification in China. The traditional nitrogen application rate in the typical wheat maize planting system is 550–600 kg N ha−1a−1. Under the condition of 30–60% nitrogen reduction on a traditional basis, this region can still ensure that the crop yield will not decrease [30]. To this end, we selected three treatments of 150 kg N ha−1, 200 kg N ha−1, and 300 kg N ha−1 in a 14-year-long location experiment, with different nitrogen application levels, and applied 15N-labeled nitrogen fertilizer. We studied the enrichment of soil microbial residue nitrogen and fertilizer nitrogen during the key growth stages of wheat to understand the impact of nitrogen fixed by microbial residue on nitrogen absorption in wheat. We hypothesized that (1) fungal and bacterial microbial residues regulate the retention and supply of nitrogen during the growth period of wheat due to their functional specificity, and (2) there are key nodes where the mineralization of microbial residue nitrogen has a profound impact on the uptake of nitrogen by wheat.

2. Materials and Methods

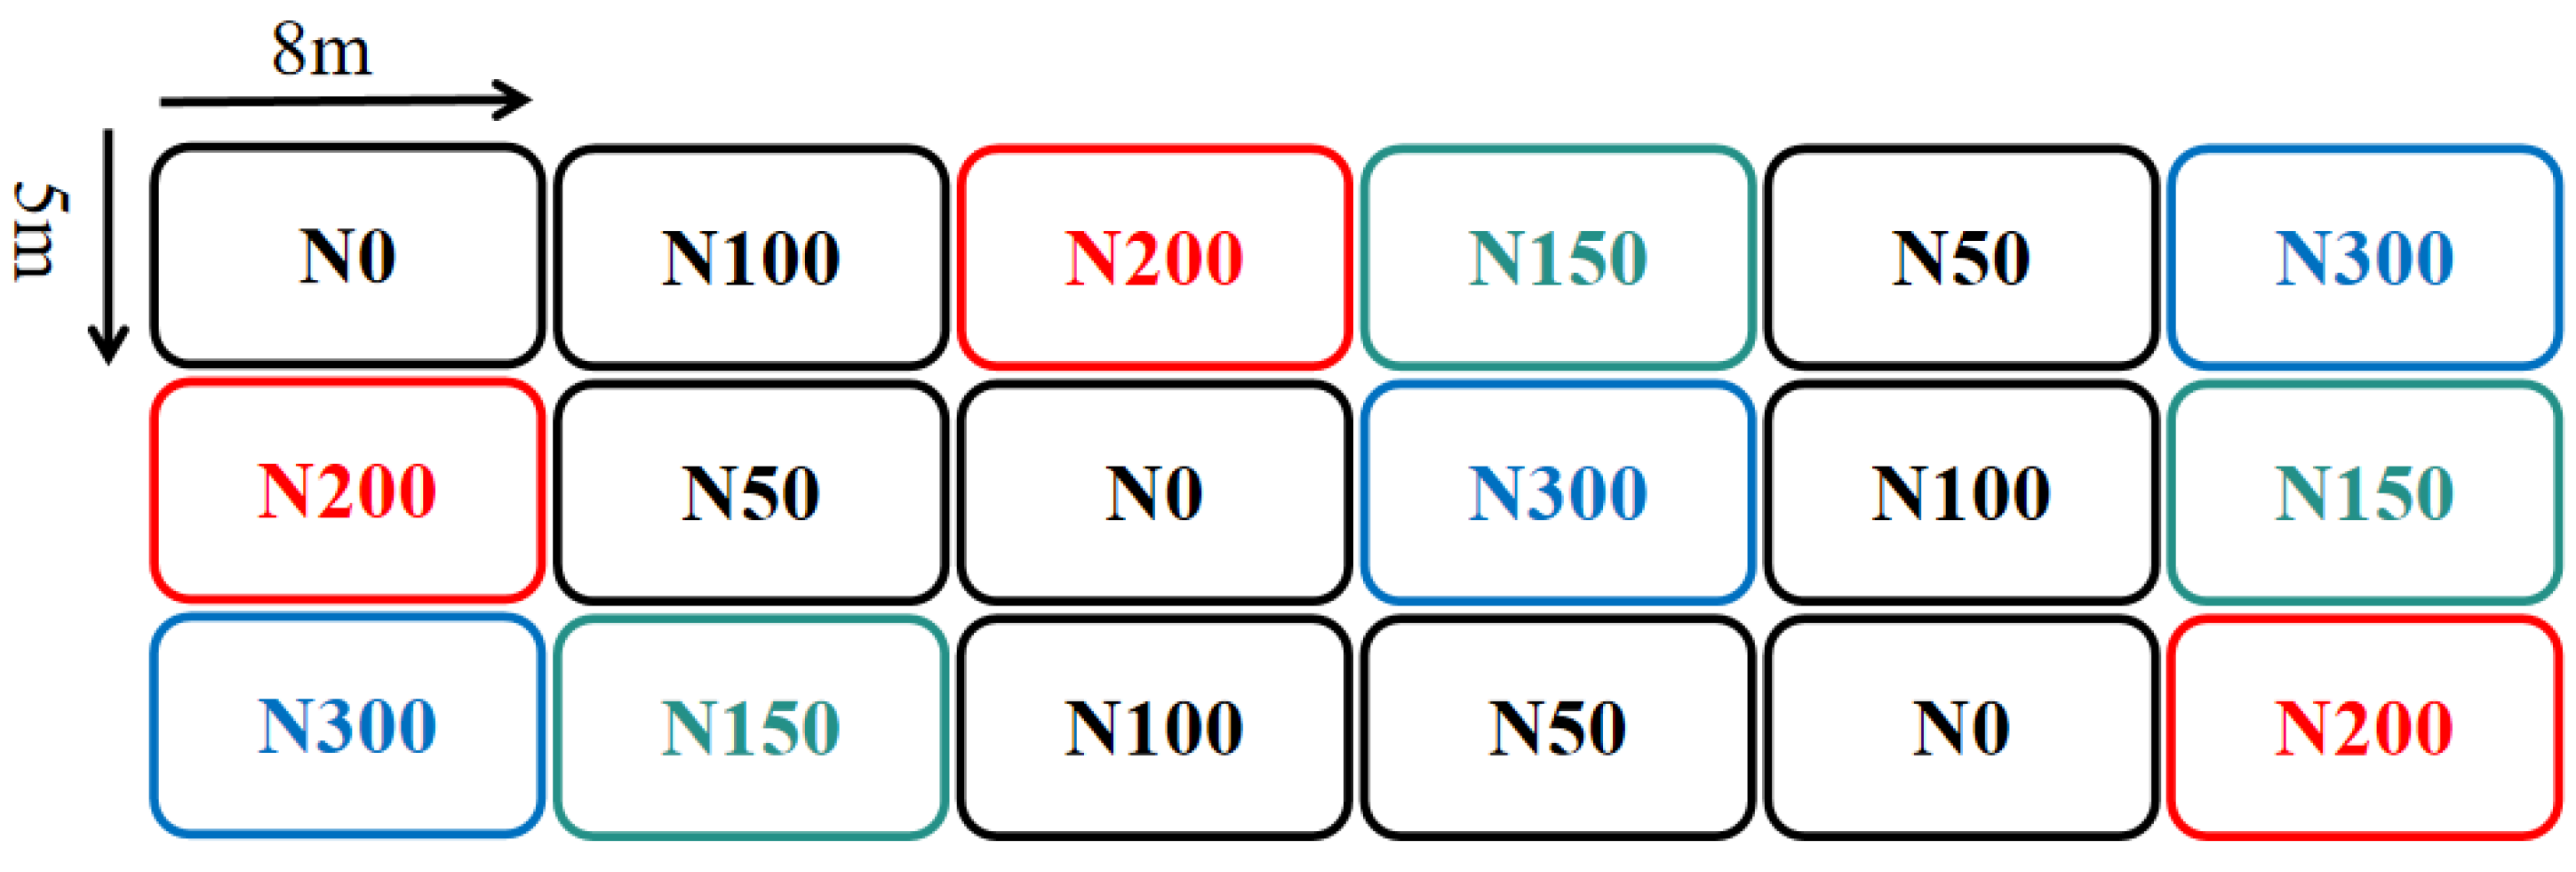
2.1. Site Description and Experimental Design

The research site is located in the Luancheng Agricultural Ecological Experiment Station of the Chinese Academy of Sciences (37.88° N 114.68° E). The soil type is fluvo cinnamon soil, and the surface soil texture is silty loam (soil texture classification system of the U.S. Department of Agriculture). This area belongs to the intensive farmland with fine management of high nitrogen input in the North China Plain. The nitrogen input is mainly chemical fertilizer. The typical regional planting system is the rotation system of winter wheat and summer corn with two crops a year. The positioning experiment began in 2003 with six treatments: N0, N50, N100, N150, N200, and N300, each repeated three times. The nitrogen application rates for the wheat and corn seasons in the rotation system were the same, at 0, 50, 100, 150, 200, and 300 kg ha−1, respectively. The type of nitrogen fertilizer was urea, and the ratio of base fertilizer to topdressing was 1:1. The phosphorus fertilizer application rate for each treatment was 32.5 kg ha−1, all applied as base fertilizer. In the wheat season of 2016, nine 15N isotope-labeled micro-plots (urea 15N abundance of 99%) were established for the N150, N200, and N300 treatments. The micro-plots were isolated with PVC boards, buried 1 m deep, with the upper part 10 cm above the ground, and had an area of 1.11 m2. Each micro-plot was planted with seven rows of wheat, and the sowing rate and management methods were the same as those in the outer experimental plots. The layout of the treatments is shown in Figure 1.

2.2. Sample Collection and Measurement

2.2.1. Soil and Plant Sample Collection

Soil samples were collected at the emergence stage (7 days after base fertilization), tillering stage (21 days after base fertilization), jointing stage (160 days after base fertilization), booting stage (11 days after topdressing), filling stage (21 days after topdressing), and maturity stage (60 days after topdressing) of wheat, with a depth of 20 cm. At the jointing stage, filling stage, and harvest stage, soil samples were collected using the shaken root method. The fresh soil samples were initially sieved through a 2mm mesh to remove large plant debris and gravel, followed by thorough mixing and air-drying. Afterward, any remaining fine plant roots were carefully removed from the dried samples. Finally, the dried samples were ground and passed through a 0.15mm sieve. During the harvest period, the straw and grains of the wheat above ground were collected and dried to a constant weight at 55 °C before being ground for further analysis.

2.2.2. Determination of Total N and 15N Abundance in Soil and Plants

The total nitrogen in the soil was determined using an elemental analyzer (vario Macro, Elementar, Hanau, Germany), and its 15N abundance was determined using an elemental analyzer-stability isotope mass spectrometer (EA-CIRMS, Flash EA1112, Delta plus XP, Thermo Fisher Scientific Inc., Waltham, MA, USA).

2.2.3. Analysis of Amino Sugars and 15N Enrichment

The determination of amino sugar content was performed using gas chromatography: soil samples containing 0.4 mg N were placed in a hydrolysis bottle, and 10 mL of 6 mol L−1 HCl was added to hydrolyze for 8 h at 105 °C. Chitin and peptidoglycan were hydrolyzed to form amino sugar monomers, after which internal standard substance 1 (inositol) was added. After filtration, hydrochloric acid was removed by rotary evaporation, and the dry matter was dissolved in water to adjust the pH to 6.6–6.8. After high-speed centrifugation, iron, aluminum precipitates, and some organic matter were removed. A second rotary evaporation was performed, and the dried material was dissolved in anhydrous methanol. After high-speed centrifugation, salt was removed, and the anhydrous methanol was purged with nitrogen gas, completing the purification of the amino sugars. After purifying the amino sugars, we mixed them with internal standard 2 (N-methyl glucosamine), added water, and placed them in a freeze dryer. After the water is completely freeze-dried, the amino sugars are converted into an aldehyde nitrile derivative. The amino sugar derivative is dissolved in a 1:1 ethyl acetate-n-hexane mixed solvent and determined using a gas chromatograph (GC-7890A, Agilent Tech. Co., Ltd., Wilmington, DE, USA). The 15N isotopic ratio of the amino sugars is determined using GC/MS (Finnigan trace, Thermo Electron Co., Ltd., Waltham, MA, USA) [24].

2.3. Calculation

2.3.1. Remaining Fertilizer N in Soil

The residual nitrogen content of fertilizer in soil is calculated according to the following formula:
TNF (g kg−1) = TN (g kg−1) × (ATS − ATC)/ATF
where TNF (g kg−1) represents the residual fertilizer N content in the soil, TN (g kg−1) represents the total nitrogen content in the soil, ATS represents the 15N abundance (%), ATC represents the natural 15N abundance (%) of the labeled soil sample, and ATF represents the 15N abundance (%) of the fertilizer N.

2.3.2. Fertilizer-Derived Fungal, Bacterial, and Total Microbial Necromass N in Soil

The calculation of the ratio of amino sugar isotopic incorporation into the soil is as follows:
APEAS = (RS − RC)/[1 + (RS − RC)] × 100
where RS is the isotopic enrichment ratio of the soil sample with labeled nitrogen fertilizer, and Rc is the isotopic ratio of the corresponding amino sugar in the blank soil during the same measurement.
The content of amino sugar in the fertilizer sources is calculated as follows:
ASF (mg kg−1) = AST (mg kg−1) × APEAS/ATF
In the formula, ASF (mg kg−1) represents the content of glucosamine (GluN) or muramic acid (MurN) in the soil from the fertilizers, AST (mg kg−1) represents the content of glucosamine (GluN) or muramic acid (MurN) in the soil, APEAS represents the isotopic incorporation ratio of glucosamine (GluN) or muramic acid (MurN) in the soil, and ATF represents the isotopic abundance of N in the fertilizers.
The nitrogen content of fertilizer-derived fungi, bacteria, and total microbial residue in the soil is calculated as follows:
FRN (g kg−1) = (GluN (g kg−1)/179.2 − 2 × MurN (g kg−1)/251.23) × 179.2 × 1.08
BRN (g kg−1) = MurN (g kg−1) × 9.8
MRN (g kg−1) = FRN (g kg−1) + BRN (g kg−1)
FRNF (mg kg−1) = FRN (mg kg−1) × APEGluN/ATF
BRNF (mg kg−1) = BRN (mg kg−1) × APEMurN/ATF
MRNF (mg kg−1) = FRNF (mg kg−1) + BRNF (mg kg−1)
where FRN (g kg−1) represents the nitrogen content of the fungal microbial residues, BRN (g kg−1) represents the nitrogen content of the bacterial microbial residues, and MRN (g kg−1) represents the total nitrogen content of the microbial residues; FRNF (mg kg−1) represents the nitrogen content of the fungal microbial residues from fertilizer sources, BRNF (mg kg−1) represents the nitrogen content of the bacterial microbial residues from fertilizer sources, and MRNF (mg kg−1) represents the total nitrogen content of the microbial residues from fertilizer sources; GluN (mg kg−1) represents the content of glucosamine in the soil fungi, MurN (mg kg−1) represents the content of muramic acid in the soil; APEGluN represents the 15N isotopic incorporation ratio of glucosamine, and APEMurN represents the 15N isotopic incorporation ratio of muramic acid.

2.4. Statistical Analysis

All experimental data were collated using Microsoft Excel 2016, and a one-way ANOVA was used to test the influence of different treatment methods on soil-related factors using SPSS 21.0 software. When p < 0.05, it indicates that the treatment groups have reached a significant level of difference. Origin 2023 software was used to draw relevant graphs. The dismo package in R version 4.1.2 was used for random forest model analysis to evaluate the relative importance of relevant variables in determining wheat nitrogen absorption. Amos 24 software was used to construct a structural equation model, and the maximum likelihood estimation method was selected to fit the measurement data into the model.

3. Results

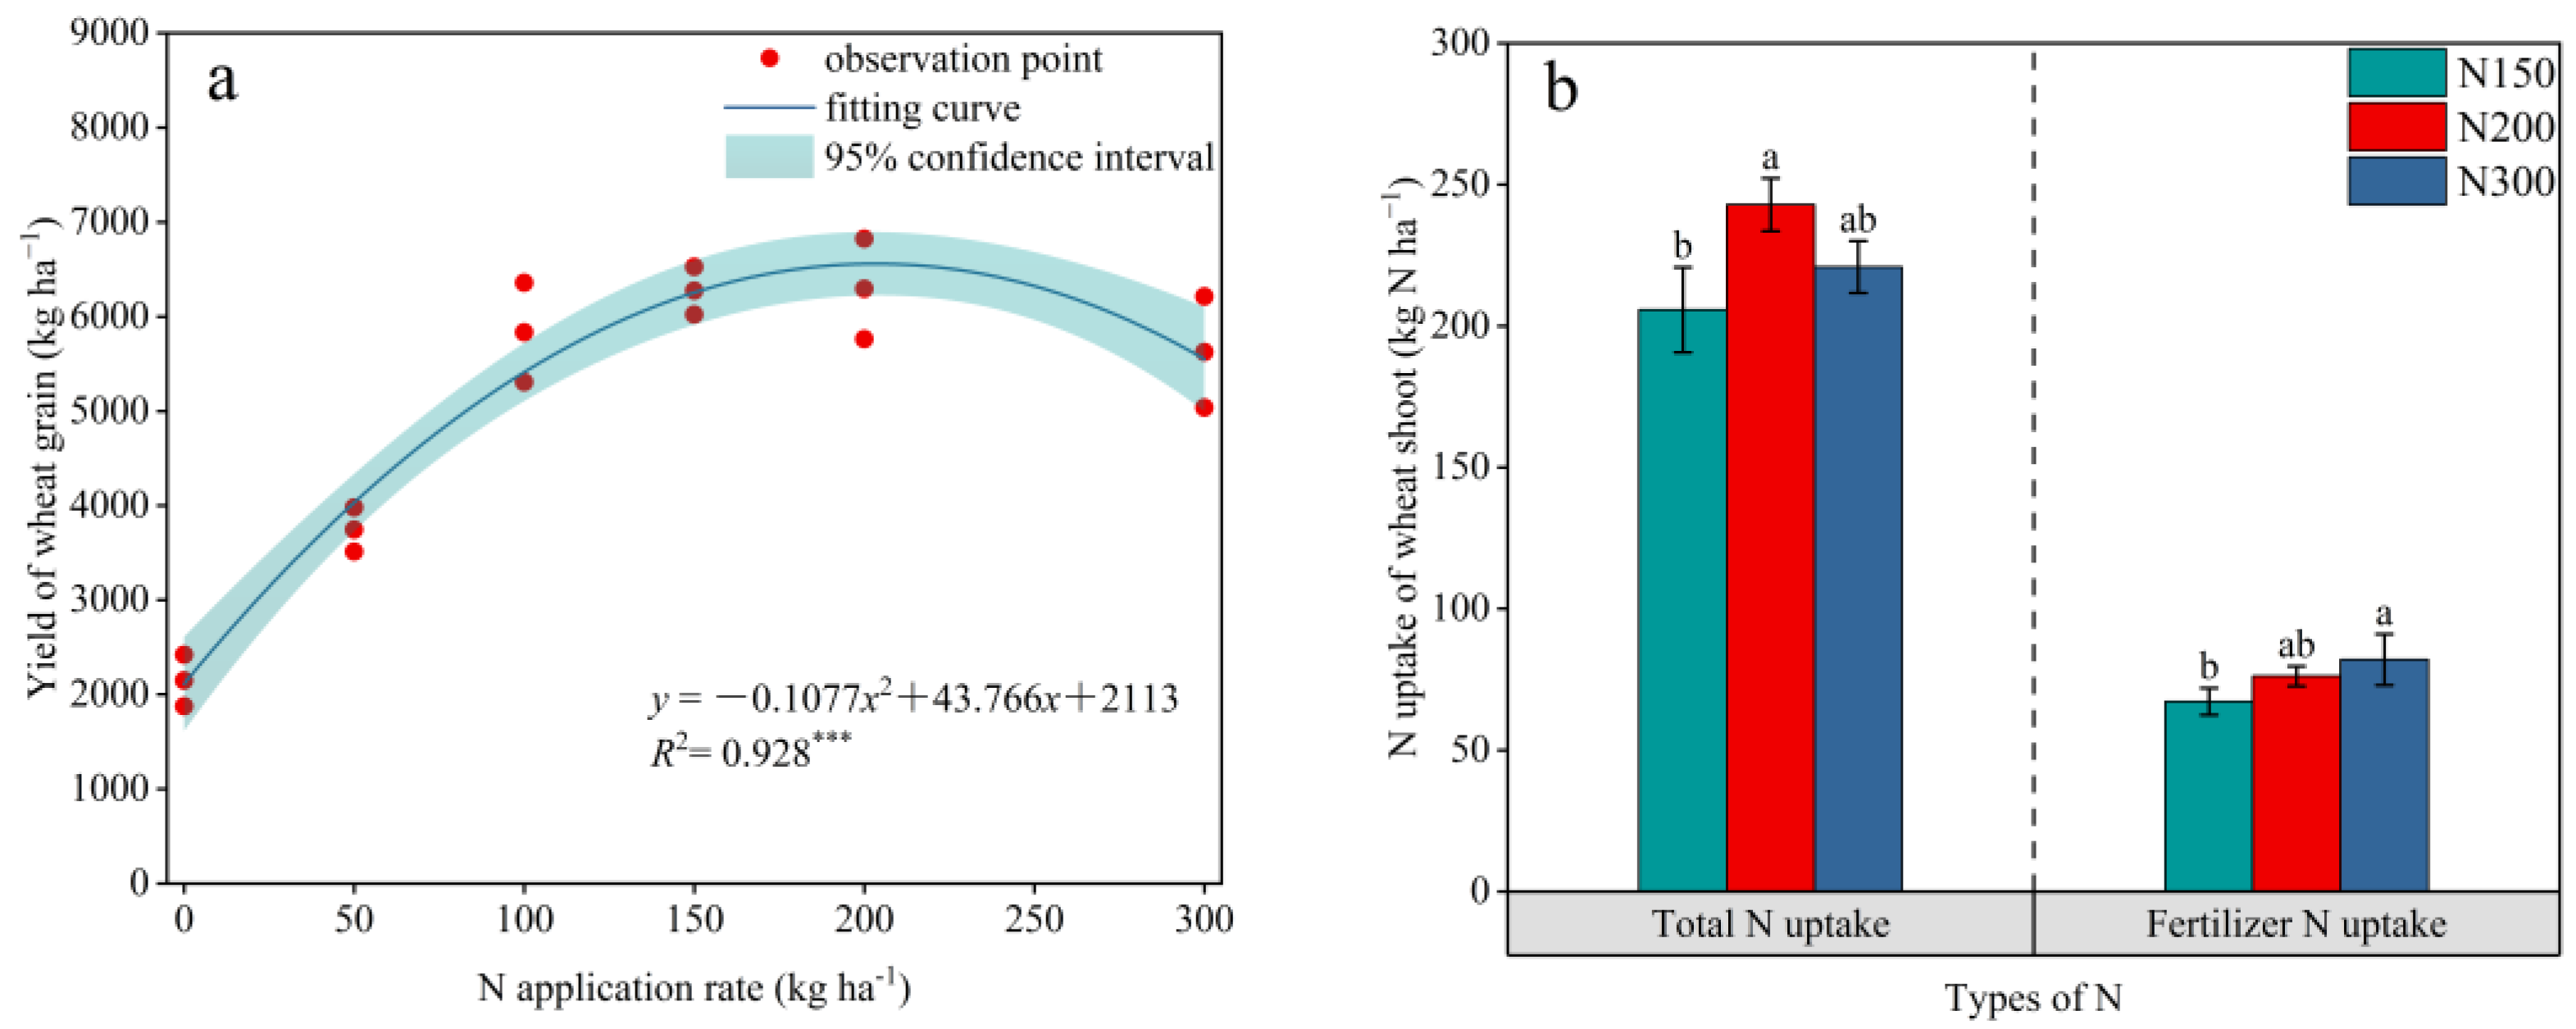
3.1. Effects of Long-Term Different N Application on Crop Yield and N Uptake

We observed that the wheat yield showed an upward trend when the N application rate increased from 0 to 200 kg N ha−1, but when the N application rate exceeded 200 kg N ha−1, the wheat yield began to show a downward trend. Although there was no significant difference in wheat yields among N150, N200, and N300, regression analysis showed that the relationship between the wheat grain yield and the nitrogen application rate was a monotonically increasing quadratic function. Therefore, it was inferred that the N application rate for the highest wheat yield in this region should be 203.18 kg N ha−1 (Figure 2a). When the N application rate increased from 150 kg N ha−1 to 300 kg N ha−1, the total N uptake of the wheat shoot increased by 18.07% and 7.36%, respectively, and the N uptake of the fertilizer increased by 13.32% and 21.99%, respectively (Figure 2b).

3.2. Effects of Long-Term Fertilization on Soil Physical and Chemical Properties

As shown in Table 1, compared with the N150 treatment, the SOC content in N200 and N300 increased by 23.14% and 12.32%, the AN content increased by 9.36% and 10.83%, the FN content increased by 5.32% and 14.55%, the MN content increased by 21.54% and 38.68%, while the MBN content was the lowest in N300. There was no significant difference in the soil available potassium and phosphorus content among treatments. Soil pH in N150 was significantly higher than that in N200 and N300.

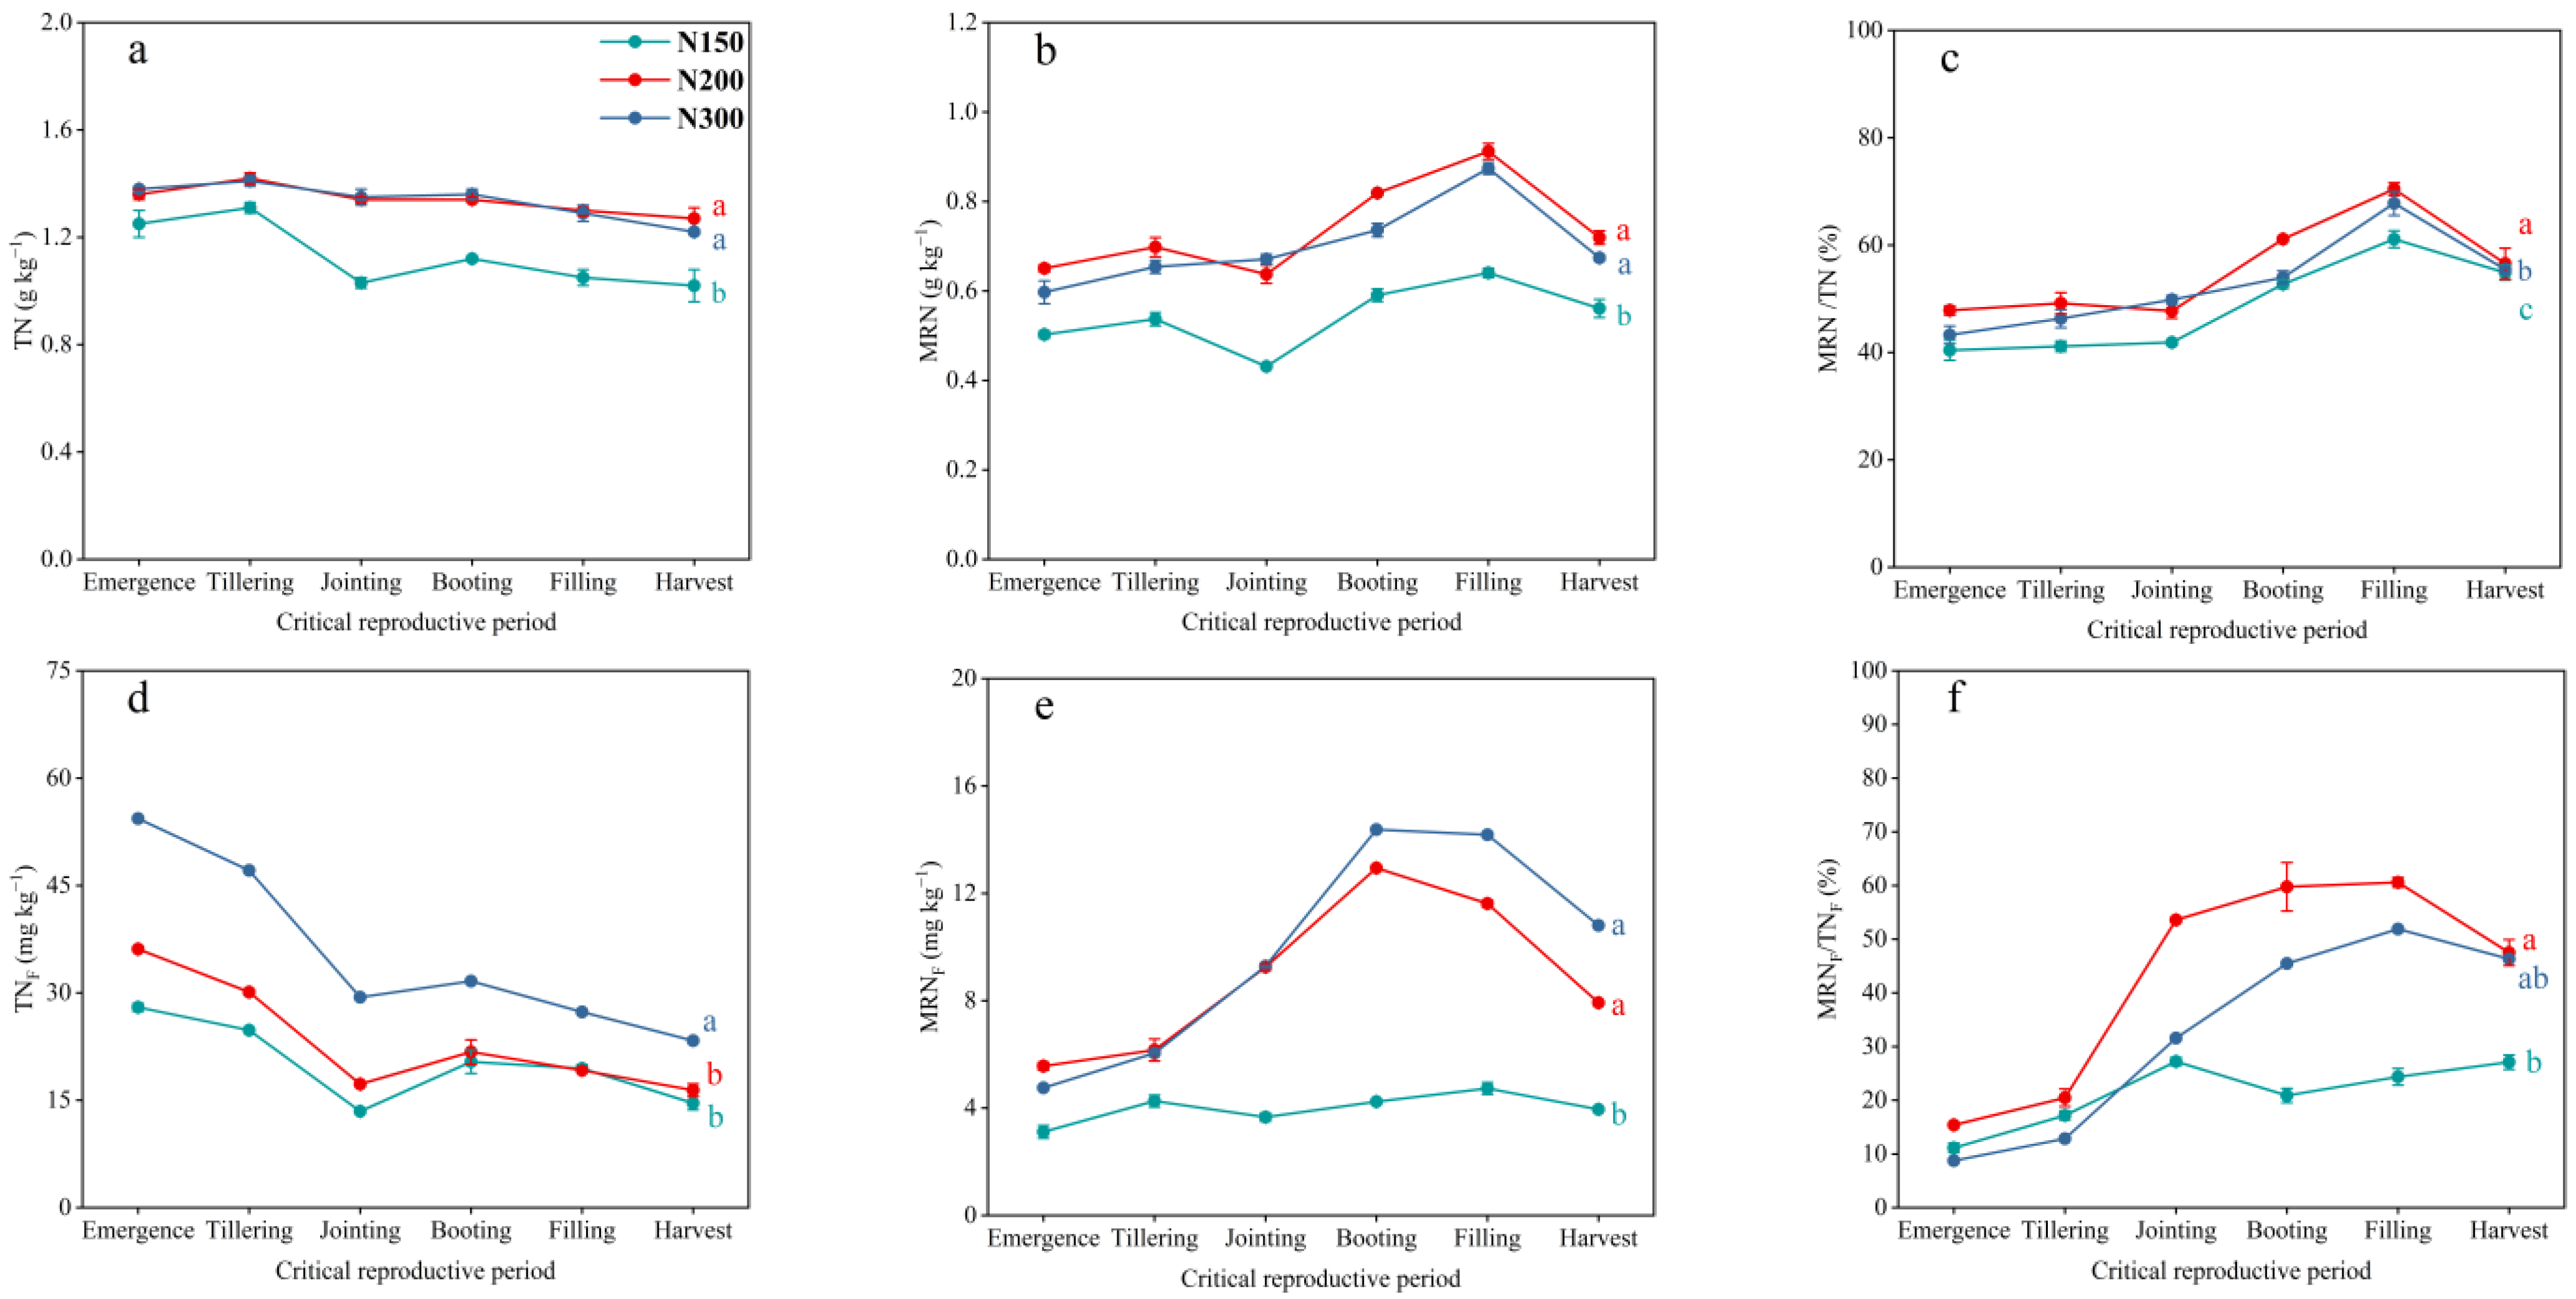
3.3. Dynamics of Soil TN and MRN Pools and Fertilizer N in Those Pools

The content of TN and TNF in each treatment soil showed a slow decreasing trend with the progress of the wheat growth period. The soil TN content of N200 and N300 was significantly higher than that of N150, while there was no significant difference in the soil TN content between N200 and N300 treatments. By the harvest stage, the soil TN of N200 and N300 increased by 24.43% and 18.73%, respectively, compared to N150. The TNF content of N300 was significantly higher than that of N150 and N200, and the TNF content of N300 increased by 42.14% and 59.70%, respectively, compared to N150 and N200 (Figure 3a,d). Compared to soil TN and TNF, the changes in MRN and MRNF of each treatment showed a trend of first increasing and then decreasing with the progress of the growth period. The period from the booting stage to the filling stage of wheat is a critical period for the accumulation of soil MRN. After the filling stage, soil MRN is mineralized, while the soil TN pool remains stable, indicating that mineralized MRN replenishes other N pools. There were no significant differences in the MRN and MRNF contents of N200 and N300, and both were significantly higher than N150. Compared with the N150 treatment, the final retention of MRN in the soil increased by 28.22% and 20.13% for N200 and N300, and the retention of soil MRNF increased by 100.59% and 173.57%, respectively (Figure 3b,e). The soil MRN pool is of great significance in maintaining the stability of the soil TN pool. We observed that at harvest, the soil MRN to TN ratio of N150, N200, and N300 was 54.87%, 56.55%, and 55.47%, respectively, with N200 having a higher MRN to TN ratio than N150 and N300 (Figure 3c). The MRNF to TNF ratio was 27.10%, 47.50%, and 46.33%, respectively, with N200 having a higher MRNF to TNF ratio than N150 and N300 (Figure 3f).

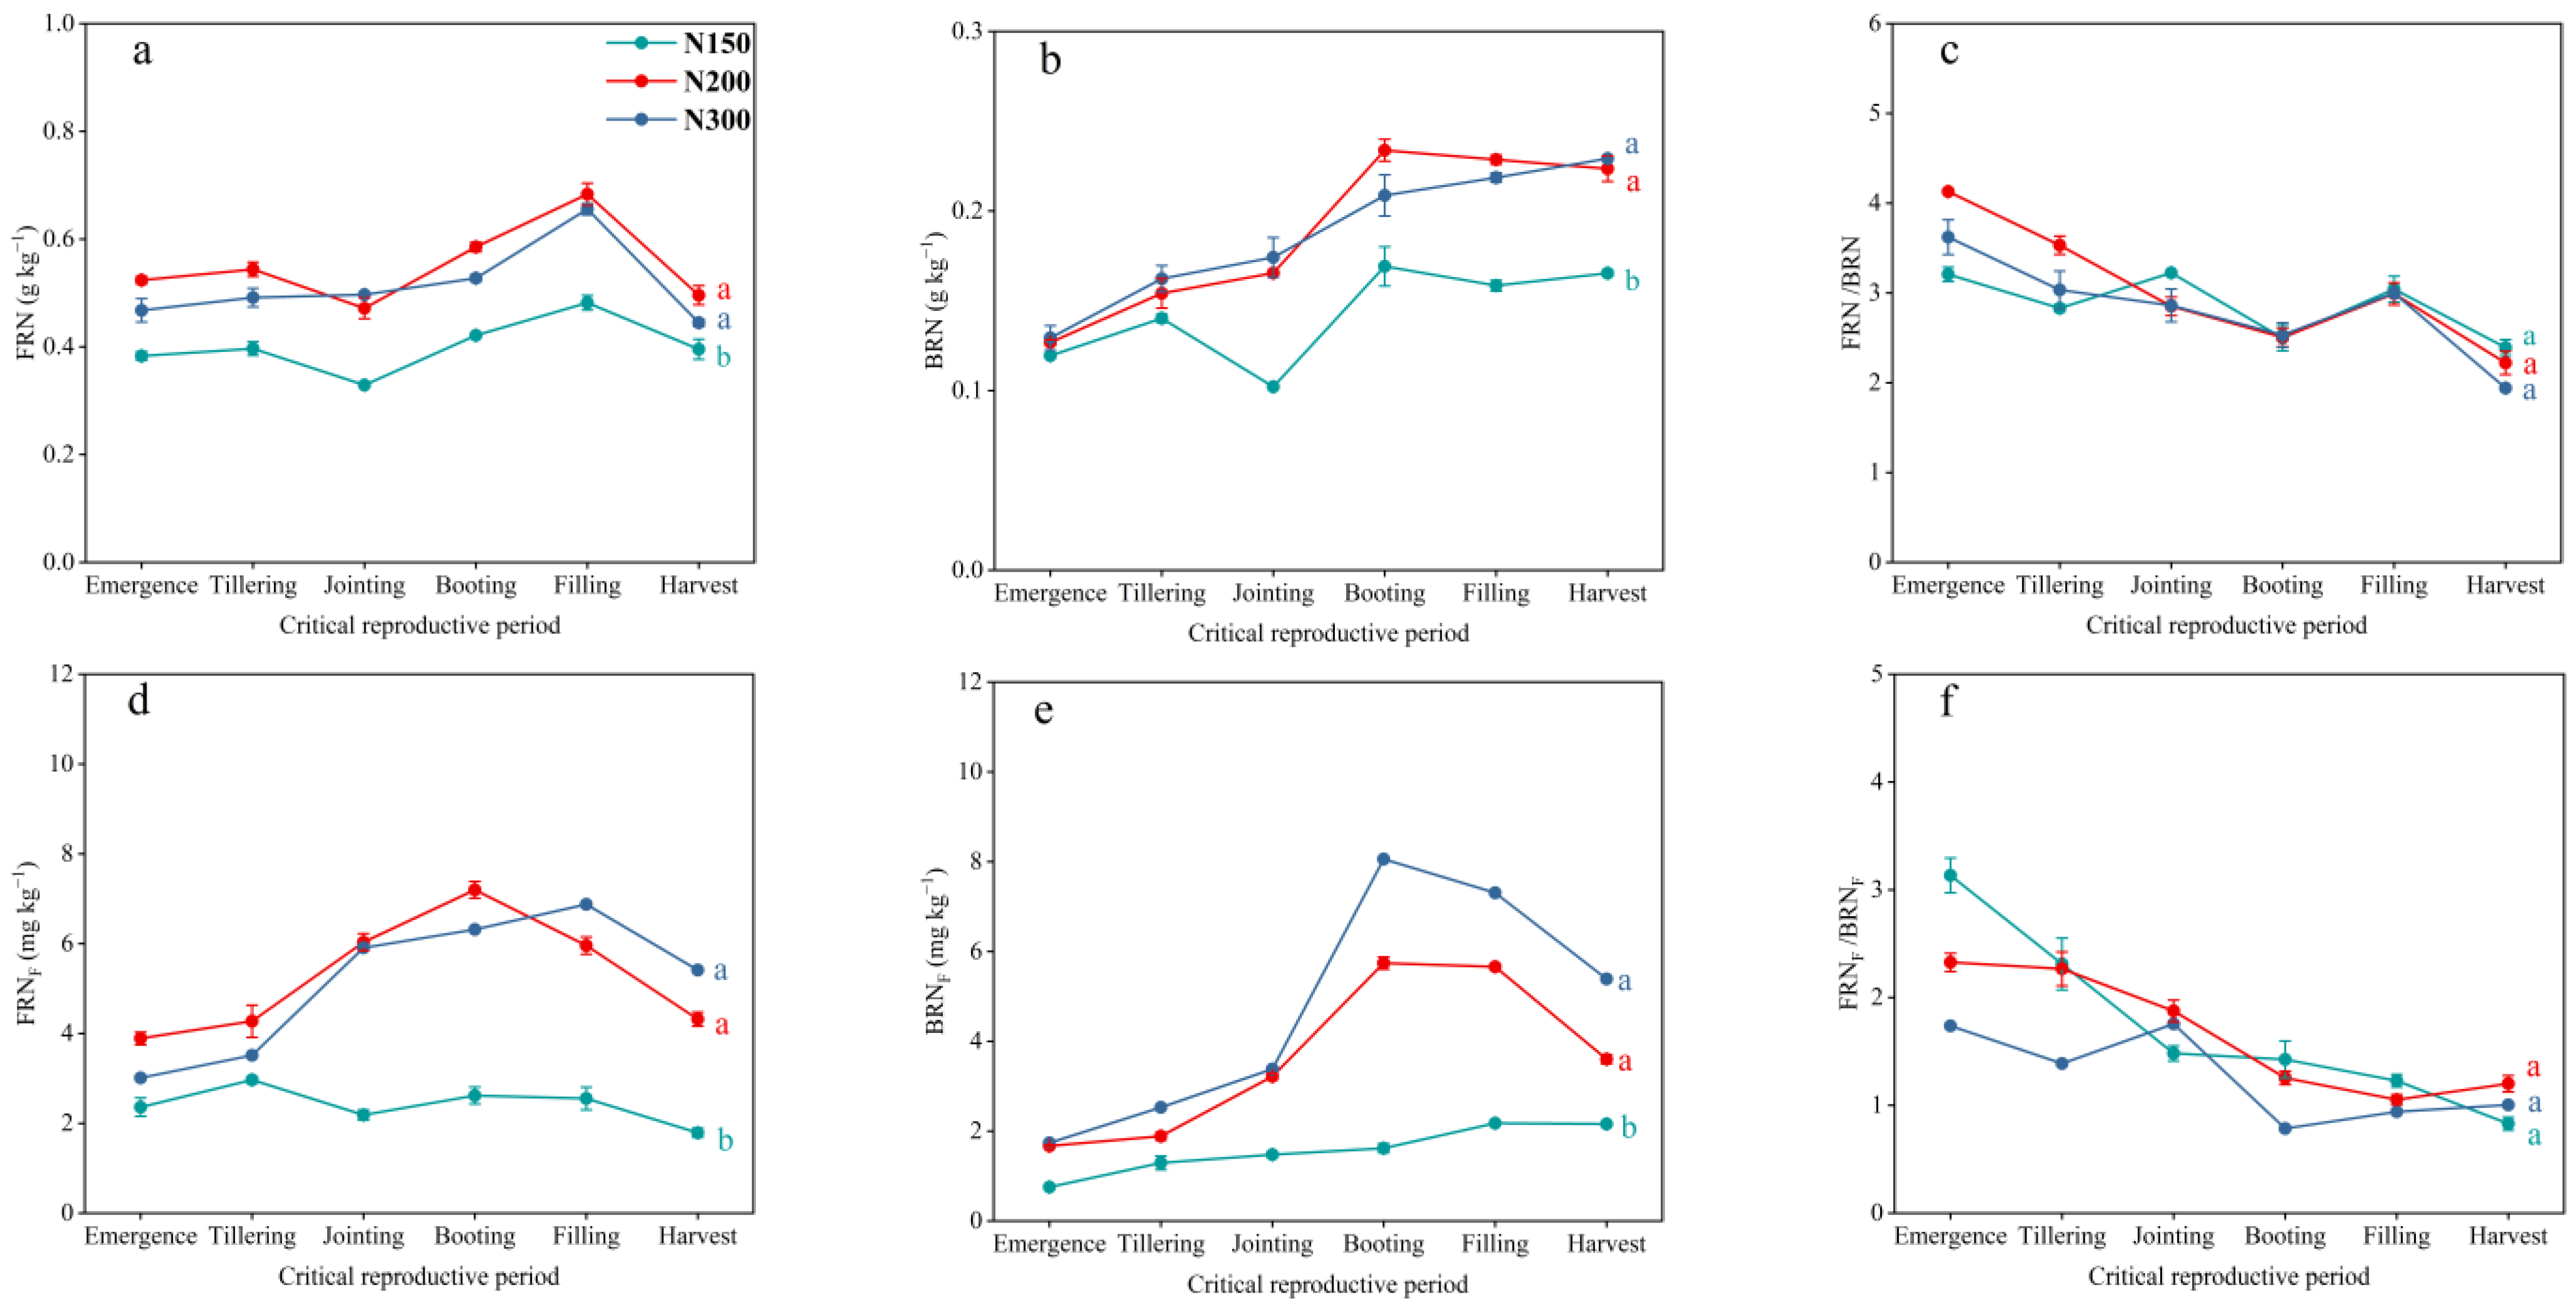
3.4. Dynamics of Soil FRN and BRN Pools and Fertilizer N in Those Pools

Similarly, the period from the booting stage to the filling stage of wheat is a critical period for the accumulation of soil FRN and BRN. Both the soil FRN and BRN contents showed that N200 and N300 were significantly higher than N150, but there was no significant difference between N200 and N300. The soil FRNF and BRNF contents also showed the same trend among the treatments. After the filling stage, the mineralization of soil FRN occurred mainly, while the soil BRN content remained relatively stable. Compared with the N150 treatment, the final retained soil FRN content of N200 and N300 increased by 25.33% and 12.40%, respectively. The soil BRN retention increased by 45.14% and 48.61%, respectively, and the soil FRNF retention increased by 141.29% and 202.48%, respectively. The soil BRNF retention increased by 66.84% and 149.60%, respectively (Figure 4a–e). The ratio of FRN to BRN can reflect the relative contributions of fungal and bacterial microorganisms to the conversion of fertilizer nitrogen. It can be seen that fungal microorganisms dominate the accumulation of microbial residue nitrogen during the wheat growth period, and the accumulation of microbial residue nitrogen by bacterial microorganisms gradually increases as the wheat growth period progresses. The average ratios of FRN to BRN for N150, N200, and N300 during the entire observation period were 2.87, 3.04, and 2.83, respectively, and the average ratios of FRNF to BRNF were 1.74, 1.66, and 1.27, respectively. It can be seen that the contribution of bacterial microorganisms to soil MRNF accumulation relative to fungal microorganisms is greater than the contribution of bacterial microorganisms to soil MRN accumulation relative to fungal microorganisms (Figure 4c,f).

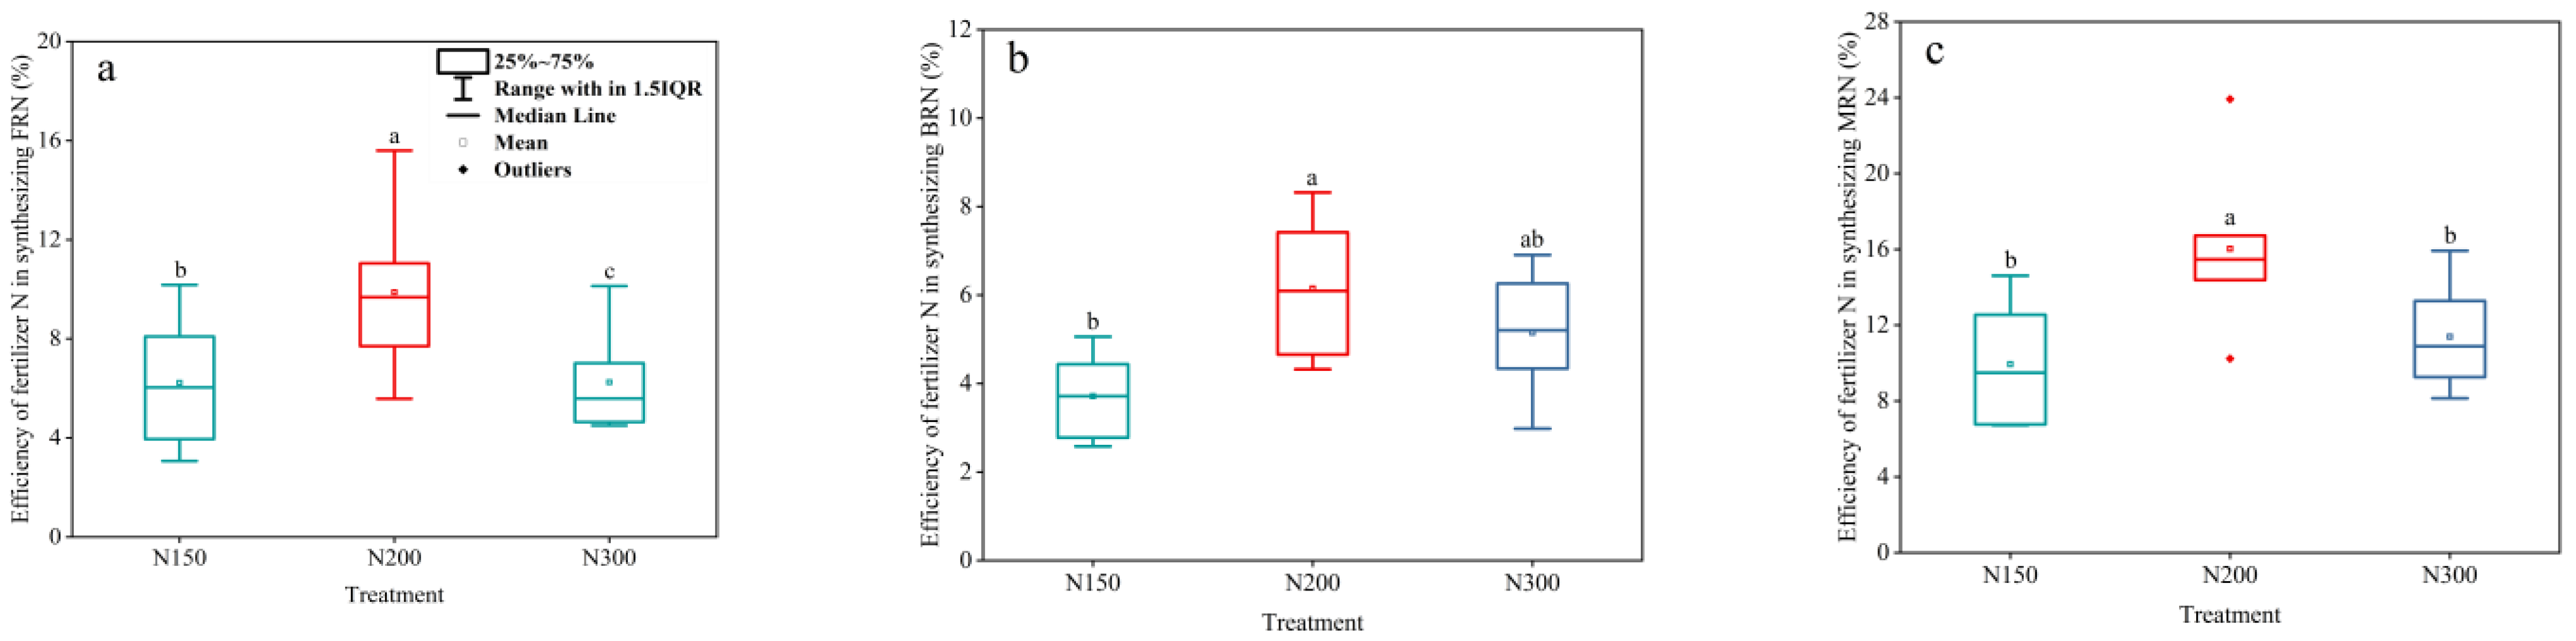
3.5. Dynamic Changes in the Efficiency of Fertilizer Nitrogen-Synthesizing Microbial Residue Nitrogen Driven by Different Long-Term Nitrogen Application Levels

During the entire observation period, the efficiency of microbial utilization of fertilizer N to synthesize MRN was highest under N200 treatment. Ultimately, the efficiency of the microbial utilization of fertilizer N to synthesize MRN in N150, N200, and N300 was 6.77%, 10.24%, and 9.26%, respectively (Figure 5c). The efficiency of fertilizer N synthesis of FRN under N200 treatment was 5.58%, and the efficiency of BRN synthesis was 4.65% (Figure 5a,b).

3.6. Dynamics of Rhizosphere Soil MRN, FRN, and BRN Pools and Fertilizer N in Those Pools

In the rhizosphere soil, the MRN content at the three stages was always significantly higher for N200 and N300 than for N150, while there was no significant difference between N200 and N300. The MRN content of N200 increased by 43.48%, 44.02%, and 21.49% in the jointing stage, the filling stage, and the harvest stage, respectively, compared to the corresponding period for N150, and the MRN content of N300 increased by 41.89%, 41.29%, and 21.45%. The rhizosphere effect of the MRN content in the rhizosphere soil of the three treatments was significant in the jointing stage and harvest stage, while the rhizosphere effect was not significant in the filling stage (Figure 6c). Specifically, the treatment of the rhizosphere soil FRN content showed significant rhizosphere effects at both the jointing stage and harvest stage, while negative rhizosphere effects were observed at the filling stage (Figure 6a). The rhizosphere effect of BRN content in the rhizosphere soil of each treatment during the grain filling stage was weaker than that during the jointing stage and harvest stage. (Figure 6b); the rhizosphere soil MRNF content gradually increased with the growth stage, with N300 > N200 > N150 among the treatments, and showed strong rhizosphere effects (Figure 6f). Specifically, the soil FRNF content of N200 reached a level comparable to that of N300 at both the jointing stage and harvest stage, and the soil BRNF content of N200 reached a level comparable to that of N300 at the filling stage (Figure 6d,e).

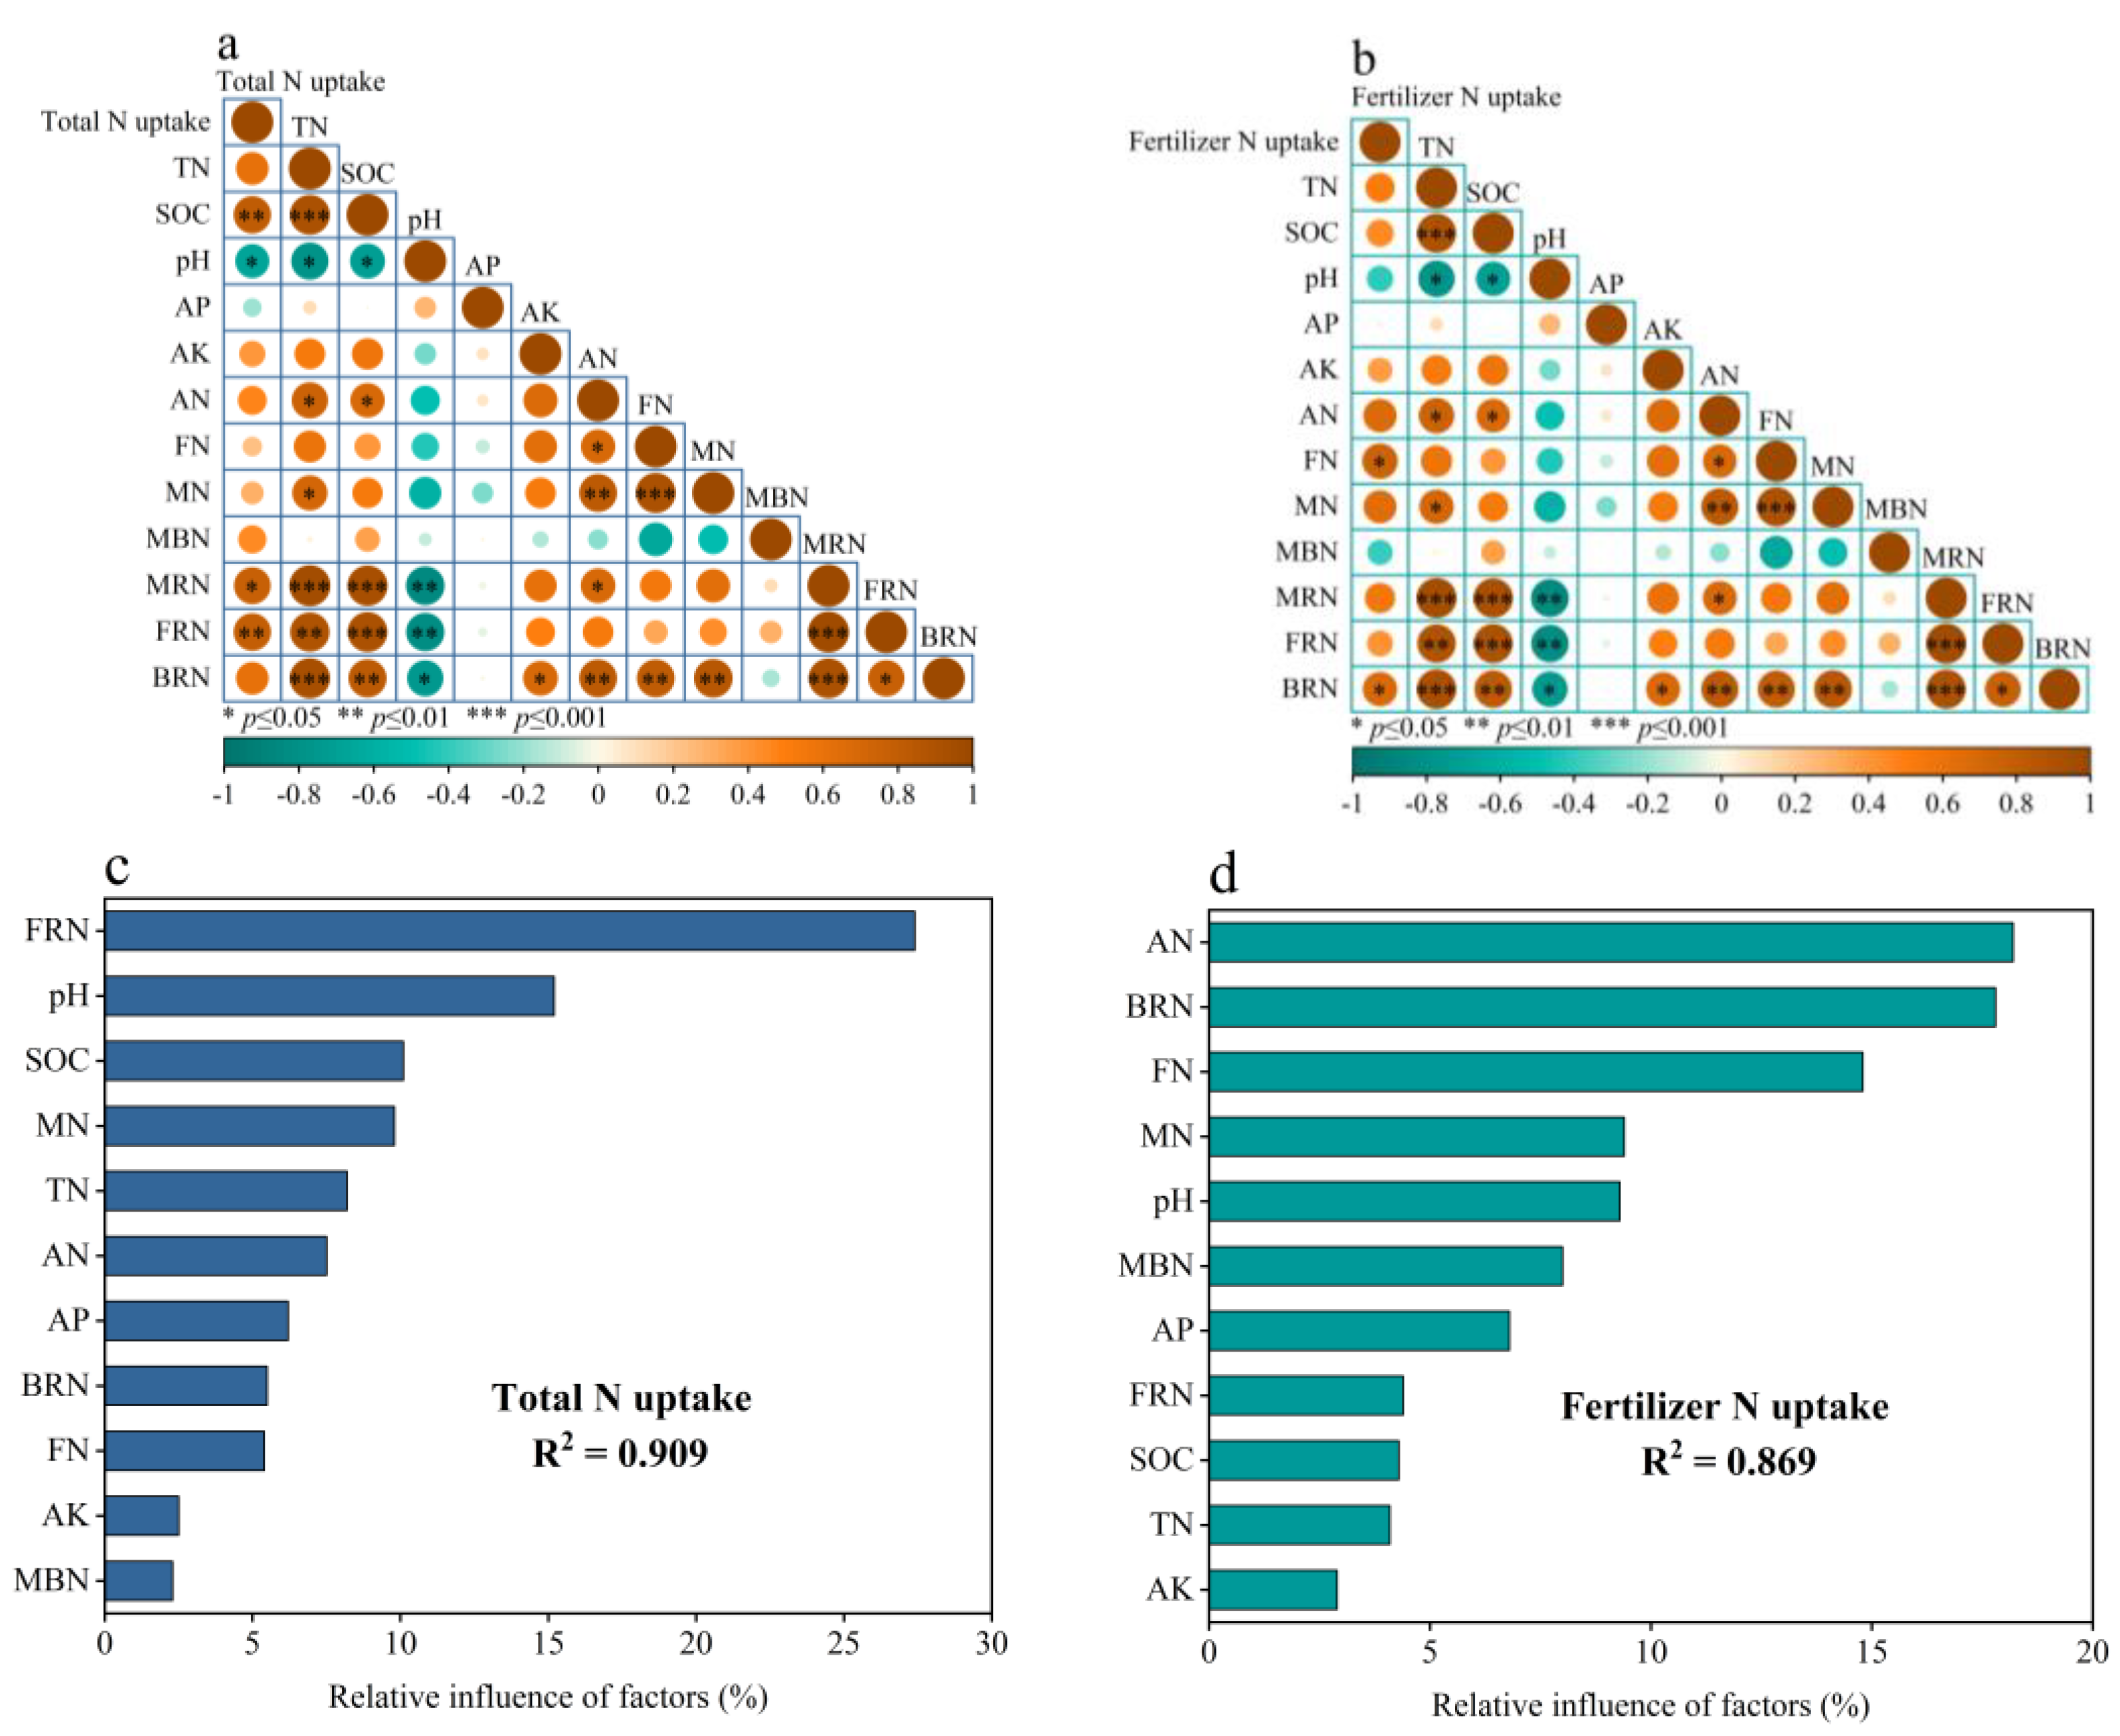
3.7. Correlation between Crop Nitrogen Uptake and Soil Biotic and Abiotic Factors

The addition of nitrogen fertilizer can supplement soil nutrient content and significantly affect the absorption of nitrogen by wheat. However, the correlation between the overall nitrogen uptake of wheat and the nitrogen uptake of fertilizer is not the same for each explanatory variable. SOC, MRN, and FRN have a direct and significant positive correlation with the total nitrogen uptake of wheat, while pH has a direct and significant negative correlation with the overall nitrogen uptake of wheat (Figure 7a). The random forest model shows that FRN, pH, SOC, MN, and TN are the top five factors explaining the total nitrogen uptake of wheat in order (Figure 7c). FN and BRN have a direct and significant positive correlation with the nitrogen uptake of wheat fertilizer (Figure 7b). The random forest model indicates that soil AN, BRN, FN, MN, and pH are the top five factors explaining the nitrogen uptake of the wheat fertilizer in order (Figure 7d). The results of the path analysis showed that there were two main transformation pathways affecting the uptake of nitrogen by wheat after nitrogen was added to the soil. One was a direct effect on the available nitrogen components (AN and MN), while the other was through the temporary storage of nitrogen in the “Immobilized N pool”, which included two mechanisms: microbial retention (MRN and MBN) and physical retention (FN). The nitrogen in the retention pool could be released through mineralization or crystallization to replenish the available nitrogen pool and provide nitrogen for the wheat (Figure 8).

4. Discussion

4.1. The Effect of Different Nitrogen Levels on Microbial Residue

Soil microorganisms mediate the dynamics of microbial residues through the cell pathways of the nutrient-uptake material and synthesis, proliferation, and death [31]. The balance between the production and decomposition of soil microbial residues determines their ultimate accumulation level [20,28,32]. A number of meta-analyses have emphasized that the addition of nitrogen in the farmland ecosystem increases the content of soil microbial residues, and the response of microbial residues and biomass to nitrogen addition increases with the increase in the nitrogen addition rate (0–800 kg N ha−1a−1), and there is a two-way positive effect between the two [26,33,34]. In this study, long-term nitrogen application was beneficial to the accumulation of soil microbial residues, but the conversion and utilization of nitrogen by microorganisms did not continue to increase with the increase in the nitrogen application level (Figure 3b). This is consistent with the results of Hu et al. in the rice–wheat system and Anning et al. in the farmland soil of the Loess Plateau [25,26]. Zhang et al.’s research results in tropical forest ecosystems showed that high-level nitrogen addition decreased the accumulation of soil microbial residues compared to medium-level nitrogen addition [35]. The application of nitrogen fertilizer increased the total nitrogen content in soil (Table 1) and improved the effectiveness of nitrogen, and microorganisms can use nitrogen sources to increase their own biomass [33,36]. As the amount of nitrogen applied increases, the pH of the soil gradually decreases (Table 1). Long-term high-level nitrogen application may inhibit the growth of microorganisms due to ammonia toxicity [37]. At the same time, as more and more nitrogen is applied, the growth of soil microorganisms is limited by carbon in the soil. Microbial residues serve as a “carbon source” and are excavated by microorganisms to rebuild biomass [38,39], which affects the production and degradation of soil microbial residues. SOC in the N200 treatment is higher than that in other treatments, which may alleviate the carbon limitation of microbial growth (Table 1). In addition, other studies have also shown that when adding other exogenous nutrients such as crop straw and manure to farmland, the addition ratio is not linearly related to the maintenance of microbial biomass and microbial residue, and the appropriate addition amount is more conducive to the production and retention of the microbial residue [40,41,42,43]. The efficiency of nitrogen conversion from fertilizer nitrogen to microbial residue nitrogen and the contribution of microbial residue nitrogen to soil nitrogen retention can indicate that the soil microorganisms in the N200 treatment exhibit a strong capture and carrying capacity for fertilizer nitrogen (Figure 5a). Fungal and bacterial microorganisms have specificities in nitrogen utilization and in vitro modification, as well as in their retention in soil. Our results indicate that the microbial fixation of soil fertilizer nitrogen during the growth period of wheat mainly relies on fungal microorganisms, while bacterial microorganisms quickly emerge as a key factor in the retention of fertilizer nitrogen during the rapid growth period of wheat (Figure 4c,f).

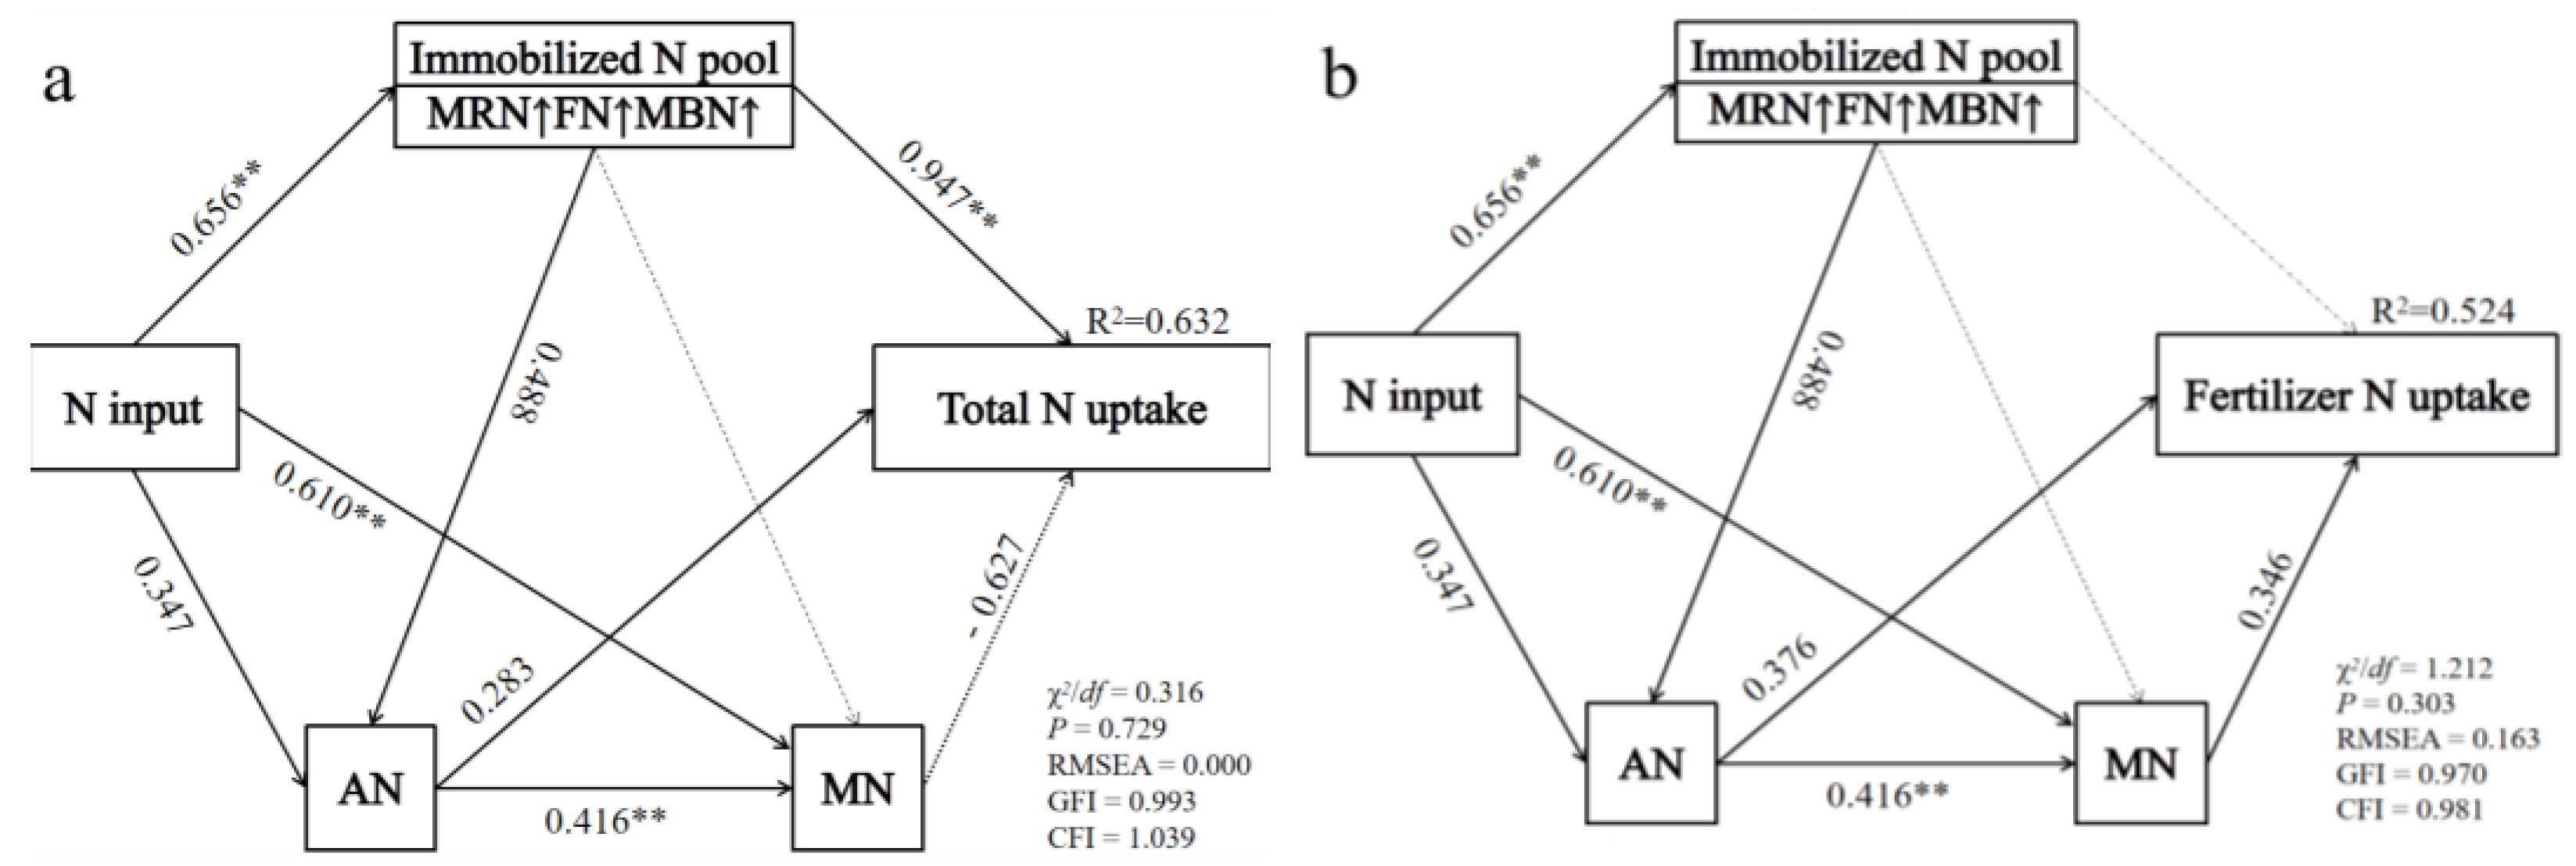
4.2. The Effect of Microbial Residue Nitrogen on Crop Nitrogen Uptake

Sustainable crop growth cannot rely solely on the mineralization of soil nitrogen reservoirs. Our results show that the contribution of soil microbial residue nitrogen to soil nitrogen reservoirs can exceed 50%, confirming the prominent role of microbial residue in soil nitrogen conservation (Figure 3c). Although the differences in wheat yield among N150, N200, and N300 treatments were not significant, significant differences in wheat nitrogen absorption were observed among the treatments (Figure 2). Fungal and bacterial microbial residues have different regulatory effects on wheat nitrogen absorption from different sources of nitrogen, and correlation analysis and random forest models show that soil fungal microbial residue nitrogen is significantly positively correlated with wheat nitrogen absorption and accounts for 27.40% of the weight (Figure 7a,c), while soil bacterial microbial residue nitrogen is significantly positively correlated with wheat nitrogen absorption and accounts for 17.80% of the weight (Figure 7b,d). The results of Ma et al. showed that the reduction in microbial residue nitrogen was significantly positively correlated with the insufficient absorption of crop nitrogen. Microbial residue nitrogen has the ability to compensate for crop nitrogen demand through decomposition and mineralization, but its role in soil nitrogen remains primarily conservation [39]. We found that 21.13% and 22.91% of the MRN in N200 and N300, respectively, were mineralized during the rapid growth stage of wheat (from the filling stage to the harvest stage), while only 12.39% of the MRN in N150 was mineralized. However, N150 had 19.71% of the soil MRN mineralized during the tillering stage to the jointing stage, and the mineralization ratio was much higher than that of N200 and N300 (Figure 3b). At the harvest stage, the soil TN, AN, and MN contents of N200 and N300 were at the same level, both higher than that of N150 (Figure 3a and Table 1), indicating that MRN mineralization replenished the soil available nitrogen, and N200 had the same ability as N300 to compensate for crop nitrogen demand through soil microbial residue nitrogen. However, N150 had a large amount of soil MRN mineralized during the early growth stage of wheat, resulting in insufficient replenishment of nitrogen availability during the rapid growth stage of wheat, which contributed to the differences in wheat nitrogen absorption among the treatments. Although soil BRN (booting stage) begins to mineralize earlier than soil FRN (filling stage), the amount of soil FRN mineralization is greater (Figure 4a,b). Studies have shown that carbon from fungal necrotic material is more common in bacteria than fungi [44]. Here we believe that the impact of the microbial residue nitrogen pool as a “transitional pool” on soil nitrogen availability during the wheat growth period includes two aspects. First, nitrogen in the “transitional pool” is directly converted into available nitrogen and utilized by plants and microorganisms [45]. Second, due to the rapid turnover of bacterial microorganisms, some stable fungal residue nitrogen forms are converted to relatively easily decomposable bacterial residue nitrogen forms [24,46]. During the wheat growth period, the newly formed microbial residue nitrogen from fertilizer nitrogen in N200 and N300 treatments mineralizes before the soil background microbial residue nitrogen, and the mineralization amplitude of the newly formed microbial residue nitrogen from fertilizer nitrogen is higher than that of the background microbial residue nitrogen, which may be due to the formation of soil microbial residue nitrogen that is less protected by soil aggregates and mineral particle adsorption [47,48,49]. However, only a small amount of MRNF mineralized under the N150 treatment (Figure 3e), which may be related to the low nutrient availability of the N150 treatment, which is not conducive to microbial activity [26]. From the emergence stage to the flowering stage of wheat, the retention effect of bacterial microorganisms on fertilizer nitrogen is more prominent than that of fungal microorganisms, and then from the flowering stage to the harvest stage, soil BRNF releases the fertilizer nitrogen slowly and effectively, which is beneficial for wheat absorbing fertilizer nitrogen (Figure 4e). In the rhizosphere soil, there is a significant negative rhizosphere effect of soil FRN at the filling stage, while soil BRN has a significant positive rhizosphere effect, indicating that bacterial microorganisms in the wheat rhizosphere utilize soil FRN rapidly. At the same time, microbial residue nitrogen formed by fertilizer nitrogen had significant positive rhizosphere effects and gradually increased over time (Figure 6), indicating that rhizosphere soil microorganisms were in an active state, and nitrogen in the non-root zone migrated to the root zone, providing a guarantee for the crop absorption of fertilizer nitrogen.

5. Conclusions

Based on a 14-year long-term location fertilization experiment, combining microbial residue with 15N-labeling technology, the dynamic changes of MRN from different sources during the growth period of wheat under different N levels were evaluated. We found that the addition of 200 kg N ha−1 to farmland in the North China Plain is an effective measure to improve the N fixation and transformation of microorganisms, which ensures the wheat yield and provides a theoretical basis for guiding agricultural practice in the region. The contribution of MRN to soil TN and the retention of fertilizer N applied during the current season are significant. It mainly forms a transitional N pool through the accumulation of FRN. During the slow growth stage of wheat, it mainly shows an accumulation effect, and during the rapid growth stage, it begins to mineralize and provide N for crops. In conclusion, our research results are helpful for understanding the impact of soil microbial residue accumulation on soil fertility improvement from a mechanism perspective. Compared with fertilizer nitrogen input, straw crushing and returning is also an important nitrogen input method for farmland in the North China Plain. We hope to comprehensively evaluate the long-term and short-term impacts of different exogenous nitrogen inputs on the soil microbial residue nitrogen pool in the future, to evaluate more cost-effective agricultural practices.

Author Contributions

Conceptualization, Y.Z., L.Z. and X.L. (Xiaoxin Li); methodology, H.H., S.Q. and C.H.; Investigation, J.L.; software, L.X. and C.Z.; validation, Y.L., X.L. (Xiuping Liu) and W.D.; formal analysis, L.X.; resources, H.H.; data curation, C.Z.; writing—original draft preparation, J.H.; writing—review and editing, J.H.; visualization, J.H.; supervision, Y.Z.; funding acquisition, Y.Z. All authors have read and agreed to the published version of the manuscript.

Funding

This research was funded by the National Key Research and Development Program of China (Grant No. 2022YFD1901303 and 2022YFD1500302), the Strategic Priority Research Program of the Chinese Academy of Sciences (Grant No. XDA28010301), the Key Research and Development Program of Hebei Province (Grand No. 22326410D), the Central Guided Local Science and Technology Development Fund Project (236Z7303G), and the Natural Science Foundation of Hebei Province(C2022503009). The authors thank the colleagues at the Luancheng Agroecosystem Experimental Station for technical assistance and precious efforts in maintaining and measuring the long-term experiment.

Data Availability Statement

Data are contained within the article.

Conflicts of Interest

The authors declare no conflicts of interest.

References

  1. Giordano, M.; Petropoulos, S.A.; Rouphael, Y. The Fate of Nitrogen from Soil to Plants: Influence of Agricultural Practices in Modern Agriculture. Agriculture 2021, 11, 944. [Google Scholar] [CrossRef]
  2. Erisman, J.W.; Sutton, M.A.; Galloway, J.; Klimont, Z.; Winiwarter, W. How a Century of Ammonia Synthesis Changed the World. Nat. Geosci. 2008, 1, 636–639. [Google Scholar] [CrossRef]
  3. Zhang, X.; Davidson, E.A.; Mauzerall, D.L.; Searchinger, T.D.; Dumas, P.; Shen, Y. Managing Nitrogen for Sustainable Development. Nature 2015, 528, 51–59. [Google Scholar] [CrossRef] [PubMed]
  4. Quan, Z.; Zhang, X.; Davidson, E.A.; Zhu, F.; Li, S.; Zhao, X.; Chen, X.; Zhang, L.; He, J.; Wei, W.; et al. Fates and Use Efficiency of Nitrogen Fertilizer in Maize Cropping Systems and Their Responses to Technologies and Management Practices: A Global Analysis on Field 15N Tracer Studies. Earth’s Future 2021, 9, e2020EF001514. [Google Scholar] [CrossRef]
  5. Martínez-Dalmau, J.; Berbel, J.; Ordóñez-Fernández, R. Nitrogen Fertilization. A Review of the Risks Associated with the Inefficiency of Its Use and Policy Responses. Sustainability 2021, 13, 5625. [Google Scholar] [CrossRef]
  6. Stevens, W.B.; Hoeft, R.G.; Mulvaney, R.L. Fate of Nitrogen-15 in a Long-Term Nitrogen Rate Study: II. Nitrogen Uptake Efficiency. Agron. J. 2005, 97, 1046–1053. [Google Scholar] [CrossRef]
  7. Pandey, A.; Eldridge, S.M.; Weatherley, A.; Willett, I.R.; Myint, A.K.; Oo, A.N.; Ngwe, K.; Mang, Z.T.; Chen, D. High Fertilizer Nitrogen Input Increases Nitrogen Mining in Sandy Paddy Soils. Nutr. Cycl. Agroecosyst. 2023, 125, 77–88. [Google Scholar] [CrossRef]
  8. Dan, X.; He, M.; Meng, L.; He, X.; Wang, X.; Chen, S.; Cai, Z.; Zhang, J.; Zhu, B.; Müller, C. Strong Rhizosphere Priming Effects on N Dynamics in Soils with Higher Soil N Supply Capacity: The ‘Matthew Effect’ in Plant-Soil Systems. Soil Biol. Biochem. 2023, 178, 108949. [Google Scholar] [CrossRef]
  9. Singh, B. Are Nitrogen Fertilizers Deleterious to Soil Health? Agronomy 2018, 8, 48. [Google Scholar] [CrossRef]
  10. Khan, S.A.; Mulvaney, R.L.; Ellsworth, T.R.; Boast, C.W. The Myth of Nitrogen Fertilization for Soil Carbon Sequestration. J. Environ. Qual. 2007, 36, 1821–1832. [Google Scholar] [CrossRef]
  11. Chen, Z.; Zhou, X.; Geng, S.; Miao, Y.; Cao, Y.; Chen, Z.; Zhang, J.; Han, S. Interactive Effect of Nitrogen Addition and Throughfall Reduction Decreases Soil Aggregate Stability through Reducing Biological Binding Agents. For. Ecol. Manag. 2019, 445, 13–19. [Google Scholar] [CrossRef]
  12. Wang, F.; Liu, Y.; Liang, B.; Liu, J.; Zong, H.; Guo, X.; Wang, X.; Song, N. Variations in Soil Aggregate Distribution and Associated Organic Carbon and Nitrogen Fractions in Long-Term Continuous Vegetable Rotation Soil by Nitrogen Fertilization and Plastic Film Mulching. Sci. Total Environ. 2022, 835, 155420. [Google Scholar] [CrossRef]
  13. Ren, C.; Zhang, X.; Reis, S.; Gu, B. Socioeconomic Barriers of Nitrogen Management for Agricultural and Environmental Sustainability. Agric. Ecosyst. Environ. 2022, 333, 107950. [Google Scholar] [CrossRef]
  14. Hayatsu, M.; Tago, K.; Saito, M. Various Players in the Nitrogen Cycle: Diversity and Functions of the Microorganisms Involved in Nitrification and Denitrification. Soil Sci. Plant Nutr. 2008, 54, 33–45. [Google Scholar] [CrossRef]
  15. Ma, Q.; Wu, Z.; Pan, F.; Wang, J.; Zhou, H.; Jiang, C.; Xu, Y.; Yu, W. Effect of Glucose Addition on the Fate of Urea-15N in Fixed Ammonium and Soil Microbial Biomass N Pools. Eur. J. Soil Biol. 2016, 75, 168–173. [Google Scholar] [CrossRef]
  16. Pajares, S.; Bohannan, B.J.M. Ecology of Nitrogen Fixing, Nitrifying, and Denitrifying Microorganisms in Tropical Forest Soils. Front. Microbiol. 2016, 7, 1045. [Google Scholar] [CrossRef] [PubMed]
  17. Liang, C. Soil Microbial Carbon Pump: Mechanism and Appraisal. Soil Ecol. Lett. 2020, 2, 241–254. [Google Scholar] [CrossRef]
  18. Liang, C.; Zhu, X. The Soil Microbial Carbon Pump as a New Concept for Terrestrial Carbon Sequestration. Sci. China Earth Sci. 2021, 64, 545–558. [Google Scholar] [CrossRef]
  19. Glaser, B.; Millar, N.; Blum, H. Sequestration and Turnover of Bacterial- and Fungal-Derived Carbon in a Temperate Grassland Soil under Long-Term Elevated Atmospheric p CO2. Glob. Chang. Biol. 2006, 12, 1521–1531. [Google Scholar] [CrossRef]
  20. Joergensen, R.G. Amino Sugars as Specific Indices for Fungal and Bacterial Residues in Soil. Biol. Fertil. Soils 2018, 54, 559–568. [Google Scholar] [CrossRef]
  21. Buckeridge, K.M.; Mason, K.E.; McNamara, N.P.; Ostle, N.; Puissant, J.; Goodall, T.; Griffiths, R.I.; Stott, A.W.; Whitaker, J. Environmental and Microbial Controls on Microbial Necromass Recycling, an Important Precursor for Soil Carbon Stabilization. Commun. Earth Environ. 2020, 1, 36. [Google Scholar] [CrossRef]
  22. Glaser, B.; Turrión, M.-B.; Alef, K. Amino Sugars and Muramic Acid—Biomarkers for Soil Microbial Community Structure Analysis. Soil Biol. Biochem. 2004, 36, 399–407. [Google Scholar] [CrossRef]
  23. He, H.; Xie, H.; Zhang, X. A Novel GC/MS Technique to Assess 15N and 13C Incorporation into Soil Amino Sugars. Soil Biol. 2006, 38, 1083–1091. [Google Scholar] [CrossRef]
  24. Zhou, F.; Zhang, X.; Ma, S.; Li, Y.; Zhu, M.; Zhang, W.; Li, J.; Liu, X.; Hu, G.; Wang, X.; et al. Soil Microbial Necromass Regulation of Long-Term Fertilizer N Retention Influenced by Maize Stover Mulching. Geoderma 2023, 433, 116453. [Google Scholar] [CrossRef]
  25. Anning, D.K.; Li, Z.; Qiu, H.; Deng, D.; Zhang, C.; Ghanney, P.; Shen, Q. Divergent Accumulation of Microbial Residues and Amino Sugars in Loess Soil after Six Years of Different Inorganic Nitrogen Enrichment Scenarios. Appl. Sci. 2021, 11, 5788. [Google Scholar] [CrossRef]
  26. Hu, Q.; Liu, T.; Ding, H.; Li, C.; Tan, W.; Yu, M.; Liu, J.; Cao, C. Effects of Nitrogen Fertilizer on Soil Microbial Residues and Their Contribution to Soil Organic Carbon and Total Nitrogen in a Rice-Wheat System. Appl. Soil Ecol. 2023, 181, 104648. [Google Scholar] [CrossRef]
  27. Zhou, R.; Liu, Y.; Dungait, J.A.J.; Kumar, A.; Wang, J.; Tiemann, L.K.; Zhang, F.; Kuzyakov, Y.; Tian, J. Microbial Necromass in Cropland Soils: A Global Meta-analysis of Management Effects. Glob. Chang. Biol. 2023, 29, 1998–2014. [Google Scholar] [CrossRef] [PubMed]
  28. Chen, J.; Song, D.; Luan, H.; Liu, D.; Wang, X.; Sun, J.; Zhou, W.; Liang, G. Living and Dead Microorganisms in Mediating Soil Carbon Stocks Under Long-Term Fertilization in a Rice-Wheat Rotation. Front. Microbiol. 2022, 13, 854216. [Google Scholar] [CrossRef]
  29. Groffman, P.M.; Fahey, T.J.; Fisk, M.C.; Yavitt, J.B.; Sherman, R.E.; Bohlen, P.J.; Maerz, J.C. Earthworms Increase Soil Microbial Biomass Carrying Capacity and Nitrogen Retention in Northern Hardwood Forests. Soil Biol. Biochem. 2015, 87, 51–58. [Google Scholar] [CrossRef]
  30. Ju, X.-T.; Xing, G.-X.; Chen, X.-P.; Zhang, S.-L.; Zhang, L.-J.; Liu, X.-J.; Cui, Z.-L.; Yin, B.; Christie, P.; Zhu, Z.-L.; et al. Reducing Environmental Risk by Improving N Management in Intensive Chinese Agricultural Systems. Proc. Natl. Acad. Sci. USA 2009, 106, 3041–3046. [Google Scholar] [CrossRef]
  31. Liang, C.; Schimel, J.P.; Jastrow, J.D. The Importance of Anabolism in Microbial Control over Soil Carbon Storage. Nat. Microbiol. 2017, 2, 17105. [Google Scholar] [CrossRef]
  32. Buckeridge, K.M.; Creamer, C.; Whitaker, J. Deconstructing the Microbial Necromass Continuum to Inform Soil Carbon Sequestration. Funct. Ecol. 2022, 36, 1396–1410. [Google Scholar] [CrossRef]
  33. Liao, S.; Tan, S.; Peng, Y.; Wang, D.; Ni, X.; Yue, K.; Wu, F.; Yang, Y. Increased Microbial Sequestration of Soil Organic Carbon under Nitrogen Deposition over China’s Terrestrial Ecosystems. Ecol. Process. 2020, 9, 52. [Google Scholar] [CrossRef]
  34. Hu, J.; Huang, C.; Zhou, S.; Liu, X.; Dijkstra, F.A. Nitrogen Addition Increases Microbial Necromass in Croplands and Bacterial Necromass in Forests: A Global Meta-Analysis. Soil Biol. Biochem. 2022, 165, 108500. [Google Scholar] [CrossRef]
  35. Zhang, W.; Cui, Y.; Lu, X.; Bai, E.; He, H.; Xie, H.; Liang, C.; Zhang, X. High Nitrogen Deposition Decreases the Contribution of Fungal Residues to Soil Carbon Pools in a Tropical Forest Ecosystem. Soil Biol. Biochem. 2016, 97, 211–214. [Google Scholar] [CrossRef]
  36. Zhou, Z.; Wang, C.; Zheng, M.; Jiang, L.; Luo, Y. Patterns and Mechanisms of Responses by Soil Microbial Communities to Nitrogen Addition. Soil Biol. 2017, 115, 433–441. [Google Scholar] [CrossRef]
  37. Geisseler, D.; Scow, K.M. Long-Term Effects of Mineral Fertilizers on Soil Microorganisms—A Review. Soil Biol. Biochem. 2014, 75, 54–63. [Google Scholar] [CrossRef]
  38. Engelking, B.; Flessa, H.; Joergensen, R.G. Shifts in Amino Sugar and Ergosterol Contents after Addition of Sucrose and Cellulose to Soil. Soil Biol. Biochem. 2007, 39, 2111–2118. [Google Scholar] [CrossRef]
  39. Ma, X.; Zhang, W.; Zhang, X.; Bao, X.; Xie, H.; Li, J.; He, H.; Liang, C.; Zhang, X. Dynamics of Microbial Necromass in Response to Reduced Fertilizer Application Mediated by Crop Residue Return. Soil Biol. Biochem. 2022, 165, 108512. [Google Scholar] [CrossRef]
  40. Yang, Y.; Xie, H.; Mao, Z.; Bao, X.; He, H.; Zhang, X.; Liang, C. Fungi Determine Increased Soil Organic Carbon More than Bacteria through Their Necromass Inputs in Conservation Tillage Croplands. Soil Biol. Biochem. 2022, 167, 108587. [Google Scholar] [CrossRef]
  41. Xu, Y.; Gao, X.; Liu, Y.; Li, S.; Liang, C.; Lal, R.; Wang, J. Differential Accumulation Patterns of Microbial Necromass Induced by Maize Root vs. Shoot Residue Addition in Agricultural Alfisols. Soil Biol. Biochem. 2022, 164, 108474. [Google Scholar] [CrossRef]
  42. Su, F.; Chen, X.; Zhang, L.; Hao, M.; Wei, X. Dynamics of Microbial Residues in Highland Agroecosystems as Affected by Cropping Systems and Fertilisation in a 31-year-long Experiment. Eur. J. Soil Sci. 2022, 73, e13205. [Google Scholar] [CrossRef]
  43. Zhang, Y.; Gao, Y.; Zhang, Y.; Huang, D.; Li, X.; Gregorich, E.; McLaughlin, N.; Zhang, X.; Chen, X.; Zhang, S.; et al. Effect of Long-Term Tillage and Cropping System on Portion of Fungal and Bacterial Necromass Carbon in Soil Organic Carbon. Soil Tillage Res. 2022, 218, 105307. [Google Scholar] [CrossRef]
  44. López-Mondéjar, R.; Brabcová, V.; Štursová, M.; Davidová, A.; Jansa, J.; Cajthaml, T.; Baldrian, P. Decomposer Food Web in a Deciduous Forest Shows High Share of Generalist Microorganisms and Importance of Microbial Biomass Recycling. ISME J. 2018, 12, 1768–1778. [Google Scholar] [CrossRef]
  45. Akroume, E.; Maillard, F.; Bach, C.; Hossann, C.; Brechet, C.; Angeli, N.; Zeller, B.; Saint-André, L.; Buée, M. First Evidences That the Ectomycorrhizal Fungus Paxillus Involutus Mobilizes Nitrogen and Carbon from Saprotrophic Fungus Necromass. Environ. Microbiol. 2019, 21, 197–208. [Google Scholar] [CrossRef] [PubMed]
  46. Simon, A.; Bindschedler, S.; Job, D.; Wick, L.Y.; Filippidou, S.; Kooli, W.M.; Verrecchia, E.P.; Junier, P. Exploiting the Fungal Highway: Development of a Novel Tool for the in Situ Isolation of Bacteria Migrating along Fungal Mycelium. FEMS Microbiol. Ecol. 2015, 91, fiv116. [Google Scholar] [CrossRef] [PubMed]
  47. Villarino, S.H.; Talab, E.; Contisciani, L.; Videla, C.; Di Geronimo, P.; Mastrángelo, M.E.; Georgiou, K.; Jackson, R.B.; Piñeiro, G. A Large Nitrogen Supply from the Stable Mineral-Associated Soil Organic Matter Fraction. Biol. Fertil. Soils 2023, 59, 833–841. [Google Scholar] [CrossRef]
  48. Xu, Y.; Sun, L.; Gao, X.; Wang, J. Contrasting Response of Fungal versus Bacterial Residue Accumulation within Soil Aggregates to Long-Term Fertilization. Sci. Rep. 2022, 12, 17834. [Google Scholar] [CrossRef]
  49. Xue, P.; Pei, J.; Ma, N.; Wang, J. Microbial Residual Nitrogen Distribution in Brown Earth’s Aggregates as Affected by Different Maize Residues and Soil Fertility Levels. Front. Environ. Sci. 2022, 10, 892039. [Google Scholar] [CrossRef]
Figure 1. The experimental treatment layout, where the 15N isotope-labeled micro-regions are marked with bright colors for treatment.
Agronomy 14 00193 g001
Figure 2. Regression analysis of the nitrogen application rate and the wheat grain yield (a), the total nitrogen uptake in the aboveground part of the wheat and fertilizer nitrogen uptake (b). Asterisks indicate the significance level of the regression: *** p < 0.001. Different lowercase letters indicate significant differences between treatments (p < 0.05).
Agronomy 14 00193 g002
Figure 3. The dynamic changes in TN content (a), MRN content (b), MRN/TN ratio (c), TNF content (d), MRNF content (e), and MRNF/TNF ratio (f) during the experiment among the three treatments. The means and standard errors are shown (n = 3). Different lowercase letters indicate significant differences between treatments (p < 0.05).
Agronomy 14 00193 g003
Figure 4. The dynamic changes in FRN content (a), BRN content (b), FRN/BRN ratio (c), FRNF content (d), BRNF content (e), and FRNF/BRNF ratio (f) during the experiment among the three treatments. The means and standard errors are shown (n = 3). Different lowercase letters indicate significant differences between treatments (p < 0.05).
Agronomy 14 00193 g004
Figure 5. The efficiency of fertilizer nitrogen in synthesizing FRN (a), BRN (b), and MRN (c) in the three treatments during the experiment. Different lowercase letters indicate differences between different time periods under the same treatment (p < 0.05).
Agronomy 14 00193 g005
Figure 6. The dynamic changes in the FRN content in the rhizosphere soil (a), the dynamic changes in the BRN content in the rhizosphere soil (b), the dynamic changes in the MRN content in the rhizosphere soil (c), the dynamic changes in the FRNF content in the rhizosphere soil (d), the dynamic changes in the BRNF content in the rhizosphere soil (e), and the dynamic changes in the rhizosphere soil MRNF content (f). Different lowercase letters indicate significant differences between treatments (p < 0.05), and + (p < 0.05), ++ (p < 0.01), and +++ (p < 0.001) indicate positive roots. In the same way, − represents a negative rhizosphere effect.
Agronomy 14 00193 g006
Figure 7. The correlation of explanatory variables with the total nitrogen uptake in wheat (a), and the correlation of explanatory variables with the wheat fertilizer nitrogen uptake (b). Relative importance (%) of explanatory variables in explaining the crop total nitrogen uptake (c) and fertilizer nitrogen uptake (d). Significant effects are indicated as follows: * p < 0.05, ** p < 0.01, *** p < 0.001.
Agronomy 14 00193 g007
Figure 8. Direct and indirect pathways of different forms of nitrogen pools affecting the uptake of total nitrogen by the wheat shoot (a) and direct and indirect pathways of different forms of nitrogen pools affecting the uptake of fertilizer nitrogen by the wheat shoot (b). The direction of the arrow indicates the direction of the path, and the value next to the arrow indicates the standardized path coefficient, with significant effects: ** p < 0.01.
Agronomy 14 00193 g008
Table 1. The physical and chemical properties of 0–20 cm soil.
FactorsTreatment
N150N200N300
SOC (g kg−1)9.25 ± 0.32 c11.39 ± 0.16 a10.39 ± 0.05 b
pH8.53 ± 0.08 a8.39 ± 0.01 b8.44 ± 0.03 ab
AP (mg kg−1)35.41 ± 2.83 a35.02 ± 3.10 a34.85 ± 3.18 a
AK (mg kg−1)125.80 ± 2.90 a130.85 ± 5.75 a132.81 ± 2.18 a
AN (mg kg−1)123.23 ± 2.24 b134.76 ± 6.20 a136.58 ± 7.19 a
FN (mg kg−1)148.76 ± 0.73 c156.68 ± 0.53 b170.41 ± 0.49 a
MN (mg kg−1)33.39 ± 1.50 c40.59 ± 3.14 b46.31 ± 3.48 a
MBN (mg kg−1)2.96 ± 0.18 a3.25 ± 0.12 a2.51 ± 0.18 b
SOC refers to soil organic carbon, pH refers to soil acidity and alkalinity, AP refers to soil available phosphorus, AK refers to soil available potassium, FN refers to soil fixed ammonium, MN refers to soil mineral nitrogen, and MBN refers to soil microbial biomass nitrogen. The means and standard errors are shown (n = 3). Different lowercase letters indicate significant differences between treatments (p < 0.05).
Disclaimer/Publisher’s Note: The statements, opinions and data contained in all publications are solely those of the individual author(s) and contributor(s) and not of MDPI and/or the editor(s). MDPI and/or the editor(s) disclaim responsibility for any injury to people or property resulting from any ideas, methods, instructions or products referred to in the content.

