Article

Exploring the Diverse Response of Cropland Vegetation to Climatic Factors and Irrigation across China

1
College of Water Resources and Architectural Engineering, Northwest A&F University, Yangling, Xianyang 712100, China
2
College of Water Conservancy and Hydropower Engineering, Hohai University, Nanjing 210098, China
3
Yellow River Engineering Consulting Co., Ltd., Zhengzhou 450003, China
*
Author to whom correspondence should be addressed.
Agronomy 2024, 14(1), 188; https://doi.org/10.3390/agronomy14010188
Submission received: 20 December 2023 / Revised: 11 January 2024 / Accepted: 11 January 2024 / Published: 15 January 2024
(This article belongs to the Section Water Use and Irrigation)

Abstract

:
Owing to limited research on the interactions between cropland vegetation and climate and irrigation, this study used the normalized difference vegetation index (NDVI) as a cropland vegetation indicator to describe vegetation dynamics. Potential evapotranspiration (PET) was calculated using the Penman–Monteith equation. A partial correlation analysis and a Pearson correlation coefficient were used to determine the spatial response mechanisms of cropland vegetation to different climatic factors and irrigation in China for the period 1985–2015. The results show that different climatic factors (precipitation, PET, and water deficits) display positive correlations with cropland vegetation in China. A stronger correlation was observed between cropland vegetation and meteorological factors in northern China compared to the southern parts; the response time of NDVI values of croplands to precipitation was observed to be short-term (1 to 3 months) and long-term (3 to 6 months) in northern and southern regions, respectively. In contrast, the response time of NDVI values of croplands to PET displayed a complex spatial heterogeneity. Most of the cropland vegetation and the areas with the highest potential crop yields were located in the eastern part of China; these areas also require higher levels of irrigation, which benefits the potential crop yields. This study can provide a better understanding of the agricultural ecosystems and formulate strategies for food security.

1. Introduction

Vegetation plays an essential role in material and energy exchange, greenhouse carbon reduction, and climate stabilization [1,2,3,4]. The vegetation cover is commonly used to assess regional and global environmental conditions [5,6,7,8]. The impact of human activities and climatic factors on vegetation dynamics has been widely discussed in the last few decades [9,10,11]. Relevant studies have shown that climatic factors have the most direct effect on vegetation, affecting its growing seasons, species composition, and distributional range, thereby altering the structure and function of ecosystems; human activities directly or indirectly affect vegetation by disturbing and modifying ecosystems, such as urban development and land-use change [12,13,14,15].
Cropland, being one of the most significant terrestrial vegetation types, is essential for the sustainable development of national economies [16,17,18,19]. In addition to producing grains, vegetables, and fiber for humans, cropland also performs important roles in ecosystem services such as soil protection, carbon sequestration, and gas management [20,21,22]. Cropland vegetation is much more complex than other types of vegetation changes due to farmers and government policies [23,24,25,26]. In particular, cropland has retained the traits of the original natural ecosystem while also undergoing extensive human modification, resulting in a classic natural–artificial coupled ecosystem [16,27]. However, less research has investigated the different responses of cropland vegetation to environmental conditions than vegetation such as forests and grasslands. Investigating cropland vegetation’s reaction to climatic variables and human activities can aid in understanding the drivers of cropland change, developing reasonable agricultural policies, and achieving sustainable agricultural growth.
Satellite remote sensing data have become an indispensable source of information for monitoring vegetation changes at the regional, national, and global levels [28,29,30,31]. Remote sensing vegetation indexes have been widely utilized to monitor vegetation status [32,33,34]. Numerous studies have confirmed that the Normalized Difference Vegetation Index (NDVI) is closely related to aboveground biomass, the leaf area index (LAI), vegetation coverage, and vegetation chlorophyll, thereby effectively reflecting regional vegetation coverage and vegetation growth status. Therefore, among various vegetation indices, the NDVI has become the most popular vegetation index and is commonly used in the quantification of vegetation dynamics, terrestrial carbon, and environmental stress [7,35]. The Global Inventory Modeling and Mapping Study (GIMMS) NDVI product, derived from the Advanced Very High-Resolution Radiometer, provides global bi-weekly NDVI data starting from the 1980s, which is considered to be a reliable long-term NDVI time series, and has been widely used in Earth and environmental sciences [35,36,37]. These remotely sensed data are also employed for crop monitoring and agricultural yield predictions, allowing for the examination of crop vegetation over lengthy time periods and enormous areas [34].
Cropland vegetation growth is vulnerable to a combination of natural and anthropogenic factors [7,13,15,38]. Climate affects vegetation dynamics, which in turn impacts plant growth [39]. Precipitation is the climate factor that receives the most attention when examining the response between cropland vegetation and climate, especially in arid regions. Changes in precipitation over a longer time period will cause changes in the type of vegetation function, while changes in annual and seasonal precipitation will alter plant phenology and ecosystem cover [38,40]. Potential evapotranspiration (PET) plays a critical role in the ongoing atmosphere–soil–vegetation interaction as an essential component of the global water and energy cycles, and water resources in the agricultural system are primarily drained through PET [41,42]. Similarly, PET impacts vegetation development on different temporal and spatial scales. Water scarcity impacts cropland vegetation growth in both arid and humid places due to regional variances in precipitation and PET [43]. Furthermore, previous research has shown that vegetation growth can be influenced by past climatic conditions. Piao et al. (2003) found a nearly three-month lag in the NDVI responses to temperature [44]. Wen et al. (2019) identified the overall average lagged times of daily minimum and maximum temperature on vegetation growth were 1.45 ± 0.96 months and 1.68 ± 1.05 months, respectively [45]. Therefore, time-lag effects must also be considered when evaluating the response relationship between agricultural vegetation and climatic factors, and understanding such time lags allows us to better comprehend the interactions between cropland vegetation and climate factors.
In addition, many studies have confirmed that human activities are another major factor affecting vegetation cover. Ren et al. (2023) demonstrated that anthropogenic influences, such as Gross Domestic Product (GDP), had largely negative effects on the NDVI in the Jilin Province, China, while changes in land use types were mostly positive [7]. Gao et al. (2022) inferred from the results of residual analysis that human activities were the dominant driver for vegetation change [38]. In general, human activities have both positive and negative impacts on vegetation cover [10]. For cropland, irrigation is the main means of supplementing crop water scarcity and ensuring effective water management, and is a major factor influencing changes in cropland vegetation, which are directly affected by human activities [46,47]. Irrigation is becoming increasingly crucial in a rapidly changing climate, since more frequent and severe extremes, such as droughts and heatwaves, increase the risk of plant death and production, while also putting an additional strain on water resources. [48,49,50]. Therefore, it is especially critical to explore the response of cropland vegetation to irrigation.
China is one of the greatest agricultural countries in the world, with significant differences in climatic conditions across the country. The response and feedback mechanisms of cropland vegetation to climatic factors and human activities vary considerably in different areas [51,52,53]. Precipitation, PET, water deficiency, and irrigation all have an impact on cropland vegetation coverage. Therefore, it is necessary to explore the diverse responses of cropland vegetation to various climatic factors and irrigation across China. The primary objectives of this study were to (1) analyze the response of the cropland NDVI to different climatic factors; (2) investigate the response time of cropland vegetation to different climatic factors; and (3) assess the spatial differentiation of the relationship between cropland vegetation and irrigation. The findings of our study could improve our understanding of cropland vegetation development by identifying cropland vegetation response mechanisms and environmental factors, as well as providing decision support for agricultural production.

2. Materials and Methods

2.1. Study Area

The main basins, plateaus, plains, and rivers in China are shown in Figure 1a. Based on climate characteristics, the study area was divided into eight sub-regions (sub-region I to sub-region VIII) (Figure 1b). The climatic classification criteria were provided by the Resource and Environmental Sciences and Data Center of the Institute of Geographic Sciences and Natural Resources Research, Chinese Academy of Sciences (China) (https://www.resdc.cn/data.aspx?DATAID=133, accessed on 20 December 2023). The principal cropland-producing areas were separated into nine sub-regions based on regional features, as illustrated in Figure 1c (http://www.resdc.cn/data.aspx?DATAID=275, accessed on 20 December 2023). The nine food-producing regions are (I) the Northeast China Plain (NECP), (II) the Yunnan–Guizhou Plateau (YGP), (III) the Northern China Plain (NCP), (IV) Southern China (SC), (V) the Sichuan Basin and surrounding regions (SCB), (VI) the Middle and Lower reaches of the Yangtze River (MLRYR), (VII) the Qinghai Tibet Plateau (QTP), (VIII) the Loess Plateau (LP), and (IX) the Arid and Semi-arid Area of North China (ASANC).

2.2. Data Sources and Preprocessing

We employed GIMMS NDVI gridded cell data, specifically the NDVI3g product (USA). For the period 1982–2015, NDVI gridded cell data were collected from the GIMMS dataset with a spatial resolution of 8 km pixel and a temporal resolution of 15 days [54]. The maximum value synthesis method was used to create the monthly dataset [55].
We used NDVI gridded cell data obtained from the Global Inventory Modeling and Mapping Studies (GIMMS) project, specifically the NDVI3g product. The NDVI gridded cell data, originating from the GIMMS dataset with a spatial resolution of 8 km pixel and a temporal resolution of 15 days, were obtained for the period 1982–2015 [54]. The dataset on a monthly scale was achieved by the maximum value synthesis method [55].
In this study, the monthly weather gridded cell data of 862 meteorological stations for the period 1982–2015 (Figure 1b) were obtained from the China Meteorological Data Sharing Service Network (China) (http://data.cma.cn/site/index.html, accessed on 20 December 2023). The PET was calculated using the Penman–Monteith formula, the details of which can be seen in Section 2.3.1. The water deficit was expressed as precipitation minus PET. We reconstructed the spatial resolution of the meteorological data using the Inverse Distance Weighted (IDW) approach, in accordance with the NDVI dataset [56]. Table 1 shows the average annual PET and annual cumulative precipitation for the eight climatic zones (Figure 1b) from 1982 to 2015.
The crop yield (ton) was obtained from the Ministry of Agriculture and Rural Affairs of The People’s Republic of China. The potential yield data of croplands were obtained from the Resource and Environment Science and Data Center (China) (http://www.resdc.cn/data.aspx?DATAID=261, accessed on 20 December 2023). The data about the irrigated cultivated lands were obtained from the Food and Agriculture Organization (FAO) of the United Nations. Specifically, the irrigation rate in this study refers to the proportion of irrigated cultivated lands to total cropland. We resampled the potential yield data and the irrigated cultivated lands to match the spatial resolution of 8 km using the majority function in the Resample Tool of ArcGIS 10.2 (ESRI, Redlands, CA, USA).

2.3. Data Analysis

2.3.1. Potential Evapotranspiration

The Penman–Monteith equation (Equation (1)) takes into account all relevant elements and is commonly used to calculate PET [57,58].
PET = 0.408 Δ R n G + γ 900 T + 273 u 2 e s e a γ 1 + 0.34 u 2 + Δ
where PET is the potential evapotranspiration (mm·d−1); Rn is the net surface radiation (MJ/m−2·d), which is calculated from Equations (2) to (15); G is the soil heat flux (MJ/m2·d), which is calculated from Equation (17); γ is the dry and wet constant (kPa/°C), which is calculated from Equations (10) to (12); T is the average temperature (°C), which is obtained from the observational data; u2 is the wind speed at a height of 2 m (m/s), which is calculated from Equation (16); es is the actual vapor pressure (kPa), which is calculated from Equations (13) to (14); ea is the actual atmospheric pressure (kPa), which is calculated from Equations (13) and (15); and Δ is the tangent slope of the saturation vapor pressure curve at T (kPa/°C), which is calculated from Equation (18).
R n = R n s R n l
where Rns is the net shortwave radiation (MJ/m2·d), which is calculated from Equation (7); and Rnl is the net longwave radiation (MJ/m2·d), which is calculated from Equation (3).
R n l = 2.45 × 10 9 0.9 n N + 0.1 0.34 0.14 e a T max , K 4 + T min , K 4
where n is the actual sunshine hours (h), obtained from the observational data; N is the maximum possible sunshine hours (h), which is calculated from Equation (4); and Tmax,K and Tmin,K are the maximum and minimum absolute temperatures (K), respectively, which are obtained from observational data.
N = 24 / π ω s
where ωs is the sunshine hour angle (rad), which is calculated from Equation (5).
ω s = arccos tan φ tan δ
where φ is geographical latitude (rad), which is obtained from the observational data; and δ is the dip angle of the sun (rad), which is calculated from Equation (6).
δ = 0.409 sin 2 π 365 J 1.39
where J is the ordinal number.
R n s = 0.77 0.19 + 0.38 n N R a
where Ra is the solar radiation at the edge of the atmosphere (MJ/m2·d), which is calculated from Equation (8).
R a = 37.6 d r ω s sin φ sin δ + cos φ cos δ sin ω s
where dr is the relative distance between the sun and the earth, which is calculated from Equation (9).
d r = 1 + 0.033 cos 2 π 365 J
γ = 0.00163 P λ
where P is the pressure (kPa), which is calculated from Equation (11); and λ is the latent heat (MJ/kg), which is calculated from Equation (12).
P = 101.3 293 0.0065 Z 293 5.26
where Z is the elevation (m), which is obtained from the observational data.
λ = 2.501 2.361 × 10 3 T m
where Tm is the monthly average temperature (°C), which is obtained from the observational data.
e T = 0.6108 exp 17.27 T T + 237.3
where e(T) is the saturated water vapor pressure at a temperature of T.
e s = e T max + e T min 2
where Tmax and Tmin are the maximum and minimum temperatures (°C), respectively, which are obtained from the observational data.
e a = R H 50 e T min + 50 e T max
where RH is the relative humidity (%), which is obtained from the observational data.
u 2 = 4.87 U h ln 67.8 h 5.42
where h is the sealing height (m), which is obtained from the observational data; Uh is the actual wind speed (m/s), which is obtained from the observational data.
G = 0.38 T d T d 1
where Td and Td−1 are the atmospheric temperatures at d and d − 1, respectively, which are obtained from the observational data.
Δ = 4098 e a T + 237.3 2

2.3.2. Partial Correlation Analysis

In this study, we performed a pixel-level partial correlation analysis between cropland vegetation, precipitation, and PET for the period 1982–2015.
r y x . z = r x y r x z r y z 1 r x z 2 1 r y z 2
where ryx.z refers to the partial correlation coefficient between y and x, when z is the control variable, and ryx, ryz, and rxz represent the correlation coefficients among y, x, and z, respectively.

2.3.3. Pearson Correlation Coefficient

In this study, we used the Pearson correlation coefficient (p < 0.05) to quantify the impact of water deficits on the vegetation of croplands. The Pearson correlation coefficient was calculated between the cropland vegetation NDVI and crop yield for the major crop-producing areas. The Pearson correlation coefficients were calculated for each grid cell.

3. Results

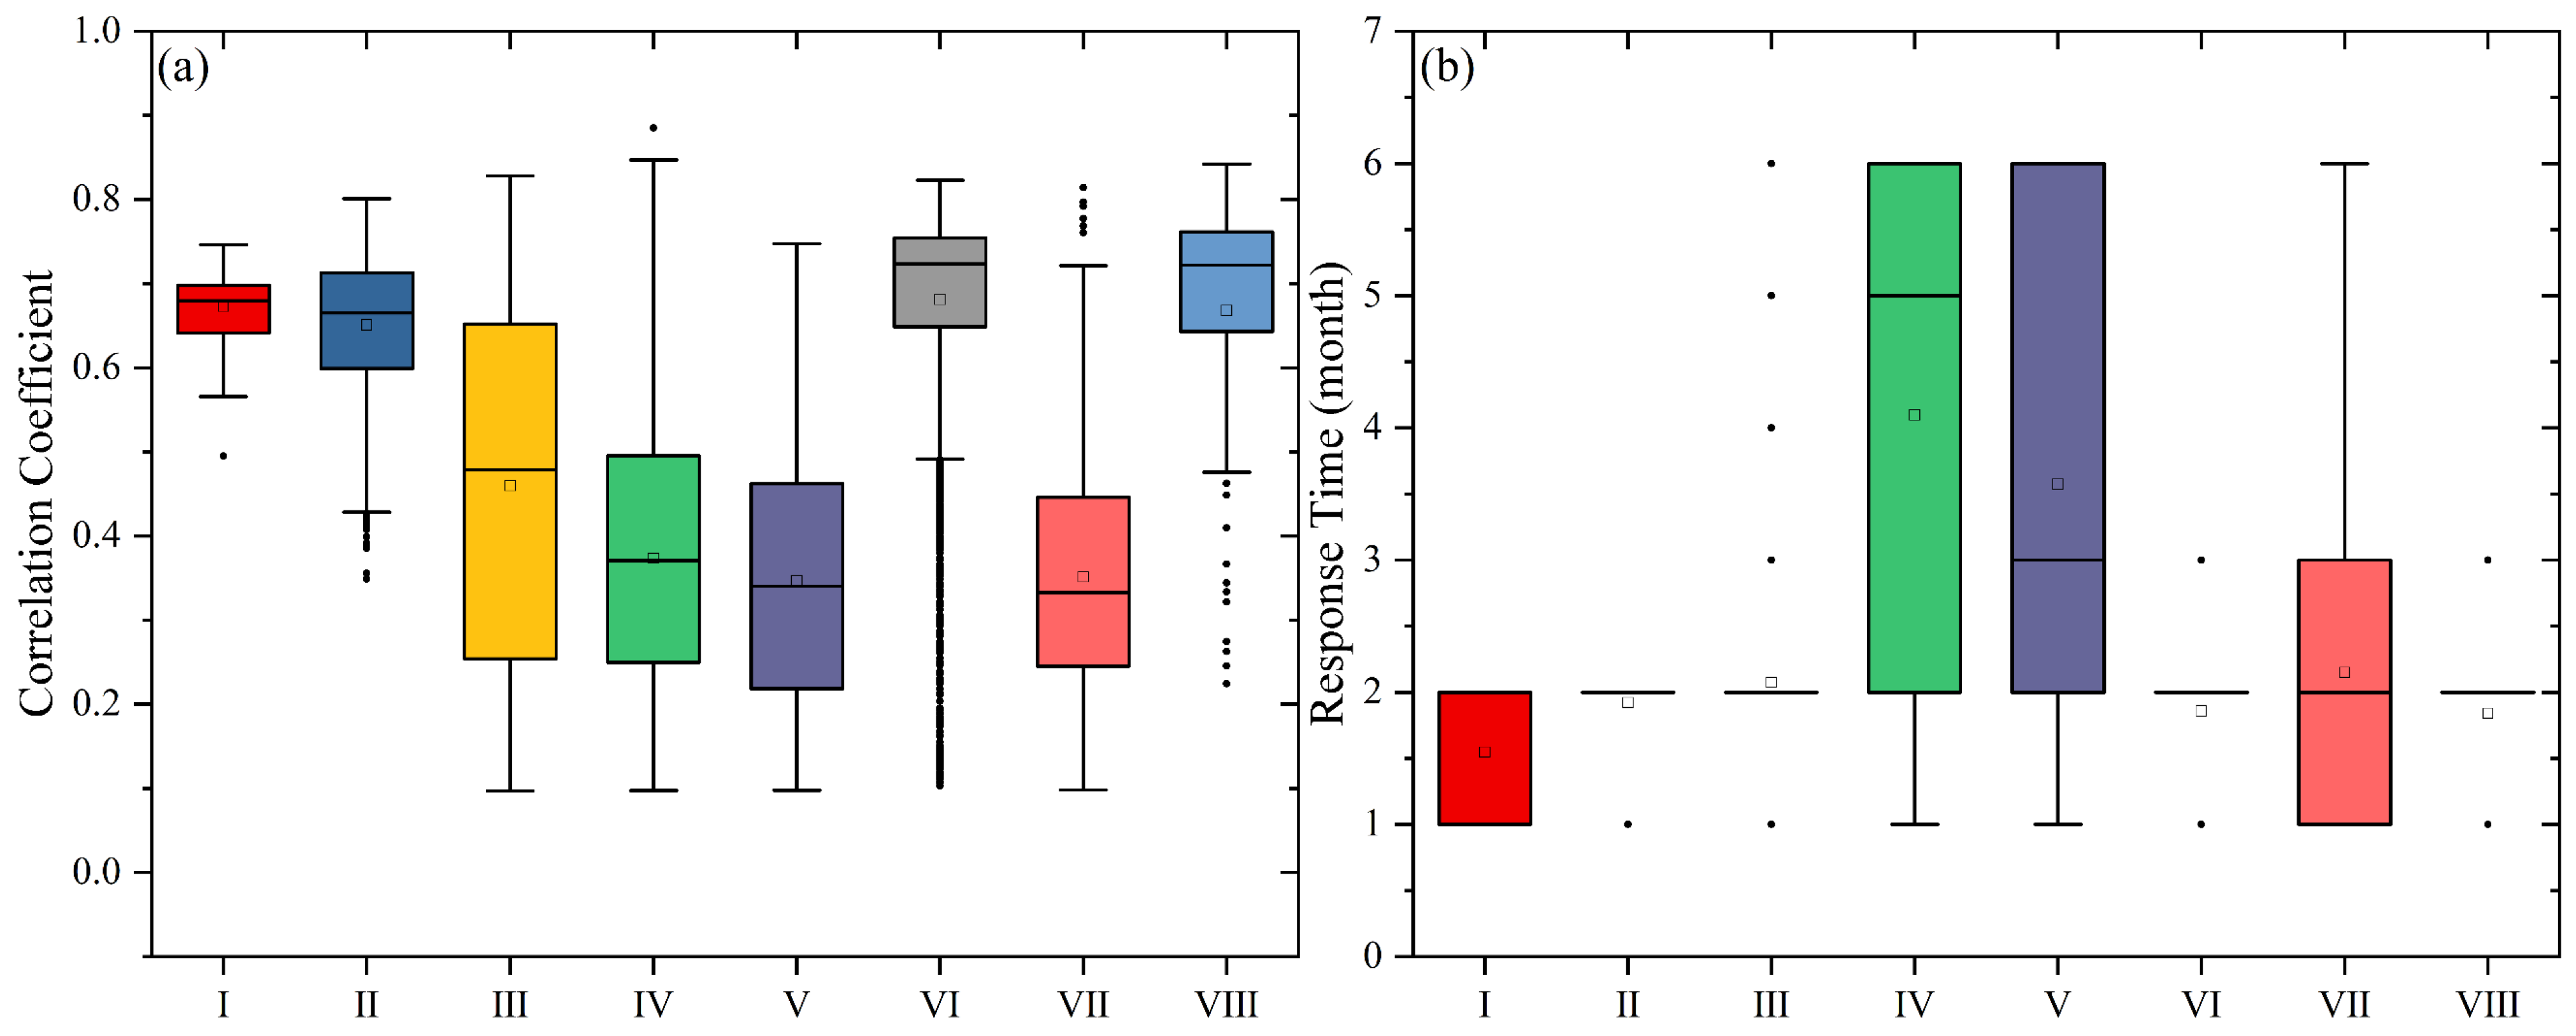
3.1. The Cropland Vegetation Response to Climatic Factors

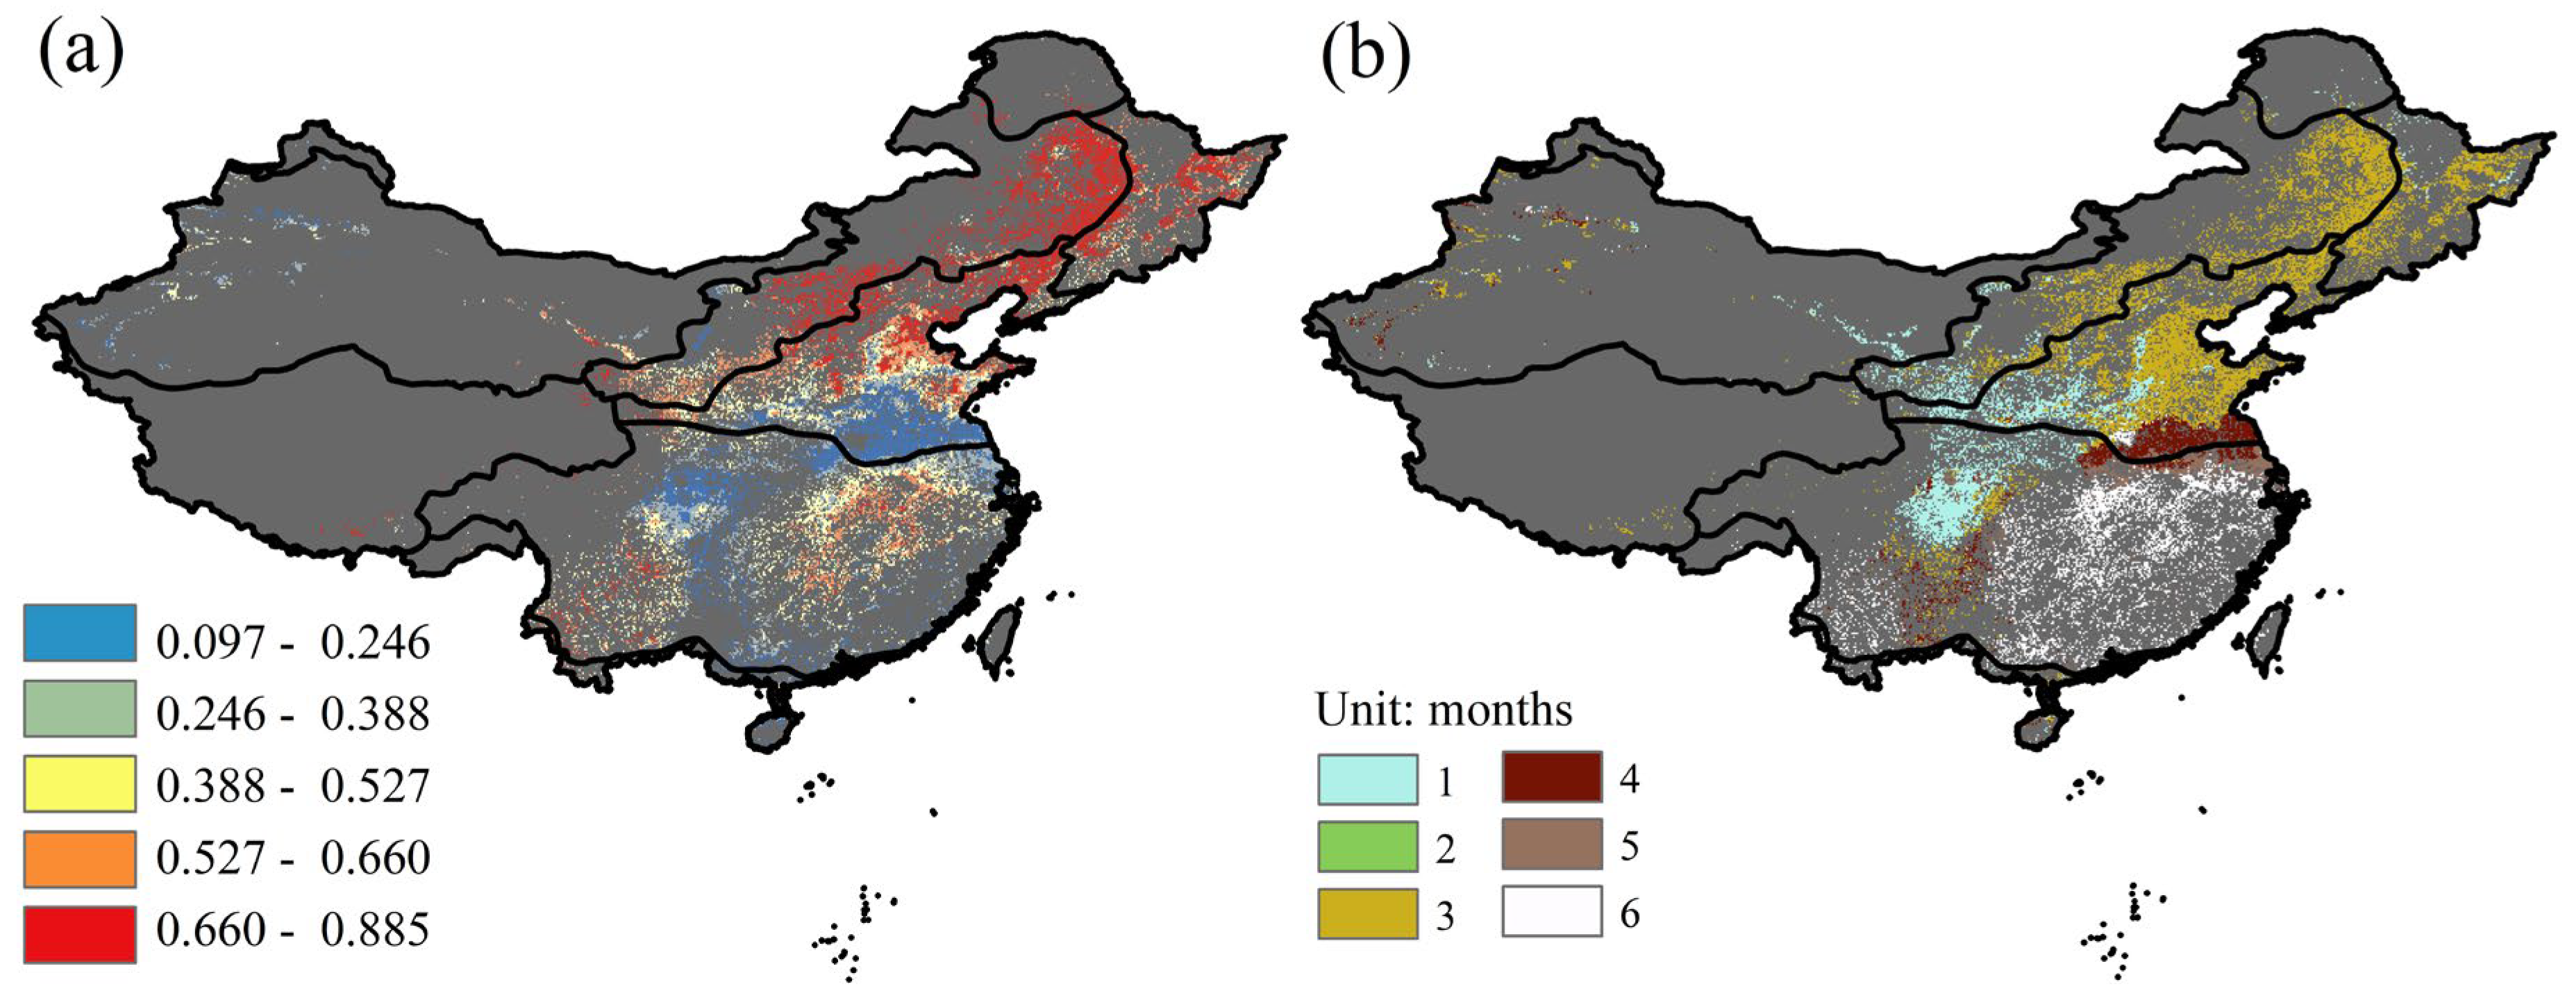
3.1.1. Response of Cropland Vegetation to Precipitation

We assessed the correlation coefficients between the cropland NDVI and precipitation to discover the characteristics of the response of cropland vegetation to precipitation (Figure 2a). We also performed a partial correlation analysis of the NDVI and precipitation in different climatic sub-regions, with response times ranging from 1 to 6 months (Figure 2b). Precipitation was shown to have a beneficial impact on cropland vegetation in China, with the largest positive impact recorded in sub-regions I, II, VI, and VIII, with a high positive impact in sub-regions III, and a low positive impact in sub-regions IV, V, and VII (see Figure 2a). Figure 2b shows that the majority of locations had reaction times of less than 3 months (64.8% of grid cells), although other places had response times of 4 to 5 months (18.6% of grid cells). Only a few areas (16.6% of grid cells) showed a time lag of more than 5 months, and these were mainly in sub-regions IV and V (Figure 2b).
Figure 3a demonstrates that the correlation coefficient between cropland vegetation and precipitation (usually >0.6) was highest in sub-regions I, II, VI, and VIII, and that these four sub-regions (Figure 3b) had similar response times (generally 1–2 months). Although sub-regions II and III (Figure 3b) had similar response times (usually 2 months), the correlation coefficient in sub-region III (typically 0.2–0.6) was lower than the correlation coefficient in sub-region II (typically 0.6–0.7) (Figure 3a). Sub-region VII had the lowest correlation coefficient (usually 0.2–0.4), with some grid locations (32.4%) having a response time of more than 2 months. The spatial distribution pattern shows that the climate sub-regions in eastern China (sub-regions IV and V) had a longer response time of 2–6 months (Figure 3b), with correlation coefficients only slightly higher than sub-region VII.

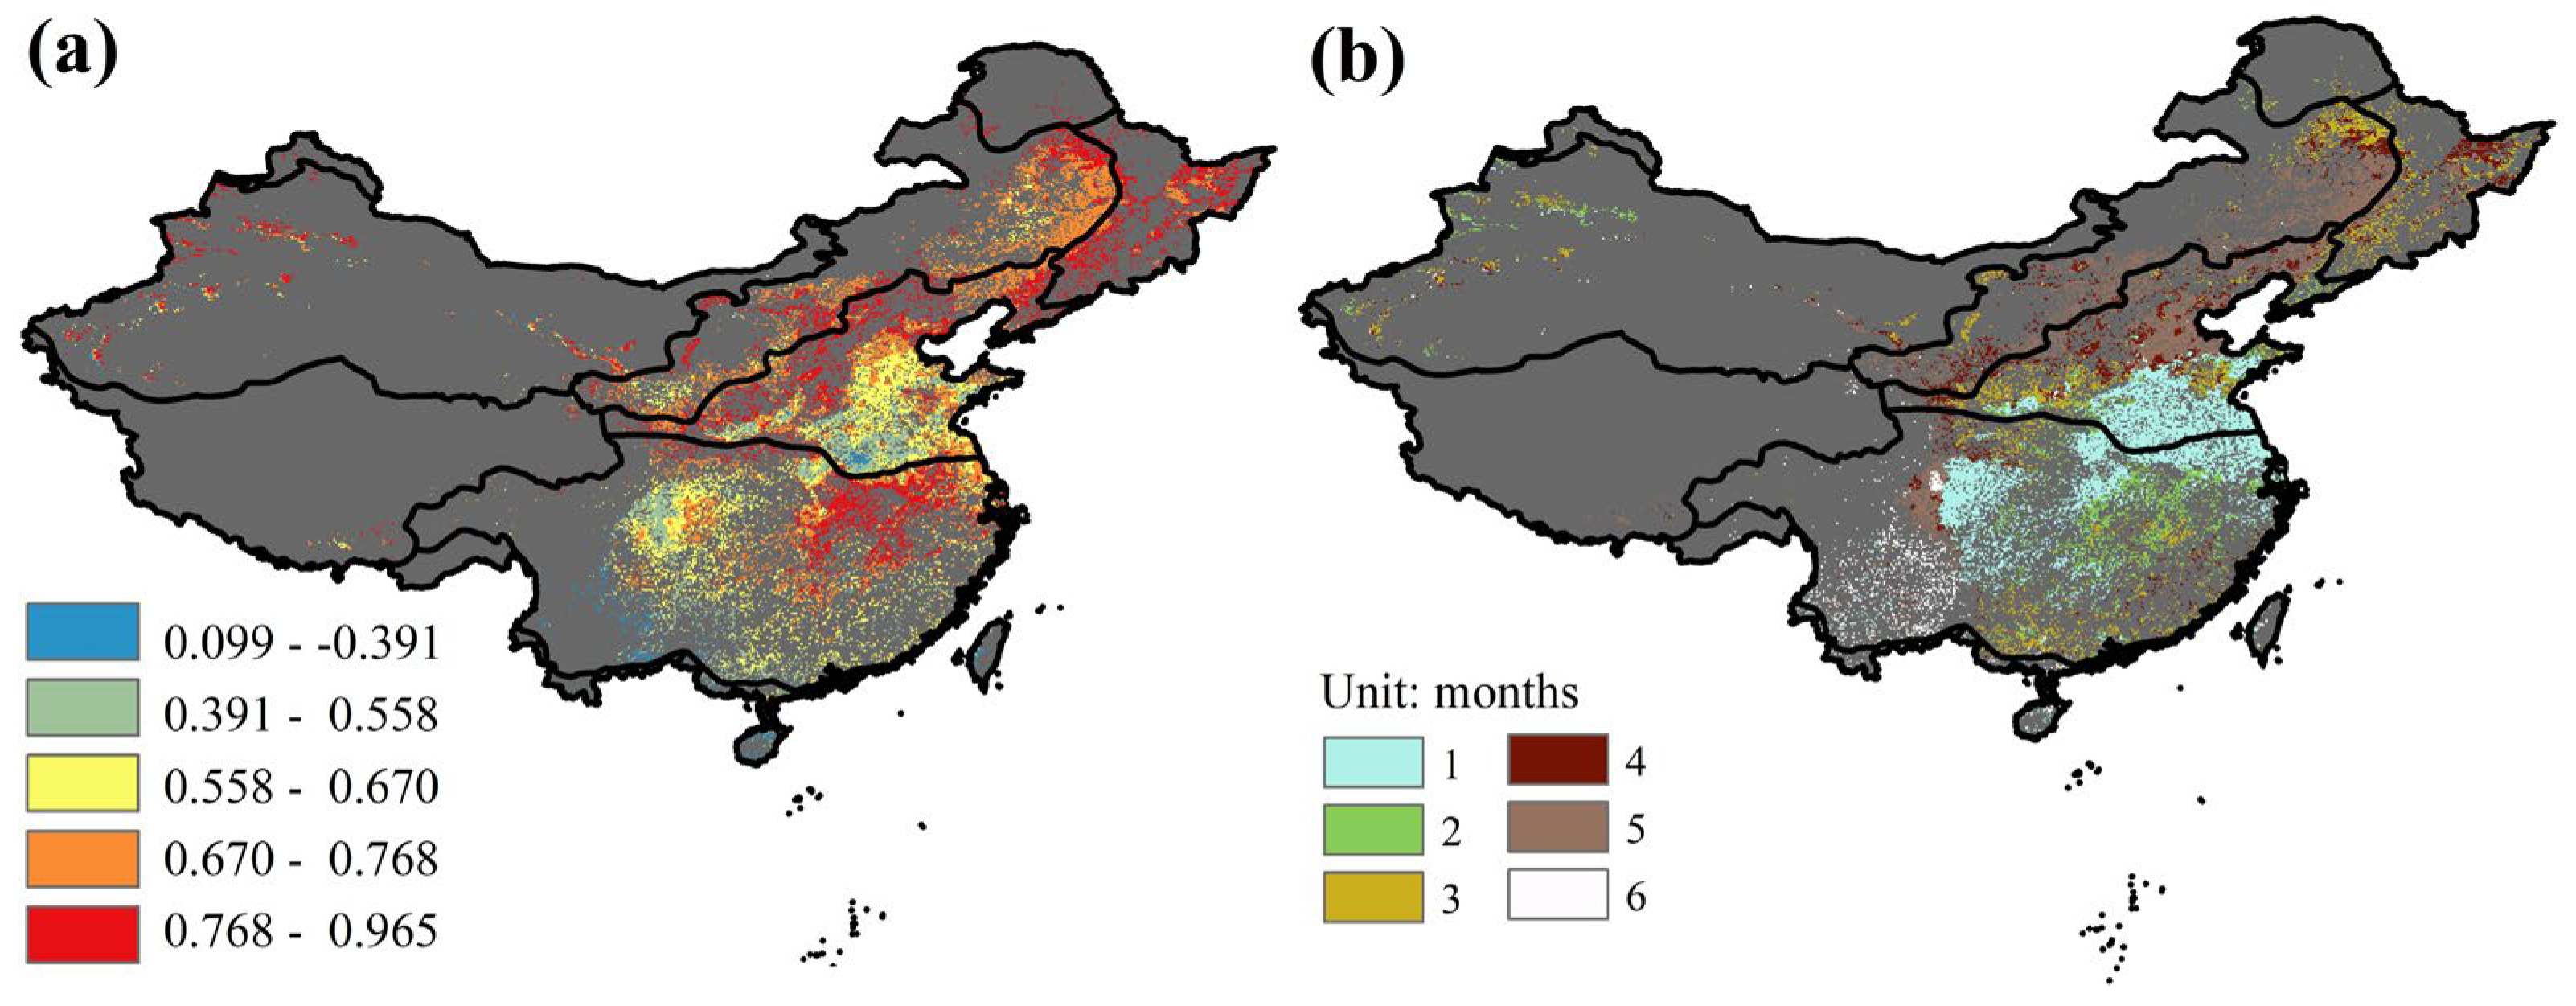
3.1.2. Response of Cropland Vegetation to PET

As compared to precipitation, the positive impact of PET on cropland vegetation was significantly stronger (Figure 4a), which seems to be latitude-dependent. The highest positive impact of PET was observed in sub-regions I, II, VI, and VII in northern China, which was significantly stronger than sub-regions III, IV, and V in southern China, with sub-region V in southern China exhibiting the lowest correlation coefficient. However, sub-region VIII is located in southern China, and it also shows a strong positive PET impact, suggesting a complex response relationship between PET and vegetation in China. The response time of cropland vegetation to PET was significantly longer than precipitation, which also showed different characteristics in different climatic zones (Figure 4b). Unlike the correlation coefficient, the response time was not observed to be particularly linked to latitude; most areas had a response time longer than 3 months in the climatic zones, which are located in northern China (sub-regions I, II, and VI) and also in southern climatic zones (sub-regions III, IV, V, and VIII) (Figure 4b).
The correlation coefficient of cropland vegetation and PET was greater than 0.6 for most of the sub-regions, particularly sub-regions I and II (typically >0.8) (Figure 5a). The correlation coefficient of cropland vegetation and PET was the lowest for sub-region V (typically 0.4~0.6), which is located further south in China. The response time of cropland vegetation and PET varies considerably between different climatic zones; sub-regions II, V, VI, and VIII had the longest response times (typically >3 months), and sub-region IV had the shortest response time (typically <3 months). In addition, the response time of sub-region VII (typically 2 to 4 months), sub-region III (typically 1 to 5 months), and sub-region V (typically 3 to 6 months) varied over a long range. Therefore, it can be concluded that there was no clear link recorded between response time and correlation coefficient.

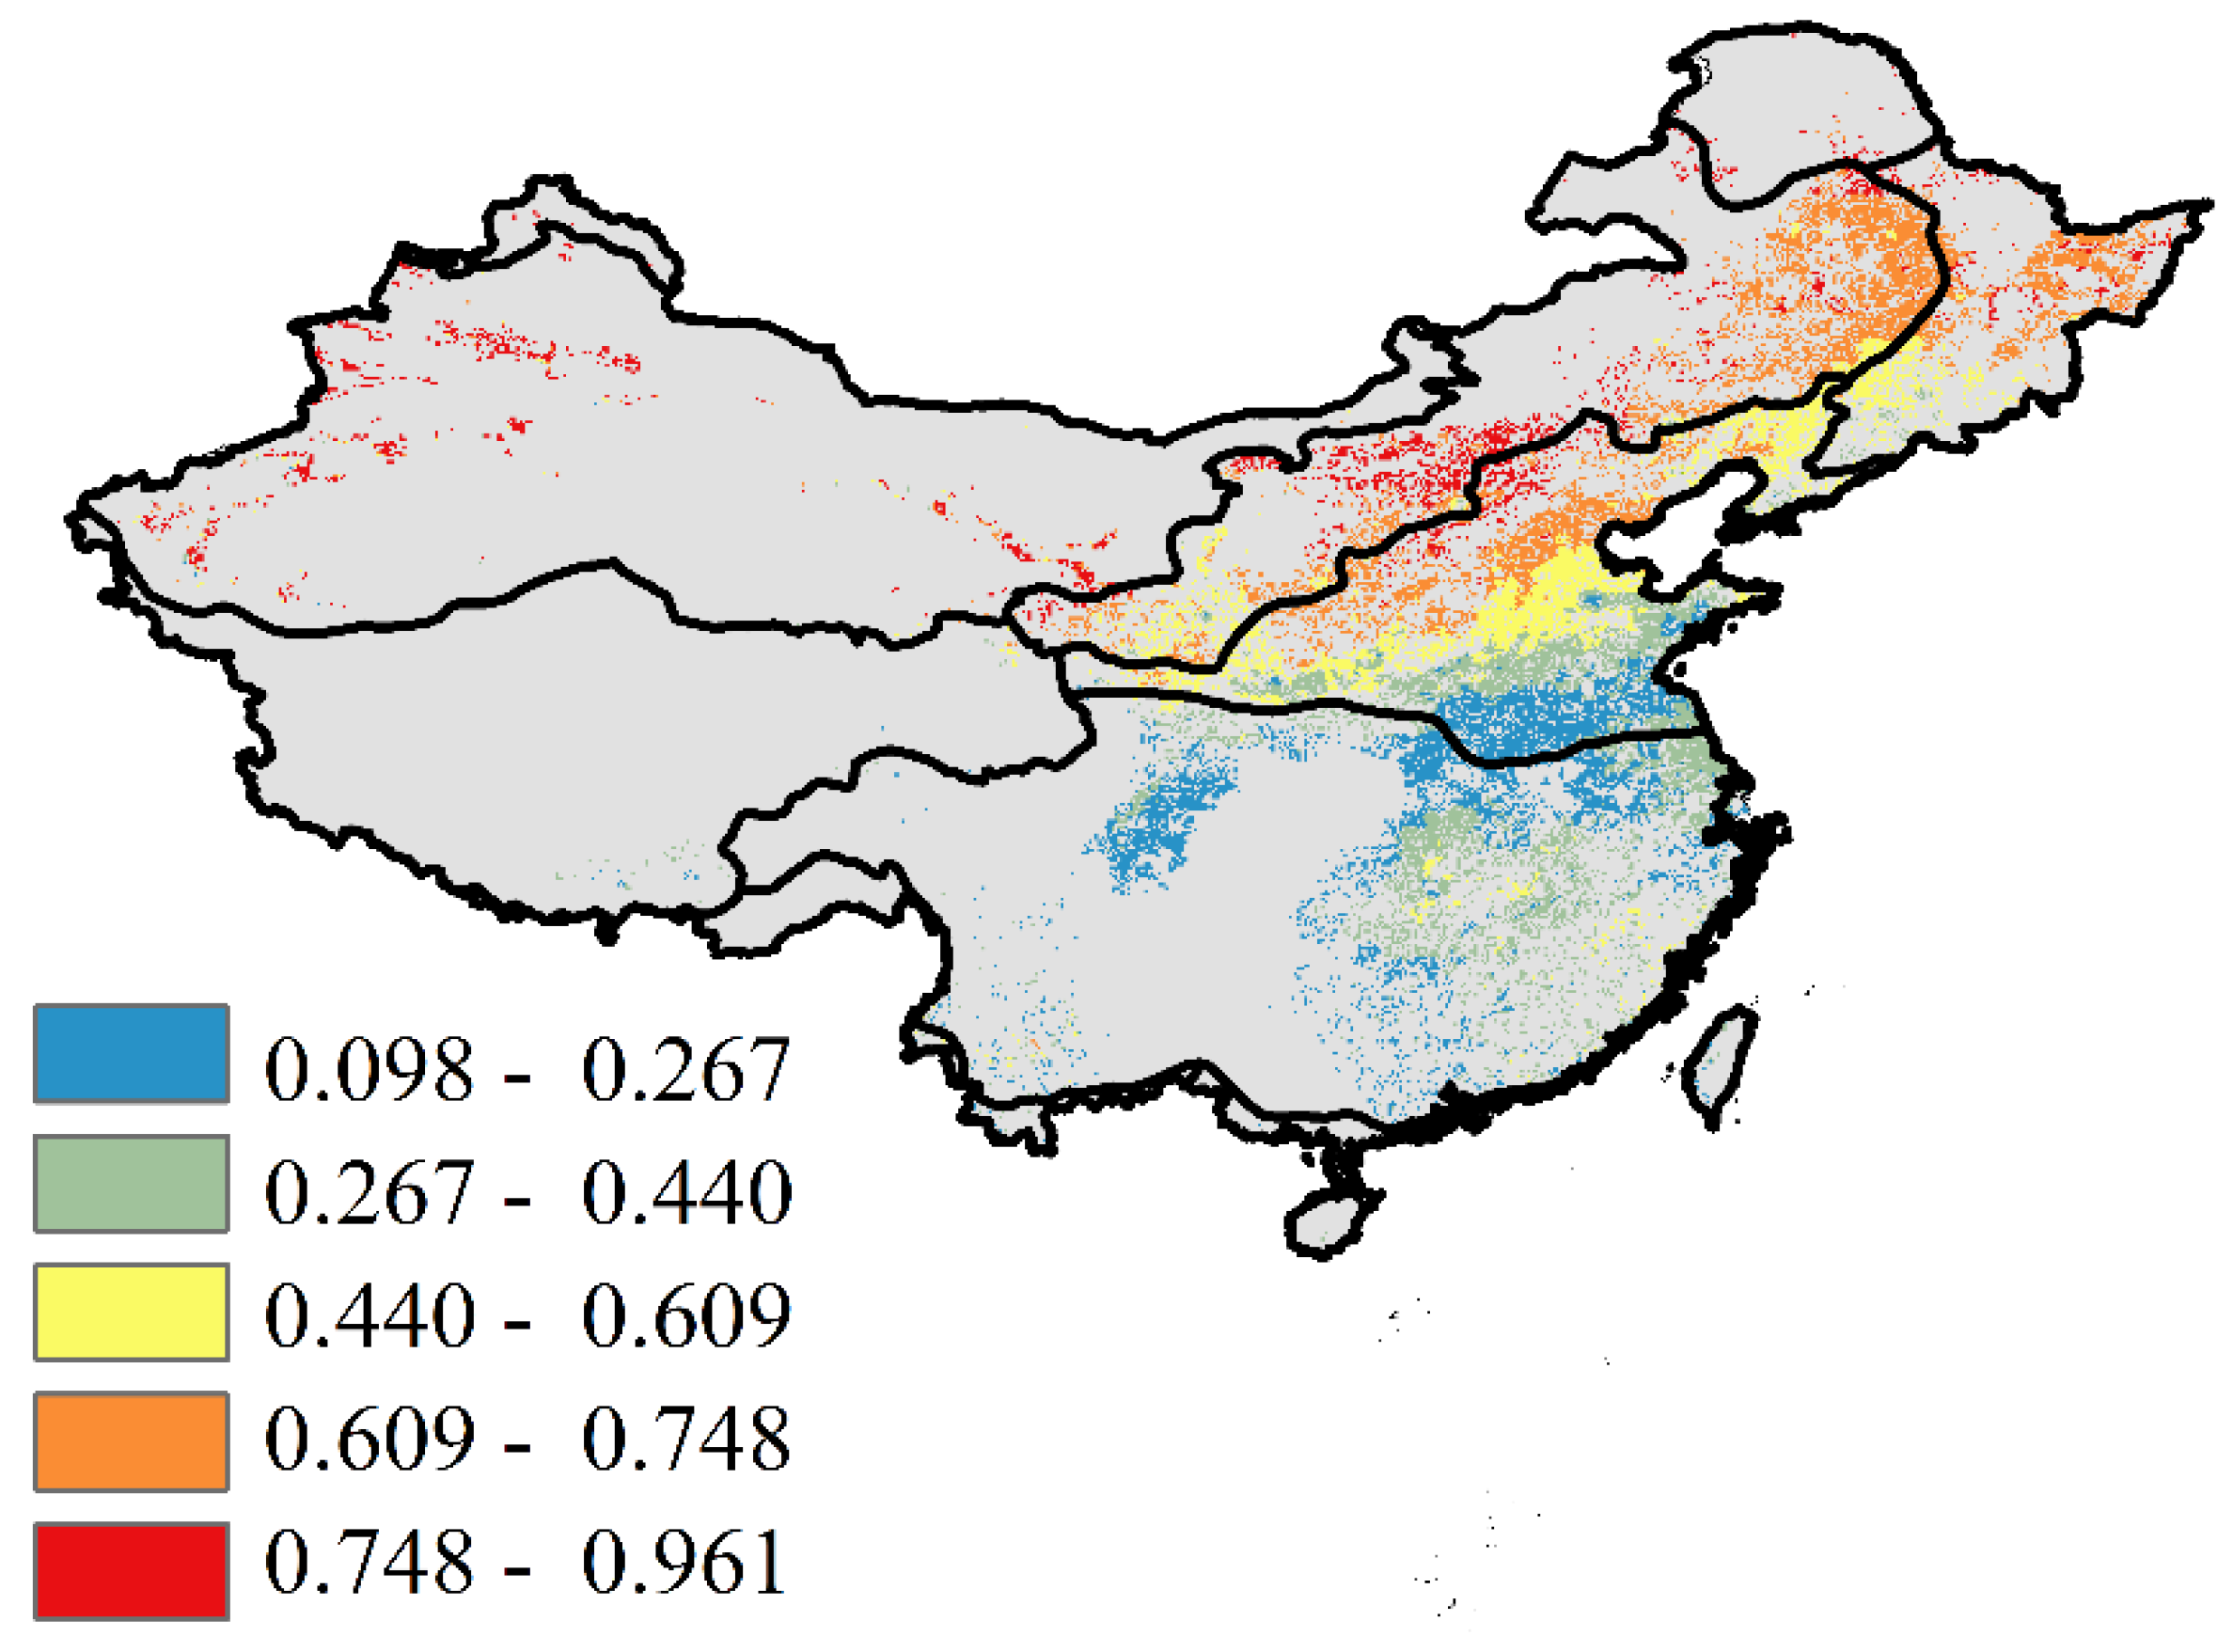
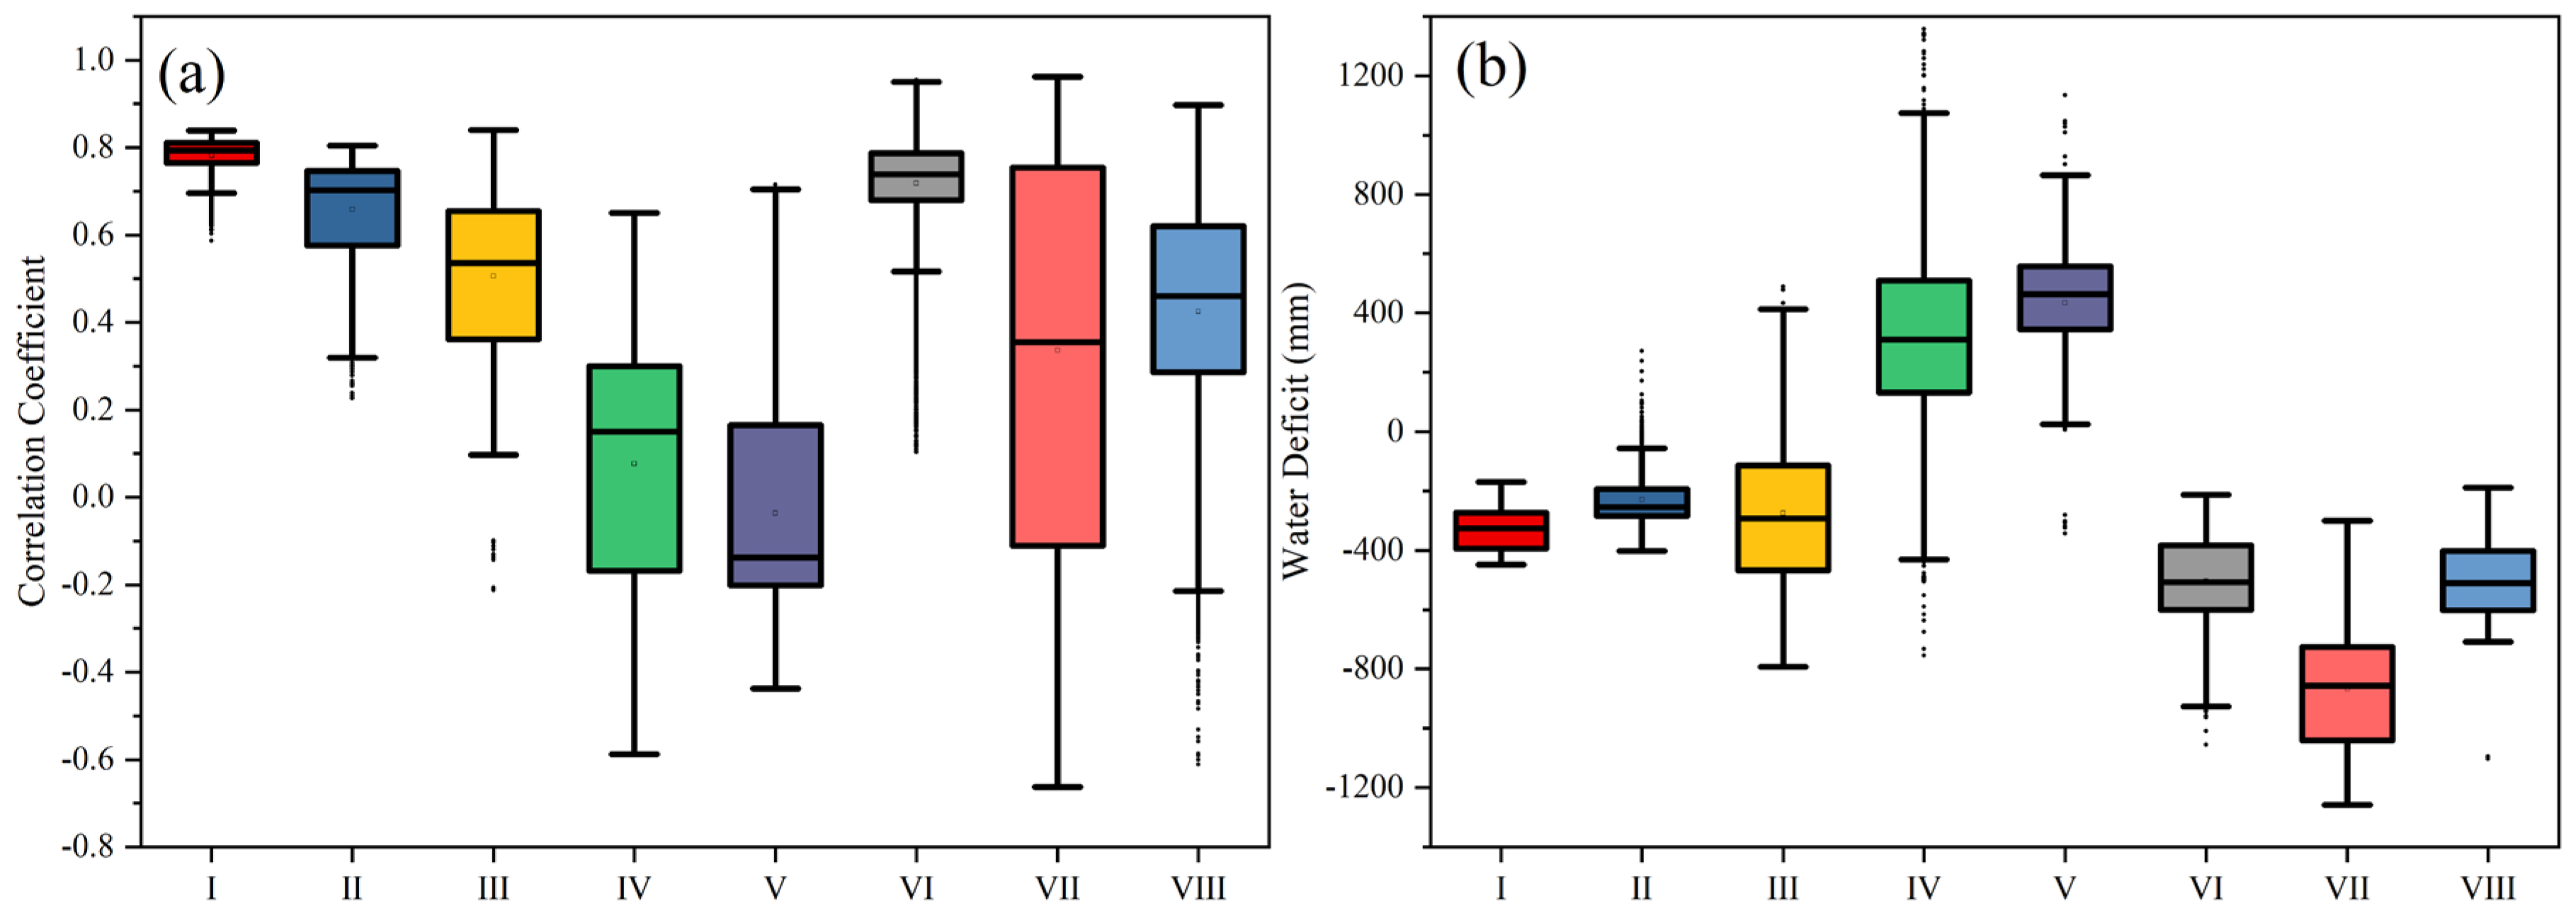
3.1.3. Response of Cropland Vegetation to Water Deficits

To identify cropland vegetation response to water deficits, we calculated the correlation coefficients between the cropland NDVI and water deficits for each grid cell, which was expressed as precipitation minus PET. Figure 6 shows that water deficits had a positive impact on cropland vegetation in China; sub-regions I, II, VI, and VII had the highest positive impact, and the cropland vegetation in sub-regions I, II, and VI also responded strongly to precipitation and PET. In terms of water deficits, precipitation, and PET, the impact and response times were the lowest in sub-regions IV and V. In addition, higher correlation coefficients were generally found in the north of China (sub-regions I, II, VI, and VII), while lower correlation coefficients were observed in the south of China (sub-regions IV and V).
Figure 7a shows that the highest correlation coefficient of cropland vegetation to water deficits (typically >0.6) was recorded in sub-regions I, II, VI, and VII (Figure 5b), which displayed larger water deficits (typically >200 mm). The most water-deficient area, sub-region VII (typically >800 mm), displayed a correlation coefficient greater than 0.8. Sub-regions III and VIII (Figure 5b) had a similar correlation coefficient (typically 0.4–0.6); however, sub-region VIII (typically >400 mm) displayed larger areas with water deficits compared to sub-region III (typically >0~400 mm). Sub-regions IV and V were the areas with the most severe water scarcity (typically <−200 mm), and had the lowest correlation coefficients. In general, the correlation coefficients between water deficits and cropland vegetation were closely related to the degree of water shortage.

3.2. Response of Crop Yield to Irrigation Rate

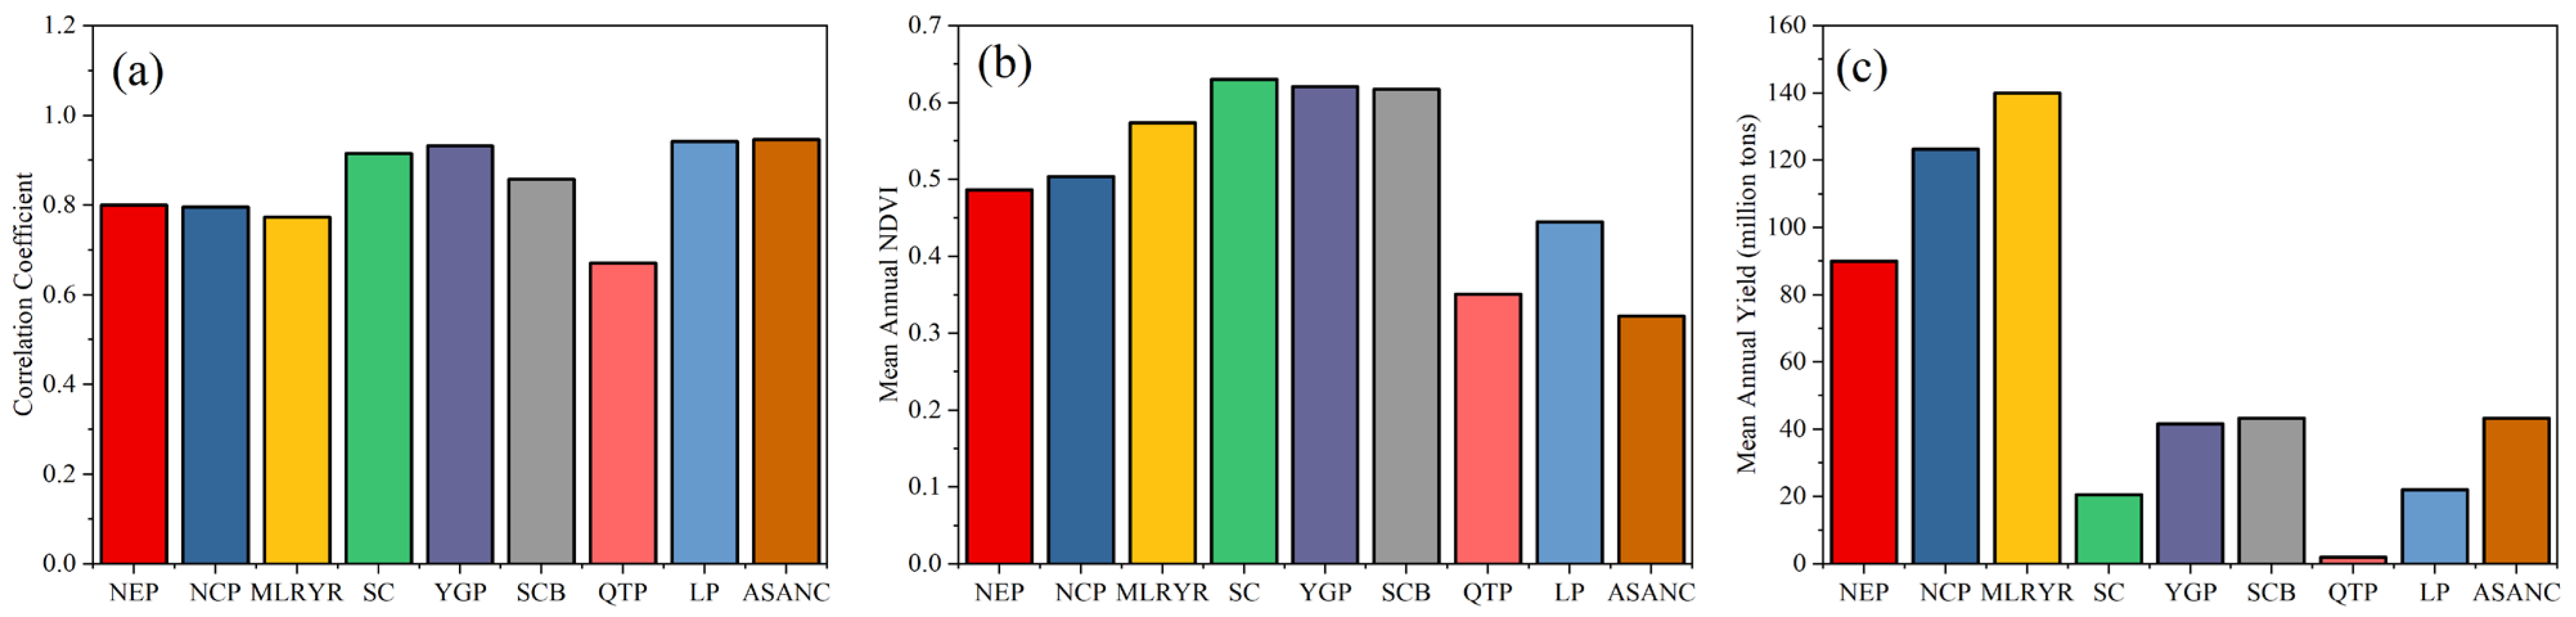
3.2.1. Relationship between Cropland NDVI and Crop Yields

The goal of our study was to understand the correlation between the NDVI and crop yield in each crop-producing area. The average NDVI values during the growing season (March–October) and the multi-year average crop yields were obtained. Figure 8a shows the correlation coefficients between crop yields and the NDVI of cropland vegetation, which was greater than 0.6 in all crop-producing areas. The SC, YGP, LP, SCB, and ASANC crop-producing areas showed the highest correlation coefficients (typically >0.9), followed by the NEP, NCP, and MLRYR areas (approximately 0.8), and the QTP area, which showed a relatively weak correlation (typically <0.7). The multi-year average NDVI values for the growing season have been shown in Figure 8b. The crop-producing areas in the MLRYR, SC, YGP, and SCB regions showed the highest NDVI values (typically >0.55), followed by the areas in the NEP and NCP regions (approximately 0.5) and the QTP, LP, and ASANC regions (typically <0.5). The multi-year average crop yields in the NEP, NCP, and MLRYR regions were the highest (typically >90 million tons), followed by the SC, YGP, SCB, LP, and ASANC regions (typically >20 million tons), and the QTP region (1.94 million tons) (Figure 8c).

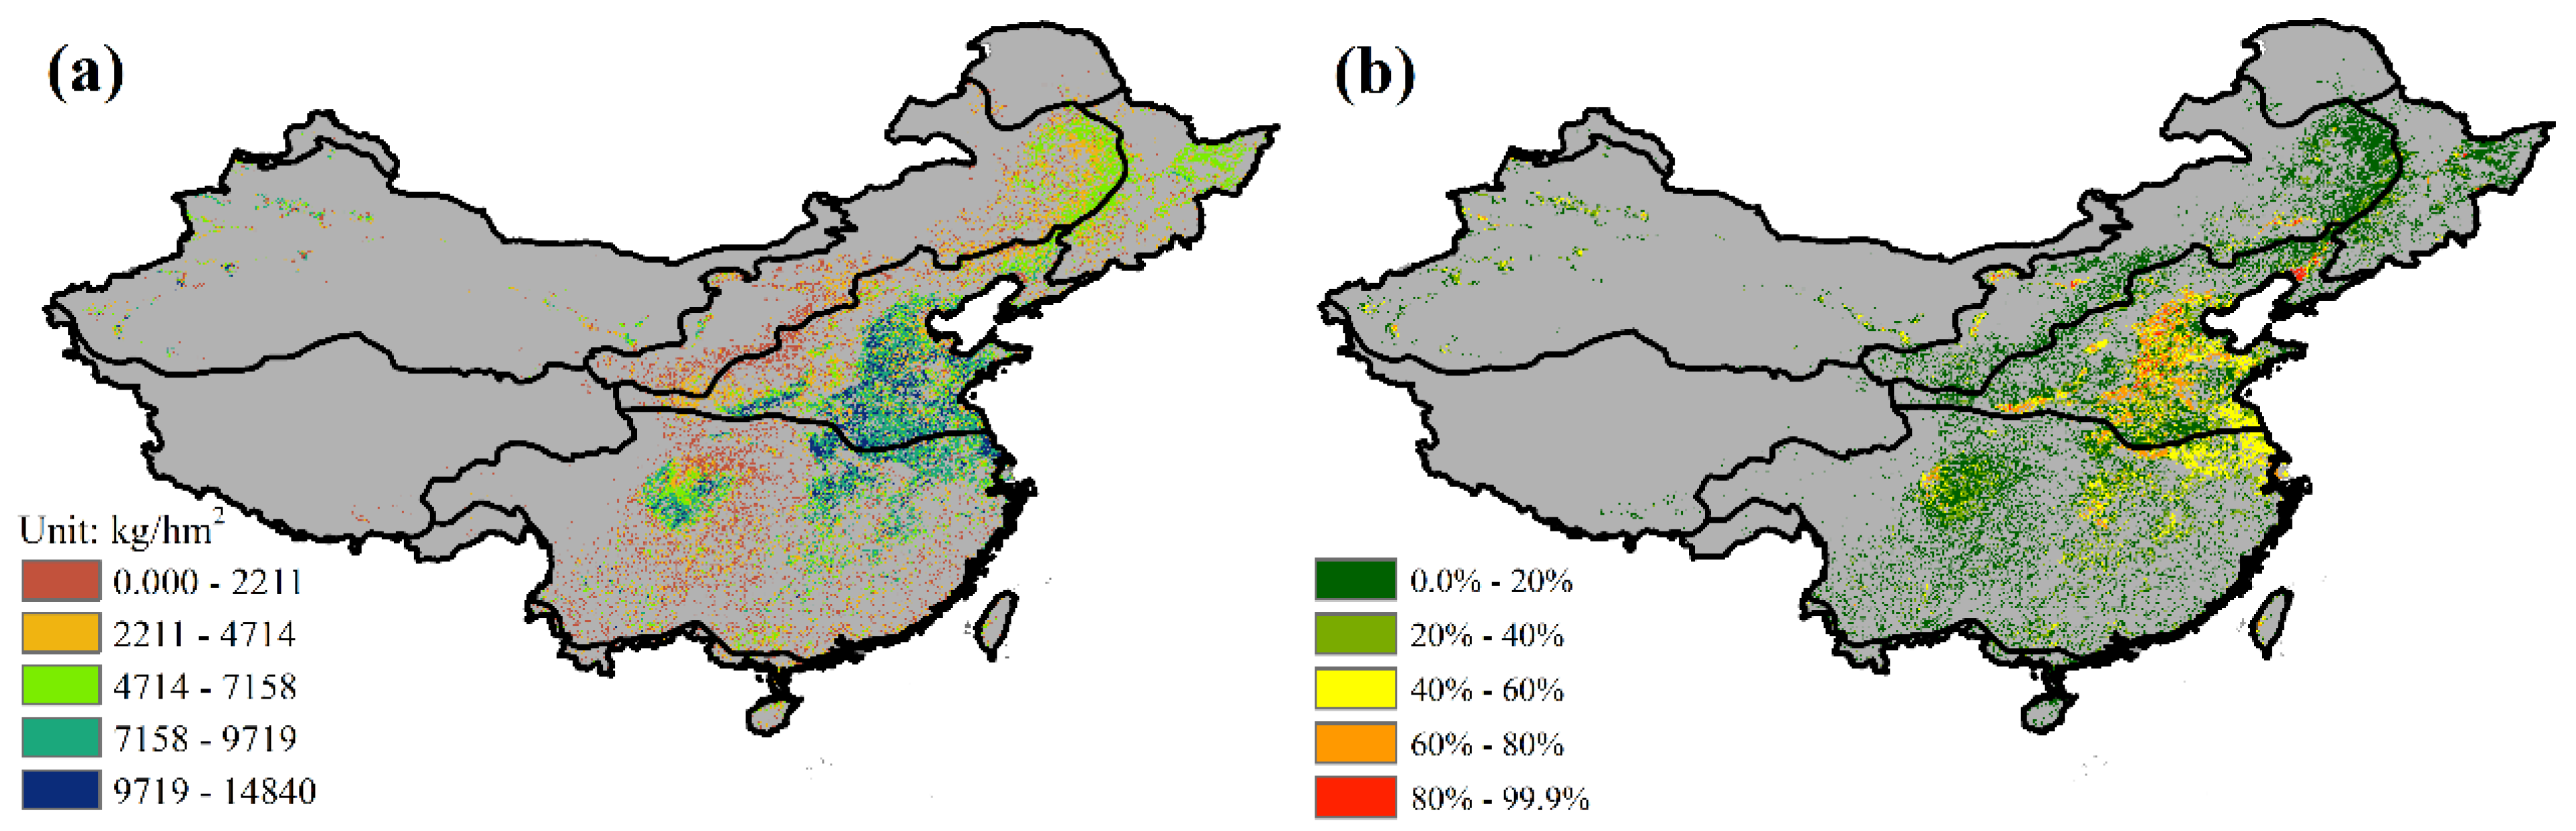
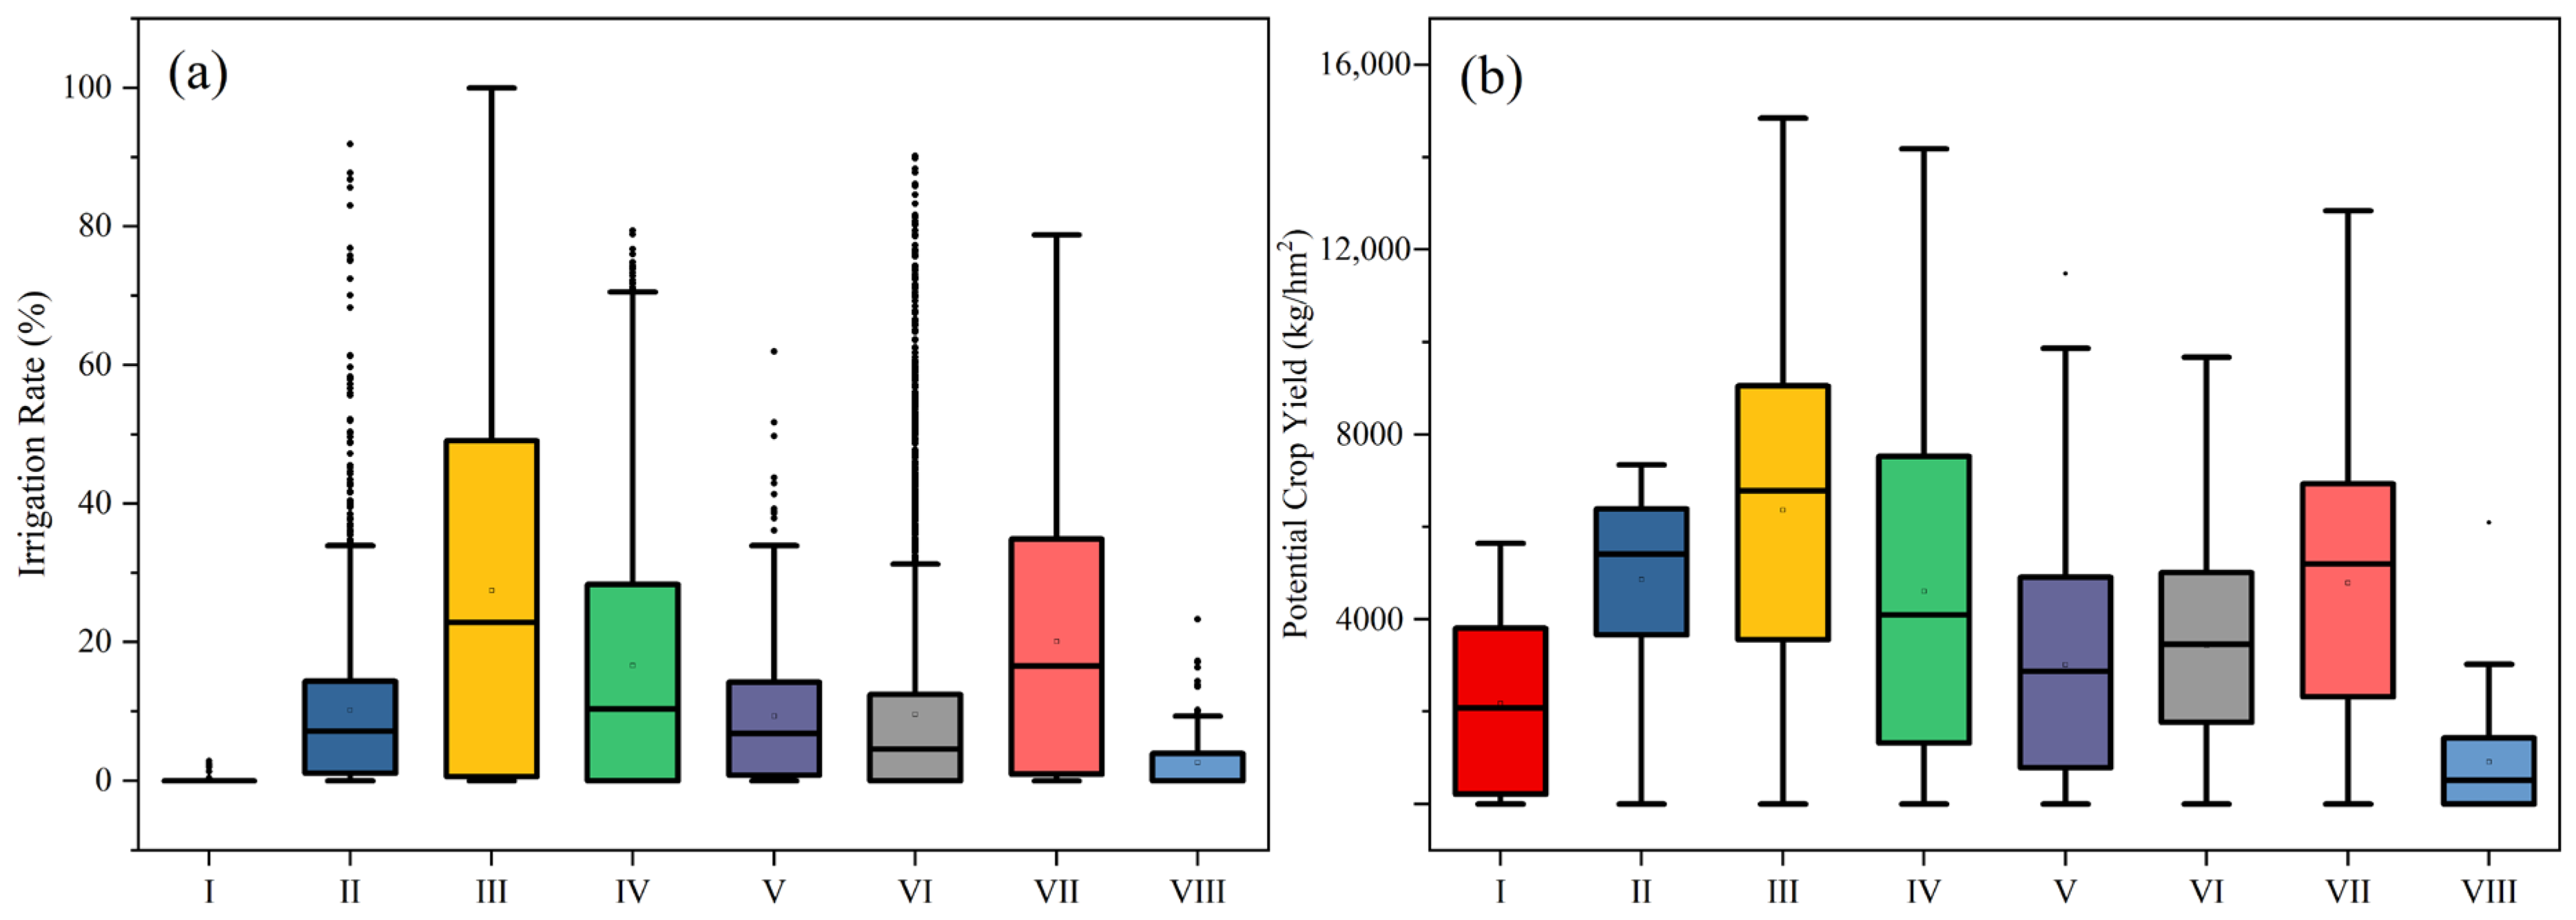
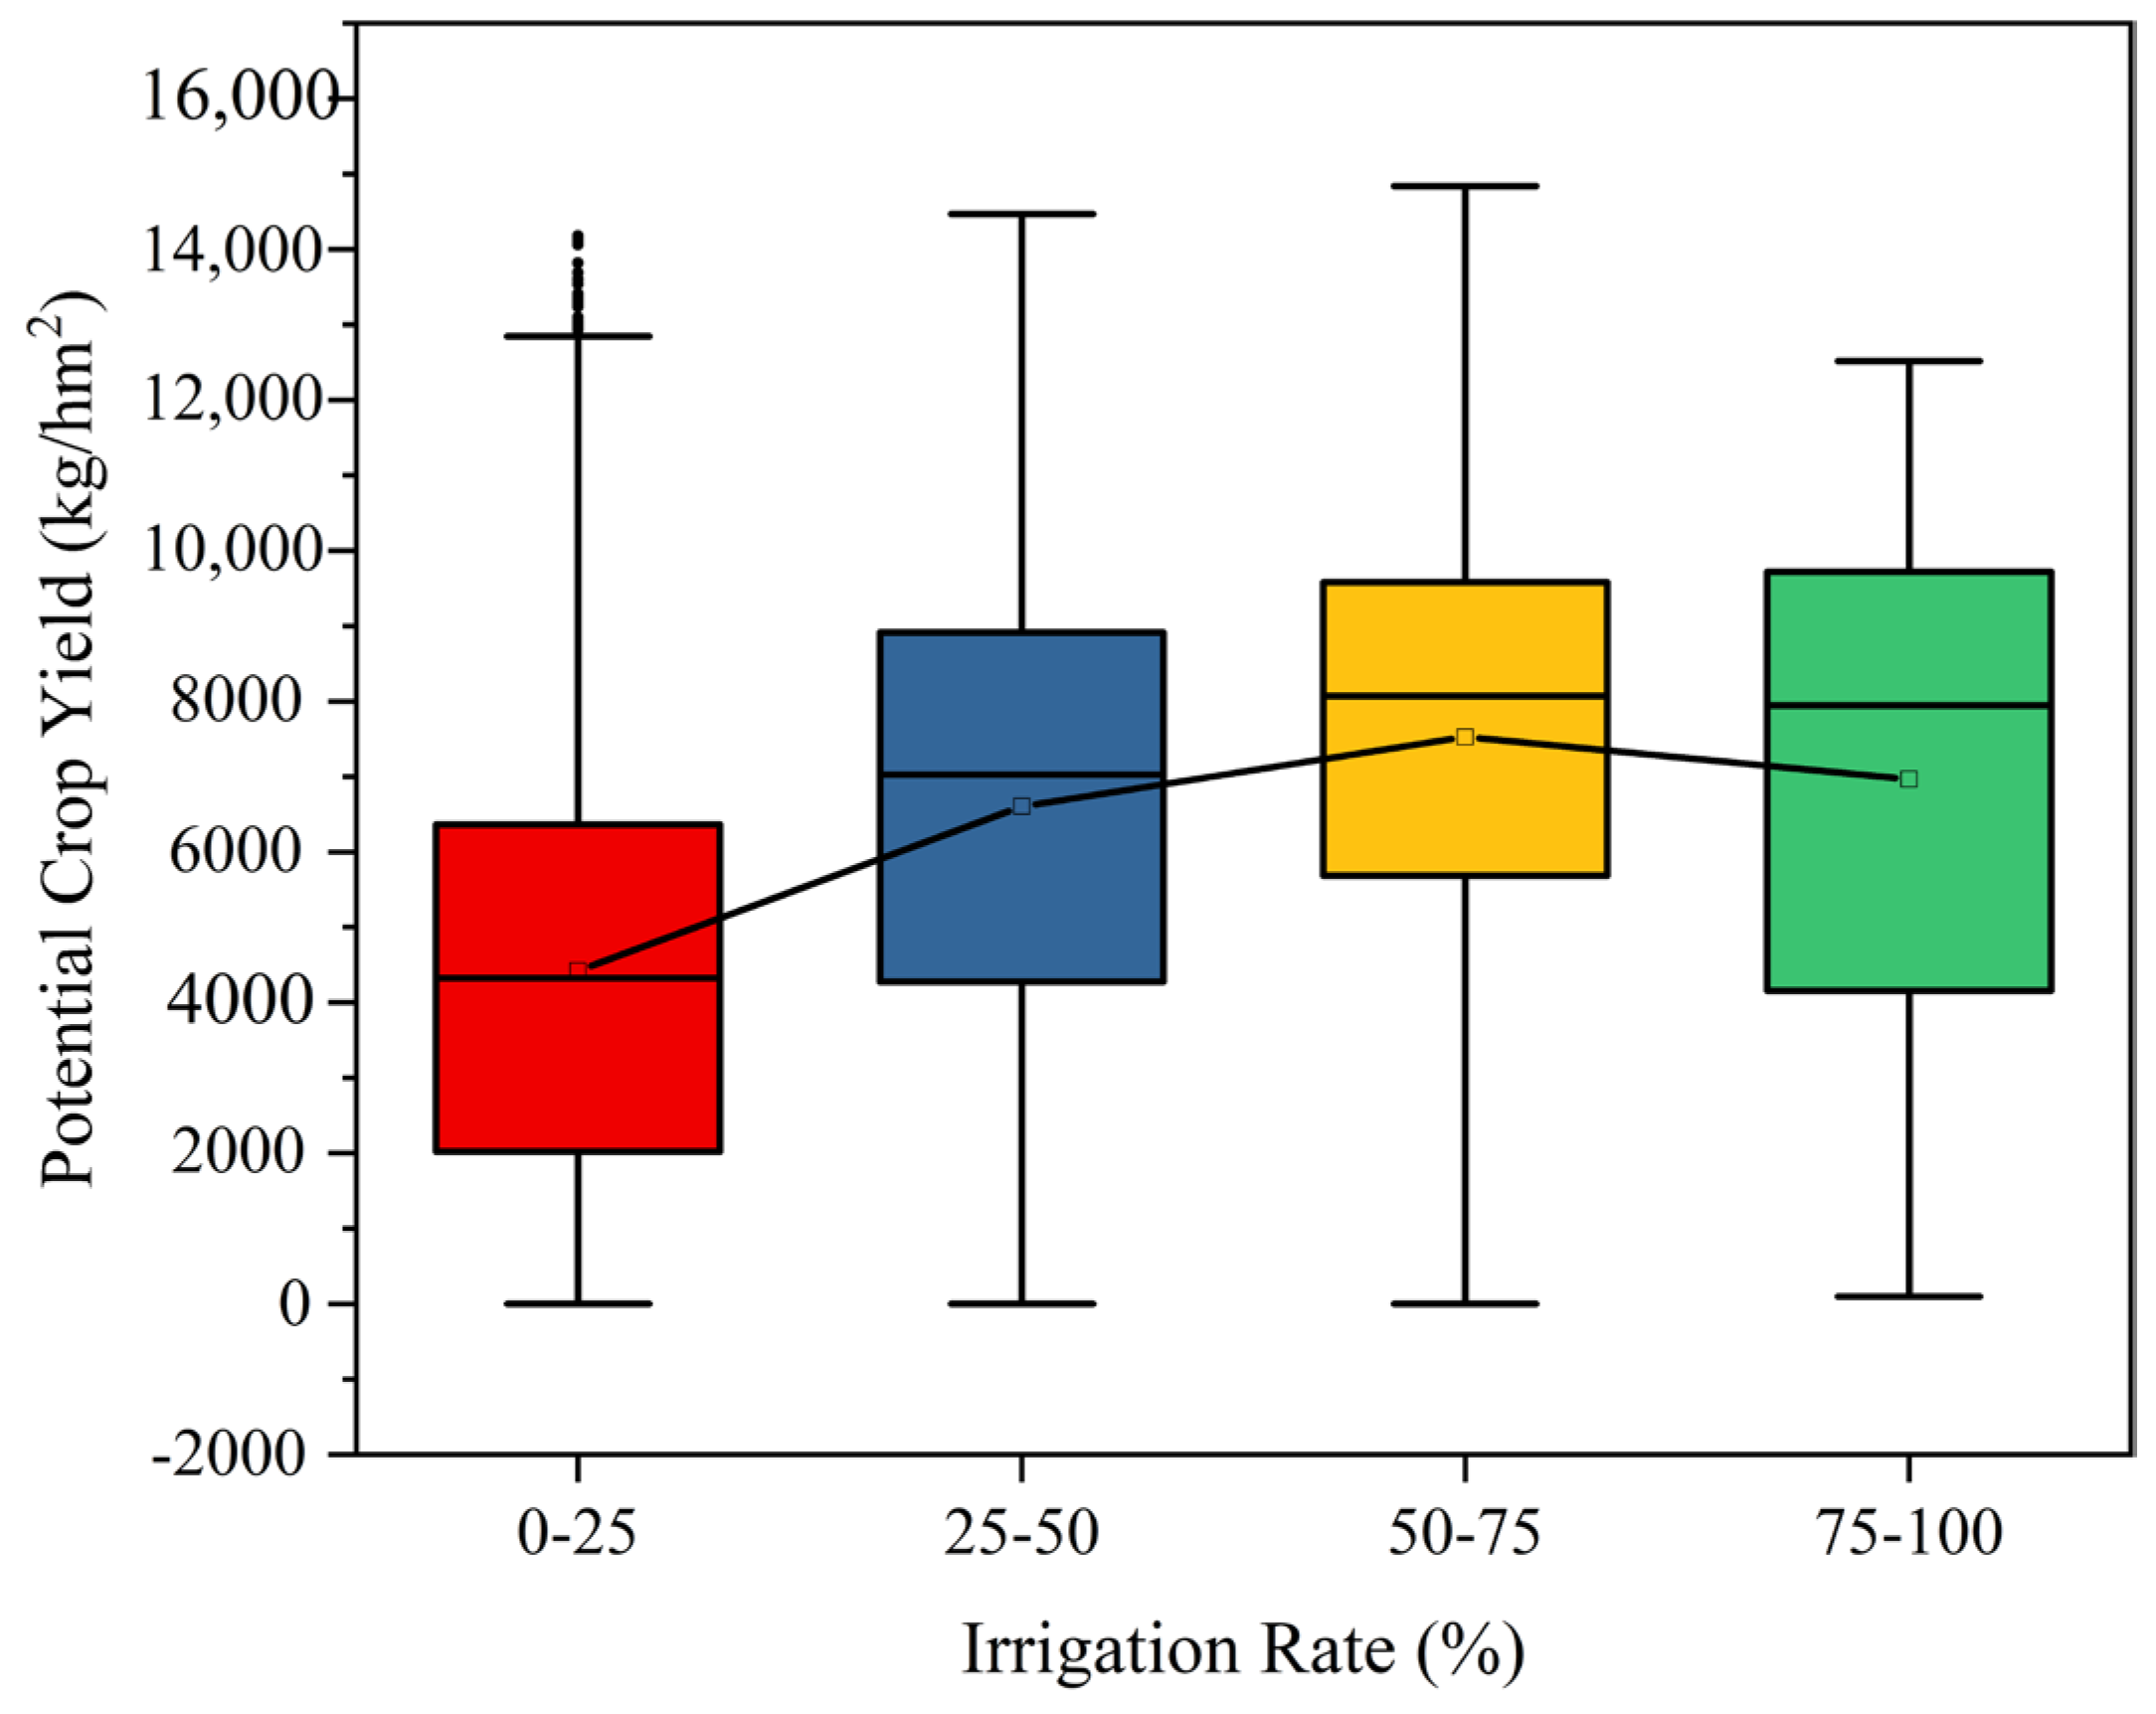
3.2.2. The Effect of Different Irrigation Rate on Potential Crop Yields

The potential grain yield and irrigation rate for each grid cell in China are shown in Figure 9. The irrigation rate is represented by the percentage of total irrigated land on each grid cell. Figure 9a shows that the potential grain yield per hectare was the highest in sub-regions III and IV, and these areas had the highest irrigation rates (Figure 9b); China’s plains (paddy, sorghum, maize, etc.) are located in these two sub-regions. Sub-region I is one of the coldest areas of China and mainly produces one crop a year [59], sub-region VIII includes the Qinghai–Tibet Plateau, where crop growth is very difficult [60], these two sub-regions (I and VIII) have the lowest potential for grain production in China. It can be seen in Figure 9b that most areas had an irrigation rate lower than 40% (81.9% of grid cells), but some displayed a higher degree, 40%~80% (17.4% of grid cells). Only a few areas (0.7% of grid cells) had an irrigation rate higher than 80%, which were mainly distributed in sub-region III (Figure 9b).
We further assessed the response of the irrigation rates to potential crop yields in different climatic zones, as shown in Figure 10. Irrigation rates are low in China, with sub-regions III and VII (15–20%) having slightly higher values than sub-regions II, IV, V, and VI (5–10%) in relative terms. The irrigation rates of sub-regions I and VIII were close to zero. A strong correlation was observed between potential grain yields per hectare and irrigation rates, with sub-regions II, III, and VII showing higher average potential grain yields per hectare than sub-regions IV, V, and VI. Sub-regions I and VIII displayed significantly lower correlations compared to the remaining divisions (Figure 10b).
We also analyzed the correlations between the average potential grain yields per hectare and irrigation rates (Figure 11). The irrigation rate increased from 0–25% to 50–75%, with the average increase in potential crop yield growing from 4000 kg/hm2 to 8000 kg/hm2. It is worth noting that the rate of this increase becomes progressively smaller. The average potential grain yield per hectare did not show a significant increase when the irrigation rate was increased from 50~75% to 75~100%.

4. Discussion

4.1. Discrepancy Response of Cropland Vegetation to Legacy Effects

As shown in this study, there is a positive correlation between precipitation and the cropland NDVI, although it is not equally distributed in space [61,62]. The cropland NDVI responded more strongly to precipitation in sub-regions I, II, VI, and VIII than in sub-regions IV, V, and VII (Figure 3a). Table 1 shows that sub-regions VI and VIII are relatively dry, with multi-year average PET far exceeding multi-year average cumulative precipitation. In addition, the temperature in sub-regions VI and VIII, which are dry and cold areas, respectively, is low [63,64]. In general, the NDVI values of croplands were observed to be more sensitive to precipitation in cold and dry areas, which has also been illustrated by Bao et al. (2021) [65]. Sub-regions I and II are located in NECP, where rain-fed irrigation is widely practiced and precipitation is the main source of the soil moisture utilized by crops [59]. Although the temperature in the NECP region is low, rain-fed crops have been reported to be more sensitive to precipitation, which is a major factor, in addition to temperature, affecting crop yields [66]. Sub-regions IV and V, which have high temperatures and enough precipitation, had the smallest association between precipitation and vegetation [67].
The correlation between the cropland NDVI and PET was substantially greater than the correlation between precipitation and the NDVI (Figure 5a). It has been reported that many factors affect PET, such as wind speed, vapor pressure deficits, temperature, and precipitation [68,69,70]. According to Table 1, the driest climate zones in China are located in subzones VI, VII, and VIII. The arid climate zones have a large water vapor pressure difference, which produces a large PET. The maximum PET will reduce the soil water content, which in turn will cause water shortages and affect the growth of vegetation [71]. Tang and Tang (2021) found that wind speed has also been an important factor affecting PET [68], and sub-regions I and II experience the highest wind speeds in China [72], which may be an important factor of the PET sensitivity to change in the farmland vegetation in these regions. There may also be other factors contributing to the strong correlation between farmland vegetation and PET in these regions, but the current literature on this issue is insufficient, and further research is required. The water quantity in sub-region V is sufficient (Table 1) and the relative humidity of air is high, which does not create water deficit conditions; thus, the response of farmland vegetation to PET is not strong in this region.
Croplands in sub-regions I, II, and VI had a stronger reaction to precipitation than croplands in sub-regions III, IV, V, VII, and VIII (Figure 5a). A thorough examination of Figure 3a and Figure 5a reveals a strong correlation between cropland NDVI values and precipitation, which is similar to the correlation between the cropland NDVI and PET in sub-regions I and II, where water deficit conditions are determined by both precipitation and PET. Xu et al. (2018) discovered that trees have the highest drought resistance and can access water stored in deep soil layers in severe drought circumstances [73]. Herbaceous plant xylem systems are less drought-resistant due to their low capacity for water and carbon storage [74]. Therefore, the type and density of vegetation cover have a great influence on the ecological resistance of the region, which results in significant spatial variability in the response of cropland vegetation to climatic factors. As can be seen in Figure 12, sub-region VI has a larger proportion of grassland vegetation (Figure 12a) and a lower vegetation cover (Figure 12b), indicating that the ecological resistance of this region is poor and it is prone to respond strongly to water deficit conditions. The maximum precipitation in sub-regions IV and V (Table 1) was observed to also have the highest forest and vegetation cover, indicating that abundant precipitation and stronger ecological resistance may be the reason for the insensitivity of NDVI values of cropland to water deficit conditions in this region.

4.2. Adaptive Irrigation Practices for Different Grain-Producing Areas

This study shows that the spatial distribution of average multi-year potential yields is not uniform throughout all the regions (Figure 10). The average irrigation rates (Figure 10a) and corresponding average multi-year potential crop yields were observed to be highest in sub-regions III, IV, and VII. Figure 11 further shows that by increasing the irrigation rate, crop yields can increase to some extent. In particular, crops in wetter areas usually require more water as they are more sensitive to precipitation, and therefore increased irrigation is more effective [59]. Furthermore, mulched irrigation is considered to be the most efficient irrigation method because the uniform distribution of water in the soil limits deep percolation and reduces unproductive evaporation from the soil [75]. Several gaps were identified between mean yearly yields and potential crop yields in several grain-producing areas of China, particularly in the NEP, NCP, MLRYR, LP, and ASANC sub-regions. In addition, the most important grain-producing areas of China were observed to be the NEP, NCP, MLRYR, LP, and ASANC sub-regions, which constituted more than 70% of China’s total crop area. The average multi-year precipitation in NEP (sub-regions I, II, and eastern VI) is very small (Table 1), but the average multi-year PET is large, which creates a larger water deficit (Figure 13b) and conditions more sensitive to water deficit conditions (Figure 7a). According to Figure 12b, the irrigation rate is higher in the NEP sub-region, which indicates that mulched irrigation is an effective strategy to reduce the PET in this region. The multi-year average precipitation in the NCP sub-region (sub-region III) is low and the multi-year average PET is large (Table 1). According to Figure 7a, the cropland vegetation in sub-region NCP is more sensitive to water deficit conditions. In addition, the response of vegetation to PET is slightly greater than that of precipitation in the NCP sub-region (Figure 13a), with a large water deficit (Figure 13b). According to Figure 12b, the irrigation rate in the NCP sub-region is low; therefore, a further increase in the irrigation rate and the use of mulching in the NCP sub-region could reduce PET. The MLRYR sub-region was observed to have a higher average multi-year precipitation and a lower average multi-year PET (Table 1). According to Figure 7a, the cropland vegetation in sub-region MLRYR is more sensitive to water deficits. In addition, the proportion of forest vegetation in sub-region IV was low, and the response of the MLRYR sub-region to PET was slightly greater than that of precipitation (Figure 13a). According to Figure 12b, the average irrigation rate in the MLRYR sub-region was high; therefore, mulched irrigation should be an effective strategy to reduce evaporation. The multi-year average precipitation in the ASANC sub-region (sub-region VIII) was low and the multi-year average PET was large (Table 1). According to Figure 7a, the cropland vegetation in the ASANC sub-region was more sensitive to water deficits. In addition, the response of vegetation to PET in the ASANC sub-region was slightly greater than that of precipitation (Figure 13a), with a large water deficit to meet crop needs (Figure 13b). According to Figure 12b, the irrigation rate in the ASANC sub-region was low; therefore, the irrigation rate could be further increased and mulching could be applied to reduce PET. Sub-region ASANC is located in an extremely arid region, and improving the drought tolerance of crops has been proposed to increase the yield of crops in such areas [76]. However, irrigation could be a double-edged sword. For example, Zheng et al. (2021) showed that improper irrigation strategies may also erode the land environment and reduce crop yields [77]. Furthermore, while irrigation provides sufficient water, it also promotes nitrous oxide emissions due to the large amount of nitrogen inputs [78]. In addition, secondary hazards, such as splashing and erosion from irrigation, have been shown to potentially reduce water and fertilizer use efficiency [79]. Therefore, there is also a need to improve soil watering methods (e.g., Biosystems Technology) when irrigating cropland vegetation, and to provide better prerequisites and a stable environment for plant growth [80,81].

5. Conclusions

This study investigated the diverse response of cropland vegetation to meteorological conditions and irrigation across China. Our findings will contribute to the understanding of changes in agricultural vegetation and their driving factors in different sub-regions for more effective and sustainable ecosystem management. This study’s findings have been summarized as follows:
The diverse response of cropland vegetation to climatic factors (precipitation, PET, and water deficits) was assessed in different climate sub-regions across China. The climatic factors showed positive correlations with cropland vegetation, and the highest correlation coefficient between cropland vegetation and climatic factors was observed in sub-regions I, II, and VI, and the lowest in sub-regions IV and V. In general, there was a stronger correlation between cropland vegetation and meteorological factors in northern China compared to the southern parts.
The response time of cropland vegetation to precipitation and PET in China varied greatly due to meteorological conditions and vegetation density. The response time of cropland vegetation to precipitation was found to be short (1–3 months) in the north and lengthy (3–6 months) in the south, whereas the response time of cropland vegetation to PET revealed extensive regional variation.
The correlation between cropland vegetation, crop yields, and irrigation rates varied considerably across China. Most of the cropland vegetation and the areas with the highest potential crop yields are located in the eastern part of China. These areas also require higher irrigation rates, which benefits the potential crop yields.

Author Contributions

Y.S.: conceived and designed research ideas, analyzed the data, and wrote the paper. H.Z.: conceptualization, methodology, and supervision. Y.D.: conceptualization, and revised the manuscript. H.C.: conceptualization and supervision. X.P.: data collection. All authors have read and agreed to the published version of the manuscript.

Funding

This study was supported by the National Natural Science Foundation of China [grant number (52179046)].

Data Availability Statement

The datasets used during the current study are available from the corresponding author on reasonable request.

Acknowledgments

Special thanks to the anonymous reviewers and the editor for their extensive work on editing the language of the manuscript and useful suggestions for improving the quality of the manuscript.

Conflicts of Interest

Author Yibo Ding was employed by the company Yellow River Engineering Consulting Co., Ltd. The remaining authors declare that the research was conducted in the absence of any commercial or financial relationships that could be construed as a potential conflict of interest.

References

  1. Chen, N.; Zhang, Y.; Yuan, F.; Song, C.; Xu, M.; Wang, Q.; Hao, G.; Bao, T.; Zuo, Y.; Liu, J.; et al. Warming-Induced Vapor Pressure Deficit Suppression of Vegetation Growth Diminished in Northern Peatlands. Nat. Commun. 2023, 14, 7885. [Google Scholar] [CrossRef] [PubMed]
  2. Xu, Y.; Dai, Q.-Y.; Zou, B.; Xu, M.; Feng, Y.-X. Tracing Climatic and Human Disturbance in Diverse Vegetation Zones in China: Over 20 Years of NDVI Observations. Ecol. Indic. 2023, 156, 111170. [Google Scholar] [CrossRef]
  3. Lai, J.; Zhao, T.; Qi, S. Spatiotemporal Variation in Vegetation and Its Driving Mechanisms in the Southwest Alpine Canyon Area of China. Forests 2023, 14, 2357. [Google Scholar] [CrossRef]
  4. Lian, X.; Jiao, L.; Liu, Z.; Jia, Q.; Zhong, J.; Fang, M.; Wang, W. Multi-Spatiotemporal Heterogeneous Legacy Effects of Climate on Terrestrial Vegetation Dynamics in China. GISci. Remote Sens. 2022, 59, 164–183. [Google Scholar] [CrossRef]
  5. Duveiller, G.; Hooker, J.; Cescatti, A. The Mark of Vegetation Change on Earth’s Surface Energy Balance. Nat. Commun. 2018, 9, 679. [Google Scholar] [CrossRef]
  6. Zhou, Y.; Batelaan, O.; Guan, H.; Liu, T.; Duan, L.; Wang, Y.; Li, X. Assessing Long-Term Trends in Vegetation Cover Change in the Xilin River Basin: Potential for Monitoring Grassland Degradation and Restoration. J. Environ. Manag. 2024, 349, 119579. [Google Scholar] [CrossRef]
  7. Ren, Y.; Zhang, F.; Zhao, C.; Cheng, Z. Attribution of Climate Change and Human Activities to Vegetation NDVI in Jilin Province, China during 1998–2020. Ecol. Indic. 2023, 153, 110415. [Google Scholar] [CrossRef]
  8. Bhanja, S.N.; Malakar, P.; Mukherjee, A.; Rodell, M.; Mitra, P.; Sarkar, S. Using Satellite-Based Vegetation Cover as Indicator of Groundwater Storage in Natural Vegetation Areas. Geophys. Res. Lett. 2019, 46, 8082–8092. [Google Scholar] [CrossRef]
  9. Li, W.; Zhou, J.; Xu, Z.; Liang, Y.; Shi, J.; Zhao, X. Climate Impact Greater on Vegetation NPP but Human Enhance Benefits after the Grain for Green Program in Loess Plateau. Ecol. Indic. 2023, 157, 111201. [Google Scholar] [CrossRef]
  10. Fan, F.; Xiao, C.; Feng, Z.; Yang, Y. Impact of Human and Climate Factors on Vegetation Changes in Mainland Southeast Asia and Yunnan Province of China. J. Clean. Prod. 2023, 415, 137690. [Google Scholar] [CrossRef]
  11. Pearson, R.G.; Phillips, S.J.; Loranty, M.M.; Beck, P.S.A.; Damoulas, T.; Knight, S.J.; Goetz, S.J. Shifts in Arctic Vegetation and Associated Feedbacks under Climate Change. Nat. Clim. Chang. 2013, 3, 673–677. [Google Scholar] [CrossRef]
  12. Liu, H.; Deng, Y.; Liu, X. The Contribution of Forest and Grassland Change Was Greater than That of Cropland in Human-Induced Vegetation Greening in China, Especially in Regions with High Climate Variability. Sci. Total Environ. 2021, 792, 148408. [Google Scholar] [CrossRef] [PubMed]
  13. Yang, S.; Liu, J.; Wang, C.; Zhang, T.; Dong, X.; Liu, Y. Vegetation Dynamics Influenced by Climate Change and Human Activities in the Hanjiang River Basin, Central China. Ecol. Indic. 2022, 145, 109586. [Google Scholar] [CrossRef]
  14. Zhang, Y.; Lu, Y.; Song, X. Identifying the Main Factors Influencing Significant Global Vegetation Changes. Forests 2023, 14, 1607. [Google Scholar] [CrossRef]
  15. Ren, H.; Chen, C.; Li, Y.; Zhu, W.; Zhang, L.; Wang, L.; Zhu, L. Response of Vegetation Coverage to Climate Changes in the Qinling-Daba Mountains of China. Forests 2023, 14, 425. [Google Scholar] [CrossRef]
  16. Hu, B.; Xie, M.; He, R.; Shi, Z.; Zhou, Y.; Ni, H.; Li, H. Spatio-Temporal Evolution of Cropland Ecosystem Services Value and Its Spatially Varying Dominate over the Past Two Decades: A Case Study in Jiangxi Province in Southern China. J. Clean. Prod. 2023, 427, 139228. [Google Scholar] [CrossRef]
  17. Chen, W.; Yang, L.; Zeng, J.; Yuan, J.; Gu, T.; Liu, Z. Untangling the Increasing Elevation of Cropland in China from 1980 to 2020. Geogr. Sustain. 2023, 4, 281–293. [Google Scholar] [CrossRef]
  18. Zhang, M.; Li, G.; He, T.; Zhai, G.; Guo, A.; Chen, H.; Wu, C. Reveal the Severe Spatial and Temporal Patterns of Abandoned Cropland in China over the Past 30 Years. Sci. Total Environ. 2023, 857, 159591. [Google Scholar] [CrossRef]
  19. Kuttippurath, J.; Kashyap, R. Greening of India: Forests or Croplands? Appl. Geogr. 2023, 161, 103115. [Google Scholar] [CrossRef]
  20. Hu, B.; Xie, M.; Li, H.; He, R.; Zhou, Y.; Jiang, Y.; Ji, W.; Peng, J.; Xia, F.; Liang, Z.; et al. Climate and Soil Management Factors Control Spatio-Temporal Variation of Soil Nutrients and Soil Organic Matter in the Farmland of Jiangxi Province in South China. J. Soils Sediments 2023, 23, 2373–2395. [Google Scholar] [CrossRef]
  21. Xiao, Y.; Xie, G.; Lu, C.; Ding, X.; Lu, Y. The Value of Gas Exchange as a Service by Rice Paddies in Suburban Shanghai, PR China. Agric. Ecosyst. Environ. 2005, 109, 273–283. [Google Scholar] [CrossRef]
  22. Yu, S.; Wang, L.; Zhao, J.; Shi, Z. Using Structural Equation Modelling to Identify Regional Socio-Economic Driving Forces of Soil Erosion: A Case Study of Jiangxi Province, Southern China. J. Environ. Manag. 2021, 279, 111616. [Google Scholar] [CrossRef] [PubMed]
  23. Wuyun, D.; Sun, L.; Chen, Z.; Hou, A.; Crusiol, L.G.T.; Yu, L.; Chen, R.; Sun, Z. The Spatiotemporal Change of Cropland and Its Impact on Vegetation Dynamics in the Farming-Pastoral Ecotone of Northern China. Sci. Total Environ. 2022, 805, 150286. [Google Scholar] [CrossRef] [PubMed]
  24. Subedi, Y.R.; Kristiansen, P.; Cacho, O. Reutilising Abandoned Cropland in the Hill Agroecological Region of Nepal: Options and Farmers’ Preferences. Land Use Policy 2022, 117, 106082. [Google Scholar] [CrossRef]
  25. Song, W.; Song, W. Cropland Fallow Reduces Agricultural Water Consumption by 303 Million Tons Annually in Gansu Province, China. Sci. Total Environ. 2023, 879, 163013. [Google Scholar] [CrossRef]
  26. Wang, X.; Lu, C.; Fang, J.; Shen, Y. Implications for Development of Grain-for-Green Policy Based on Cropland Suitability Evaluation in Desertification-Affected north China. Land Use Policy 2007, 24, 417–424. [Google Scholar] [CrossRef]
  27. Xue, J.; Zhang, X.-L.; Chen, S.-C.; Hu, B.-F.; Wang, N.; Shi, Z. Quantifying the Agreement and Accuracy Characteristics of Four Satellite-Based LULC Products for Cropland Classification in China. J. Integr. Agric. 2024, 23, 283–297. [Google Scholar] [CrossRef]
  28. Matas-Granados, L.; Pizarro, M.; Cayuela, L.; Domingo, D.; Gómez, D.; García, M.B. Long-Term Monitoring of NDVI Changes by Remote Sensing to Assess the Vulnerability of Threatened Plants. Biol. Conserv. 2022, 265, 109428. [Google Scholar] [CrossRef]
  29. Eisfelder, C.; Asam, S.; Hirner, A.; Reiners, P.; Holzwarth, S.; Bachmann, M.; Gessner, U.; Dietz, A.; Huth, J.; Bachofer, F.; et al. Seasonal Vegetation Trends for Europe over 30 Years from a Novel Normalised Difference Vegetation Index (NDVI) Time-Series—The TIMELINE NDVI Product. Remote Sens. 2023, 15, 3616. [Google Scholar] [CrossRef]
  30. Son, N.T.; Chen, C.F.; Chen, C.R.; Minh, V.Q.; Trung, N.H. A Comparative Analysis of Multitemporal MODIS EVI and NDVI Data for Large-Scale Rice Yield Estimation. Agric. For. Meteorol. 2014, 197, 52–64. [Google Scholar] [CrossRef]
  31. Peng, J.; Liu, Z.; Liu, Y.; Wu, J.; Han, Y. Trend Analysis of Vegetation Dynamics in Qinghai–Tibet Plateau Using Hurst Exponent. Ecol. Indic. 2012, 14, 28–39. [Google Scholar] [CrossRef]
  32. Ding, Y.; He, X.; Zhou, Z.; Hu, J.; Cai, H.; Wang, X.; Li, L.; Xu, J.; Shi, H. Response of Vegetation to Drought and Yield Monitoring Based on NDVI and SIF. CATENA 2022, 219, 106328. [Google Scholar] [CrossRef]
  33. Wang, X.; Yan, S.; Wang, W.; Yin, L.; Li, M.; Yu, Z.; Chang, S.; Hou, F. Monitoring Leaf Area Index of the Sown Mixture Pasture through UAV Multispectral Image and Texture Characteristics. Comput. Electron. Agric. 2023, 214, 108333. [Google Scholar] [CrossRef]
  34. Shammi, S.A.; Meng, Q. Use Time Series NDVI and EVI to Develop Dynamic Crop Growth Metrics for Yield Modeling. Ecol. Indic. 2021, 121, 107124. [Google Scholar] [CrossRef]
  35. Li, M.; Cao, S.; Zhu, Z.; Wang, Z.; Myneni, R.B.; Piao, S. Spatiotemporally Consistent Global Dataset of the GIMMS Normalized Difference Vegetation Index (PKU GIMMS NDVI) from 1982 to 2022. Earth Syst. Sci. Data 2023, 15, 4181–4203. [Google Scholar] [CrossRef]
  36. Ma, C.; Li, T.; Liu, P. GIMMS NDVI3g+ (1982–2015) Response to Climate Change and Engineering Activities along the Qinghai–Tibet Railway. Ecol. Indic. 2021, 128, 107821. [Google Scholar] [CrossRef]
  37. Liu, Y.; Li, L.; Chen, X.; Zhang, R.; Yang, J. Temporal-Spatial Variations and Influencing Factors of Vegetation Cover in Xinjiang from 1982 to 2013 Based on GIMMS-NDVI3g. Glob. Planet. Chang. 2018, 169, 145–155. [Google Scholar] [CrossRef]
  38. Gao, W.; Zheng, C.; Liu, X.; Lu, Y.; Chen, Y.; Wei, Y.; Ma, Y. NDVI-Based Vegetation Dynamics and Their Responses to Climate Change and Human Activities from 1982 to 2020: A Case Study in the Mu Us Sandy Land, China. Ecol. Indic. 2022, 137, 108745. [Google Scholar] [CrossRef]
  39. Gong, H.; Cheng, Q.; Jin, H.; Ren, Y. Effects of Temporal, Spatial, and Elevational Variation in Bioclimatic Indices on the NDVI of Different Vegetation Types in Southwest China. Ecol. Indic. 2023, 154, 110499. [Google Scholar] [CrossRef]
  40. Snyder, K.A.; Tartowski, S.L. Multi-Scale Temporal Variation in Water Availability: Implications for Vegetation Dynamics in Arid and Semi-Arid Ecosystems. J. Arid Environ. 2006, 65, 219–234. [Google Scholar] [CrossRef]
  41. Guo, F.; Liu, D.; Mo, S.; Huang, Q.; Ma, L.; Xie, S.; Deng, W.; Ming, G.; Fan, J. Estimation of Daily Evapotranspiration in Gully Area Scrub Ecosystems on Loess Plateau of China Based on Multisource Observation Data. Ecol. Indic. 2023, 154, 110671. [Google Scholar] [CrossRef]
  42. Wang, F.; Liang, W.; Fu, B.; Jin, Z.; Yan, J.; Zhang, W.; Fu, S.; Yan, N. Changes of Cropland Evapotranspiration and Its Driving Factors on the Loess Plateau of China. Sci. Total Environ. 2020, 728, 138582. [Google Scholar] [CrossRef]
  43. Da Silva, J.B.A.; de Almeida, G.L.P.; da Silva, M.V.; de Oliveira-Junior, J.F.; Pandorfi, H.; de Sousa, A.M.O.; Marinho, G.T.B.; Giongo, P.R.; Ferreira, M.B.; de Sousa, J.S.; et al. Characterization of Water Status and Vegetation Cover Change in a Watershed in Northeastern Brazil. J. S. Am. Earth Sci. 2023, 130, 104546. [Google Scholar] [CrossRef]
  44. Piao, S.; Fang, J.; Zhou, L.; Guo, Q.; Henderson, M.; Ji, W.; Li, Y.; Tao, S. Interannual Variations of Monthly and Seasonal Normalized Difference Vegetation Index (NDVI) in China from 1982 to 1999. J. Geophys. Res. Atmos. 2003, 108, 4401. [Google Scholar] [CrossRef]
  45. Wen, Y.; Liu, X.; Yang, J.; Lin, K.; Du, G. NDVI Indicated Inter-Seasonal Non-Uniform Time-Lag Responses of Terrestrial Vegetation Growth to Daily Maximum and Minimum Temperature. Glob. Planet. Chang. 2019, 177, 27–38. [Google Scholar] [CrossRef]
  46. Qi, X.; Feng, K.; Sun, L.; Zhao, D.; Huang, X.; Zhang, D.; Liu, Z.; Baiocchi, G. Rising Agricultural Water Scarcity in China Is Driven by Expansion of Irrigated Cropland in Water Scarce Regions. One Earth 2022, 5, 1139–1152. [Google Scholar] [CrossRef]
  47. Gonçalves, L.R.; Oliveira, C.W.; Meireles, A.C.M. Spatial Distribution of Evapotranspiration by Fractional Vegetation Cover Index on Irrigated Cropland Banana (Musa spp.) in the Semiarid. Remote Sens. Appl. Soc. Environ. 2023, 29, 100878. [Google Scholar] [CrossRef]
  48. Qiu, J.; Zipper, S.C.; Motew, M.; Booth, E.G.; Kucharik, C.J.; Loheide, S.P. Nonlinear Groundwater Influence on Biophysical Indicators of Ecosystem Services. Nat. Sustain. 2019, 2, 475–483. [Google Scholar] [CrossRef]
  49. Flörke, M.; Schneider, C.; McDonald, R.I. Water Competition between Cities and Agriculture Driven by Climate Change and Urban Growth. Nat. Sustain. 2018, 1, 51–58. [Google Scholar] [CrossRef]
  50. Marchionni, V.; Fatichi, S.; Tapper, N.; Walker, J.P.; Manoli, G.; Daly, E. Assessing Vegetation Response to Irrigation Strategies and Soil Properties in an Urban Reserve in Southeast Australia. Landsc. Urban Plan. 2021, 215, 104198. [Google Scholar] [CrossRef]
  51. Ma, R.; Shen, X.; Zhang, J.; Xia, C.; Liu, Y.; Wu, L.; Wang, Y.; Jiang, M.; Lu, X. Variation of Vegetation Autumn Phenology and Its Climatic Drivers in Temperate Grasslands of China. Int. J. Appl. Earth Obs. Geoinf. 2022, 114, 103064. [Google Scholar] [CrossRef]
  52. Li, C.; Chen, J.; Wu, X.; Zhou, M.; Wei, Y.; Liu, Y.; Liu, L.; Peng, L.; Dou, T.; Li, L. Persistent Effects of Global Warming on Vegetation Growth Are Regulated by Water in China during 2001–2017. J. Clean. Prod. 2022, 381, 135198. [Google Scholar] [CrossRef]
  53. Ge, C.; Sun, S.; Yao, R.; Sun, P.; Li, M.; Bian, Y. Long-Term Vegetation Phenology Changes and Response to Multi-Scale Meteorological Drought on the Loess Plateau, China. J. Hydrol. 2022, 614, 128605. [Google Scholar] [CrossRef]
  54. Zhang, Y.; He, Y.; Li, Y.; Jia, L. Spatiotemporal Variation and Driving Forces of NDVI from 1982 to 2015 in the Qinba Mountains, China. Environ. Sci. Pollut. Res. 2022, 29, 52277–52288. [Google Scholar] [CrossRef]
  55. Xue, S.-Y.; Xu, H.-Y.; Mu, C.-C.; Wu, T.-H.; Li, W.-P.; Zhang, W.-X.; Streletskaya, I.; Grebenets, V.; Sokratov, S.; Kizyakov, A.; et al. Changes in Different Land Cover Areas and NDVI Values in Northern Latitudes from 1982 to 2015. Adv. Clim. Chang. Res. 2021, 12, 456–465. [Google Scholar] [CrossRef]
  56. Gong, G.; Mattevada, S.; O’bryant, S.E. Comparison of the Accuracy of Kriging and IDW Interpolations in Estimating Groundwater Arsenic Concentrations in Texas. Environ. Res. 2014, 130, 59–69. [Google Scholar] [CrossRef]
  57. Allen, R.G.; Kilic, A.; D’Urso, G.; Consoli, S. The Penman-Monteith Equation. In Encyclopedia of Soils in the Environment, 2nd ed.; Goss, M.J., Oliver, M., Eds.; Academic Press: Oxford, UK, 2023; pp. 634–645. ISBN 978-0-323-95133-3. [Google Scholar]
  58. Li, Y.; Qin, Y.; Rong, P. Evolution of Potential Evapotranspiration and Its Sensitivity to Climate Change Based on the Thornthwaite, Hargreaves, and Penman–Monteith Equation in Environmental Sensitive Areas of China. Atmos. Res. 2022, 273, 106178. [Google Scholar] [CrossRef]
  59. Bai, Y.; Gao, J. Optimization of the Nitrogen Fertilizer Schedule of Maize under Drip Irrigation in Jilin, China, Based on DSSAT and GA. Agric. Water Manag. 2021, 244, 106555. [Google Scholar] [CrossRef]
  60. Zhao, N.; Zhang, X.; Hu, L.; Liu, H.; Ma, L.; Xu, T.; Han, X.; Kang, S.; Wang, X.; Zhao, X.; et al. Cropping practices manipulate soil bacterial structure and functions on the Qinghai-Tibet Plateau. J. Plant Physiol. 2022, 271, 153666. [Google Scholar] [CrossRef]
  61. Mo, K.; Chen, Q.; Chen, C.; Zhang, J.; Wang, L.; Bao, Z. Spatiotemporal Variation of Correlation between Vegetation Cover and Precipitation in an Arid Mountain-Oasis River Basin in Northwest China. J. Hydrol. 2019, 574, 138–147. [Google Scholar] [CrossRef]
  62. Georganos, S.; Abdi, A.M.; Tenenbaum, D.E.; Kalogirou, S. Examining the NDVI-Rainfall Relationship in the Semi-Arid Sahel Using Geographically Weighted Regression. J. Arid Environ. 2017, 146, 64–74. [Google Scholar] [CrossRef]
  63. Wang, H.; Yan, S.; Liang, Z.; Jiao, K.; Li, D.; Wei, F.; Li, S. Strength of Association between Vegetation Greenness and Its Drivers across China between 1982 and 2015: Regional Differences and Temporal Variations. Ecol. Indic. 2021, 128, 107831. [Google Scholar] [CrossRef]
  64. Yao, M.; Rui, J.; Niu, H.; Heděnec, P.; Li, J.; He, Z.; Wang, J.; Cao, W.; Li, X. The Differentiation of Soil Bacterial Communities along a Precipitation and Temperature Gradient in the Eastern Inner Mongolia Steppe. CATENA 2017, 152, 47–56. [Google Scholar] [CrossRef]
  65. Bao, Z.; Zhang, J.; Wang, G.; Guan, T.; Jin, J.; Liu, Y.; Li, M.; Ma, T. The Sensitivity of Vegetation Cover to Climate Change in Multiple Climatic Zones Using Machine Learning Algorithms. Ecol. Indic. 2021, 124, 107443. [Google Scholar] [CrossRef]
  66. Guo, E.; Yang, X.; Li, T.; Zhang, T.; Wilson, L.T.; Wang, X.; Zheng, D.; Yang, Y. Does ENSO Strongly Affect Rice Yield and Water Application in Northeast China? Agric. Water Manag. 2021, 245, 106605. [Google Scholar] [CrossRef]
  67. Ding, Y.; Xu, J.; Wang, X.; Cai, H.; Zhou, Z.; Sun, Y.; Shi, H. Propagation of Meteorological to Hydrological Drought for Different Climate Regions in China. J. Environ. Manag. 2021, 283, 111980. [Google Scholar] [CrossRef]
  68. Tang, Y.; Tang, Q. Variations and Influencing Factors of Potential Evapotranspiration in Large Siberian River Basins during 1975–2014. J. Hydrol. 2021, 598, 126443. [Google Scholar] [CrossRef]
  69. Hu, X.; Shi, L.; Lin, L.; Zha, Y. Nonlinear Boundaries of Land Surface Temperature–Vegetation Index Space to Estimate Water Deficit Index and Evaporation Fraction. Agric. For. Meteorol. 2019, 279, 107736. [Google Scholar] [CrossRef]
  70. Ma, Z.; Yan, N.; Wu, B.; Stein, A.; Zhu, W.; Zeng, H. Variation in Actual Evapotranspiration Following Changes in Climate and Vegetation Cover during an Ecological Restoration Period (2000–2015) in the Loess Plateau, China. Sci. Total Environ. 2019, 689, 534–545. [Google Scholar] [CrossRef]
  71. Joiner, J.; Yoshida, Y.; Anderson, M.; Holmes, T.; Hain, C.; Reichle, R.; Koster, R.; Middleton, E.; Zeng, F.-W. Global Relationships among Traditional Reflectance Vegetation Indices (NDVI and NDII), Evapotranspiration (ET), and Soil Moisture Variability on Weekly Timescales. Remote Sens. Environ. 2018, 219, 339–352. [Google Scholar] [CrossRef]
  72. Li, Z.; Xiao, Z.-N.; Zheng, C.-W. Observation Analysis of Wind Climate in China for 1971–2017 under the Demand of Wind Energy Evaluation and Utilization. Energy Rep. 2021, 7, 3535–3546. [Google Scholar] [CrossRef]
  73. Xu, H.-J.; Wang, X.-P.; Zhao, C.-Y.; Yang, X.-M. Diverse Responses of Vegetation Growth to Meteorological Drought across Climate Zones and Land Biomes in Northern China from 1981 to 2014. Agric. For. Meteorol. 2018, 262, 1–13. [Google Scholar] [CrossRef]
  74. Craine, J.M.; Ocheltree, T.W.; Nippert, J.B.; Towne, E.G.; Skibbe, A.M.; Kembel, S.W.; Fargione, J.E. Global Diversity of Drought Tolerance and Grassland Climate-Change Resilience. Nat. Clim. Chang. 2013, 3, 63–67. [Google Scholar] [CrossRef]
  75. Zhang, Z.; Li, X.; Liu, L.; Wang, Y.; Li, Y. Influence of Mulched Drip Irrigation on Landscape Scale Evapotranspiration from Farmland in an Arid Area. Agric. Water Manag. 2020, 230, 105953. [Google Scholar] [CrossRef]
  76. Çelik, Ö.; Ayan, A.; Meriç, S.; Atak, Ç. Comparison of Tolerance Related Proteomic Profiles of Two Drought Tolerant Tomato mutants Improved by Gamma Radiation. J. Biotechnol. 2021, 330, 35–44. [Google Scholar] [CrossRef]
  77. Zheng, J.; Fan, J.; Zhang, F.; Guo, J.; Yan, S.; Zhuang, Q.; Cui, N.; Guo, L. Interactive effects of mulching practice and nitrogen rate on grain yield, water productivity, fertilizer use efficiency and greenhouse gas emissions of rainfed summer maize in northwest China. Agric. Water Manag. 2021, 248, 106778. [Google Scholar] [CrossRef]
  78. Maraseni, T.; Kodur, S. Improved prediction of farm nitrous oxide emission through an understanding of the interaction among climate extremes, soil nitrogen dynamics and irrigation water. J. Environ. Manag. 2019, 248, 109278. [Google Scholar] [CrossRef]
  79. Zhu, Z.; Li, J.; Zhu, D.; Gao, Z. The impact of maize canopy on splash erosion risk on soils with different textures under sprinkler irrigation. CATENA 2024, 234, 10768. [Google Scholar] [CrossRef]
  80. Kalinitchenko, V.P.; Glinushkin, A.P.; Minkina, T.M.; Mandzhieva, S.S.; Sushkova, S.N.; Sukovatov, V.A.; Il’ina, L.P.; Makarenkov, D.A. Chemical Soil-Biological Engineering Theoretical Foundations, Technical Means, and Technology for Safe Intrasoil Waste Recycling and Long-Term Higher Soil Productivity. ACS Omega 2020, 5, 17553–17564. [Google Scholar] [CrossRef] [PubMed]
  81. Bunkin, N.F.; Glinushkin, A.P.; Shkirin, A.V.; Ignatenko, D.N.; Chirikov, S.N.; Savchenko, I.V.; Meshalkin, V.P.; Samarin, G.N.; Maleki, A.; Kalinitchenko, V.P. Identification of Organic Matter Dispersions Based on Light Scattering Matrices Focusing on Soil Organic Matter Management. ACS Omega 2020, 5, 33214–33224. [Google Scholar] [CrossRef]
Figure 1. Topographic and geographic zones: (a) different ecosystem types occupy different regions; (b) eight sub-regions based on climate zone; and (c) major grain-producing areas of China.
Agronomy 14 00188 g001
Figure 2. Response of cropland vegetation to precipitation for the period 1985–2015: (a) partial correlation coefficient and (b) response time.
Agronomy 14 00188 g002
Figure 3. Box diagram showing (a) the correlation coefficient and (b) the response time between cropland vegetation and precipitation for different sub-regions.
Agronomy 14 00188 g003
Figure 4. Response of cropland vegetation to PET for the period 1985–2015: (a) partial correlation coefficient and (b) response time.
Agronomy 14 00188 g004
Figure 5. Box diagram showing (a) the correlation coefficient and (b) the response time between cropland vegetation and PET for different sub-regions.
Agronomy 14 00188 g005
Figure 6. Partial correlation coefficient of cropland vegetation to water deficits for the period 1985–2015.
Agronomy 14 00188 g006
Figure 7. Box diagram showing (a) the correlation coefficient and (b) the response time between cropland NDVI and water deficits in different climate zones.
Agronomy 14 00188 g007
Figure 8. Relationship between the cropland NDVI and crop yields in different production areas in China: (a) correlation coefficient; (b) annual average NDVI; and (c) mean annual yield.
Agronomy 14 00188 g008
Figure 9. Spatial distribution of (a) multi-year average potential crop yields and (b) irrigation rate.
Agronomy 14 00188 g009
Figure 10. The irrigation rate and multi-year average potential crop yields in different climate zones: (a) irrigation rate and (b) potential crop yields.
Agronomy 14 00188 g010
Figure 11. Correlation between potential crop yields and irrigation rates.
Agronomy 14 00188 g011
Figure 12. Spatial distribution of (a) vegetation type and (b) density.
Agronomy 14 00188 g012
Figure 13. Spatial distribution of (a) cropland vegetation response to climatic factors and (b) water deficits.
Agronomy 14 00188 g013
Table 1. The average annual potential evapotranspiration (PET) and the average annual cumulative precipitation for the eight climatic zones (1982–2015).
Climate ZonesAverage Annual Potential Evapotranspiration (mm)Annual Average Cumulative Precipitation (mm)
I269–398464–497
II484–555587–735
III820–948557–800
IV727–9981061–1590
V805–13201567–2052
VI677–862340–464
VII862–1034104–205
VIII655–941340–723
Disclaimer/Publisher’s Note: The statements, opinions and data contained in all publications are solely those of the individual author(s) and contributor(s) and not of MDPI and/or the editor(s). MDPI and/or the editor(s) disclaim responsibility for any injury to people or property resulting from any ideas, methods, instructions or products referred to in the content.

