Article

Simulating the Effects of Drought Stress Timing and the Amount Irrigation on Cotton Yield Using the CSM-CROPGRO-Cotton Model

1
School of Computer Science and Technology, Xinjiang University, Urumqi 830017, China
2
School of Agricultural Engineering, Jiangsu University, Zhenjiang 212013, China
3
Department of Electronic Engineering, and Beijing National Research Center for Information Science and Technology, Tsinghua University, Beijing 100084, China
4
Xinjiang Key Laboratory of Signal Detection and Processing, Urumqi 830017, China
*
Authors to whom correspondence should be addressed.
Agronomy 2024, 14(1), 14; https://doi.org/10.3390/agronomy14010014
Submission received: 16 November 2023 / Revised: 7 December 2023 / Accepted: 15 December 2023 / Published: 20 December 2023
(This article belongs to the Section Water Use and Irrigation)

Abstract

:
Drought stress disrupts the molecular-level water balance in plants, and severe water deficiency can be fatal for cotton plants. However, mild water deficits or short-term drought stress may enhance crop resilience, increasing yields. The present study aims to determine the optimal watering time and irrigation amount to induce drought tolerance in cotton seedlings during drought training. Specifically, the investigation focuses on identifying the ideal day for watering and the corresponding irrigation volume that effectively triggers the transition of cotton plants into a state of enhanced resistance to drought stress during the seedling stage. In this study, the CSM-CROPGRO-Cotton model was utilized, and our objectives were to (i) evaluate the predictive capability of CSM-CROPGRO-Cotton for yield estimation in field experiments in Xinjiang and (ii) simulate and assess the range of time during the seedling stage when cotton plants can withstand drought stress without reducing yields, identifying irrigation strategies that induce drought training while maintaining yield under mild water deficiency. The model was validated using yield data from field experiments conducted in 2023. The validation criteria included a normalized root mean square error ( n R M S E ) > 10 % and a coefficient of determination ( r 2 ) > 85 % for yield; for the leaf area index (LAI), the criterion was ( r 2 ) > 90 % , with a degree of agreement of ( d ) > 75 % . The results demonstrated the accuracy of the CSM-CROPGRO-Cotton model in predicting cotton yield. Based on the validated CSM-CROPGRO-Cotton model, this study employed the LINUX crop model batch-processing technique to efficiently simulate 357 different irrigation strategies by adjusting the amount of “first irrigation” and timing. The findings revealed that in the irrigation scheme for cotton during the seedling stage, when the amount of first irrigation was in the lower range of 10 mm to 15 mm, the cotton plants underwent drought training during the early growth stage, and their yields did not exhibit drastic fluctuations due to reduced amounts of first irrigation. The suitable period for first irrigation for drought training was from 25 June to 6 July, and the amount of first irrigation could save approximately 57.14% in irrigation water. This implies that subjecting cotton plants to a certain level of drought training can enhance their stress tolerance and increase yields. This finding holds great significance for cotton cultivation in drought-prone regions.

1. Introduction

Cotton is one of the most important fiber crops for the textile and garment industry [1]. The climate and land conditions in Changji provide unique advantages for large-scale mechanized cotton cultivation. However, in recent years, global climate change and increasing water resource pressure have had a significant impact on the cotton industry [2,3]. Internationally, cotton cultivation techniques have developed significantly, with various innovative and advanced cultivation methods emerging. These techniques include precision irrigation, remote sensing monitoring, genetic improvement, and soil conservation to enhance cotton yield and quality while reducing water resource requirements [4,5,6,7,8,9]. Applying these cutting-edge technologies provides new opportunities and challenges for cotton cultivation. However, despite these achievements, industry leaders anticipate that climate change and variability, particularly drought and high temperatures, could reduce crop yields by approximately 50% [10,11]. A significant challenge in cotton farming is adapting to arid and water-deficient conditions [12]. Drought significantly influences cotton growth and development, severely affecting both yield and quality. Hence, water-deficient irrigation strategies have become a focal point of research, aiming to optimize water resource utilization and mitigate the adverse effects of drought on cotton.
Drought stress is a nonbiological stress that poses significant challenges to agricultural productivity every year. Some techniques to alleviate drought stress include mulching, drought-tolerant plant varieties, super-absorbent hydrogels, and biochar. However, most of these practices are labor-intensive, costly, and have limited effectiveness. It has been demonstrated that inducing plant root growth through irrigation strategies is a prioritized approach that encompasses numerous direct and indirect benefits [13]. The periodic recurrence of drought makes the design of technologies for mitigating drought stress highly important. Recent methods for alleviating drought stress include film planting [14], the development of drought-tolerant crops [15], the use of nanoparticles for drought tolerance [16], and the application of super-absorbent hydrogels and biochar [17,18], as well as harnessing rhizobacteria that promote plant growth [19].
However, the effectiveness of these practices in mitigating drought stress is limited. Instead, a more easily implementable approach is to induce plants with drought resistance through deficit irrigation. Research on deficit irrigation in crops has been conducted internationally since the 1970s, primarily focusing on fruit trees [20]. In the 1980s, the emphasis of deficit irrigation research shifted towards water-saving and yield-increasing effects, as well as mechanisms and fruit quality issues. Scholars have conducted extensive studies on the physiological and biochemical responses of crops under deficit irrigation, water requirement patterns, optimal timing, and degree of deficit [21]. From the 1990s to the present, the focus of deficit irrigation research has shifted from yield improvement to quality enhancement [22] and has expanded to aspects such as fertilizer utilization efficiency under deficit irrigation. Additionally, during the early and middle stages of pear fruit growth, the implementation of deficit irrigation by Cheng Fuhou et al. significantly reduced the fruit shape index. During the water-controlled treatment, the fruit’s water content was significantly lower than the control, but it did not inhibit fruit growth or affect fruit size. On the contrary, there was a tendency for increased yield, individual fruit weight, fruit quality, and storage stability [23]. Zeng Dechao and others have conducted research on deficit irrigation in fruit trees, but the research content mainly focused on irrigation techniques [24]. Meng Zhaojiang conducted deficit irrigation experiments on summer maize, Zhang Xiying and others conducted field experiments on deficit irrigation regimes for winter wheat [25,26], Wang Mixia and others conducted deficit irrigation experiments on field mulched corn [27], and Hu Xiaotao and others extended deficit irrigation research to maize as a cereal crop, studying the effects of deficit irrigation on maize physiological indicators and water use efficiency [28]. Other studies mainly focused on theoretical issues related to inadequate irrigation under water scarcity conditions [29].
This study implemented deficit irrigation on cotton to induce drought tolerance and enhance its drought resistance. In order to identify the most suitable timing and amount of deficit irrigation, the study utilized weather and soil sensor data collected from experimental sites and employed crop model batch-processing techniques to conduct simulation experiments. Prior to the experiments, the model was calibrated. When compared to traditional field experiments with control groups, this approach offers more certainty and convenience in determining the induction of drought tolerance in cotton.
The experimental site is located in the heartland of the Eurasian continent, characterized by abundant sunlight, rich thermal energy, scarce precipitation, and dry air. It is a typical inland arid and semi-arid region. The vast land resources, abundant solar radiation, and relatively stable precipitation and glacial meltwater provide excellent natural conditions for cotton cultivation in the area. However, the region’s arid and low rainfall characteristics, coupled with intense evaporation, make oasis irrigation agriculture the predominant form of agriculture. Irrigation plays a vital role in cotton production in Xinjiang. In recent years, the increasing cultivation area and agricultural water use in Changji, combined with issues such as excessive groundwater extraction and competition for water resources between agriculture and ecosystems, have become increasingly prominent. These problems constrain the sustainable production of cotton [30]. Scientific and rational irrigation management and technological measures can enhance cotton’s ability to adapt to arid environments [31]. In order to overcome the adverse impacts of drought on cotton cultivation, measures for drought induction have become an important research direction. Drought induction involves implementing appropriate water management and other agronomic measures to enhance plants’ ability to adapt to drought [32]. These measures can improve cotton’s physiological characteristics and drought resistance, thereby enhancing yield and quality [33]. Exploring strategies that are suitable for drought induction is significant for enhancing drought resistance and promoting the sustainable development of cotton cultivation. Finally, mitigating the climate drought and water scarcity challenges faced in cotton production in Xinjiang requires the widespread adoption of water-saving irrigation techniques and improved water resource utilization efficiency [34]. Different growth stages of cotton plants exhibit varying sensitivities to water stress. Adequate irrigation should be provided during critical periods of crop water demand while reducing irrigation during less sensitive stages. This approach holds significant application potential in cotton production in Xinjiang. It is crucial for achieving sustainable cotton production, maintaining the economic income of local cotton farmers, and contributing to global cotton production [35].

2. Materials and Methods

2.1. Study Area

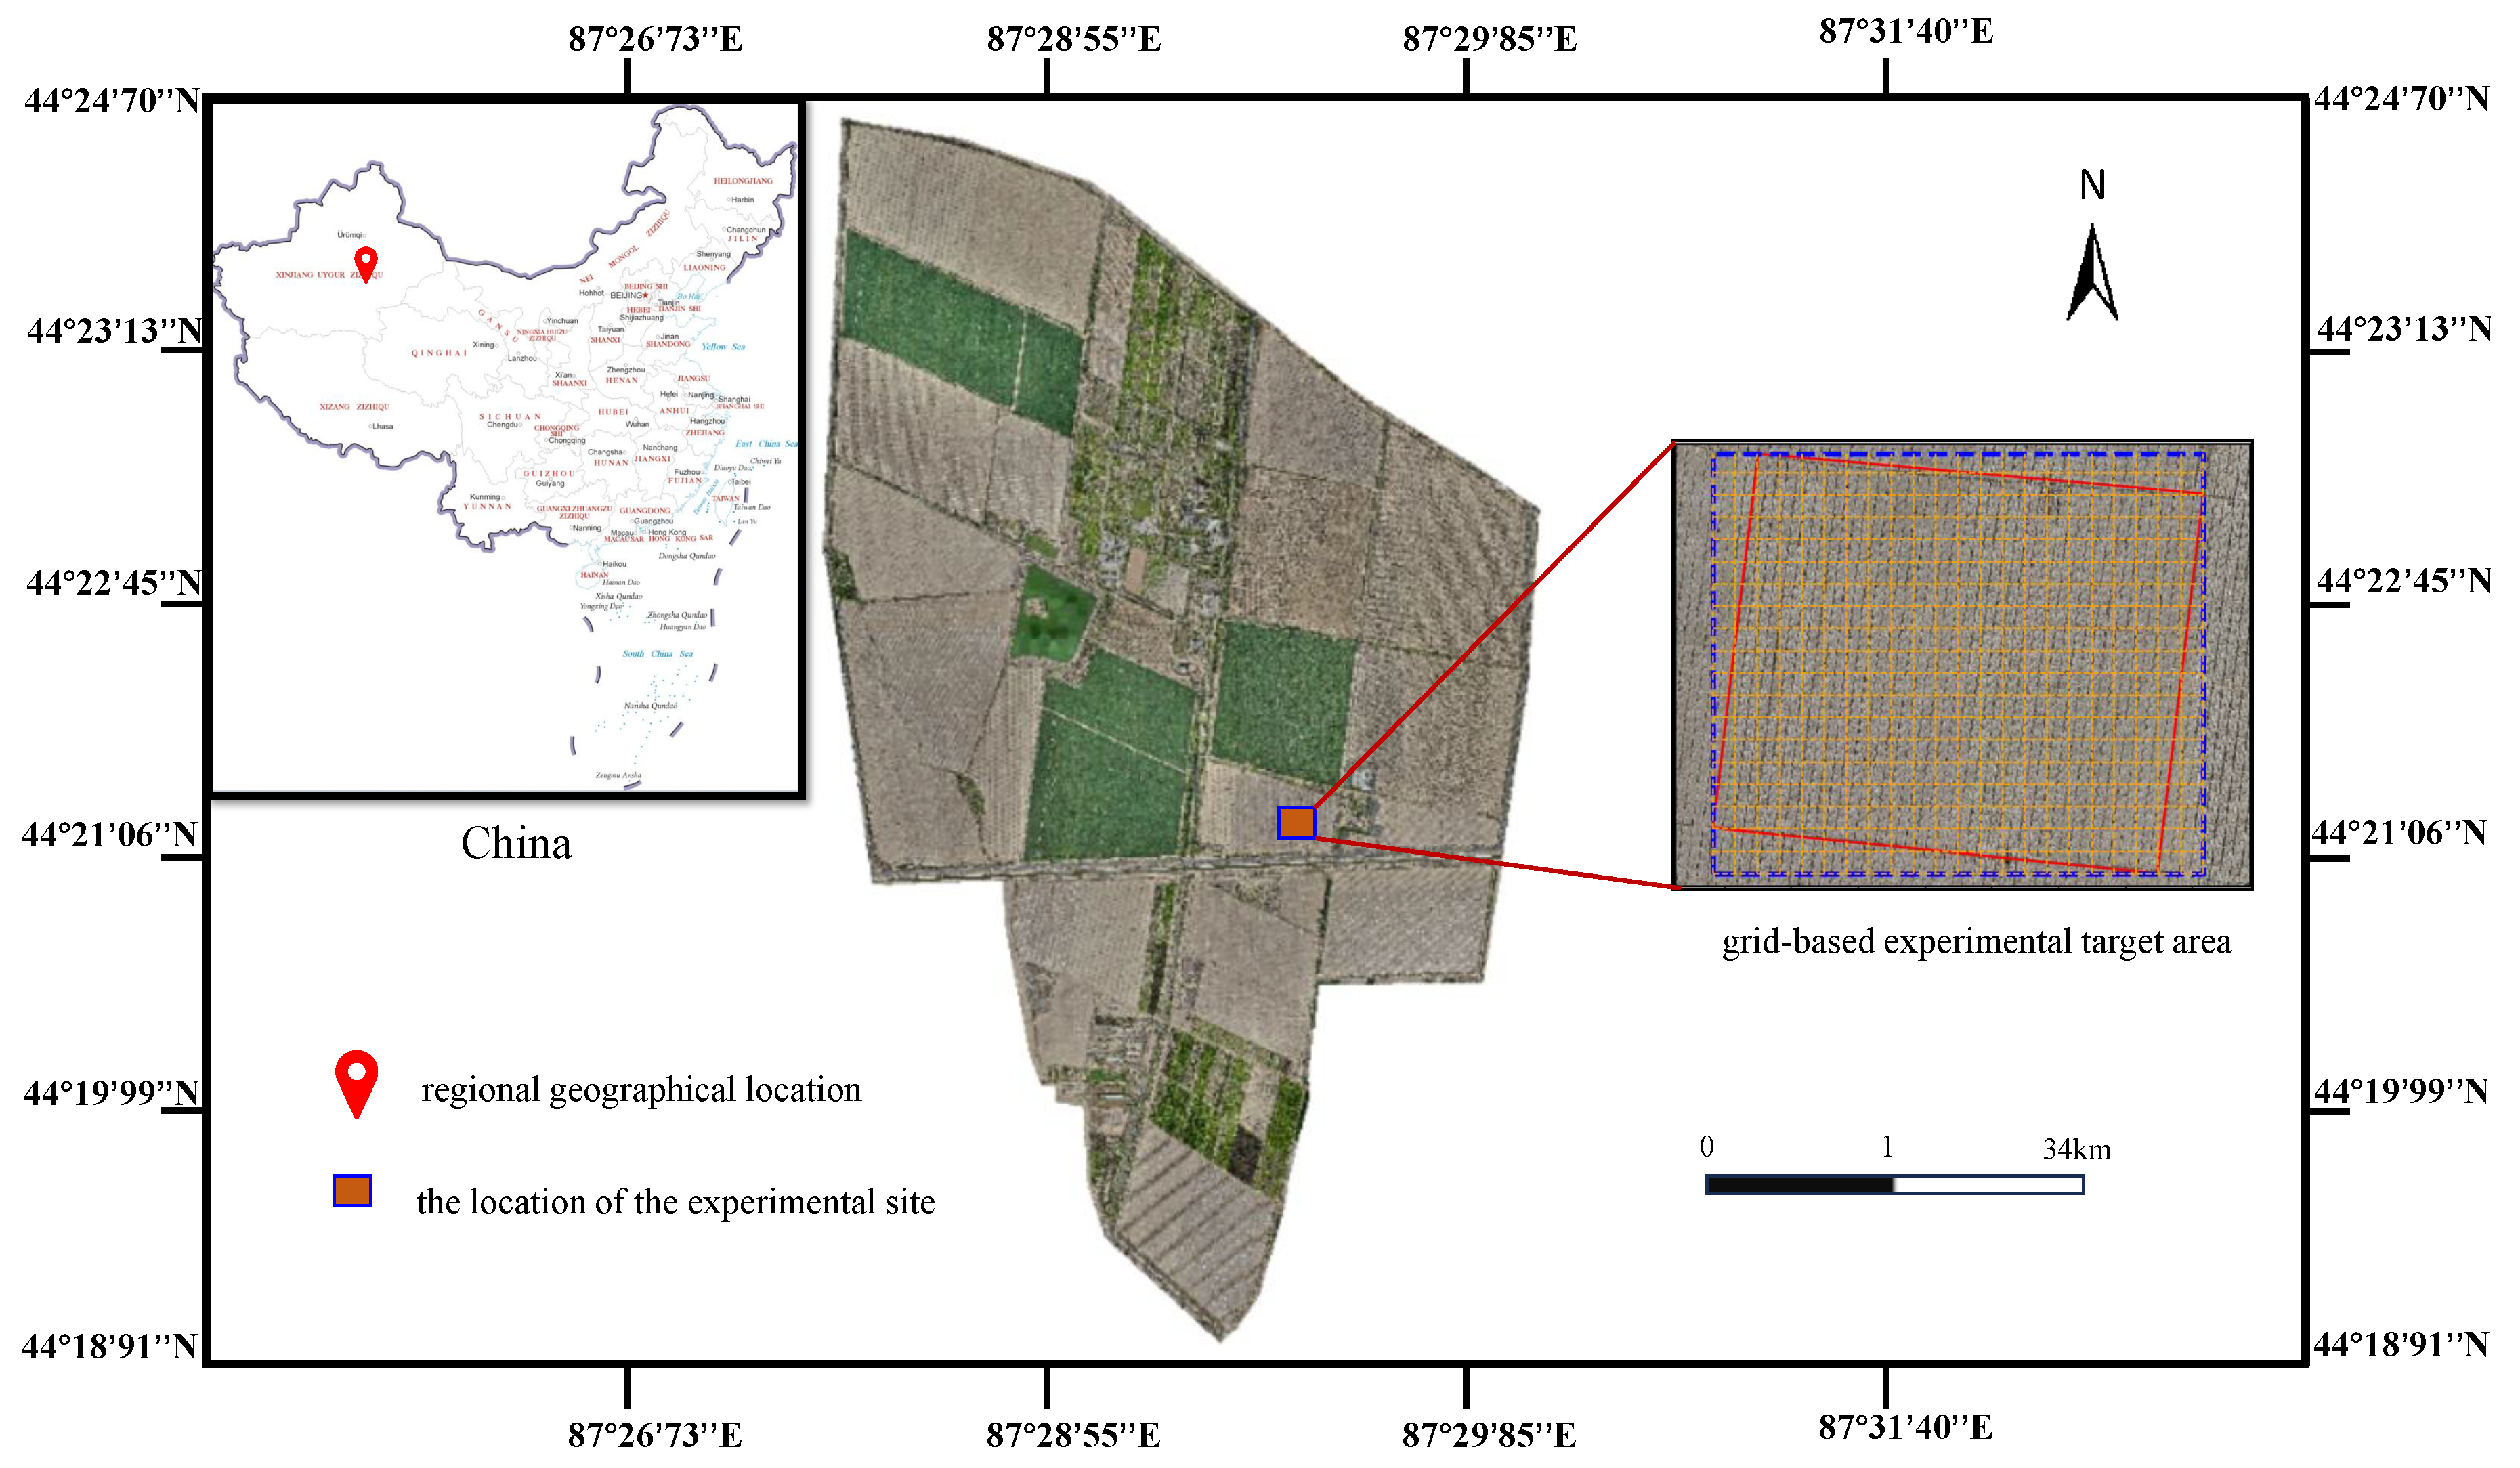
This research was conducted in the Changji region of Xinjiang Uygur Autonomous Region in northwest China. The position is as shown in Figure 1. The experimental site was the Huaxing Farm Experimental Base in Changji City. The region is situated in the northeastern part of Xinjiang, bordered by the northern Tianshan Mountains and the southeastern margin of the Junggar Basin at an elevation of 400 to 570 m above sea level. The latitude and longitude co-ordinates of the experimental site are approximately 87.3 degrees east and 44.2 degrees north, respectively. The experimental site experiences a continental climate with low rainfall throughout the year. The summers are hot and dry, with occasional thunderstorms, while winters receive minimal snowfall. The average annual precipitation is around 190 mm, and the average annual temperature is 6.8 degrees Celsius.
The soil type in the experimental field is light sandy loam soil (50.2% sand, 46.0% silt, and 3.8% clay) with a saturated water content of 0.273 cm 3 /cm 3 in the 0–100 cm soil layer [36]. The soil temperature, humidity, and salinity characteristics of the region are shown in Table 1. The main crops in the Changji region include cotton, watermelon, tomato, and chili pepper. Cotton is one of the primary economic crops in the area and is affected by the arid and rainfall-deficient climate. Drip irrigation is the main method of water supply. Changji is one of the major cotton-producing areas. The cotton variety used in this experiment is “Zhongmian 113”.

2.2. Experimental Design of Field

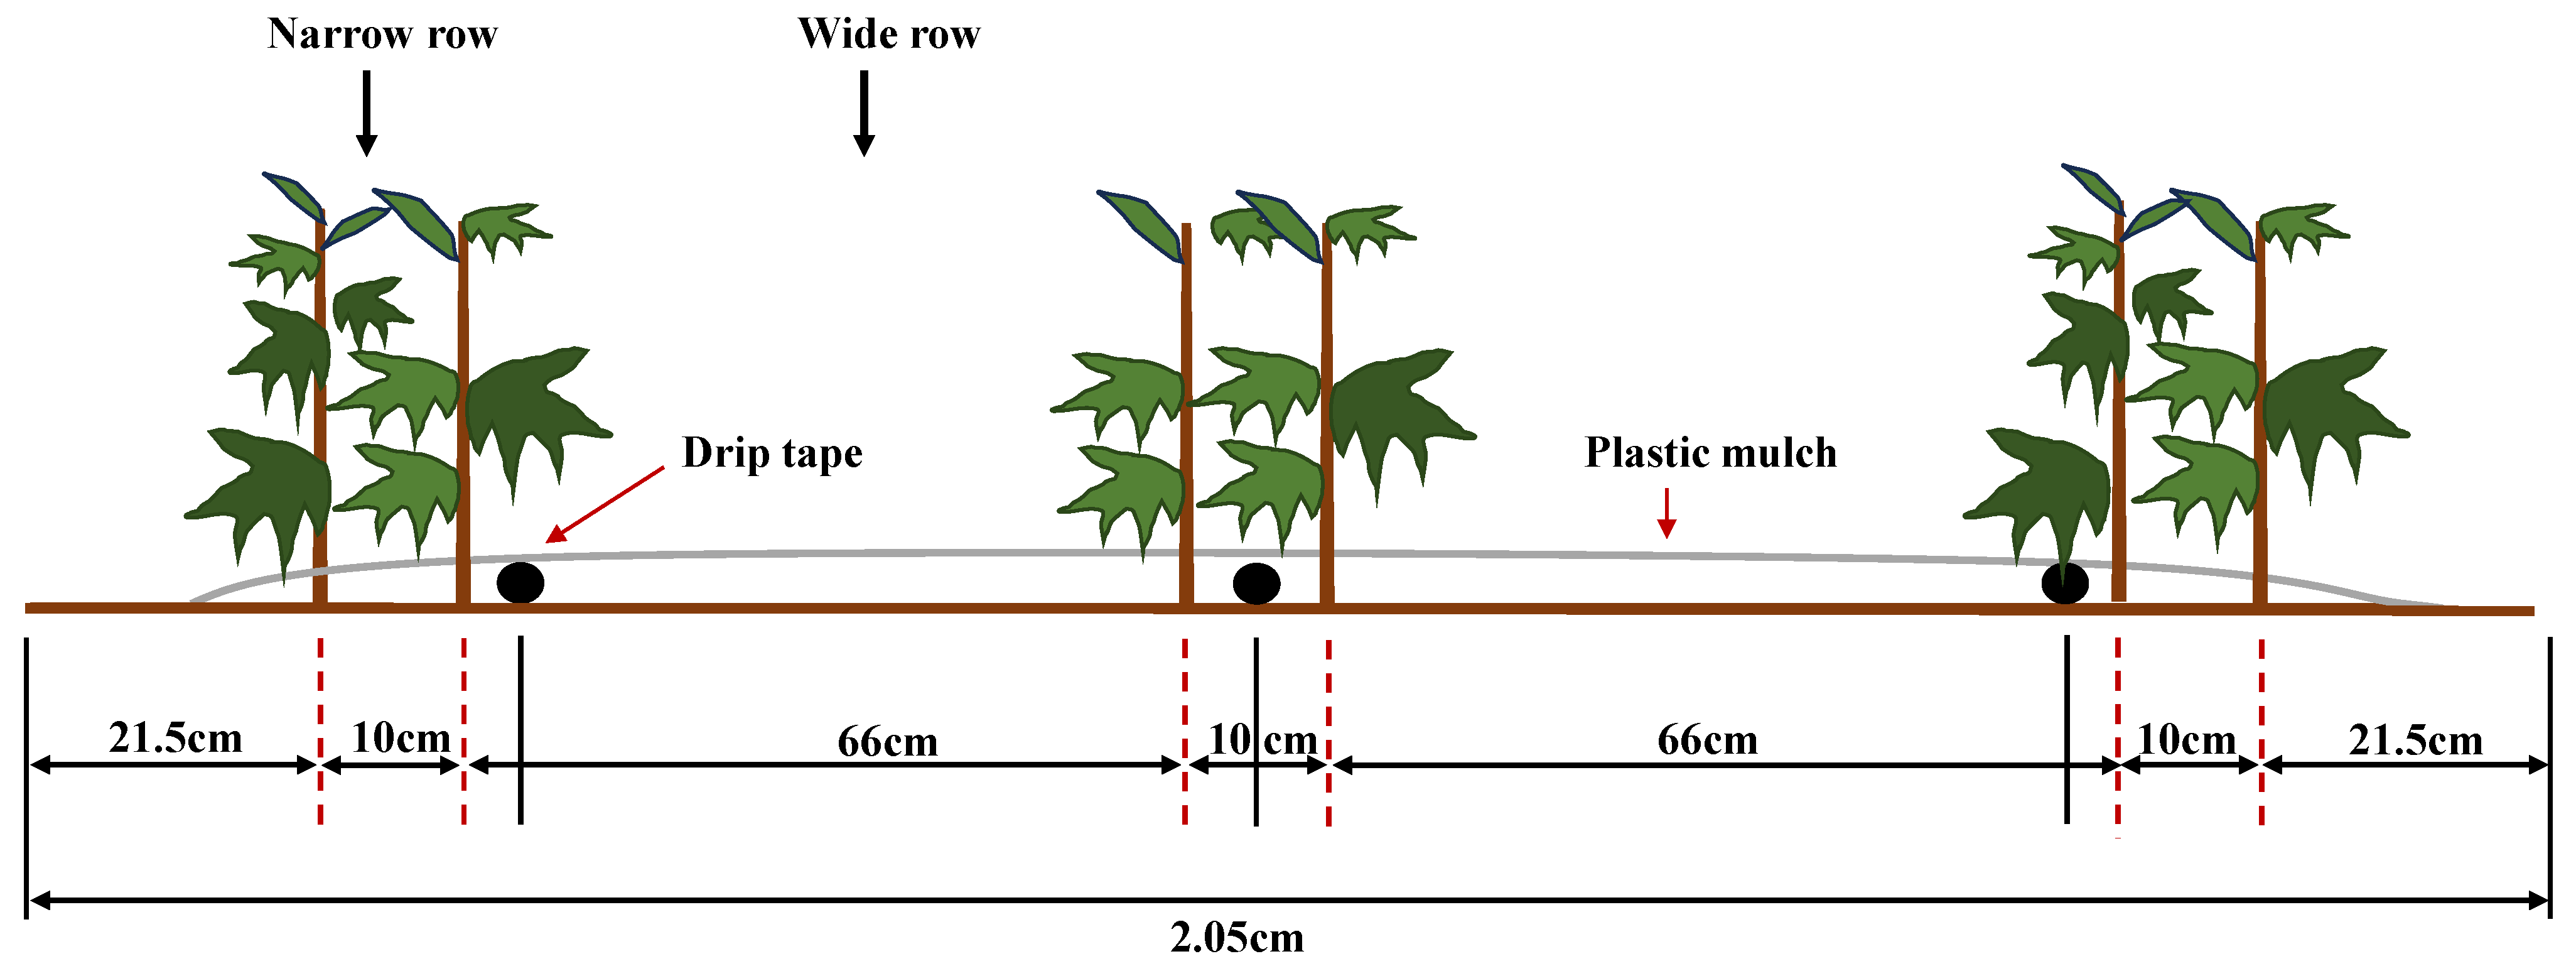
According to the climate and soil conditions in Changji, the region’s main method of cotton cultivation is periodic drip irrigation using drip tapes laid under a plastic film. The water usage of drip irrigation under the plastic film is only about 12% of traditional irrigation methods, significantly reducing water costs in arid areas [37,38,39]. Moreover, applying soluble fertilizers through drip irrigation under the plastic film allows for precise fertilization and improves fertilizer utilization efficiency. However, addressing issues such as drip tape damage, leakage, partial clogging, inadequate pressure, and uneven distribution caused by seepage from lateral pipes is crucial. In this field experiment, a planting method with six rows of cotton seeds was used, with a spacing of 43 cm between the films and three drip lines per film. Each film covered a 2.05 m wide white plastic film strip. The drip tapes used were thin-walled labyrinth drip tapes made of polyethylene resin, with an inner diameter of 16 mm, an emitter spacing of 30 cm, and an emission rate of 2.4 L/h. The cotton plants were distributed on both sides of the drip tapes within the films, as shown in Figure 2. Each film was divided into wide and narrow rows. The two rows of cotton plants in the narrow rows were located on the same side of the drip tape, with a distance of 10 cm between the plants. The wide rows consisted of empty rows with a spacing of 66 cm between the three drip lines, providing sufficient growing space for the cotton plants and maximizing photosynthetic efficiency.
The cotton variety used in the experiment is “Zhongmian 113”. The actual planting density measured during the yield assessment was 18 plants per meter. The experimental area is 35 m × 45 m. The experiment started with machine sowing on 10 April of the same year. Before sowing, basal fertilizer was applied at a depth of 10 cm in the soil. The sowing was conducted using a tractor-mounted “seedling-laying pipe-mulching” piece of equipment for rapid machine sowing. This field experiment aimed to investigate the impact of deficit irrigation on yield. Four irrigation treatments (T0/T1/T2) and one control group were set up, and irrigation was initiated during the seedling stage of cotton growth. As shown in Table 2, different water-deficit treatments were applied at different growth stages to explore the stress tolerance of cotton cultivation in Changji under water-deficit conditions. The Ck group served as the well-irrigated control, with the amount of irrigation based on the ideal irrigation level that ensured good yield in previous years at the local Huaxing experimental base. Compared to the Ck control group, the Tro, Tr1, and Tr2 treatments had water deficits of 10%, 15%, and 25%, respectively, when applied at the same irrigation stages. The Ck* treatment was set as the drought exercise control to investigate whether the initial water deficit during the first irrigation would promote drought tolerance in cotton seedlings. Irrigation was conducted approximately every 7 days, primarily during the seedling, budding, and flowering stages. The amount of irrigation for each stage was controlled based on water meters at the field’s drip tape lateral pipes. The detailed irrigation plan is presented in Table 2.
In order to investigate the impact of different irrigation strategies on yield in the arid environment, the field experiment employed different irrigation treatments with the same fertilization scheme in this study area. The fertilization scheme primarily involved the application of basal fertilizer at a depth of 10–15 cm in the soil before sowing, using diammonium phosphate as the fertilizer. A drip irrigation system was used to apply compound water-soluble fertilizers [40]. The main types of fertilizers used for irrigation were urea (containing 46% N), water-soluble fertilizer 6-25-25 (containing 6% N, 25% P, 25% K), water-soluble fertilizer 12-30-30 (containing 12% N, 30% P, 30% K), and green potassium fertilizer (containing 52% P, 34% K). Calculating the fertilization amounts at different stages determined the N, P, and K ratios for different treatments at different periods, as shown in Table 2. FDEP represents the shallow depth where the drip irrigation emitters are located, which is the depth from which water-soluble fertilizer is discharged from the drip tape emitters. FACD represents the fertilization method, whereas AP004 represents the application of water-soluble fertilizer. The lines in Figure 3 represent different irrigation strategies. The black line represents the fully irrigated treatment, while the light blue line represents the irrigation strategy of Ck* undergoing drought induction during the flowering stage. It is evident that on the 160th day of 2023, drought induction was implemented on the seedlings, and the amount of irrigation at this time was significantly lower than the other irrigation lines. The bar chart in Figure 3 represents the N, P, and K ratios at different periods. Fertilization in this field was carried out in conjunction with irrigation. Hence, the fertilization management schedule aligned with the irrigation plan. The x-axis of the graph represents the number of days in 2023.

2.3. Experimental Design of Drought Exercise Simulation

In the field experiment design, under the same fertilization strategy, five control experiments with different irrigation treatments were set up: Ck, Ck*, Tr0, Tr1, and Tr2. Among them, Tr0, Tr1, and Tr2 were designed to investigate the effect of deficit irrigation on cotton yield. The reference group Ck* was used to explore the actual performance of cotton under drought induction. This study used Ck* as a reference for realistic and effective drought induction and designed the following experiments to find the most suitable drought induction time and corresponding irrigation amount. Based on the fixed timings and irrigation amounts for all irrigation stages except the “first irrigation” node, as shown in Table 3, the same fertilization strategy as in Table 2 was used. The amount of irrigation and timing for the first irrigation were adjusted. The adjustment range for the first irrigation timing was from the 115th day to the 165th day of 2023, with a daily change resulting in 51 first irrigation time nodes. Each time node was assigned seven irrigation gradients: 5, 10, 15, 20, 25, 30, and 35. A total of 357 different irrigation strategies with varying timings and amounts of first irrigation were designed. This was carried out to find the optimal drought induction time and irrigation amount and further analyze the feasible range for the timing of the first irrigation and the minimum amount of first irrigation required to maintain yield without a reduction under drought conditions. In this simulation experiment, the “Zhongmian 113” cotton variety parameters will first be calibrated using historical data from Changji. Then, the calibrated parameters will be validated using actual yield data from the field in 2023, with an acceptable absolute error of less than 10%. This means that based on the calibrated variety parameters, the DSSAT model can accurately simulate the cotton growth process in Changji. Based on this, the accuracy of DSSAT under Changji’s weather and soil data is assumed, allowing for further simulations of drought induction experiments.
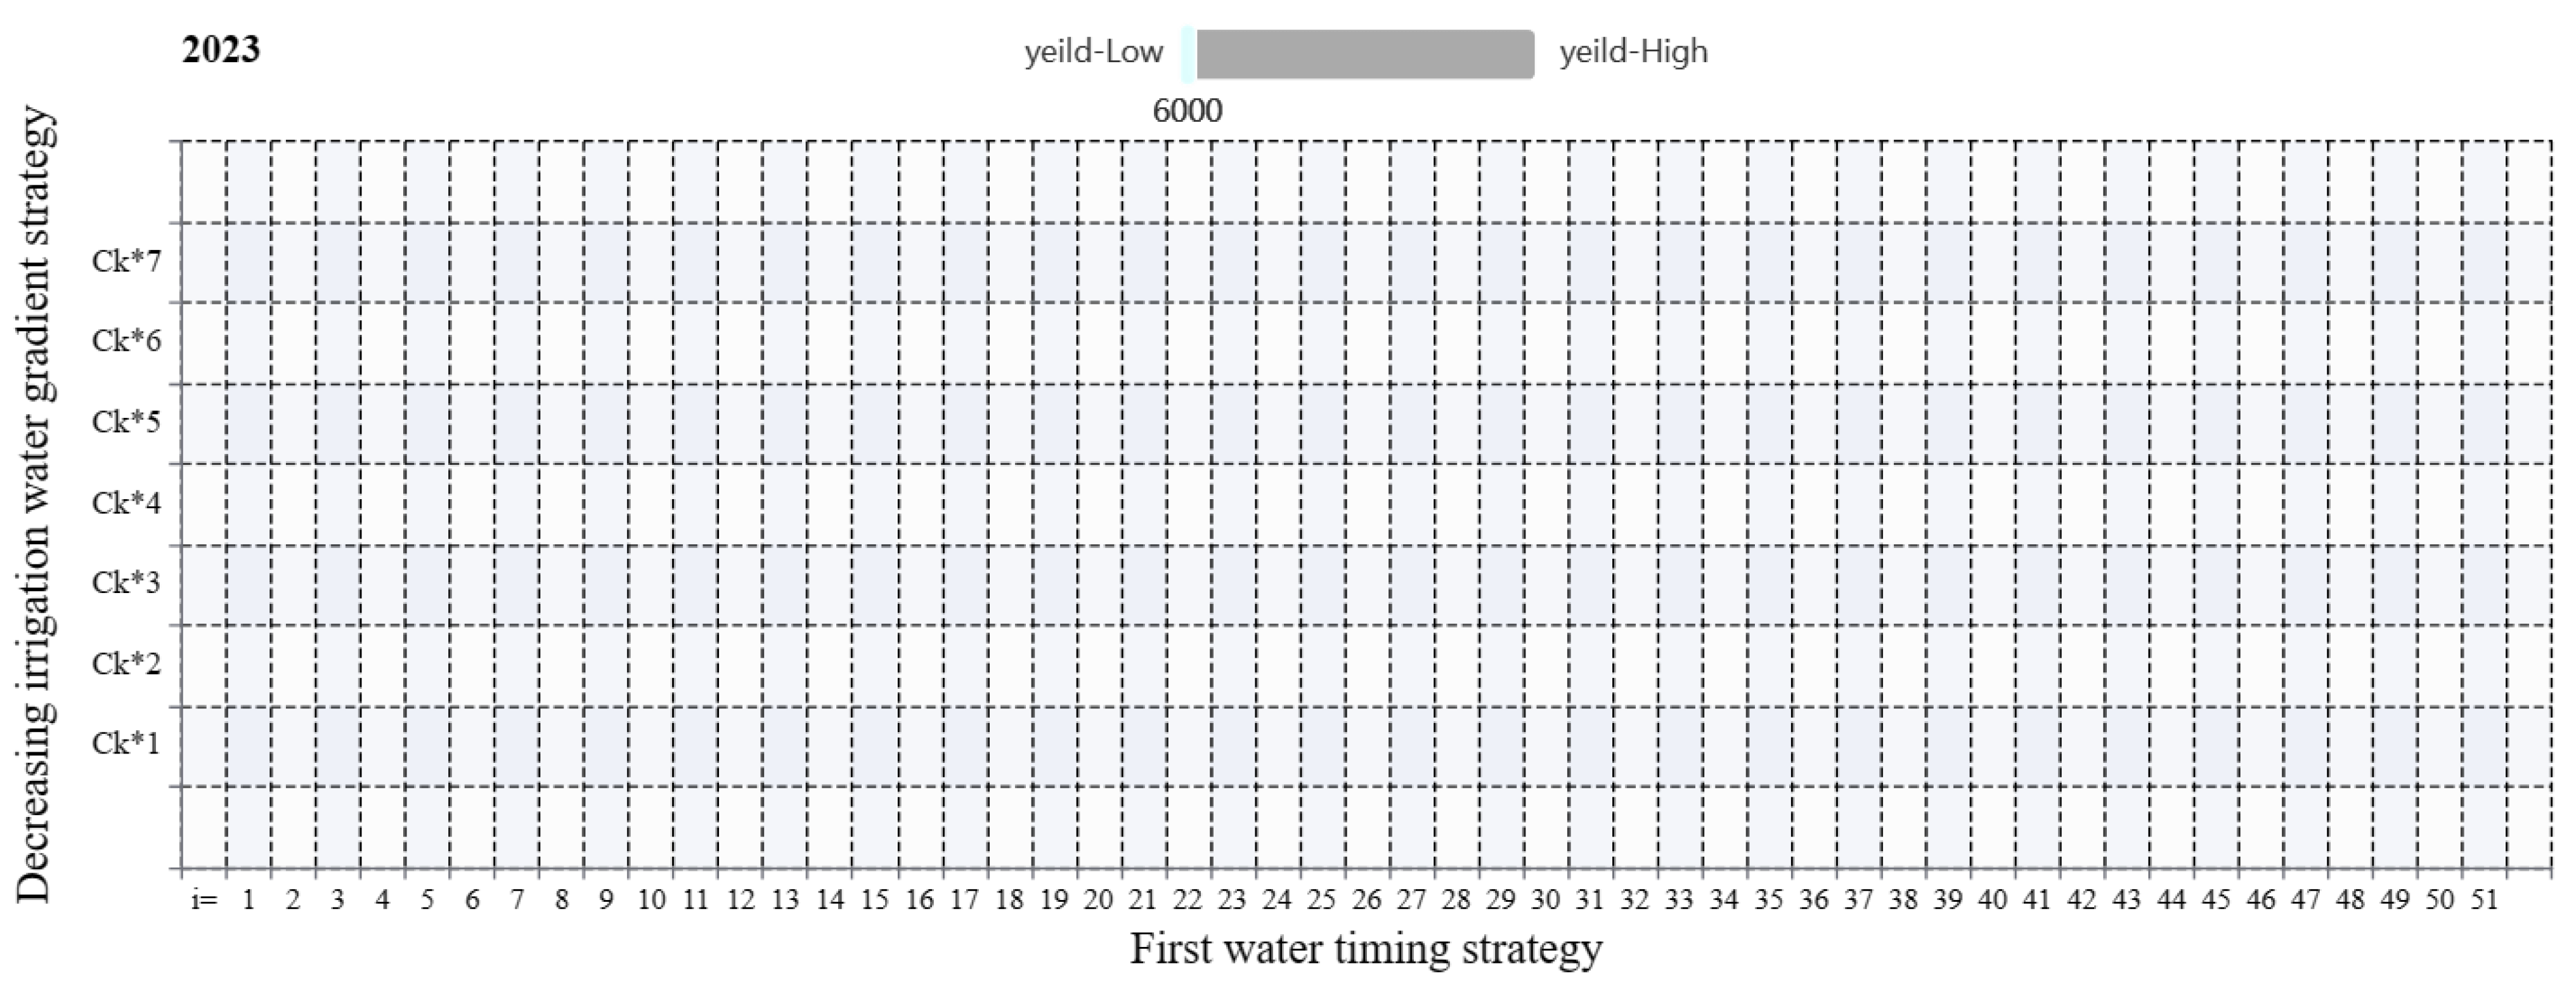
In order to determine the optimal irrigation timing and amount for drought induction in the field experiment, the study calibrated the genetic parameters of the “Zhongmian 113” variety using the Glue parameter calibration module in the crop model. Based on this, the weather and soil data collected from the Changji region were obtained and organized into corresponding soil files (“.SOL”) and weather files (“.WTH”) using code retrieval. The 357 control experiments were structured into a management file (“.COX”), where each experiment represented a different irrigation strategy for determining irrigation amount and timing. The data files had to adhere to the format requirements of the crop model. The “DSSBatch.L48” batch processing file was used to process all the control experiments at once in the Linux system efficiently. Subsequently, the simulated yields for the 357 irrigation strategies were automatically extracted, and a yield filtering range was set. The irrigation timing and amount that met the criteria were traced back. The entire process was automated using Python code. In order to facilitate a more intuitive analysis of the results, the intermediate data were mapped onto the co-ordinate system shown in Figure 4.
In order to visually display the distribution of yields for the 357 different irrigation strategies, this study constructs a Cartesian co-ordinate system, as shown in Figure 4, to create a heatmap of yield distribution. The vertical axis represents the seven irrigation gradients for the first irrigation, denoted as Ck*1, Ck*2, Ck*3, Ck*4, Ck*5, Ck*6, and Ck*7, corresponding to irrigation amounts of 5, 10, 15, 20, 25, 30, and 35, respectively. The horizontal axis represents the first irrigation time Xi, where Xi takes values from the 115th day to the 165th day of 2023 sequentially, resulting in 51 consecutive solar days. This means that when starting from the second irrigation, the first irrigation time nodes progressively advance by 1 day. There are 51 first irrigation times and seven irrigation gradients, resulting in 357 irrigation management strategies used to find the optimal period and amount of irrigation for drought induction.

2.4. Data Collection and Analysis

2.4.1. Meteorological Data

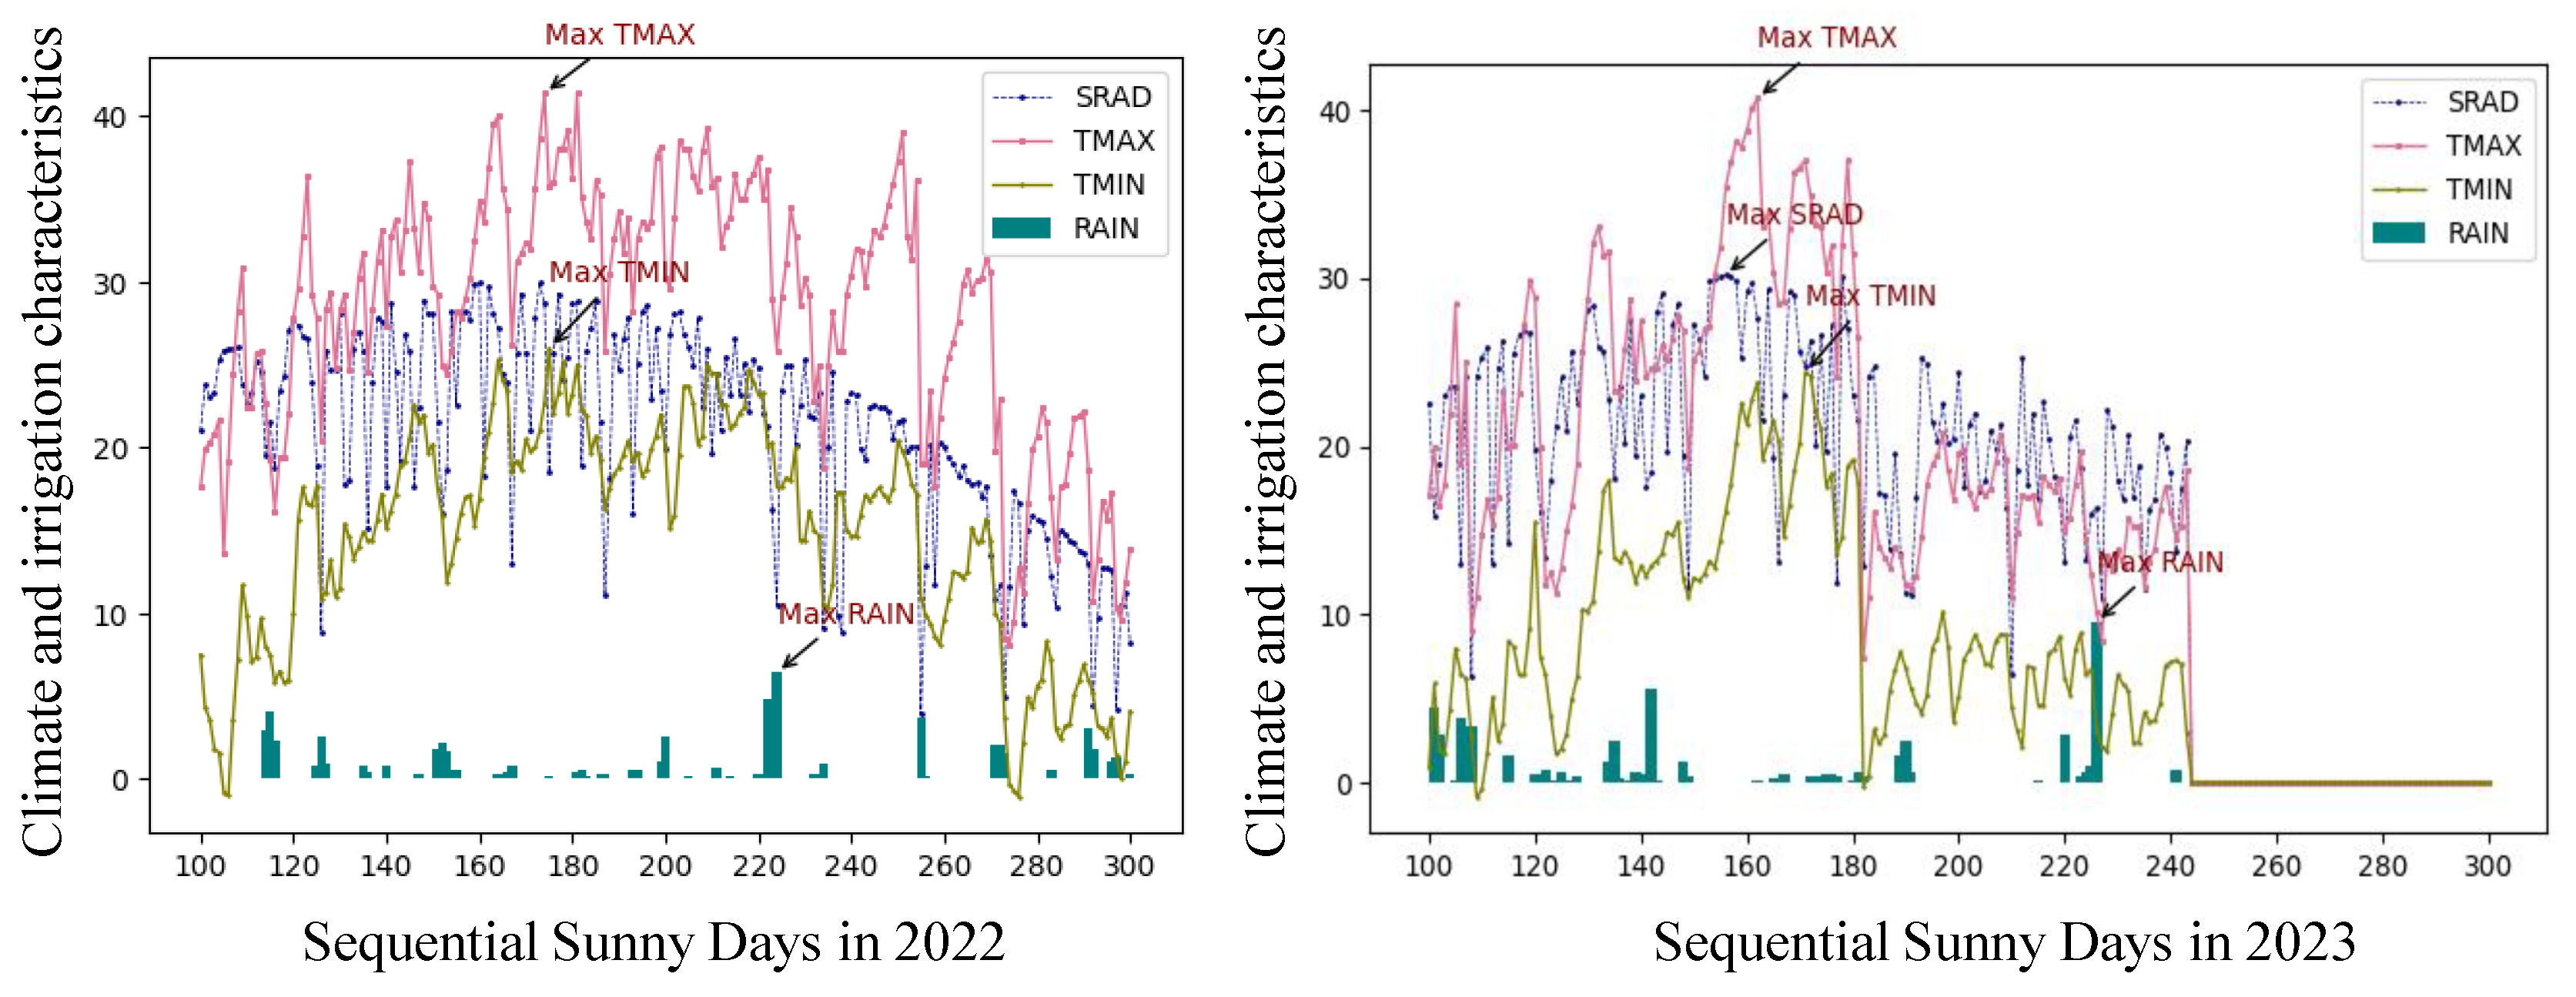
In this study, weather data from the “ECMWF” department with a longitude of 87.2 E and a latitude of 44.3 N were used. The weather data used for yield prediction included rainfall (RAIN), solar radiation (SRAD), maximum temperature (TMAX), and minimum temperature (TMIN) for the entire year of 2022 and up until September 2023. Due to time constraints, weather data for the period after September 2023 were not available. However, the period after September corresponds to the late stage of cotton bolling, and the overall yield has already taken shape by then. In order to ensure the successful operation of the DSSAT-Cotton model, weather data from September and October 2022 were used to fill in the missing data. The experimental weather data were obtained from the nearest meteorological station to the experimental site, with a latitude and longitude of 87.4 E and 43.9 N, respectively, located approximately 34.5 km from the experimental site. The data were collected daily. As shown in Figure 5, the high-temperature range for 2022 and 2023 is distributed from early June to late July. The rainfall is concentrated around early August, with the maximum daily rainfall of 8.13 mm and 9.56 mm for the two years. As indicated by the blue dashed line in Figure 5, the solar radiation for both years consistently decreases from the 160th day onwards, in line with the general growth requirements of cotton in Changji. As the latest available data for the experimental field, these weather data were combined with historical climate data from Changji to serve as input for the DSSAT crop model. The use of weather data from the nearest meteorological station ensured the local calibration and accuracy of the DSSAT model. In this study, we chose to use the DSSAT (Decision Support System for Agrotechnology Transfer) crop model for simulation analysis. DSSAT is a widely applied model in the agricultural field, known for its reliable modeling capabilities and flexibility to accurately simulate key indicators, such as crop growth, development, yield, and water utilization. The selection of the DSSAT crop model for this experiment was based on its established application and the extensive literature supporting its accuracy in simulating cotton and other crops. However, it is important to note that there are other crop simulation models available besides DSSAT. For example, models like APSIM (Agricultural Production Systems Simulator) and CERES (Crop Environment Resource Synthesis) are also widely used in crop research. Nevertheless, the reason for choosing DSSAT in this experiment was its mature application in cotton cultivation and the abundance of literature supporting its simulation results.

2.4.2. Soil Data

The experimental soil data were obtained from the meteorological station’s soil data at NASA GES DISC (https://ldas.gsfc.nasa.gov/gldas/, accessed on 7 January 2023), with the station co-ordinates of 87.3 E and 44.22 N. Five sets of soil data near the co-ordinates of the experimental field were selected, and the average values were calculated to obtain the soil data shown in Table 4. These data were used as a substitute for the soil data at the location of the experimental field and were primarily used for soil input indicators in the DSSAT crop model [41].
According to the data, the location co-ordinates are 87.3 E, 44.22 N. The soil’s Mendelian hue is red, and the soil’s solar reflectance is 0.14. The evaporation limit in the first stage is 7.1. The soil drainage rate is 0.5. The soil’s runoff curve is 76.0. The mineralization coefficient is 1. The land fertility coefficient is 1. The names and units of the indicators shown in Table 4 are as follows (as indicated in Table 5).

2.4.3. Data Collection Methods for Cotton Growth and Yield Measurement

Three points were selected for each irrigation treatment plot during the yield estimation. A total of 15 measurement points were selected for the 5 irrigation treatments in this experiment. The number of mature cotton bolls contained in a 6.67 cm2 plot was measured at each measurement point. The maturity criterion for the cotton bolls was a diameter of greater than 3 cm. The number of cotton plants in the 6.67 cm2 plot was also measured. The average number of bolls and cotton plants for each treatment was calculated based on the three sampling points. These values were then converted into the average number of bolls and cotton plants per hectare for each of the 5 treatments. The yield per acre was determined using the following formula based on the measured sample yield:
y i ¯ = ( n u m ̲ b o l l i α b o l l ̲ w e i g h t i β ) / 1000
In the formula, y i ¯ represents the theoretical yield per mu (kg/mu) of a certain treatment calculated through sample estimation, where i represents the code for different irrigation treatments. n u m ̲ b o l l i represents the estimated number of bolls per mu (unit: bolls/mu) obtained through sample estimation. b o l l ̲ w e i g h t i represents the average boll weight (unit: g) measured at different measurement points. α and β are the boll number and weight correction coefficients, respectively. In this experiment, the boll number correction coefficient is taken as 0.95, and the boll weight correction coefficient is determined based on the results of the variety approval announcement, ranging from 5 to 5.5 g. Additionally, the data obtained from Table 6 measurements will be organized and used for the observation file (A-file) in the DSSAT model [42].

2.5. Model Development

2.5.1. Crop Simulation Using CROPGRO Model for Potential Yield Estimation

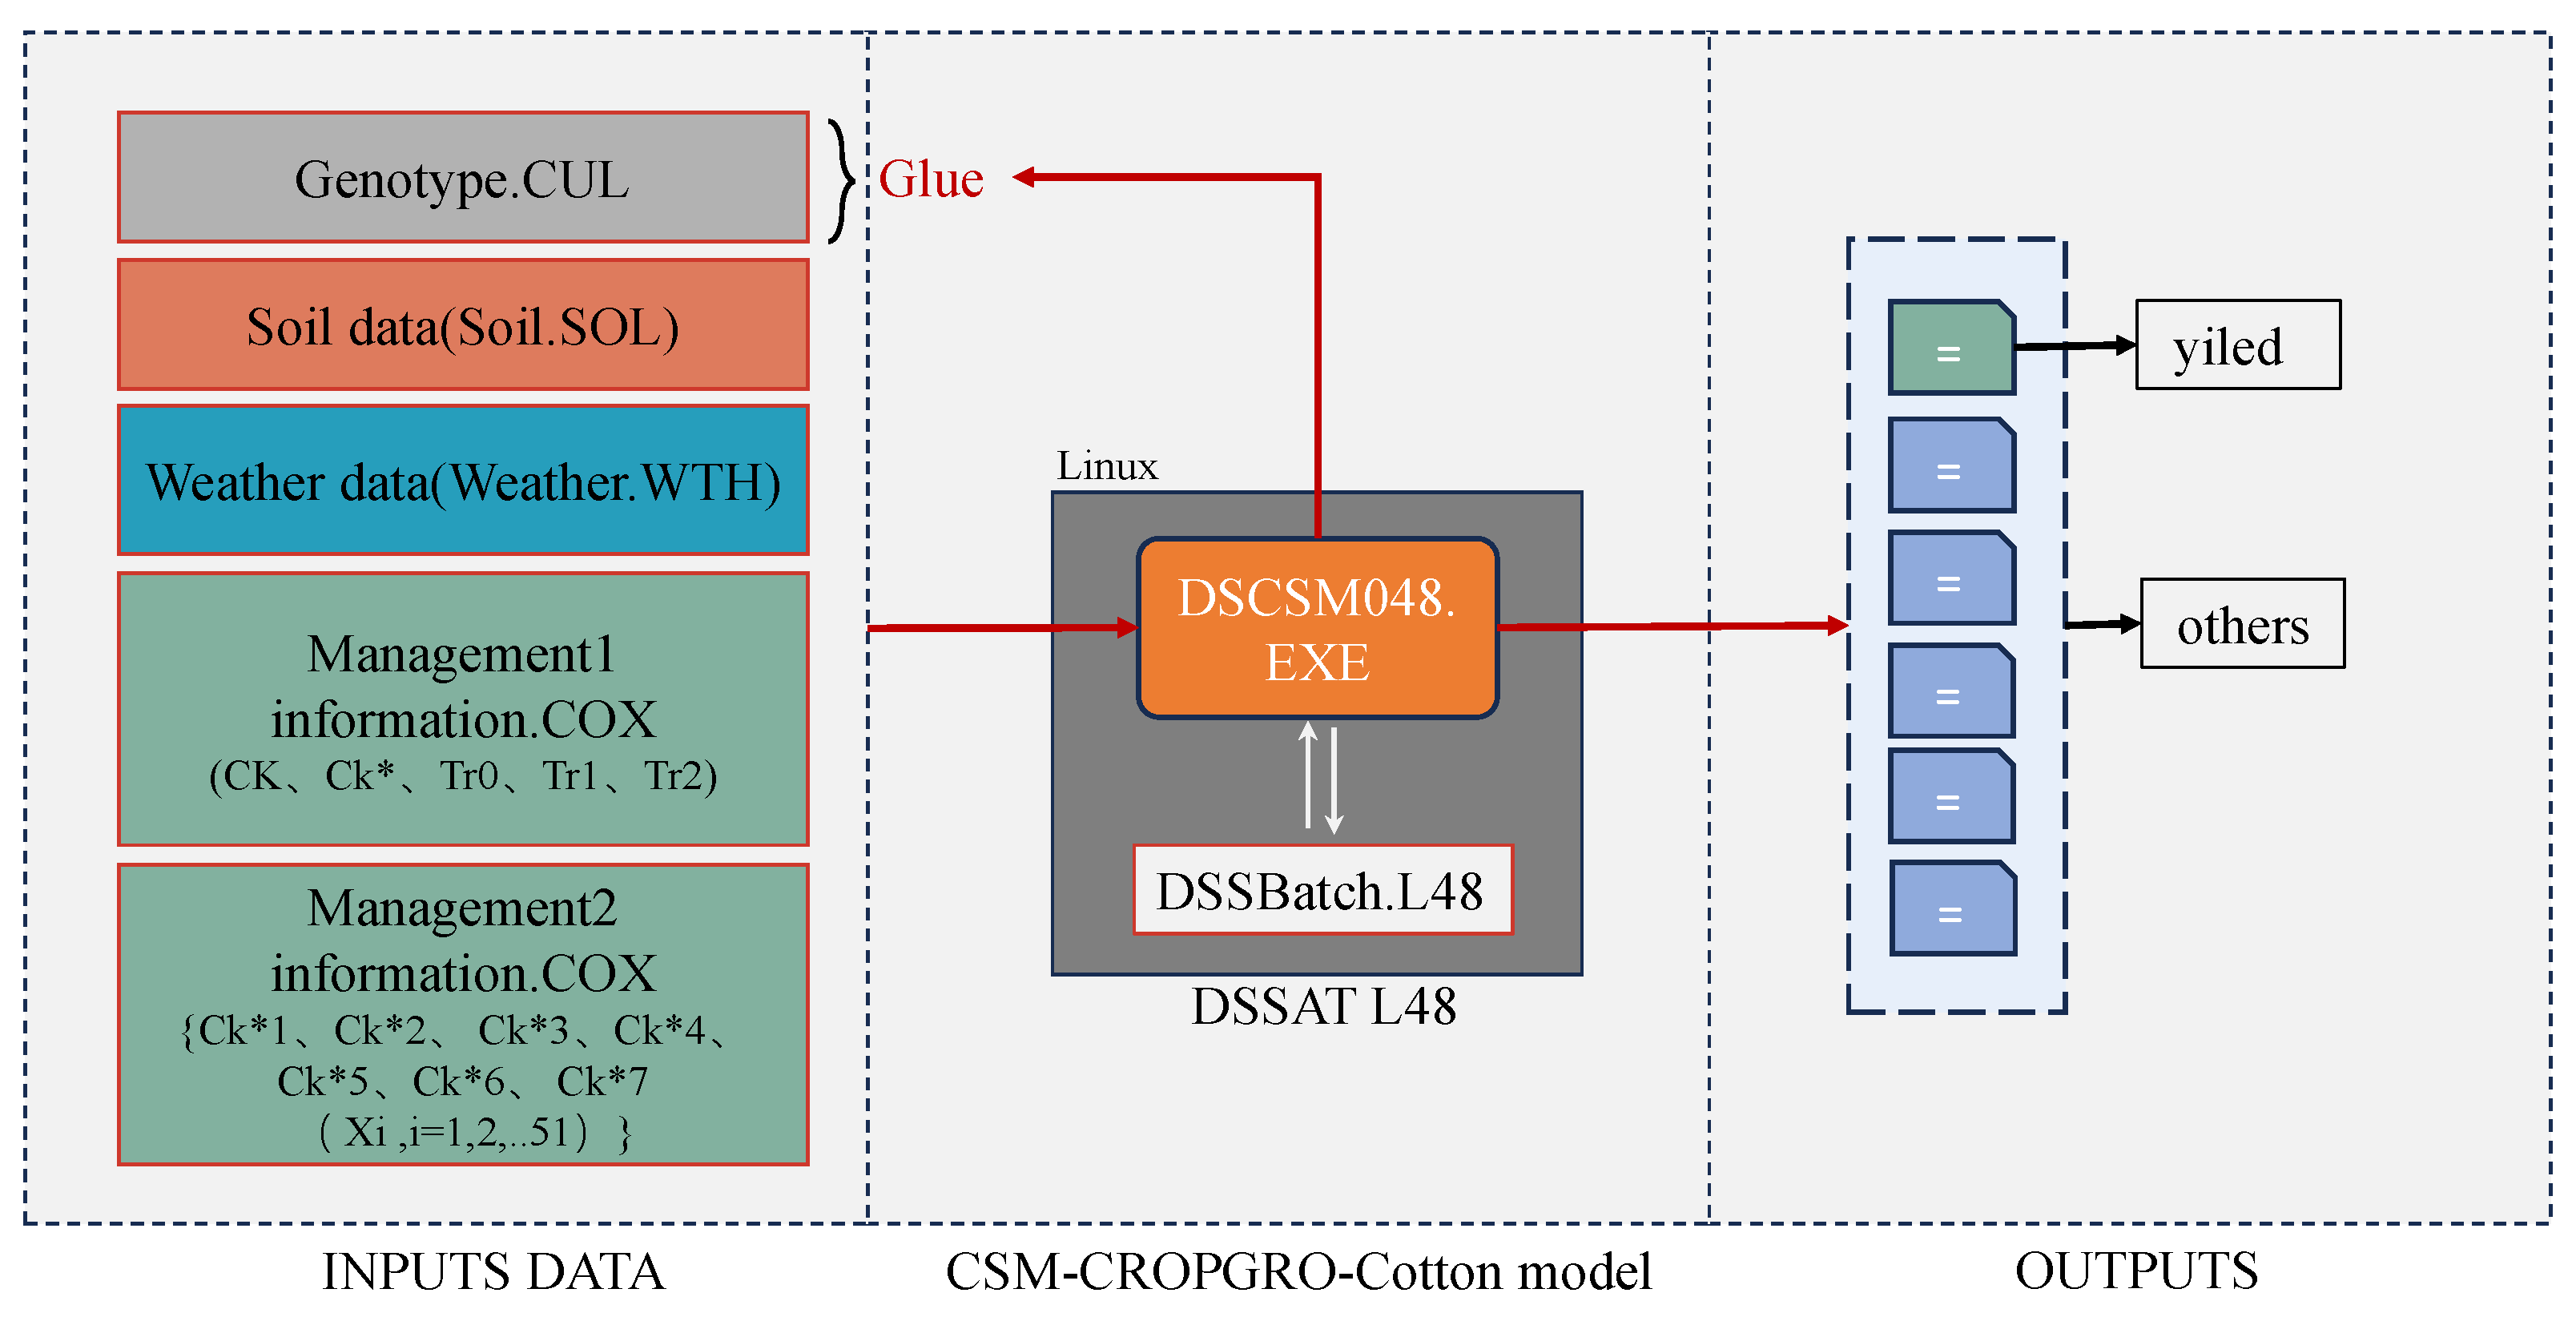
DSSAT is a highly influential computer application used in agricultural decision-making. It combines crop, soil, and weather information in a standard format and allows for crop modeling and the prediction of production indicators by modifying management files [41]. Through the DSSAT program, researchers can simulate the results of various crop cultivation techniques over multiple years in different regions, making it an ideal choice for crop growth analysis. DSSAT is based on the CROPGRO model, which accepts specific input parameters and generates output results regarding crop growth, yield, and other related variables. The input-output principle of this model is illustrated in Figure 6.
This study utilized the CSM-CROPGRO-Cotton model within the Linux-based DSSAT L4.8 software. The CSM-CROPGRO-Cotton model was employed to simulate the daily growth and development of cotton crops in Changji. The inputs for the CSM-CROPGRO-Cotton model include variety coefficients, daily weather data, soil data for different layers, and management information, such as irrigation and fertilization practices [43,44,45,46,47]. DSSAT is a one-dimensional model that calculates the daily variation in soil moisture content through soil evaporation, infiltration, unsaturated flow, irrigation, vertical drainage, root water uptake, and plant transpiration [47]. In addition to considering crop coefficients, which are assumed to vary minimally or conservatively among crop varieties, the model requires variety coefficients as specific input parameters representing variety-specific traits. These data are stored in the “cotton.cul” file within the Genotype component. The genetic coefficients for the varieties were calibrated using the Glue program based on scattered historical phenological data from Changji [48]. The model effectively captures the influence of external environmental factors on cotton growth and development, and the experimental results demonstrate its suitability for predicting cotton yield in Changji.
In this study, 357 sets of irrigation strategies were simulated for cotton using LINUX crop model batch-processing techniques. These techniques ensured the excellent stability and reliability of the DSSAT crop model when running on the Linux operating system, which is particularly important when dealing with a workload exceeding the experimental scenarios of this paper. Moreover, when handling larger volumes of tasks, this technology exhibits higher program responsiveness during multi-tasking processing. Additionally, in order to meet the intelligent decision-making requirements in similar smart agriculture scenarios, there are practical applications for facilitating computational interactions between other algorithm programs of intelligent systems and the DSSAT crop model.

2.5.2. Calibration of Genetic Coefficients for the Model

In this study, the DSCSM048.exe program was invoked on a Linux system, and a batch-processing file named DSSBatch.L48 was constructed. The yield and leaf area index of five field experiments were first validated using calibrated genetic parameters. The genetic parameters for the variety “Zhongmian113” obtained from the Glue program are described in Table 7. The normalized root mean square error ( n R M S E ) between the observed and simulated yields was found to be 13.9%, indicating that the model is reasonably accurate and can be used to simulate management practices for cotton crops in Changji. This study considers the calibrated model suitable for accurately predicting cotton yield in Changji. Based on this, 357 different irrigation experiments were simulated and analyzed to determine the optimal drought-hardening period and the corresponding amount of irrigation under the arid conditions of this experimental site.
Before exploring the optimal first irrigation timing and amount of irrigation for the drought hardening of cotton crops in Changji, it is necessary to assess the accuracy of the calibrated CSM-CROPGRO-Cotton model through simulation. The basic approach involves comparing the simulated values with the actual measurements from the year 2023 using statistical methods. The main statistical metrics used for evaluation are the root mean square error ( R M S E ), normalized root mean square error ( n R M S E ), absolute error ( A E ), absolute relative error ( A R E ), coefficient of determination ( r 2 ), and the index of agreement (d). In this study, the performance of the DSSAT model was evaluated by using the above metrics for aboveground cotton yield and leaf area index ( L A I ), based on measurements from fields planted with “ Zhongmian 113” in April 2023 and harvested in October 2023 [49]. The evaluation metrics were calculated using the following formulas.
A R E = 1 n i = 1 n s i o i o i 100 %
R N S E = 1 n i = 1 n ( s i o i ) 2
r 2 = ( i = 1 n ( o i o ¯ ) ( s i s ¯ ) i = 1 n ( o i o ¯ ) 2 i = 1 n ( s i s ¯ ) 2 ) 2
d = 1 i = 1 n ( s i o i ) 2 i = 1 n ( ( s i o ¯ ) + ( o i o ¯ ) ) 2
In the above formulas, n represents the number of observations, s i represents the simulated values from the DSSAT model, o i represents the actual observed values from field experiments with deficit irrigation, and o ¯ represents the mean of the observed values. A R E stands for absolute relative error, which measures the average relative difference between the observed values and the model or estimation values, indicating the average proportion of the model’s prediction error relative to the observed values. R M S E represents the root mean square error, which measures the average difference between the observed values and the model or estimation values, indicating the standard deviation of the model’s prediction error. n R M S E is the normalized root mean square error, which is used to compare the model fitting error of datasets with different scales or ranges. It normalizes the R M S E value with respect to the data range, making comparisons between different datasets more comparable.
A lower n R M S E indicates a better predictive accuracy of the model. When validating the CSM-CROPGRO-Cotton model, n R M S E can be used to assess the model’s accuracy in predicting yield and LAI. A lower n R M S E value suggests that the model has good robustness in predicting these indicators. The coefficient of determination, denoted as r 2 , measures the degree of linear relationship between the model and observed data. A higher r 2 value indicates a better fit of the model to the yield and LAI data. In the CSM-CROPGRO-Cotton model, r 2 is used to evaluate the model’s explanatory power for yield and LAI, where a higher value signifies a better ability to explain and fit the observed data. The index of agreement, represented by d, measures the consistency between the model’s predictions and observed data, taking into account both the bias and variability of the predictions. In the CSM-CROPGRO-Cotton model, the index of agreement is used to assess the model’s consistency in predicting yield and LAI. A higher value indicates that the model can generate stable and consistent predictions, demonstrating good robustness. When d > 0.65, it indicates a good simulation performance, and when r 2 > 0.5 , the results can be considered acceptable. For n R M S E , values greater than 10% are considered good, values between 20% and 30% indicate moderate model performance, and values above 30% are considered poor [43].

3. Results and Discussion

3.1. Yield and LAI Simulation Results and Analysis

Before conducting the simulated experiments for drought hardening, it was necessary to validate the accuracy of the DSSAT model. This study performed a calibration of the genetic parameters using historical data from Changji. Then, it used the yield and leaf area index ( L A I ) data from 2023 to verify the accuracy of the model [50]. The yield of the five field experiments under deficit irrigation was measured through sampling on October 1st, and the simulated yields for different treatments were obtained using the calibrated DSSAT model. The measured and simulated yields per mu for different treatments are shown in Table 8. The observed LAI values for the five field experiments were collected and calculated at different time points from July to August, and the simulated values were obtained from the DSSAT simulation. Table 9 presents the LAI data for different strategies. Figure 7 and Figure 8 show the trends of LAI during the cotton growth process for treatment Ck and treatment Ck*, respectively. It can be observed from Figure 8 that the trend in LAI closely matches the observed LAI data.
Based on the above data, the calculated R M S E for yield is 208, n R M S E is 0.139, A R E is 0.029, r 2 is 0.856, and d is 0.0616. The results, with n R M S E > 10 % , r 2 > 85 % , and d > 60 % , indicate that the model simulation results are good. Similarly, the values of d for the simulated and observed leaf area index (LAI) for several experiments are greater than 65%, and r 2 is greater than 80%. The values of n R M S E , r 2 , and d demonstrate good robustness when validating the CSM-CROPGRO-Cotton model, indicating its suitability for cotton simulation experiments. Therefore, it can be concluded that the DSSAT model with calibrated parameters can be used for yield prediction in the Huaxing area of Changji.
The yield trend analysis in Figure 7 reveals that the difference between treatments Ck and Ck* lies in reducing the amount of irrigation of the first water in Ck* while advancing the timing of the first irrigation to the early stage of the seedling period. However, the results are astonishing: despite significantly reducing the amount of irrigation of the first water and irrigating the cotton earlier, the yield remains close to that of the higher irrigation amount without advancing the timing of the first irrigation. This pattern has significant implications for water-saving benefits in arid and water-deficient regions.
Through monitoring the growth and final yield performance of the seedlings in real field experiments, we found that cotton plants exhibit a resilience to mild drought during the seedling stage. By observing the control experiments in the field, it was determined that when seedlings undergo continuous growth under drought conditions within a certain duration, their yield does not suffer significant damage. However, if the seedlings experience prolonged or more severe drought stress, their growth and yield are significantly negatively affected.

3.2. Simulation Results and Analysis of Drought Hardening

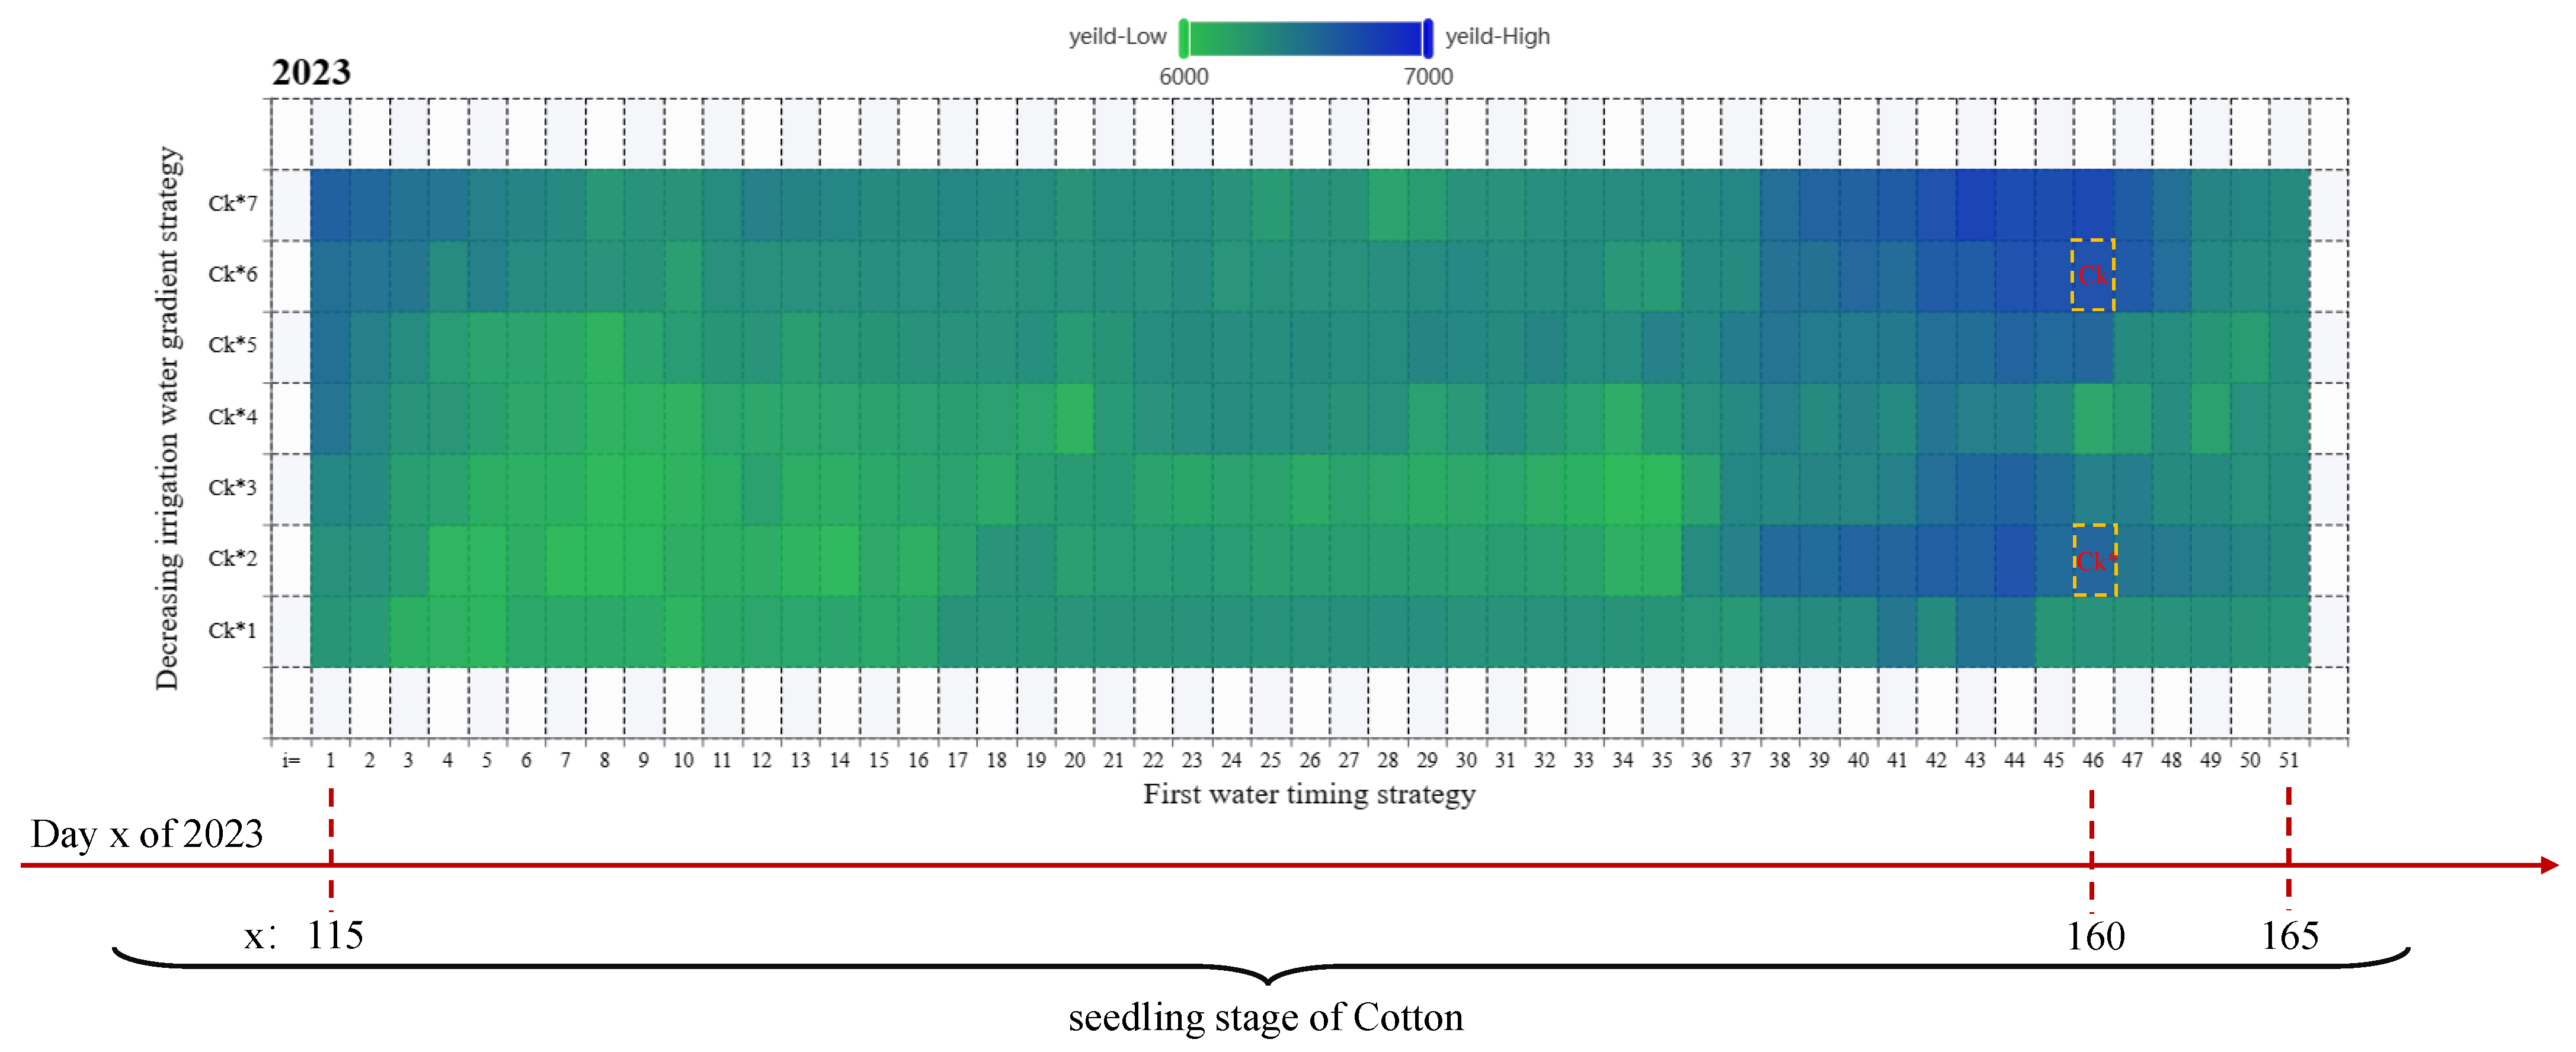
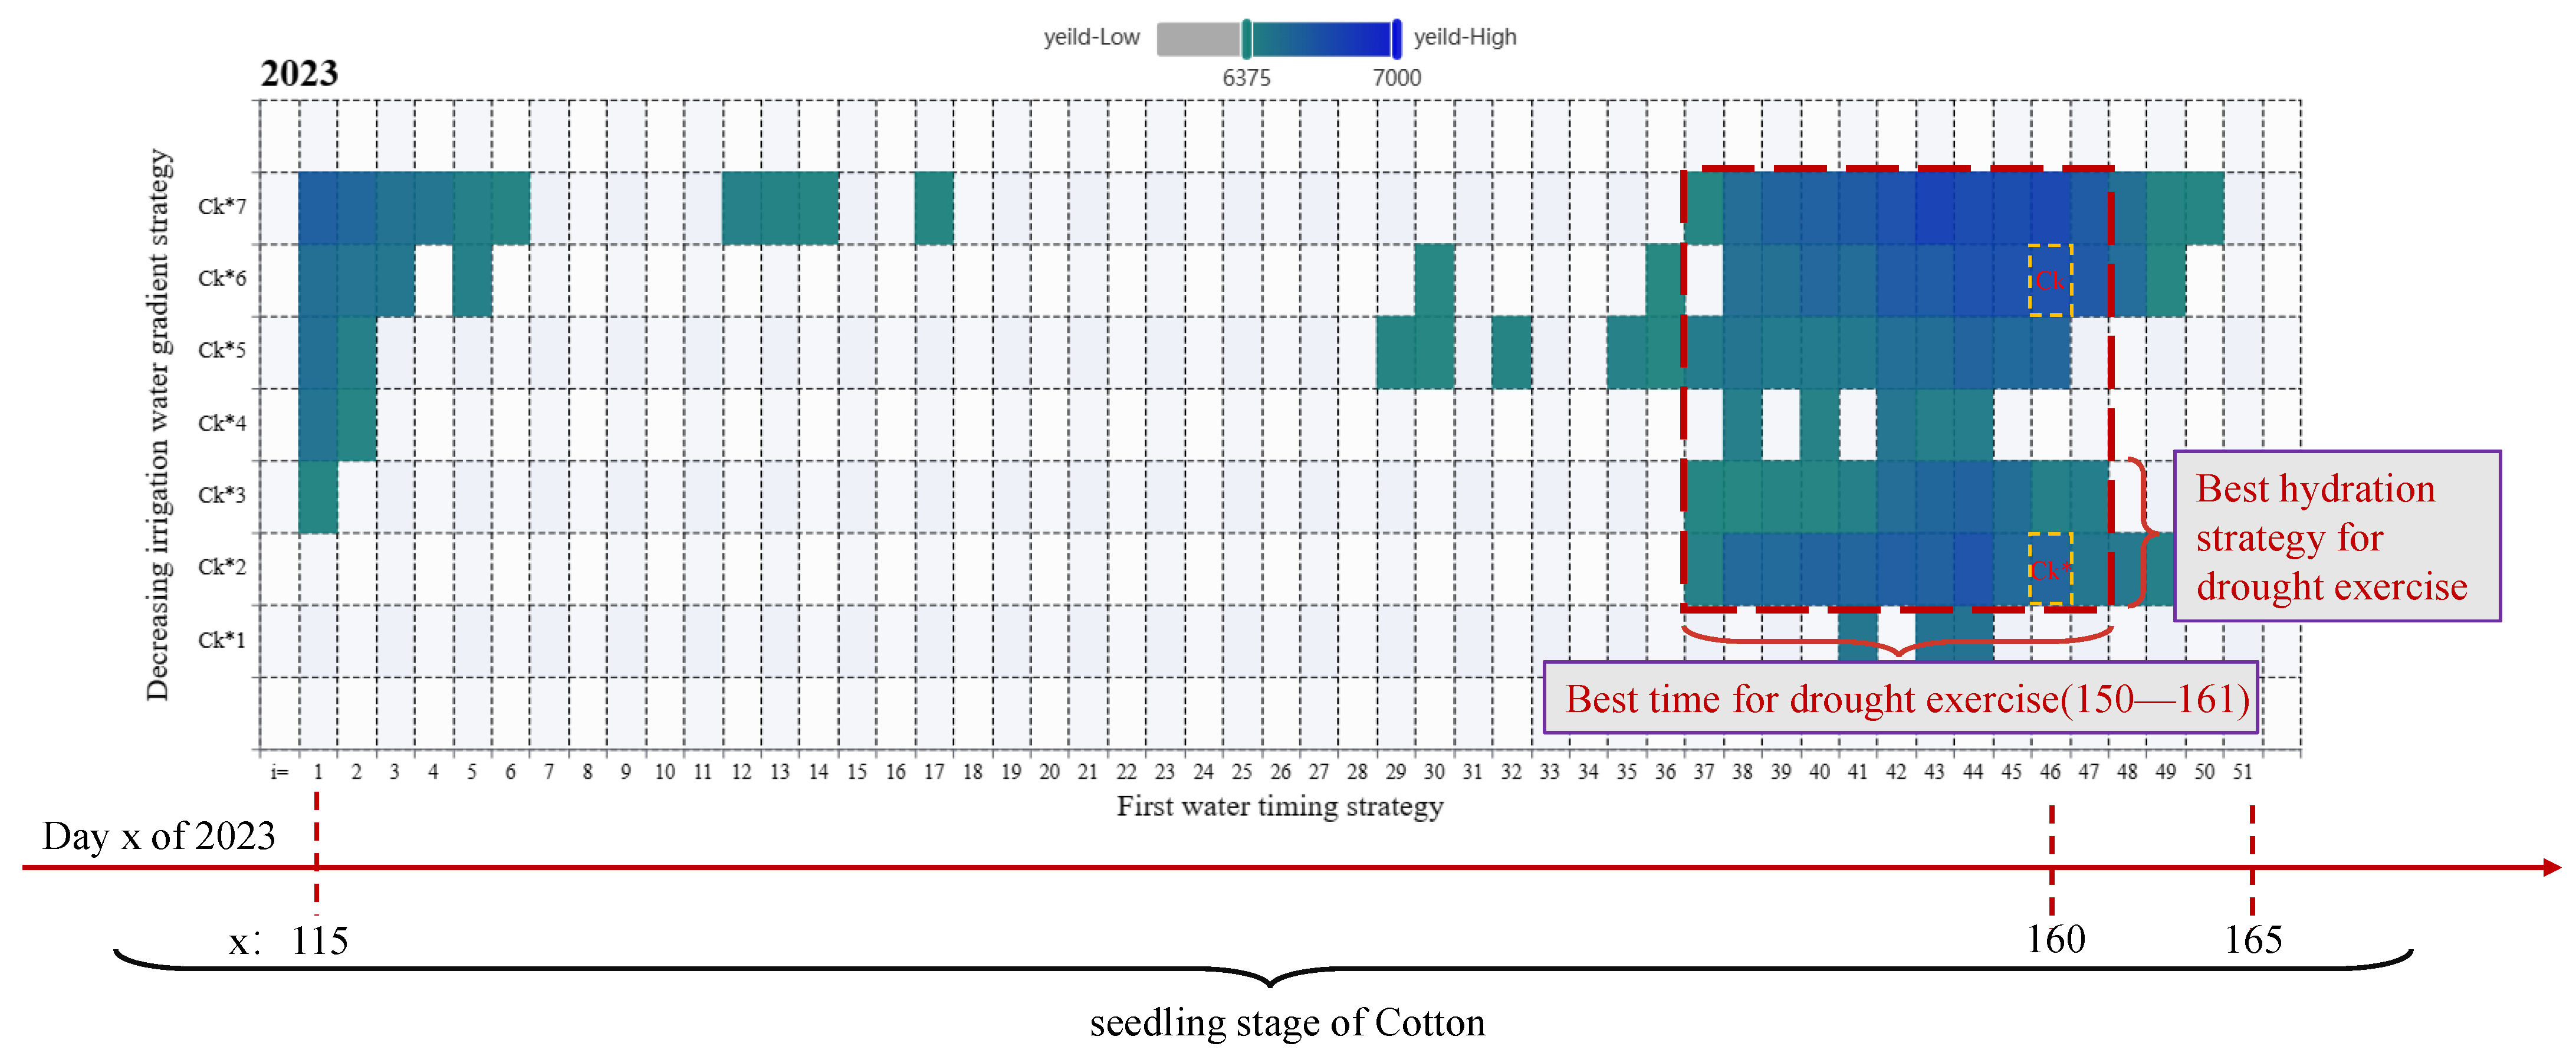
The yield trend analysis in the field experiments found that reducing the amount of irrigation of the first water can provide cotton with a certain stress-tolerance effect. This indicates that appropriate drought hardening can be helpful for water-saving and yield protection in cotton. In order to further explore the patterns of drought hardening, this study conducted the simulation and modeling of 357 irrigation strategies according to the experimental design in Section 2.3. The simulated yields were represented using a heatmap distribution in a constructed Cartesian co-ordinate system. The vertical axis represents seven different irrigation treatments: Ck*1, Ck*2, Ck*3, Ck*4, Ck*5, Ck*6, and Ck*7, with detailed data shown in Table 3. The horizontal axis represents the selectable time series for the first water irrigation, ranging from the 115th day to the 165th day of 2023, covering the entire cotton seedling growth stage. The grid formed by the intersection of the vertical and horizontal axes represents different combinations of irrigation strategies, totaling 357. The study used a calibrated crop model to simulate the 357 strategies, resulting in 357 different simulated yields. The corresponding yield values were mapped using colors ranging from light to dark, as shown in Figure 9. The strategy represented by the orange dashed box corresponds to Ck and Ck*, with similar yields.
In this study, we conducted a combination of real field experiments and simulation experiments to investigate the response and adaptability of cotton plants to drought stress during the seedling stage. The real field experiments, which were based on monitoring the growth and final yield performance of the seedlings, revealed that cotton plants exhibit resilience to mild drought during the seedling stage. On the other hand, the results of the simulation experiments indicated that cotton seedlings can generally maintain normal growth and yield under mild water deficiency conditions. In the simulation experiments involving 357 irrigation strategies, gradually reducing the amount of irrigation could guide the plants to adapt to water scarcity. By gradually decreasing the amount of irrigation, we allowed the plants to gradually adapt to a lower water supply over a period of time, thereby enhancing their drought tolerance. Additionally, we simulated different water supply conditions under drought by adjusting the irrigation interval. Ultimately, we found that longer irrigation intervals can improve the plants’ adaptability to drought stress.
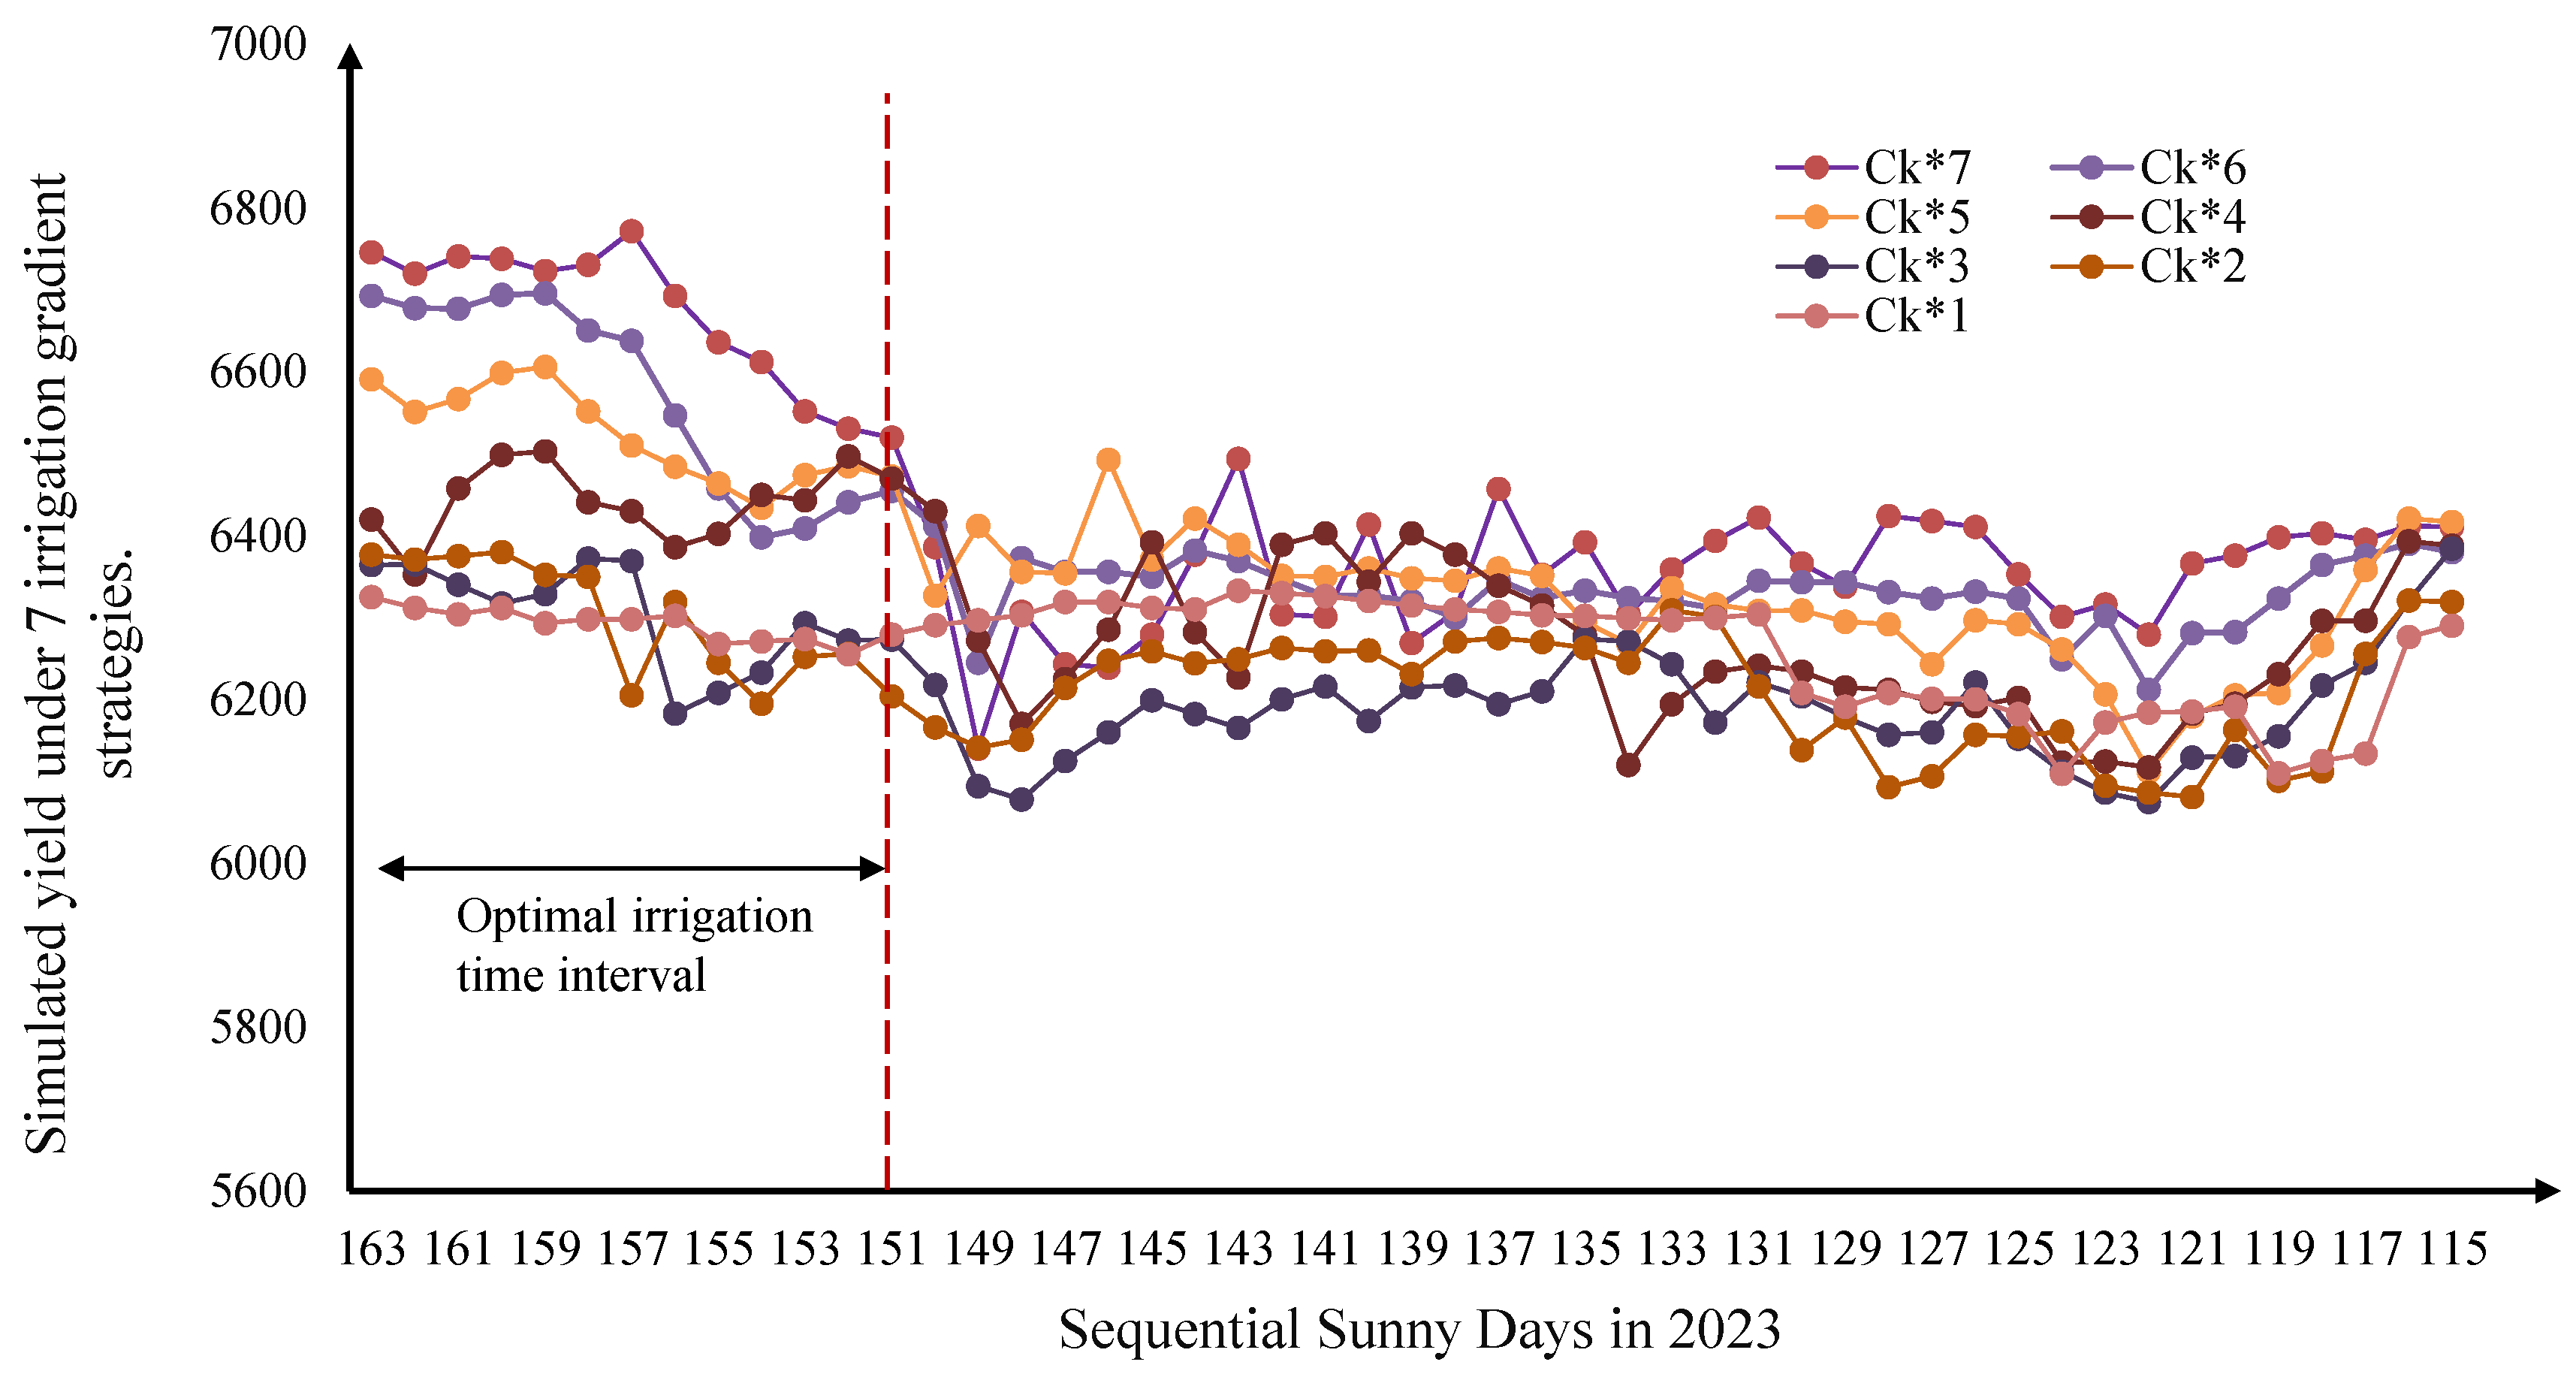
From Figure 9, it can be visually observed that the yield distribution under different strategies, from a horizontal time sequence perspective, shows that the yields are significantly higher within the range of “Day 150” to “Day 161” of the solar calendar compared to other times. There is also a slight increase in yields around “Day 115”. This pattern is consistent with the trend shown in the line chart Figure 10, where each point on the line corresponds to 1 of the 357 strategies. Therefore, it can be concluded that while maintaining relatively small yield fluctuations, the permissible irrigation time range for the first water is from Day 150 to Day 161 of 2023, specifically from 25 June to 6 July. It also indicates that “Day 115” falls within the “seedling water” irrigation time range. Conducting the first water irrigation during this period can effectively maintain higher yields.
Figure 9 presents irrigation strategies, with the “first amount of irrigation” as a variable, where the quantity and timing of the first irrigation directly influence the crop’s growth and development stages. Excessive irrigation quantity or delayed timing may subject the crops to water stress, resulting in hindered growth and reduced yields. Conversely, insufficient irrigation quantity or early timing may fail to meet the crop’s water requirements, thereby affecting normal growth and development. In this experiment, the quantity and timing of the first irrigation were systematically adjusted during simulations to find the optimal amount of irrigation and timing for maximizing yields. The simulations simulated the growth status of cotton under different conditions, considering the effects of drought stress. Adjusting the quantity and timing of the first irrigation directly impacted the yield and water use efficiency. When the irrigation period fell within the range of “Day 150” to “Day 161” of the solar calendar, the corresponding yields were significantly higher compared to other periods with an equal amount of irrigation. Within this drought adaptation period, the relationship between the first amount of irrigation and yield showed a decrease followed by an increase. Therefore, implementing appropriate irrigation management that induces drought tolerance can enhance crop yields and improve water use efficiency.
From the perspective of vertical drought hardening and water control strategies, it can be observed that within the range of “Day 150” to “Day 161”, the strategies with higher amounts of irrigation, such as Ck*6 (30 mm) and Ck*7 (35 mm), showed the expected high yields. Surprisingly, the strategies with lower amounts of irrigation, such as Ck*2 (10 mm) and Ck*3 (15 mm), also achieved high yields. This indicates that the speculation in Section 3.1 was correct; that is, appropriate water-deficit irrigation during the “first water period” of cotton irrigation can stimulate the drought resistance of cotton to a certain extent. It not only saves a significant amount of water but also allows cotton plants to acquire drought resistance at an early stage, thereby maintaining a good yield level.
From a physiological perspective, drought stress is an environmental constraint that significantly reduces plant growth and productivity by causing biochemical and physiological changes in plant tissues, leading to yield losses. In order to overcome the impacts of drought stress, plants actively induce biochemical, physiological, and molecular modifications to enhance their tolerance to external stressors. The upregulation or downregulation of key hormones and cell proteins involved in response to abiotic stress, particularly drought stress, play a crucial role in mitigating water stress during drought acclimation in plants, aligning with the aforementioned experimental results. These findings hold revolutionary implications for cotton cultivation in the region, where climate drought and year-round water scarcity prevail.
In order to obtain specific irrigation timing ranges and water restrictions for high yields, the study used Figure 9 as a basis and simulated a yield range of 6374 kg/ha to 7000 kg/ha. With this yield range as a constraint, the optimal drought acclimation timing range was determined, as shown in Figure 11. The results revealed that cotton plants still achieved favorable yields when the initial amount of irrigation, referred to as “first watering,” was controlled within the lower range of 10 mm to 15 mm. The optimal timing for the “first watering” was found to be between the “150th” and “161st” day after cotton planting.

4. Conclusions

Drought significantly limits agricultural production, and cotton plants are vulnerable to water scarcity. Severe water deficiency can be fatal for cotton, while mild water deficiency or short-term drought stress can enhance the crop’s stress tolerance and increase yields. However, there is limited research on the specific details of drought training for cotton and the irrigation measures to improve cotton’s drought resistance. Farmers are still uncertain when and how much irrigation can induce drought tolerance in cotton seedlings to better withstand drought stress. This knowledge is crucial for agricultural development in water-scarce regions. In order to address this issue, this study first validated the CSM-CROPGRO-Cotton model with parameter-corrected data from field observations. Subsequently, using the corrected parameters, the study employed batch processing in the DSSAT L4.8 model based on the Linux system to simulate cotton yield distribution in 357 irrigation scenarios. The aim was to identify the optimal irrigation strategies that align with the characteristics of drought training. The results revealed that in the irrigation scheme for cotton during the seedling stage, when the “first irrigation” amount was in the lower range of 10 mm to 15 mm, cotton plants experienced drought training during the early growth stage, and their yields did not exhibit significant fluctuations due to reduced the amount of first irrigation. The suitable time range for first irrigation for drought training was from 25 June to 6 July. By implementing this irrigation strategy, the amount of first irrigation could save approximately 57.14% of water usage. This finding holds great significance for cotton cultivation in drought-affected regions.
In practical cotton farming scenarios, the recommended time range for first irrigation in drought training and its associated water-saving potential hold practicality and applicability. Determining the timing of the first irrigation is crucial for drought training, and the provided time range is adjusted based on the local climate and cotton growth requirements. It can help cotton plants establish a healthy root system and adapt to dry growing conditions. The water-saving potential indicates that delaying first irrigation can achieve a certain degree of water conservation. This potential can serve as a reference for decision-makers to evaluate the effectiveness of drought training and irrigation scheduling. However, the applicability may vary depending on geographical location, climatic conditions, and specific farming practices, necessitating adjustments and validation in practical applications. The provided information can guide decision-makers in formulating irrigation strategies and managing water resources, but further research and field experiments may be necessary.
Drought training is of great importance for cotton cultivation in drought-prone areas, including the Changji region with low annual rainfall. Proper drought training and irrigation strategies can enhance plant resilience and increase yield. By exposing cotton plants to controlled drought conditions, they adjust their physiological and biochemical mechanisms to adapt to water limitations, promote root growth and development, and improve water use efficiency. These adaptive adjustments help cotton plants maintain growth and metabolic activities, enhancing their resilience when facing drought stress. Furthermore, considering geographical and climatic variations, plant variety selection, and the optimization of drought training strategies can ensure the broad applicability of these research findings. In modern smart agriculture, there is potential for improvement in intelligent decision algorithms based on crop models. The introduction of artificial intelligence algorithms, such as machine learning, can overcome the limitations posed by specific agricultural data. Additionally, the continuous development of on-site sensor data-collection technology will drive the widespread adoption of intelligent irrigation decision systems based on artificial intelligence algorithms.
Author Contributions

Conceptualization, L.W. and L.H. (Liang He); methodology, L.W. and M.L.; software, Z.H.; validation, L.W., M.L., Z.H., L.H. (Lianjin Han), L.H. (Liang He) and W.S.; investigation, L.W.; resources, L.W. and M.L.; data curation, L.W., Z.H. and M.L; writing—original draft preparation, L.W. and L.H. (Liang He); writing—review and editing, L.H. (Liang He) and W.S.; supervision, L.H. (Liang He); project administration, L.H. (Liang He). All authors have read and agreed to the published version of the manuscript.

Funding

This research was funded by the National Key R&D Program of China (2022ZD0115801).

Data Availability Statement

Data are available from the corresponding author upon request.

Conflicts of Interest

The authors declare no conflict of interest.

References

  1. Li, N.; Yao, N.; Li, Y.; Chen, J.; Liu, D.; Biswas, A.; Li, L.; Wang, T.; Chen, X. A meta-analysis of the possible impact of climate change on global cotton yield based on crop simulation approaches. Agric. Syst. 2021, 193, 103221. [Google Scholar] [CrossRef]
  2. Abraha, M.; Savage, M. Potential impacts of climate change on the grain yield of maize for the midlands of KwaZulu-Natal, South Africa. Agric. Ecosyst. Environ. 2006, 115, 150–160. [Google Scholar] [CrossRef]
  3. Rosenzweig, C.; Ritchie, J.; Jones, J.W.; Tsuji, G.; Hildebrand, P. Climate change and agriculture: Analysis of potential international impacts. In Proceedings of the Symposium on Climate Change and Agriculture: Analysis of Potential International Impacts; Soil Science Society of America: Road Madison, WI, USA, 1995. [Google Scholar]
  4. Li, Z.; Jin, X.; Zhao, C.; Wang, J.; Xu, X.; Yang, G.; Li, C.; Shen, J. Estimating wheat yield and quality by coupling the DSSAT-CERES model and proximal remote sensing. Eur. J. Agron. 2015, 71, 53–62. [Google Scholar] [CrossRef]
  5. Levitan, N.; Kang, Y.; Özdoğan, M.; Magliulo, V.; Castillo, P.; Moshary, F.; Gross, B. Evaluation of the uncertainty in satellite-based crop state variable retrievals due to site and growth stage specific factors and their potential in coupling with crop growth models. Remote Sens. 2019, 11, 1928. [Google Scholar] [CrossRef] [PubMed]
  6. Shanahan, J.F.; Schepers, J.S.; Francis, D.D.; Varvel, G.E.; Wilhelm, W.W.; Tringe, J.M.; Schlemmer, M.R.; Major, D.J. Use of remote-sensing imagery to estimate corn grain yield. Agron. J. 2001, 93, 583–589. [Google Scholar] [CrossRef]
  7. Delécolle, R.; Maas, S.; Guerif, M.; Baret, F. Remote sensing and crop production models: Present trends. ISPRS J. Photogramm. Remote Sens. 1992, 47, 145–161. [Google Scholar] [CrossRef]
  8. Pietrucha-Urbanik, K.; Rak, J. Water, Resources, and Resilience: Insights from Diverse Environmental Studies. Water 2023, 15, 3965. [Google Scholar] [CrossRef]
  9. Rak, J.R.; Pietrucha-Urbanik, K. An approach to determine risk indices for drinking water–study investigation. Sustainability 2019, 11, 3189. [Google Scholar] [CrossRef]
  10. Campos, H.; Cooper, M.; Habben, J.; Edmeades, G.; Schussler, J. Improving drought tolerance in maize: A view from industry. Field Crop. Res. 2004, 90, 19–34. [Google Scholar] [CrossRef]
  11. Shukla, P.R.; Skea, J.; Calvo Buendia, E.; Masson-Delmotte, V.; Pörtner, H.O.; Roberts, D.; Zhai, P.; Slade, R.; Connors, S.; Van Diemen, R.; et al. IPCC, 2019: Climate Change and Land: An IPCC Special Report on Climate Change, Desertification, Land Degradation, Sustainable Land Management, Food Security, and Greenhouse Gas Fluxes in Terrestrial Ecosystems; IPCC: Geneva, Switzerland, 2019. [Google Scholar]
  12. Perry, C.; Barnes, E.; Munk, D.; Fisher, K.; Bauer, P. Cotton Irrigation Management for Humid Regions; Cotton Incorporated: Cary, NC, USA, 2012. [Google Scholar]
  13. Ahluwalia, O.; Singh, P.C.; Bhatia, R. A review on drought stress in plants: Implications, mitigation and the role of plant growth promoting rhizobacteria. Resour. Environ. Sustain. 2021, 5, 100032. [Google Scholar] [CrossRef]
  14. Mori, Y. New agro-technology (Imec) by hydrogel membrane. React. Funct. Polym. 2013, 73, 936–938. [Google Scholar] [CrossRef]
  15. Nuccio, M.L.; Paul, M.; Bate, N.J.; Cohn, J.; Cutler, S.R. Where are the drought tolerant crops? An assessment of more than two decades of plant biotechnology effort in crop improvement. Plant Sci. 2018, 273, 110–119. [Google Scholar] [CrossRef]
  16. Saxena, R.; Tomar, R.S.; Kumar, M. Exploring nanobiotechnology to mitigate abiotic stress in crop plants. J. Pharm. Sci. Res. 2016, 8, 974. [Google Scholar]
  17. Saha, A.; Sekharan, S.; Manna, U. Superabsorbent hydrogel (SAH) as a soil amendment for drought management: A review. Soil Tillage Res. 2020, 204, 104736. [Google Scholar] [CrossRef]
  18. Zhang, Y.; Ding, J.; Wang, H.; Su, L.; Zhao, C. Biochar addition alleviate the negative effects of drought and salinity stress on soybean productivity and water use efficiency. BMC Plant Biol. 2020, 20, 288. [Google Scholar] [CrossRef]
  19. Chiappero, J.; del Rosario Cappellari, L.; Alderete, L.G.S.; Palermo, T.B.; Banchio, E. Plant growth promoting rhizobacteria improve the antioxidant status in Mentha piperita grown under drought stress leading to an enhancement of plant growth and total phenolic content. Ind. Crop. Prod. 2019, 139, 111553. [Google Scholar] [CrossRef]
  20. Shi, W.; Hu, X.; Kang, S. Research Status and Prospects of Deficit Irrigation Techniques in Crop Under Drought and Water Scarcity Conditions. Agric. Res. Arid. Areas 1998, 16, 84–88. [Google Scholar]
  21. Mitchell, P.; Jerie, P.; Chalmers, D. The effects of regulated water deficits on pear tree growth, flowering, fruit growth, and yield. J. Am. Soc. Hortic. Sci. 1984, 109, 604–606. [Google Scholar] [CrossRef]
  22. Fereres, E.; Evans, R.G. Irrigation of fruit trees and vines: An introduction. Irrig. Sci. 2006, 24, 55–57. [Google Scholar] [CrossRef]
  23. Cheng, F.; Huo, C.; Zhang, J.; Chen, P.; Meng, Z. Effects of deficit irrigation on the growth, yield, and quality of pear fruit. Agric. Res. Arid. Areas 2000, 18, 72–76. [Google Scholar]
  24. Huang, X.; Li, G.; Zeng, D. Real Time Determination of Irrigation scheduling for Micro-Irrigated orchards. Trans. Chin. Soc. Agric. Eng. 2002, 18, 79–83. [Google Scholar]
  25. Meng, Z.; Liu, A.; Pang, H.; Wang, H.; Jia, D. Physiological mechanisms and indicators of deficit irrigation in summer maize. Trans. Chin. Soc. Agric. Eng. 1998, 14, 88–92. [Google Scholar]
  26. Zhang, X.; You, M.; Wang, X. Effects of different stages of water deficit and different levels of deficit on winter wheat yield. Acta Agric. Boreali-Sin. 1999, 14, 79–83. [Google Scholar]
  27. Wang, M.; Kang, S.; Cai, H.; Xiong, Y. Effects of deficit irrigation on maize ecological characteristics and yield. J. Northwest A&F Univ. 2000, 28, 1–2. [Google Scholar]
  28. Hu, X.; Liang, Z.; Kang, S.; Cai, H. Effects of simulated deficit irrigation on maize root growth and water use efficiency. Irrig. Drain. 1998, 17, 11–15. [Google Scholar]
  29. Kang, S.; Zhang, J.; Liang, Z.; Hu, X.; Cai, H. Controlled alternate irrigation: A new approach for water-saving regulation in farmland. Agric. Res. Arid. Areas 1997, 15, 1–6. [Google Scholar]
  30. Zhang, L.; Zhou, W.; Li, D. Research progress in irrigation mode selection of high-efficiency water-saving agriculture. J. Drain. Irrig. Mach. Eng. 2019, 37, 447–453. [Google Scholar]
  31. Ali, M.; Hoque, M.; Hassan, A.; Khair, A. Effects of deficit irrigation on yield, water productivity, and economic returns of wheat. Agric. Water Manag. 2007, 92, 151–161. [Google Scholar] [CrossRef]
  32. Yang, X.; Lu, M.; Wang, Y.; Wang, Y.; Liu, Z.; Chen, S. Response mechanism of plants to drought stress. Horticulturae 2021, 7, 50. [Google Scholar] [CrossRef]
  33. Wojtyla, Ł.; Paluch-Lubawa, E.; Sobieszczuk-Nowicka, E.; Garnczarska, M. Drought stress memory and subsequent drought stress tolerance in plants. In Priming-Mediated Stress and Cross-Stress Tolerance in Crop Plants; Elsevier: Amsterdam, The Netherlands, 2020; pp. 115–131. [Google Scholar]
  34. Asaminew, T.; Araya, A.; Atkilt, G.; Solomon, H. Modeling the potential impact of climate change on cotton (Gossypium hirsutum) production in Northeastern Semi-Arid Afar and Western Tigray Regions of Ethiopia. J. Earth Sci. Clim. Chang. 2017, 8, 1–7. [Google Scholar]
  35. Wang, X. Impact and Adaptation of Climate Change on Cotton Phenology, Yield and Fiber Quality in Xinjiang. Ph.D. Thesis, China Agricultural University Beijing, Beijing, China, 2015. [Google Scholar]
  36. Li, M.; Du, Y.; Zhang, F.; Fan, J.; Ning, Y.; Cheng, H.; Xiao, C. Modification of CSM-CROPGRO-Cotton model for simulating cotton growth and yield under various deficit irrigation strategies. Comput. Electron. Agric. 2020, 179, 105843. [Google Scholar] [CrossRef]
  37. Tao, H.; Tao, J.; Li, Q.; Aihemaiti, M.; Jiang, Y.; Yang, W.; Wei, J. Average relative flow of single-wing labyrinth drip irrigation tape based on projection pursuit regression. Sci. Rep. 2022, 12, 8543. [Google Scholar] [CrossRef]
  38. Huang, D.; Han, J.; Wu, W.; Wu, J. Soil temperature effects on emergence and survival of Iris lactea seedlings. N. Z. J. Crop Hortic. Sci. 2008, 36, 183–188. [Google Scholar] [CrossRef]
  39. Li, F.M.; Wang, J.; Xu, J.Z.; Xu, H.L. Productivity and soil response to plastic film mulching durations for spring wheat on entisols in the semiarid Loess Plateau of China. Soil Tillage Res. 2004, 78, 9–20. [Google Scholar] [CrossRef]
  40. Yao, N.; Li, Y.; Xu, F.; Liu, J.; Chen, S.; Ma, H.; Chau, H.W.; Li Liu, D.; Li, M.; Feng, H.; et al. Permanent wilting point plays an important role in simulating winter wheat growth under water deficit conditions. Agric. Water Manag. 2020, 229, 105954. [Google Scholar] [CrossRef]
  41. Jones, J.W.; Hoogenboom, G.; Porter, C.H.; Boote, K.J.; Batchelor, W.D.; Hunt, L.; Wilkens, P.W.; Singh, U.; Gijsman, A.J.; Ritchie, J.T. The DSSAT cropping system model. Eur. J. Agron. 2003, 18, 235–265. [Google Scholar] [CrossRef]
  42. Ritchie, J.T. Soil water balance and plant water stress. In Understanding Options for Agricultural Production; Springer: Dordrecht, The Netherlands, 1998; pp. 41–54. [Google Scholar]
  43. Rugira, P.; Ma, J.; Zheng, L.; Wu, C.; Liu, E. Application of DSSAT CERES-maize to identify the optimum irrigation management and sowing dates on improving maize yield in Northern China. Agronomy 2021, 11, 674. [Google Scholar] [CrossRef]
  44. Chipanshi, A.; Ripley, E.; Lawford, R. Large-scale simulation of wheat yields in a semi-arid environment using a crop-growth model. Agric. Syst. 1999, 59, 57–66. [Google Scholar] [CrossRef]
  45. Moulin, S. Impacts of model parameter uncertainties on crop reflectance estimates: A regional case study on wheat. Int. J. Remote Sens. 1999, 20, 213–218. [Google Scholar] [CrossRef]
  46. Wang, J.; Li, X.; Lu, L.; Fang, F. Estimating near future regional corn yields by integrating multi-source observations into a crop growth model. Eur. J. Agron. 2013, 49, 126–140. [Google Scholar] [CrossRef]
  47. Thirumeninathan, S.; Pazhanivelan, S.; Sudarmanian, N.; Ragunath, K.; Kumaraperumal, R.; Srinivasan, G.; Mohan, R. Integrating SAR Sentinel-1A and DSSAT CROPGRO Simulation Model for Peanut Yield Gap Analysis. Agronomy 2023, 13, 889. [Google Scholar] [CrossRef]
  48. Thorp, K.R.; Batchelor, W.D.; Paz, J.O.; Kaleita, A.L.; DeJonge, K.C. Using cross-validation to evaluate CERES-Maize yield simulations within a decision support system for precision agriculture. Trans. ASABE 2007, 50, 1467–1479. [Google Scholar] [CrossRef]
  49. Saseendran, S.; Ahuja, L.; Ma, L.; Nielsen, D.; Trout, T.; Andales, A.; Chávez, J.; Ham, J. Enhancing the water stress factors for simulation of corn in RZWQM2. Agron. J. 2014, 106, 81–94. [Google Scholar] [CrossRef]
  50. Li, Z.; He, J.; Xu, X.; Jin, X.; Huang, W.; Clark, B.; Yang, G.; Li, Z. Estimating genetic parameters of DSSAT-CERES model with the GLUE method for winter wheat (Triticum aestivum L.) production. Comput. Electron. Agric. 2018, 154, 213–221. [Google Scholar] [CrossRef]
Figure 1. Research area map of Huaxing Cotton Experimental Base in Changji, Xinjiang.
Agronomy 14 00014 g001
Figure 2. Field drip irrigation tape distribution design.
Agronomy 14 00014 g002
Figure 3. Distribution of irrigation treatment and fertilizer proportion content.
Agronomy 14 00014 g003
Figure 4. Yield thermal distribution map co-ordinate system.
Agronomy 14 00014 g004
Figure 5. Historical climate characteristics and irrigation water distribution map.
Agronomy 14 00014 g005
Figure 6. Batch processing technical route.
Agronomy 14 00014 g006
Figure 7. Simulated yield and observation results.
Agronomy 14 00014 g007
Figure 8. Simulated LAI and observation results.
Agronomy 14 00014 g008
Figure 9. Production heatmap distribution map.
Agronomy 14 00014 g009
Figure 10. Yield line chart of different drought exercise and irrigation strategies.
Agronomy 14 00014 g010
Figure 11. Drought exercise strategy, amount of irrigation, and time sequence range.
Agronomy 14 00014 g011
Table 1. Soil parameter data of the experimental area.
Latitude and Longitude of the Soil Data Station Site44.208 N87.308 E
TypeSaline soil
Plant available water content (mm)1.0
Soil reference depth (cm)100.0
Reference layerShallow (10–20)Deep (40–100)
gravel content (%)7.08.0
sand content (%)31.031.0
silt content (%)46.043.0
clay content (%)23.026.0
reference bulk density (kg/dm 3 )1.371.35
organic carbon (% weight)0.460.27
pH8.38.4
clay cation exchange capacity (cmol/kg)44.056.0
cation exchange capacity (cmol/kg)11.013.0
alkalinity (%)15.016.0
salinity (dS/m)11.224.0
Table 2. Irrigation and fertilization timing scheme.
Irrigation and Water ManagementFertilizers
Year/Math/DayDATECkCk*Tr0Tr1Tr2FACDFDEPNPK
Germinate2023/4/2023,11030302725.524AP0042000
NO12023/6/0923,160351231.529.828AP004216.511.2511.25
NO22023/6/1923,170252522.521.320AP004225.218.7518.75
NO32023/6/2923,180252522.521.320AP00422720.2514.25
NO42023/7/0923,19030302725.124AP004233.926.2526.25
NO52023/7/1423,195252522.521.320AP004241.73030
NO62023/7/2123,202404036.03432AP004253.722.522.5
NO72023/7/2823,209353531.529.828AP004253.722.522.5
NO82023/8/423,216353531.529.828AP0042000
NO92023/8/1123,223303027.025.524AP004222.0823.415.3
NO102023/8/1823,230303027.025.524AP0042000
NO112023/8/2523,237202018.01716AP0042000
Table 3. Drought exercise plan for adjusting the timing and amount of first irrigation.
TreatmentDateIrrigation and Water ManagementControl Group
Date Time of 2023Ck*1Ck*2Ck*3Ck*4Ck*5Ck*6Ck*7CkCk*
Emergence watering2023/4/20110303030303030303030
First wateringxi = 115 −165.51510152025303535,x:16012,x:160
Second Water2023/6/19170252525252525252525
Third Water2023/6/29180252525252525252525
Fourth Water2023/7/09190303030303030303030
Fifth Water2023/7/14195252525252525252525
Sixth Water2023/7/21202404040404040404040
Seventh Water2023/7/28209353535353535353535
Eighth Water2023/8/4216353535353535353535
Ninth Water2023/8/11223303030303030303030
Tenth Water2023/8/18230303030303030303030
Table 4. Different depths of soil parameter data.
SLBSLLLSDULSSATSRGFSSKSSBDMSLOCSLCLSLSISLCFSLNISLHWSLHBSCEC
50.2020.320.41714.31.310.4134310−998.5−9925.5
150.2010.3190.4240.744.31.270.3534310−998.5−9925.5
300.1990.3190.4240.614.31.270.2734310−998.5−9925.5
500.1980.3180.4190.454.31.30.2434310−998.6−9924.5
600.1980.3180.3870.304.31.470.1634310−998.6−9923.5
700.1980.3180.3870.304.31.470.1634310−998.6−9923.5
900.1860.2990.3590.184.31.570.330250−998.6−9920.7
1100.1590.2750.3470.14.31.570.125200−998.6−9917.3
1200.1590.2750.3470.14.31.570.125200−998.6−9917.3
1300.1590.2750.3470.14.31.570.125200−998.6−9917.3
1500.1360.2540.3360.064.31.57020200−998.6−9913.8
1700.1360.2540.33604.31.57020200−998.6−9913.8
1900.1280.2440.3304.31.57018170−998.6−9912.4
2100.1280.2440.33104.31.57018170−998.6−9912.4
Table 5. Explanation of soil parameter variable codes.
Indicator CodeExplanation of Indicator Code
SLBDepth, base of layer, cm
SLLLLower limit of plant extractable soil water, cm 3 cm 3
SDULDrained upper limit, cm 3 , cm 3
SSATUpper limit, saturated, cm 3 , cm 3
SRGFRoot growth factor, soil only, 0.0 to 1.0
SSKSSat. hydraulic conductivity, macropore, cm h 1
SBDMBulk density, moist, g cm 3
SLOCOrganic carbon, %
SLCLClay (<0.002 mm), %
SLSISilt (0.05 to 0.002 mm),%
SLCFCoarse fraction (>2 mm),%
SLNITotal nitrogen,%
SLHWpH in water
SLHBpH in buffer
SCECCation exchange capacity, cmol kg 1
Table 6. Field Phenology data observation results.
Irrigation TreatmentNumber of PlantsTotal Bolls (Including Unopened Bolls)Number of Unopened BollsAverage Number of PlantsAverage Number of BollsAverage Number of Unopened Bollsnum_boll_i (Assuming All Bolls Are Opened)
Ck-1181293618 ± 0.00 a7 ± 0.21 a2 ± 0.22 ab118,731 ± 3661 a
Ck-21811723
Ck-31812825
Ck*-1211101817 ± 2.33 ab7 ± 0.92 a1 ± 0.25 ab105,715 ± 12,930 a
Ck*-21613526
Ck*-3138812
Tr0-1161161415 ± 0.88 ab7 ± 0.28 a1 ± 0.07 b103,493 ± 3535 a
Tr0-21510613
Tr0-31310414
Tr1-113932413 ± 0.33 b8 ± 0.89 a2 ± 0.72 ab92,699 ± 12,542 a
Tr1-21312243
Tr1-3127710
Tr2-1121274914 ± 1.20 ab9 ± 0.98 a3 ± 0.73 a116,191 ± 5245 a
Tr2-21613239
Tr2-31511124
a: significant difference. b: secondary significant difference. ab: slight significant difference. Note: The different lowercase letters within one column mean significant difference among treatments at p < 0.05.
Table 7. Genetic parameter data and range of varieties.
ParameterDefinitionRangeActual Value
CSDLCritical short day length below which reproductive development progresses with no day length effect (for short day plants) (hour)2323.00
PPSENSlope of the relative development response to photoperiod with time (positive for short day plants) (1/h)0.010.010
EM-FLTime between plant emergence and flower appearance (R1) (photothermal days)30–5044.48
FL-SHTime between first flower and first pod (R3) (photothermal days)8–129.00
FL-SDTime between first flower and first seed (R5) (photothermal days)12–2014.54
SD-PMTime between first seed (R5) and physiological maturity (R7) (photothermal days)40–6041.85
FL-LFTime between first flower (R1) and end of leaf expansion (photothermal days)70.0070.00
LFMAXMaximum leaf photosynthesis rate at 30 C, 350 vpm CO 2 , and high light (mg CO 2 /m 2 -s)—from Reddy Adv. Agron. 19970.95–1.151.11
SLAVRSpecific leaf area of cultivar under standard growth conditions (cm 2 /g)170–250179.4
SIZLFMaximum size of full leaf (three leaflets) (cm 2 )250–300284.1
XFRTMaximum fraction of daily growth that is partitioned to seed + shells0.5–10.95
WTPSDMaximum weight per seed (g)0.180.18
SFDURSeed filling duration for pod cohort at standard growth conditions (photothermal days)20–4020.03
SDPDVAverage seed per pod under standard growing conditions (#/pod 1 )20–3020.95
PODURTime required for cultivar to reach final pod load under optimal conditions (photothermal days)6–156.00
THRSHThreshing percentage. The maximum ratio of (seed/(seed + shell)) at maturity. Causes seeds to stop growing as their dry weight increases until the shells are filled in a cohort70–8072.00
SDPROFraction protein in seeds (g(protein)/g 1 (seed))0.1530.153
SDLIPFraction oil in seeds (g(oil)/g(seed))0.120.120
Table 8. Field observation seed cotton yield results and simulated yield results data.
TreatmentSimulated Yield (kg/ha)Observe Yield (kg/ha)Observe Yield (kg/mu)
Ck67386812.25454.15
Ck*63786739.35449.29
Tr061956065.4404.36
Tr157325937.9395.86
Tr251675318.7354.58
r2,dr2:0.856,d:0.616
Table 9. The leaf area index (LAI) observation data and simulation data of five field deficit irrigation experiments.
DateCk-LAI.ObsCk-LAI.SimTr0-LAI.ObsTr0-LAI.SimTr1-LAI.ObsTr1-LAI.SimTr2-LAI.ObsTr2-LAI.SimCk*-LAI.ObsCk*-LAI.Sim
7.131941.47921.3991.24411.1901.08521.2011.39881.3111.70171.532
7.181992.96462.8441.42301.3032.35742.1121.61551.5432.62012.352
7.252063.55683.7483.21203.6163.53833.4073.60343.2414.21613.933
8.12133.57383.6213.45523.4714.20963.9542.89633.0964.59164.213
8.82204.18204.5513.41013.3443.53733.4053.37673.1383.77683.945
8.152273.41733.4273.62253.4332.96443.0853.93763.9813.36063.001
8.212334.45254.2194.23744.1314.23003.0333.95403.9044.48204.284
8.262383.90253.8714.31544.9913.83283.9074.56374.7894.23214.59
RMSERMSE: 0.177RMSE: 0.294RMSE: 0.451RMSE: 0.193RMSE: 0.285
AREARE: 0.039ARE: 0.064ARE: 0.0861ARE: 0.053ARE: 0.079
nRMSnRMSE: 0.0596nRMSE: 0.0955nRMSE: 0.143nRMSE: 0.061nRMSE: 0.098
r2r2: 0.96r2: 0.93r2: 0.79r2: 0.97r2: 0.91
dd: 0.78d: 0.77d: 0.65d: 0.82d: 0.65
Disclaimer/Publisher’s Note: The statements, opinions and data contained in all publications are solely those of the individual author(s) and contributor(s) and not of MDPI and/or the editor(s). MDPI and/or the editor(s) disclaim responsibility for any injury to people or property resulting from any ideas, methods, instructions or products referred to in the content.