Article

Responses of Two-Row and Six-Row Barley Genotypes to Elevated Carbon Dioxide Concentration and Water Stress

1
Department of Agronomy and Plant Breeding, College of Agriculture, Isfahan University of Technology, Isfahan 8415683111, Iran
2
Department of Herbal and Animal Production, Vocational School of Technical Sciences, Igdir University, 76000 Igdir, Turkey
3
Department of Plant Genetics and Production, Faculty of Agriculture, University of Maragheh, Maragheh 5518183111, Iran
4
Department of Biosciences, Biotechnology and Environment, University of Bari Aldo Moro, 70121 Bari, Italy
5
Department of Biological and Environmental Sciences and Technologies, University of Salento, 73100 Lecce, Italy
*
Authors to whom correspondence should be addressed.
Agronomy 2023, 13(9), 2373; https://doi.org/10.3390/agronomy13092373
Submission received: 3 July 2023 / Revised: 30 August 2023 / Accepted: 11 September 2023 / Published: 12 September 2023
(This article belongs to the Special Issue Agro-Ecosystem Responses to Climate Change: Adaptation and Mitigation)

Abstract

:
Barley (Hordeum vulgare L.) is a crucial cereal crop globally, and its productivity is influenced by environmental factors, including elevated carbon dioxide (CO2) levels and water stress. The aim of this study is to investigate the effects of water stress and increased CO2 concentration on the growth, physiological responses, and yield of two-row and six-row barley genotypes. Univariate data analysis revealed significant effects of CO2 concentration on most traits except chlorophyll a (Chla), crop antioxidant capacity as evaluated by the activity of plant extracts to scavenge the 2,2-diphenyl-1-picrylhydrazyl (DPPH), and on the maximum quantum yield of photosystem II (Fv/Fm). Mean comparisons showed that elevated CO2 increased certain traits such as shoot dry weight (ShDW) (34.1%), root dry weight (RDW) (50.8%), leaf area (LA) (12.5%), grain weight (GW) (64.1%), and yield-related traits and combination of significant indices (CSI) (72.5%). In comparison, Proline (−19.3%), Malondialdehyde (MDA) (−34.4%) levels, and antioxidant enzyme activities, including ascorbate peroxidase (APX) (−39.1%), peroxidase (POX) (−26.1%), and catalase (CAT), (−34.4%) decreased. Water stress negatively affected ShDW (−40.2%), GW (−43.7%), RDW (−28.5%), and LA (−28.8%), while it positively affected DPPH (36.0%), APX (54.8%), CAT (85.1%), and MDA (101%). Six-row barley genotypes (Goharan and Mehr) had the highest yield under normal humidity and elevated CO2 concentrations, while under water stress conditions, their yield decreased more than two-row genotypes (Behrokh and M9316). Principal component analysis and heatmapping revealed that two-row barley genotypes exhibited the highest stress resistance under elevated CO2 concentrations, with the highest levels of secondary metabolites.

1. Introduction

Climate change and the rising concentration of greenhouse gases have a direct impact on the temporal and spatial distribution of critical agricultural factors such as light, water, and temperature. This poses significant threats to agricultural production, trade patterns, and ultimately, food security [1,2,3]. In recent years, there has been a growing global focus on climate change and greenhouse gases. Carbon dioxide (CO2) is considered the most significant greenhouse gas, with levels increasing from 280 μmol mol–1 during pre-industrial times to the current level of 400 μmol mol–1 [4]. Projections suggest that CO2 levels will reach 700 μmol mol–1 by the end of the 21st century [5]. Despite occupying a small volume of the atmosphere (0.04%), even small changes in CO2 levels have direct and indirect effects on plant morphology, physiology, and biochemistry [6]. Plants respond to elevated CO2 concentrations by increasing photosynthesis rate, dry matter accumulation, and water and nutrient use efficiency [7]. In nature, plants face numerous abiotic stress factors simultaneously, which will be increasingly frequent due to climate change and affect their growth, yield, and survival. Among the possible stress combinations in this context, the one between CO2 increase and a water deficit is the most probable.
Climate change-induced water deficit stress is a critical issue that severely hampers crop growth and yields in various regions worldwide [8]. Water deficit stress or light water stress significantly reduced plant growth and development [9], leading to the closing of the leaf stomata, decreasing the potential of cell water, and directly affecting the structure of the components involved in cellular photosynthesis [10]. As such, plants tackle the wa-ter limitations by making morphological, physiological and biochemical changes [2].
Barley (Hordeum vulgare L.) is one of the most important and suitable crops for arid and semi-arid regions due to having a high diversity of genetic resources that can adapt to a wide range of environmental stresses such as drought, salinity and heat stress [11,12,13]. Barley is mainly grown as a feed grain and also for malting to produce alcoholic beverag-es. Barley comprises two forms, the two-row and the six-row genotype. The six-row barley usually has a higher grain protein concentration and is more suitable for animal feed, while two-row barley is more commonly used in the malting industry due to its higher carbohydrate content [14].
Research has shown that cereal production should increase significantly in the coming years due to the ever-increasing population and growing demand for food. Therefore, understanding the factors influencing the growth and yield in cereals, including barley, as well as choosing the most suitable cultivars for future climatic conditions, is of particular importance [15]. In addition, understanding the exact patterns and mechanisms of plants’ responses to climate changes (water stress and increasing CO2 concentration) is increasingly important for predicting plant performance and flexibility and, as a result, choosing the most suitable cultivars.
The aim of this study was to investigate how two-row and six-row barley genotypes respond to elevated CO2 concentrations and their potential for mitigating or enhancing water deficit stress. This study focused on identifying the physiological mechanisms that underlie these responses. The results of this study provide important insights into managing barley genotypes to enhance growth rate and yield under changing environmental conditions, especially in the context of high CO2 and drought stress.

2. Materials and Methods

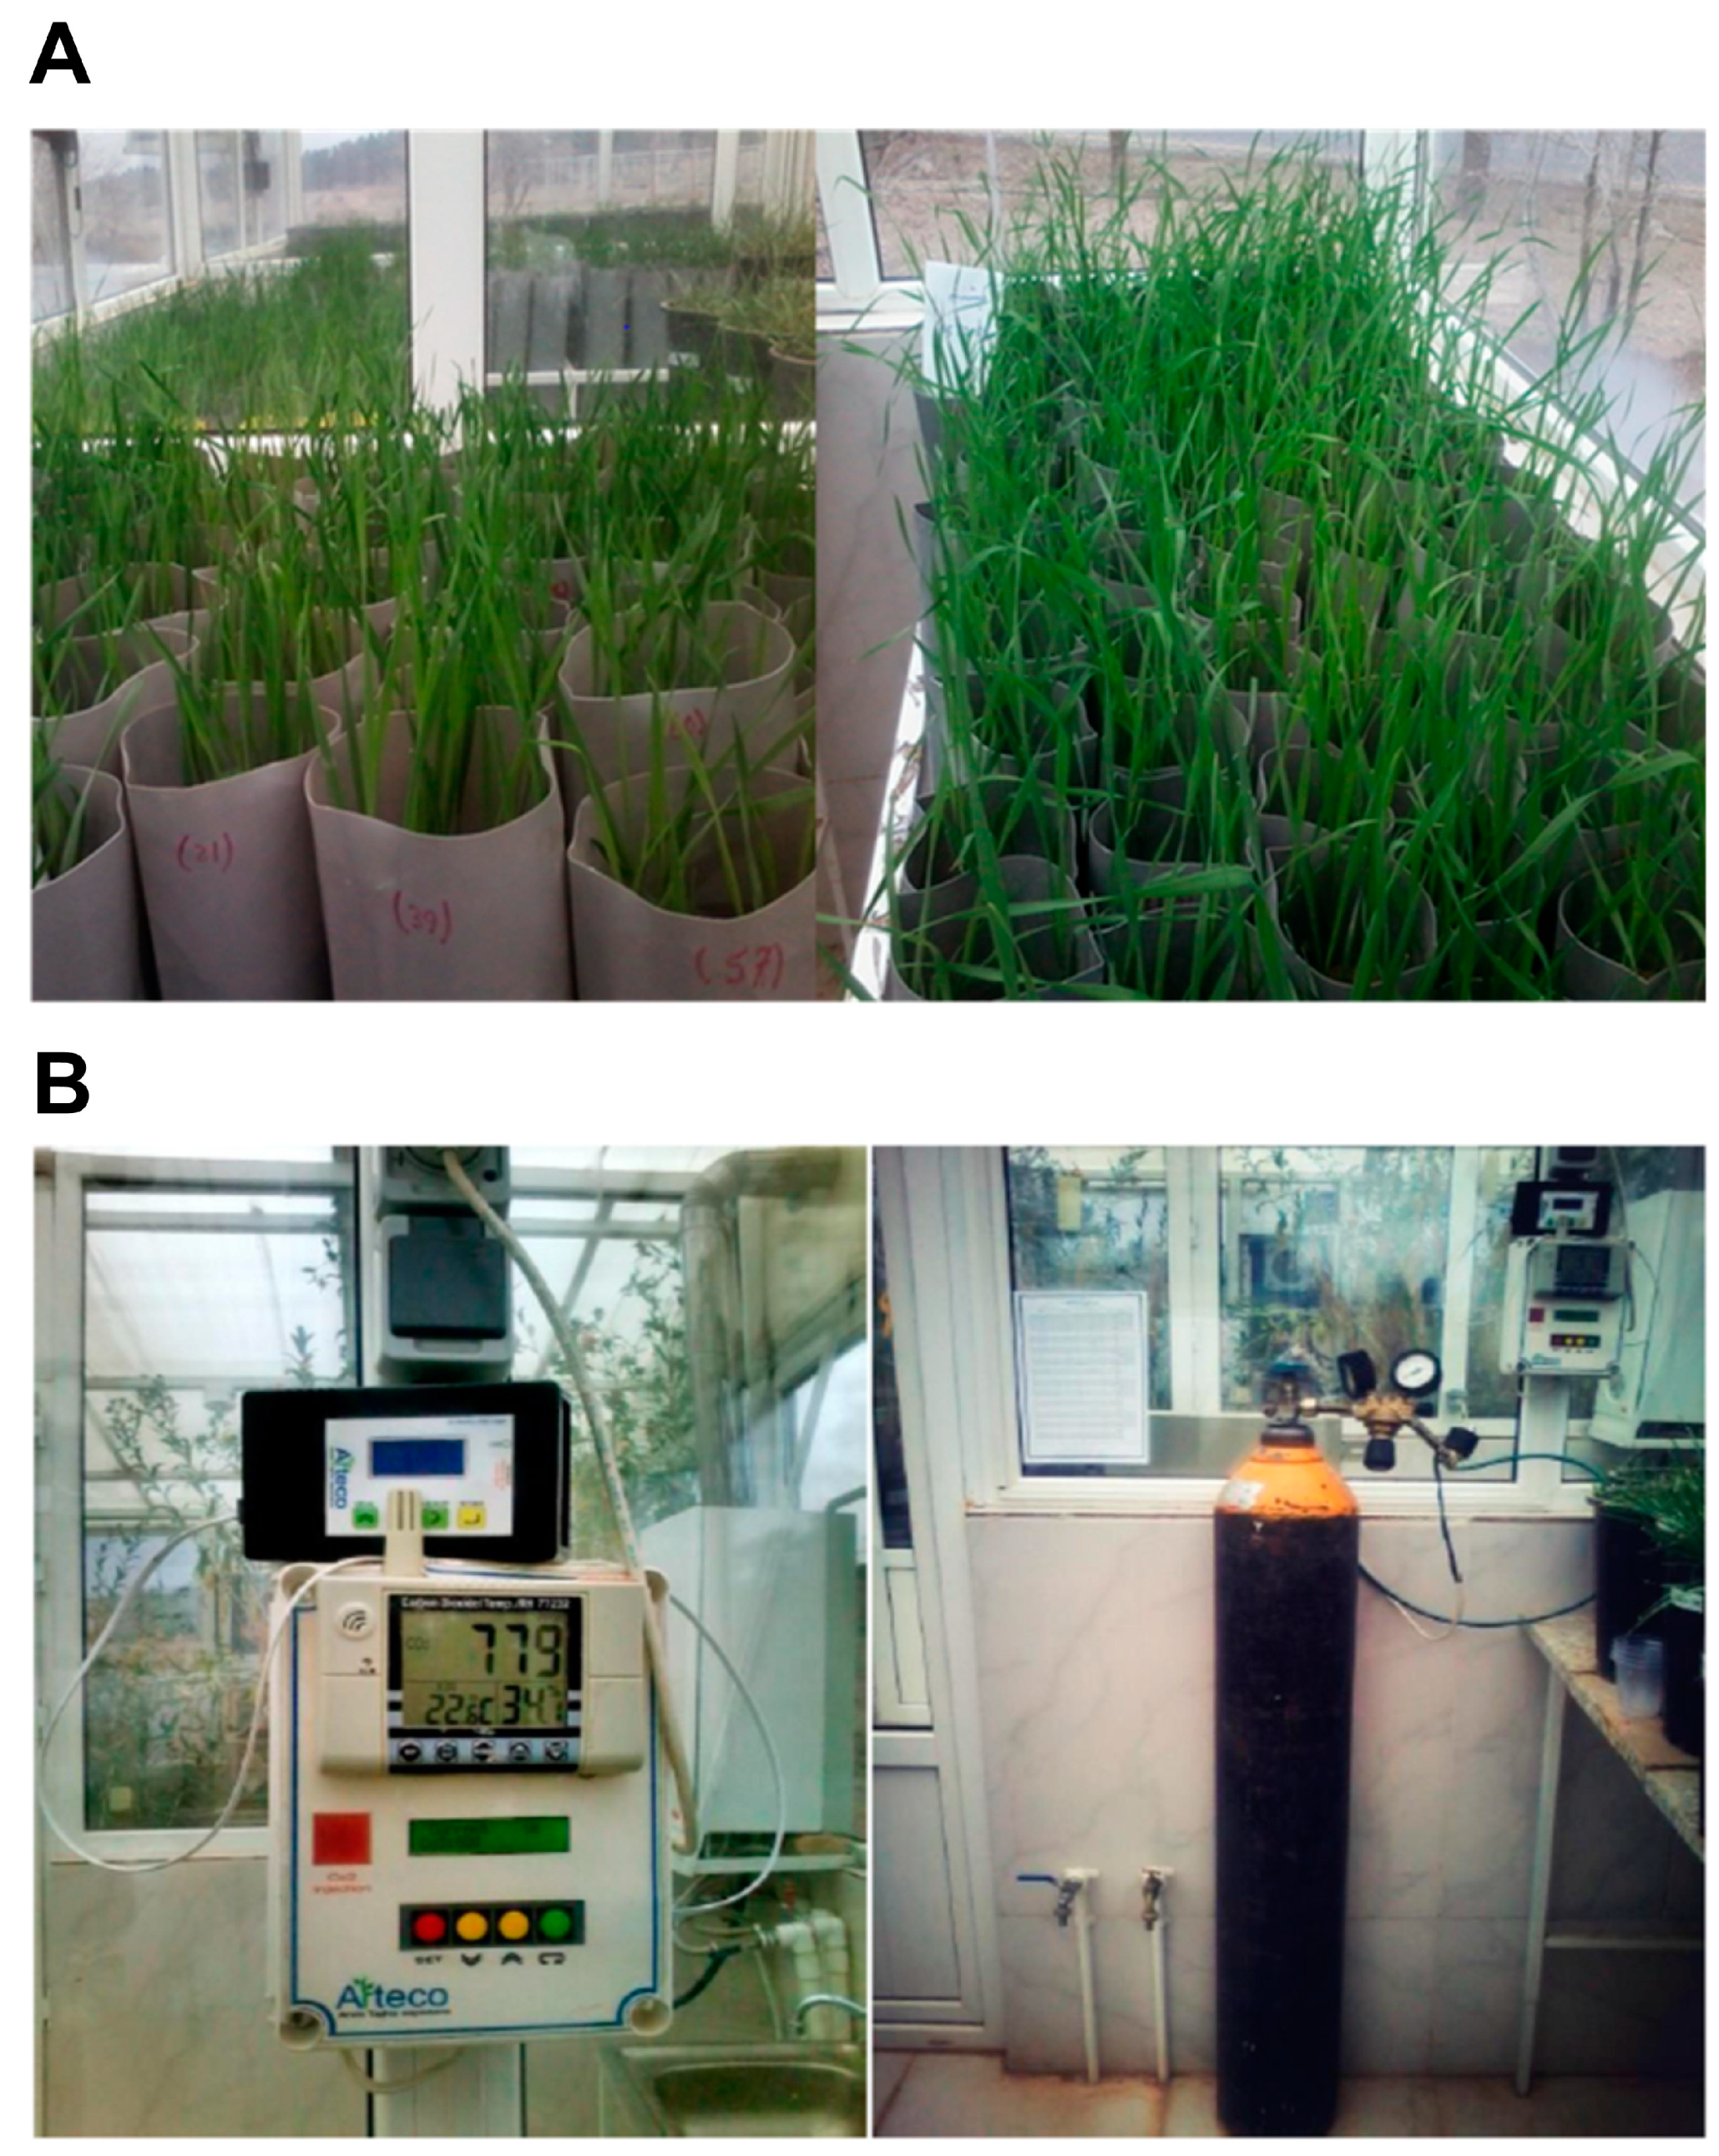
2.1. Plant Material, Experimental Site and Design

The plant material used in this experiment consisted of four barley genotypes including Goharan and Mehr (six-row) and Behrokh and M9316 (two-row), which were selected based on a previous comprehensive field evaluation [16] (Table 1).
The experiment was conducted using a split factorial-based randomized complete block design with three replications. The factors studied were two moisture environments (irrigation after 40% and 75% depletion of the available soil water as control levels and water deficit stress) and two concentrations of CO2 (390 ± 50 and 700 ± 50 μmol mol−1). The experimental site was the greenhouse of Isfahan University of Technology (between 551,379 N and 3,620,385 E, at 1525 m above mean sea level, with an average annual temperature of 14.7 °C and average annual rainfall of 105 mm, in a semi-arid and cold climate). Ten seeds of each genotype, after disinfection with 2% sodium hypochlorite solution for 3 min, were sown (17 March 2018) in polyethylene columns (16 cm in diameter and 60 cm in height), the end of which was perforated and coarse sand was placed at the bottom (4 cm height), while the rest of the column was filled with about 5 kg of soil.
In the controlled greenhouse setting, two separate and adjacent chambers were used, each with a different level of CO2 concentration set. From the beginning of the experiment, each chamber received a distinct injection of CO2 concentration. CO2 gas entered every chamber through the CO2 gas capsule and its concentration was automatically measured in both chambers and adjusted until harvest, by a CO2 meter (AZ77232 CO2/Temperature/Relative Humidity Meter designed and manufactured by AZ Instrument, Taichung City, Taiwan) (Figure 1).
Moreover, cultivars were exposed to two different irrigation conditions within each chamber: control and stress. Overall, the treatment list was designed as follows:
  • Control irrigation condition and Ambient CO2 concentration.
  • Control irrigation condition and Elevated CO2 concentration.
  • Water stress condition and Ambient CO2 concentration.
  • Water stress condition and Elevated CO2 concentration.

2.2. Water Stress Treatment

Water stress was applied at the stage where three leaves had emerged (Zadoks cod. 13) [17], according to the Maximum Allowable Depletion (MAD) of soil available water (SAW) (i.e., between −0.03 to −1.5 MPa) [18]. From the planting to the tillering stage (i.e., plant full establishment), irrigation was executed in both environments at the same time and to the same extent, based on crop water need (40% soil water depletion as the control). Water stress treatment (75% depletion of SAW) was initiated at the tillering stage. Soil–water potential based on the depletion of SAW was determined using a soil moisture release curve. The following equations were used for the irrigation treatments:
SAW = (θfc − θpwp) × ρb × V column
Virrig = SAW × ρ
“θfc” is the volume basis of the soil–water content on field capacity (%), “θpwp” is the volume basis of the soil–water content on wilting point (%), “ρb” is the bulk density (g cm−3) of the experimental soil, “V” column is the column volume (m3), “Virrig” is the irrigation volume (m3), and “ρ” is soil moisture depletion (40% and 75% of ASW). Water stress treatment was applied at both levels until the end of the experiment.

2.3. Measurement of the Physiological Traits

Sampling was performed at the stage of spike emergence on the leaves of five randomly selected plants on 13–16 May 2018, and harvesting of the plants was performed at the time of physiological maturation on 16–19 June 2018. The samples for shoot and root weight determination were collected from harvested plants.

2.3.1. Plant Leaf Area (LA)

The green LA was measured by using a digital LA meter (Model GA-5, OSK Company, Tokyo, Japan).

2.3.2. Relative Water Content (RWC)

To measure RWC, four or five pieces of fresh leaves 1 cm in diameter were cut and weighed (FW). Samples were then placed in a petri dish with some water in an incubator for 4 h at 4 °C and weighed again. (TW). Finally, the samples were placed in an oven at 72 °C for 72 h and weighed again (DW). The RWC was calculated using the following equation [19].
RWC = (FW − DW/TW − DW) × 100

2.3.3. Chlorophyll a (Chla), Chlorophyll b (Chlb) and carotenoids (Car)

Lichtenthaler’s [20] method was used to measure the concentration of Chl and Car. For this purpose, 0.1 g of leaf samples were first pulverized with liquid nitrogen and transferred to a 1.5 mL microtube and then 500 μL of 80% acetone was added to them and after vortexing they were refrigerated for 24 h. Then, samples were filtered and centrifuged for 10 min at 4000 rpm using a T16-15cc centrifuge. Next, 50 μL of the supernatant was separated by a sampler and poured into new microtubes, and by adding 80% acetone it reached a volume of 1 mL. Chlorophyll a (Chla), chlorophyll b (Chlb), and carotenoid (Car) contents were then estimated by spectrophotometric absorbance at 663, 646, and 470 nm using a HITACHI U-1800 spectrophotometer (Hitachi—Science & Technology Company, Berkshire city, United Kingdom), respectively, using the following equations:
Chla = 12.25 A663.2 − 2.798 A646.8
Chlb = 21.50 A646.8 − 5.10 A663.3
Car = (1000 A470 − 1.82 Ch1a − 85.02 Ch1b)/198
A: light absorbance at 663, 645, and 470 nm.
Pigment data were expressed in milligrams per gram of fresh leaf weight.

2.3.4. Maximum Quantum Efficiency of PSII (Fv/Fm)

Fv/Fm data were collected using a Hansatech (ver. 1.21) fluorometer before irrigation from the middle of the leaf and between the main vein and the edge of the flag leaf in all plants at the stage of spike emergence. The green parts of the flag leaf were placed in the dark for 20 min using aluminium foil and special clamps; then, the maximum Fv/Fm was measured.

2.3.5. Proline Content

Proline content was determined using a modified method described by Nxele et al. [21]. Sample tissues (0.25 g each) were homogenized in 10 mL of 3% (w/v) sulphosalicylic acid and centrifuged at 1500 rpm for 10 min. About 2 mL of each extract was then mixed with 2 mL of glacial acetic acid and 2 mL of ninhydrin. The reaction mixture was boiled in a bain-marie at 100 °C for 60 min and cooled in an ice bath. In the meantime, 4 mL of toluene was added to the reaction mixture before cooling. Finally, the mixture was vortexed to obtain two separate phases and the absorbance of the upper phase was read at 520 nm using toluene as the blank.

2.3.6. MDA Concentration

MDA content was measured using the method of Du and Bramlage [22]. Leaf sample (0.2 g) was pulverized with liquid nitrogen and 2 mL of 0.1% trichloroacetic acid (TCA) was added to it, ground well, and poured into 2 mL microtubes. It was centrifuged for 5 min at 10,000 rpm by the Eppendorf 5810 R refrigerated centrifuge. At this stage, 0.5 mL of the supernatant of each sample was isolated and mixed in another microtubule with 1 mL of 20% trichloroacetic acid containing 0.5% thiobarbituric acid (TBA). The microtubes were then centrifuged again at 15,000 rpm for 15 min.
MDA value was calculated using the following equation (extinction coefficient (ε) = 155):
MDA= (A532 − A600/155) × (mount of reaction mixture/leaf tissue)

2.3.7. Antioxidant Enzyme Activities

The antioxidant enzymes from barley leaf was extracted using the method Nematpour et al. [23]. Briefly, 0.1 g of fresh leaves were weighed from the plants of each treatment and after pulverization by liquid nitrogen, 1 mL of extraction buffer (including Tris, EDTA, Triton and DTT in a certain ratio) was added to it, and it was poured into a 1.5 mL microtube. The microtubes were centrifuged in the Eppendorf 5810 R refrigerated centrifuge at 12,000 rpm and 4 °C for 30 min, and then the supernatants were used to measure antioxidant enzyme activities.
  • Catalase activity (CAT)
CAT activity was measured using the modified Aebi [24] method by H2O2 decomposition spectrophotometry. For this purpose, 3 mL of 50 mM potassium phosphate buffer (including Na2HPo4 and NaH2Po4 with a specified ratio and pH = 7) and 4.45 μL of 15 mM hydrogen peroxide were mixed with 50 μL of plant extract. CAT activity was determined based on reduced adsorption at 240 nm for 2 min by HITACHI U-1800 spectrophotometer.
b.
Ascorbate peroxidase activity (APX)
APX activity was measured by using the modified method of Nakano and Asada [25]. To start the reaction, 3 mL of 50 mM potassium phosphate buffer (including Na2HPO4 and NaH2PO4 in specified ratio and pH = 7), 1 mL of 5 mM APX, and 4.45 μL of 0.5 mM hydrogen peroxide were mixed with 50 μL of plant extract. APX activity was performed based on reduced adsorption at 290 nm for 2 min by HITACHI U-1800 spectrophotometer.
c.
Peroxidase activity (POX)
The activity of POX was measured using Chance’s [26] method. For this purpose, 3 mL of 50 mM potassium phosphate buffer (including Na2HPO4 and NaH2PO4 with specified ratio and pH = 7), 3.35 μL of guaiacol, and 4.45 μL of 15 mM hydrogen peroxide were mixed with 50 μL of plant extract. POX activity was performed based on reduced adsorption at 470 nm for 2 min by HITACHI U-1800 spectrophotometer.

2.3.8. DPPH Radical Scavenging Assay

Aebi’s (1983) [24] method was used to measure the scavenging of DPPH free radical by leaves extract. Briefly, 0.1 g of plant leaf was pulverized with liquid nitrogen into a 1.5 mL microtube and then 500 μL of 95% ethanol was added. Then, samples were vortexed, placed in a refrigerator for 4 h at 4 °C, and centrifuged for 5 min at 3000 rpm using an Eppendorf 5810 R refrigerated centrifuge. Next, 20 μL of clear supernatant was transferred to new microtubes and mixed with 800 μL of ethanol-soluble DPPH (0.5 mM). The absorbance was read at 517 nm after 30 min of storage in dark conditions using a Unico 2100 spectrophotometer. DPPH solution was used as a control (blank). Finally, DPPH concentration was determined based on a calibration curve made with ascorbic acid (the concentration of ascorbic acid varied from 13 to 100 μg/mL) as standards.

2.3.9. Dry Weight of Shoots and Roots

The shoot and root samples were isolated and washed prior to analysis using an accurate digital scale model SKX1202, and the fresh weights of each pot’s shoots and roots were measured with precision up to 0.01 g. After this step, samples were dried for 72 h at 65 °C and dry weight data were collected to determine the shoot and root dry weights post-harvest.

2.3.10. Seed Weight per Plant

The main spikes of plants in each pot were separated and threshed. The seeds’ weight was measured after physiological maturation.

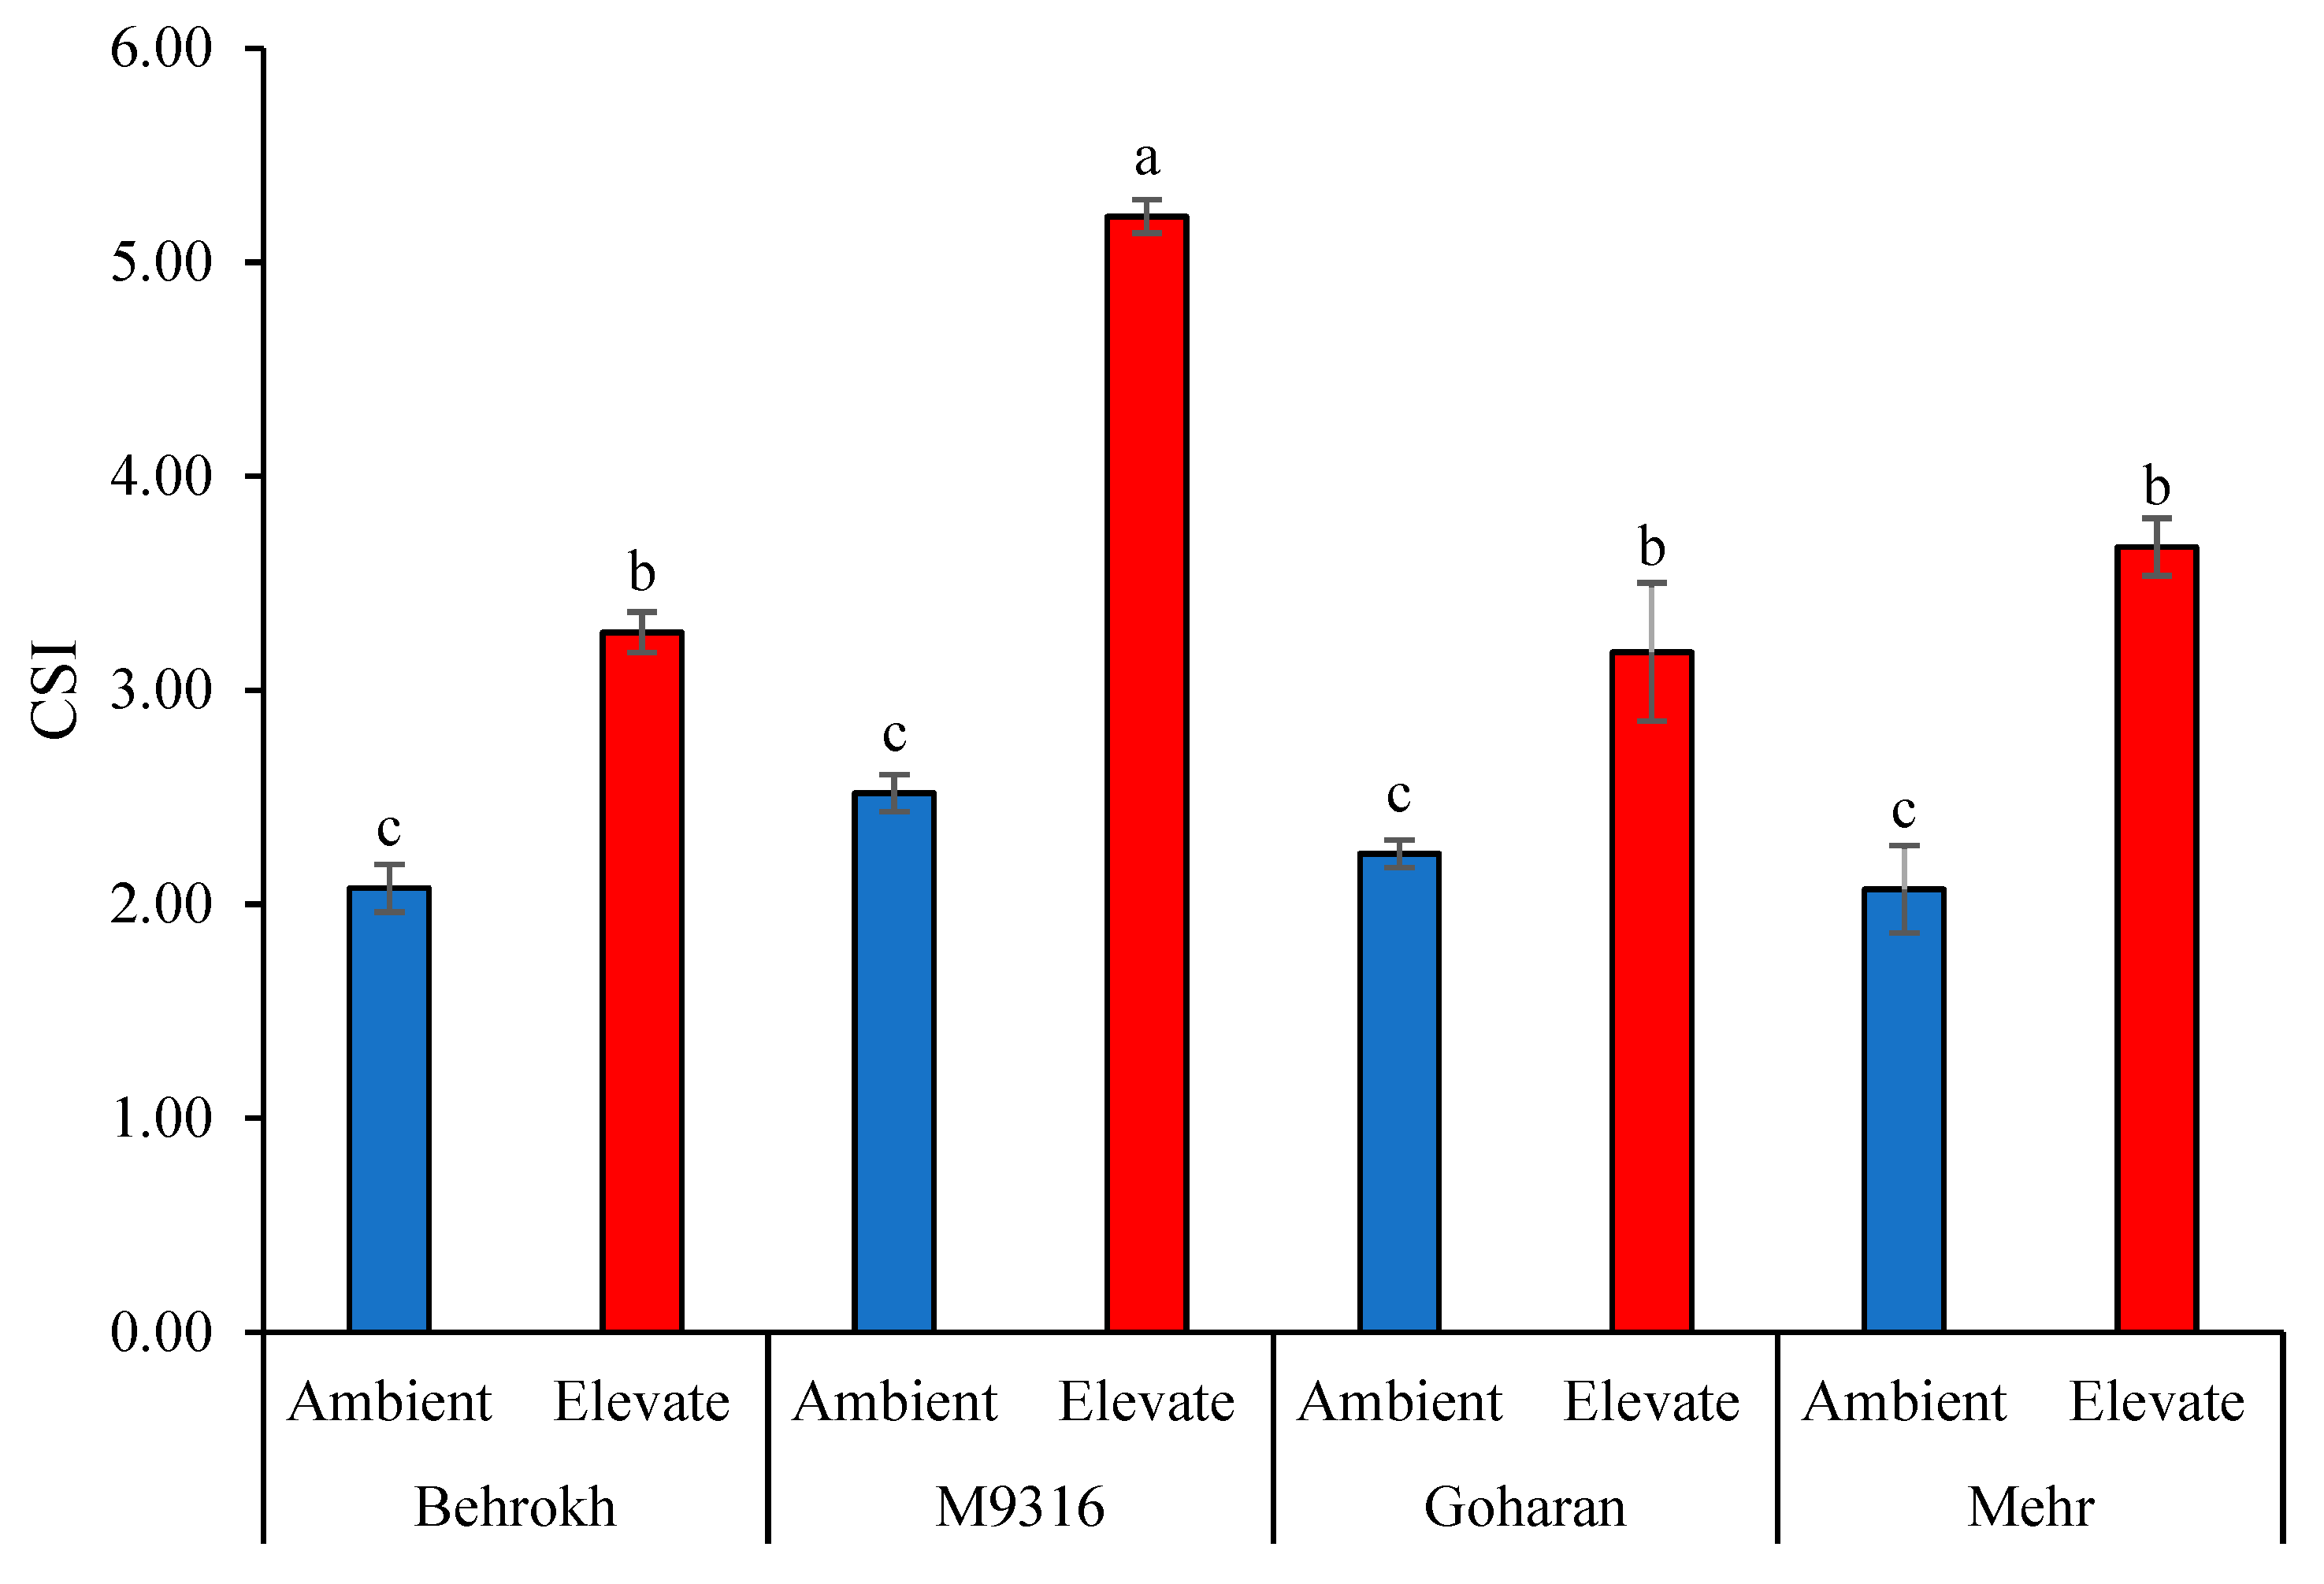
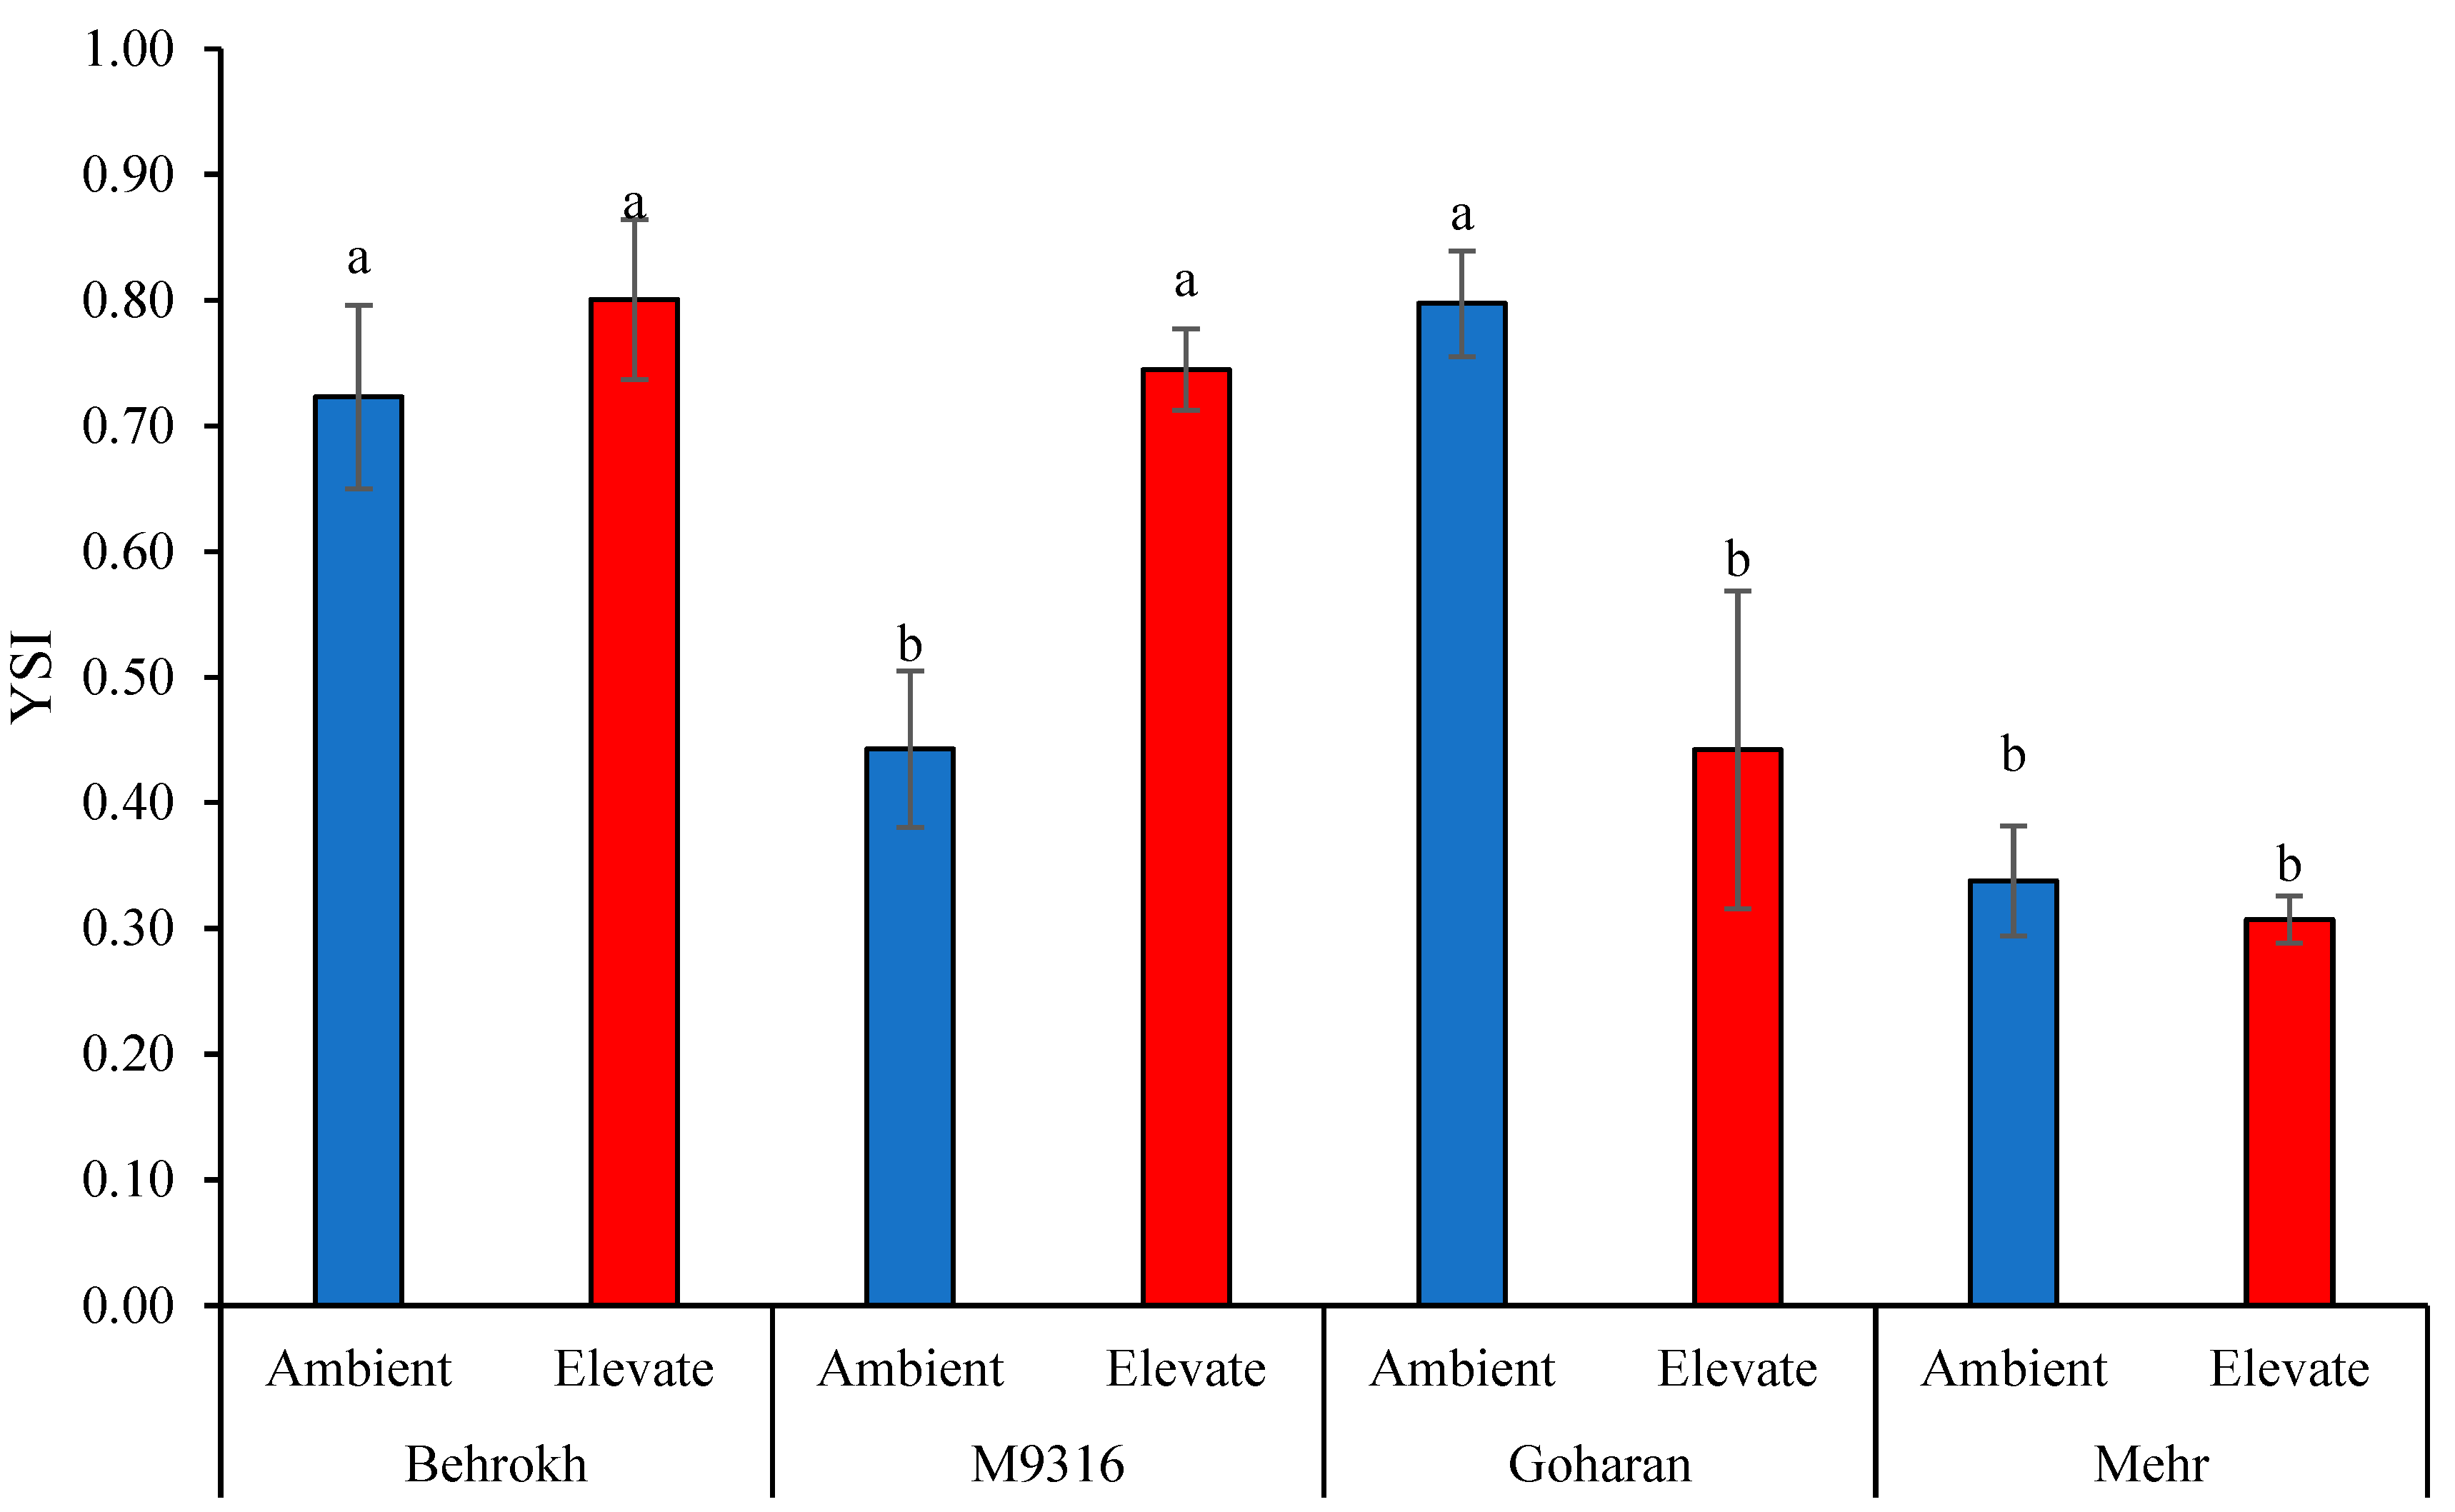
2.3.11. Combination of Significant Indices (CSI) and Yield Stability Index (YSI)

The selection of high yield genotypes under normal and water stress conditions was achieved according to the yield stability index (YSI) and the combination of significant indices (CSI), which were calculated using the following equations according to Sabouri et al. [27]:
YSI = Ys/Yp
CSIi = ½ [(rYP.MP × Mpi) + (rYP.GMP × GMPi) + (rYP.HM × Hmi) + (rYP.STI × STIi) + (rYS.MP × Mpi) + (rYS.GMP × GMPi) + (rYS.HM × Hmi) + (rYS.STI × STIi)
where I is the genotype, r is the correlation coefficients between index and seed yield, MP is the mean productivity, HM is the harmonic mean, GMP is the geometric mean productivity, STI is the stress tolerance index, Ys is the grain yield of an experimental genotype under water stress, and Yp is the seed yield of an experimental genotype under normal conditions.

2.3.12. Statistical Analysis

First, the normality of the data was checked, and all the data procured from different CO2 environments (390 ± 50 and 700 ± 50 μmol mol−1) were analyzed using a two-factor design experiment (moisture conditions × barley genotypes) based on a completely randomized block design [28]. Analysis of variance was performed using the general linear model (GLM) procedure of SAS (ver. 9.4; SAS Institute Inc., Cary, NC, USA), and the least significant difference test (LSD) was then used at the 5% probability level for the comparison of treatment means. Principal component analysis (PCA) was performed, and biplot and heat-mapping drawings were prepared to highlight the contribution of each variable (measured traits) in the genotype differentiation using the Stat Graphics centurion XVIII (http://www.statgraphics.com, accessed on 1 February 2023). JMP (ver.16) software was used to cluster genotypes and measure traits with heat mapping according to Ward’s method [29].

3. Results

3.1. Univariate Data Analysis

The results of the variance analysis of the studied traits over two moisture environments (normal and water stress) and two levels of CO2 concentration are reported in Table 2 and Table 3. The analysis of variance (Table 2) showed that the effect of CO2 concentration was significant (p < 0.05) for all measured traits except Chla, crop antioxidant capacity as evaluated by the activity of plant extracts to scavenge the 2,2-diphenyl-1-picrylhydrazyl (DPPH) and Fv/Fm, and also the effect of genotypes was significant (p < 0.01) for all the traits except for relative water content (RWC). The variance analysis of stress resistance indices showed that the effect of CO2 concentration, genotype, and interaction between genotype and CO2 were significant (p < 0.01) for CSI and YSI indices. In addition, water stress affected all measured traits significantly (p < 0.05), except for POX and Fv/Fm.

3.1.1. Interaction of CO2 and Water Stress

In normal moisture conditions, elevated CO2 increased traits such as ShDW, RDW, LA, GW, Chla, and POX, while decreased MDA levels had no significant effect on the other traits. Moreover, among traits, elevated CO2 had the highest and lowest significant effect on the GW (57.2%) and Chla (15.7%) traits, respectively. Meanwhile, elevated CO2 increased ShDW, RDW, GW, and Chlb under water stress conditions, whereas Proline, MDA, and POX content decreased, and no significant effect was reported on the other traits. Moreover, among traits, elevated CO2 had the highest and lowest significant effect on the RDW (97.5%) and ShDW (13.9%) traits, respectively (Table 3). Water stress in both CO2 concentrations reduced ShDW, RDW, LA, and GW and enhanced Chla, Chlb, Proline, MDA, and POX. In both CO2 levels, water stress had the greatest effect on Proline and caused its sharp increase, while water stress had the least significant effect on LA traits (−21.4%) and RDW (−14.6%) in ambient and elevated CO2 concentrations, respectively (Table 3). Among different treatments, the highest ShDW, RDW, LA, and GW was observed in normal moisture conditions and elevated CO2 concentration, while the highest Chla was observed in water stress (both CO2 concentrations) and the highest of Chlb was observed in water stress and elevated CO2. Moreover, the highest Proline, MDA, and POX traits were observed in water stress and ambient CO2 (Table 3).

3.1.2. Interaction of CO2 and Different Genotypes

The effects of elevated CO2 on all the studied traits were influenced by the barley genotypes (Table 4). Elevated CO2 caused a significant increase in ShDW, RDW, GW, Car, and Fv/Fm in all genotypes; the increase in two-row barley genotypes was much higher than that in the six-row barley. Moreover, elevated CO2 increased Chla and Chlb in all genotypes but it was more elevated in the Mehr and Goharan genotypes (six-row). On the other hand, elevated CO2 decreased Proline, MDA, CAT, APX, and POX in all barley genotypes, which was reduced in the six-row barley genotypes much higher than in two-row barley (Table 4).
Under ambient CO2, the highest ShDW, GW, and Fv/Fm were observed in the M9316, the highest RDW, Proline, MDA, and POX in the Behrokh, the highest Chla, Chlb, APX and Car in Mehr, and also, the highest CAT was observed in the Goharan (Table 4).
Under elevated CO2, the highest ShDW and GW were observed in M9316, similar to normal CO2 concentration. In addition, according to the Table 5, the highest value of MDA, CAT, and APX were reported in M9316. The highest Chla, Chlb and Car in Mehr genotype and the highest Proline, MDA, RDW, and POX in Behrokh were observed (Table 4).
The graph of the effect of different concentrations of CO2 on the studied barley genotypes for the CSI drought stress tolerance index (Figure 2) showed that increasing CO2 increased CSI in two-row and six-row barley genotypes and among the genotypes elevated CO2 had the greatest and least impact on M9316 (107.0%) and Goharan (42.2%), respectively. Under ambient CO2, no significant difference was observed among genotypes in terms of CSI, but under elevated CO2, the M9316 genotype had the highest CSI, and no significant difference was observed between other cultivars (Figure 2). Moreover, triple comparison data were computed considering three different groups of variables: environments (CO2 concentrations), irrigation regimes, and genotype. Results are reported in Table S1.
Meanwhile, the graph of the effect of different concentrations of CO2 on the studied barley genotypes for the YSI drought stress tolerance index (Figure 3) shows that elevated CO2 increased YSI in the M9316 genotype (68.2%) and decreased it in the Goharan genotype (−44.5%), whereas it had no significant effect on the Behrokh and Mehr genotypes. Under ambient CO2, Behrokh and Goharan had the highest YSI and the M9316 and Mehr genotypes had the lowest YSI, but under elevated CO2, Behrokh and M9316 (two-row) had the highest and Goharan and Mehr (six-row) had the lowest YSI (Figure 3).

3.1.3. Interaction Effects of Water Stress and Different Genotypes

Water stress caused a significant decrease in ShDW, RDW, LA, and GW in all genotypes, especially in six-row barley (Mehr and Goharan), while water stress caused a significant increase in Car, Proline, MDA, Chla, Chlb, DPPH, and POX in all genotypes, although this increase was much higher in the genotypes of two-row barley (Behrokh and M9316) (Table 5). In normal moisture conditions, the highest ShDW and LA was observed in the Goharan genotype, the highest RDW was found in Behrokh, the highest GW was observed in the Goharan and Mehr genotypes, the highest amount of Chla, Chlb, Car, Proline, and POX was observed in Behrokh and Mehr, and the highest MDA was observed in the Mehr genotype (Table 5).

3.1.4. Correlation between Ambient CO2 and Two Moisture Conditions (Normal, Water Stress)

Under normal humidity conditions, there were positive and significant correlations between ShDW and GW, RDW with Chla, Proline and POX, RWC with CAT, Chla with Chlb, Car, Proline, APX, POX, and DPPH, Chlb with Car, Car with Proline, POX, and DPPH, Proline with POX and DPPH, MDA with APX and DPPH, APX with POX and DPPH, and POX with DPPH. Moreover, under normal moisture conditions, negative and significant correlations were observed between ShDW with Chlb and CAT, RDW with LA, GW with CAT, LA with Chla, Proline, and POX, and RWC with MDA, respectively (Table 6). Looking at variable correlation under water stress conditions, a positive and significant correlation was identified between ShDW with GW and RWC, RDW with Proline and MDA, Chla with Chlb and Car, Car with CAT, and Proline with POX. In addition, under water stress we observed a negative and significant correlation between ShDW with Chlb, Proline, and POX, RDW with RWC and Fv/Fm, GW with POX and DPPH, LA with Chlb and DPPH, RWC with Proline and MDA, Fv/Fm with Proline and POX, and MDA with DPPH (Table 6).

3.1.5. Correlation between Elevated CO2 and Two Moisture Conditions (Normal, Water Stress)

In normal conditions, there were positive and significant correlations between ShDW with GW, LA, and DPPH, RDW with Car and POX, GW with LA, CAT, and DPPH, LA with APX, Chla with Proline, MDA, and CAT, Car with POX, MDA with CAT and DPPH, CAT with POX and DPPH, and between POX with DPPH. Moreover, in this condition, there was a negative and significant correlation between ShDW with Proline and APX, RDW with POX, GW, LA, CAT, and MDA with APX, Fv/Fm with POX, and APX with DPPH. In normal moisture conditions, there was no significant correlation between Chlb and Proline and any of the traits (Table 7). Under water stress irrigation, a positive and significant correlation was observed between ShDW with GW, LA, and Fv/Fm, RDW with Proline, Chla with Chlb, Car, and APX, Chlb with Car and APX, Car and Proline with MDA, and POX with DPPH. Moreover, a negative and significant correlation between ShDW with Proline, GW with Chla, Chla with Fv/Fm and MDA, Chlb, APX, and Fv/Fm with MDA, and POX with DPPH was observed in water stress conditions (Table 7).

3.2. Multivariate Data Analysis

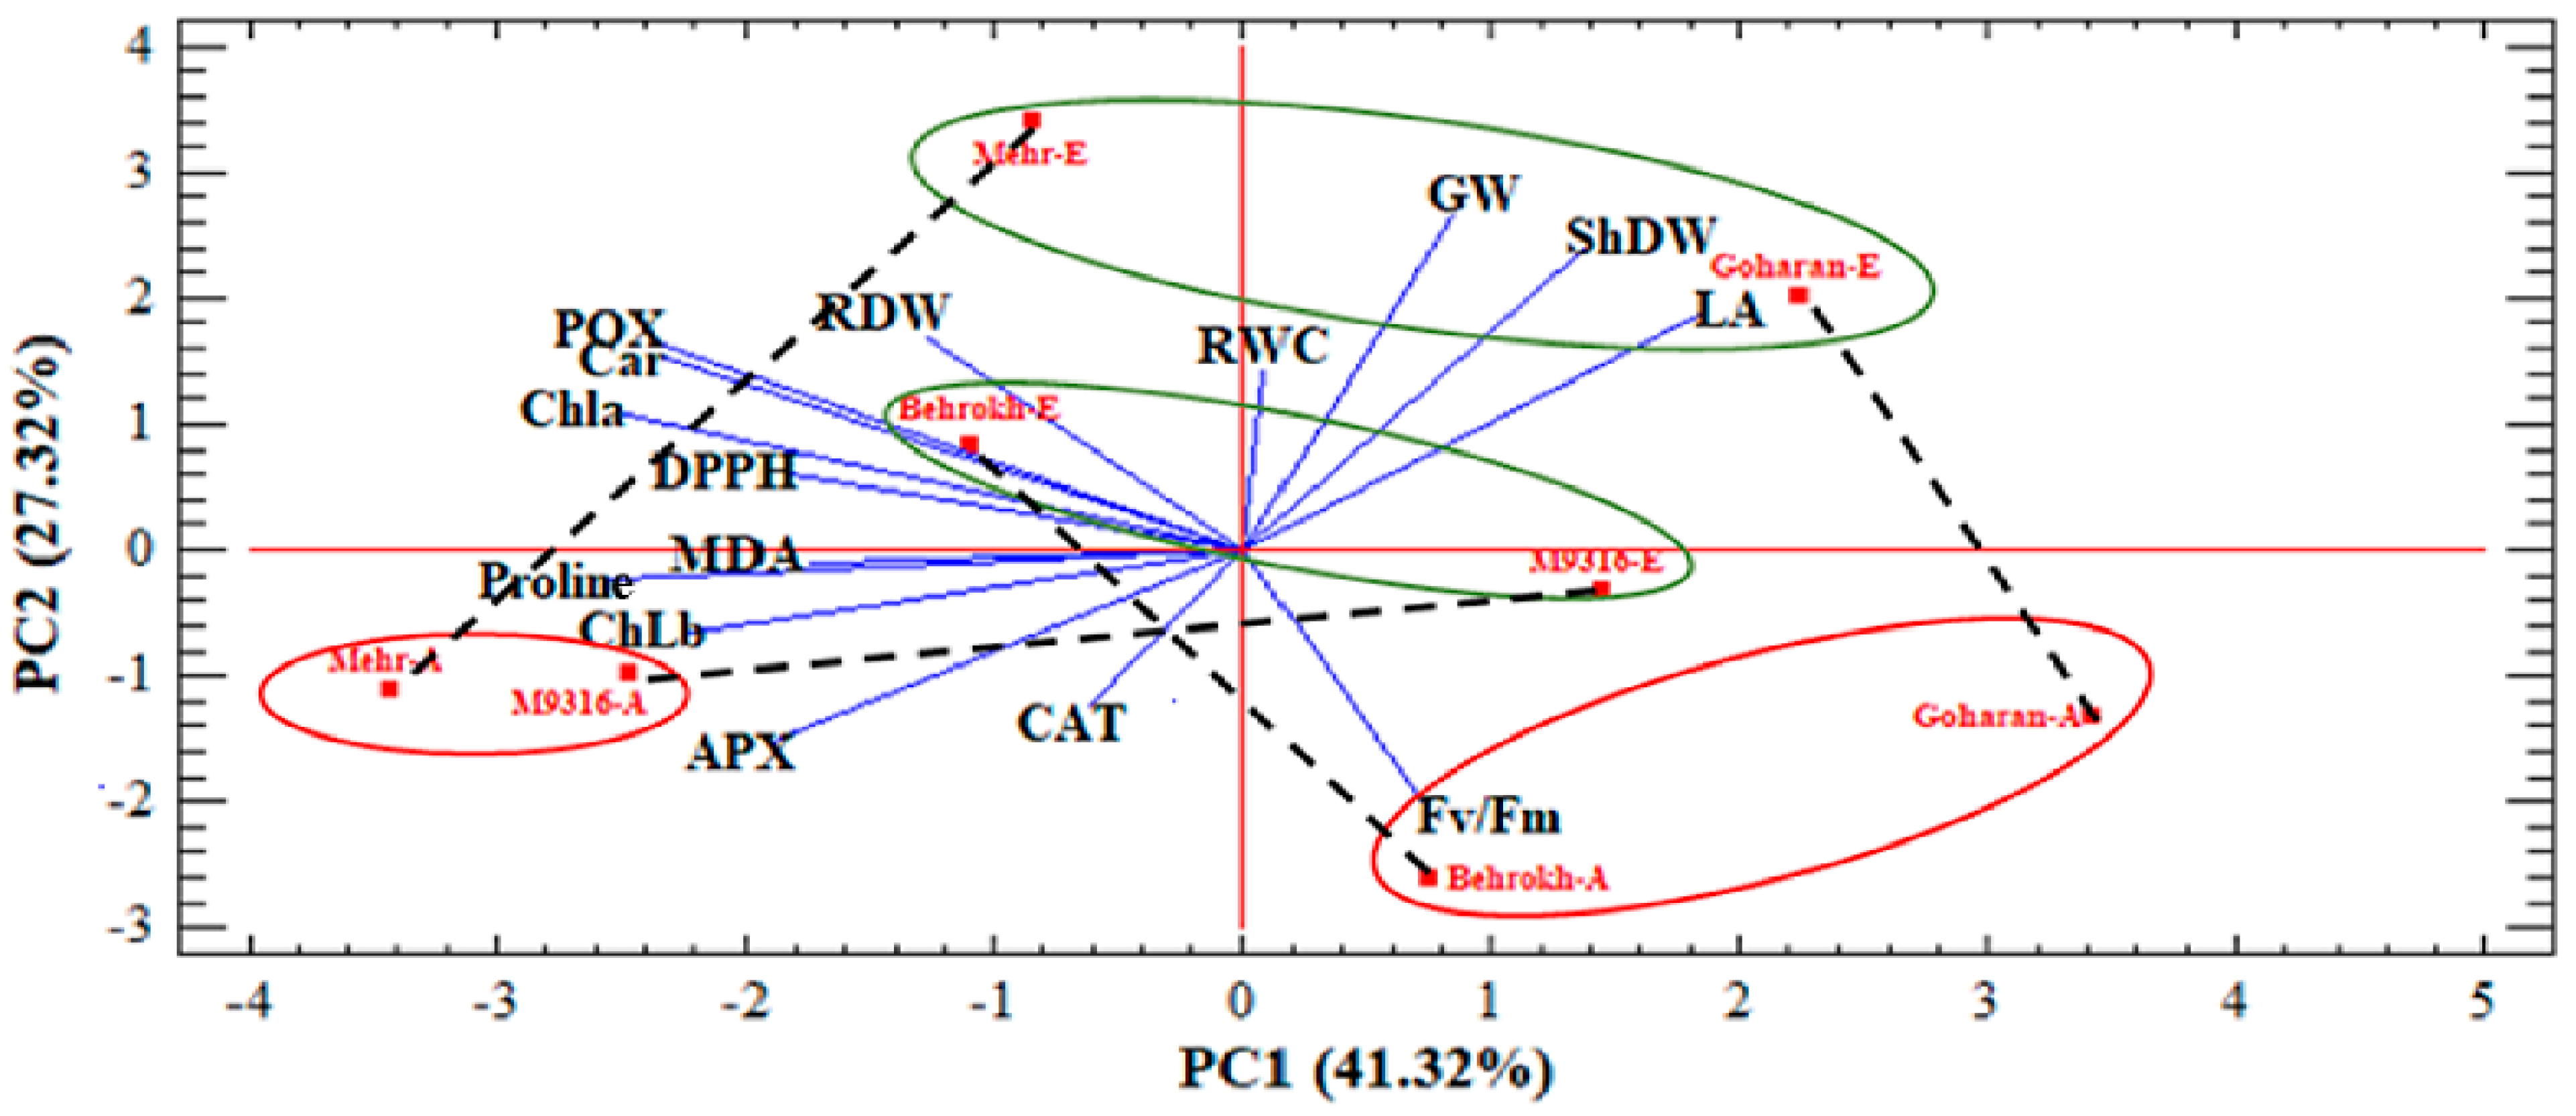
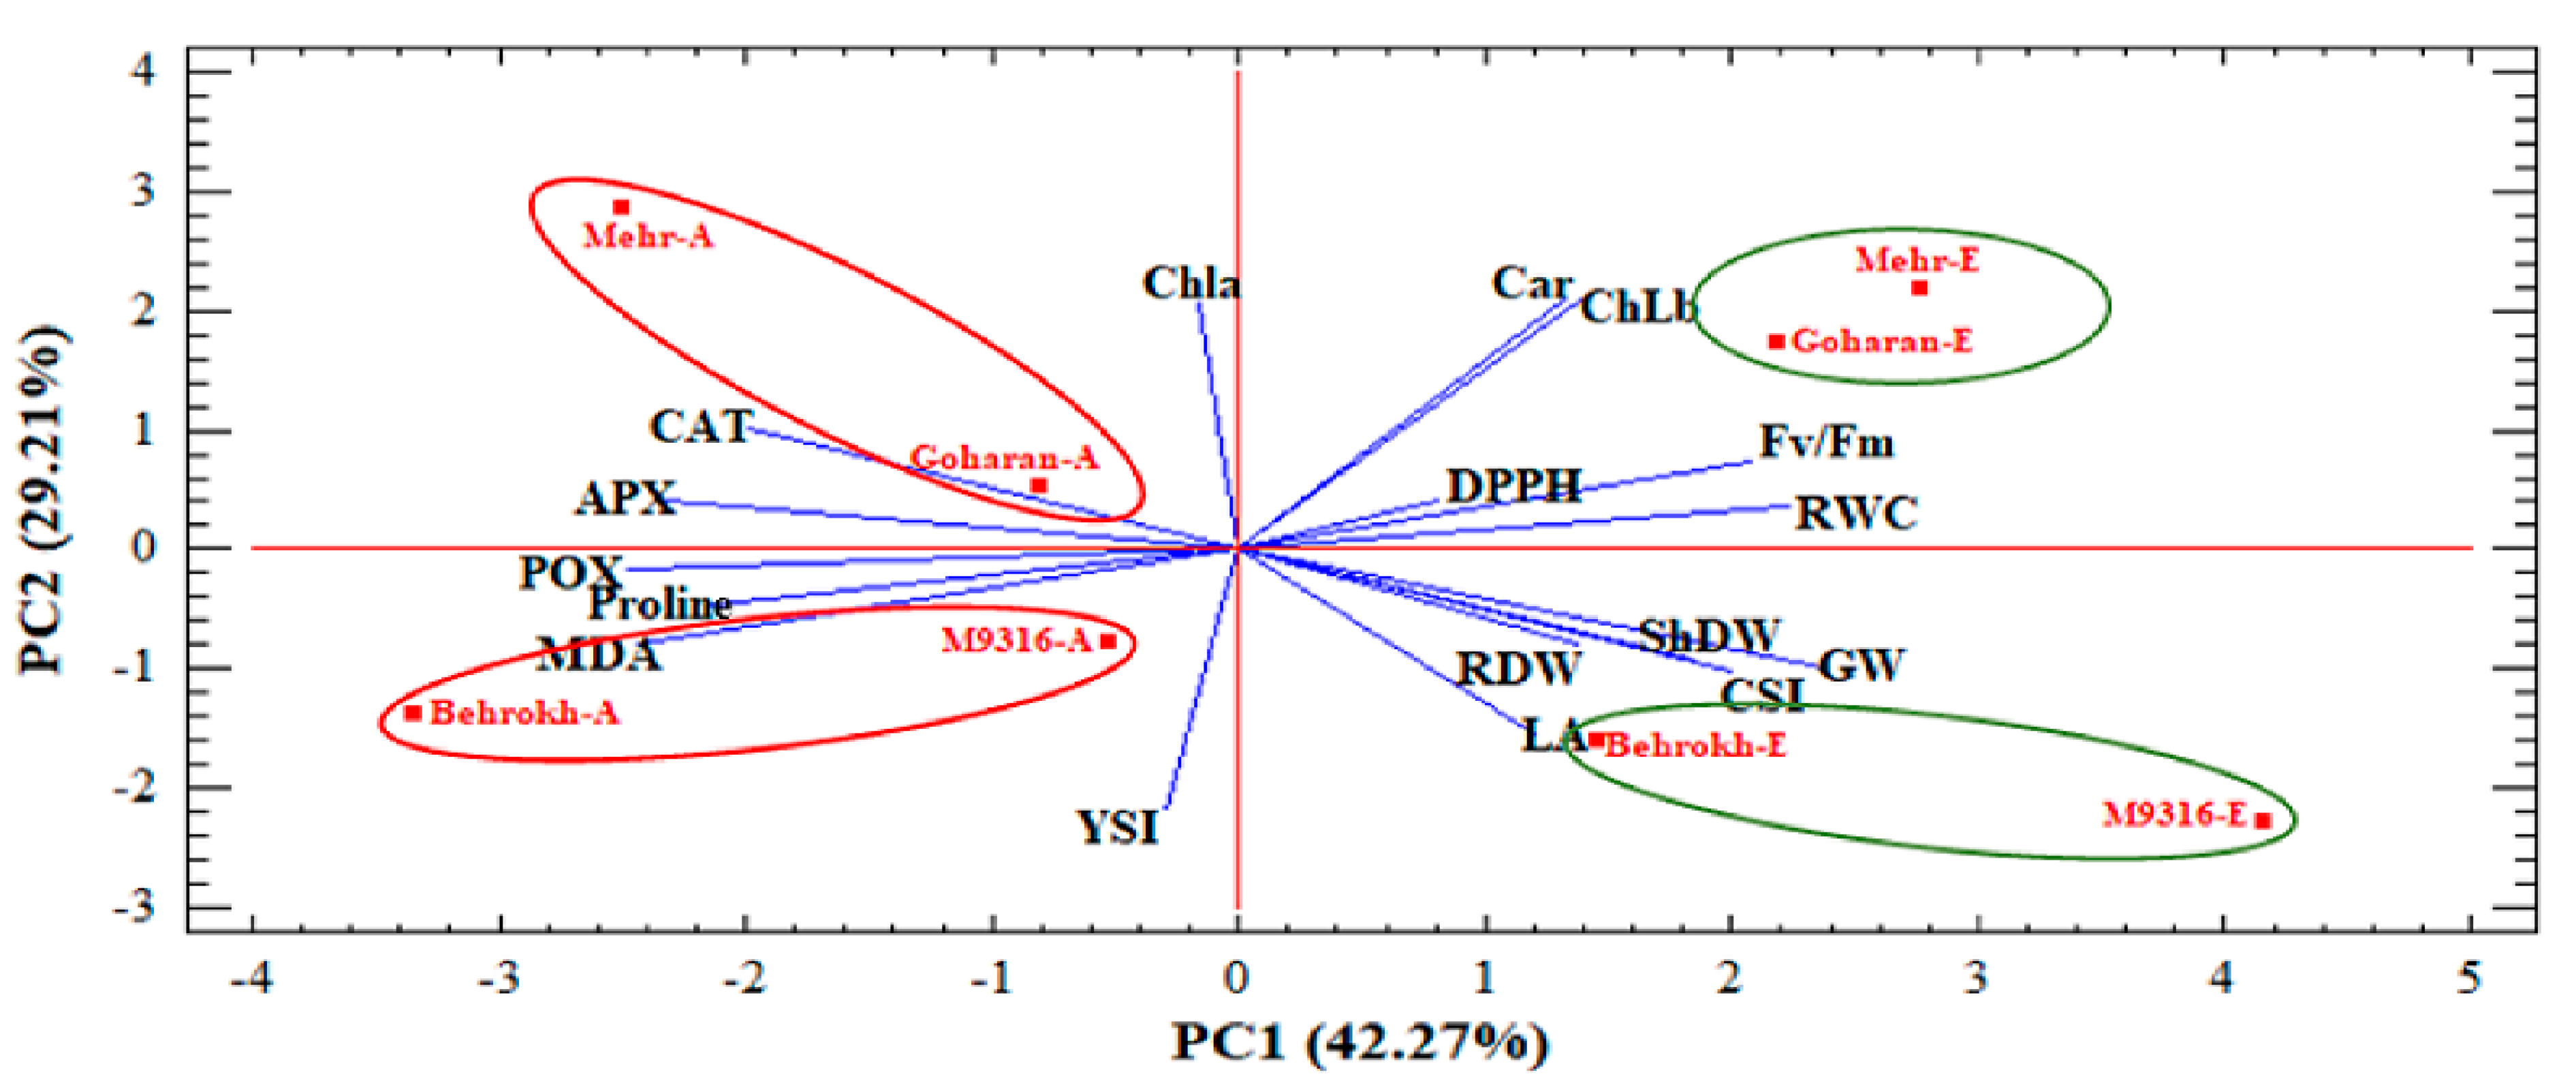
3.2.1. Principal Component Analysis

Based on the univariate data analysis, it was found that the studied two and six-row barley genotypes were significantly affected by the interaction of water stress and CO2 concentration, and the two-row barley was affected more than the six-row barley. Therefore, the interaction effects between genotypes and CO2 concentration under normal and water stress conditions were prepared using biplot analysis (Figure 3 and Figure 4). Under normal moisture conditions, the first two components explained 68.64% of the total variance and 71.48% of the under water stress. Under the normal moisture condition, the first principal component (PC1) had a positive correlation with LA and negatively correlated with Chla, Chlb, Car, Proline, MDA, APX, POX, and DPPH. The second component (PC2) was positively correlated with ShDW, RDW, GW, LA, and RWC and had a negative correlated with Fv/Fm, CAT, and APX. Therefore, PC1 was considered as a “physiological and biochemical component” and PC2 as a “seed productivity component” (Figure 4). The biplot diagram showed that the studied genotypes were divided into four groups and the two-row genotype and six-row genotypes were placed in separate groups for the effect of ambient CO2, which shows the great impact of CO2 concentration. The increase in CO2 concentration made the position of the genotypes more positive compared to PC2, and it also had a much more significant effect on the two-row barley genotypes and caused a greater increase in the amount of enzymes and yield compared to the six-row barley. To select genotypes with higher yield and manage the increase in CO2 amount to produce more yield under normal conditions, six-row barley genotypes (Mehr and Goharan) had the highest yield and yield components in elevated CO2 concentration. Moreover, the dashed lines on the biplot chart (Figure 4) show the intensification of the effect of increasing CO2 concentrations for different genotypes. Mehr genotype was affected more than other genotypes in normal conditions by increasing CO2 concentrations (elevated CO2), followed by Behrokh, Goharan, and M9316.
Under water stress conditions, PC1 explained 42.27% of the total variance and was mainly positively associated with ShDW, RDW, GW, LA, RWC, and Fv/Fm and negative coefficients were associated with Proline, MDA, CAT, APX, and POX (Figure 5). Moreover, PC2 explained 29.21% of the total variance and was positively associated with Chla, Chlb, and Car and negatively associated with YSI and CSI. Therefore, PC1 represents the functional traits and PC2 represents the traits of plant pigments and CSI and YSI indices (Figure 5). Therefore, the second component can be called “the stability component of genotypes in different environmental conditions” based on stress tolerance indices. Moreover, the biplot chart showed that, similar to normal conditions, in water stress conditions, the treatment compounds were divided into four groups, and all the treatments of ambient CO2 were completely separated from the elevated CO2, which shows the great effect of the CO2 concentration. Increasing the CO2 concentration changed the position of the genotypes under moisture stress conditions in terms of PC1 and PC2, and this change was greater in the two-row genotypes than in the six-row genotypes. The biplot results showed that the highest values of stress resistance indices were in the two-row barley genotypes (M9316 and Behrokh) with elevated CO2 concentrations, indicating grain yield stability in the two-row genotypes. According to the mentioned cases, the superior genotypes for yield can be selected with an emphasis on PC1 and for more strength on PC2 (Figure 5).

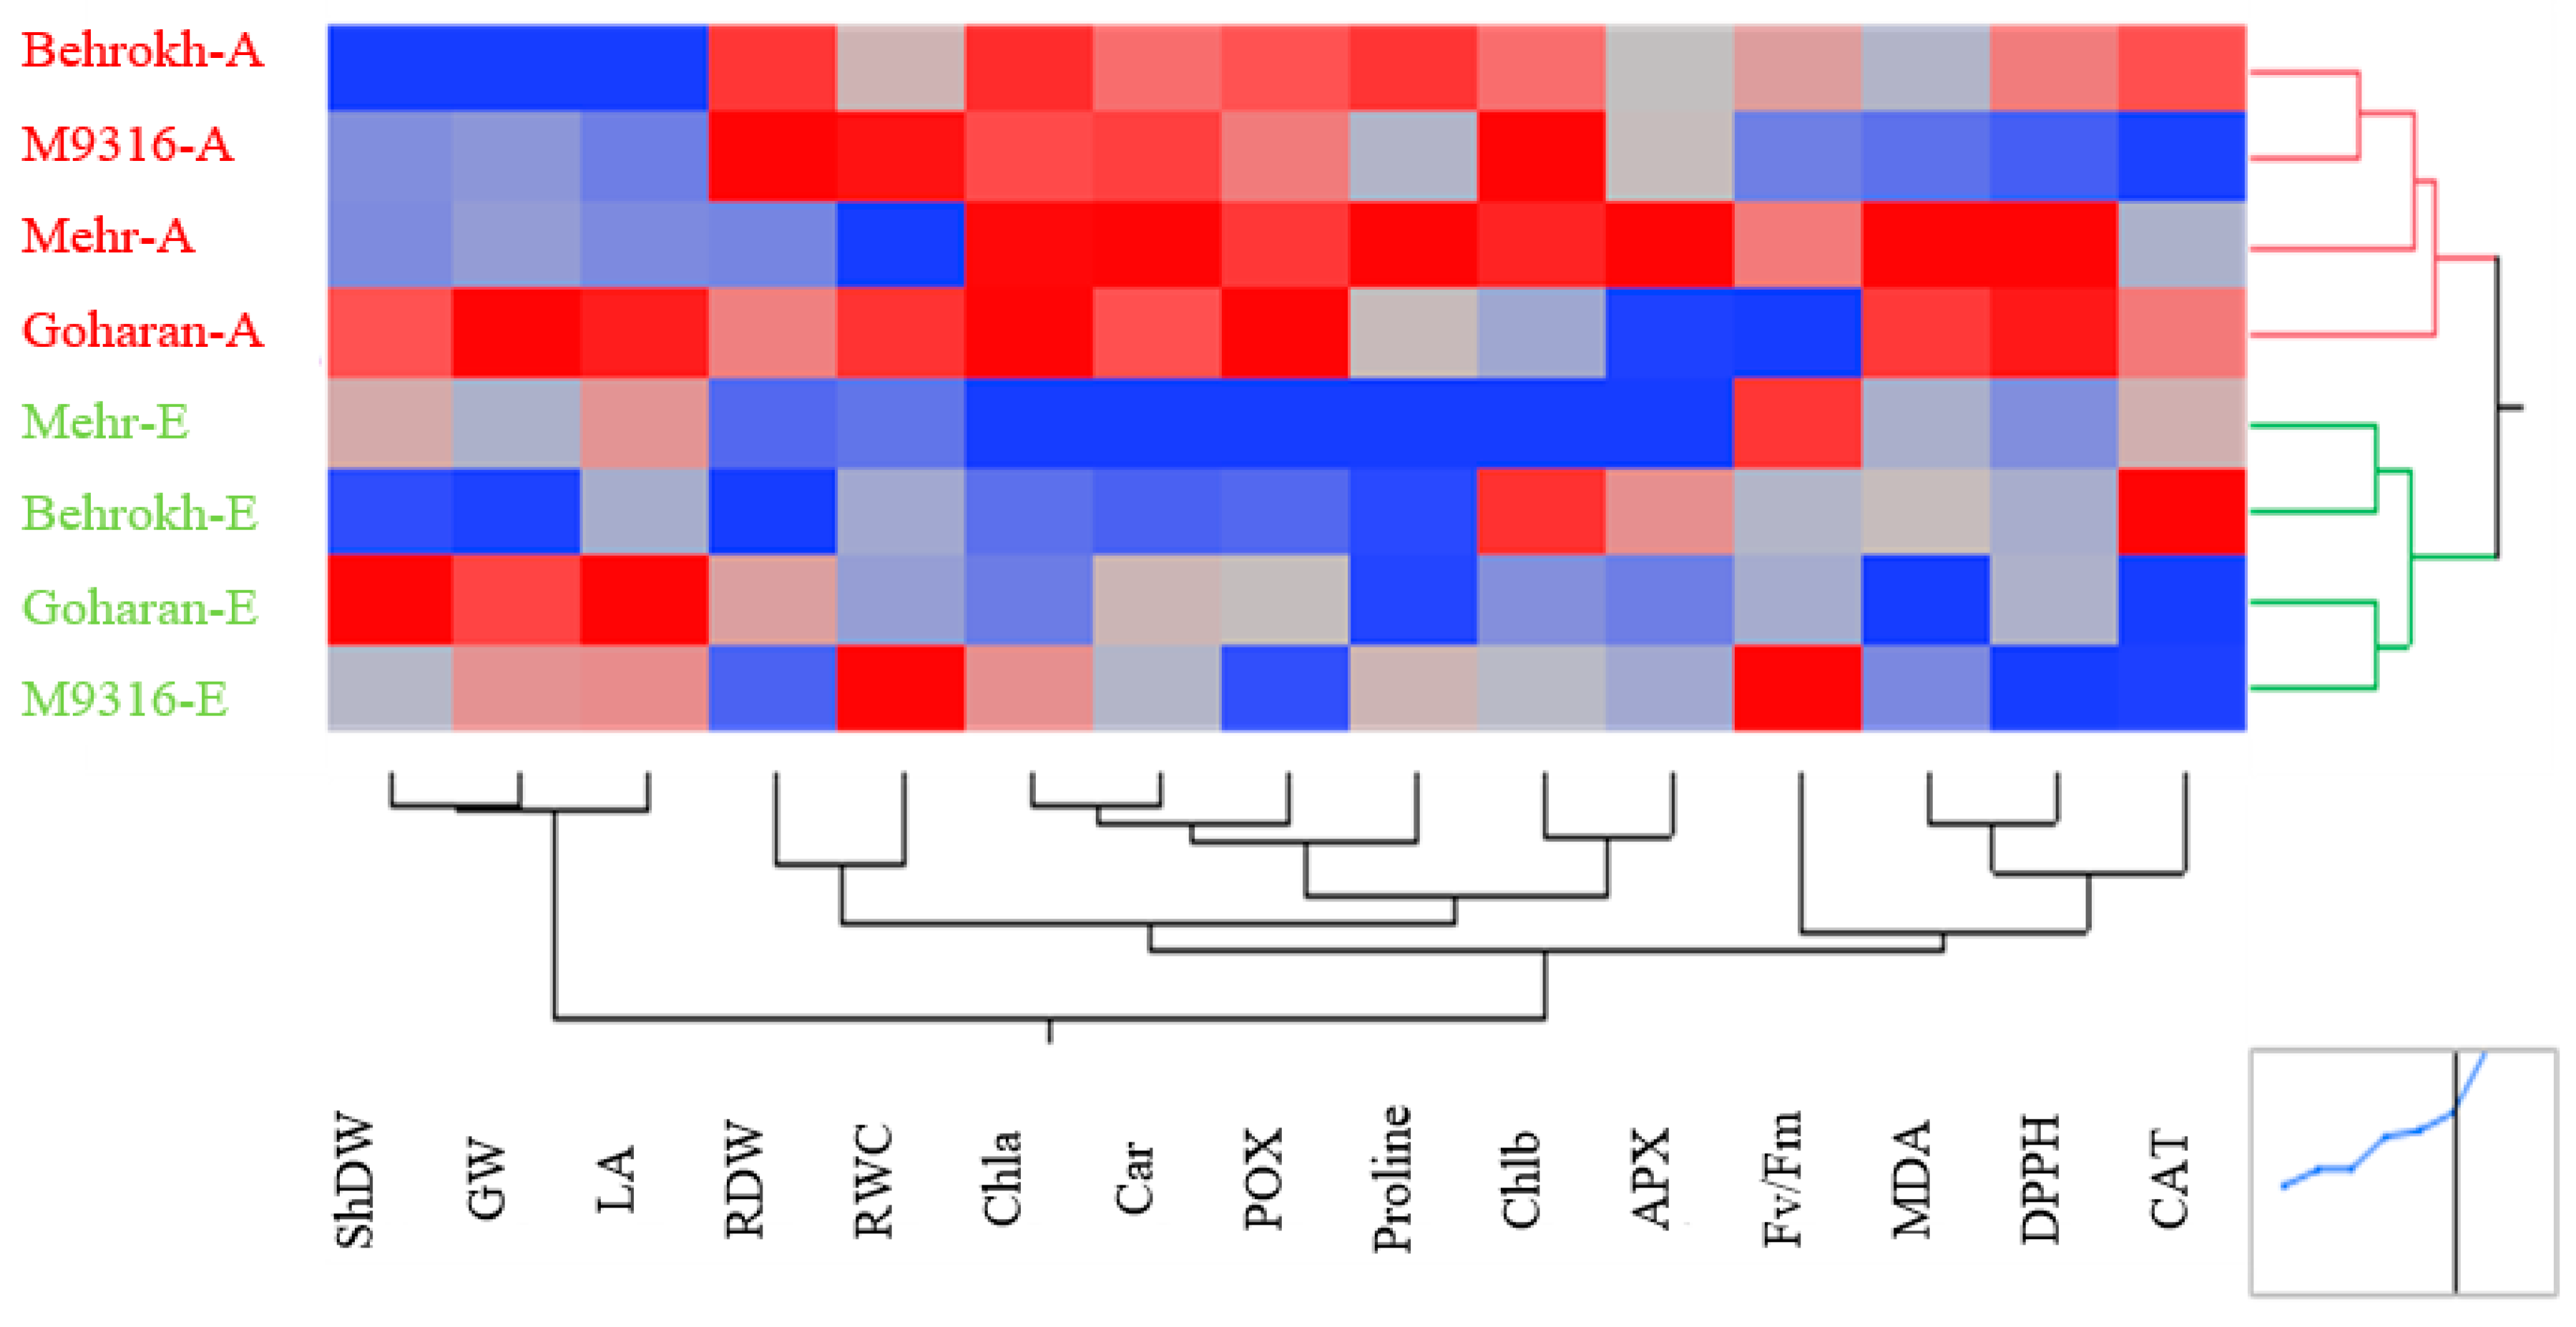
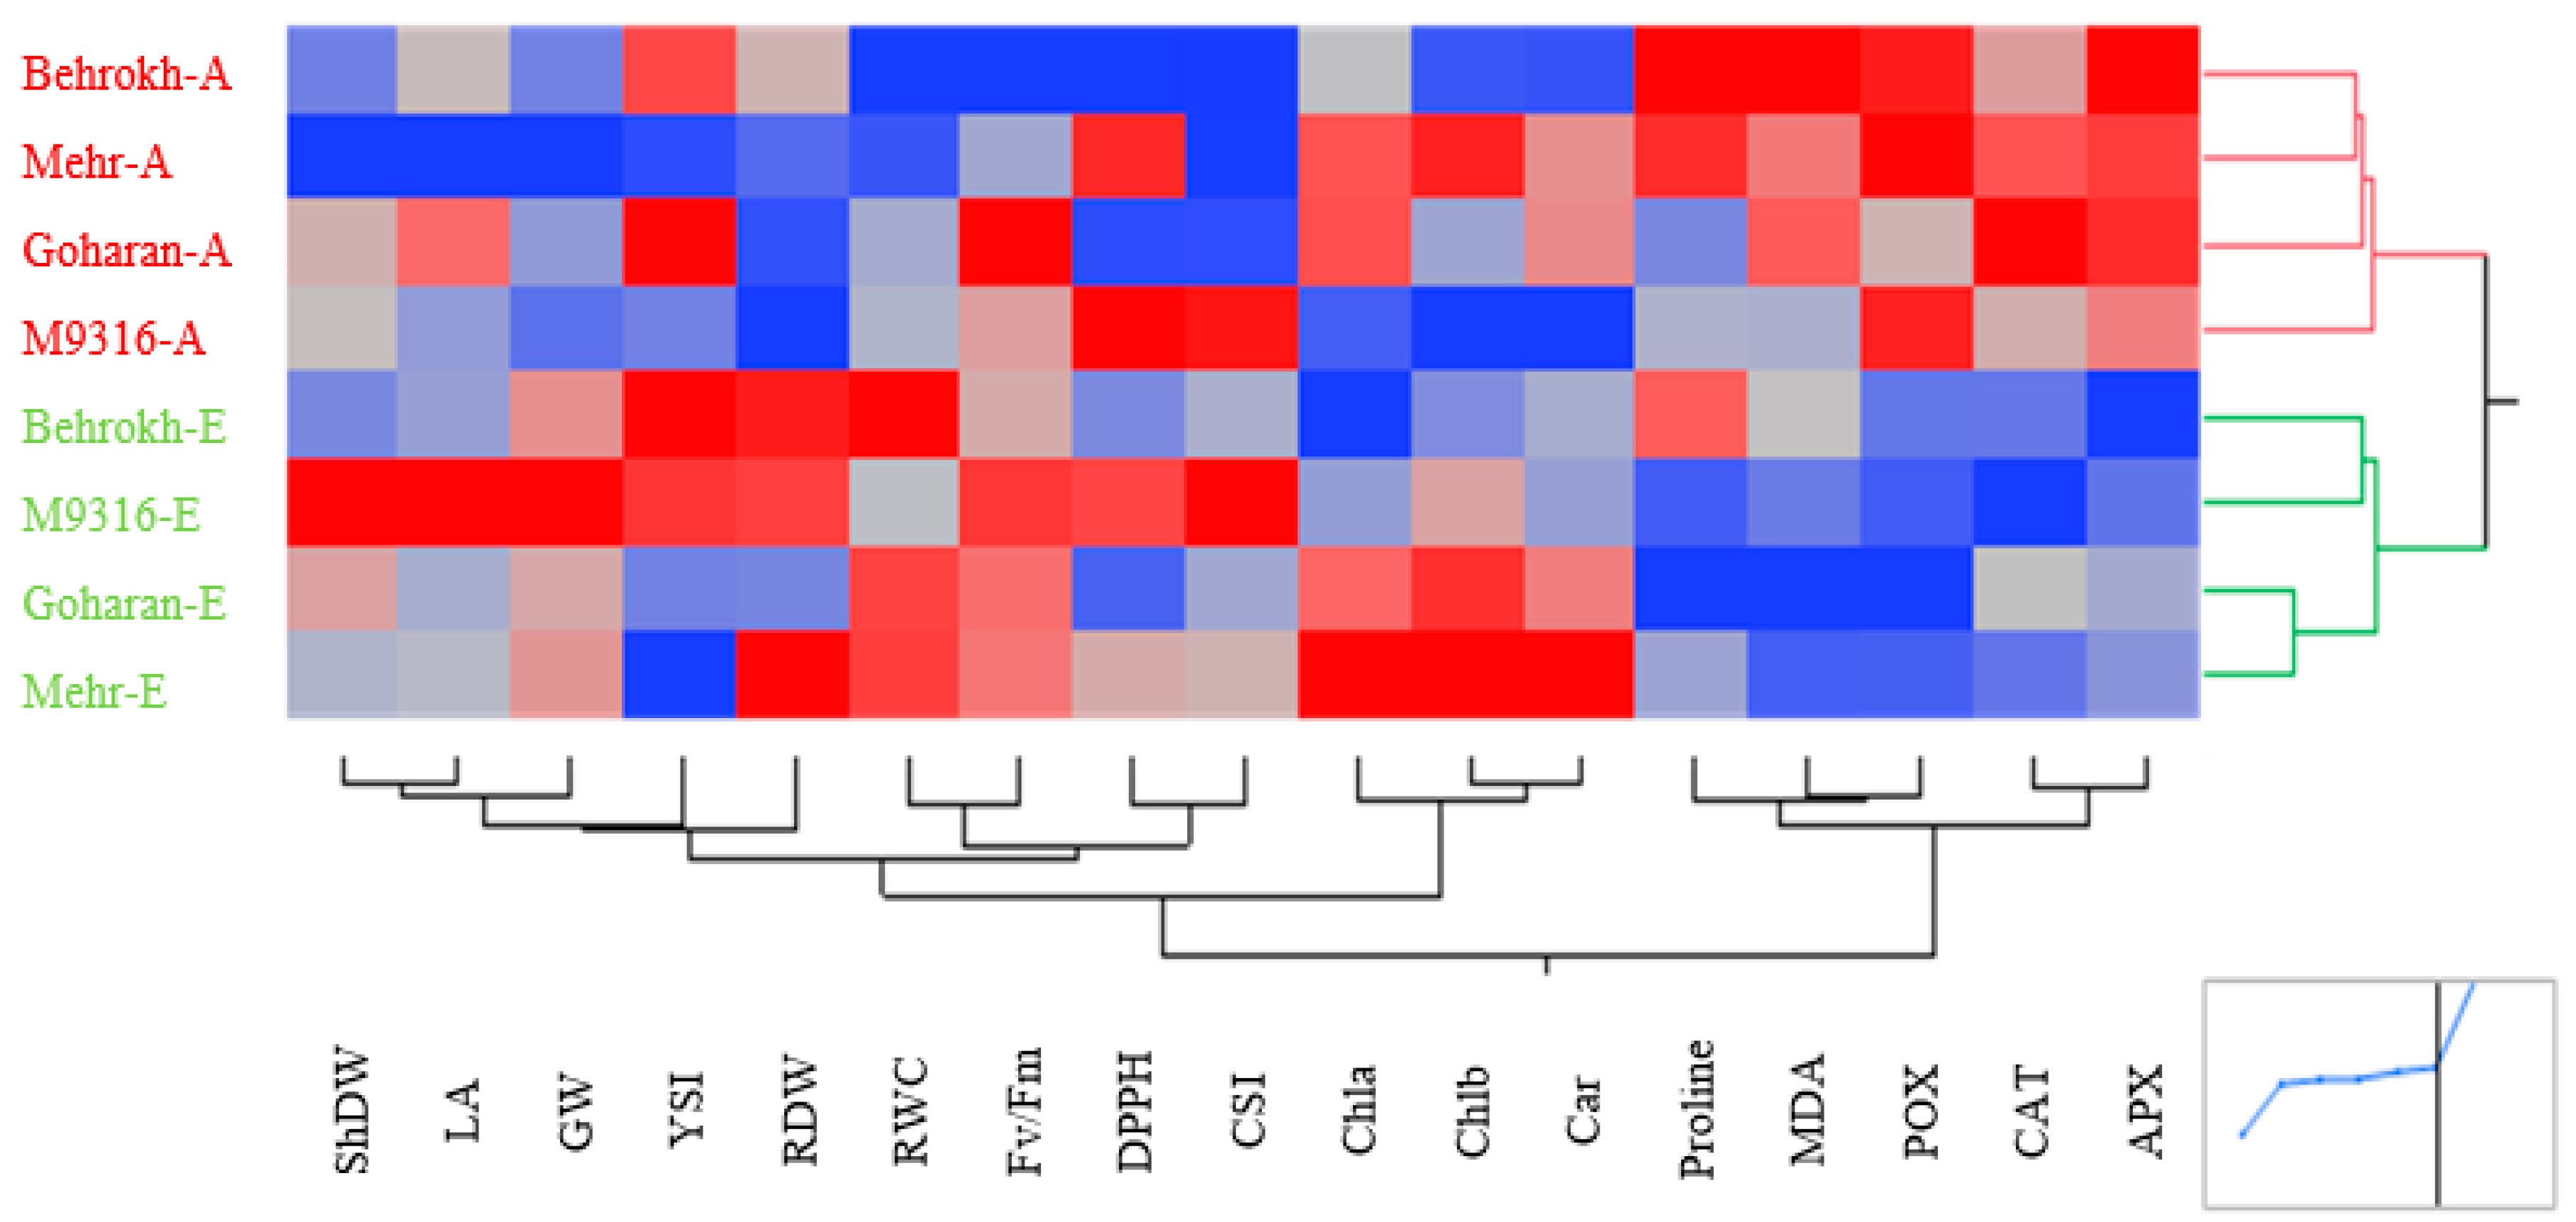
3.2.2. Heatmapping Analysis

The heatmapping graph (Figure 6) under normal moisture conditions shows that the genotypes were placed in two groups. The first group included M9316-A, Goharan-A, Behrokh-A, and Mehr-A; the second group included Behrokh-E, Mehr-E, Goharan-E, and M9316-E. It also shows that the measured traits were also placed in two separate groups. The first group comprises ShDW, GW, and LA traits and the second group includes other traits. According to the heatmapping graph, the first group of genotypes had the lowest amount in terms of the traits of group one and the highest amount in terms of the traits of group two, while the opposite of this situation was seen in the second group of genotypes. Moreover, it was observed that in normal moisture conditions, increasing the amount of CO2 increased ShDW, GW, LA, RDW, and RWC and decreased MDA in all studied genotypes. In contrast, in terms of other traits, the response of the genotypes to increasing CO2 concentration was different (Figure 6). The clustering results showed that the lowest amount of yield under normal conditions was observed in the two-row barley genotypes (Behrokh-A and M9316-A). The increase in the amount of CO2 concentration caused an increase in yield and yield components, which was greater in the six-row varieties (Goharan-E and Mehr-E).
Under water stress conditions, the heat mapping graph shows that all genotypes in the conditions of increased CO2 concentration and normal CO2 were placed in two separate clusters (the first group includes Behrokh-A, Mehr-A, M9316-A, and Goharan-A and the second group comprises Behrokh-E, Goharan-E, M9316-E, and Mehr-E), which shows the high impact of changing CO2 concentrations under stress conditions on the studied genotypes (Figure 6). It also shows that the measured traits were placed in three separate groups. The first group included ShDW, LA, GW, YSI, RDW, RWC, Fv/Fm, DPPH, and CSI traits, the second group included Chla, Chlb, and Car, and the third group included Proline, MDA, POX, CAT, and APX. The first group of genotypes had the lowest amount in the traits of the first two groups and the highest amount in the traits in the third group, while the opposite was seen in the second group of genotypes. Moreover, it was observed that in water stress conditions, increasing the amount of CO2 decreased Proline, MDA, APX, POX, and CAT and increased ShDW, GW, RDW, RWC, Fv/Fm, Chlb, and Car in all studied genotypes, while in terms of other traits, the response of genotypes to increasing CO2 concentration was different (Figure 7). Moroever, the heatmap results show that the highest amount of drought stress resistance indices was observed in the two-row barley genotypes, which indicates the greater resistance of these genotypes to climate changes. Moreover, the results show that two-row barley genotypes compared to six-row barley showed a more stable yield with increasing CO2 concentrations under moisture stress conditions.

4. Discussion

Water stress significantly affects plants’ physical and physiological mechanisms, leading to severe effects on the growth and performance of crops. The initial objective of this study was to investigate the interaction effect of increasing CO2 and water stress on the grain yield and the amount of secondary metabolites, including proline and other antioxidants, of two-row and six-row genotypes of barley. In general, water stress significantly decreased ShDW, RDW, LA, and GW in both six-row and two-row barley genotypes. However, the decrease was more pronounced in the six-row barley genotypes compared to the two-row barley genotypes. Moreover, in terms of biochemical responses, water stress had contrasting effects on certain compounds in the two-row and six-row barley genotypes. The two-row barley genotypes exhibited a greater increase in Car, Proline, MDA, Chla, Chlb, DPPH, and POX compared to the six-row barley genotypes. Car, MDA, and Proline are known to play a crucial role in plant protection against oxidative stress, which is often induced by water stress [30,31,32]. The increase in Chla and Chlb contents could be attributed to the adaptive response of plants to enhance light capture and maximize photosynthetic efficiency under water stress conditions [33]. Moreover, the elevation in DPPH and POX activity suggests the activation of antioxidant defence mechanisms to counteract the increased production of ROS resulting from water stress [34].
Elevated CO2 positively impacted several traits under both normal and water stress conditions. In normal conditions, there was an increase in ShDW, RDW, LA, GW, Chla, and POX, and a decrease in MDA. Under water stress conditions, there was an increase in ShDW, RDW, and GW and a decrease in Proline, MDA, and POX. Indeed, under water stress, plants exposed to elevated CO2 maintain a higher capacity for growth and biomass accumulation compared to ambient CO2 (Table 3 and Table 4). These findings align with the study of Leakey et al. [35], which reported increased biomass under elevated CO2 and water stress conditions in maize. In addition, a decrease in MDA levels indicates reduced lipid peroxidation and membrane damage, reflecting a positive effect of elevated CO2 on plant stress tolerance [36].
Elevated CO2 resulted in a substantial increase in ShDW, RDW, GW, Car, and Fv/Fm in all genotypes (Table 4), indicating enhanced growth, biomass accumulation, photosynthetic pigments, and photosynthetic efficiency under elevated CO2 conditions. Ainsworth and Rogers [37] reported increased biomass and grain yield in barley under elevated CO2. Additionally, elevated CO2 has enhanced photosynthetic performance and increased carotenoid content in various plant species [7]. The increase in Fv/Fm suggests improved photosynthetic capacity and light energy utilization under elevated CO2 conditions [38].
Conversely, elevated CO2 caused a decrease in Proline, MDA, CAT, APX, and POX in all barley genotypes (Table 4), indicating altered stress responses and antioxidant activity. Studies showed that under high CO2 conditions, reduction in proline suggests a modulation of osmotic adjustment mechanisms and reduced stress tolerance, a decrease in MDA levels indicates reduced lipid peroxidation and oxidative damage in plants exposed, and a decrease in CAT, APX, and POX activity suggests a downregulation of antioxidant defence mechanisms in response to elevated CO2 [38].
Moreover, the responses to elevated CO2 varied between two-row and six-row barley genotypes. The increase in ShDW, RDW, GW, Car, and Fv/Fm was much higher in two-row barley genotypes compared to six-row barley genotypes, indicating potential genotype-specific differences in growth and photosynthetic responses to elevated CO2. Similarly, the decrease in proline, MDA, CAT, APX, and POX was much higher in six-row barley genotypes than in two-row barley genotypes under elevated CO2 conditions.
The effects of elevated CO2 on CSI and YSI showed mixed responses among the genotypes. Elevated CO2 increased CSI in both two-row and six-row barley genotypes, indicating potential changes in the processes, causing resistance in the plant (Figure 1 and Figure 2). However, the response of YSI varied among genotypes, with some genotypes showing an increase in YSI while others exhibited a decrease. These findings suggest that elevated CO2 can influence stress resistance and yield stability in barley, potentially reflecting alterations in plant physiology, resource allocation, and carbon and nitrogen metabolism.
Under normal moisture and water stress conditions and ambient CO2 concentration, positive correlations were observed between ShDW with GW and RDW with Chla, Proline, and POX. Moreover, there were negative correlations between ShDW with proline, POX, and Chlb and GW with POX and DPPH under water stress (Table 6). These results show that in the water stress condition, the plant spends a large part of its energy on the production of antioxidants and secondary metabolites in order to be able to tolerate the stress conditions, which leads to less grain production and a reduced yield. These results were consistent with Ahanger et al. [39]. In elevated CO2 concentrations, positive correlations were observed between ShDW with GW, LA, and DPPH under normal and water stress and negative correlations with APX. This suggests that increased shoot dry weight is associated with higher levels of leaf pigments, larger leaf size, enhanced antioxidant activity, and enzymatic defense mechanisms [7,40].
The PCA and heatmapping analyses were employed to evaluate the physiological responses of two and six-row barley genotypes to the interaction of water stress and CO2 concentration. The results revealed significant effects of these factors on the studied genotypes, with the two-row barley being more affected than the six-row barley. The biplot results in the normal environment, similar to the correlation results, showed that there is a positive and significant relationship between grain yield, ShDW, and LA, and due to the increase in CO2 concentration, the amount of these traits increased in the studied genotypes, and the highest amount of grain yield and yield components was observed in six-row barley genotypes (Goharan-E and Mehr-E). Moreover, the values of DPPH, POX, Car, Proline, and APX had a positive and significant correlation, and due to the increase in CO2 concentration, their values also increased, and this increase was more obvious in the two-row barley genotypes (Behrokh-E and M9316-E). In the water stress environment, the increase in CO2 concentration caused an increase in the concentration of secondary metabolites and antioxidant enzymes, and this increase was more prominent in Behrokh and M9316. Moreover, the drought stress tolerance indices in two-row barley genotypes were higher than in six-row barley, indicating stability in grain yield and greater resistance to stress in this group. The heatmapping analysis demonstrated distinct patterns in genotype clustering and trait distribution, highlighting the significant impact of changing CO2 concentrations on genotype performance and physiological responses. Research shows that under water-limited conditions and elevated CO2 concentrations, plants often increase the synthesis and accumulation of secondary metabolites, such as phenolics, flavonoids, and terpenoids. These compounds act as antioxidants, scavenging ROS and protecting cellular components from oxidative damage, so increased levels of secondary metabolites contribute to enhanced water stress tolerance in barley by mitigating oxidative stress and maintaining cellular homeostasis [41,42]. In addition, the two-row barley genotypes (Behrokh and M9316) had higher grain yield, biomass, and secondary metabolites such as proline, POX, and APX antioxidants under water stress conditions and elevated CO2 concentration. According to these studies, higher CO2 concentration causes the stomatal openings to receive more carbon dioxide and thus creates resistance in these genotypes. Vasilaki et al. [43] reported that under moisture stress conditions, the amount of stress resistance and seed yield due to stomatal regulation and increased proline were higher in two-row barley genotypes than in six-row. The findings contribute to our understanding of the potential effects of climate change on barley genotypes and suggest that specific genotypes, particularly two-row barley, exhibit higher resistance to drought stress and greater stability in yield under elevated CO2 conditions. These findings have implications for crop improvement strategies and the selection of genotypes with desirable traits for sustainable agriculture in the face of changing environmental conditions.

5. Conclusions

This study investigated the effects of different levels of CO2 concentration and moisture environments on the traits of two and six-row barley genotypes. The results of univariate data analysis showed that elevated CO2 levels affect the measured parameters differently, with a general decrease in antioxidant contents and an increase in yield-related traits. The drought stress tolerance indices were also influenced by CO2 concentration, with increased CO2 levels decreasing the indices. Under normal moisture conditions, data indicate a significant effect of CO2 concentration, with a greater increase in enzymes and yield observed in two-row barley genotypes. Under water stress conditions, the highest stress resistance indices were observed in two-row barley genotypes with elevated CO2 concentrations, suggesting their stability in grain yield. In conclusion, this study demonstrated that CO2 concentration and moisture environments significantly influenced various traits in two and six-row barley genotypes. These data offer a comprehensive adaptation scheme of barley genotypes to CO2 increase, deepening and thus representing an innovative starting point for the constitution and management of new cultivars adapted to the cooccurrence of different stress conditions.
Overall, the obvious CO2-induced changes will have implications for the grain quality of barley concerning healthy food, industrial processing, and market value, since elevated CO2 levels had different effects on traits under normal and water stress. Experimental evidence for these impacts is sometimes contradictory, suggesting that further multi-year research with a wider range of cultivars is required to estimate the consequences for barley quality aspects in a future high-CO2 world.

Supplementary Materials

The following supporting information can be downloaded at: https://www.mdpi.com/article/10.3390/agronomy13092373/s1, Table S1: Interaction effects of CO2 concentrations, water stress and different genotypes of barley on traits.

Author Contributions

Conceptualization, H.R.E. and M.Z.; Data curation, M.Z.K.; Formal analysis, S.B., S.S. and S.Z.; Methodology, S.B. and S.Z.; Project administration, F.V. and M.V.; Software, S.Z.; Supervision, F.V. and M.V.; Validation, M.N.; Visualization, M.N.; Writing—original draft, S.B., H.R.E., M.Z., S.Z., M.Z.K. and M.N.; Writing—review and editing, S.B., H.R.E., M.Z., S.Z., M.Z.K., M.N., F.V. and M.V. All authors have read and agreed to the published version of the manuscript.

Funding

This research received no external funding.

Data Availability Statement

Not applicable.

Conflicts of Interest

The authors declare no conflict of interest.

References

  1. Karimifard, S.; Moghadasi, R.; Yazdani, S.; Mohammadinejad, A. The Economic Impact of Climate Change on Agricultural Crops Yield in Khuzestan (Case study: Wheat, Barley, and Rice). Eur. Online J. Nat. Soc. Sci. Proc. 2016, 4, 2254. [Google Scholar]
  2. Seleiman, M.F.; Al-Suhaibani, N.; Ali, N.; Akmal, M.; Alotaibi, M.; Refay, Y.; Dindaroglu, T.; Abdul-Wajid, H.H.; Battaglia, M.L. Drought Stress Impacts on Plants and Different Approaches to Alleviate Its Adverse Effects. Plants 2021, 10, 259. [Google Scholar] [CrossRef] [PubMed]
  3. Chandio, A.A.; Jiang, Y.; Amin, A.; Akram, W.; Ozturk, I.; Sinha, A.; Ahmad, F. Modeling the impact of climatic and non-climatic factors on cereal production: Evidence from Indian agricultural sector. Environ. Sci. Pollut. Res. 2022, 29, 14634–14653. [Google Scholar] [CrossRef] [PubMed]
  4. Shabbir, A.; Dhileepan, K.; Zalucki, M.P.; Adkins, S.W. Biological control under a changing climate: The efficacy of the parthenium weed stem-galling moth under an atmosphere enriched with CO2. Biol. Control 2019, 139, 104077. [Google Scholar] [CrossRef]
  5. Srinivasarao, C.; Kundu, S.; Shanker, A.K.; Naik, R.P.; Vanaja, M.; Venkanna, K.; Sankar, M.; Naresh, K. Continuous cropping under elevated CO2: Differential effects on C4 and C3 crops, soil properties and carbon dynamics in semi-arid alfisols. Agric. Ecosyst. Environ. 2016, 218, 73–86. [Google Scholar] [CrossRef]
  6. Chaudhry, S.; Sidhu, G.P.S. Climate Change Regulated Abiotic Stress Mechanisms in Plants: A Comprehensive Review; Springer: Berlin/Heidelberg, Germany, 2022; Volume 41, ISBN 0029902102759. [Google Scholar]
  7. Chen, Y.; Wei, Z.; Wan, H.; Zhang, J.; Liu, J.; Liu, F. CO2 Elevation and Nitrogen Supply Alter the Growth and Physiological Responses of Tomato and Barley Plants to Drought Stress. Agronomy 2022, 12, 1821. [Google Scholar] [CrossRef]
  8. Bogati, K.; Walczak, M. The Impact of Drought Stress on Soil Microbial Community, Enzyme Activities and Plants. Agronomy 2022, 12, 189. [Google Scholar] [CrossRef]
  9. Wu, J.; Wang, J.; Hui, W.; Zhao, F.; Wang, P.; Su, C.; Gong, W. Physiology of Plant Responses to Water Stress and Related Genes: A Review. Forests 2022, 13, 324. [Google Scholar] [CrossRef]
  10. Moustakas, M.; Sperdouli, I.; Moustaka, J. Early Drought Stress Warning in Plants: Color Pictures of Photosystem II Photochemistry. Climate 2022, 10, 179. [Google Scholar] [CrossRef]
  11. Amare, K.; Mashilla, D.; Alex Albert, V.; Firew, M. Saved barley (Hordeum vulgare) seed quality in mid-altitudes and high-lands of Southern Ethiopia. Afr. J. Agric. Res. 2014, 9, 448–454. [Google Scholar] [CrossRef]
  12. Kreszies, T.; Shellakkutti, N.; Osthoff, A.; Yu, P.; Baldauf, J.A.; Zeisler-Diehl, V.V.; Ranathunge, K.; Hochholdinger, F.; Schreiber, L. Osmotic stress enhances suberization of apoplastic barriers in barley seminal roots: Analysis of chemical, transcriptomic and physiological responses. New Phytol. 2019, 221, 180–194. [Google Scholar] [CrossRef]
  13. Feiziasl, V.; Jafarzadeh, J.; Sadeghzadeh, B.; Mousavi Shalmani, M.A. Water deficit index to evaluate water stress status and drought tolerance of rainfed barley genotypes in cold semi-arid area of Iran. Agric. Water Manag. 2022, 262, 107395. [Google Scholar] [CrossRef]
  14. Miralles, D.J.; Abeledo, L.G.; Prado, S.A.; Chenu, K.; Serrago, R.A.; Savin, R. Barley. In Crop Physiology Case Histories for Major Crops; Elsevier: Amsterdam, The Netherlands, 2021; pp. 164–195. [Google Scholar]
  15. Munaweera, T.I.K.; Jayawardana, N.U.; Rajaratnam, R.; Dissanayake, N. Modern plant biotechnology as a strategy in addressing climate change and attaining food security. Agric. Food Secur. 2022, 11, 26. [Google Scholar] [CrossRef]
  16. Bardehji, S.; Eshghizadeh, H.R.; Zahedi, M.; Sabzalian, M.R.; Gheisari, M. The combined effect of nitrogen fertilizer and sowing season on response to water-limited stress in barley (Hordeum vulgare L.). J. Agric. Sci. 2021, 159, 31–49. [Google Scholar] [CrossRef]
  17. Zadoks, J.C.; Chang, T.T.; Konzak, C.F. A decimal code for the growth stages of cereals. Weed Res. 1974, 14, 415–421. [Google Scholar] [CrossRef]
  18. Kramer, P.J.; Boyer, J.S. Water Relations of Plants and Soils; Academic Press: Cambridge, MA, USA, 1995. [Google Scholar]
  19. Barrs, H.D.; Weatherley, P.E. A Re-Examination of the Relative Turgidity Techniques for Estimating Water Deficits in Leaves. Aust. J. Biol. Sci. 1962, 15, 413–428. [Google Scholar] [CrossRef]
  20. Lichtenthaler, H.K. Chlorophylls and carotenoids: Pigments of photosynthetic biomembrane. Methods Enzymol. 1987, 148, 350–382. [Google Scholar]
  21. Nxele, X.; Klein, A.; Ndimba, B.K. Drought and salinity stress alters ROS accumulation, water retention, and osmolyte content in sorghum plants. S. Afr. J. Bot. 2017, 108, 261–266. [Google Scholar] [CrossRef]
  22. Du, Z.; Bramlage, W.J. Modified Thiobarbituric Acid Assay for Measuring Lipid Oxidation in Sugar-Rich Plant Tissue Extracts. J. Agric. Food Chem. 1992, 40, 1566–1570. [Google Scholar] [CrossRef]
  23. Nematpour, A.; Eshghizadeh, H.R.; Abraheh, M. Interactive effects of CO2 and nitrogen supply on growth and physiological traits of millet cultivars under drought stress. Arch. Agron. Soil Sci. 2019, 12, 1476–3567. [Google Scholar] [CrossRef]
  24. Aebi, H.I. Catalase in vitro. In Methods in Enzymology; Academic Press: Cambridge, MA, USA, 1983; Volume 105, pp. 673–686. [Google Scholar]
  25. Nakano, Y.; Asada, K. APX Nakano & Asada 1981.pdf. Plant Cell Physiol. 2018, 22, 867–880. [Google Scholar]
  26. Chance, B.; Maehly, A.C. Assay of catalases and peroxidases. Methods Enzymol. 1955, 2, 764–775. [Google Scholar]
  27. Sabouri, A.; Dadras, A.R.; Azari, M.; Saberi Kouchesfahani, A.; Taslimi, M.; Jalalifar, R. Screening of rice drought-tolerant lines by introducing a new composite selection index and competitive with multivariate methods. Sci. Rep. 2022, 12, 2163. [Google Scholar] [CrossRef] [PubMed]
  28. Shapiro, S.S.; Wilk, M.B. An analysis of variance test for normality (complete samples). Biometrika 1965, 52, 591–611. [Google Scholar] [CrossRef]
  29. Ward, J.H., Jr. Hierarchical Grouping to Optimize an Objective Function. J. Am. Stat. Assoc. 1963, 58, 236–244. [Google Scholar] [CrossRef]
  30. Gill, S.S.; Tuteja, N. Reactive oxygen species and antioxidant machinery in abiotic stress tolerance in crop plants. Plant Physiol. Biochem. 2010, 48, 909–930. [Google Scholar] [CrossRef]
  31. Hayat, S.; Hayat, Q.; Alyemeni, M.N.; Wani, A.S.; Pichtel, J.; Ahmad, A. Role of proline under changing environments: A review. Plant Signal. Behav. 2012, 7, 1456–1466. [Google Scholar] [CrossRef]
  32. Abdelrahman, M.; Jogaiah, S.; Burritt, D.J.; Tran, L.S.P. Legume genetic resources and transcriptome dynamics under abiotic stress conditions. Plant Cell Environ. 2018, 41, 1972–1983. [Google Scholar] [CrossRef]
  33. Flexas, J.; Bota, J.; Galmés, J.; Medrano, H.; Ribas-Carbó, M. Keeping a positive carbon balance under adverse conditions: Responses of photosynthesis and respiration to water stress. Physiol. Plant. 2006, 127, 343–352. [Google Scholar] [CrossRef]
  34. Hasanuzzaman, M.; Nahar, K.; Gill, S.S.; Fujita, M. Drought Stress Responses in Plants, Oxidative Stress, and Antioxidant Defense. Clim. Chang. Plant Abiotic Stress Toler. 2013, 9, 209–250. [Google Scholar]
  35. Leakey, A.D.B.; Uribelarreà, M.; Ainsworth, E.A.; Naidu, S.L.; Rogers, A.; Ort, D.R.; Long, S.P. Photosynthesis, productivity, and yield of maize are not affected by open-air elevation of CO2 concentration in the absence of drought. Plant Physiol. 2006, 140, 779–790. [Google Scholar] [CrossRef] [PubMed]
  36. Mhamdi, A.; Noctor, G.; Baker, A. Plant catalases: Peroxisomal redox guardians. Arch. Biochem. Biophys. 2012, 525, 181–194. [Google Scholar] [CrossRef] [PubMed]
  37. Ainsworth, E.A.; Rogers, A. The response of photosynthesis and stomatal conductance to rising [CO2]: Mechanisms and environmental interactions. Plant Cell Environ. 2007, 30, 258–270. [Google Scholar] [CrossRef] [PubMed]
  38. Velikova, V.; Sharkey, T.D.; Loreto, F. Formation of Reactive Oxygen Species; Landes Bioscience: Austin, TX, USA, 2012; pp. 1–3. [Google Scholar]
  39. Ahanger, M.A.; Qin, C.; Begum, N.; Maodong, Q.; Dong, X.X.; El-Esawi, M.; El-Sheikh, M.A.; Alatar, A.A.; Zhang, L. Nitrogen availability prevents oxidative effects of salinity on wheat growth and photosynthesis by up-regulating the antioxidants and osmolytes metabolism, and secondary metabolite accumulation. BMC Plant Biol. 2019, 19, 479. [Google Scholar] [CrossRef]
  40. Valero-Galván, J.; González-Fernández, R.; Navarro-Cerrillo, R.M.; Gil-Pelegrín, E.; Jorrín-Novo, J.V. Physiological and proteomic analyses of drought stress response in Holm oak provenances. J. Proteome Res. 2013, 12, 5110–5123. [Google Scholar] [CrossRef] [PubMed]
  41. Yadav, B.; Jogawat, A.; Rahman, M.S.; Narayan, O.P. Secondary metabolites in the drought stress tolerance of crop plants: A review. Gene Rep. 2021, 23, 101040. [Google Scholar] [CrossRef]
  42. Zare, S.; Mirlohi, A.; Sabzalian, M.R.; Saeidi, G.; Koçak, M.Z.; Hano, C. Water Stress and Seed Color Interacting to Impact Seed and Oil Yield, Protein, Mucilage, and Secoisolariciresinol Diglucoside Content in Cultivated Flax (Linum usitatissimum L.). Plants 2023, 12, 1632. [Google Scholar] [CrossRef]
  43. Vasilaki, C.; Katsileros, A.; Doulfi, D.; Karamanos, A.; Economou, G. Evaluation of seven barley genotypes under water stress conditions. Agron. Res. 2022, 20, 1–14. [Google Scholar]
Figure 1. Experiment set up. (A) Two-row and six-row barley plant pots under Ambient CO2 (right) and El-evated CO2 (left) concentration, just before applying drought stress, (B) CO2 concentration ad-justment device in the greenhouse to apply the CO2 concentration factor.
Agronomy 13 02373 g001
Figure 2. The interaction effects of genotype and different CO2 concentrations on drought tolerance index CSI. The same letter above columns for each trait (diagram) indicates that values are not statistically different (p > 0.05). Values are mean ± standard error. Environments: Ambient CO2 (400 ± 50 µmol mol−1) and Elevated CO2 (700 ± 50 µmol mol−1).
Agronomy 13 02373 g002
Figure 3. The interaction effects of genotype and different CO2 concentrations on drought tolerance index YSI. The same letter above columns for each trait (diagram) indicates that values are not statistically different (p > 0.05). Values are mean ± standard error. Environments: Ambient CO2 (400 ± 50 µmol mol−1) and Elevated CO2 (700 ± 50 µmol mol−1).
Agronomy 13 02373 g003
Figure 4. Principal component analysis of the relationship among the studied traits and the distribution of barley genotypes relative to these traits under normal moisture conditions and two different CO2 concentrations. ShDW: Shoot dry weight (g plant−1), RDW: Root dry weight (g plant−1), GW: Grain weight (g plant−1), LA: Leaf area (cm2 plant−1), RWC: relative water content (%), Chla: chlorophyll a content, Chlb: chlorophyll b content, Car: carotenoids content (mg g−1 FW), Fv/Fm: the quantum efficiency of photosystem II, Proline: leaf proline content (μmol g−1 FW), MDA: malondialdehyde (nmolg−1 FW), CAT: catalase specific activity (units mg–1 protein), APX: ascorbate peroxidase specific activity (units mg–1 protein), POX: peroxidase specific activity (units mg−1 protein), DPPH: 2,2-diphenyl-1-picrylhydrazyl scavenging assay (mg mL–1). dash lines indicate the distance between each genotype with different CO2 concentrations (A: ambient, E: elevated) of PCs.
Agronomy 13 02373 g004
Figure 5. Principal component analysis of the relationship among the studied traits and the distribution of barley genotypes relative to these traits under water stress conditions and two different CO2 concentrations. ShDW: Shoot dry weight (g plant−1), RDW: Root dry weight (g plant−1), GW: Grain weight (g plant−1), LA: Leaf area (cm2 plant−1), RWC: relative water content (%), Chla: chlorophyll a content, Chlb: chlorophyll b content, Car: carotenoids content (mg g−1 FW), Fv/Fm: the quantum efficiency of photosystem II, Proline: leaf proline content (μmol g−1 FW), MDA: malondialdehyde (nmolg−1 FW), CAT: catalase specific activity (units mg–1 protein), APX: ascorbate peroxidase specific activity (units mg–1 protein), POX: peroxidase specific activity (units mg−1 protein), DPPH: 2,2-diphenyl-1-picrylhydrazyl scavenging assay (mg mL–1).
Agronomy 13 02373 g005
Figure 6. Heat-mapping diagram related to the studied traits of barley genotypes under normal conditions and two different CO2 concentrations. The dark blue color indicates the lowest value of the characters, and the dark red color indicates the highest value. ShDW: Shoot dry weight (g plant−1), RDW: Root dry weight (g plant−1), GW: Grain weight (g plant−1), LA: Leaf area (cm2 plant−1), RWC: relative water content (%), Chla: chlorophyll a content, Chlb: chlorophyll b content, Car: carotenoids content (mg g−1 FW), Fv/Fm: the quantum efficiency of photosystem II, Proline: leaf proline content (μmol g−1 FW), MDA: malondialdehyde (nmolg−1 FW), CAT: catalase specific activity (units mg–1 protein), APX: ascorbate peroxidase specific activity (units mg−1 protein), POX: peroxidase specific activity (units mg−1 protein), DPPH: 2,2-diphenyl-1-picrylhydrazyl scavenging assay (mg mL−1).
Agronomy 13 02373 g006
Figure 7. Heat-mapping diagram related to the studied traits of barley genotypes under water stress conditions and two different CO2 concentrations. The dark blue colour indicates the lowest value of the characters, and the dark red colour indicates the highest value. ShDW: Shoot dry weight (g plant−1), RDW: Root dry weight (g plant−1), GW: Grain weight (g plant−1), LA: Leaf area (cm2 plant−1), RWC: relative water content (%), Chla: chlorophyll a content, Chlb: chlorophyll b content, Car: carotenoids content (mg g−1 FW), Fv/Fm: the quantum efficiency of photosystem II, Proline: leaf proline content (μmol g−1 FW), MDA: malondialdehyde (nmolg−1 FW), CAT: catalase specific activity (units mg−1 protein), APX: ascorbate peroxidase specific activity (units mg−1 protein), POX: peroxidase specific activity (units mg−1 protein), DPPH: 2,2-diphenyl-1-picrylhydrazyl scavenging assay (mg mL−1).
Agronomy 13 02373 g007
Table 1. List of barley genotypes and relative pedigree information.
CountryPedigreeNumber of RowsGenotype
IranRhn-03//L.527/NK12726Goharan
IranRoho/Mazorka/Trompilo6Mehr
IranNovosadski-4442Behrokh
IranSLB44-56/Lignee1312M9316
Table 2. Analysis of variance (ANOVA) for agro-physiological characteristics and tolerance indices of barley genotypes under different CO2 concentrations and irrigation regimes.
S.O.V Mean Square
DFShDWRDWLAGWRWCChlaChlbCarFV/FmProlineMDACATAPXPOXDPPHCSIYSI
CO212.49 **0.492 **5.76 **3.46 **1829 **0.008 ns0.021 *0.017 *0.001 ns115 **78.4 **0.273 **0.001 **1.28 **0.002 ns15.5 **3.011 **
Rep*CO240.0320.0050.810.04231.070.0130.0160.0010.0012.890.1920.00600.0440.0020.0660.021
Irrigation (I)17.35 **0.127 **47.9 **4.61 **1806 **2.37 **0.021 **0.212 **0.000 ns8413 **718 **0.563 **0.003 **0.053 ns0.144 **--
Genotype (G)31.49 **0.250 **6.95 **0.387 **136 ns0.414 **0.033 **0.061 **0.004 **601 **19.2 **0.026 **0.001 **0.830 **0.142 **1.91 **0.202 **
I*G30.776 **0.086 **4.79 **0.806 **78.7 ns0.190 **0.025 **0.149 **0.001 ns528 **28.1 **0.003 ns0.000 ns0.446 **0.054 **--
I*CO211.14 **0.047 **11.9 **0.106 *3.42 ns0.042 *0.026 **0.001 ns0.000 ns135 **17.3 **0.004 ns0.000 ns2.53 **0.007 ns--
G*CO230.183 **0.040 **0.434 ns0.085 **156 ns0.092 **0.011 *0.017 *0.003 *14.4 *2.40 *0.021 **0.000 *0.091 **0.008 ns0.897 **0.112 **
I*G*CO230.067 ns0.004 ns1.92 ns0.301 **26.6 ns0.049 **0.0030.011 *0.002 ns45.9 **10.6 **0.030 **0.002 **0.299 **0.027 **--
Error280.040.0060.6830.01755.070.0080.0040.0030.0014.790.7970.00200.0120.0020.086 #120.012 #12
CV 12.216.412.211.59.3811.89.314.64.1157.713.111.110.212.29.619.7
ns Non-significant. * Significant at the 0.05 probability level. ** Significant at the 0.01 probability level. #: degree freedom of CSI and YSI. ShDW: Shoot dry weight (g plant−1), RDW: Root dry weight (g plant−1), GW: Grain weight (g plant−1), LA: Leaf area (cm2 plant−1), RWC: relative water content (%), Chla chlorophyll a content, Chlb chlorophyll b content and Car carotenoids content (mg g−1 FW), Fv/Fm: the quantum efficiency of photosystem II, Proline: leaf prolin content (μmol g−1FW), MDA: malondialdehyde (nmolg−1 FW), CAT: catalase specific activity (units mg–1 protein), APX: ascorbate peroxidase specific activity (units mg–1 protein), POX: peroxidase specific activity (units mg−1 protein), DPPH: 2,2-diphenyl-1-picrylhydrazyl scavenging assay (mg mL–1), CSI: combination of significant indices, YSI: yield stability index. I*G: Interaction effect of irrigation and genotype, I*CO2: Interaction effect of irrigation and CO2 concentration, G*CO2: Interaction effect of genotype and CO2 concentration, I*G*CO2: Interaction effect of irrigation, genotype and CO2 concentration.
Table 3. The interaction effects of water stress and different CO2 concentrations on traits.
MCControlStressLSD
(0.05)
CO2AmbientElevatedAmbientElevated
T
ShDW1.56 b2.32 a1.08 d1.23 c0.14
RDW0.51 b0.64 a0.28 c0.55 b0.03
LA6.10 b7.78 a4.79 c5.09 c0.22
GW1.10 b1.73 a0.57 c1.02 b0.23
Chla0.55 c0.63 b1.06 a1.02 a0.05
Chlb0.25 c0.25 c0.34 b0.43 a0.31
Proline1.47 c1.21 c31.01 a24.61 b3.17
MDA8.28 c6.93 d17.02 a13.50 b1.11
POX1.05 c1.19 b1.45 a0.66 d0.12
The same letter above the columns for each trait indicates that the values are not statistically different (p > 0.05). MC: moisture conditions, T: trait, ShDW: Shoot dry weight (g plant−1), RDW: Root dry weight (g plant−1), LA: Leaf area (cm2 plant−1), GW: Grain weight (g plant−1), Chla: chlorophyll a content, Chlb: chlorophyll b content, MDA: malondialdehyde (nmolg−1 FW), POX: peroxidase specific activity (units mg−1 protein).
Table 4. Interaction effects of CO2 concentrations and different genotypes of barley on traits.
CO2AmbientLSD
(0.05)
ElevatedLSD
(0.05)
GBehrokhM9316GoharanMehrBehrokhM9316GoharanMehr
T
ShDW1.11 c1.65 a1.28 b1.23 bc0.141.34 c2.44 a1.59 b1.72 b0.25
RDW0.61 a0.31 bc0.29 c0.37 b0.120.74 a0.61 b0.36 c0.67 ab0.10
GW0.76 c0.98 a0.77 c0.81 b0.031.14 c1.71 a1.20 c1.44 b0.22
Chla0.88 b0.50 d0.82 c0.99 a0.050.65 c0.67 c0.92 b1.07 a0.09
Chlb0.26 c0.20 d0.32 b0.39 a0.040.31 b0.31 b0.37 a0.40 a0.05
Car0.32 c0.23 d0.36 b0.43 a0.030.38 c0.35 c0.40 b0.49 a0.06
Fv/Fm0.71 b0.74 a0.74 a0.73 a0.020.72 ab0.73 ab0.75 a0.67 c0.06
Proline22.10 a12.11 c9.91 d20.42 b1.2121.01 a6.93 c5.14 d18.91 b1.02
MDA13.91 a10.90 c12.72 b13.90 a0.6511.60 a10.67 a8.95 b9.12 b0.98
CAT0.43 b0.38 c0.53 a0.40 bc0.040.26 b0.36 a0.29 b0.23 c0.04
APX0.04 b0.03 c0.04 b0.06 a0.010.02 b0.03 a0.03 a0.02 b0.009
POX1.58 a1.03 b0.88 c1.51 a0.111.01 a0.97 a0.71 c0.84 b0.12
The same letter above the columns for each trait indicates that the values are not statistically different (p > 0.05). G: genotypes. T: trait. ShDW: Shoot dry weight (g plant−1), RDW: Root dry weight (g plant−1), GW: Grain weight (g plant−1), Chla: chlorophyll a content, Chlb: chlorophyll b content, Car: carotenoids content (mg g−1FW), Fv/Fm: the quantum efficiency of photosystem II, MDA: malondialdehyde (nmolg−1FW), CAT: catalase specific activity (units mg–1 protein), APX: ascorbate peroxidase specific activity (units mg–1 protein), POX: peroxidase specific activity (units mg−1 protein).
Table 5. Interaction effects of water stress and different genotypes of barley on traits.
MCControlLSD
(0.05)
StressLSD
(0.05)
GBehrokhM9316GoharanMehrBehrokhM9316GoharanMehr
T
ShDW1.43 d1.59 c2.60 a2.14 b0.1391.23 b1.50 a1.28 b0.81 d0.177
RDW0.82 a0.53 b0.39 c0.58 b0.1250.53 a0.39 c0.26 d0.46 b0.210
LA5.07 c7.08 b8.25 a7.35 b0.7414.84 b5.33 a5.11 a4.47 b0.674
GW0.96 c1.24 b1.68 a1.77 a0.4610.84 b1.02 a0.72 b0.48 c0.166
Chla0.72 a0.37 c0.52 b0.76 a0.1400.82 b0.81 b1.22 a1.30 a0.246
Chlb0.28 a0.20 c0.26 b0.26 b0.0110.29 b0.32 b0.42 a0.49 a0.094
Car0.30 a0.21 b0.21 b0.32 a0.0720.39 b0.57 a0.34 b0.60 a0.194
Proline1.67 a1.155 b0.710 c1.83 a0.33733.40 b41.30 a13.91 d30.51 c3.058
MDA6.72 c6.19 c7.10 b10.4 a1.2518.42 a15.80 b12.50 d14.60 c1.832
POX1.12 a0.82 b0.65 c1.11 a0.1101.40 b1.61 a0.94 d1.21 c0.170
DPPH0.27 b0.26 c0.21 d0.30 a0.0030.50 b0.57 a0.28 d0.35 c0.012
A same letter above the columns for each trait indicates that the values are not statistically different (p > 0.05). MC: moisture conditions. G: genotypes. T: trait. ShDW: Shoot dry weight (g plant−1), RDW: Root dry weight (g plant−1), LA: Leaf area (cm2 plant−1), GW: Grain weight (g plant−1), Chla: chlorophyll a content, Chlb: chlorophyll b content, Car: carotenoids content (mg g−1 FW), MDA: malondialdehyde (nmolg−1 FW), POX: peroxidase specific activity (units mg−1 protein), DPPH: 2,2-diphenyl-1-picrylhydrazyl scavenging assay (mg mL–1).
Table 6. Correlation coefficients among the measured traits in barley genotypes under ambient CO2 (water stress above diagonal and control below diagonal) conditions.
ShDWRDWGWLARWCChlaChlbCarFv/FmProlineMDACATAPXPOXDPPH
ShDW −0.340.65 **0.550.61 *−0.33−0.60 *−0.210.42−0.79 **−0.23−0.03−0.11−0.58 *−0.19
RDW−0.49 0.060.28−0.65 *0.05−0.31−0.45−0.61 *0.67 *0.60 *−0.420.120.30−0.54
GW0.80 **−0.31 0.560.000.07−0.40−0.040.03−0.410.320.150.32−0.58 *−0.66 *
LA0.45−0.71 **0.42 0.33−0.11−0.61 *−0.24−0.01−0.390.120.09−0.05−0.54−0.69 *
RWC−0.460.45−0.41−0.27 −0.38−0.280.030.52−0.73 **−0.57 *0.20−0.43−0.430.22
Chla−0.540.62 *−0.25−0.67 *−0.06 0.74 **0.81 **0.020.200.560.540.50−0.32−0.38
Chlb−0.58 *0.19−0.42−0.350.010.64 * 0.85 **0.180.210.140.57 *0.25−0.020.22
Car−0.410.52−0.08−0.52−0.090.93 **0.71 ** 0.34−0.120.200.78 **0.34−0.45−0.06
Fv/Fm0.36−0.300.270.39−0.18−0.11−0.12−0.03 −0.73 **−0.510.28−0.18−0.66 *0.19
Proline−0.330.61 *−0.07−0.62 *−0.110.86 **0.550.92 **−0.26 0.53−0.370.310.67 *−0.04
MDA0.05−0.180.29−0.02−0.63 *0.410.100.46−0.010.49 0.170.47−0.07−0.75 **
CAT−0.64 **0.02−0.76 **−0.020.62 *−0.140.36−0.11−0.12−0.19−0.46 −0.02−0.53−0.25
APX−0.29−0.07−0.01−0.32−0.360.60 *0.380.54−0.210.500.81 **−0.25 −0.22−0.35
POX−0.380.57 *−0.16−0.76 **−0.100.89 **0.360.80 **−0.070.82 **0.56−0.260.67 * 0.54
DPPH−0.190.220.03−0.46−0.280.79 **0.450.82 **0.160.75 **0.73 **−0.300.74 **0.88 **
* Significant at the 0.05 probability level. ** significant at the 0.01 probability level. ShDW: Shoot dry weight (g plant−1), RDW: Root dry weight (g plant−1), GW: Grain weight (g plant−1), LA: Leaf area (cm2 plant−1), RWC: relative water content (%), Chla: chlorophyll a content, Chlb: chlorophyll b content, Car: carotenoids content (mg g−1 FW), Fv/Fm: the quantum efficiency of photosystem II, Proline: leaf proline content (μmol g−1 FW), MDA: malondialdehyde (nmolg−1 FW), CAT: catalase specific activity (units mg–1 protein), APX: ascorbate peroxidase specific activity (units mg–1 protein), POX: peroxidase specific activity (units mg−1 protein), DPPH: 2,2-diphenyl-1-picrylhydrazyl scavenging assay (mg mL–1).
Table 7. Correlation coefficients among the measured traits in barley genotypes under elevated CO2 (water stress above diagonal and control below diagonal) conditions.
ShDWRDWGWLARWCChlaChlbCarFv/FmProlineMDACATAPXPOXDPPH
ShDW −0.250.80 **0.59 *−0.35−0.28−0.18−0.550.64 *−0.66 *−0.15−0.04−0.48−0.030.31
RDW−0.08 0.280.200.05−0.28−0.380.05−0.360.72 **0.47−0.460.16−0.68 **0.48
GW0.79 **−0.23 0.55−0.40−0.58 *−0.49−0.66 *0.50−0.230.27−0.25−0.53−0.350.52
LA0.77 **−0.380.82 ** 0.06−0.19−0.03−0.180.30−0.30−0.07−0.22−0.07−0.190.48
RWC−0.540.03−0.43−0.52 −0.070.000.200.120.310.02−0.14−0.010.27−0.21
Chla−0.550.24−0.09−0.350.53 0.81 **0.80 **−0.57 *−0.26−0.82 **0.160.84 **0.00−0.01
Chlb−0.410.29−0.20−0.06−0.090.23 0.58 *−0.43−0.45−0.85 **0.090.67 *0.300.05
Car−0.100.69 *−0.02−0.210.380.430.27 −0.67 *0.19−0.500.110.89 **0.10−0.26
Fv/Fm−0.24−0.19−0.26−0.200.30−0.240.23−0.10 −0.400.14−0.02−0.75 **0.29−0.05
Proline−0.61 *−0.04−0.08−0.200.430.84 **0.380.320.07 0.59 *−0.040.16−0.33−0.08
MDA0.050.000.500.150.290.75 **0.000.27−0.330.53 −0.12−0.59 *−0.19−0.15
CAT0.330.140.67 *0.380.120.59 *−0.120.40−0.430.400.90 ** 0.160.35−0.34
APX−0.73 **0.07−0.92 **−0.64 *0.18−0.090.24−0.140.260.03−0.69 *−0.82 ** −0.160.12
POX0.240.66 *0.33−0.04−0.010.41−0.070.61 *−0.57 *0.020.540.65 *−0.50 −0.74 **
DPPH0.63*0.240.80 **0.53−0.150.23−0.190.29−0.42−0.020.69 *0.88 **−0.89 **0.73 **
* Significant at the 0.05 probability level. ** significant at the 0.01 probability level. ShDW: Shoot dry weight (g plant−1), RDW: Root dry weight (g plant−1), GW: Grain weight (g plant−1), LA: Leaf area (cm2 plant−1), RWC: relative water content (%), Chla: chlorophyll a content, Chlb: chlorophyll b content, Car: carotenoids content (mg g−1 FW), Fv/Fm: the quantum efficiency of photosystem II, Proline: leaf proline content (μmol g−1 FW), MDA: malondialdehyde (nmolg−1 FW), CAT: catalase specific activity (units mg–1 protein), APX: ascorbate peroxidase specific activity (units mg–1 protein), POX: peroxidase specific activity (units mg−1 protein), DPPH: 2,2-diphenyl-1-picrylhydrazyl scavenging assay (mg mL–1).
Disclaimer/Publisher’s Note: The statements, opinions and data contained in all publications are solely those of the individual author(s) and contributor(s) and not of MDPI and/or the editor(s). MDPI and/or the editor(s) disclaim responsibility for any injury to people or property resulting from any ideas, methods, instructions or products referred to in the content.

