Article

Decoupling Vegetation Dynamics and Climate Change Impacts on Runoff and Sediment in Loess Gully Areas

State Key Laboratory of Eco-Hydraulics in Northwest Arid Region of China, Xi’an University of Technology, Xi’an 710048, China
*
Author to whom correspondence should be addressed.
Agronomy 2024, 14(2), 238; https://doi.org/10.3390/agronomy14020238
Submission received: 21 November 2023 / Revised: 8 January 2024 / Accepted: 20 January 2024 / Published: 23 January 2024
(This article belongs to the Special Issue Agro-Ecosystem Responses to Climate Change: Adaptation and Mitigation)

Abstract

:
While climate change and vegetation dynamics have a strong relationship, few studies have specifically measured the effects of these factors on runoff and sediment development in the gully zone of the Loess Plateau. This study investigates the monthly impacts of climatic change and vegetation dynamics on water flow and sediment movement in the gully zone of the Loess Plateau between 2000 and 2016. In this study, the standard gully watershed of the Loess Plateau is investigated using partial least squares structural equation modeling (PLS-SEM). The state of vegetation in the watershed is characterized by utilizing the vegetation index obtained using the Moderate Resolution Imaging Spectroradiometer (MODIS), along with monthly hydro-meteorological and vegetation data. The collective impacts of vegetation dynamics, climate change, and runoff contribute to 74.3% of the monthly fluctuations in sediment levels. The data indicate that 31.6% of the monthly runoff variability can be ascribed to the combined influence of climate change and vegetation dynamics. Climate change significantly influences flow and sediment via direct and indirect mechanisms, primarily by altering the growth and development of vegetation, which subsequently impacts both runoff and sediment. The impact of vegetation on sediment (−0.246) is more pronounced compared to its impact on runoff (−0.239). Furthermore, the impact of vegetation on sediment (−0.038) was significantly less significant compared to the impact on runoff (−0.208). Hence, the vegetation in the watershed primarily mitigates sediment deposition and suspended sediment transit in the water body by regulating runoff, thereby reducing the sediment load. This study examines the intricate correlation between climate change and vegetation dynamics on water flow and sediment deposition in the gully region of the Loess Plateau. It can serve as a helpful resource for managing water resources, allocating agricultural water, and planning soil conservation in the region.

1. Introduction

The Loess Plateau region is experiencing significant soil erosion problems, one of the area’s most pressing ecological challenges [1]. According to the 2019 China Soil and Water Conservation Bulletin, the Loess Plateau has a total land area of 574,600 km2, with a land erosion area of 210,100 km2, accounting for 36.56 percent of the total land area. Of the total area, 159,900 km2 experiences hydrological erosion, 76.11% of soil erosion. As a result, it is regarded as one of the most severely affected regions by soil and water erosion globally [2,3,4]. Additionally, it contributes to almost 90% of the sediment volume in the Yellow River [5]. Soil erosion in the Loess Plateau region can cause excessive sediment in the Yellow River and land degradation. It threatens the sustainability of the ecosystem, leading to widespread socio-economic concerns [6,7]. Since the 1950s, China has carried out continuous and systematic soil erosion control projects in the Loess Plateau region, focusing on vegetation protection and construction as basic ecological management measures. For example, the Grain-for-Green Project (GGP) in 1999 [8] and the Natural Forest Protection Project were carried out in 2000 [9]. These measures have achieved remarkable results, decreasing sediment and runoff in the Yellow River by 0.02 Gt/year and 0.25 km3/year from the 1950s to the 2010s [10]. However, the significant reduction in runoff has exacerbated water scarcity in the Yellow River. This has severely hampered local socio-economic development [11]. Previous studies have demonstrated that soil properties, topography, vegetation, and prevailing meteorological conditions all play a role in influencing water flow and sediment movement in a given drainage basin [12,13,14]. However, in the Loess Plateau region, the soil and landscape are generally considered to be relatively stable over short timeframes [15]. Climate change and vegetation dynamics are the primary factors that influence watershed runoff and sediment. These factors’ impacts on flow and sediment are divergent [16,17]. The runoff and sediment loads originating from a watershed exert a significant impact on both soil erosion and the transportation of nutrients. This presents multiple hazards to agricultural sustainability via the deterioration of soil quality and decreased crop productivity [18]. This further contributes to the intricacy of comprehending watershed runoff and sediment. In this region, climate change could lead to changes in precipitation patterns, affecting runoff volumes [19,20], and vegetation dynamics could affect soil retention and vegetation cover, affecting sediment production [21,22]. Hence, it is crucial to adopt an integrated approach to comprehensively understand the effects of climate change and vegetation dynamics on watershed hydrological processes. In-depth studies are necessary to gain a better understanding of this intricate relationship.
Previous researchers have employed various methods, such as statistical data analysis, climate elasticity, and hydrological modeling, to differentiate the effects of climate change and vegetation dynamics on watershed flow and sediment [10,23,24]. This methodology allows for the precise differentiation of the individual impacts of climate change and vegetation dynamics on changes in yearly watershed runoff and sediment. However, it is challenging to decouple the distinct influences of climate change and vegetation dynamics on alterations in watershed runoff and sediment. This challenge arises primarily from the conventional approach that treats climate change and vegetation dynamics as separate and unrelated phenomena. The interactions via which climatic variability and vegetation dynamics affect runoff and sediment are intricate. The presence of runoff and sediment in a watershed is directly impacted by variations in precipitation, encompassing both the overall amount of precipitation and the intensity of precipitation events. Precipitation indirectly affects runoff by promoting plant growth. Climate change, on the other hand, directly impacts vegetation dynamics, which subsequently influence water flow and sediment deposition [25]. In addition, runoff and sediment content, as well as the state of vegetation in the watershed, are affected by precipitation and temperature in the antecedent period [4]. Soil saturation and moisture, which affect runoff, sediment, and vegetation in the watershed, are influenced by antecedent precipitation and temperature [4]. These interrelationships can make it difficult to predict how runoff and sediment will respond to climate change and vegetation dynamics. Therefore, the decoupling of the impacts of vegetation dynamics and climate change on runoff and deposition is imperative.
Structural Equation Modeling (SEM) is a valuable statistical technique used to explore complex relationships between variables [15]. It integrates elements of factor analysis, path analysis, and regression analysis, enabling the examination of connections between latent and observed variables. SEM assists in differentiating between direct effects (the relationship between independent and dependent variables) and indirect effects (the relationship between independent and dependent variables influenced by other variables), while also quantifying the strength of each relationship. PLS-SEM, a type of SEM, is capable of handling small sample sizes and non-normally distributed data, providing greater flexibility for exploratory studies and complex models [15]. Its popularity is increasing in finance, social sciences, agricultural economics, and ecology [26,27,28,29].
This study conducted a detailed investigation and analysis of the Yanwachuan watershed, a typical watershed in the gully region of the Loess Plateau. At the monthly scale, it utilized Pearson correlation analysis to analyze the lag effects of vegetation response to climatic factors. Furthermore, it employed PLS-SEM to decouple the impact of climate change and vegetation dynamics on runoff. The objectives of this study are: (1) to utilize Pearson correlation analysis to examine the lag effects of two vegetation indices in response to precipitation and temperature, (2) to quantify the relative magnitude of the direct and indirect impacts of climate change and vegetation dynamics on runoff and sediment using PLS-SEM, and (3) to evaluate the indirect effects of climate factors on runoff and sediment via their influence on vegetation dynamics.

2. Materials and Methods
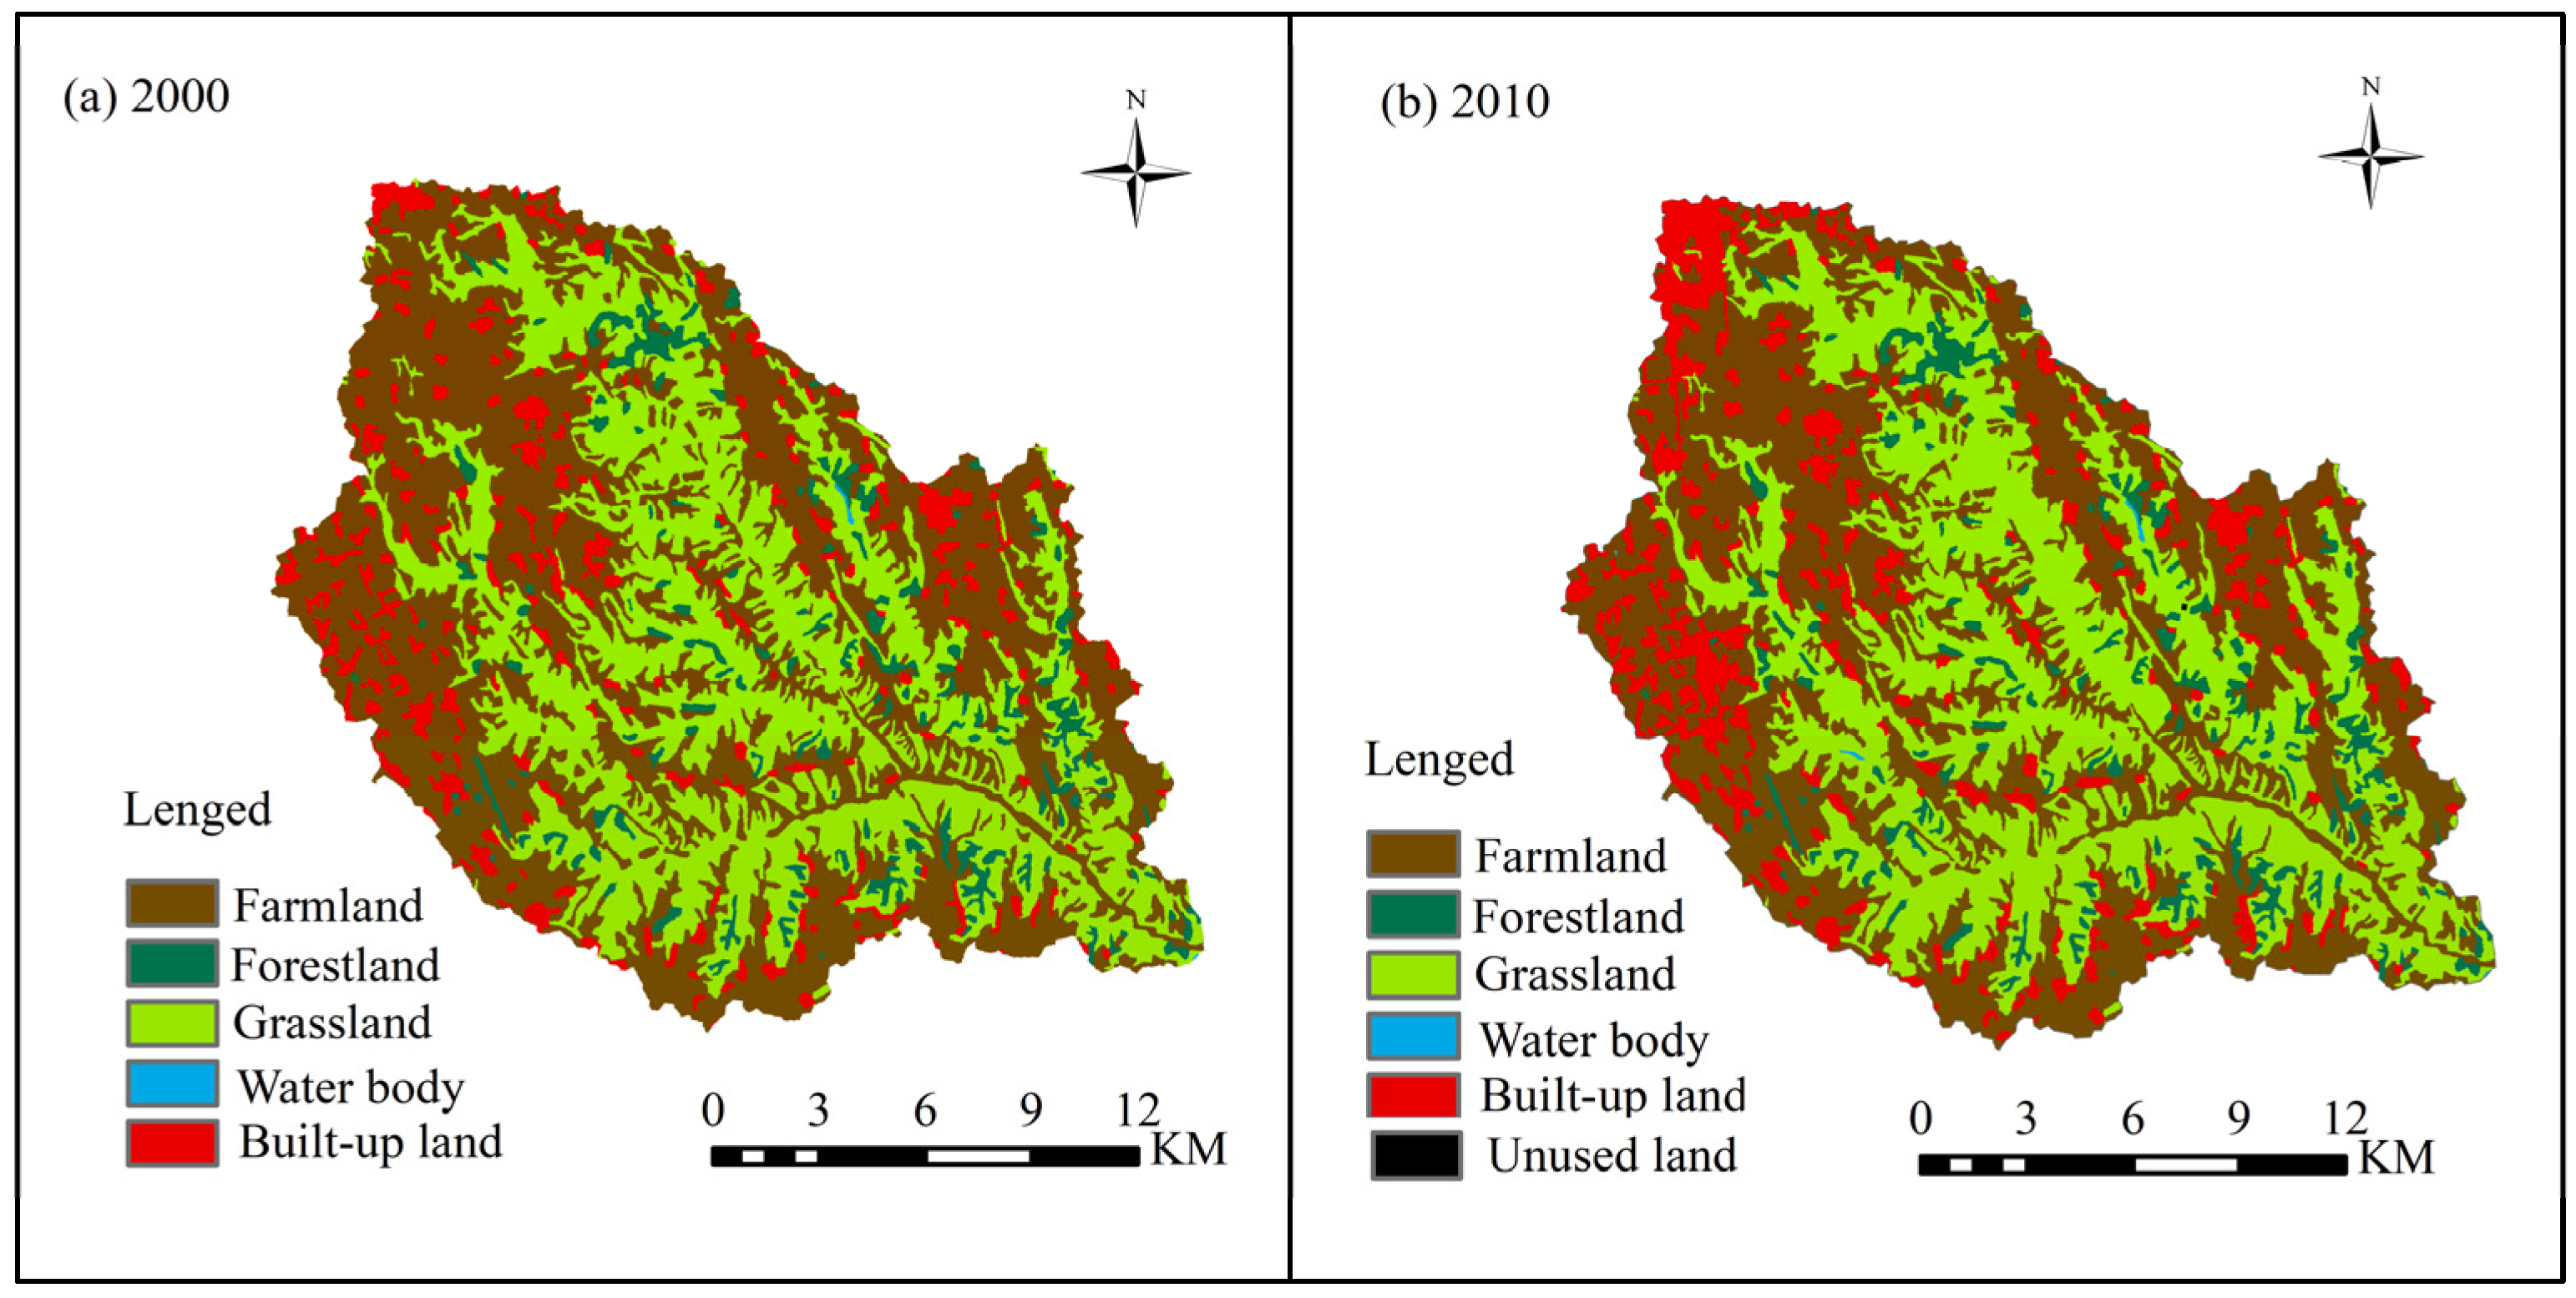
2.1. Study Area

The watershed spans 367.5 square kilometers with elevations ranging from 948 to 1432 m above sea level, as depicted in Figure 1. Located in the semi-humid monsoon climate zone, it experiences an average annual rainfall of 552.8 mm (2000–2016) and a mean annual temperature of 10.1 °C, with 78.6 percent of the annual precipitation occurring between May and September. The area is situated in the southern part of the river basin. The geomorphology of the watershed is mainly composed of three types: Loess, beam, and mountain slopes and gullies, which account for 53.7%, 17.7%, and 28.6% of the total area, respectively [30]. The watershed exhibits typical landform characteristics of the Loess Plateau gully region. The geological structure of the Yanwachuan watershed is relatively homogeneous, and the ground surface is mainly covered by Quaternary loess that can be up to about 200 m thick [3,31]. Soil erosion is a massive problem. To control soil erosion, an experimental study on comprehensive watershed management in the Yanwachuan watershed, a typical mesoscale watershed of the Loess Plateau gully area, was conducted by the Xifeng Water Conservation Station of the Yellow Commission in 1975. Figure 2 presents the land use patterns in 2000 and 2010, revealing that grassland and agricultural land constitute the primary land use types within the watershed. Furthermore, it is evident that a significant amount of agricultural land underwent conversion to construction land and grassland during this period. By the end of 2012, the area treated by soil and water conservation measures had reached 238.59 square kilometers, with a treatment rate of 68.96% [3,32].

2.2. Data

This study examines the variables that may have affected the monthly sediment in the Yanwachuan watershed from 2000 to 2016. The selected variables include climatic factors such as monthly precipitation and temperature, runoff, and vegetation characteristics. The precipitation and temperature data were collected from the daily records of the Xifeng National Meteorological Observatory. To reflect the effect of temperature, we selected the monthly average, maximum, and minimum temperatures. To reflect the effect of monthly precipitation, we used the monthly total precipitation amount, monthly maximum 1-day maximum precipitation, and monthly count of days with precipitation. We calculated the monthly mean precipitation using the Tyson polygon method. The Normalized Difference Vegetation Index (NDVI) and the Enhanced Vegetation Index (EVI) were downloaded from the LAADS DAAC database (http://ladsweb.modaps.eosdis.nasa.gov/) (accessed on 13 June 2023). Both indices are based on the principle of red absorption of infrared radiation by healthy vegetation and can be calculated using remote sensing data. They directly reflect vegetation’s growth, cover, and health status and are widely used in agriculture, forestry, ecology, and other fields [33,34,35,36,37,38,39]. The indices have a spatial resolution of 250 m and a temporal resolution of 16 days. The runoff and sediment data were obtained from the daily precipitation and runoff data of the Xifeng Soil and Water Conservation Scientific Experiment Station of the Yellow River Conservancy Commission. Measurements were conducted at the watershed outlet, and the relevant datasets were thoroughly examined for their feasibility prior to their release. A 90 m resolution digital elevation model was selected using ArcGIS software to map the watershed boundary.

2.3. Methods

(1) Pearson correlation analysis
This study utilized the Pearson correlation coefficient to investigate the delayed effects of various vegetation indices on temperature and precipitation. This analysis aimed to separate the influences of vegetation dynamics and climate change on the hydrological parameters of the watershed [40]. Previous research has shown that vegetation responds to changing climatic conditions within three months [41,42,43]. Therefore, this study considered a lag of 0–3 months when analyzing Pearson correlations between the two vegetation indices and climatic factors. The lagged response time with the highest correlation coefficient was considered the most suitable. The Pearson correlation coefficient is a widely used statistical measure that assesses the strength and direction of the relationship between variables, ranging from −1 to 1. It provides important information about the degree of correlation between variables. The p value was used to indicate the test’s level of significance. The calculation of the correlation coefficient R is as follows [23]:
R = n x i y i x i y i n x i 2 x i 2 n y i 2 y i 2
where n is the length of the data, and x and y are the values corresponding to time i. Correlations can be categorized into five groups based on the absolute value of the correlation coefficient: very weak or no correlation (R < 0.2); weak correlation (0.2 < R < 0.4); moderate correlation (0.4 < R < 0.6); strong correlation (0.6 < R < 0.8); and very strong correlation (0.8 < R < 1).
(2) Partial least squares structural equation modeling
Partial least squares structural equation modeling (PLS-SEM) is predominantly employed to examine causal links among latent variables [44]. In theoretical models, we can measure the causal relationships between potential variables using the corresponding observed variables. A PLS-SEM model has two main components: measurement and structural models [45] (Figure 3). The measurement model is an expression of the relationship between the observed and latent variables. The relationship between exogenous and endogenous latent variables is expressed in the structural model. The results of the path analysis are visualized using path coefficient β, which indicates the direction and strength of causal relationships between latent variables [46]. The external model loadings show how the explicit variables respond to the latent variables. In a linear system, direct effects are denoted by the relevant path coefficients, while indirect effects refer to the paths that involve intermediate variables. The total effect is the cumulative result of both the direct and indirect effects that elucidate the connection between the variables. The goodness of fit (GOF) refers to the accuracy of the predictions made by the model and is calculated as follows [47,48]:
G O F = C ommunality ¯ × R 2 ¯
where C o m m u n a l i t y ¯ denotes the average of Q2 for all conformations under the commonality of conformational cross-validation and R 2 ¯ is the average of R2 for all endogenous variables.
Climatic conditions exert both direct and indirect influences on runoff [49]. Within each category, several indicators were selected as observed variables (Table 1). In order to examine potential causal relationships between climate change, vegetation dynamics, and runoff in the study area, the researchers developed the following hypotheses: (1) The presence of precipitation causes an increase in soil moisture, which decreases water’s ability to seep into the ground and increases runoff. Additionally, the growth of plants can be indirectly influenced by precipitation and antecedent precipitation, which in turn affects runoff [50]. (2) Variations in temperature and antecedent temperature might impact vegetation cover by modifying plant morphology and photosynthetic processes [51,52]. (3) Previous studies have demonstrated a negative correlation between vegetation dynamics and both runoff and sediment changes [53,54], indicating that vegetation cover significantly influences surface runoff and indirectly affects sediment changes. (4) Sediment is directly impacted by surface runoff, and a clear and positive relationship between these two factors has been observed in previous studies [55,56]. PLS-SEM was performed using SmartPLS (version 3) software (https://www.smartpls.com/) (accessed on 13 July 2023).

3. Results

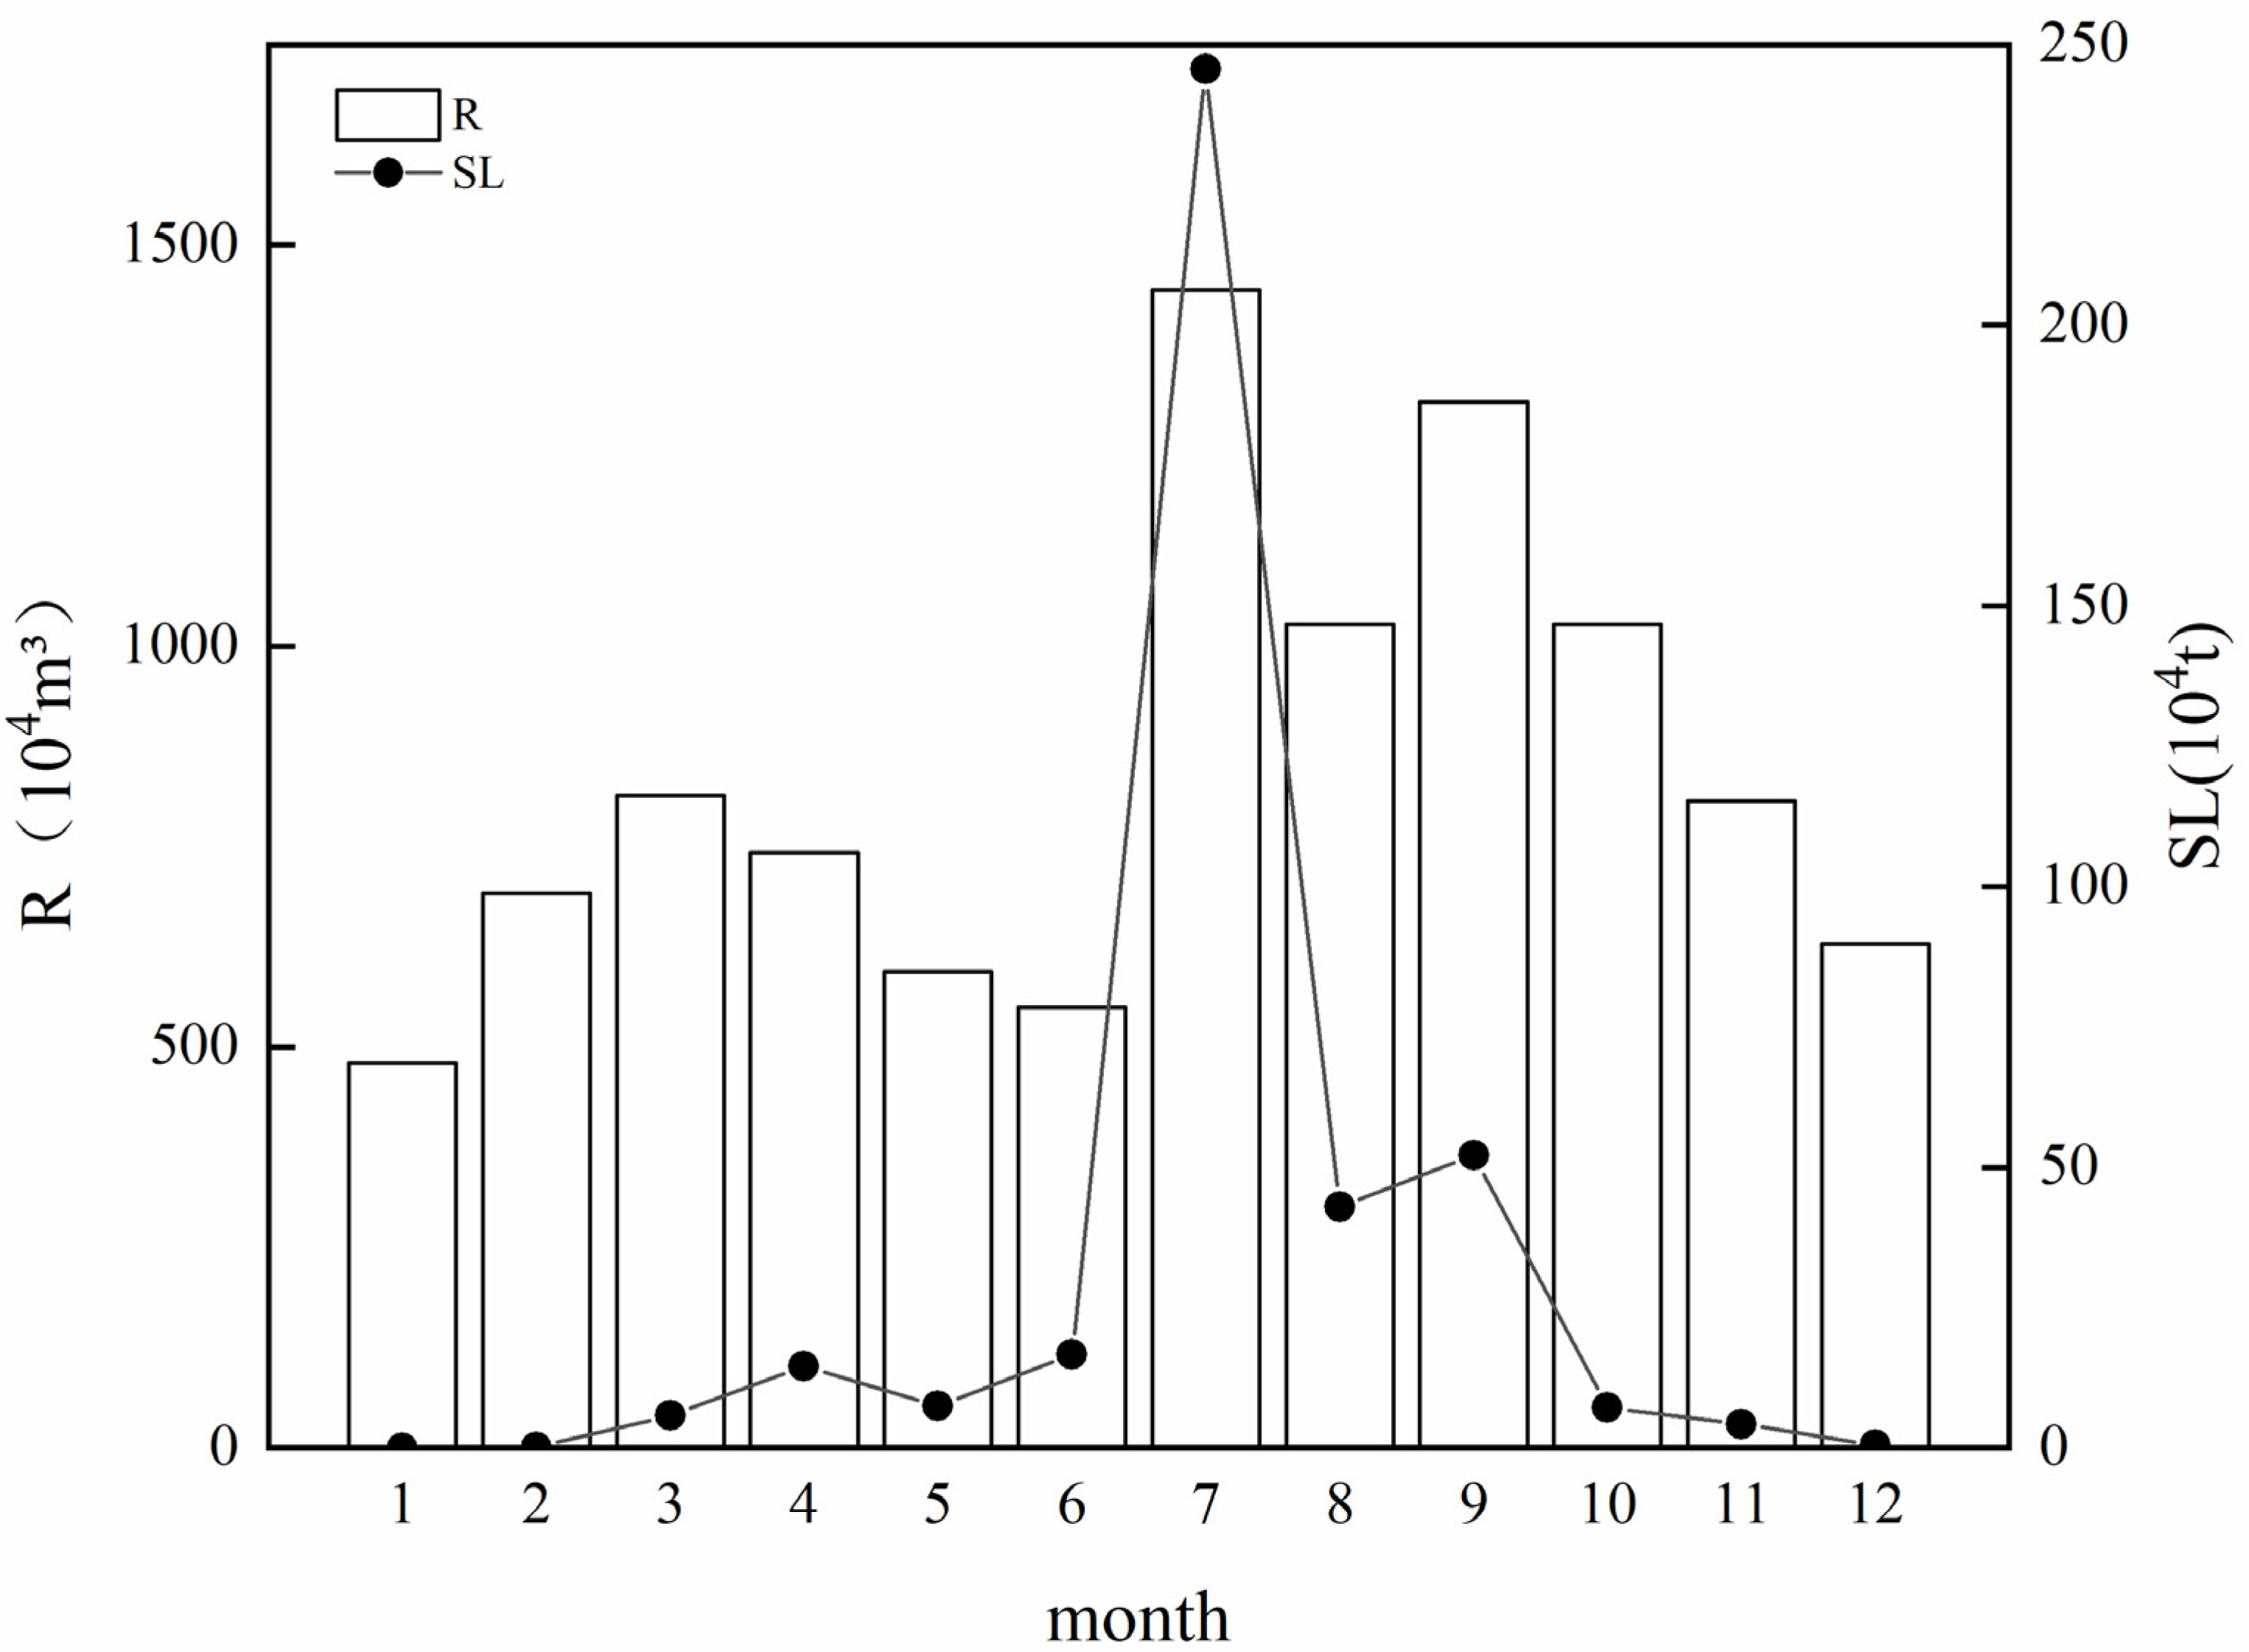
3.1. Monthly Dynamics of Climate, Vegetation, Runoff, and Sediment

Figure 4 illustrates the monthly variations in runoff and sediment load from 2000 to 2016. Both variables show significant seasonal variations. The highest values occur in July. Table 2 shows that mean monthly temperature (T) and minimum temperature (Tmin) were highest in June–August, while maximum temperature (Tmax) was highest in June–July. The data show that total monthly precipitation (P) and monthly precipitation days (PD) were significantly higher in July–September, while maximum monthly precipitation (Pmax) was significantly higher in July–August. Regarding vegetation variables, NDVI and EVI were significantly higher (p < 0.05) in July–September and June–August compared to the other months.

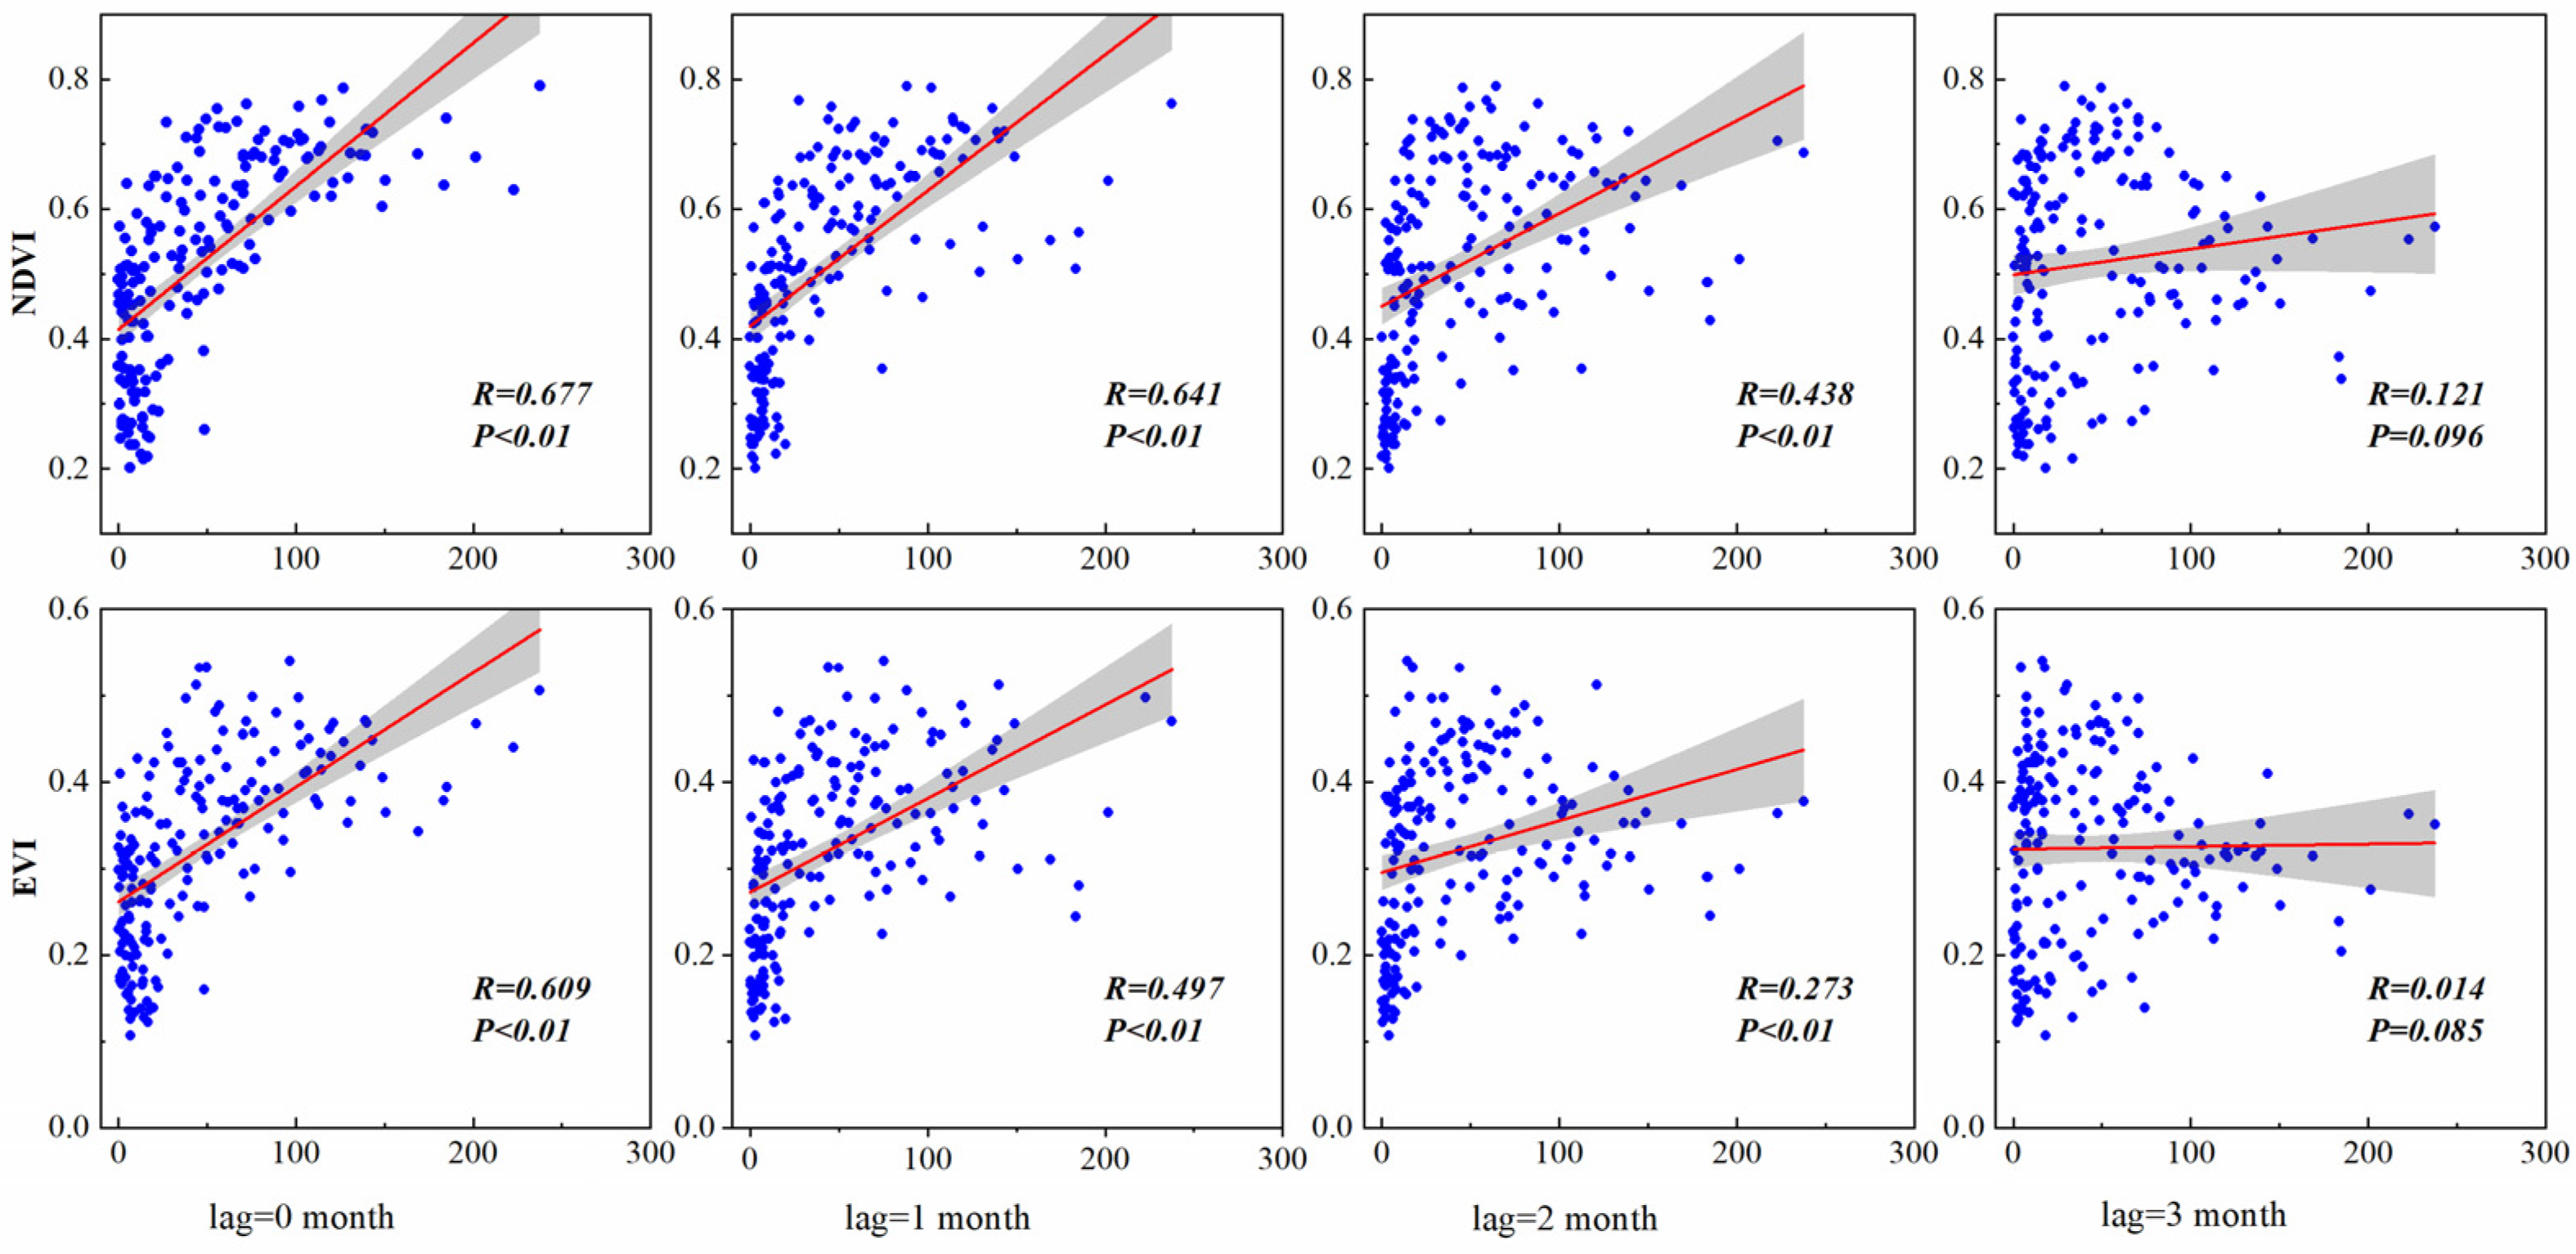
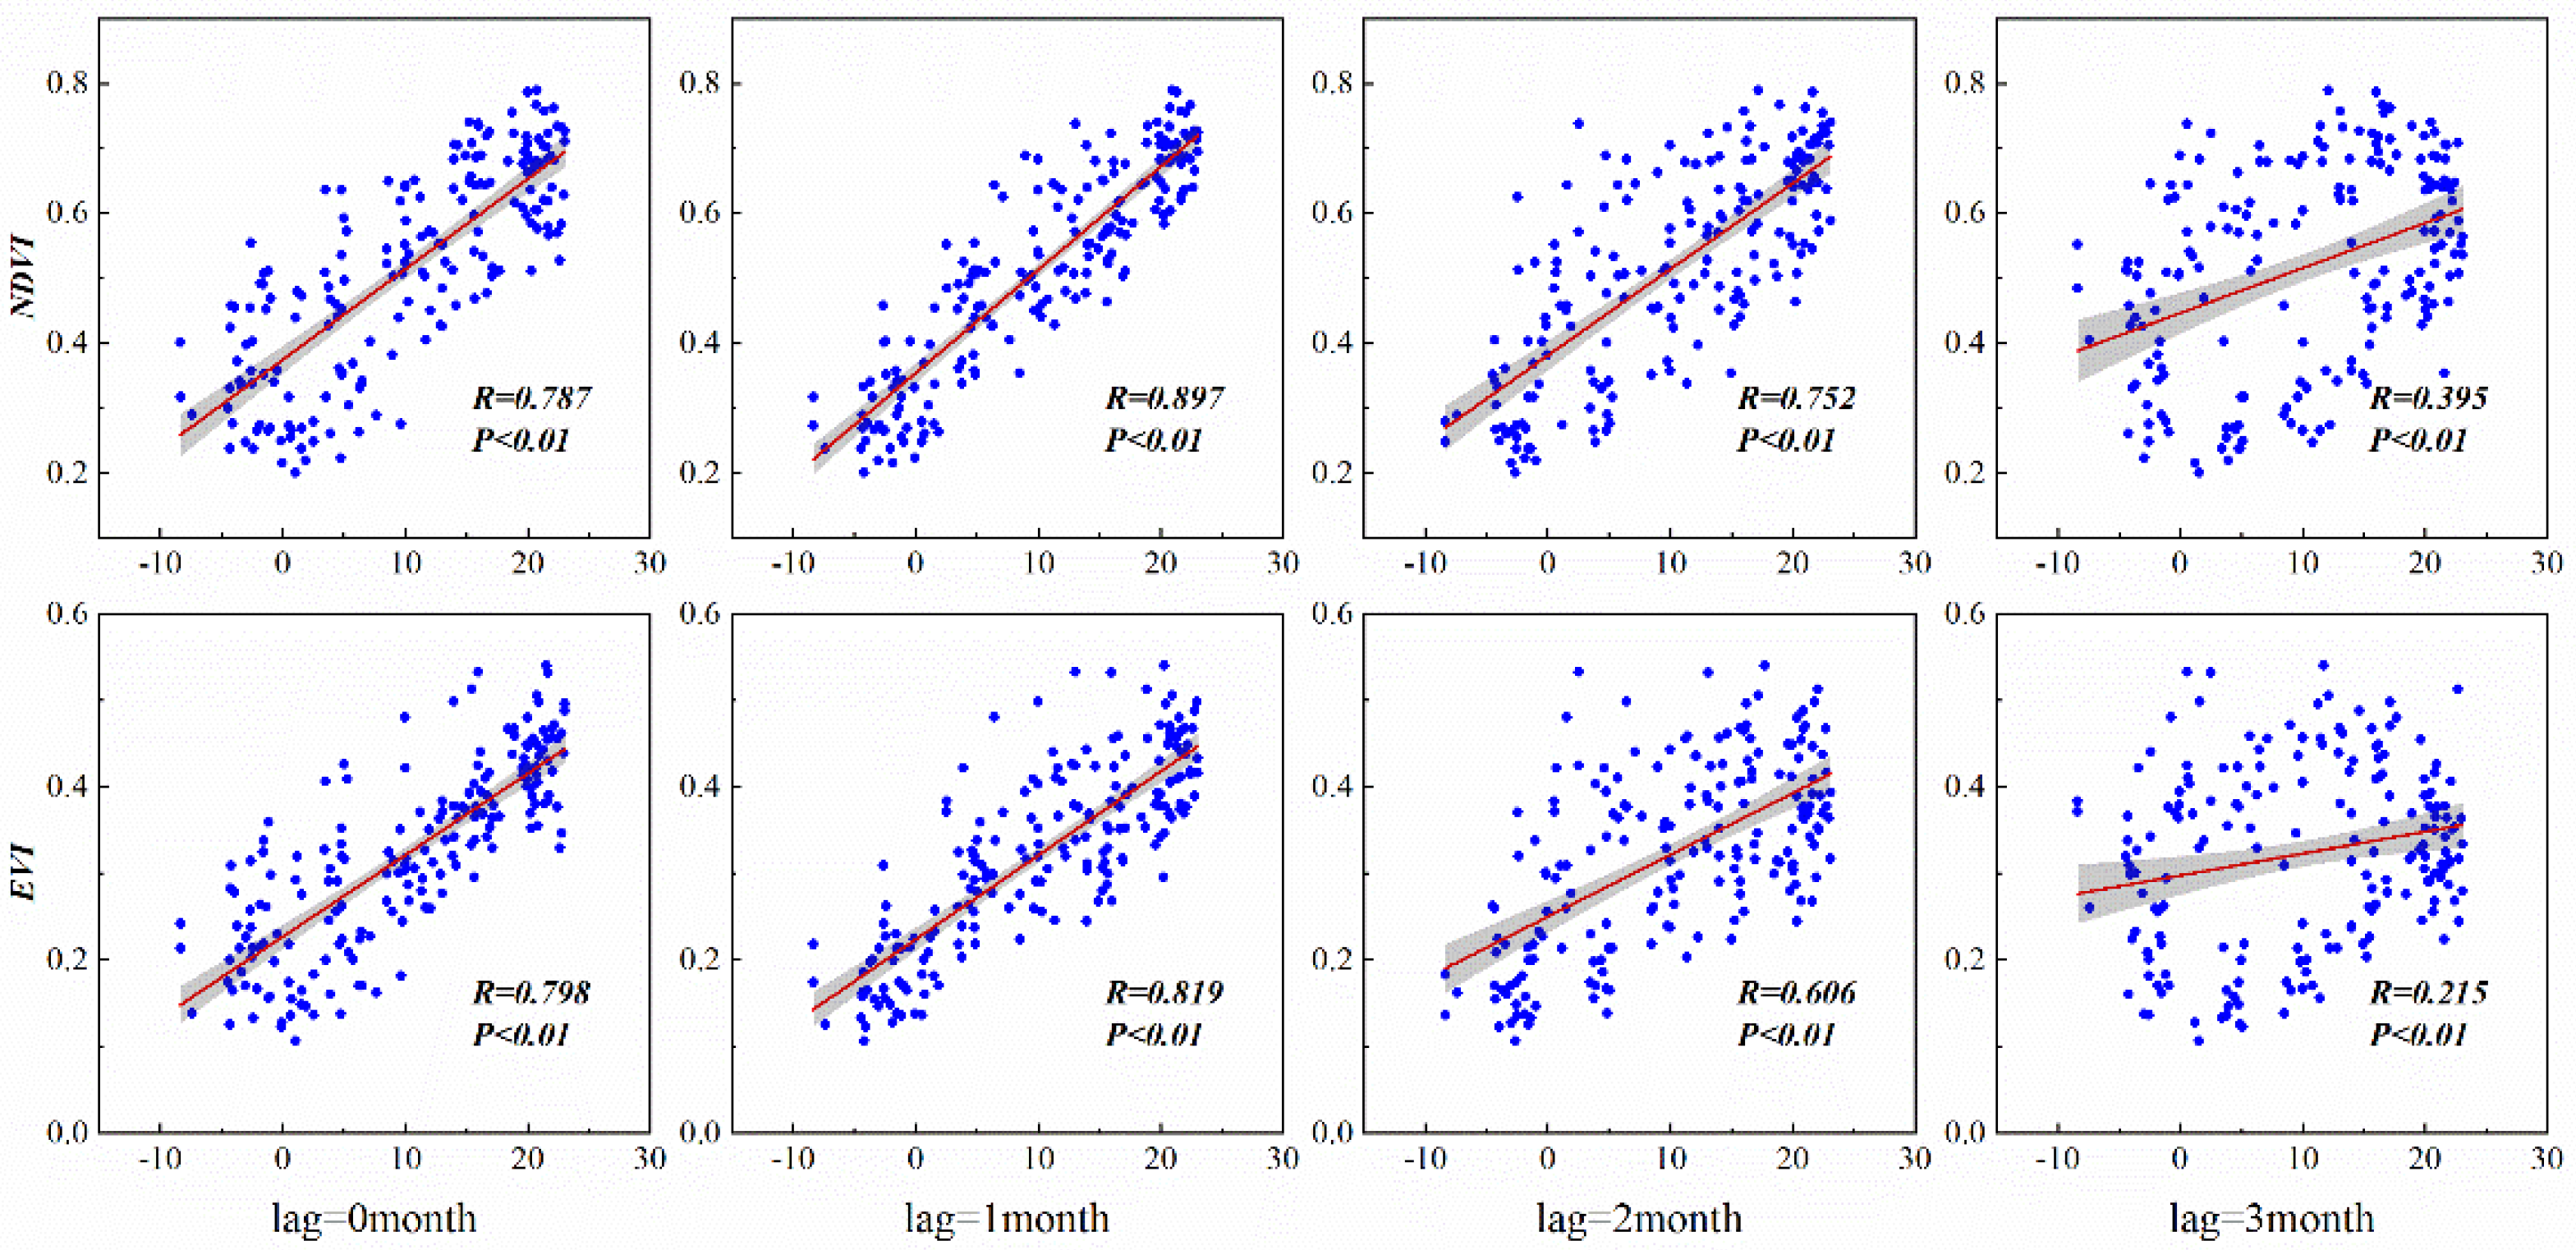
3.2. Temporal Delays in the Impact of Vegetation Indicators on Precipitation and Temperature Response

Correlation studies were conducted to examine the delayed impact of vegetation on climate by assessing the relationship between vegetation and both precipitation and temperature. The analyses included four time lag values (0, 1, 2, and 3 months), resulting in a total of 16 correlations. The correlations between the vegetation indices (NDVI and EVI) and precipitation are summarized in Figure 5. With a lag of 0, 1, or 2 months, significant correlations were found between vegetation indices and precipitation. The strongest correlation was observed at 0 months lag, with correlation coefficients of 0.68 and 0.605 for vegetation indices and precipitation, respectively. However, the correlation became less significant and dispersed at three months lag. Figure 6 displays the correlation between the vegetation index and temperature at lag times ranging from 0 to 3 months. Regardless of the lag value, the results indicate a significant correlation between vegetation index and temperature. The correlation coefficients were the highest at a lag of 1 month, with values of 0.879 and 0.819, respectively. This suggests that the vegetation index responds to the climate after one month. The PLS-SEM model excludes the total monthly rainfall (P3mon) up to 3 months before, based on the correlation analyses.

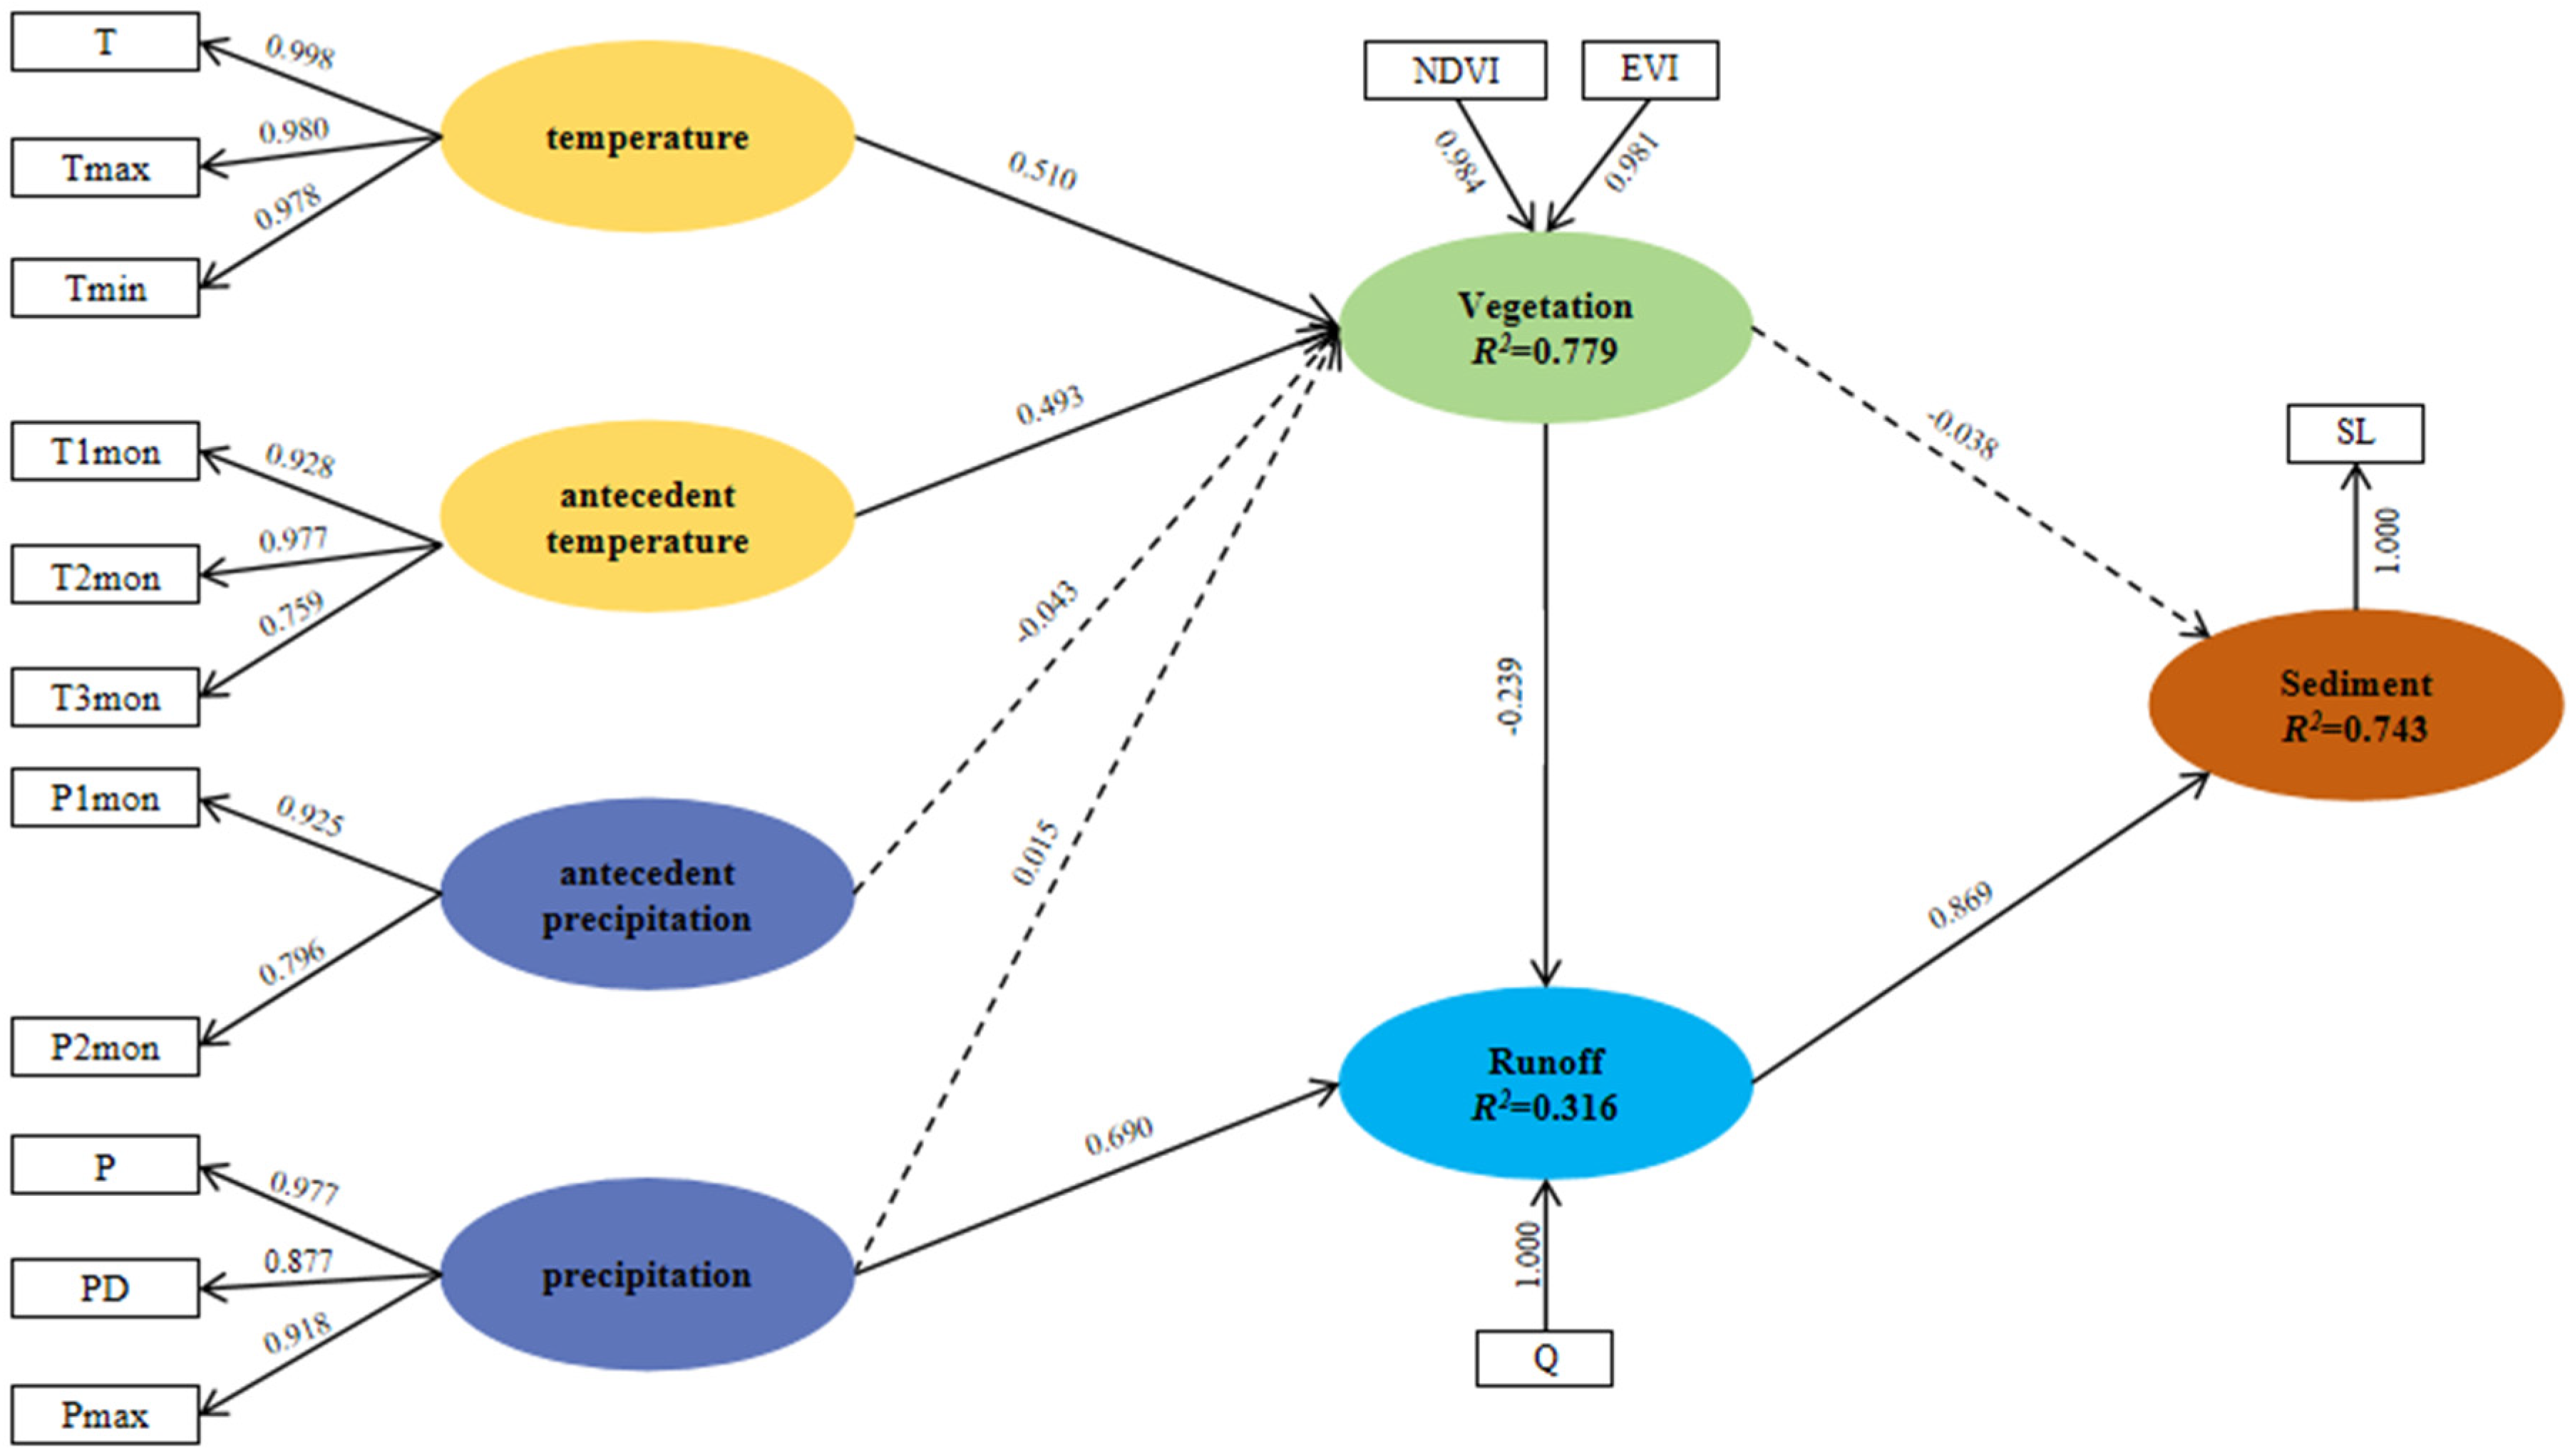
3.3. Decoupling Climate Change and Vegetation Dynamics Effects on Runoff and Sediment

PLS-SEM was utilized in this study to separate the influences of plant cover and climate change on runoff and sediment. This enabled the quantification of the individual contributions of climate change and vegetation dynamics to runoff and sediment, as depicted in Figure 7. The correlations between each latent variable and its corresponding observed variable in the model were significant, above a threshold of 0.7. This suggests that the latent variables effectively captured the observed variability. The model demonstrated a goodness of fit (GOF) value of 0.641 (>0.5), indicating a satisfactory simulation [15]. The model findings demonstrate that both temperature and antecedent temperature have a considerable and direct impact on vegetation, with β values of 0.510 and 0.493, respectively. Furthermore, these factors also influence runoff and sediment via their effects on vegetation. Precipitation significantly impacts vegetation and runoff, with respective coefficients of 0.690 and 0.015. No substantial correlation was seen between antecedent precipitation and vegetation. This study revealed that runoff, with a beta coefficient of 0.869, had a substantial and direct impact on sediment. The presence of vegetation hurt sediment, with a coefficient of −0.038. Climatic factors explained 77.9% of monthly vegetation dynamics, and climatic and vegetation dynamics explained 31.6% of monthly runoff variability. Moreover, 74.3% of the monthly sediment variability was explained by vegetation dynamics, climatic factors, and runoff.
Table 3 shows the decomposition of the correlations of all the model variables into direct, indirect, and total effects. At the monthly scale in the watershed, temperature was the main driver of vegetation dynamics (β = 0.510). Runoff was most influenced by precipitation (β = 0.686), followed by vegetation cover (β = −0.239) and temperature (β = −0.122). The total effect of runoff on sediment (β = 0.0869) was found to be greater than that of precipitation (β = 0.597). Vegetation’s direct effect on sediment (β = −0.038) was less significant than vegetation’s indirect effect on sediment via runoff (β = −0.208). The total vegetation effect on sediment (β = −0.246) was more significant than the total effect on runoff (β = −0.239). Vegetation is more effective at controlling sediment than runoff.

4. Discussion

This study utilized partial least squares structural equation modeling (PLS-SEM) to investigate the complex interrelationships between climate change, vegetation dynamics, and their effects on runoff and sediment. The results of this study indicate that climate change has a significant influence on vegetation dynamics. Specifically, the impact of temperature on vegetation dynamics was found to be highly significant (β = 0.510). The direct effect of antecedent temperature on vegetation was also significant (β = 0.493). The study area has no natural forest. The Artemisia ferruginea community dominated the natural vegetation, the white goat grass, and the Benjamin’s needle grass community [57]. Plantation vegetation was formed with acacia, mountain almond, lateral cypress, oil pine, poplar, willow, wolfsbane, buckthorn, apple, pear, and apricot as dominant plantations [58]. Alfalfa is the dominant artificial forage [58]. The range of suitable growing temperatures for these three vegetation types is between 5 and 15 °C [58,59,60,61,62,63,64,65]. Much of the watershed lies within the optimum temperature range for vegetation. This range activates physiological and biochemical responses in vegetation, contributing to accelerated growth and development processes [66,67]. In addition, as the global climate warms and the growing season of vegetation lengthens, higher temperatures help to activate plant growth earlier and promote the growth of new leaves and buds [10,39,68,69,70]. This contributes to the early greening of vegetation and the lengthening of the growing season, which helps vegetation absorb light energy more efficiently and photosynthesize more throughout the season, thus increasing biomass and vegetation cover. However, the influence of rainfall and previous rainfall on plant life was found to be statistically insignificant (p < 0.05). The gully area of the Loess Plateau is located in a region characterized by a combination of semi-arid and semi-humid conditions, with a dry climate, deep soil layers, and deeply submerged groundwater [71]. Soil moisture is mainly replenished by precipitation. The depletion of soil moisture is a significant constraint on plant growth and development in the Loess Plateau. This is primarily due to the limited rainfall in the region and the irregular distribution of rainfall in terms of amount, intensity, and duration [72]. This suggests that vegetation remains severely water-stressed even when recharged by rainfall due to its limited and uneven nature. On the contrary, the diverse root systems of the vegetation in the study area enable them to adapt to arid conditions, thrive, and develop despite the scarcity of water resources [73,74,75]. This may be related to the fact that the local plant species have gradually developed adaptive characteristics to the arid environment during the evolutionary process. Consequently, this study reveals that temperature, rather than precipitation, is the key limiting factor for the growth and development of vegetation in the gully areas of the Loess Plateau. Moreover, the findings suggest that vegetation growth in the study area is influenced by both current and past climatic conditions, as indicated by the lag relationship observed between the vegetation index and climate [40]. The research area demonstrates a one-month time delay between the vegetation index and the corresponding climate response. This observation is consistent with previous research, indicating a one-month delay on a monthly basis, and the vegetation’s response to climatic change is typically less than three months [17,76,77].
Climatic factors also strongly influence runoff variability. The effects of temperature and antecedent temperature on runoff are mainly indirect (β is −0.118 and −0.122, respectively). Precipitation (β = 0.690) directly affects runoff variability (Table 3). On the one hand, warmer temperatures and melting glacial snow increase runoff [32]. On the other hand, higher temperatures increase evapotranspiration, which significantly affects plant growth and development and leads to reduced soil moisture content. Consequently, this reduction in soil moisture content results in a decrease in surface and subsurface runoff [49,78,79]. These two effects partially offset each other, and the overall effect of temperature on runoff remains negative. Precipitation (β = 0.686) had a significant effect on runoff. Soil water storage capacity in the gully area of the Loess Plateau is limited. Precipitation in the study area shows a pattern of significant concentrated rainfall events in a short period [80]. In this case, a large amount of precipitation in a short period leads to soil saturation and surface runoff. This increases the amount and rate of surface runoff. At the same time, however, precipitation also increases soil moisture. This directly affects the plant root system’s uptake of water and nutrients and promotes plant growth, development, and survival [81]. As precipitation increases, vegetation uptake and transpiration also increase, resulting in soil water depletion by vegetation and a reduction in the generation of surface and subsurface runoff, but this effect is relative to vegetation. As a result, the path coefficient of the indirect effect of precipitation on runoff via vegetation is negative (β = −0.004). Consistent with previous findings [82,83,84,85], vegetation and runoff showed a negative correlation (β = −0.239). Vegetation cover can help maintain soil structure and reduce soil erosion by slowing down the scouring and erosion of the soil by rainfall to some extent [86]. In addition, the root system of vegetation can increase soil porosity and water-holding capacity. This helps to improve the soil’s water retention capacity, thereby reducing runoff. In addition, the growth and development of vegetation will increase the consumption of soil moisture and return precipitation to the atmosphere via evapotranspiration [87]. This will reduce the amount of surface runoff. Hydrological processes exhibit a time delay and the impacts of vegetation on soil water content and runoff generation are not immediately observed, even after rainfall [88]. As a result, negative correlations can be observed at monthly scales.
Climate change, vegetation dynamics, runoff, and sediment are closely linked. Climate change mainly alters the hydrological cycle via precipitation and temperature [89]. This, in turn, affects runoff and sand production changes in the watershed. Changes in precipitation directly affect changes in runoff, which is the carrier of sediment and directly affects sand production in the watershed and sand transport by the river. Thus, precipitation is the main climatic factor leading to soil erosion in the watershed (β = 0.597). Although rising and falling temperatures can also cause changes in the hydrological cycle and alter evapotranspiration and vegetation growth, the Yanwachuan watershed is deep inland and has a small area. Therefore, the effect of temperature on soil erosion is insignificant (β = −0.121). It is widely recognized (β = −0.246) that afforestation and grass planting, which enhance ground vegetation cover, play a crucial role in soil erosion control and ecological environment improvement. As the most dominant land-use type in the watershed, agricultural land generally does not produce surface runoff from light rainfall due to its loess structure and fast infiltration rate. However, agricultural land’s soil water retention capacity is poor due to the plowed subsoil layer formed by annual turnover and plowing of agricultural land, which is a poorly permeable layer with a meager infiltration rate and water-insulating effect. At the same time, agricultural land has a very high sand production. This is caused by loose topsoil, low soil consolidation by plant roots, and low resistance to erosion. In the past few decades, numerous strategies have been implemented in the watershed area to conserve soil and water, resulting in a significant increase in plant cover [90]. The land-use types in the watershed were ordered as arable land > grassland > woodland > construction land > water in both 2000 and 2010 (Figure 2). In the Loess Plateau, various soil and water conservation forests are being established on unused land or naturally infertile slopes in the gully regions. Both young and mature forests have varying degrees of sand reduction benefits. Artificial forests intercept rainfall through the plant canopy, absorb water, and protect the soil. This increases infiltration and reduces runoff. Furthermore, the root system stabilizes the surface soil, resulting in improved resistance to soil erosion and reduced water and soil loss [85,91,92,93]. However, the effectiveness of conserving soil and water varies depending on the vegetative species and cover. The rapid growth of artificially planted grass can increase ground cover, intercept rainfall directly, reduce the kinetic energy of raindrops, slow down the flow of water along slopes, reduce the erosive force of the water on the soil, and block eroded soil particles, increasing the opportunities for rainwater to infiltrate [94]. At the same time, the root network of grasses stabilizes the soil. It improves its physical and chemical properties, as well as its permeability and water-holding capacity [94,95]. In addition, vegetation litter has water absorption and retention and soil protection functions [96]. This can also reduce water and soil loss. However, the interaction between rainfall and the soil surface can lead to surface crusting and closure, reducing infiltration and increasing surface runoff (β = 0.869). This often triggers flooding, causing gully heads to advance by up to several tens of meters and significantly increasing the amount of sand transported by gullies. In addition, loess runoff down the gully can increase erosive sediments in the gully valley by 76% or more [57].
However, this study has some limitations. Firstly, it did not fully consider the impact of engineering measures implemented in the watershed on water and sediment reduction. Further research should comprehensively investigate the impacts of engineering interventions on hydrological processes, sediment discharge, and the underlying mechanisms. The study of the complex relationships between different climatic factors, including topography, wind speed, solar radiation, vegetation cover, and sediment runoff, is also essential. In using remote sensing variables such as NDVI, it is essential to be aware of data quality and potential sources of error. It is crucial to consider the potential errors in the remote sensing data and the soil type’s influence on the vegetation’s growth and the hydrological processes. The incorporation of soil type data into the study would enhance the comprehension of the intricate correlation between vegetation dynamics and hydrological processes.

5. Conclusions

The gully region of the Loess Plateau is one of the areas in China severely affected by soil erosion. Soil erosion leads to a decline in soil fertility, reduced land productivity, and exacerbated gully development, resulting in issues such as reservoir siltation and river channel blockage. These factors contribute to environmental degradation and pose constraints on sustainable economic development. This region was one of the first in China to conduct prototype observations of water and soil loss and study the laws of water and soil loss, conservation measures, and comprehensive watershed management. This study analyzed the complex relationship between monthly runoff and sediment with climate change and vegetation dynamics in the Yanwachuan watershed using partial least squares structural equation modeling (PLS-SEM). This study found that climate factors accounted for 77.9% of monthly vegetation dynamics, while climate factors and vegetation dynamics explained 31.6% of monthly runoff changes. Furthermore, vegetation dynamics, climate factors, and runoff explained 74.3% of monthly sediment changes. Among the factors affecting sediment changes, direct runoff had the most significant impact (β = 0.869), while precipitation had a crucial indirect effect (β = 0.597). Vegetation had a limited direct impact on sediment (β = −0.246) but mainly reduced sediment transport by decreasing runoff. This subsequently led to a reduction in sediment deposition and suspended transport in water bodies. Additionally, this study found that climate factors significantly influenced vegetation dynamics. Temperature had a significant direct effect on vegetation dynamics (β = 0.510), with early temperature also having a highly significant direct effect on vegetation (β = 0.493). However, this study found that precipitation and early precipitation did not significantly affect vegetation (p < 0.05). This could be due to the presence of drought-resistant herbaceous plants and shrubs, such as alfalfa and sea buckthorn, in the study area that can survive and grow under limited water resources. This study presents a method for separating influencing factors from the intricate relationship between watershed runoff and sediment transport in the gully region of the Loess Plateau. This study contributes to a better understanding of water and soil loss drivers.

Author Contributions

Conceptualization, D.Z. and P.M.; methodology, X.H. and D.Z.; software, D.Z.; validation, D.Z. and P.M.; writing—original draft preparation, D.Z., P.M., H.L., Y.L. and S.G.; writing—review and editing, D.Z., P.M., H.L., Y.L. and S.G.; visualization, D.Z., P.M., H.L. and X.S.; supervision, D.Z., P.M., H.L. and X.S. All authors have read and agreed to the published version of the manuscript.

Funding

This research was supported by a grant from the Natural Science Basic Research Programme of Shaanxi Province (2023-JC-ZD-30).

Data Availability Statement

The data presented in this study are available upon request from the corresponding authors.

Conflicts of Interest

The authors declare no conflicts of interest.

References

  1. Wen, B.; Huang, C.; Zhou, C.; Zhang, H.; Yang, Q.; Li, M. Spatiotemporal dynamics and driving factors of soil erosion in the Beiluo River Basin, Loess Plateau, China. Ecol. Indic. 2023, 155, 110976. [Google Scholar] [CrossRef]
  2. Xia, L.; Song, X.; Fu, N.; Cui, S.; Li, L.; Li, H.; Li, Y. Effects of rock fragment cover on hydrological processes under rainfall simulation in a semi-arid region of China. Hydrol. Process. 2018, 32, 792–804. [Google Scholar] [CrossRef]
  3. Xia, L.; Song, X.; Li, H.; Li, Y. Evolution Characteristics of Runoff and Sediment Yield and Their Driving Factors in Yanwachuan Basin. J. Soil Water Conserv. 2016, 30, 89–95. [Google Scholar]
  4. Tian, X.; Zhao, G.; Mu, X.; Zhang, P.; Gao, P.; Sun, W.; Lu, X.; Tian, P. Decoupling effects of driving factors on sediment yield in the Chinese Loess Plateau. Int. Soil Water Conserv. Res. 2023, 11, 60–74. [Google Scholar] [CrossRef]
  5. Zheng, F.; Zhang, X.C.; Wang, J.; Flanagan, D.C. Assessing applicability of the WEPP hillslope model to steep landscapes in the northern Loess Plateau of China. Soil Tillage Res. 2020, 197, 104492. [Google Scholar] [CrossRef]
  6. Kong, D.; Miao, C.; Gou, J.; Zhang, Q.; Su, T. Sediment reduction in the middle Yellow River basin over the past six decades: Attribution, sustainability, and implications. Sci. Total Environ. 2023, 882, 163475. [Google Scholar] [CrossRef]
  7. Zheng, H.; Miao, C.; Wu, J.; Lei, X.; Liao, W.; Li, H. Temporal and spatial variations in water discharge and sediment load on the Loess Plateau, China: A high-density study. Sci. Total Environ. 2019, 666, 875–886. [Google Scholar] [CrossRef]
  8. Li, W.; Zhou, J.; Xu, Z.; Liang, Y.; Shi, J.; Zhao, X. Climate impact greater on vegetation NPP but human enhance benefits after the Grain for Green Program in Loess Plateau. Ecol. Indic. 2023, 157, 111201. [Google Scholar] [CrossRef]
  9. Wang, Y.; Brandt, M.; Zhao, M.; Xing, K.; Wang, L.; Tong, X.; Xue, F.; Kang, M.; Jiang, Y.; Fensholt, R. Do afforestation projects increase core forests? Evidence from the Chinese Loess Plateau. Ecol. Indic. 2020, 117, 106558. [Google Scholar] [CrossRef]
  10. Wang, Z.; Xu, M.; Liu, X.; Singh, D.K.; Fu, X. Quantifying the impact of climate change and anthropogenic activities on runoff and sediment load reduction in a typical Loess Plateau watershed. J. Hydrol. Reg. Stud. 2022, 39, 100992. [Google Scholar] [CrossRef]
  11. Yang, D.; Li, C.; Hu, H.; Lei, Z.; Yang, S.; Kusuda, T.; Koike, T.; Musiake, K. Analysis of water resources variability in the Yellow River of China during the last half century using historic data. Water Resour. Res. 2004, 1842, 308–322. [Google Scholar]
  12. Marques, M.J.; Bienes, R.; Jimenez, L.; Perez-Rodriguez, R. Effect of vegetal cover on runoff and soil erosion under light intensity events. Rainfall simulation over USLE plots. Sci. Total Environ. 2007, 378, 161–165. [Google Scholar] [CrossRef] [PubMed]
  13. Wei, W.; Chen, L.; Fu, B.; Huang, Z.; Wu, D.; Gui, L. The effect of land uses and rainfall regimes on runoff and soil erosion in the semi-arid loess hilly area, China. J. Hydrol. 2007, 335, 247–258. [Google Scholar] [CrossRef]
  14. Shi, Z.H.; Huang, X.D.; Ai, L.; Fang, N.F.; Wu, G.L. Quantitative analysis of factors controlling sediment yield in mountainous watersheds. Geomorphology 2014, 226, 193–201. [Google Scholar] [CrossRef]
  15. Cheng, S.; Yu, X.; Li, Z.; Xu, X.; Gao, H.; Ye, Z. The effect of climate and vegetation variation on monthly sediment load in a karst watershed. J. Clean. Prod. 2023, 382, 135290. [Google Scholar] [CrossRef]
  16. Yang, X.; Sun, W.; Li, P.; Mu, X.; Gao, P.; Zhao, G. Reduced sediment transport in the Chinese Loess Plateau due to climate change and human activities. Sci. Total Environ. 2018, 642, 591–600. [Google Scholar] [CrossRef]
  17. Zhang, B.; He, C.; Burnham, M.; Zhang, L. Evaluating the coupling effects of climate aridity and vegetation restoration on soil erosion over the Loess Plateau in China. Sci. Total Environ. 2016, 539, 436–449. [Google Scholar] [CrossRef]
  18. Kong, Z.-H.; Zhang, X.-S.; Zhou, G.-S. Agricultural sustainability in a sensitive environment—A case analysis of Loess Plateau in China. J. Environ. Sci. 2002, 14, 357–366. [Google Scholar]
  19. Wang, X.; Wang, B.; Xu, X. Effects of large-scale climate anomalies on trends in seasonal precipitation over the Loess Plateau of China from 1961 to 2016. Ecol. Indic. 2019, 107, 105643. [Google Scholar] [CrossRef]
  20. Wang, Y. Response of Droughts or Waterloggings in the Loess Plateau in China to Global Climate Change. Arid. Land Geogr. 2005, 28, 161–166. [Google Scholar]
  21. Liu, Y.; Wang, J.Y. Progress in Studies on Relationships between Vegetation and Soil Nutrients and Water in Succession of Vegetation of Loess Plateau. J. Northeast. Agric. Sci. 2010, 35, 25–27. [Google Scholar] [CrossRef]
  22. Zhang, X.Y.; Zhou, Z.Z. Research progress on mechanism of grassland vegetation regulating soil erosion in Loess Plateau. Grassl. Sci. 2015, 32, 64–70. [Google Scholar]
  23. Geng, R.; Ye, Z.; Tian, P.; Jin, Q.; Bi, B.; Zhao, G.; Mu, X.; Wang, T.; Zhu, D. Variation of runoff-sediment relationship at flood event scale in three typical watersheds of the Loess Plateau. Catena 2024, 235, 107679. [Google Scholar] [CrossRef]
  24. Bao, Z.; Zhang, J.; Wang, G.; He, R.; Jin, J.; Wang, J.; Wu, H. Quantitative assessment of the attribution of runoff and sediment changes based on hydrologic model and machine learning: A case study of the Kuye River in the Middle Yellow River basin. Adv. Water Sci. 2021, 32, 485–496. [Google Scholar] [CrossRef]
  25. Tian, P.; Liu, L.; Tian, X.; Zhao, G.; Klik, A.; Wang, R.; Lu, X.; Mu, X.; Bai, Y. Sediment yields variation and response to the controlling factors in the Wei River Basin, China. Catena 2022, 213, 106181. [Google Scholar] [CrossRef]
  26. Borychowski, M.; Grzelak, A.; Popławski, Ł. What drives low-carbon agriculture? The experience of farms from the Wielkopolska region in Poland. Environ. Sci. Pollut. Res. 2022, 29, 18641–18652. [Google Scholar] [CrossRef]
  27. Wang, H.; Zhong, S.; Guo, J.; Fu, Y. Factors Affecting Green Agricultural Production Financing Behavior in Heilongjiang Family Farms: A Structural Equation Modeling Approach. Front. Psychol. 2021, 12, 692140. [Google Scholar] [CrossRef]
  28. Bernardo, A.B.I.; Cai, Y.; King, R.B. Society-level social axiom moderates the association between growth mindset and achievement across cultures. Br. J. Educ. Psychol. 2021, 91, 1166–1184. [Google Scholar] [CrossRef]
  29. Yang, X.; Tian, Y.H.; Hao, Y.; Zhang, Y.Z. A New Method to Calculate the Rate of Technological Progress and their Contribution Rates of Economic Growth in China. J. Quant. Technol. Econ. 2017, 34, 57–72. [Google Scholar] [CrossRef]
  30. Li, L.J. Study on the Change Mechanism of Water Balance Component and Water-Related Ecosystem Services under Typical Vegetation Species in the Gully Region of the Loess Plateau. Ph.D. Thesis, Xi’an University of Technology, Xi’an, China, 2023. [Google Scholar]
  31. Xia, L.; Bi, R.; Song, X.; Lu, C.; Ma, Y.; Li, H. Study on the variation of baseflow and its driving factors in the Yanwachuan watershed. Acta Ecol. Sin. 2021, 41, 8430–8442. [Google Scholar]
  32. Wang, Y.; Liu, W.Z.; Li, H.Y.; Zhang, X.P. The Flow-sediment Relationship and Its Response to Watershed Management in Yanwachuan Watershed, Loess Plateau Gully Region, China. J. Nat. Resour. 2015, 30, 1403–1413. [Google Scholar] [CrossRef]
  33. Zhu, Y.X.; Zhang, Y.J.; Zu, J.X.; Che, B.; Tang, Z.; Cong, N.; Li, J.X.; Chen, N. Performance evaluation of GIMMS NDVI based on MODIS NDVI and SPOT NDVI data. Ying Yong Sheng Tai Xue Bao J. Appl. Ecol. 2019, 30, 536–544. [Google Scholar] [CrossRef]
  34. Wang, Z.P.; Zhang, X.Z.; He, Y.T.; Li, M.; Shi, P.L.; Zu, J.X.; Niu, B. Responses of normalized difference vegetation index (NDVI) to precipitation changes on the grassland of Tibetan Plateau from 2000 to 2015. Chin. J. Appl. Ecol. 2018, 29, 75–83. [Google Scholar] [CrossRef]
  35. Piao, S.L.; Fang, J.Y.; He, J.S.; Xiao, Y. Spatiaùtion of grassland biomass in China. Chin. J. Plant Ecol. 2004, 4, 491–498. [Google Scholar]
  36. Dai, Q.Y.; Xu, Y.; Zhao, C.; Lu, Y.G.; Huang, W.T. Dynamic variation of vegetation EVl and its driving mechanism in the Sichuan Basin. China Environ. Sci. 2023, 43, 4292–4304. [Google Scholar] [CrossRef]
  37. Son, N.T.; Chen, C.F.; Chen, C.R.; Minh, V.Q.; Trung, N.H. A comparative analysis of multitemporal MODIS EVI and NDVI data for large-scale rice yield estimation. Agric. For. Meteorol. 2014, 197, 52–64. [Google Scholar] [CrossRef]
  38. Zhong, R.; Wang, P.; Mao, G.; Chen, A.; Liu, J. Spatiotemporal variation of enhanced vegetation index in the Amazon Basin and its response to climate change. Phys. Chem. Earth 2021, 123, 103024. [Google Scholar] [CrossRef]
  39. Yu, L.; Liu, T.; Bu, K.; Yan, F.; Yang, J.; Chang, L.; Zhang, S. Monitoring the long term vegetation phenology change in Northeast China from 1982 to 2015. Sci. Rep. 2017, 7, 14770. [Google Scholar] [CrossRef]
  40. Wu, D.; Zhao, X.; Liang, S.; Zhou, T.; Huang, K.; Tang, B.; Zhao, W. Time-lag effects of global vegetation responses to climate change. Glob. Chang. Biol. 2015, 21, 3520–3531. [Google Scholar] [CrossRef]
  41. Anderson, L.O.; Malhi, Y.; Aragao, L.E.; Ladle, R.; Arai, E.; Barbier, N.; Phillips, O. Remote sensing detection of droughts in Amazonian forest canopies. New Phytol. 2010, 187, 733–750. [Google Scholar] [CrossRef]
  42. Rundquist, B.C.; Harrington, J.A., Jr. The Effects of Climatic Factors on Vegetation Dynamics of Tallgrass and Shortgrass Cover. GeoCarto Int. 2000, 15, 33–38. [Google Scholar] [CrossRef]
  43. Saatchi, S.; Asefi-Najafabady, S.; Malhi, Y.; Aragao, L.E.; Anderson, L.O.; Myneni, R.B.; Nemani, R. Persistent effects of a severe drought on Amazonian forest canopy. Proc. Natl. Acad. Sci. USA 2013, 110, 565–570. [Google Scholar] [CrossRef]
  44. Adler, S.J.; Sharma, P.N.; Radomir, L. Toward open science in PLS-SEM: Assessing the state of the art and future perspectives. J. Bus. Res. 2023, 169, 114291. [Google Scholar] [CrossRef]
  45. Liu, C.; Zhang, F.; Jim, C.-Y.; Johnson, V.C.; Tan, M.L.; Shi, J.; Lin, X. Controlled and driving mechanism of the SPM variation of shallow Brackish Lakes in arid regions. Sci. Total Environ. 2023, 878, 163127. [Google Scholar] [CrossRef] [PubMed]
  46. Wang, C.; Ma, L.; Zhang, Y.; Chen, N.; Wang, W. Spatiotemporal dynamics of wetlands and their driving factors based on PLS-SEM: A case study in Wuhan. Sci. Total Environ. 2022, 806, 151310. [Google Scholar] [CrossRef]
  47. Farooq, M.S.; Salam, M. Nexus between CSR and DSIW: A PLS-SEM Approach. Int. J. Hosp. Manag. 2020, 86, 102437. [Google Scholar] [CrossRef]
  48. Tenenhaus, M.; Vinzi, V.E.; Chatelin, Y.M.; Lauro, C.J.C.S.; Analysis, D. PLS path modeling. Comput. Stat. Data Anal. 2005, 48, 159–205. [Google Scholar] [CrossRef]
  49. Huang, X.; Fang, N.F.; Shi, Z.H.; Zhu, T.X.; Wang, L. Decoupling the effects of vegetation dynamics and climate variability on watershed hydrological characteristics on a monthly scale from subtropical China. Agric. Ecosyst. Environ. 2019, 279, 14–24. [Google Scholar] [CrossRef]
  50. Mo, K.; Chen, Q.; Chen, C.; Zhang, J.; Wang, L.; Bao, Z. Spatiotemporal variation of correlation between vegetation cover and precipitation in an arid mountain-oasis river basin in northwest China. J. Hydrol. 2019, 574, 138–147. [Google Scholar] [CrossRef]
  51. Nearing, M.A.; Jetten, V.; Baffaut, C.; Cerdan, O.; Couturier, A.; Hernandez, M.; Le Bissonnais, Y.; Nichols, M.H.; Nunes, J.P.; Renschler, C.S.; et al. Modeling response of soil erosion and runoff to changes in precipitation and cover. Catena 2005, 61, 131–154. [Google Scholar] [CrossRef]
  52. Wen, Y.; Liu, X.; Yang, J.; Lin, K.; Du, G. NDVI indicated inter-seasonal non-uniform time-lag responses of terrestrial vegetation growth to daily maximum and minimum temperature. Glob. Planet. Chang. 2019, 177, 27–38. [Google Scholar] [CrossRef]
  53. Fu, B.-J.; Wang, Y.-F.; Lu, Y.-H.; He, C.-S.; Chen, L.-D.; Song, C.-J. The effects of land-use combinations on soil erosion: A case study in the Loess Plateau of China. Prog. Phys. Geogr. Earth Environ. 2009, 33, 793–804. [Google Scholar] [CrossRef]
  54. Ran, L.; Lu, X.; Xu, J. Effects of Vegetation Restoration on Soil Conservation and Sediment Loads in China: A Critical Review. Crit. Rev. Environ. Sci. Technol. 2013, 43, 1384–1415. [Google Scholar] [CrossRef]
  55. Restrepo, J.D.; Kjerfve, B.; Hermelin, M.; Hydrology, J.C. Factors controlling sediment yield in a major South American drainage basin: The Magdalena River, Colombia. J. Hydrol. 2006, 316, 213–232. [Google Scholar] [CrossRef]
  56. Zhao, D.; Xiong, D.; Zhang, B.; He, K.; Wu, H.; Zhang, W.; Lu, X. Long-term response of runoff and sediment load to spatiotemporally varied rainfall in the Lhasa River basin, Tibetan Plateau. J. Hydrol. 2023, 618, 129154. [Google Scholar] [CrossRef]
  57. Wang, Y. Response of Runoff and Sediment to Climatic Change and Human Activity in Yanwachuan Watershed, Loess Plateau, China. Ph.D. Thesis, Northwest Agriculture and Forestry University, Xi’an, China, 1 November 2015. [Google Scholar]
  58. Cheng, J.; Hu, T.M.; Cheng, J.M. Responses of distribution of Bothriochloa ischaemum community to hydrothermal gradient in loess plateau. Acta Agrestia Sin. 2010, 18, 5. [Google Scholar]
  59. Cheng, J.; Hu, T.M.; Cheng, J.M. Responses of distribution of Artemisia sacrorum community to climate in semi-arid and semi-humid areas of Loess Plateau. Sci. Soil Water Conserv. 2011, 9, 6. [Google Scholar]
  60. Jiao, X.; Liu, G.Q. Growth and lts Influencing Factors of Locust in the Loess Plateau. Water Resour. Dev. Manag. 2009, 007, 42–48. [Google Scholar]
  61. Li, X.Y.; Yang, F.D. Analysis of Climatic Conditions for Seabuckthorn Growth and lts Cultivation Techniques. J. Agric. Catastrophology 2022, 12, 75–77. [Google Scholar]
  62. Liu, Y.H. Study on the Relations between Growth Development and Yield Formation of Alfalfa and Climate Conditions. Ph.D. Thesis, Northwest Agriculture and Forestry University, Xi’an, China, 1 April 2006. [Google Scholar]
  63. Bo, Y.S.; Wei, L.Y.; Zhang, S.Z. Afforestation Survival Rate and Juvenile Growth Characteristics of Platycladus orientalis on Arid Southern Mountain Slopes. Bull. Soil Water Conserv. 2005, 25, 4. [Google Scholar]
  64. Wang, J.; Jiao, M.L.; Han, J.; Chen, F.; Sun, Z.Z. Study on Climatic Suitability Zoning of Apple Planting in Qingyang City Based on GIS. J. Agric. Catastrophology 2023, 13, 111–113. [Google Scholar]
  65. Wei, X.; Zhang, L.F.; He, Y.; Cao, S.P.; Sun, Q.; Gao, B.H. Spatial and temporal variation characteristics of different vegetation types inyellow river basin and theirinuencing factors from 2000 to 2020. Remote Sens. Nat. Resour. 2023, 1–13. Available online: https://link.cnki.net/urlid/10.1759.p.20230830.1130.010 (accessed on 13 July 2023).
  66. Xu, M.; Li, X.; Liu, M.; Shi, Y.; Zhou, H.; Zhang, B.; Yan, J. Spatial variation patterns of plant herbaceous community response to warming along latitudinal and altitudinal gradients in mountainous forests of the Loess Plateau, China. Environ. Exp. Bot. 2020, 172, 103983. [Google Scholar] [CrossRef]
  67. Zhao, J.; Zhang, H.; Zhang, Z.; Guo, X.; Li, X.; Chen, C. Spatial and Temporal Changes in Vegetation Phenology at Middle and High Latitudes of the Northern Hemisphere over the Past Three Decades. Remote Sens. 2015, 7, 10973–10995. [Google Scholar] [CrossRef]
  68. Li, C.; Chen, J.; Wu, X.; Zhou, M.; Wei, Y.; Liu, Y.; Liu, L.; Peng, L.; Dou, T.; Li, L. Persistent effects of global warming on vegetation growth are regulated by water in China during 2001–2017. J. Clean. Prod. 2022, 381, 135198. [Google Scholar] [CrossRef]
  69. Piao, S.; Friedlingstein, P.; Ciais, P.; Viovy, N.; Demarty, J. Growing season extension and its impact on terrestrial carbon cycle in the Northern Hemisphere over the past 2 decades. Glob. Biogeochem. Cycles 2007, 21, GB3018-1–GB3018-11. [Google Scholar] [CrossRef]
  70. Zhang, G.; Zhang, Y.; Dong, J.; Xiao, X. Green-up dates in the Tibetan Plateau have continuously advanced from 1982 to 2011. Proc. Natl. Acad. Sci. USA 2013, 110, 4309–4314. [Google Scholar] [CrossRef]
  71. Chen, L.; Messing, I.; Zhang, S.; Fu, B.; Ledin, S. Land use evaluation and scenario analysis towards sustainable planning on the Loess Plateau in China—Case study in a small catchment. Catena 2003, 54, 303–316. [Google Scholar] [CrossRef]
  72. Xu, P.; Zhang, C. Progress of Research on Retrieval of Soil Moisture Based on Remote Sensing. For. Grassl. Resour. Res. 2015, 04, 151–156+160. [Google Scholar] [CrossRef]
  73. Ogle, K.; Reynolds, J.F. Plant responses to precipitation in desert ecosystems: Integrating functional types, pulses, thresholds, and delays. Oecologia 2004, 141, 282–294. [Google Scholar] [CrossRef]
  74. Schwinning, S.; Ehleringer, J.R. Water use trade-offs and optimal adaptations to pulse-driven arid ecosystems. J. Ecol. 2001, 89, 464–480. [Google Scholar] [CrossRef]
  75. Wang, J.F.; Zhang, L.H.; Zhao, R.F.; Xie, Z.K. Responses of plant growth of different life-forms to precipitation changes in desert steppe. Chin. J. Appl. Ecol. 2020, 31, 778–786. [Google Scholar] [CrossRef]
  76. Kong, D.; Miao, C.; Wu, J.; Zheng, H.; Wu, S. Time lag of vegetation growth on the Loess Plateau in response to climate factors: Estimation, distribution, and influence. Sci. Total Environ. 2020, 744, 140726. [Google Scholar] [CrossRef] [PubMed]
  77. Ma, Y.; Guan, Q.; Sun, Y.; Zhang, J.; Yang, L.; Yang, E.; Li, H.; Du, Q. Three-dimensional dynamic characteristics of vegetation and its response to climatic factors in the Qilian Mountains. Catena 2022, 208, 105694. [Google Scholar] [CrossRef]
  78. Hu, J.; Zhao, G.; Li, P.; Mu, X. Variations of pan evaporation and its attribution from 1961 to 2015 on the Loess Plateau, China. Nat. Hazards 2022, 111, 1199–1217. [Google Scholar] [CrossRef]
  79. Zhao, Z.-K.; Wang, T.-H.; Zhang, L.; Ruan, J.-B.; Zhu, X.-X. Measurement and modeling of the evaporation rate of loess under high temperature. Int. J. Heat Mass Transf. 2023, 215, 124486. [Google Scholar] [CrossRef]
  80. Lu, S.; Hu, Z.; Fu, C.; Fan, W.; Wu, D. Characteristics and Possible Causes for Extreme Precipitation in Summer over the Loess Plateau. Plateau Meteorol. 2022, 41, 241–254. [Google Scholar]
  81. Liu, J.; Li, J.; Zhou, Y.; Fu, Q.; Zhang, L.; Liu, L. Effects of Straw Mulching and Tillage on Soil Water Characteristics. Trans. Chin. Soc. Agric. Mach. 2019, 50, 333–339. [Google Scholar]
  82. Han, Y.; Yang, Q.; Gao, H.; Xu, H. Runoff and Sediment Characteristics of Flood Event in Typical Watershed on the Loess Plateau Based on Vegetation Restoration. J. Soil Water Conserv. 2023, 37, 278–283, 293. [Google Scholar]
  83. Yang, J. Vegetation Restoration and Its Impact on Hydrological Process in Typical Areas of the Middle Loess Plateau. Ph.D. Thesis, Northwest Agriculture and Forestry University, Xi’an, China, 1 May 2021. [Google Scholar]
  84. Yang, J.; Jin, J.M.; Shao, J.; Wang, J.B. Vegetation restoration and is impact on runoff in typical areas of middle Loess Plateau. Trans. Chin. Soc. Agric. Mach. 2021, 52, 258–266. [Google Scholar]
  85. Zhang, L.; Jilambda, G.; Lu, X.; Lei, Z.; Liu, R.; Zhang, X. Research of Soil Erosion Thresholds on the Lower Slopes of Different Vegetation Cover in Typical Areas of Loess Plateau. J. Soil Water Conserv. 2023, 37, 187–198. [Google Scholar]
  86. Wei, Y.Y.; Wang, J.; Zhang, Y.W.; Zheng, E.; Yang, M.T.; Wang, X.Q. Study on Soil Infiltration Characteristics of Different Vegetation Types on Loess Plateau. J. Soil Water Conserv. 2021, 40, 16–20. [Google Scholar] [CrossRef]
  87. Yang, M.H. The Research of Water Ecology for Some Main Vegetation with Soil and Water Conservation Effect in Loess Hilly and Gully Region. Ph.D. Thesis, Chinese Academy of Forestry, Beijing, China, 2006. [Google Scholar]
  88. Ding, L.; Fu, S. Sediment transport capacity as affected by different combinations of vegetation litter and stem cover. Catena 2022, 211, 106021. [Google Scholar] [CrossRef]
  89. Ahn, K.-H.; Merwade, V. Quantifying the relative impact of climate and human activities on streamflow. J. Hydrol. 2014, 515, 257–266. [Google Scholar] [CrossRef]
  90. Guo, Q.; Ding, Z.; Qin, W.; Cao, W.; Lu, W.; Xu, X.; Yin, Z. Changes in sediment load in a typical watershed in the tableland and gully region of the Loess Plateau, China. Catena 2019, 182, 104132. [Google Scholar] [CrossRef]
  91. Li, Y.Y.; Shao, M.A. Change of soil physical properties under long-term natural vegetation restoration in the Loess Plateau of China. J. Arid. Environ. 2006, 64, 77–96. [Google Scholar] [CrossRef]
  92. Salah, A.M.A.; Prasse, R.; Marschner, B. Intercropping with native perennial plants protects soil of arable fields in semi-arid lands. J. Arid. Environ. 2016, 130, 1–13. [Google Scholar] [CrossRef]
  93. Zhang, Y.; Niu, J.; Yu, X.; Zhu, W.; Du, X. Effects of fine root length density and root biomass on soil preferential flow in forest ecosystems. For. Syst. 2015, 24, 12. [Google Scholar] [CrossRef]
  94. Lazaro, R.; Calvo-Cases, A.; Lazaro, A.; Molina, I. Effective run-off flow length over biological soil crusts on silty loam soils in drylands. Hydrol. Process. 2015, 29, 2534–2544. [Google Scholar] [CrossRef]
  95. Chen, H.; Cai, Q. Impact of hillslope vegetation restoration on gully erosion induced sediment yield. Sci. China Ser. D 2006, 49, 176–192. [Google Scholar] [CrossRef]
  96. Shao, Q.; Traylen, A.; Zhang, L. Nonparametric method for estimating the effects of climatic and catchment characteristics on mean annual evapotranspiration. Water Resour. Res. 2012, 48, W03517.1–W03517.13. [Google Scholar] [CrossRef]
Figure 1. Overview of the study area.
Agronomy 14 00238 g001
Figure 2. The land-use situation in 2000 and 2010.
Agronomy 14 00238 g002
Figure 3. PLS-SEM structure.
Agronomy 14 00238 g003
Figure 4. Temporal variation in monthly runoff and sediment in the Yanwachuan watershed.
Agronomy 14 00238 g004
Figure 5. Various delays (0–3 months) in the Yanwachuan watershed, scatterplots, and correlation coefficients of chosen vegetation indicators and precipitation. Coefficients of correlation (R) and p-values are displayed in the graphs.
Agronomy 14 00238 g005
Figure 6. Various delays (0–3 months) in the Yanwachuan watershed, scatterplots, and correlation coefficients of chosen vegetation indicators and temperature. Coefficients of correlation (R) and p-values are displayed in the graphs.
Agronomy 14 00238 g006
Figure 7. Results of the PLS-SEM analysis of the Yanwachuan watershed. Relationships between potential variables: Solid arrows indicate significant relationships and numbers beside arrows indicate path coefficients. Insignificant relationships (p > 0.05) are indicated using dashed arrows. Numbers indicate the correlations between each latent variable and its observable variables after arrows, representing the loadings. Table 1 provides a comprehensive list of the abbreviations for the chosen variables.
Agronomy 14 00238 g007
Table 1. PLS-SEM selection of latent variables as well as observed variables.
Latent VariablesMeasured VariablesDescriptionUnit
Antecedent precipitationP1monTotal monthly precipitation 1 month beforemm
P2monTotal monthly precipitation 2 months beforemm
P3monTotal monthly precipitation 3 months beforemm
PrecipitationPMonthly total precipitation amountmm
PDMonthly count of days with precipitation
PmaxMonthly maximum 1-day precipitationmm
Antecedent temperatureT1monAverage monthly temperature 1 month before°C
T2monAverage monthly temperature 2 months before°C
T3monAverage monthly temperature 3 months before°C
TemperatureTMonthly average temperature°C
TmaxMonthly maximum temperature°C
TminMonthly minimum temperature°C
VegetationNDVINormalized difference vegetation index
EVIEnhanced vegetation index
RunoffRMonthly total runoff×104 m3
SedimentSLTotal monthly sediment×104 t
Table 2. Comparison of climate variables and vegetation variables in different months in the Yanwachuan watershed, 2000–2016.
Latent VariablesMeasured VariablesMonth
123456789101112
PrecipitationP6.09.917.529.544.958.2118.1102.5110.635.715.24.2
efefdefcdebcbaaabcddeff
Pmax3.34.48.413.716.022.346.936.827.812.15.62.3
efefdefdefcdecdaabbcdefeff
PD3.04.55.55.58.18.510.610.612.17.23.62.6
fgefgefefcdbcdabcabadefgg
TemperatureT−3.80.15.611.916.420.921.920.315.410.24.0−2.1
gfdcbaaabcdeg
Tmin−10.7−6.4−3.42.99.915.016.915.49.44.2−2.5−8.8
fedcbaaabcdf
Tmax2.17.014.319.922.225.826.325.120.915.79.92.9
jhfdcababcegi
egijhfdcababc
VegetationNDVI0.50.40.40.60.70.70.80.80.70.70.60.6
eeecdbbaaabcd
EVI0.30.20.30.50.50.50.50.50.50.40.40.4
efefcbaaabcdcd
Different letters indicate a significant difference between different months at a p < 0.05 level.
Table 3. Direct, indirect, and total effects of variables determined using PLS-SEM in the Yanwachuan watershed.
VariableDirect EffectIndirect EffectTotal
Vegetation
Antecedent temperature0.4930.493
Temperature0.5100.510
Antecedent precipitation−0.043−0.043
Precipitation0.0150.015
Runoff
Antecedent temperature−0.118−0.118
Temperature−0.122−0.122
Antecedent precipitation0.0100.010
Precipitation0.690−0.0040.686
Vegetation−0.239−0.239
Sediment
Antecedent temperature−0.121−0.125
Temperature−0.125−0.121
Antecedent precipitation0.0100.010
Precipitation0.5970.597
Vegetation−0.038−0.208−0.246
Runoff0.8690.869
“—”: The identification of direct or indirect effects was unattainable.
Disclaimer/Publisher’s Note: The statements, opinions and data contained in all publications are solely those of the individual author(s) and contributor(s) and not of MDPI and/or the editor(s). MDPI and/or the editor(s) disclaim responsibility for any injury to people or property resulting from any ideas, methods, instructions or products referred to in the content.

