Article

De Novo Transcriptome Analysis of Solanum lycopersicum cv. Super Strain B under Drought Stress

by
Hassan S. Al-Zahrani
1,
Tarek A. A. Moussa
1,2,*,
Hameed Alsamadany
1,
Rehab M. Hafez
2 and
Michael P. Fuller
3
1
Biological Sciences Department, Faculty of Science, King Abdulaziz University, Jeddah 21589, Saudi Arabia
2
Botany and Microbiology Department, Faculty of Science, Cairo University, Giza 12613, Egypt
3
School of Biological and Marine Science, Faculty of Science and Engineering, University of Plymouth, Plymouth PL4 8AA, UK
*
Author to whom correspondence should be addressed.
Agronomy 2023, 13(9), 2360; https://doi.org/10.3390/agronomy13092360
Submission received: 13 August 2023 / Revised: 6 September 2023 / Accepted: 7 September 2023 / Published: 11 September 2023
(This article belongs to the Topic Plant Responses to Environmental Stress)

Abstract

:
Tomato cv. super strain B was widely cultivated in Saudi Arabia under drought stress. Illumina Hiseq-2000 was used to create the transcriptional profile of tomato cultivar super strain B. A total of 98,069 contigs were gathered, with an average length of 766 bp. Most of the genes in the gene ontology (GO) analysis were categorized into molecular function (MF) of ATP binding (1301 genes), metal ion binding (456 genes), protein kinase activity (392 genes), transferase activity (299 genes), Biological process (BP) of DNA-templated genes (366 genes), and regulation of transcription genes (209 genes), while cellular components (CC) of integral component of membrane (436 genes). The most dominant enzymes expressed were transferases (645 sequences). According to the KEGG pathway database, 15,638 transcripts were interpreted in 125 exclusive pathways. The major pathway groups were metabolic pathways (map01100, 315 genes) and biosynthesis of secondary metabolites (map01110, 188 genes). The total number of variants in the twelve chromosomes of super strain B compared with the tomato genome was 5284. The total number of potential SSRs was 5047 in 4806 unigenes. Trinucleotide repeats (3006, 59.5%) were the most found type in the transcriptome. A total of 4541 SNPs and 744 INDELs in tomato super strain B were identified when compared with the tomato genome.

1. Introduction

The tomato plant (Solanum lycopersicum L.) is one of the most highly consumed economic crops all over the world and had been used as a model plant for several studies such as on abiotic stresses [1,2,3]. The cultivar “super strain B” is an early-maturing open-pollinated (OP) variety that is commonly used for processing markets worldwide. The determinate plant is vigorous and a heavy yielder, producing dark green shoulders on large round pulpy fruit weighing between 120 and 140 g. It is a vigorous plant with excellent cover, and the hard fruits provide a long shelf life and consistent ripening. This cultivar has demonstrated excellent tolerance in hot climate regions. The cultivation of vegetables under airconditioned and non-airconditioned greenhouses in Saudi Arabia began more than 30 years ago and has developed remarkably. Tomato and cucumber crops represent about 58% of this area, and the production of tomatoes has reached 40 Kg m−2 (Ministry of Environment, Water and Agriculture, KSA).
A phylogenetic and taxonomic framework is now available at the family level [4,5]. Individual studies have investigated the relationships at the tribe level [6,7,8] and genus level [9,10,11], and numerous phylogenetic investigations represent about 50% of the species in the family [12,13,14]. Some of these investigations have suggested taxonomic divergences of the formerly known genera Normania, Lycopersicon, Cyphomandra, and Triguera as groups of a monophyletic Solanum [15,16].
Transcriptome sequencing is a method in which the cDNA is directly sequenced by large-scale sequencing equipment to create tens of millions of reads. Following this, the transcription level of a particular part of the genome can be studied by cross-comparison of its reads. RNA-sequencing (RNA-seq) is a very malleable platform that gives numerous benefits such as ease of operation, cheapness, rapid flux, and sensitivity-free from gene expression abundance. It is a relevant methodology for the genome sequencing of anonymous species [17,18,19,20]. RNA-seq needs relatively few RNA samples and is highly precise for recognizing low-expression genes and expression microarrays [21]. Using the RNA-seq technique, six Solanaceae species (tomato, petunia, potato, pepper, and tobacco) account for 449,224 of the sequences that have been grouped and combined into gene indices for this family [22].
Breeders use genetic variation as the primary raw material in their breeding programs. Using molecular markers, it is necessary to map the important agronomic traits (mostly complex traits) to broaden the genetic base of improved varieties for improved yield performance. Single nucleotide polymorphisms (SNPs) and small insertions and deletions (InDels) are two usual forms of genetic variants associated with next-generation sequencing data that have been widely used in genomic and transcriptomic analyses of plants [23]. Recently, many tomato genome resequencing projects were established and started to investigate the in-depth genetic variation available in tomatoes [24,25]. These efforts aimed to classify genome-wide SNPs and InDels within S. lycopersicum, as well as shared polymorphisms among its wild closely related species using molecular markers such as simple-sequence repeats (SSRs) to identify the genes responsible for interspecific and intraspecific phenotypic variations [26,27,28]. A few researchers have used those genetic markers to gain a better understanding of drought response mechanisms and identify alleles that are associated with the drought phenotypes of different tomato genotypes [29].
The adverse environmental conditions that face agriculture in Saudi Arabia encourage research scientists to address methodologies to address problems and find applicable solutions. The current reported work aimed to characterize the transcriptome profile of the tomato cultivar super strain B and identify gene(s) of interest under drought stress. Furthermore, the work also sought to deduce suitable SSR molecular markers for Solanaceae. So, the novelty of this study is its focus on both transcriptomic analysis and molecular marker identification.

2. Materials and Methods

2.1. Plant Materials and Growth Conditions

Solanum lycopersicum cv. super strain B plant was obtained in accordance with the relevant institutional, national, and international guidelines and legislation. Seeds (Emerald Seed Co., El Centro, CA, USA) were purchased from a Saudi local market. This cultivar is broadly cultured in different regions of Saudi Arabia. The seeds were washed thoroughly with distilled water to eliminate excess antifungal seed dressing (Thiram, Karaipudur, Palladam). The viability of seeds was tested for germination and vigor and gave 80% germination after 2 days and 100% germination after 6 days. Seeds were deemed to be highly germinable and with high vigor.
The tomato cv. super strain B seeds were grown under greenhouse environmental conditions where the maximum temperature at noon was 30 °C on average and lasted for 6 h (12:00–18:00). The daily vapor pressure deficit (VPD) ranged from 0.2 to 3.5 kPa due to the daytime relative humidity range of 40% to 95%. The soil was a mixture of sand and clay (2-1 by volume). Plants were grown for 45 days and then were removed from the pots and treated for 24 h with 100 mL of 20% PEG 6000 (polyethylene glycol) [30]. Leaf tissue samples were collected and immediately plunged into liquid nitrogen and stored at −80 °C until used.

2.2. Sequencing and Data Processing

RNA-seq libraries were designed by Macrogen (Seoul, Republic of Korea) in agreement with the TruSeq library creation protocol. Samples were sequenced via the Illumina HiSeq-2000 platform.

2.2.1. RNA Extraction

Total RNA was extracted from sampled leaf tissue (two replicates) using the TRI reagent (Sigma-Aldrich, Burlington, MA, USA). Agarose gel electrophoresis was used to determine the RNA quality, and a Spectrophotometer ND-1000 was used to measure the RNA quantity (Thermo Scientific, Waltham, MA, USA). Each sample contained 10 µg RNA.

2.2.2. Illumina Paired-End cDNA Library Construction and Sequencing

The cDNA library was assembled following the manufacturer’s guidelines using Illumina/Hiseq-2000 RNAseq obtained by Macrogen (Seoul, Republic of Korea). The poly (A)-mRNA molecules were cleansed by Sera-mag Magnetic Oligo (dT) Beads from the RNA samples. A fragmentation buffer was supplemented to fragment mRNA into small segments, which were used as templates to synthesize the first cDNA strand. The sequencing adapters were added to the purified and synthesized cDNA. A gel extraction kit removed the cDNA fragments (200 ± 25 bp) from the gel. Then, the library was sequenced via an Illumina/Hiseq-2000 RNA-seq.

2.2.3. cDNA Sequencing and De Novo Transcriptome Assembly

The software FastQC (http://www.bioinformatics.babraham.ac.uk/projects/fastqc/, accessed on 13 March 2022) was applied to assess the quality of the raw data from the samples. High-quality reads were needed to enable better assembling, so, the subsequent methods: trimming of adapter, reads with low-quality nucleotides (Q ≥ 20) were trimmed by NGS_CRUMBS (http://bioinf.comav.upv.es/ngs_crumbs, accessed on 13 March 2022).
Trinity software [31] was used to build the primary assembly. This assembly was post-processed using CAP3 to reduce redundancy [32]. Then, low-expression transcripts were removed using RSEM (RNA-seq by expectation–maximization) [33]. From the final assembly, the highest transcript expressed from each cluster of the Trinity transcript was designated to make a subset.

2.3. Functional Annotation

Using the NGS backbone, the transcript sequences of S. lycopersicum cv. super strain B were annotated [34] based on the BLASTX algorithm [35] against the databases Swiss-Prot (http://web.expasy.org/docs/swiss-prot_guideline.html, accessed on 13 March 2022) [36], ITAG2.4 (ftp://ftp.sgn.cornell.edu/tomato_genome/annotation/, accessed on 13 March 2022), and UniRef90 (http://www.ebi.ac.uk/uniprot/database/download.html, accessed on 13 March 2022) [37].
The transcript functional classification was performed according to the Gene Ontology (GO) scheme using Blast2GO [38]. In this case, a plant-specific GO slim was performed to summarize the functional information of our tomato transcriptome. Moreover, Blast2GO provides an Enzyme Commission number (EC number).

2.4. Trait Genes

When the tomato transcriptome was employed as a reference database, the sequences of countless genes associated with breeding traits of interest found in other related species were assessed. To determine if these genes were present or absent in our assembled transcriptome, they were compared with referenced tomato unigenes using Blastn (cut-off of 1 × 10−60).

2.4.1. Comparison of Tomato cv. Super Strain B Transcriptome with the Tomato Genome

To determine the physical location of our assembled sequences of cv. super strain B, the most highly expressed transcript of tomato cv. super strain B was matched to the S. lycopersicum genome using Blastn (cut-off value of 1 × 10²⁰). Utilizing the Est2genome software, gene model prediction was made possible [39] as well as EMBOSS (http://www.bioinformatics.nl/emboss-explorer/, accessed on 13 March 2022), which allows for highly effective alignment of EST sequences with genomic DNA sequences. The gene model prediction was carried out through sequence homology with the tomato genome. The open reading frame detector EST Scan was also utilized for ORF annotation [40].
The sequences were marked with the tomato reference genome using Circos, a software enabling data and information presentation in a circular layout [41]. This allowed for a visual evaluation of the distribution of codifying sequences.

2.4.2. Molecular Phylogeny Relationships

Five nuclear protein-coding genes were chosen to examine the evolutionary relationships among six highly valuable Solanaceae crops using accessible data sequencing in databases (eggplant, potato, pepino, tomato, tobacco, and pepper). These were the frequently used genes for granule-bound starch synthase (waxy or GBSSI) [42,43], the salicylic acid methyltransferase gene (SAMT) [44], the β-amylase gene, the alcohol dehydrogenase gene (ADH), and the cellulose synthase gene (CesA) [44]. The genes were integrated consecutively and aligned using Clustal Omega, a multiple-sequence alignment program (https://www.ebi.ac.uk/Tools/services/rest/clustalo/, accessed on 13 March 2022). Using MEGA6, the generated alignment file was used to create a phylogenetic tree using the most significant likelihood distance and 500 bootstrap replications [45].

2.4.3. Discovery of SSR and Nucleotide-Level Variants

Mapping reads were taken from the S. lycopersicum cv. super strain B transcriptome to the reference genome. The Sputnik software (http://wheat.pw.usda.gov/ITMI/EST-SSR/LaRota, accessed on 13 March 2022), designed specifically for this activity, was used to extract SSRs. They were chosen based on their quality, proximity to introns, number of repetitions, and location within the tomato genome.
The assembled transcriptome of tomato super strain B was matched with the clean reads of tomato to detect nucleotide-level variations (SNPs and INDELs). Bowtie2 was used to map the reads. Moreover, Circos software was used for positioning the density (variants per Mb) and distribution of all these markers with the reference genome [41].

3. Results and Discussion

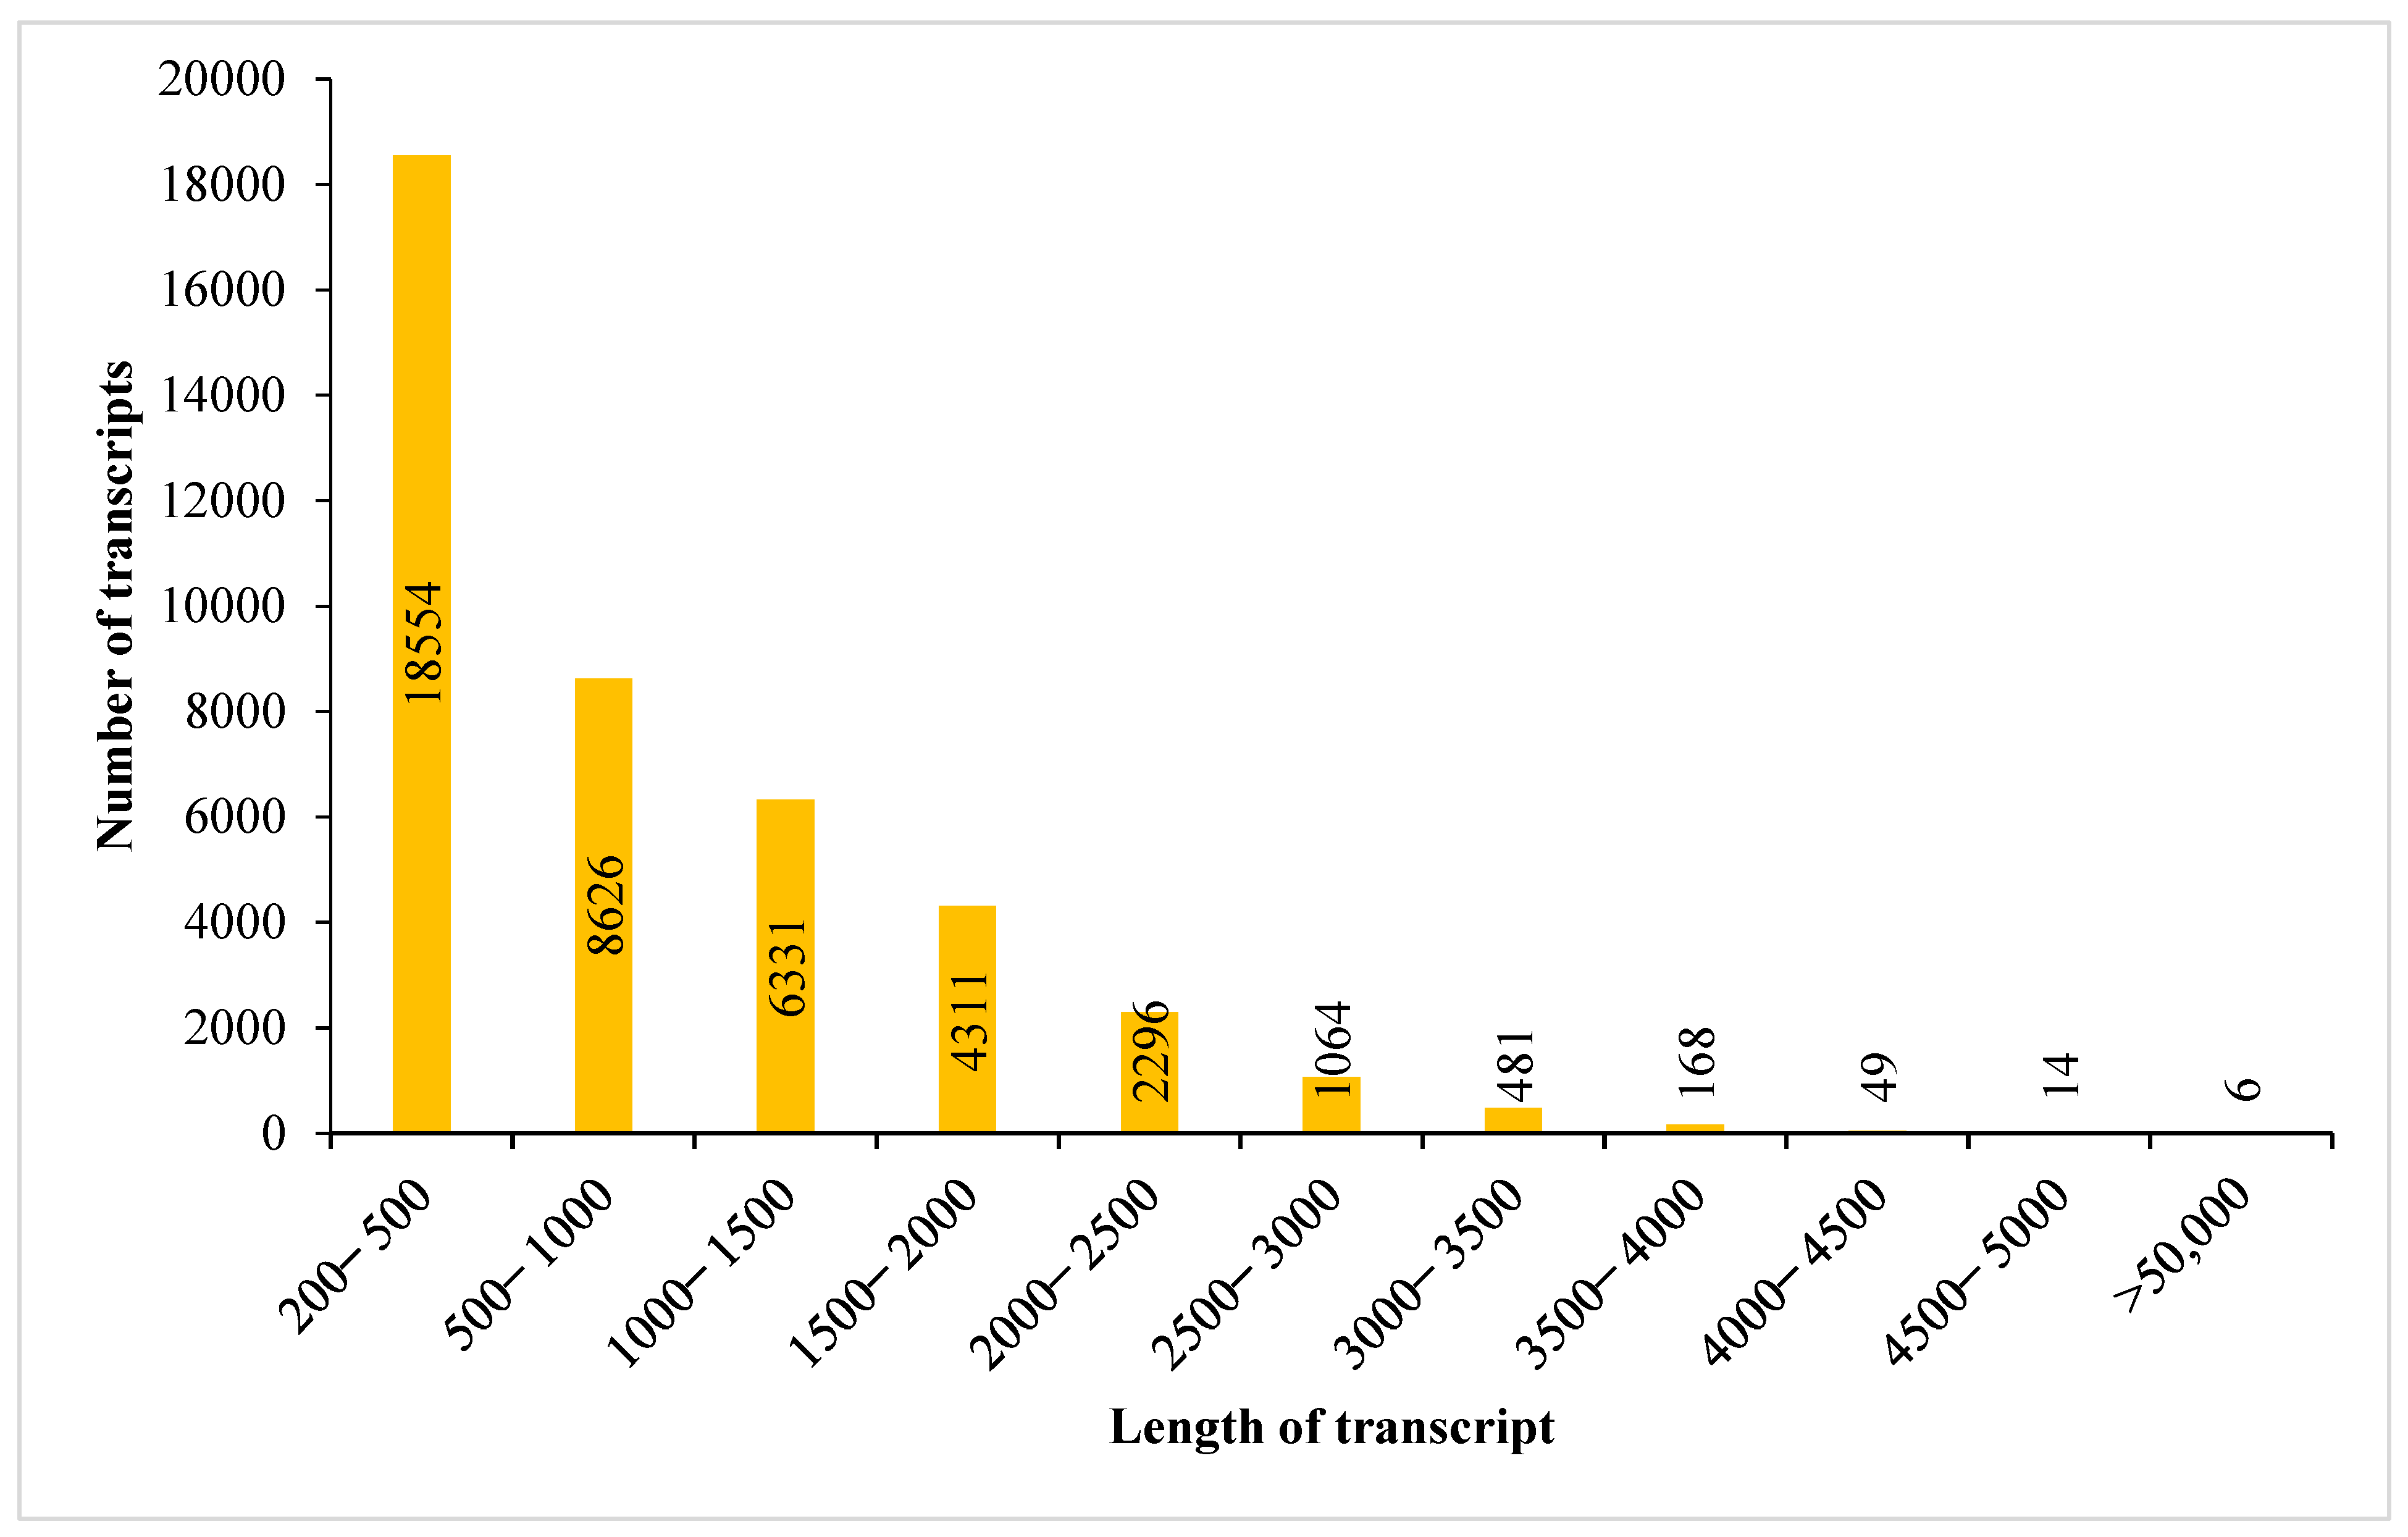
3.1. Transcriptome Sequencing Output and Assembly

The RNA sequencing from S. lycopersicum cv. super strain B using Illumina Hiseq-2000 generated 41,779,729 raw reads, which covered about 31.0 Gb raw reads data size (reads with a length > 100 bp). The raw reads were trimmed and quality-filtered by withdrawing the adapters and low-quality data to get clean reads (41,083,929), covering 29.6 Gb of clean reads data size, with 44% GC (Table 1). The sequence quality is shown in Supplementary Files S1–S4, where all the bases’ quality records are assigned.
Trinity software was used to assemble the transcriptome from high-quality reads of S. lycopersicum cultivar super strain B. The data in Table 1 show this assembly; a total of 98,069 contigs with a length of 766 bp were gathered. The highest-expressed transcript (unigenes) of each Trinity transcript cluster (41,900) had an average length of 897.37 bp. The distribution range of the length of the transcript after the gathering is illustrated in Figure 1. It can be noted that 61.2% (25,660) are between 200 and 897 bp of the assembled transcripts, 37.1% (15,522) are between >897.37–3500, and only 0.57% are higher than 3500 bp. Supplementary Table S1 is provided for more details.
The average insert length of tomato cv. Micro-Tom was 1418 bp [46], Arabidopsis was 1445 bp [47], soybean was 1539 bp [48], rice was 1548 bp [49], poplar was 990 bp [50], and S. muricatum was 704 bp [51]. The percentage of G/C of the clean reads applied as an indicator of closeness between species was estimated. These values agree with those described for Pepino where GC was 41.7% [51], as well as for other Solanum species [22].

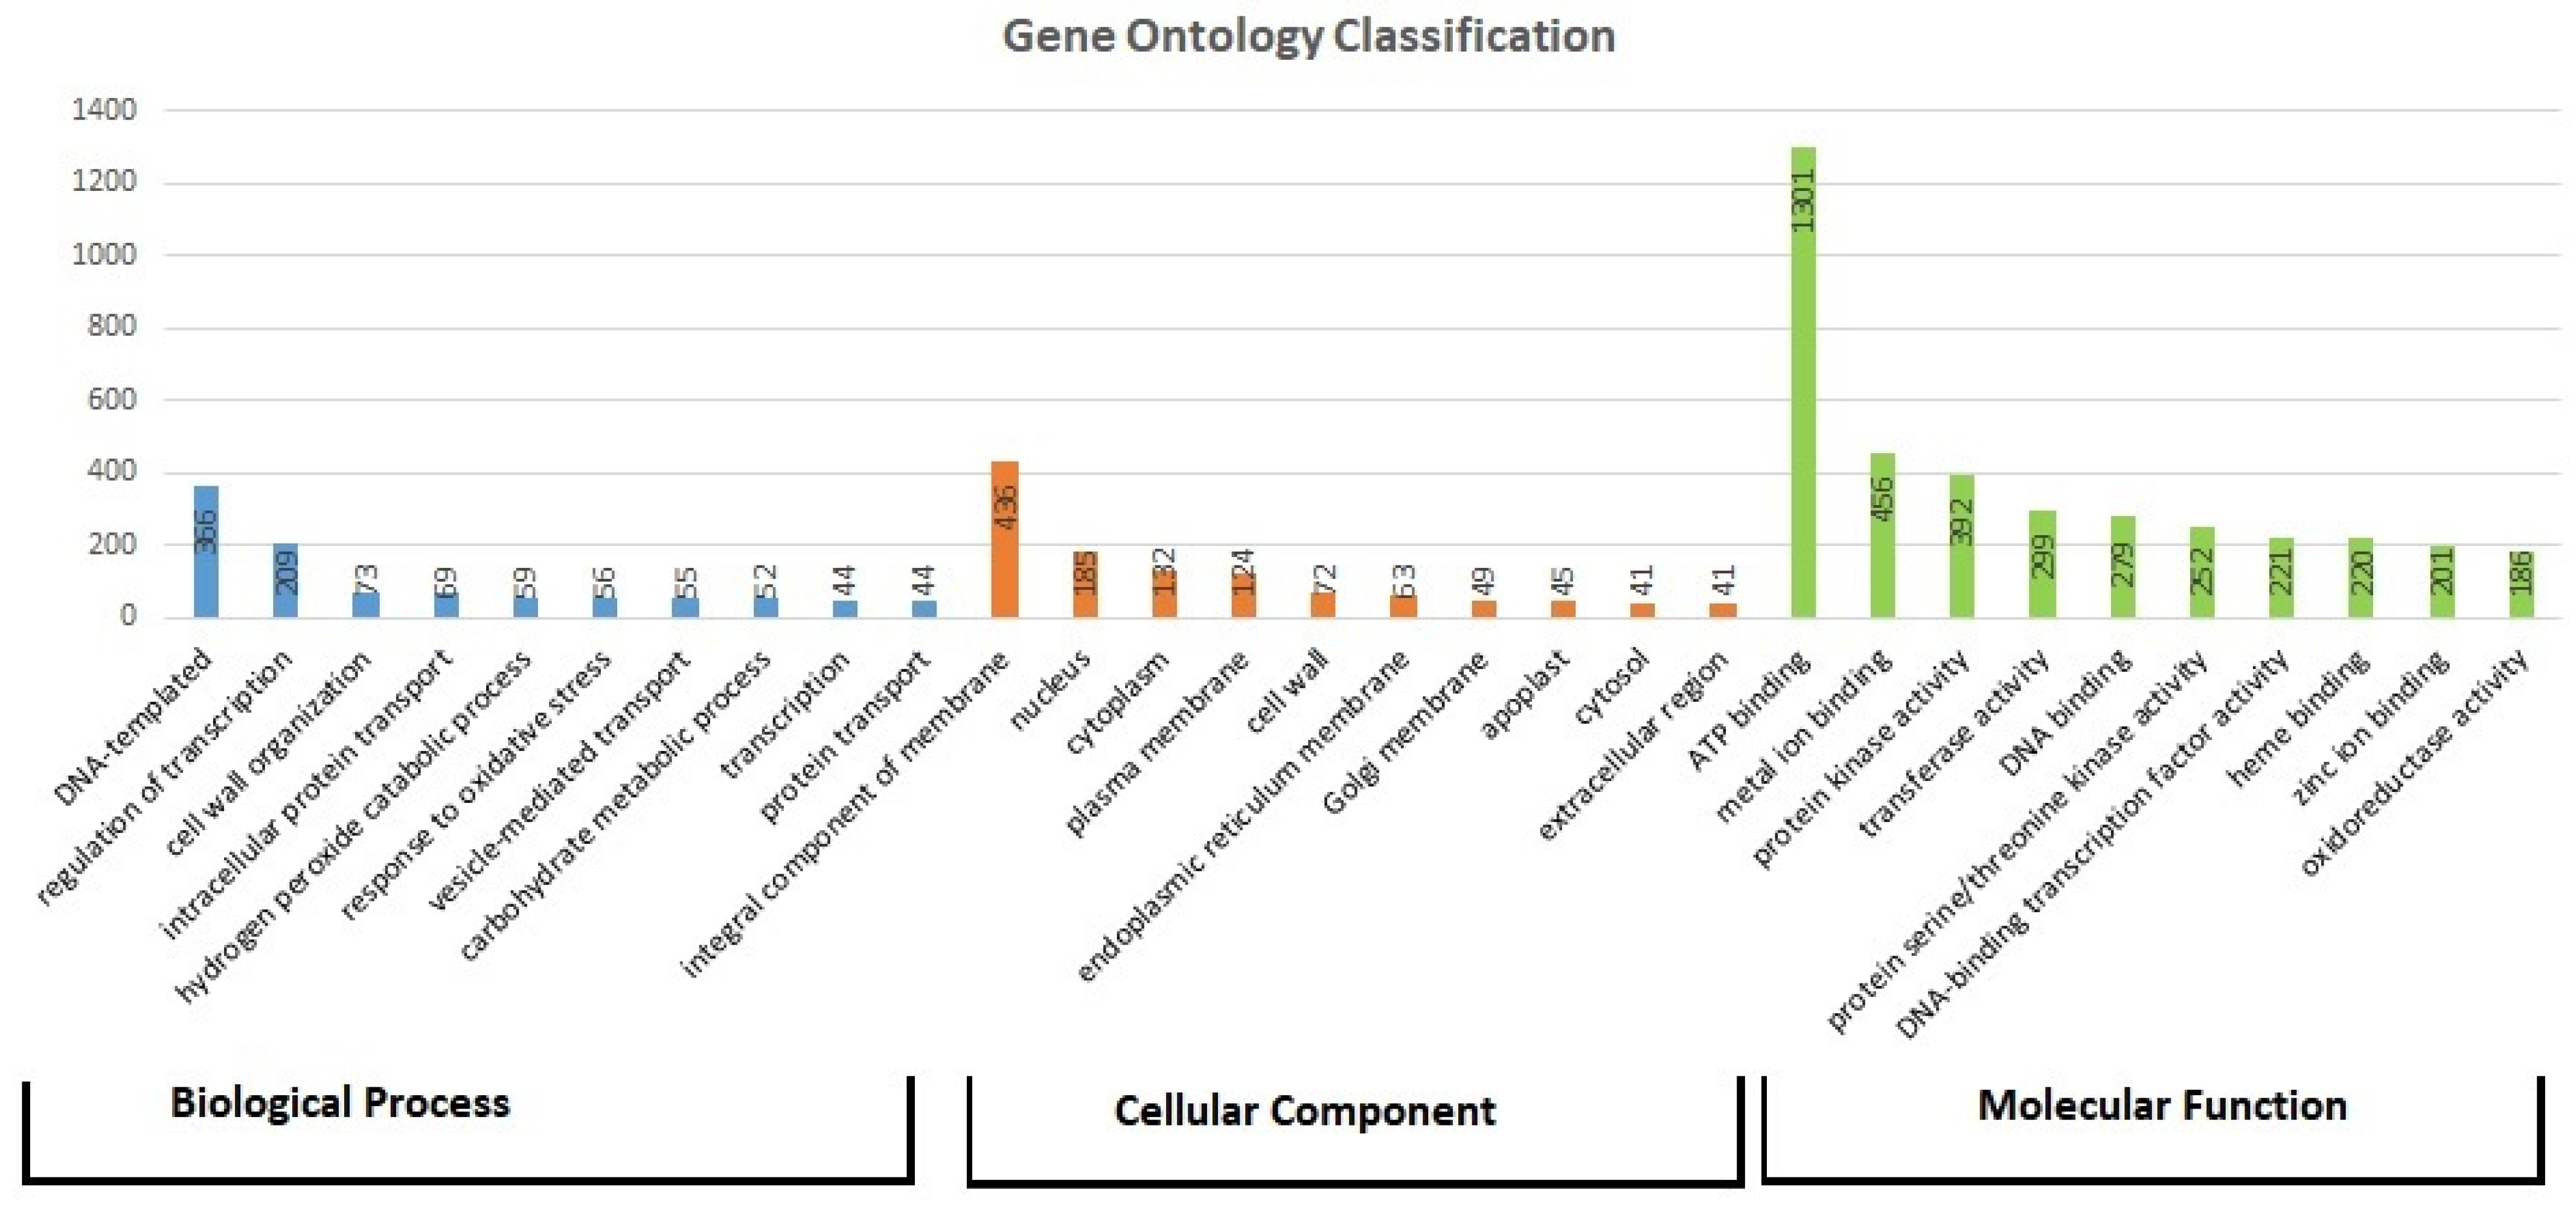
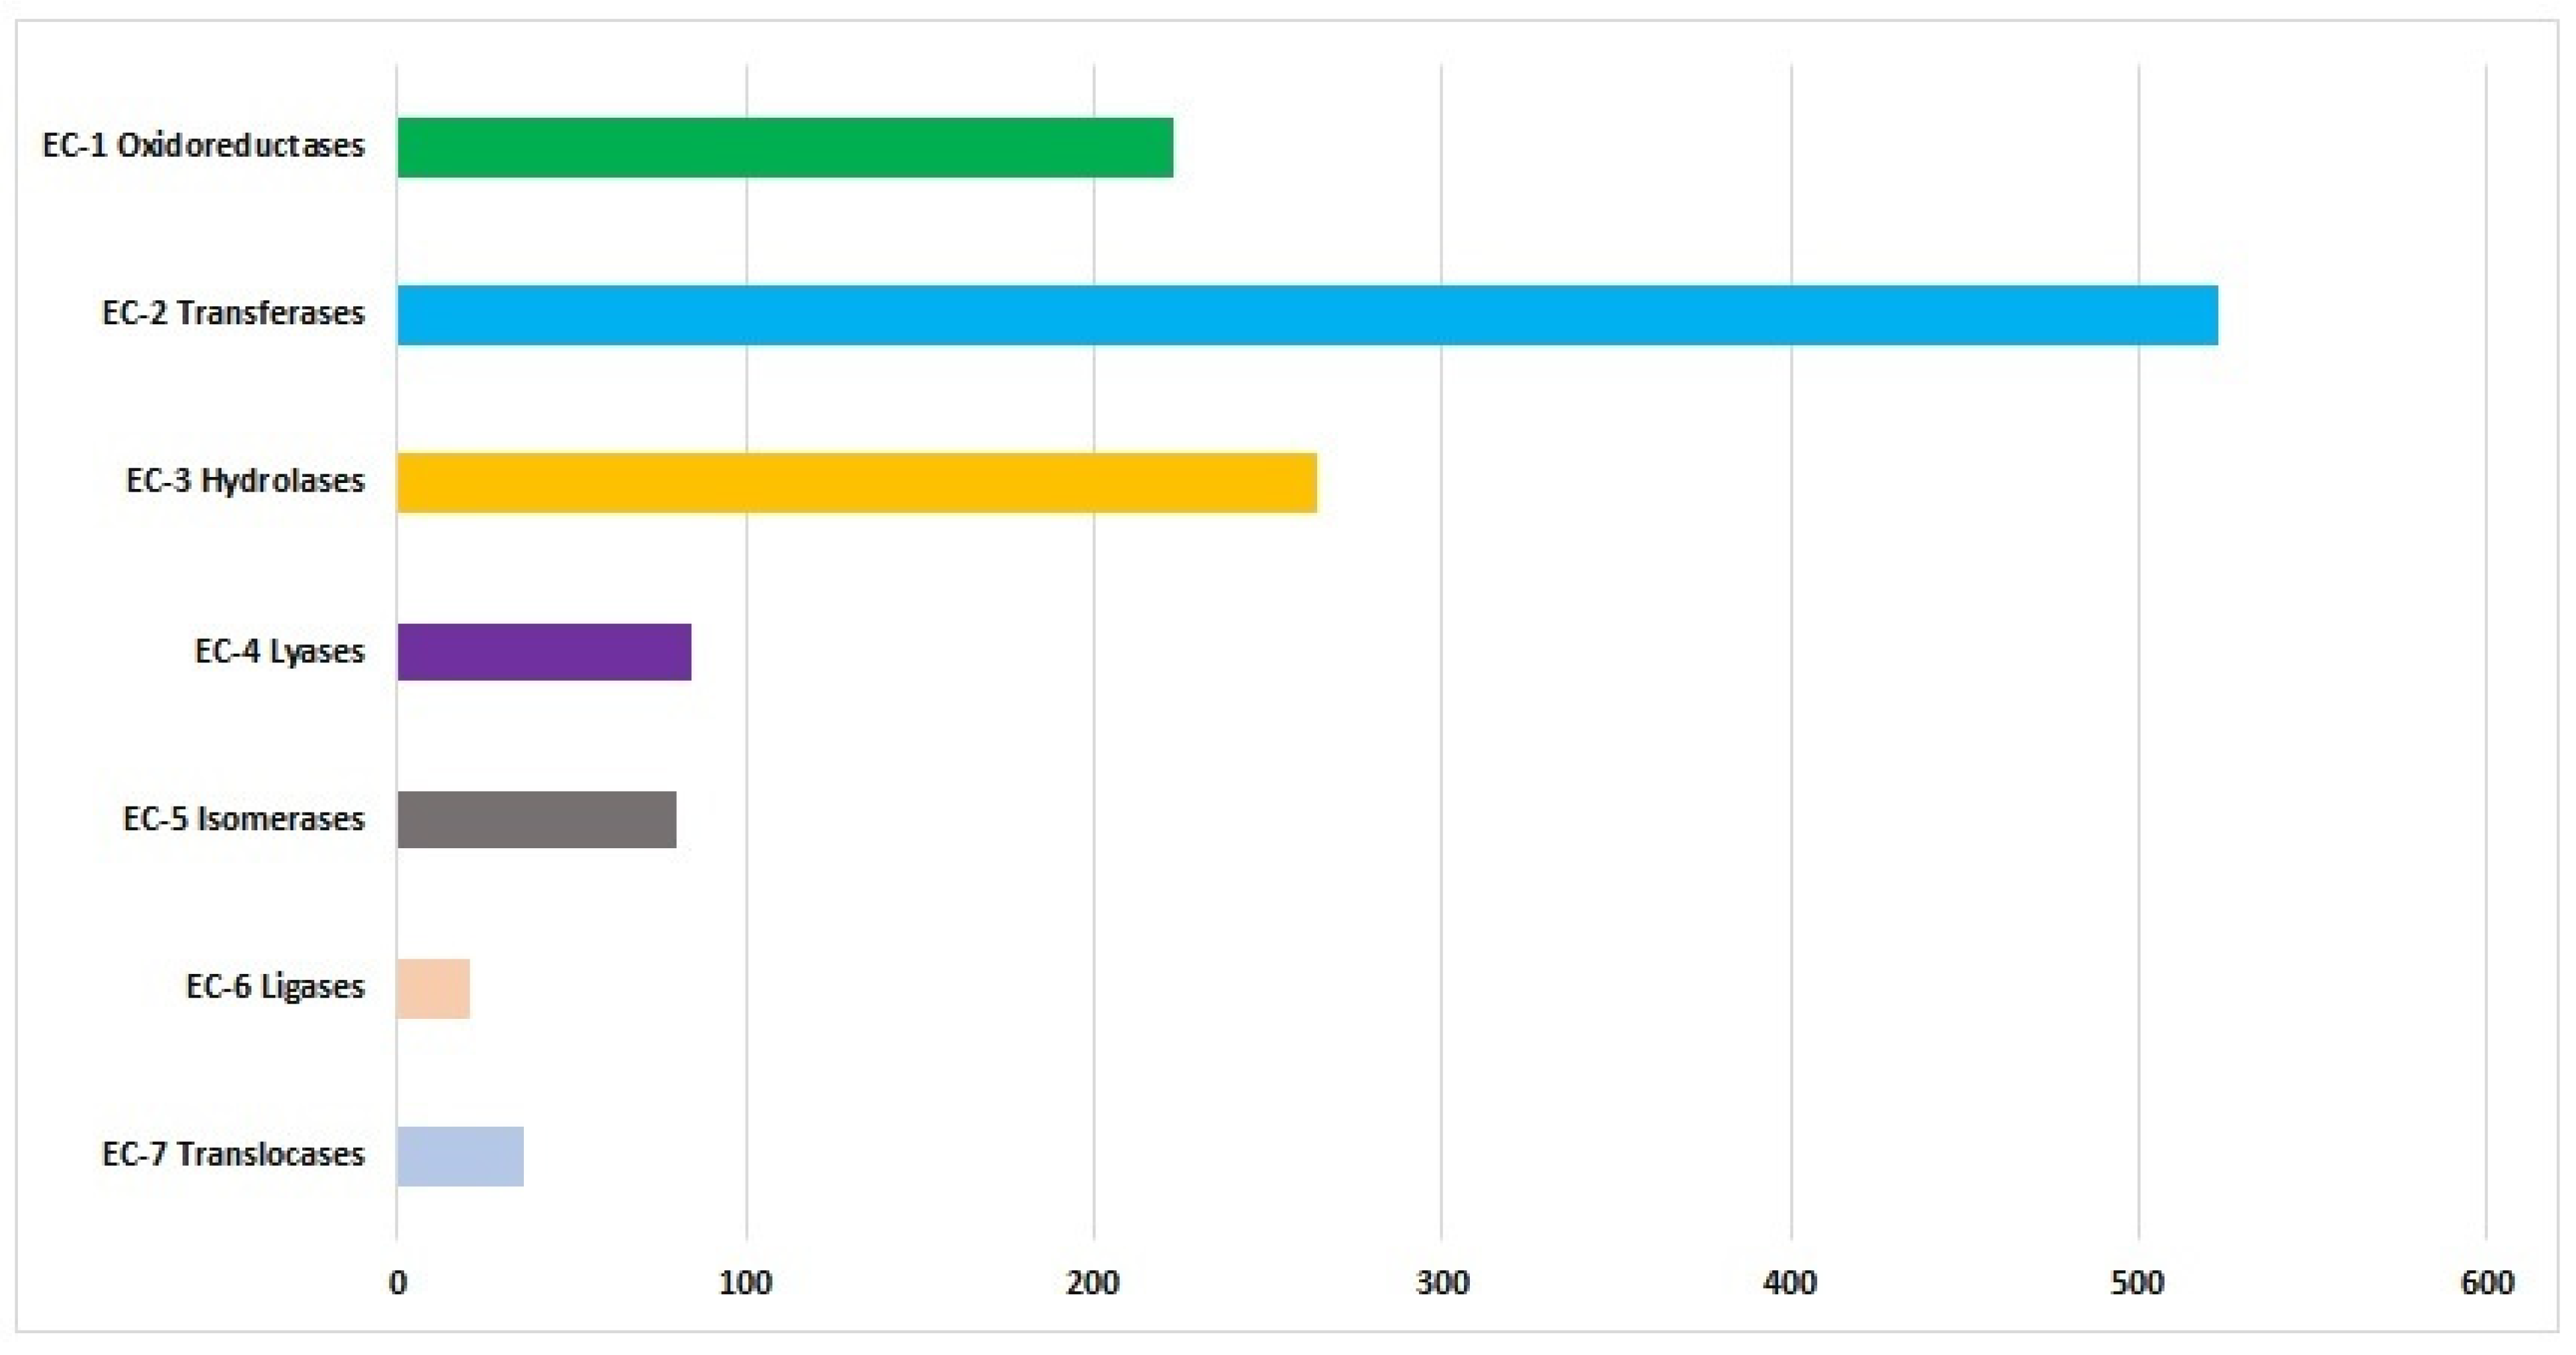
3.1.1. Functional Annotation

Firstly, the Swiss-Prot database was used to detect the highly expressed transcripts followed by the assessment of the unpaired transcripts using the ITAG2.4 database. Finally, the unpaired transcripts were estimated using the Uniref90 database. The most expressed transcripts were interpreted with Swiss-Prot, which had 94.74% significant hits, with ITAG2.4 giving 0.33% hits of the annotated transcripts and UniRef90 giving 4.93% hits of the annotated sequences (Table 2), which are comparable to those reported in other investigations on Solanaceae [51,52].
We recovered the terms of gene ontology (GO) and enzyme commission numbers (EC) using Blast2GO against the NR database for the highly expressed transcripts or unigenes in S. lycopersicum. Among all the GO terms extracted, 22.8% belong to the biological process class (BP), 14.7% to the cellular components class (CC), and 62.5% to the molecular function class (MF). Most of the genes in the GO analysis were categorized into MF of ATP binding (1301 genes), metal ion binding (456 genes), protein kinase activity (392 genes), and transferase activity (299 genes, BP of DNA-templated genes (366 genes) and regulation of transcription genes (209 genes), while CC of integral components of the membrane (436 genes) (Figure 2).
The enzyme commission (EC) number is the code for enzymes, depending on the chemical reactions they catalyze [53]. A total of 22,681 annotations were found and categorized under this scheme, including 4386 different unigenes, some containing two or more EC annotations. Transferases (EC-2) had 645 sequences, hydrolases (EC-3) had 379 sequences, oxidoreductases (EC-1) had 283 sequences, and isomerases (EC-5) had 107 sequences. These were evaluated as the highly dominant enzymes (Figure 3). Other enzyme classes, such as ligases, were less significant. The recognized annotated sequences number was close to those reported in other investigations on Solanaceae [54,55].
To recognize the function of the unigenes in tomato cultivar “super strain B”, a BLASTX search versus the KEGG protein database with a cut-off e-value of 1 × 10⁻¹⁰, % identity >= 75%, and query coverage >= 75% was achieved. Out of the 41,900 transcripts, 15,638 were interpreted in the KEGG pathway database and consigned to 125 unique pathways (Figure 4). These pathways comprise secondary metabolites biosynthesis, carbon metabolism, ribosomal activity, amino acids biosynthesis, plant hormone signal transduction, and plant–pathogen interactions. The results obtained revealed that the largest pathway groups were metabolic pathways (map01100, 315 genes), biosynthesis of secondary metabolites (map01110, 188 genes), carbon metabolism (map01200, 49 genes), ribosomal activity (ko03008, 43 genes) and biosynthesis of amino acids (map01230, 35 genes), plant hormone signal transduction (ath04075, 33 genes), protein processing in the endoplasmic reticulum (ko04141, 30 genes), spliceosome (ko03040, 30 genes), endocytosis (ko04144, 29 genes), and plant–pathogen interactions (ko04626, 25 genes). Finally, the genes in the present results were determined for every KEGG pathway and matched the comparable genes in the tomato genome database. This comparison, like others, confirmed highly analogous results and revealed a close relationship among them. These results also indicated that the work presented in this paper demonstrates a very good expression of the transcriptome. The number of genes detected in the tomato cultivar “super strain B” was less than those of tomato in other limited pathways and it is acknowledged that some processes may not be denoted in samples under study since they originated from mRNA.

3.1.2. Trait Genes

In total, three genes related to fruit shape [56], four from the anthocyanin’s pathway [57], one related to the pathway of saponins [58], two related to the chlorogenic acid pathway [59], and one related to sucrose accumulation [60] were selected (Table 3). For fruit shape, there were three genes involved, a promotor regulatory gene (Fw3), which controls fruit weight [61]; a Solanaceae transcription repressor gene (SI-IAA17) which regulates fruit size [62]; and a protein kinase gene (Wee) that is associated with the control of cell size and endoreduplication processes in developing fruits, seeds, and roots [63]. Three genes in the anthocyanins pathway were detected in our study: the anthocyanin acyltransferase gene (AAT) involved in the acylation of anthocyanins as well as other flavonoids in tomato [64], the anthocyanidin synthase gene (ANS), and the flavanone 3-hydroxylase gene (F3H) that is required for tomato leaf and fruit anthocyanins production, and overexpression improved chilling tolerance [65]. In addition, the chalcone synthase gene (CHS2) is the crucial enzyme in the biosynthesis of all classes of flavonoids in plants and is strongly upregulated in all the ripening stages [66]. In our study, there are two genes expressed in tomato cv. super strain B: the cytochrome P450 gene (C3H), which is one of the genes that potentially regulate the yellow stigma formation [67]; and the hydroxycinnamoyl-CoA shikimate/quinate hydroxycinnamoyl transferase (HCT) gene, which is one of the prime genes concerned in chlorogenic acid (CGA) biosynthesis in plants [68,69]. The glycosyltransferase gene (Egp 1-1) in tomato cv. super strain B was detected in the transcriptome analysis in this study. The overexpression of this gene showed a unique response to wounding stress in tomatoes [58] and the antisense acid invertase gene (TIV 1) in the sucrose biosynthesis pathway that increased sucrose and decreased hexose sugar concentrations, leading to fruit size decrease and increased ethylene [69].

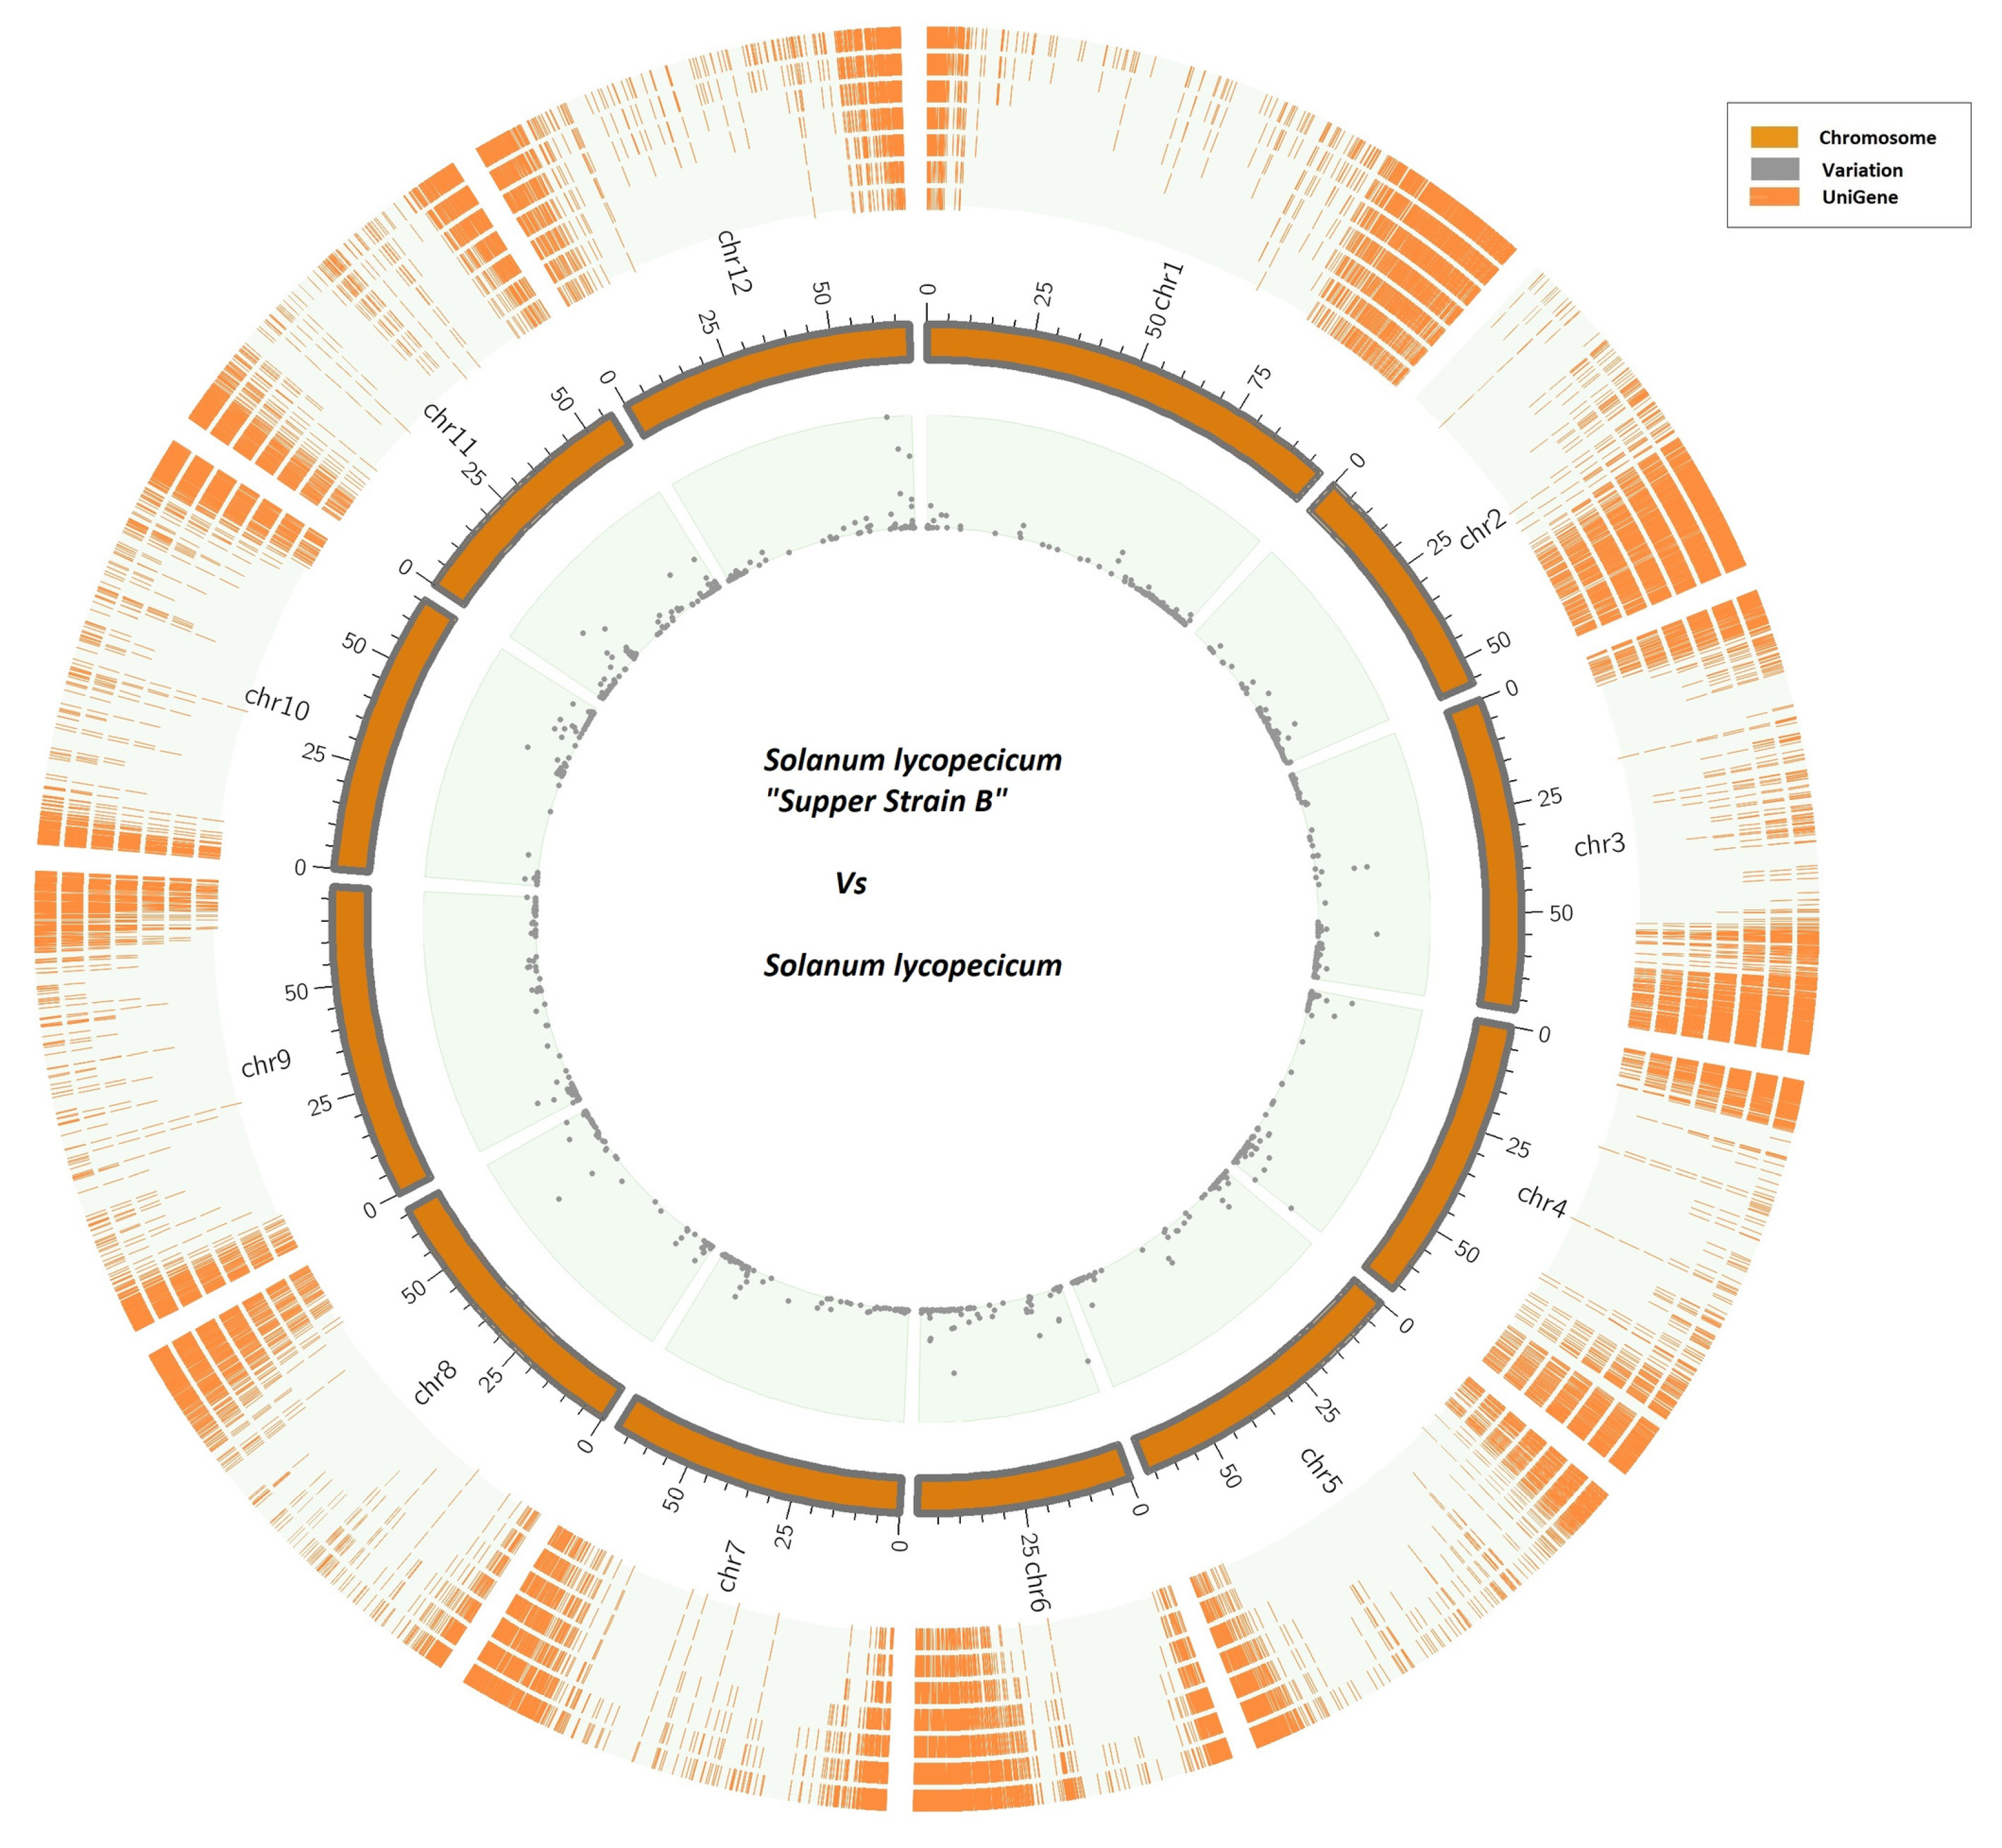
3.1.3. Matching with Tomato Genome

All the highly expressed transcripts (41,900) were blasted to the tomato genome, resulting in 36,616 (87.4%) sequences mapped. This comparison permitted us to define the assembly quality and matching of gene numbers with the tomato database. Additionally, the distribution of the super strain B unigenes relative to the tomato genome was performed by Circos software (Figure 4). This graphical illustration offers visual information on the position of the coding regions.
The total number of variants in the twelve chromosomes of tomato super strain B compared with the tomato genome was 5284 variants. The highest number of variants in the cultivar super strain B transcriptome was detected in chr 11 with 677 variants (12.8%), followed by chr 6 with 668 variants (12.6%) and chr 12 with 630 variants (11.9%). In comparison, the lowest number of variants was detected in chr 2 with 248 variants (4.7%).
Most of the highest expressed transcripts (22,682) were predicted to contain one ORF (54.1%). The current work also demonstrated the presence of introns in the unigenes which showed that 24,979 unigenes (32.9%) included 130,528 introns, with a maximum of 19 introns per unigene. SNPs and INDELs can be found by knowing where these intronic sections are [70].

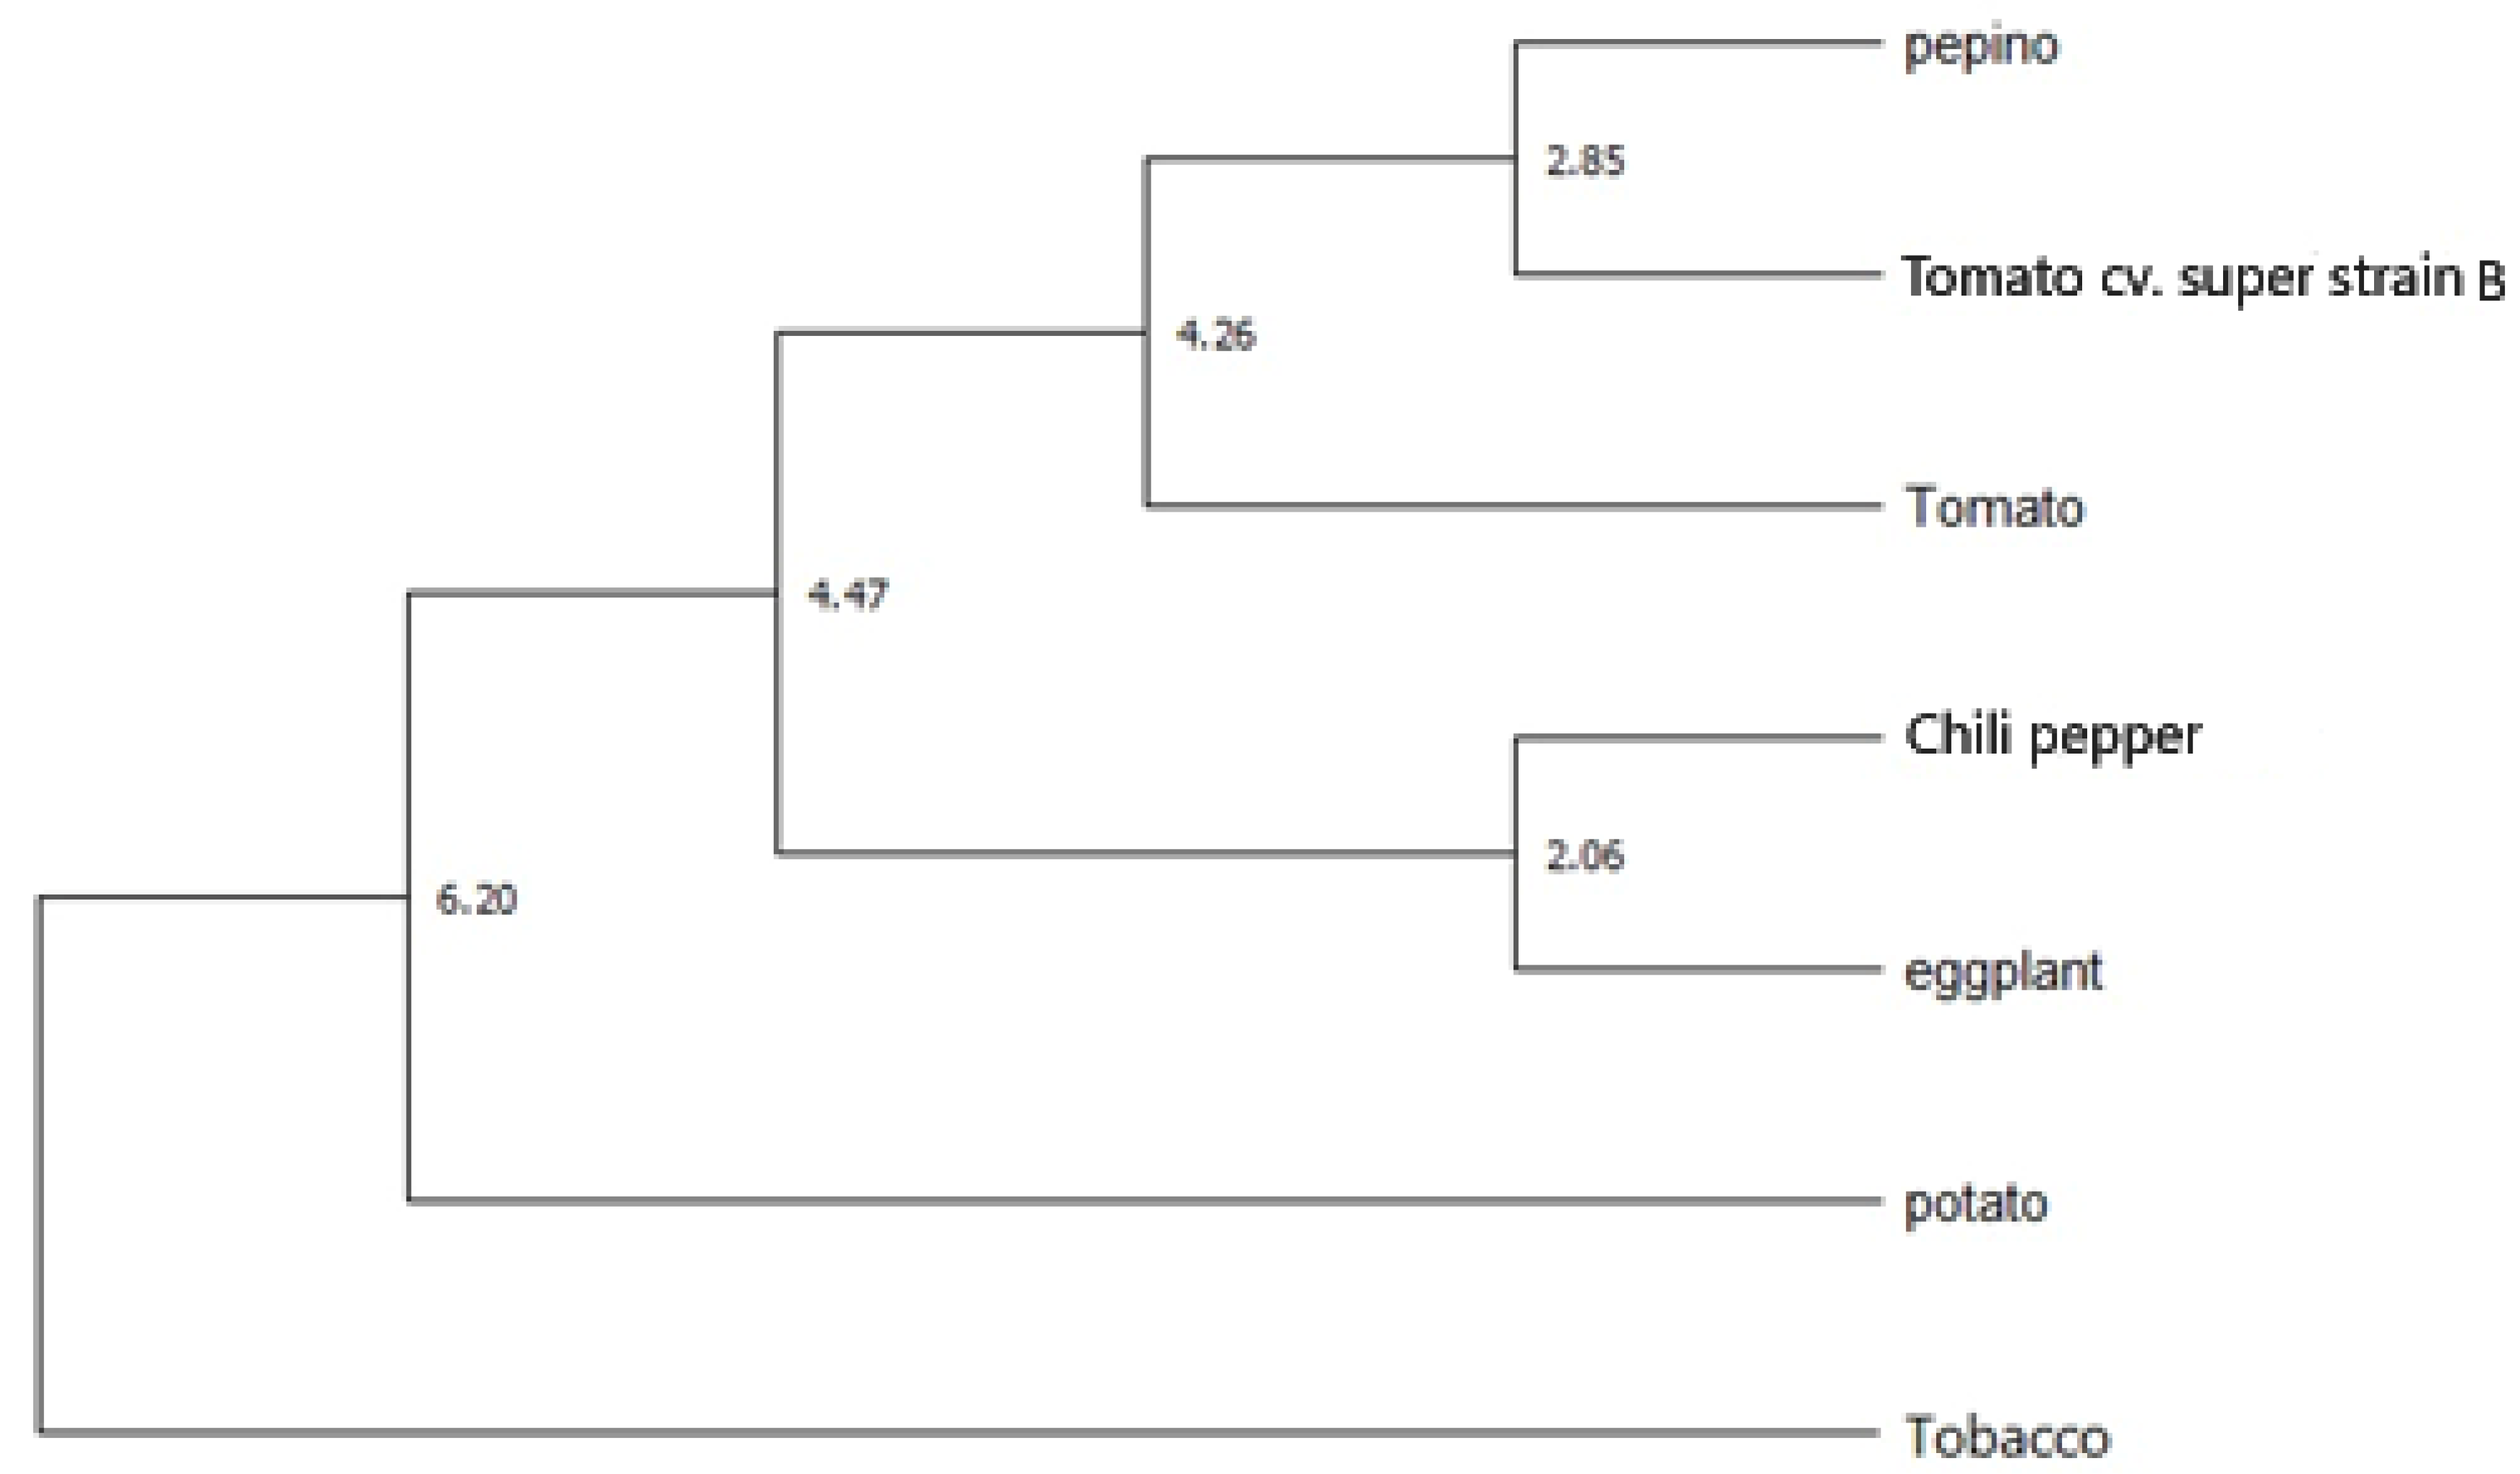
3.1.4. Molecular Phylogeny among Solanaceae Species

The appraised variant time of tomato–potato in our study was (3.56–7.93 Mya), which supports that reported previously (5.1–7.3 Mya) [71]. It was employed for time calibration and fixed at the intermediary value of 5.75 Mya. The tree created (Figure 5) showed that the pepino, super strain “B”, and tomato relatives all diverged around 4.26 Mya. Other variations were found between 5.34 Mya and the eggplant.

3.1.5. SSR and Nucleotide-Level Variants Discovery

The present investigation conducted a general screening of the transcriptome of S. lycopersicum cv. super strain B for the existence of single-sequence repeats (SSRs). The analysis was focused on di-, tri-, and tetra-nucleotide repeats. The total number of potential SSRs was 5047 in 4806 unigenes; around 1.05 of the transcripts comprise at least one SSR (Table 4). The maximum and minimum lengths of the SSRs were 48 and 17, respectively, with an average length of 21 nucleotides. Trinucleotide repeats (3006) were the dominant repetitions in our transcriptome, recording about 59.5% of the SSRs identified, followed by di-nucleotide repeats (1941), estimating about 38.5%, and tetranucleotide repeats (100), accounting for about 2%. The most common motif was AT (509), constituting 10.09% of the di-nucleotide SSRs; followed by TA (418) representing 8.28%, AG (230) representing 4.56%, and GAA (190) representing 3.76% of the trinucleotide, while AAAT represented 12% and TTAA represented 9% of the tetranucleotide SSRs.
There are many characteristics related to SSR sequences, from which their accumulation has been linked with the divergence in genome size [72]. They present ubiquitously in the genome [73], they are greatly variable and polymorphic [74], and they can represent both coding and non-coding sequences [75]. SSRs are linked with the recombination hotspots and random integration [76].
The high-throughput sequencing of the tomato cv. super strain B transcriptome made it possible to recognize many SNP and INDEL collections (Table 5). A total of 4541 SNPs and 744 INDELs in tomato cv. super strain B were identified when compared with the tomato genome. The high and stable-yielding landrace E42 had high polymorphism, with about 49% and 47% private SNPs and InDels, respectively [77]. A combination of linkage mapping in two F2 populations and physical mapping with emerging genome sequence data was applied to position 434 PCR-based markers comprising SNPs [78].
The SNPs were identified as transitions and transversions where the A<->G SNPs were 1315 (28.9%) and C<->T SNPs were 1404 (30.1%). The highest rate of transversion SNPs was A<->T (586, 12.9%), followed by A<->C (489, 10.8%), while the lowest rate was G<->C (319, 7.0%) when compared with the tomato genome (Table 6). Transitions are less common in amino acid substitutions and consequently persist as silent substitutions [79].

4. Conclusions

From the transcriptomic profile of tomato cv. super strain B, it can be concluded that there were 5047 potential SSRs in 4806 unigenes; that is, around 1.05 of the transcripts comprised at least one SSR and the total number of variants in the twelve chromosomes of tomato super strain B compared with the tomato genome was 5284 variants. The transcriptome of cultivar super strain B slightly varied from the reference tomato gnome, with 4541 SNPs and 744 INDELs. These findings open the door to discovering genes expressed under stresses, whether upregulated or downregulated, and studying the mechanisms and their roles. Moreover, Transcriptomics studies on many plant species can help scientists better understand functional genes and regulatory processes to enhance breeding choices and cultivation techniques.

Supplementary Materials

The following supporting information can be downloaded at: https://www.mdpi.com/article/10.3390/agronomy13092360/s1, File S1: Basic statistics and data quality of the of the raw data in the cv. super strain B transcriptome under drought stress (fastq 1); File S2: Basic statistics and data quality of the raw data in the cv. super strain B transcriptome under drought stress (fastq 2); File S3: Basic statistics and data quality of the of the trimmed data in the cv. super strain B transcriptome under drought stress (fastq 1); File S4: Basic statistics and data quality of the of the trimmed data in the cv. super strain B transcriptome under drought stress (fastq 2); Table S1: Transcriptome assembly. After assembly in the first group (transcripts) and after filtering by level of expression (most expressed transcripts).

Author Contributions

Conceptualization, H.S.A.-Z., T.A.A.M. and M.P.F.; methodology, T.A.A.M. and R.M.H.; validation, T.A.A.M., H.A. and R.M.H.; formal analysis, H.S.A.-Z., T.A.A.M., H.A., R.M.H. and M.P.F.; data curation, T.A.A.M. and R.M.H.; writing—original draft preparation, H.A. and R.M.H.; writing—review and editing, H.S.A.-Z., T.A.A.M. and M.P.F.; funding acquisition, H.S.A.-Z., T.A.A.M. and H.A. All authors have read and agreed to the published version of the manuscript.

Funding

This project was funded by the Deanship of Scientific Research (DSR) at King Abdulaziz University, Jeddah, under grant no. (RG-26-130-39). The authors, therefore, acknowledge with thanks DSR technical and financial support.

Data Availability Statement

The paper and its published Supplementary Materials contain all the data necessary to support the study’s conclusions. Data of this study are available and deposited at NCBI under number PRJNA752657 and SRA records are accessible with the following link: https://www.ncbi.nlm.nih.gov/sra/PRJNA752657, accessed on 13 March 2023.

Conflicts of Interest

The authors declare no conflict of interest.

References

  1. Ercolano, M.R.; Sanseverino, W.; Carli, P.; Ferriello, F.; Frusciante, L. Genetic and Genomic Approaches for R-Gene Mediated Disease Resistance in Tomato: Retrospects and Prospects. Plant Cell Rep. 2012, 31, 973–985. [Google Scholar] [CrossRef] [PubMed]
  2. Sun, W.-H.; Liu, X.-Y.; Wang, Y.; Hua, Q.; Song, X.-M.; Gu, Z.; Pu, D.-Z. Effect of Water Stress on Yield and Nutrition Quality of Tomato Plant Overexpressing StAPX. Biol. Plant. 2014, 58, 99–104. [Google Scholar] [CrossRef]
  3. Boureau, L.; How-Kit, A.; Teyssier, E.; Drevensek, S.; Rainieri, M.; Joubès, J.; Stammitti, L.; Pribat, A.; Bowler, C.; Hong, Y. A CURLY LEAF Homologue Controls Both Vegetative and Reproductive Development of Tomato Plants. Plant Mol. Biol. 2016, 90, 485–501. [Google Scholar] [CrossRef] [PubMed]
  4. Olmstead, R.G.; Bohs, L. A Summary of Molecular Systematic Research in Solanaceae: 1982–2006. In Proceedings of the VI International Solanaceae Conference: Genomics Meets Biodiversity 745, Madison, WI, USA, 23–27 July 2006; pp. 255–268. [Google Scholar]
  5. Olmstead, R.G.; Bohs, L.; Migid, H.A.; Santiago-Valentin, E.; Garcia, V.F.; Collier, S.M. A Molecular Phylogeny of the Solanaceae. Taxon 2008, 57, 1159–1181. [Google Scholar] [CrossRef]
  6. Clarkson, J.J.; Knapp, S.; Garcia, V.F.; Olmstead, R.G.; Leitch, A.R.; Chase, M.W. Phylogenetic Relationships in Nicotiana (Solanaceae) Inferred from Multiple Plastid DNA Regions. Mol. Phylogenet. Evol. 2004, 33, 75–90. [Google Scholar] [CrossRef]
  7. Yuan, Y.; Zhang, Z.Y.; Olmstead, R.G. A Retroposon Insertion to the Waxy Gene: Defining Monophyly of the Tribe Hyoscyameae (Solanaceae) and Revealing the Allopolyploid Origin of Atropa Belladonna. Mol. Biol. Evol 2006, 23, 2263–2267. [Google Scholar] [CrossRef]
  8. Levin, R.A.; Bernardello, G.; Whiting, C.; Miller, J.S. A New Generic Circumscription in Tribe Lycieae (Solanaceae). Taxon 2011, 60, 681–690. [Google Scholar] [CrossRef]
  9. Filipowicz, N.; Renner, S.S. Brunfelsia (Solanaceae): A Genus Evenly Divided between South America and Radiations on Cuba and Other Antillean Islands. Mol. Phylogenet. Evol. 2012, 64, 1–11. [Google Scholar] [CrossRef]
  10. Fregonezi, J.N.; Turchetto, C.; Bonatto, S.L.; Freitas, L.B. Biogeographical History and Diversification of Petunia and Calibrachoa (Solanaceae) in the Neotropical Pampas Grassland. Bot. J. Linn. Soc. 2013, 171, 140–153. [Google Scholar] [CrossRef]
  11. Fregonezi, J.N.; de Freitas, L.B.; Bonatto, S.L.; Semir, J.; Stehmann, J.R. Infrageneric Classification of Calibrachoa (Solanaceae) Based on Morphological and Molecular Evidence. Taxon 2012, 61, 120–130. [Google Scholar] [CrossRef]
  12. Poczai, P.; Hyvönen, J.; Symon, D.E. Phylogeny of Kangaroo Apples (Solanum Subg. Archaesolanum, Solanaceae). Mol. Biol. Rep. 2011, 38, 5243–5259. [Google Scholar] [CrossRef] [PubMed]
  13. Tepe, E.J.; Farruggia, F.T.; Bohs, L. A 10-gene Phylogeny of Solanum Section Herpystichum (Solanaceae) and a Comparison of Phylogenetic Methods. Am. J. Bot. 2011, 98, 1356–1365. [Google Scholar] [CrossRef] [PubMed]
  14. Stern, S.; Bohs, L. An Explosive Innovation: Phylogenetic Relationships of Solanum Section Gonatotrichum (Solanaceae). PhytoKeys 2012, 8, 89–98. [Google Scholar] [CrossRef] [PubMed]
  15. Bohs, L.; Olmstead, R.G. A Reassessment of Normania and Triguera (Solanaceae). Plant Syst. Evol. 2001, 228, 33–48. [Google Scholar] [CrossRef]
  16. Bohs, L. Phylogeny of the Cyphomandra Clade of the Genus Solanum (Solanaceae) Based on ITS Sequence Data. Taxon 2007, 56, 1012–1026. [Google Scholar] [CrossRef]
  17. Bloom, A.J.; Zwieniecki, M.A.; Passioura, J.B.; Randall, L.B.; Holbrook, N.M.; St. Clair, D.A. Water Relations under Root Chilling in a Sensitive and Tolerant Tomato Species. Plant. Cell Environ. 2004, 27, 971–979. [Google Scholar] [CrossRef]
  18. Ahmad, N.; Jianyu, L.; Xu, T.; Noman, M.; Jameel, A.; Na, Y.; Yuanyuan, D.; Nan, W.; Xiaowei, L.; Fawei, W.; et al. Overexpression of a novel Cytochrome P450 Promotes Flavonoid Biosynthesis and Osmotic Stress Tolerance in Transgenic Arabidopsis. Genes 2019, 10, 756. [Google Scholar] [CrossRef]
  19. Hong, Y.; Ahmad, N.; Zhang, J.; Lv, Y.; Zhang, X.; Ma, X.; Xiuming, L.; Na, Y. Genome-wide Analysis and Transcriptional Reprogramming of MYB Superfamily Revealed Positive Insights into Abiotic Stress Responses and Anthocyanin Accumulation in Carthamus tinctorius L. Mol. Genet. Genom. 2022, 297, 125–145. [Google Scholar] [CrossRef]
  20. Noman, M.; Jameel, A.; Qiang, W.-D.; Ahmad, N.; Liu, W.-C.; Wang, F.-W.; Li, H.-Y. Overexpression of GmCAMTA12 Enhanced Drought Tolerance in Arabidopsis and Soybean. Int. J. Mol. Sci. 2019, 20, 4849. [Google Scholar] [CrossRef]
  21. Trapnell, C.; Roberts, A.; Goff, L.; Pertea, G.; Kim, D.; Kelley, D.R.; Pimentel, H.; Salzberg, S.L.; Rinn, J.L.; Pachter, L. Differential Gene and Transcript Expression Analysis of RNA-Seq Experiments with TopHat and Cufflinks. Nat. Protoc. 2012, 7, 562–578. [Google Scholar] [CrossRef]
  22. Rensink, W.A.; Lee, Y.; Liu, J.; Iobst, S.; Ouyang, S.; Buell, C.R. Comparative analyses of six solanaceous transcriptomes reveal a high degree of sequence conservation and species-specific transcripts. BMC Genom. 2005, 6, 124. [Google Scholar] [CrossRef] [PubMed]
  23. Li, D.; Zeng, R.; Li, Y.; Zhao, M.; Chao, J.; Li, Y.; Wang, K.; Zhu, L.; Tian, W.-M.; Liang, C. Gene Expression Analysis and SNP/InDel Discovery to Investigate Yield Heterosis of Two Rubber Tree F1 Hybrids. Sci. Rep. 2016, 6, 24984. [Google Scholar] [CrossRef]
  24. Lin, T.; Zhu, G.; Zhang, J.; Xu, X.; Yu, Q.; Zheng, Z.; Zhang, Z.; Lun, Y.; Li, S.; Wang, X. Genomic Analyses Provide Insights into the History of Tomato Breeding. Nat. Genet. 2014, 46, 1220–1226. [Google Scholar] [CrossRef] [PubMed]
  25. Sato, S.; Tabata, S. Tomato Genome Sequence. In Functional Genomics and Biotechnology in Solanaceae and Cucurbitaceae Crops; Springer: Berlin/Heidelberg, Germany, 2016; pp. 1–13. [Google Scholar]
  26. Jung, Y.J.; Nou, I.S.; Cho, Y.G.; Kim, M.K.; Kim, H.-T.; Kang, K.K. Identification of an SNP Variation of Elite Tomato (Solanum lycopersicum L.) Lines Using Genome Resequencing Analysis. Hortic. Environ. Biotechnol. 2016, 57, 173–181. [Google Scholar] [CrossRef]
  27. Kim, B.; Hwang, I.S.; Lee, H.-J.; Oh, C.-S. Combination of Newly Developed SNP and InDel Markers for Genotyping the Cf-9 Locus Conferring Disease Resistance to Leaf Mold Disease in the Tomato. Mol. Breed. 2017, 37, 59. [Google Scholar] [CrossRef]
  28. Gupta, P.; Dholaniya, P.S.; Devulapalli, S.; Tawari, N.R.; Sreelakshmi, Y.; Sharma, R. Reanalysis of Genome Sequences of Tomato Accessions and Its Wild Relatives: Development of Tomato Genomic Variation (TGV) Database Integrating SNPs and INDELs Polymorphisms. Bioinformatics 2020, 36, 4984–4990. [Google Scholar] [CrossRef] [PubMed]
  29. Francesca, S.; Vitale, L.; Arena, C.; Raimondi, G.; Olivieri, F.; Cirillo, V.; Paradiso, A.; de Pinto, M.C.; Maggio, A.; Barone, A. The Efficient Physiological Strategy of a Novel Tomato Genotype to Adapt to Chronic Combined Water and Heat Stress. Plant Biol. 2022, 24, 62–74. [Google Scholar] [CrossRef]
  30. Meher; Shivakrishna, P.; Ashok Reddy, K.; Manohar Rao, D. Effect of PEG-6000 Imposed Drought Stress on RNA Content, Relative Water Content (RWC), and Chlorophyll Content in Peanut Leaves and Roots. Saudi J. Biol. Sci. 2018, 25, 285–289. [Google Scholar] [CrossRef]
  31. Haas, B.J.; Papanicolaou, A.; Yassour, M.; Grabherr, M.; Blood, P.D.; Bowden, J.; Couger, M.B.; Eccles, D.; Li, B.; Lieber, M. De Novo Transcript Sequence Reconstruction from RNA-Seq Using the Trinity Platform for Reference Generation and Analysis. Nat. Protoc. 2013, 8, 1494–1512. [Google Scholar] [CrossRef]
  32. Li, Y.; Korol, A.B.; Fahima, T.; Beiles, A.; Nevo, E. Microsatellites: Genomic Distribution, Putative Functions and Mutational Mechanisms: A Review. Mol. Ecol. 2002, 11, 2453–2465. [Google Scholar] [CrossRef]
  33. Li, B.; Dewey, C.N. RSEM: Accurate Transcript Quantification from RNA-Seq Data with or without a Reference Genome. BMC Bioinform. 2011, 12, 323. [Google Scholar] [CrossRef] [PubMed]
  34. Blanca, J.M.; Pascual, L.; Ziarsolo, P.; Nuez, F.; Cañizares, J. Ngs_backbone: A Pipeline for Read Cleaning, Mapping and SNP Calling Using Next Generation Sequence. BMC Genom. 2011, 12, 285. [Google Scholar] [CrossRef] [PubMed]
  35. Altschul, S.F.; Madden, T.L.; Schäffer, A.A.; Zhang, J.; Zhang, Z.; Miller, W.; Lipman, D.J. Gapped BLAST and PSI-BLAST: A New Generation of Protein Database Search Programs. Nucleic Acids Res. 1997, 25, 3389–3402. [Google Scholar] [CrossRef]
  36. Bairoch, A.; Apweiler, R. The SWISS-PROT Protein Sequence Database and Its Supplement TrEMBL in 2000. Nucleic Acids Res. 2000, 28, 45–48. [Google Scholar] [CrossRef] [PubMed]
  37. Fernandez-Pozo, N.; Menda, N.; Edwards, J.D.; Saha, S.; Tecle, I.Y.; Strickler, S.R.; Bombarely, A.; Fisher-York, T.; Pujar, A.; Foerster, H. The Sol Genomics Network (SGN)—From Genotype to Phenotype to Breeding. Nucleic Acids Res. 2015, 43, D1036–D1041. [Google Scholar] [CrossRef]
  38. Conesa, A.; Götz, S. Blast2GO: A Comprehensive Suite for Functional Analysis in Plant Genomics. Int. J. Plant Genom. 2008, 2008, 619832. [Google Scholar] [CrossRef]
  39. Mott, R. EST_GENOME: A Program to Align Spliced DNA Sequences to Unspliced Genomic DNA. Bioinformatics 1997, 13, 477–478. [Google Scholar] [CrossRef]
  40. Iseli, C.; Jongeneel, C.V.; Bucher, P. ESTScan: A Program for Detecting, Evaluating, and Reconstructing Potential Coding Regions in EST Sequences. In Proceedings of the International Conference on Intelligent Systems for Molecular Biology ISMB, Heidelberg, Germany, 6–10 August 1999; Volume 99, pp. 138–148. [Google Scholar]
  41. Krzywinski, M.; Schein, J.; Birol, I.; Connors, J.; Gascoyne, R.; Horsman, D.; Jones, S.J.; Marra, M.A. Circos: An Information Aesthetic for Comparative Genomics. Genome Res. 2009, 19, 1639–1645. [Google Scholar] [CrossRef]
  42. Särkinen, T.; Bohs, L.; Olmstead, R.G.; Knapp, S. A Phylogenetic Framework for Evolutionary Study of the Nightshades (Solanaceae): A Dated 1000-Tip Tree. BMC Evol. Biol. 2013, 13, 214. [Google Scholar] [CrossRef]
  43. Peralta, I.E.; Spooner, D.M. Granule-Bound Starch Synthase (GBSSI) Gene Phylogeny of Wild Tomatoes (Solanum L. Section Lycopersicon [Mill.] Wettst. Subsection Lycopersicon). Am. J. Bot. 2001, 88, 1888–1902. [Google Scholar] [CrossRef]
  44. Martins, T.R.; Barkman, T.J. Reconstruction of Solanaceae Phylogeny Using the Nuclear Gene SAMT. Syst. Bot. 2005, 30, 435–447. [Google Scholar] [CrossRef]
  45. Tamura, K.; Stecher, G.; Peterson, D.; Filipski, A.; Kumar, S. MEGA6: Molecular Evolutionary Genetics Analysis Version 6.0. Mol. Biol. Evol. 2013, 30, 2725–2729. [Google Scholar] [CrossRef] [PubMed]
  46. Aoki, K.; Yano, K.; Suzuki, A.; Kawamura, S.; Sakurai, N.; Suda, K.; Kurabayashi, A.; Suzuki, T.; Tsugane, T.; Watanabe, M.; et al. Large-Scale Analysis of Full-Length CDNAs from the Tomato (Solanum lycopersicum) Cultivar Micro-Tom, a Reference System for the Solanaceae Genomics. BMC Genom. 2010, 11, 210. [Google Scholar] [CrossRef] [PubMed]
  47. Yamada, K.; Lim, J.; Dale, J.M.; Chen, H.; Shinn, P.; Palm, C.J.; Southwick, A.M.; Wu, H.C.; Kim, C.; Nguyen, M. Empirical Analysis of Transcriptional Activity in the Arabidopsis Genome. Science 2003, 302, 842–846. [Google Scholar] [CrossRef] [PubMed]
  48. Umezawa, T.; Sakurai, T.; Totoki, Y.; Toyoda, A.; Seki, M.; Ishiwata, A.; Akiyama, K.; Kurotani, A.; Yoshida, T.; Mochida, K. Sequencing and Analysis of Approximately 40 000 Soybean CDNA Clones from a Full-Length-Enriched CDNA Library. DNA Res. 2008, 15, 333–346. [Google Scholar] [CrossRef]
  49. Alexandrov, N.N.; Troukhan, M.E.; Brover, V.V.; Tatarinova, T.; Flavell, R.B.; Feldmann, K.A. Features of Arabidopsis Genes and Genome Discovered Using Full-Length CDNAs. Plant Mol. Biol. 2006, 60, 69–85. [Google Scholar] [CrossRef]
  50. Ralph, S.G.; Chun, H.J.E.; Cooper, D.; Kirkpatrick, R.; Kolosova, N.; Gunter, L.; Tuskan, G.A.; Douglas, C.J.; Holt, R.A.; Jones, S.J.M. Analysis of 4,664 High-Quality Sequence-Finished Poplar Full-Length CDNA Clones and Their Utility for the Discovery of Genes Responding to Insect Feeding. BMC Genom. 2008, 9, 57. [Google Scholar] [CrossRef]
  51. Herraiz, F.J.; Blanca, J.; Ziarsolo, P.; Gramazio, P.; Plazas, M.; Anderson, G.J.; Prohens, J.; Vilanova, S. The First de Novo Transcriptome of Pepino (Solanum muricatum): Assembly, Comprehensive Analysis and Comparison with the Closely Related Species S. Caripense, Potato and Tomato. BMC Genom. 2016, 17, 321. [Google Scholar] [CrossRef]
  52. Wei, D.-D.; Chen, E.-H.; Ding, T.-B.; Chen, S.-C.; Dou, W.; Wang, J.-J. De Novo Assembly, Gene Annotation, and Marker Discovery in Stored-Product Pest Liposcelis entomophila (Enderlein) Using Transcriptome Sequences. PLoS ONE 2013, 8, e80046. [Google Scholar] [CrossRef]
  53. Tipton, K.; Boyce, S. Nomenclature Committee of the International Union of Biochemistry and Molecular Biology (NC-IUBMB), Enzyme Supplement 5 (1999). Eur. J. Biochem 1999, 264, 610–650. [Google Scholar]
  54. Garzón-Martínez, G.A.; Zhu, Z.I.; Landsman, D.; Barrero, L.S.; Mariño-Ramírez, L. The Physalis peruviana Leaf Transcriptome: Assembly, Annotation and Gene Model Prediction. BMC Genom. 2012, 13, 151. [Google Scholar] [CrossRef] [PubMed]
  55. Sierro, N.; Battey, J.N.D.; Ouadi, S.; Bovet, L.; Goepfert, S.; Bakaher, N.; Peitsch, M.C.; Ivanov, N.V. Reference Genomes and Transcriptomes of Nicotiana Sylvestris and Nicotiana Tomentosiformis. Genome Biol. 2013, 14, R60. [Google Scholar] [CrossRef] [PubMed]
  56. Wang, L.; Li, J.; Zhao, J.; He, C. Evolutionary Developmental Genetics of Fruit Morphological Variation within the Solanaceae. Front. Plant Sci. 2015, 6, 248. [Google Scholar] [CrossRef] [PubMed]
  57. Zhang, Y.; Hu, Z.; Chu, G.; Huang, C.; Tian, S.; Zhao, Z.; Chen, G. Anthocyanin Accumulation and Molecular Analysis of Anthocyanin Biosynthesis-Associated Genes in Eggplant (Solanum melongena L.). J. Agric. Food Chem. 2014, 62, 2906–2912. [Google Scholar] [CrossRef]
  58. Kohara, A.; Nakajima, C.; Hashimoto, K.; Ikenaga, T.; Tanaka, H.; Shoyama, Y.; Yoshida, S.; Muranaka, T. A Novel Glucosyltransferase Involved in Steroid Saponin Biosynthesis in Solanum Aculeatissimum. Plant Mol. Biol. 2005, 57, 225–239. [Google Scholar] [CrossRef] [PubMed]
  59. Gramazio, P.; Prohens, J.; Plazas, M.; Andújar, I.; Herraiz, F.J.; Castillo, E.; Knapp, S.; Meyer, R.S.; Vilanova, S. Location of Chlorogenic Acid Biosynthesis Pathway and Polyphenol Oxidase Genes in a New Interspecific Anchored Linkage Map of Eggplant. BMC Plant Biol. 2014, 14, 350. [Google Scholar] [CrossRef]
  60. Klann, E.; Yelle, S.; Bennett, A.B. Tomato Fruit Acid Invertase Complementary DNA: Nucleotide and Deduced Amino Acid Sequences. Plant Physiol. 1992, 99, 351. [Google Scholar] [CrossRef]
  61. Zhang, N.; Brewer, M.T.; van der Knaap, E. Fine Mapping of Fw3. 2 Controlling Fruit Weight in Tomato. Theor. Appl. Genet. 2012, 125, 273–284. [Google Scholar] [CrossRef]
  62. Su, L.Y.; Audran, C.; Bouzayen, M.; Roustan, J.-P.; Chervin, C. The Aux/IAA, Sl-IAA17 Regulates Quality Parameters over Tomato Fruit Development. Plant Signal. Behav. 2015, 10, e1071001. [Google Scholar] [CrossRef]
  63. Gonzalez, N.; Gévaudant, F.; Hernould, M.; Chevalier, C.; Mouras, A. The Cell Cycle-associated Protein Kinase WEE1 Regulates Cell Size in Relation to Endoreduplication in Developing Tomato Fruit. Plant J. 2007, 51, 642–655. [Google Scholar] [CrossRef]
  64. Outchkourov, N.S.; Karlova, R.; Hölscher, M.; Schrama, X.; Blilou, I.; Jongedijk, E.; Simon, C.D.; van Dijk, A.D.J.; Bosch, D.; Hall, R.D. Transcription Factor-Mediated Control of Anthocyanin Biosynthesis in Vegetative Tissues. Plant Physiol. 2018, 176, 1862–1878. [Google Scholar] [CrossRef]
  65. Meng, C.; Zhang, S.; Deng, Y.-S.; Wang, G.-D.; Kong, F.-Y. Overexpression of a Tomato Flavanone 3-Hydroxylase-like Protein Gene Improves Chilling Tolerance in Tobacco. Plant Physiol. Biochem. 2015, 96, 388–400. [Google Scholar] [CrossRef]
  66. Sacco, A.; Raiola, A.; Calafiore, R.; Barone, A.; Rigano, M.M. New Insights in the Control of Antioxidants Accumulation in Tomato by Transcriptomic Analyses of Genotypes Exhibiting Contrasting Levels of Fruit Metabolites. BMC Genom. 2019, 20, 43. [Google Scholar] [CrossRef] [PubMed]
  67. Zhang, Y.; Zhao, G.; Li, Y.; Zhang, J.; Shi, M.; Muhammad, T.; Liang, Y. Transcriptome Profiling of Tomato Uncovers an Involvement of Cytochrome P450s and Peroxidases in Stigma Color Formation. Front. Plant Sci. 2017, 8, 897. [Google Scholar] [CrossRef] [PubMed]
  68. Peng, X.; Li, W.; Wang, W.; Bai, G. Cloning and Characterization of a CDNA Coding a Hydroxycinnamoyl-CoA Quinate Hydroxycinnamoyl Transferase Involved in Chlorogenic Acid Biosynthesis in Lonicera Japonica. Planta Med. 2010, 76, 1921–1926. [Google Scholar] [CrossRef] [PubMed]
  69. Sonnante, G.; D’Amore, R.; Blanco, E.; Pierri, C.L.; De Palma, M.; Luo, J.; Tucci, M.; Martin, C. Novel Hydroxycinnamoyl-Coenzyme A Quinate Transferase Genes from Artichoke Are Involved in the Synthesis of Chlorogenic Acid. Plant Physiol. 2010, 153, 1224–1238. [Google Scholar] [CrossRef]
  70. Moy, M.; Dai, N.; Cohen, S.; Hadas, R.; Granot, D.; Petrikov, M.; Yeselson, Y.; Shen, S.; Schaf, A.A. The Presence of a Retrotransposon in the Promoter Region of the TIV Gene Encoding for Soluble Acid Invertase Distinguishes between the Sucrose and Hexose Accumulating Species of Lycopersicon. In Proceedings of the VI International Solanaceae Conference: Genomics Meets Biodiversity 745, Madison, WI, USA, 23–27 July 2006; pp. 429–436. [Google Scholar]
  71. Wang, Y.; Diehl, A.; Wu, F.; Vrebalov, J.; Giovannoni, J.; Siepel, A.; Tanksley, S.D. Sequencing and Comparative Analysis of a Conserved Syntenic Segment in the Solanaceae. Genetics 2008, 180, 391–408. [Google Scholar] [CrossRef]
  72. Gao, L.; Qi, J. Whole Genome Molecular Phylogeny of Large DsDNA Viruses Using Composition Vector Method. BMC Evol. Biol. 2007, 7, 41. [Google Scholar] [CrossRef]
  73. Li, Y.-C.; Korol, A.B.; Fahima, T.; Nevo, E. Microsatellites within Genes: Structure, Function, and Evolution. Mol. Biol. Evol. 2004, 21, 991–1007. [Google Scholar] [CrossRef]
  74. Kim, T.-S.; Booth, J.G.; Gauch, H.G.; Sun, Q.; Park, J.; Lee, Y.-H.; Lee, K. Simple Sequence Repeats in Neurospora crassa: Distribution, Polymorphism and Evolutionary Inference. BMC Genom. 2008, 9, 31. [Google Scholar] [CrossRef]
  75. Riley, D.E.; Krieger, J.N. Embryonic Nervous System Genes Predominate in Searches for Dinucleotide Simple Sequence Repeats Flanked by Conserved Sequences. Gene 2009, 429, 74–79. [Google Scholar] [CrossRef]
  76. Zhao, X.; Tian, Y.; Yang, R.; Feng, H.; Ouyang, Q.; Tian, Y.; Tan, Z.; Li, M.; Niu, Y.; Jiang, J. Coevolution between Simple Sequence Repeats (SSRs) and Virus Genome Size. BMC Genom. 2012, 13, 435. [Google Scholar] [CrossRef]
  77. Olivieri, F.; Calafiore, R.; Francesca, S.; Schettini, C.; Chiaiese, P.; Rigano, M.M.; Barone, A. High-Throughput Genotyping of Resilient Tomato Landraces to Detect Candidate Genes Involved in the Response to High Temperatures. Genes 2020, 11, 626. [Google Scholar] [CrossRef] [PubMed]
  78. Robbins, M.D.; Sim, S.-C.; Yang, W.; Van Deynze, A.; van der Knaap, E.; Joobeur, T.; Francis, D.M. Mapping and Linkage Disequilibrium Analysis with a Genome-Wide Collection of SNPs That Detect Polymorphism in Cultivated Tomato. J. Exp. Bot. 2011, 62, 1831–1845. [Google Scholar] [CrossRef] [PubMed]
  79. Collins, D.W.; Jukes, T.H. Rates of Transition and Transversion in Coding Sequences since the Human-Rodent Divergence. Genomics 1994, 20, 386–396. [Google Scholar] [CrossRef] [PubMed]
Figure 1. Length distribution of the most expressed transcripts in cv. Super strain B (S. lycoperscium) transcriptome under drought stress.
Agronomy 13 02360 g001
Figure 2. Gene ontology classification showing the number of transcripts for biological processes, cellular components, and molecules expressed in cv. Super strain B under drought stress.
Agronomy 13 02360 g002
Figure 3. Number of unigenes for each enzyme commission (EC) category expressed in cv. Super strain B under drought stress.
Agronomy 13 02360 g003
Figure 4. Graphical representation of cv. super strain B unigene positions on the chromosomes of tomato and nucleotide-level variants found on the reference tomato chromosomes.
Agronomy 13 02360 g004
Figure 5. Phylogenetic relationship among Solanaceae species.
Agronomy 13 02360 g005
Table 1. Raw and clean reads and transcriptome assembly summary for Solanum lycopersicum cv. super strain B under drought stress.
Category Reads
Raw Clean
Total reads 41,779,729 × 241,083,929 × 2
Total reads data size (Gb)31 Gb29.6 Gb
G/C (%)4444
Transcripts
After AssemblyAfter Filtration
Number98,06941,900
Total length75,145,30337,600,138
Average length766.25897.37
Maximum length62796279
All the filtered blast results are based on e-value <= e − 20.
Table 2. Summary of the S. lycopersicum cv. super strain B sequences functional annotation over protein databases.
Number of Transcripts%
Annotated in Swiss-Prot 21,49094.74
Annotated in ITAG2.4 740.33
Annotated in UniRef90 11184.93
Total annotated in protein databases22,682100
Table 3. Studied genes affecting features of importance in different Solanaceae.
TraitGenesGene NameBit Score
Fruit shapeFw3Promoter-regulatory333
Sl-IAA17Solanaceae transcription repressor431
WeeProtein kinase219
Anthocyanins pathwaySlAT2Anthocyanin acyltransferase-like331
ANSAnthocyanidin synthase233
F3HFlavanone 3-hydroxylase491
CHS2Chalcone synthase163
Chlorogenic acid pathwayC3HCytochrome P4501068
HCTHydroxycinnamoyl transferase904
Saponines pathwayEgp#1-1Glycosyltransferase326
Sucrose accumulator TIV1Acid invertase1310
Table 4. Statistics for single-sequence repeats (SSRs) are broken down by motif type, frequency of each motif, and the number of SSR-containing unigenes.
Nucleotide Motif Number%Unigenes
Dinucleotide
AT50926.22
TA41821.54
AG23011.85
Other Dinucleotides 78440.39
Total19411001826
Trinucleotide
GAA1906.32
TTC1836.09
TCT1344.46
ATT1203.99
TTG1193.96
TGA973.23
CTT963.19
AAG, AGA1254.16
Other Trinucleotides 194264.60
Total30061002873
Tetra-nucleotide
AAAT1212.0
TTAA99.0
AAAC77.0
ATTT, TTTC66.0
AAAG, AAGA44.0
Other Tetra-nucleotides 6262.0
Total100100107
Table 5. Statistics for single-nucleotide variations between tomato cv. super strain B and Solanum lycopersicum.
SpeciesSNPsINDELs
Solanum lycopersicum “super strain B” vs. Solanum lycopersicum4541744
Table 6. Statistics for single-nucleotide polymorphism (SNP) statistics showing the number and type of transitions and transversions identified in S. lycopersicum cv. super strain B compared with tomato genome.
SNPs TransitionsNumber (%)SNPs TransversionsNumber (%)TS/TV RatioComplex
A<->G1315 (28.9)A<->C489 (10.8)
C<->T1404 (30.1)A<->T586 (12.9)
G<->C319 (7.0)
G<->T400 (8.8)
Total2719 (59.9) 11794 (39.5) 28 (0.6)
Disclaimer/Publisher’s Note: The statements, opinions and data contained in all publications are solely those of the individual author(s) and contributor(s) and not of MDPI and/or the editor(s). MDPI and/or the editor(s) disclaim responsibility for any injury to people or property resulting from any ideas, methods, instructions or products referred to in the content.

