Article

CRISPR/Cas9-Mediated Targeted Mutagenesis of GmEOD1 Enhances Seed Size of Soybean

1
Northeast Institute of Geography and Agroecology, Chinese Academy of Sciences, Changchun 130102, China
2
University of Chinese Academy of Sciences, Beijing 100049, China
3
Ministry of Agriculture and Rural Affairs Key Laboratory of Soybean Biology, Institute of Crop Sciences, Chinese Academy of Agricultural Sciences, Beijing 100081, China
4
Jiuquan Academy of Agricultural Sciences, Jiuquan 735000, China
*
Author to whom correspondence should be addressed.
These authors contributed equally to this work.
Agronomy 2023, 13(9), 2359; https://doi.org/10.3390/agronomy13092359
Submission received: 18 August 2023 / Revised: 4 September 2023 / Accepted: 4 September 2023 / Published: 11 September 2023
(This article belongs to the Section Crop Breeding and Genetics)

Abstract

:
Seed size is a critical agronomic trait that influences the yield and appearance quality of soybeans, making it a primary breeding objective with significant economic value. While the molecular mechanisms that regulate soybean seed size remain largely unknown, several functional molecular targets have been applied in breeding to create larger grain size materials. In this study, we utilized the CRISPR/Cas9 system to induce the targeted mutagenesis of GmEOD1, which encodes the E3 ubiquitin ligase. The resulting homozygous soybean mutant of GmEOD1 exhibited larger seed size and 100-seed weight, with no significant change in the average seed weight per plant. The sum of crude protein and oil content increased significantly in mutants while fatty acid composition remained unchanged. We identified six haplotypes among 156 soybean cultivars, with Hap1 and Hap2 representing the majority of cultivars with relatively higher 100-seed weight, suggesting that sequence variations of GmEOD1 may correlate with seed weight. Transcriptomic analysis across five stages of seed development revealed that stages one–three mainly focused on cell cycle, growth, wall synthesis and modification, photosynthesis, and sugar metabolism; promoting cell growth, reproduction, and carbon accumulation; and providing key intermediates for substance synthesis. Stages four–five focused on polysaccharide catabolism, xylan metabolism, and nutrient pool activity, promoting the accumulation of dry matter, such as sugars, proteins, and lipids in seeds. Weighted gene co-expression network analysis (WGCNA) of modules related to seed size revealed 13 hub genes involved in seed development regulation. This study provides a valuable theoretical basis and excellent opportunities for genetic editing of germplasm cells with subsequent molecular soybean seed size breeding, facilitating easier seed selection to improve soybean quality.

1. Introduction

The soybean (Glycine max L. Merr.) is a highly valuable crop, providing abundant protein and oil resources for both human and animal consumption. The soybean seed is the organ where the nutrients are accumulated, and extensive efforts have been made to increase soybean yield to meet demands [1,2,3]. Previous studies have demonstrated that seed size has a significant positive correlation with yield [4]. However, the current annual growth rate of soybean production is only 55% of the required increase by 2050 [5]. As seed size and weight are critical yield determinants for soybeans [6], they have become prime targets for genetic breeding. The polygenic trait of seed size determines other important characteristics of soybeans, such as protein and oil content and appearance [7,8]. Therefore, investigating soybean seed size is crucial to improving yields and product quality.
Seed size is one of the most significant agronomic traits, and selection for larger seed size occurred during domestication [9,10]. Larger seeds provide adequate energy to support metabolic processes during germination and ensure competitiveness during seedling growth [11]. However, plants often face a trade-off between seed size and seed quantity, and conventional breeding methods struggle to select materials that excel in both [12,13]. Although a previous analysis of soybean cultivars’ contribution to yield showed that the primary driving factor for increased yield per unit area was an increase in seed number per plant, seed size remains an essential, typical, and effective selection trait during soybean domestication [14,15]. Recent studies have shown that genes controlling seed size and seed number have evolved independently, and seed size is subject to directional selection [16,17]. The essential genes within the ubiquitin-proteasome pathway, MAPK signaling pathway, transcriptional regulatory factors, G protein signaling pathway, IKU pathway, and plant hormone regulation pathway emerge as pivotal focal points for enhancing seed size through breeding. These critical genetic targets have been harnessed to create germplasm resources capable of effecting significant changes in seed size [3,7,10]. Therefore, comprehensively understanding the genetic basis and developmental mechanism of soybean seed size is crucial for promoting soybean molecular breeding for high yield [18,19].
The E3 ubiquitin ligase is a crucial enzyme in the process of ubiquitination, responsible for the specific recognition of target proteins by identifying the lysine of a specific target protein, transferring ubiquitin molecules to the substrate protein, and causing its degradation [20,21]. In Arabidopsis thaliana, the ubiquitin-protease pathway is a vital signaling pathway for the regulation of plant seed size, and the E3 ubiquitin ligase plays a critical role in this pathway [22,23]. DA1 is a ubiquitin protein receptor that negatively regulates seed and organ growth [24]. Two Ring-type E3 ubiquitin ligases, EOD1/BB and DA2, work together with DA1 and DAR1 (DA1-related protein) to limit seed and organ size growth [25]. EOD1/BB mutants show an increase in seed size, indicating that EOD1/BB may also negatively regulate seed and organ size alone [26]. Further studies show that both DA2 and EOD1/BB can ubiquitinate DA1 at multiple sites, thereby activating the peptidase activity of DA1, which can lyse various growth regulators to regulate the growth of seeds and organs [27]. In addition, DA2 and EOD1/BB are also regulated by DA1 feedback [25]. The plant-specific negative regulator of APC, SAMBA, can regulate seed size by controlling cell proliferation [28]. Further studies found that Samba could cooperatively enhance the seed size of da1-1 and eod1-2, indicating that it may have a functional redundancy or interaction with DA1 and EOD1/BB in influencing seed size [29]. Despite the crucial role of E3 ubiquitin ligase in regulating soybean seed size, the mechanism of its action is still unclear due to the complex genetic characteristics of this quantitative trait, which limits the use of genetic engineering methods to create an excellent germplasm of seed size and brings difficulties to the research of the soybean seed size regulatory network [22].
This study utilized CRISPR/Cas9 genome editing technology to target the crucial gene GmEOD1 (Glyma.13G203300) that encodes the E3 ubiquitin protein ligase EOD1/BB in soybeans. To verify the regulatory effect and mechanism of this functional locus, various traits such as seed size and yield of the mutant were analyzed. Moreover, the transcriptome profile of the eod1 mutant was evaluated during different developmental stages, and the regulatory network associated with soybean seed size was investigated. These findings provide a vital theoretical foundation and superior genetic editing germplasms for the subsequent molecular seed size breeding in soybeans and other crops.

2. Materials and Methods

2.1. Plant Materials and Growth Conditions

The soybean cultivar Jack was used for genetic transformation in this study. CRISPR/Cas9 T0 plants and T1 plants were sown in greenhouse conditions (16 h light/8 h dark, about 20–30 °C). Seeds of T1 plants and WT Jack (as a control) were germinated in pots with soil and vermiculite (1:1) in a controlled culture room at 28 °C with 50% humidity under about 16 h light/8 h night conditions and grown under natural conditions in Changchun, China (43°59′ N, 125°24′ E).

2.2. Phylogenetic Analysis of GmEOD1 Gene Family

The homologous sequences alignment of EOD1 gene family were carried out on the Phytozome website (https://phytozome-next.jgi.doe.gov/ (accessed on 18 May 2022)). The coding region sequences of homologous genes in Glycine max (L.) Merr. and Glycine soja Sieb. et Zucc. (E < 1 × 10⁻¹⁰, identity > 64%) were downloaded. A neighbor-joining phylogenetic tree of a total of sequences of 11 WTs and 37 cultivated species were constructed using the Maximum Composite Likelihood method [30] in MEGA 7.0 [31] with the default parameters.

2.3. SgRNA Design and Construction of the CRISPR/Cas9 Expression Vector

The Arabidopsis AtU6 promoter drives the sgRNA expression cassette, and the 2× CaMV35S promoter drives the Cas9 protein expression cassette. In order to obtain transformation efficiency, the expression cassettes of sgRNA and Cas9 protein were integrated into the same vector. The bar gene driven by CaMV 35S promoter was beneficial to the screening of transgenic plant. The CRISPR/Cas9 vector map of GmEOD1 is shown in Figure S1. The sgRNA target primer sequences (Table S1) and sequencing of plasmids subsequently (the sequencing primer was GATGAAGTGGACGGAAGGAAGGAG) were synthesized by Singke Biotechnology Co., Ltd. (Beijing, China). The genome sequence of GmEOD1 was downloaded in the Phytozome website. The appropriate sgRNA target sequences were designed using the web tool named CRISPR-P (http://cbi.hzau.edu.cn/crispr/ accessed on 27 July 2018) [32]. We selected a target site named GmEOD1-SP1 in the second exon of GmEOD1 (Figure 1). The designed target site was placed after the AtU6 promoter of Arabidopsis thaliana to complete vector integration. We annealed to form oligo dimers for integration into the vector after primer synthesis. Transformation of ligation products into Trans1-T1 Phage Resistant Chemically Competent Cell receptor cells used a heat excitation method. After transforming these CRISPR/Cas9 expression vectors into E. coli DH5a for in vivo cloning, the EasyPure Plasmid MiniPrep Kit (TransGen Biotechnology Ltd., Beijing, China) was used for subsequent soybean transformation.

2.4. Detection of Potential Off-Target Sites

Potential off-target site detection was performed on seeds of T2 generation of eod1 mutant. The web tool CRISPR-P was used to predict the potential off-target sites of GmEOD1 gene, from which the sequences with the highest similarity to this target site were selected, respectively. Potential off-target sites were detected with sequencing in ten samples of T2 generation mutant seeds, and the amplification primers are shown in Table S2.

2.5. Soybean Transformation and Screening for Homozygous Mutants

The plasmid containing the target gene was transferred into E. coli EHA105 receptor cells for click transformation. Then, the bacteria were dipped on LB solid plates with Kan resistance for coating culture and bacteriophage PCR assay (Figure S2) with the bacteriophage forward primer (5′-TTGGGGCTCACACCAAACTT-3′) and reverse primer (5′-CGATCGCCTTCTTTTGCTCG-3′). The specific soybean genetic transformation method using soybean cultivar Jack mediated by Agrobacterium tumefaciens is referred to in the protocol previously reported [33]. The explants obtained after elongation and rooting culture were transplanted, and the transplanted seedlings were tested using bar gene detection test strips to screen positive plants (T0 generation). We extracted genomic DNA from the emerging leaves of each individual plant in the T0 generation, amplified the regions spanning the target sites with PCR using Phanta® Super Fidelity DNA Polymerase from Vazyme Biotech Co., Ltd (Beijing, China) with the GmEOD1 forward primer (5′-GGTCAATGAACATGAATCCC-3′) and reverse primer (5′-TTTGTTGTTAGCATGGCACC-3′), and finally, purified and sequenced them. The specific mutation type was determined by comparing the sequencing peaks with the reference sequence of the WT. The heterozygous mutations have no overlapping peaks upstream of the target point but appear overlapping peaks near the target point toward the back. The WT shows no overlapping peaks at the target sequences, and it is identical to the reference sequences. The homozygous mutations including insertion, deletion, and mismatch of bases showed no overlapping peaks but also did not exactly match the WT at the target sequences. The T1 and T2 generations were screened for homozygous sequence using the same method as above.

2.6. Haplotype Analysis of EOD1 in Multiple Varieties

In order to evaluate the effects of GmEOD1 natural variations on the adaptability of soybean varieties, the GmEOD1 alleles of 156 soybeans cultivars were detected. The genomic data and the 100-seed weight were obtained in our previous investigation [34,35]. The detail information of soybean cultivars was listed in Supplementary Table S3.

2.7. Seed Size Measurements and Statistical Analysis

To quantitatively analyze the phenotypic traits of T2 generation mutants, we measured traits of plant height, bottom pod height, number of main stem nodes, number of effective branches, number of pods per plant, number of seed per plant, 100-seed weight, seed weight per plant, and seed size (seed length, width, and thickness) for each mature eod1 plant and WT. To further understand the effect of eod1 on soybean seeds, we also measured the physiological traits of the seeds, including protein, oil, soluble sugar, isoflavones, and fatty acid contents. Methods for determination of substances related to seed development are shown in Table S4. Statistical analyses were performed in SPSS v21.0 (IBM, Armonk, NY, USA) using the method of independent samples t-test to compare the significance of differences between controls and mutants at the 0.05 probability level. All histograms are drawn in R4.0.3. The indicators of traits are shown as the mean values ± standard deviation.

2.8. Transcriptome Sequencing and Analysis and WGCNA

To fully concentrate on exploring the expression differences of the key genes controlling the seed development, the seeds and leaves of eod1 T2 generation and WT were sampled at 0 d (stage 1), 10 d (stage 2), 20 d (stage 3), 30 d (stage 4), and 40 d (stage 5) after R5 stage (Figure S3, Table S5) under the same conditions with three biological replicates. Every sample larger than 0.2 g was used as input material for the RNA sample preparations. Seed length and seed width were measured in each stage for discerning the relationship of EOD1 and seed growth modules (WGCNA) considering the influence of moisture and number of seeds at the time of sampling on the accuracy of weight and yield. In total, 30 seed samples were sent to Novogene Co., Ltd (Beijing, China) for transcriptome sequencing. Sequencing libraries were generated using the Illumina NovaSeq 600. The raw data was uploaded to NCBI Sequence Read Archive with the accession number of PRJNA972865. All the downstream analysis was based on clean data with high quality. Differential expression analysis was performed using the DESeq2 R package (1.20.0) [36] with a model based on the negative binomial distribution. DESeq2 provides statistical routines for determining differential expression in digital gene expression data usage. Genes with an adjusted p-value < 0.05 were assigned as the threshold for significantly differential expression. ClusterProfiler R package (3.8.1) [37] was used to Gene Ontology (GO) enrichment analysis of differentially expressed genes (DEGs) and test the statistical enrichment of differential expression genes in KEGG pathways. Corrected p-value < 0.05 were considered significantly enriched by differential expressed genes. R package WGCNA [38] was used to calculate various weighted association analysis in describing the gene association modes among different sample.

2.9. Gene Expression Analysis by Quentitative Real-Time RNA (qPCR)

The Glycine Max RNA-seq database contains 4085 soybean RNA-seq data sources (http://ipf.sustech.edu.cn/pub/soybean/ accessed on 12 December 2021), and a search of this database for target genes revealed that GmEOD1 was expressed in different plant tissues and in different amounts in existing studies as shown in Figure S4 shows that GmEOD1 can be expressed in several different parts of soybean, but the expression level (FPKM value) and the number of studies that have occurred are highest in soybean cotyledons; followed by higher number of studies in roots and leaves; and in terms of expression, besides the highest in cotyledons, endosperm, stems, meristematic tissues, leaves, and seedlings are also at higher expression levels. Based on the expression levels of the target genes in previous studies, the number of studies and the practicability of sampling, quantitative analysis of soybean cotyledons and leaf tissues will be performed in this study, and transcriptome analysis of cotyledons will be performed.
Total RNA was extracted from seed and leaf samples collected from T2 homozygous eod1 mutants and WT at five stages using TransZol Up Plus RNA Kit (TransGen Biotech, Beijing, China). We synthesized cDNA via reverse transcription using the TransScript One-Step gDNA Removal and cDNA Synthesis SuperMix (TransGen Biotech) kit. For qRT-PCR, ABI 7500 fast real-time PCR system had PCR cycling conditions as follows: 50 °C for 2 min, 95 °C for 3 min, followed by 40 cycles of 95 °C for 5 s, a primer extension reaction of 60 °C for 30 s. All reactions were performed with three biological replicates. The gene expression levels were analyzed using the 2−∆∆Ct method with the GmActin (Glyma18g52780) gene as an internal reference. Data processing was performed with R4.0.3.

3. Results

3.1. The Target Gene GmEOD1 Has High Homology with EOD1 of Arabidopsis

Our phylogenetic analysis of the EOD1 gene family involved 11 coding region sequences of homologous genes from soybean and 37 from wild soybeans (Glycine soja Sieb. et Zucc.) (Figure S5). In addition, the analysis included 23 species of plants for the region sequences of the EOD1 gene family (Figure S5). The evolutionary tree results demonstrated that GmEOD1 in our study shares high homology with the critical gene EOD1 of Arabidopsis thaliana (At3g63530).

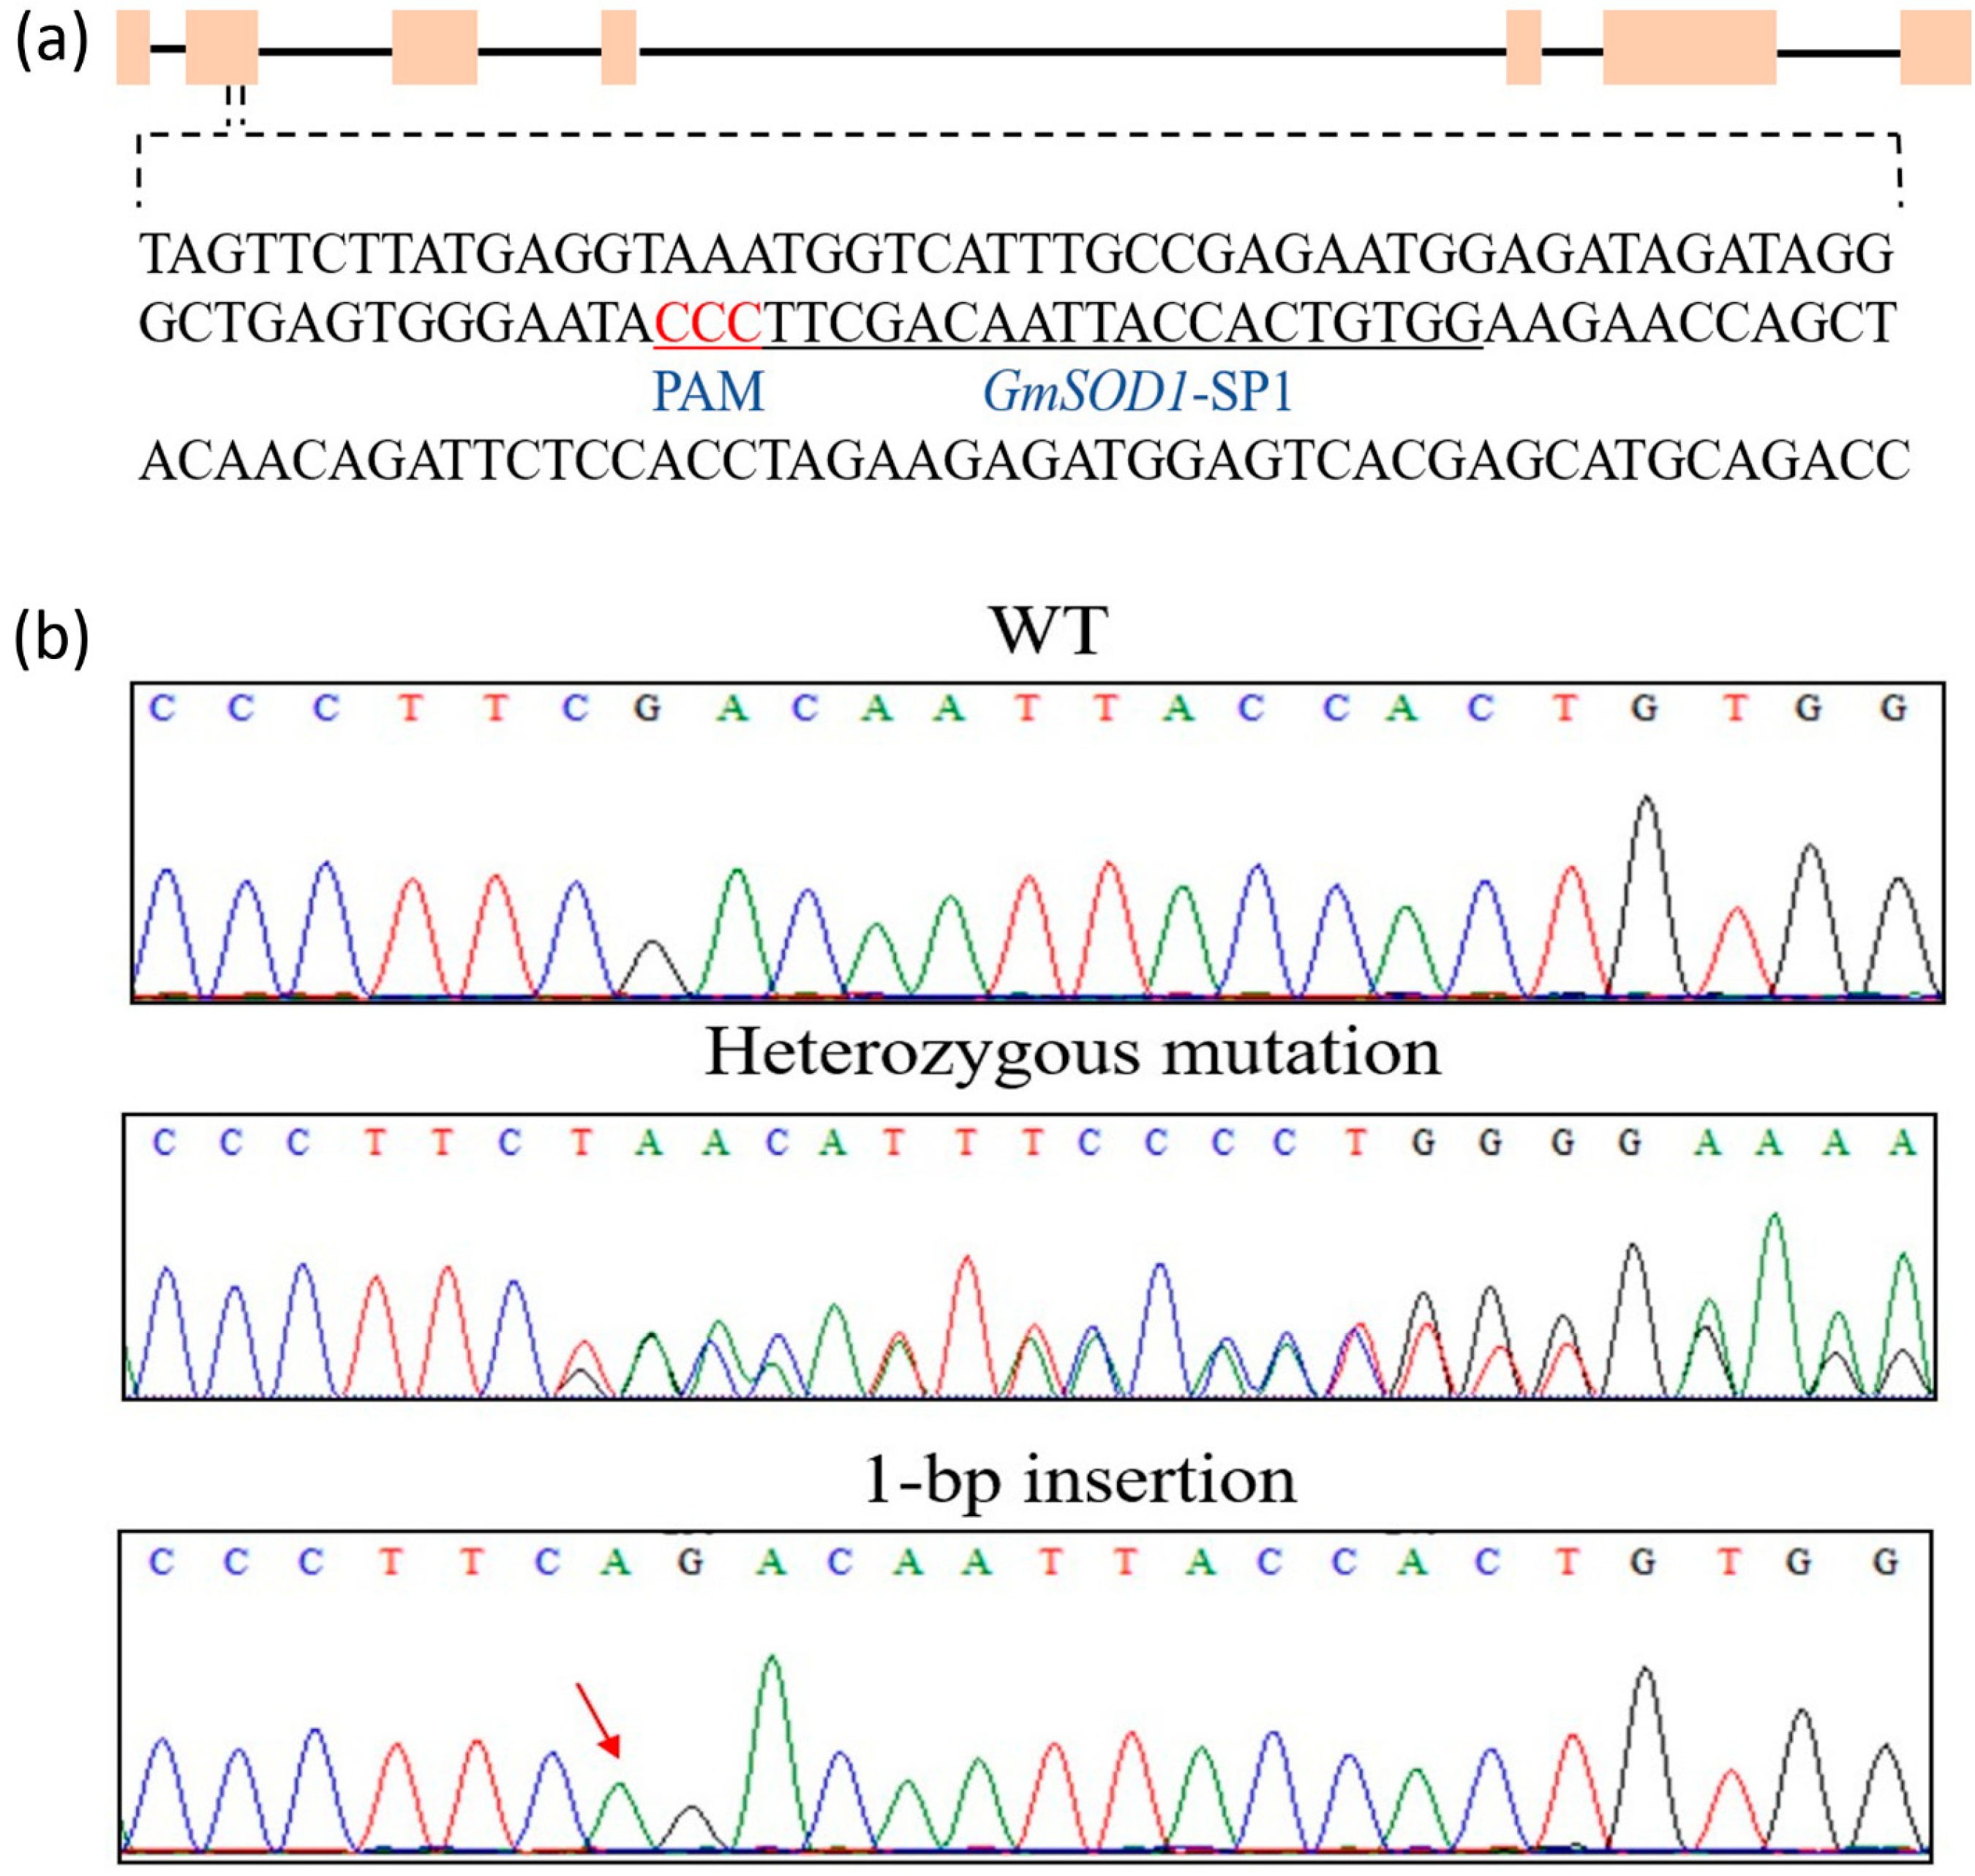
3.2. Homozygous GmEOD1 Mutant Was Induced by CRISPR/Cas9

We utilized CRISPR/Cas9-mediated genome editing tools to knock out the endogenous gene GmEOD1 in soybeans. The target site, GmEOD1-SP1, was selected at the second exon of the GmEOD1 gene (Figure 1), and the corresponding sgRNA/Cas9 vector was transformed into the soybean cultivar Jack by Agrobacterium-mediated transformation to generate mutant plants. We extracted DNA from leaf tissue and used PCR and DNA sequence analysis to detect CRISPR/Cas9-induced mutations at the target loci. Eventually, eight positive plants containing the sgRNA/Cas9 vector T-DNA were identified in 13 T0 transgenic strains, two of which had GmEOD1 heterozygous target mutations. During the expansion of generation planting, we also observed the type and number of GmEOD1 targeted mutations in T1 and T2 generations (Table S6). Finally, six heterozygous eod1 mutants were found in the T1 generation. We identified one type of mutation (Figure 2) at the target site GmEOD1-SP1 (1-bp insertion) in a total of 50 homozygous null alleles of GmEOD1 induced by CRISPR/Cas9 in the T2 generation. The frameshift mutation induced by CRISPR/Cas9 at the target site of GmEOD1 generated premature translation termination codons (PTCs).
To investigate the specificity of the CRISPR/Cas9 system in soybeans, we used the web tool CRISPR-P (http://cbi.hzau.edu.cn/crispr/ accessed on 10 August 2021) to predict potential off-target sites of the GmEOD1 gene. We selected four sequences with the highest similarity to the target site (Table S6) and sequenced them in ten homozygous eod1 mutant seeds of the T2 generation using the amplification primers listed in Table S2. The results of site-specific genomic PCR and sequencing showed no off-target events, indicating the high specificity of the CRISPR/Cas9 system in soybeans.

3.3. Phenotype and Physiological Trait Analysis of T2 Homozygous eod1 Mutant and WT Plants

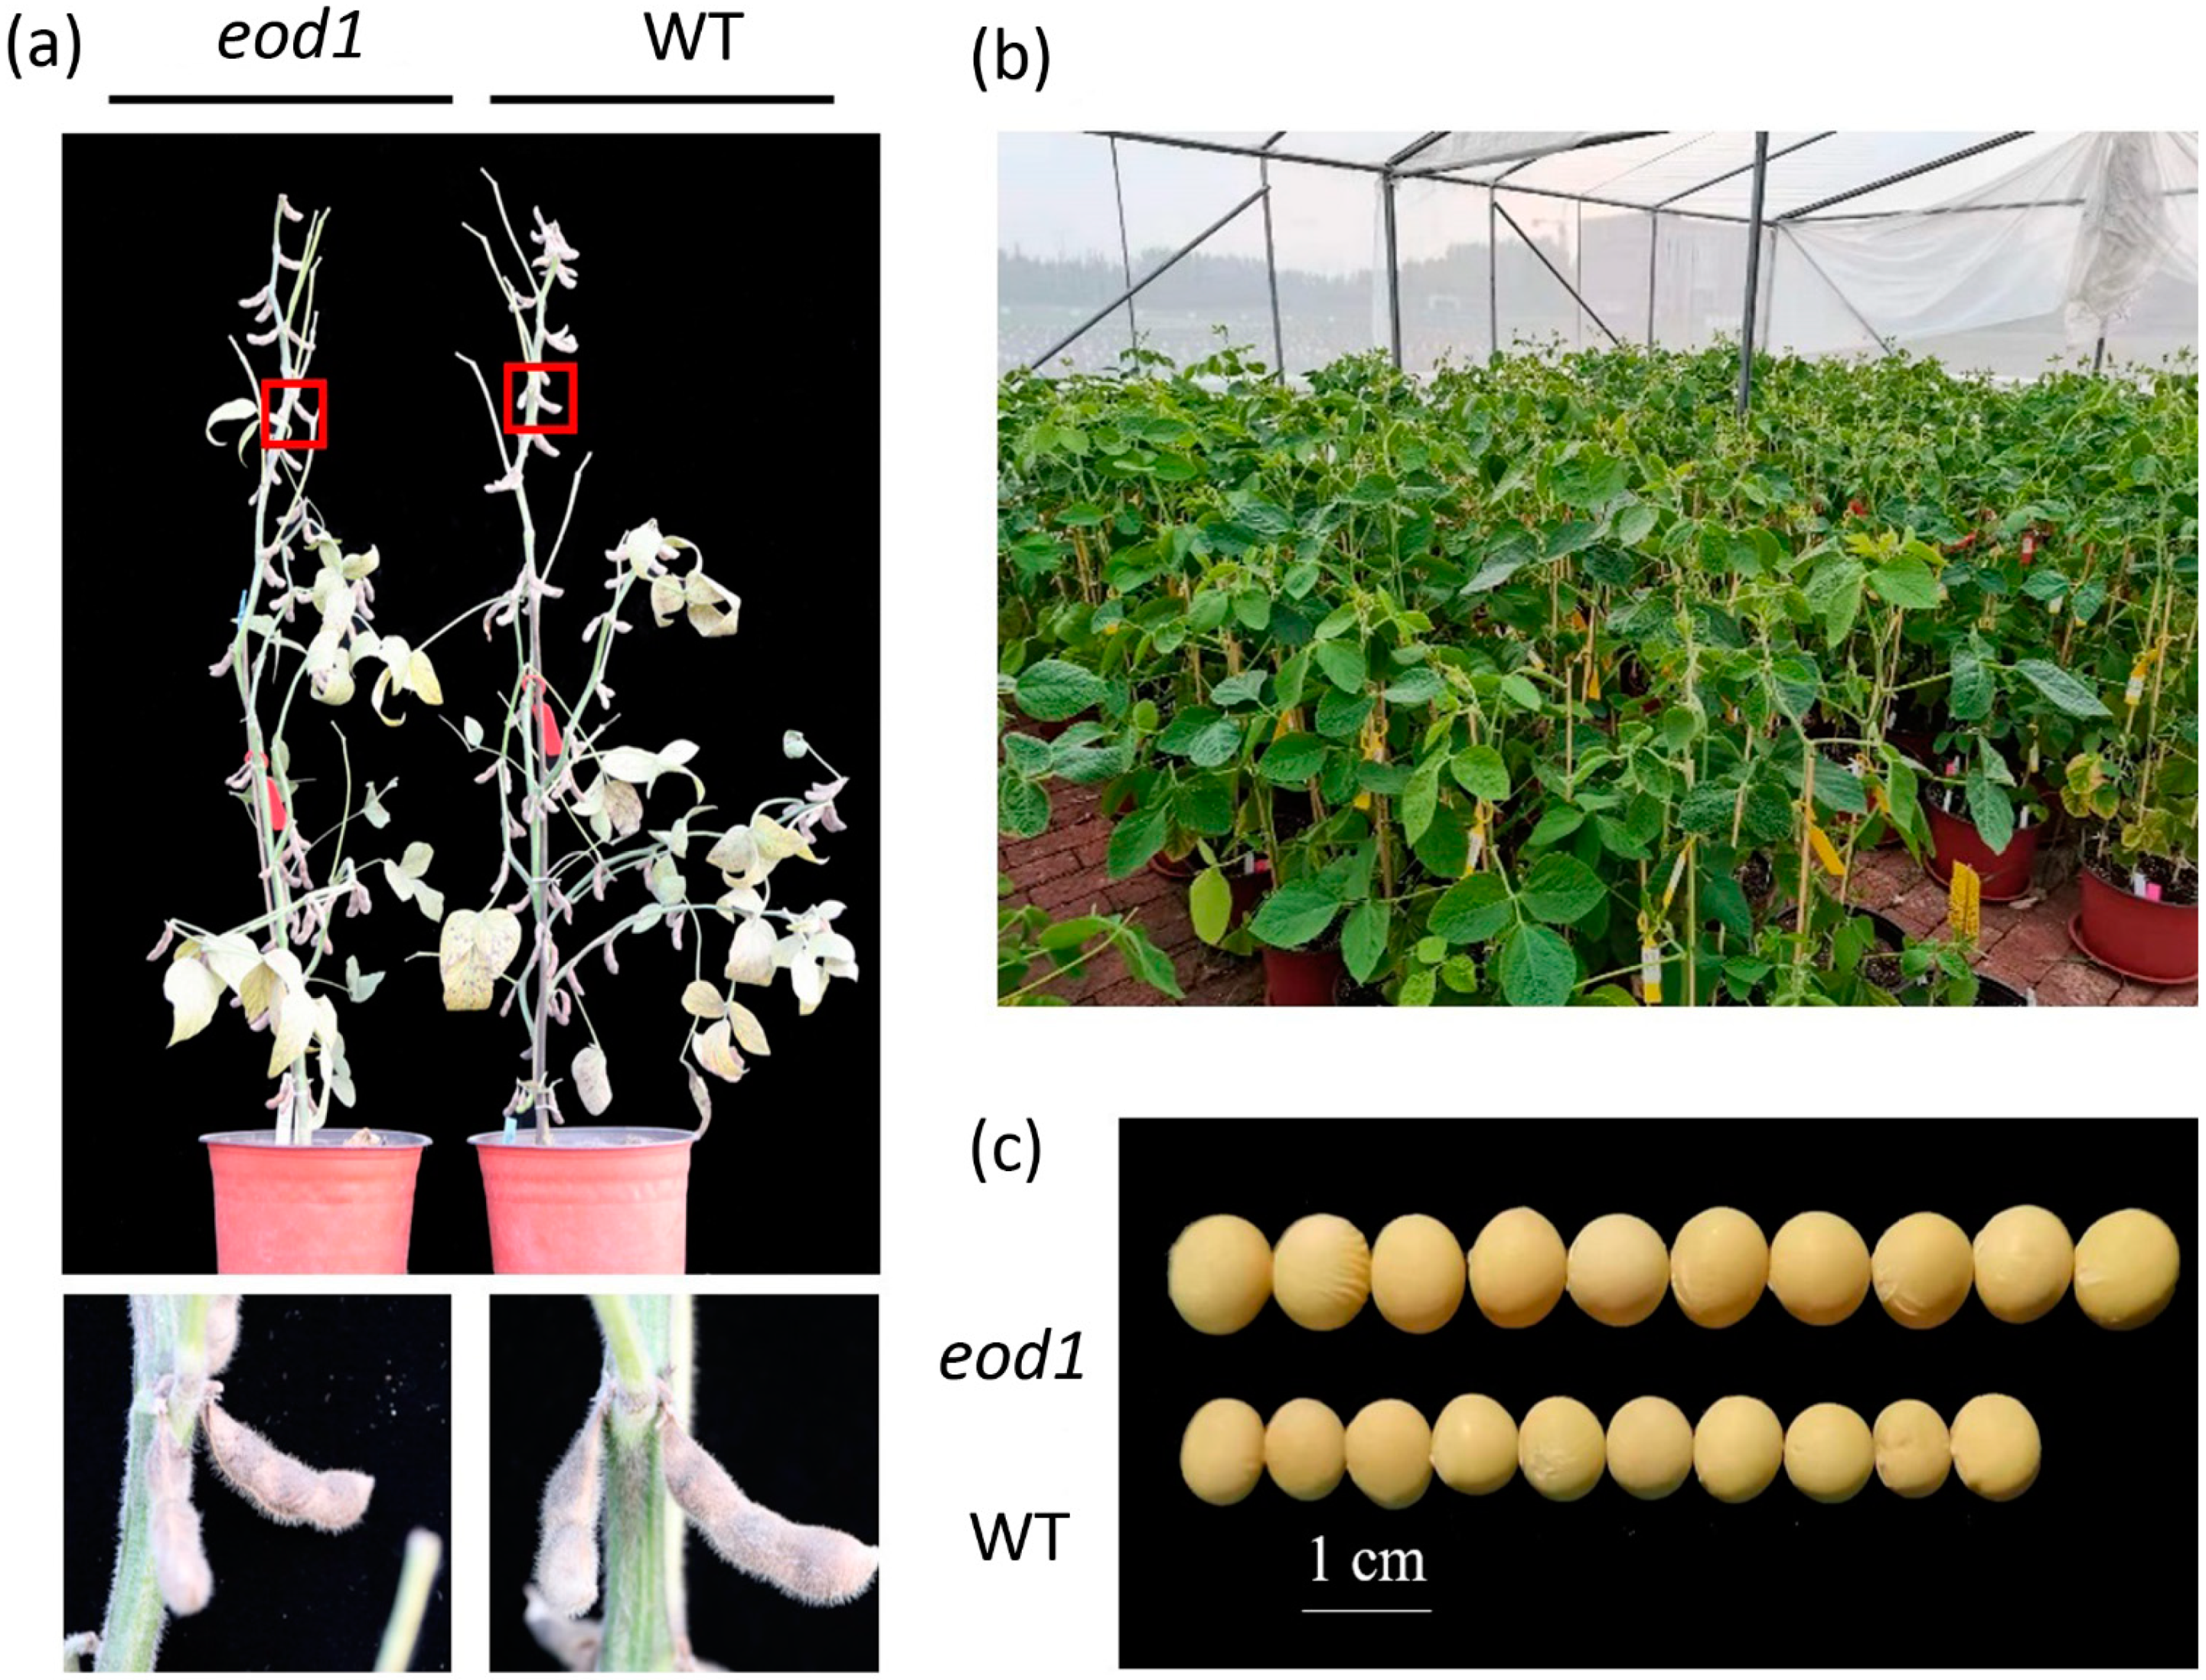
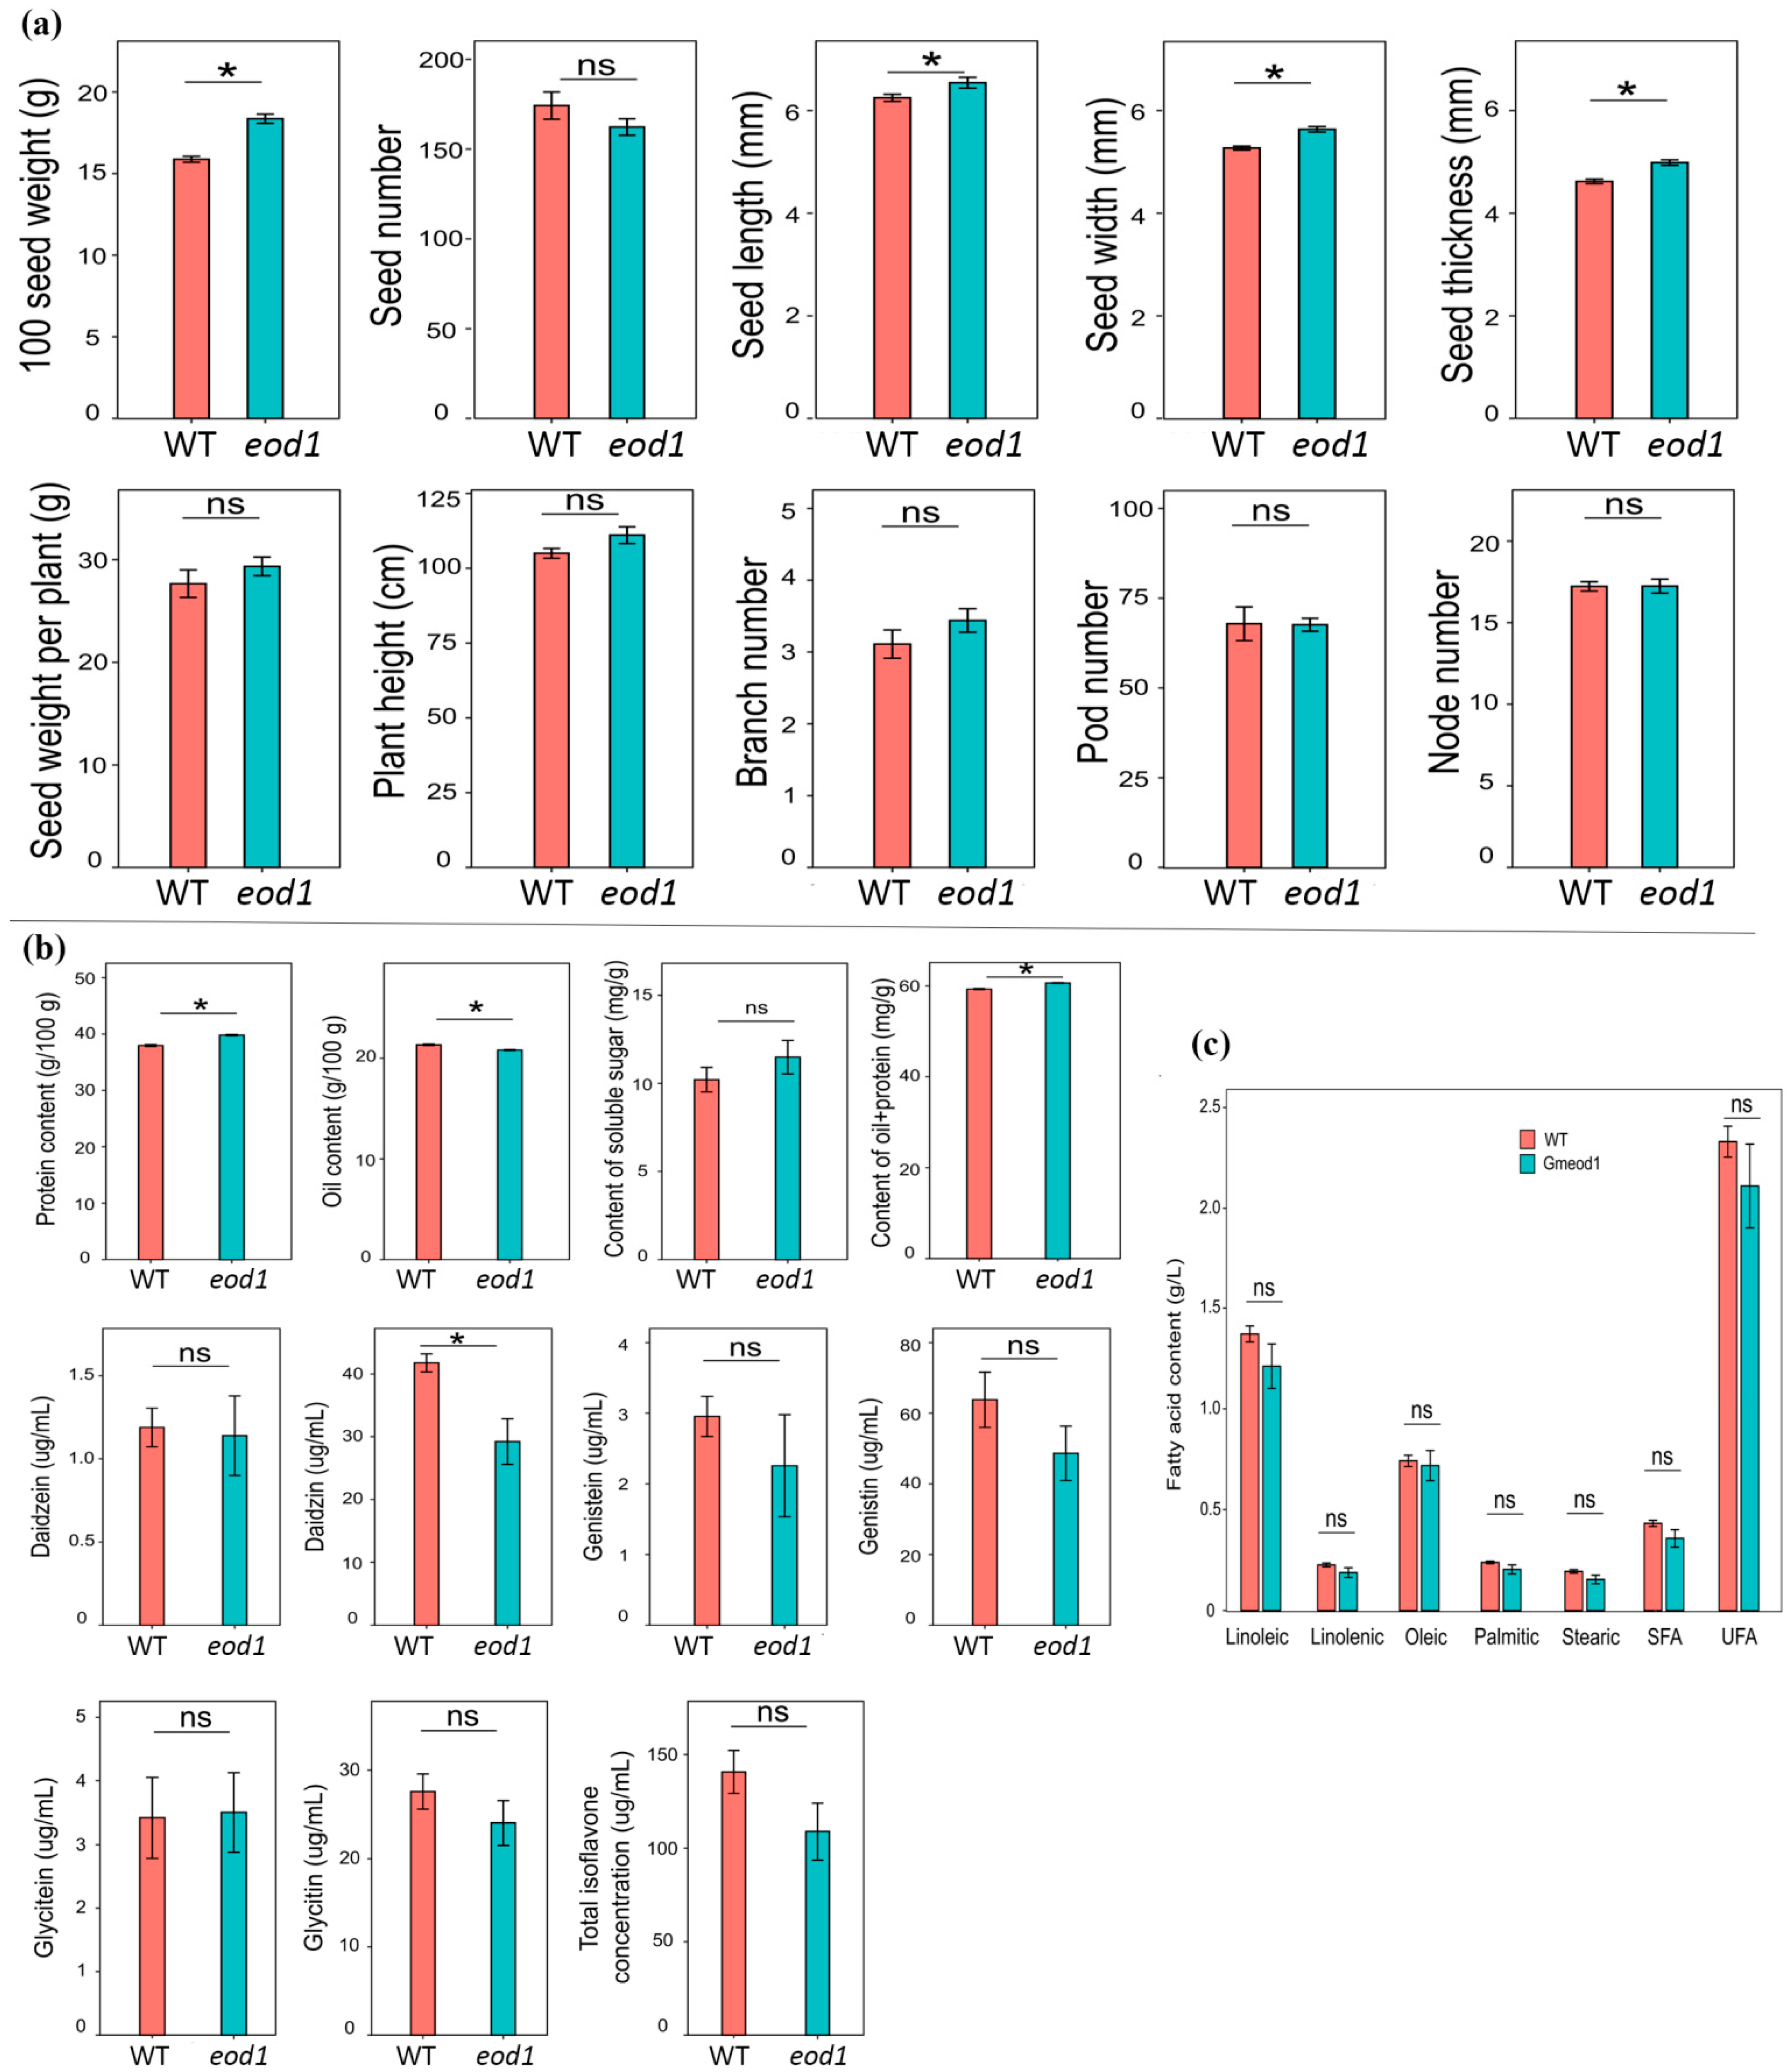
3.3.1. T2 Homozygous eod1 Mutant Exhibited the Larger Seed Size and 100-Seed Weight

The overall plants, mature pods, seeds, and growth environment of the T2 generation mutant and WT plants were shown in Figure 3. The results showed that the seed size significantly increased, including the seed length (+4.6%, p < 0.05), seed width (+8.0%, p < 0.001), and seed thickness (+7.2%, p < 0.001) in T2 homozygous eod1 mutant plants (Figure 3), and the eod1 mutant plants had significantly higher 100-seed weight (+15.7%, p < 0.001) compared to the WT. The number of seed per plant exhibited no significant difference. Though the average of the seed weight per plant in eod1 mutant was higher than WT, there is no significant difference between them. These results exhibited that the T2 homozygous eod1 mutant plants showed a higher seed size phenotype. However, the mutant plants did not differ significantly from the WT in traits of plant height, number of effective branches, number of main stem nodes, and number of pods per plant.

3.3.2. T2 Homozygous eod1 Mutant Improved Protein Content but Reduced Oil Content

To better evaluate the effect of homozygous eod1 mutant on soybean seeds, we subsequently examined the physiological traits of the seeds, including protein, oil, soluble sugar, isoflavones, and fatty acid content. The results showed that the protein content of the eod1 mutant seeds (39.84%) was significantly higher compared to the WT (37.96%, p < 0.01); however, the oil content was lower compared to the WT (eod1, 20.82%; WT, 21.33%, p < 0.05), and there was no difference in the soluble reducing sugar content between them (Figure 3a). The sum of the crude protein and oil increased significantly in mutants (eod1, 60.66%; WT, 59.28%, p < 0.05, Figure 3). The isoflavone content of the mutant and WT plants was determined using liquid chromatography, and the components measured, such as Daidzein, Daidzin, Genistein, Genistin, Glycitein, and Glycitin, and the total isoflavone concentration were included. The results showed that the soybean Daidzin content of the mutant seeds was lower than that of the WT (p < 0.05, Figure 3b) while there were no significant differences in the total concentrations of soybean xanthin, genistein, soybean xanthin, soybean xanthin glycogen, genistein, and isoflavones (p > 0.05). The content of the five major fatty acids was determined using gas chromatography in the mutant and WT plants (Figure 3c), and the results showed that there was no significant change in the content of palmitic, stearic, oleic, linoleic, and linolenic acids in the mutant plants compared to the WT. There was also no significant change (p > 0.05) in the total saturated fatty acid (SFA) (including palmitic and stearic acids) and total unsaturated fatty acid (UFA) content (including oleic, linolenic, and linoleic acids).

3.4. Analysis of GmEOD1 Haplotypes Revealed That EOD1 Gene Sequence Variation May Be Associated with Seed Weight in Soybean Varieties of the Different Maturity Groups

Sequence analysis of the EOD1 genome of 156 cultivars showed that there were variants in the exon, intron, and UTR regions, and six haplotypes were categorized (Figure 4). A total of 17 SNPs, including 1 allele in the 5′UTR (Gm13: 31727840...31728348), 14 alleles in genomic region (Gm13: 31728349...31735342), and 2 alleles in the 3′UTR (Gm13:31735343…31735910), were identified. The hap1 was the major haplotype with relatively higher average 100-seed weight of 18.56 ± 3.58 g, and represented more than half cultivars (87 cultivars) of the total. The hap2 covered 37 cultivars and the average 100-seed weight was 18.42 ± 4.25 g, slightly higher than that of hap1 (p > 0.05); the rare hap5 with average 100-seed weight of 14.88 ± 2.25 g, 19.8% lower than that of hap1 (p < 0.05). The average 100-seed weight varied among the haplotypes, implying that EOD1 gene sequence variation may be associated with seed weight.

3.5. Transcriptome Analysis and WGCNA (Weighted Gene Co-Correlation Network Analysis) among Five Stages of Seed Development

3.5.1. Transcriptome Analysis Showed Many Metabolic Pathways Involved in Seed Size Regulation

Among the five sampling stages, which were taken every 10 days since R5 (when seeds in pods reach up to 3 mm in length at any of the four uppermost nodes of the main stem with fully grown leaves), transcriptome profiling identified a total of 3501 differentially expressed genes (DEGs) in the third stage, with 1730 up-regulated and 1771 down-regulated genes, showing the highest number of DEGs (Figure 5). In contrast, the fifth stage had the lowest number of DEGs, with only 554 genes differentially expressed, of which 206 were up-regulated and 348 were down-regulated. Transcriptome analysis of the target gene at each of the five stages revealed that GmEOD1 was consistently downregulated from the first to the fifth stage (log2Fold Change < 0) (Table S7), indicating that knockdown of the GmEOD1 gene in the eod1 mutant resulted in decreased expression of this gene.
GO enrichment analysis reflects the overall functional characteristics of genes. In this study, enrichment analysis was performed for DEGs in eod1 vs. WT stage one–five, respectively, and padj < 0.05 was used as the threshold for significant enrichment, where the most significantly enriched biological processes related to seed size (Table 1) mainly included cell cycle (GO: 0008283, GO: 0051726), cell growth (GO: 0042127, GO: 0008284), protein kinase signaling pathway (GO: 0016538, GO: 0000079, GO: 1904029, GO: 0052548), photosynthesis (GO: 0009765), nutrient metabolism (GO: 0045735), phytohormone signaling pathway (GO: 0042446), protein metabolism (GO: 0032269, GO: 0051248, GO: 0045861), cell wall synthesis and modification (GO: 0005618, GO: 0009505), zygote development (GO: 0048580, GO: 0010154) and sugar metabolism (GO: 0006073, GO: 0044042, GO: 0044264, GO: 0010383, GO: 0046527, GO: 0000272, GO: 0010411), etc.
Pathway enrichment analysis evaluates whether DEGs are significantly different in a given pathway. It compares the pathways in the KEGG database and identifies those pathways that are significantly enriched compared to the entire genomic background. In this study, KEGG pathway enrichment analysis was conducted for eod1 mutant and WT DEGs at stages one–five (Figure S6). A total of 584, 174, 714, 437, and 92 mutant and WT DEGs were annotated to 117, 92, 117, 112, and 68 metabolic pathways in stages one–five, respectively. These metabolic pathways might be related to seed size development and involved in zygote size regulation. The pathways included were fatty acid biosynthesis (gmx00061), linoleic acid metabolism (gmx00591), flavonoid biosynthesis (gmx00941), photosynthesis (gmx00195), ubiquitin-mediated protein hydrolysis (gmx04120), ubiquitin ketone and other terpenoid quinone synthesis (gmx00130), nitrogen metabolism (gmx00910), galactose metabolism (gmx00052), fatty acid metabolism (gmx01212), glycolysis and glycogenesis (gmx00010), starch and sucrose metabolism (gmx00500), and amino and nucleotide sugar metabolism (gmx00520).
Using 0.05 as the probability level for KEGG pathway enrichment analysis, the most significantly enriched metabolic pathways are shown in Table S8. The significant metabolic pathways specific to stage one are: photosynthesis (gmx00196) and circadian rhythm (gmx04712). The significant metabolic pathways specific to stage three is DNA replication (gmx03030); these processes are the normal physiological growth of the crop, and these two stages of these metabolic processes are more active, indicating that in the early stages of seed growth, the seed is in a state of active synthesis of related substances to provide raw materials and power for other substances and processes. The significant metabolic pathways specific to stage five are: sugar metabolism (gmx00052) and linolenic acid metabolism (gmx00592). Stage five occurs 40 days after the growth of the seeds, which is very close to the early R7 maturation time of soybeans, and some of the seeds begin to gradually move toward maturity, and the analysis of the KEGG significance results shows that the accumulation of nutrients, such as sugar, is more active at this stage compared to other stages. The analysis of KEGG significant results showed that the accumulation of sugars and other nutrients was more active at this stage compared to other stages.

3.5.2. WGCNA Showed Four Modules and Screened 13 Hub Genes Associated with Seed Size

In this study, for the 32,562 genes obtained from the screening filter, a soft threshold β = 7 (squared threshold of correlation coefficient of 0.9) was chosen to construct a modular hierarchical clustering tree diagram (Figure S7), and a total of 14 co-expression modules were obtained. The correlation coefficients and significance of each module and trait were calculated (Figure S8). Considering the influence of moisture and the number of seeds on the accuracy of seed weight and yield at the time of sampling, only the traits of seed length and width were determined for each stage, and a correlation coefficient greater than 0.38 was set as the threshold value for correlating modules with traits. The results showed that the modules associated with both seed length and width traits were Black (correlation coefficients of 0.39 and 0.53, respectively), Magenta (correlation coefficients of 0.38 and 0.52, respectively), Blue (correlation coefficients of −0.49 and −0.50, respectively), and Pink (correlation coefficients of −0.46 and −0.54, respectively) with p-values of less than 0.05, indicating that Black, Magenta, Blue, and Pink had significant effects on the seed size traits.
WGCNA constructed a co-expression network between genes in the modules and calculated the large connectivity (KWithin value) of genes in the network and then screened 13 hub genes related to seed size traits and related to the E3 ubiquitin ligase regulation (Table 2). The hub genes associated with seed size were identified based on the co-expression network within the four modules (Figure S9). Among them, Glyma.16G062000 encodes galactose oxidase, Glyma.15G182600 encodes sucrose synthase, and Glyma.11G032800 encodes ribosomal protein, which plays regulatory roles in sugar metabolism and substance accumulation and, thus, influences the zygote size. In addition, other genes that play a role in the E3 ubiquitin ligase regulatory zygote size pathway were screened. Glyma.02G059900, Glyma.01G179800, Glyma.11G062400, and Glyma.17G247700 encode ubiquitin protein receptor DA1-related proteins; Glyma.13G259100 and Glyma.15G249000 encode ubiquitin ligase DA2; and Glyma.12G057100 and Glyma.11G132700 encode ubiquitin ligase EOD1/BB. DA1 acts with ubiquitin ligase DA2 and EOD1/BB can negatively regulate seed size. These genes above are functionally similar to the target gene GmEOD1 and may play a synergistic role in the regulation of soybean seed size.

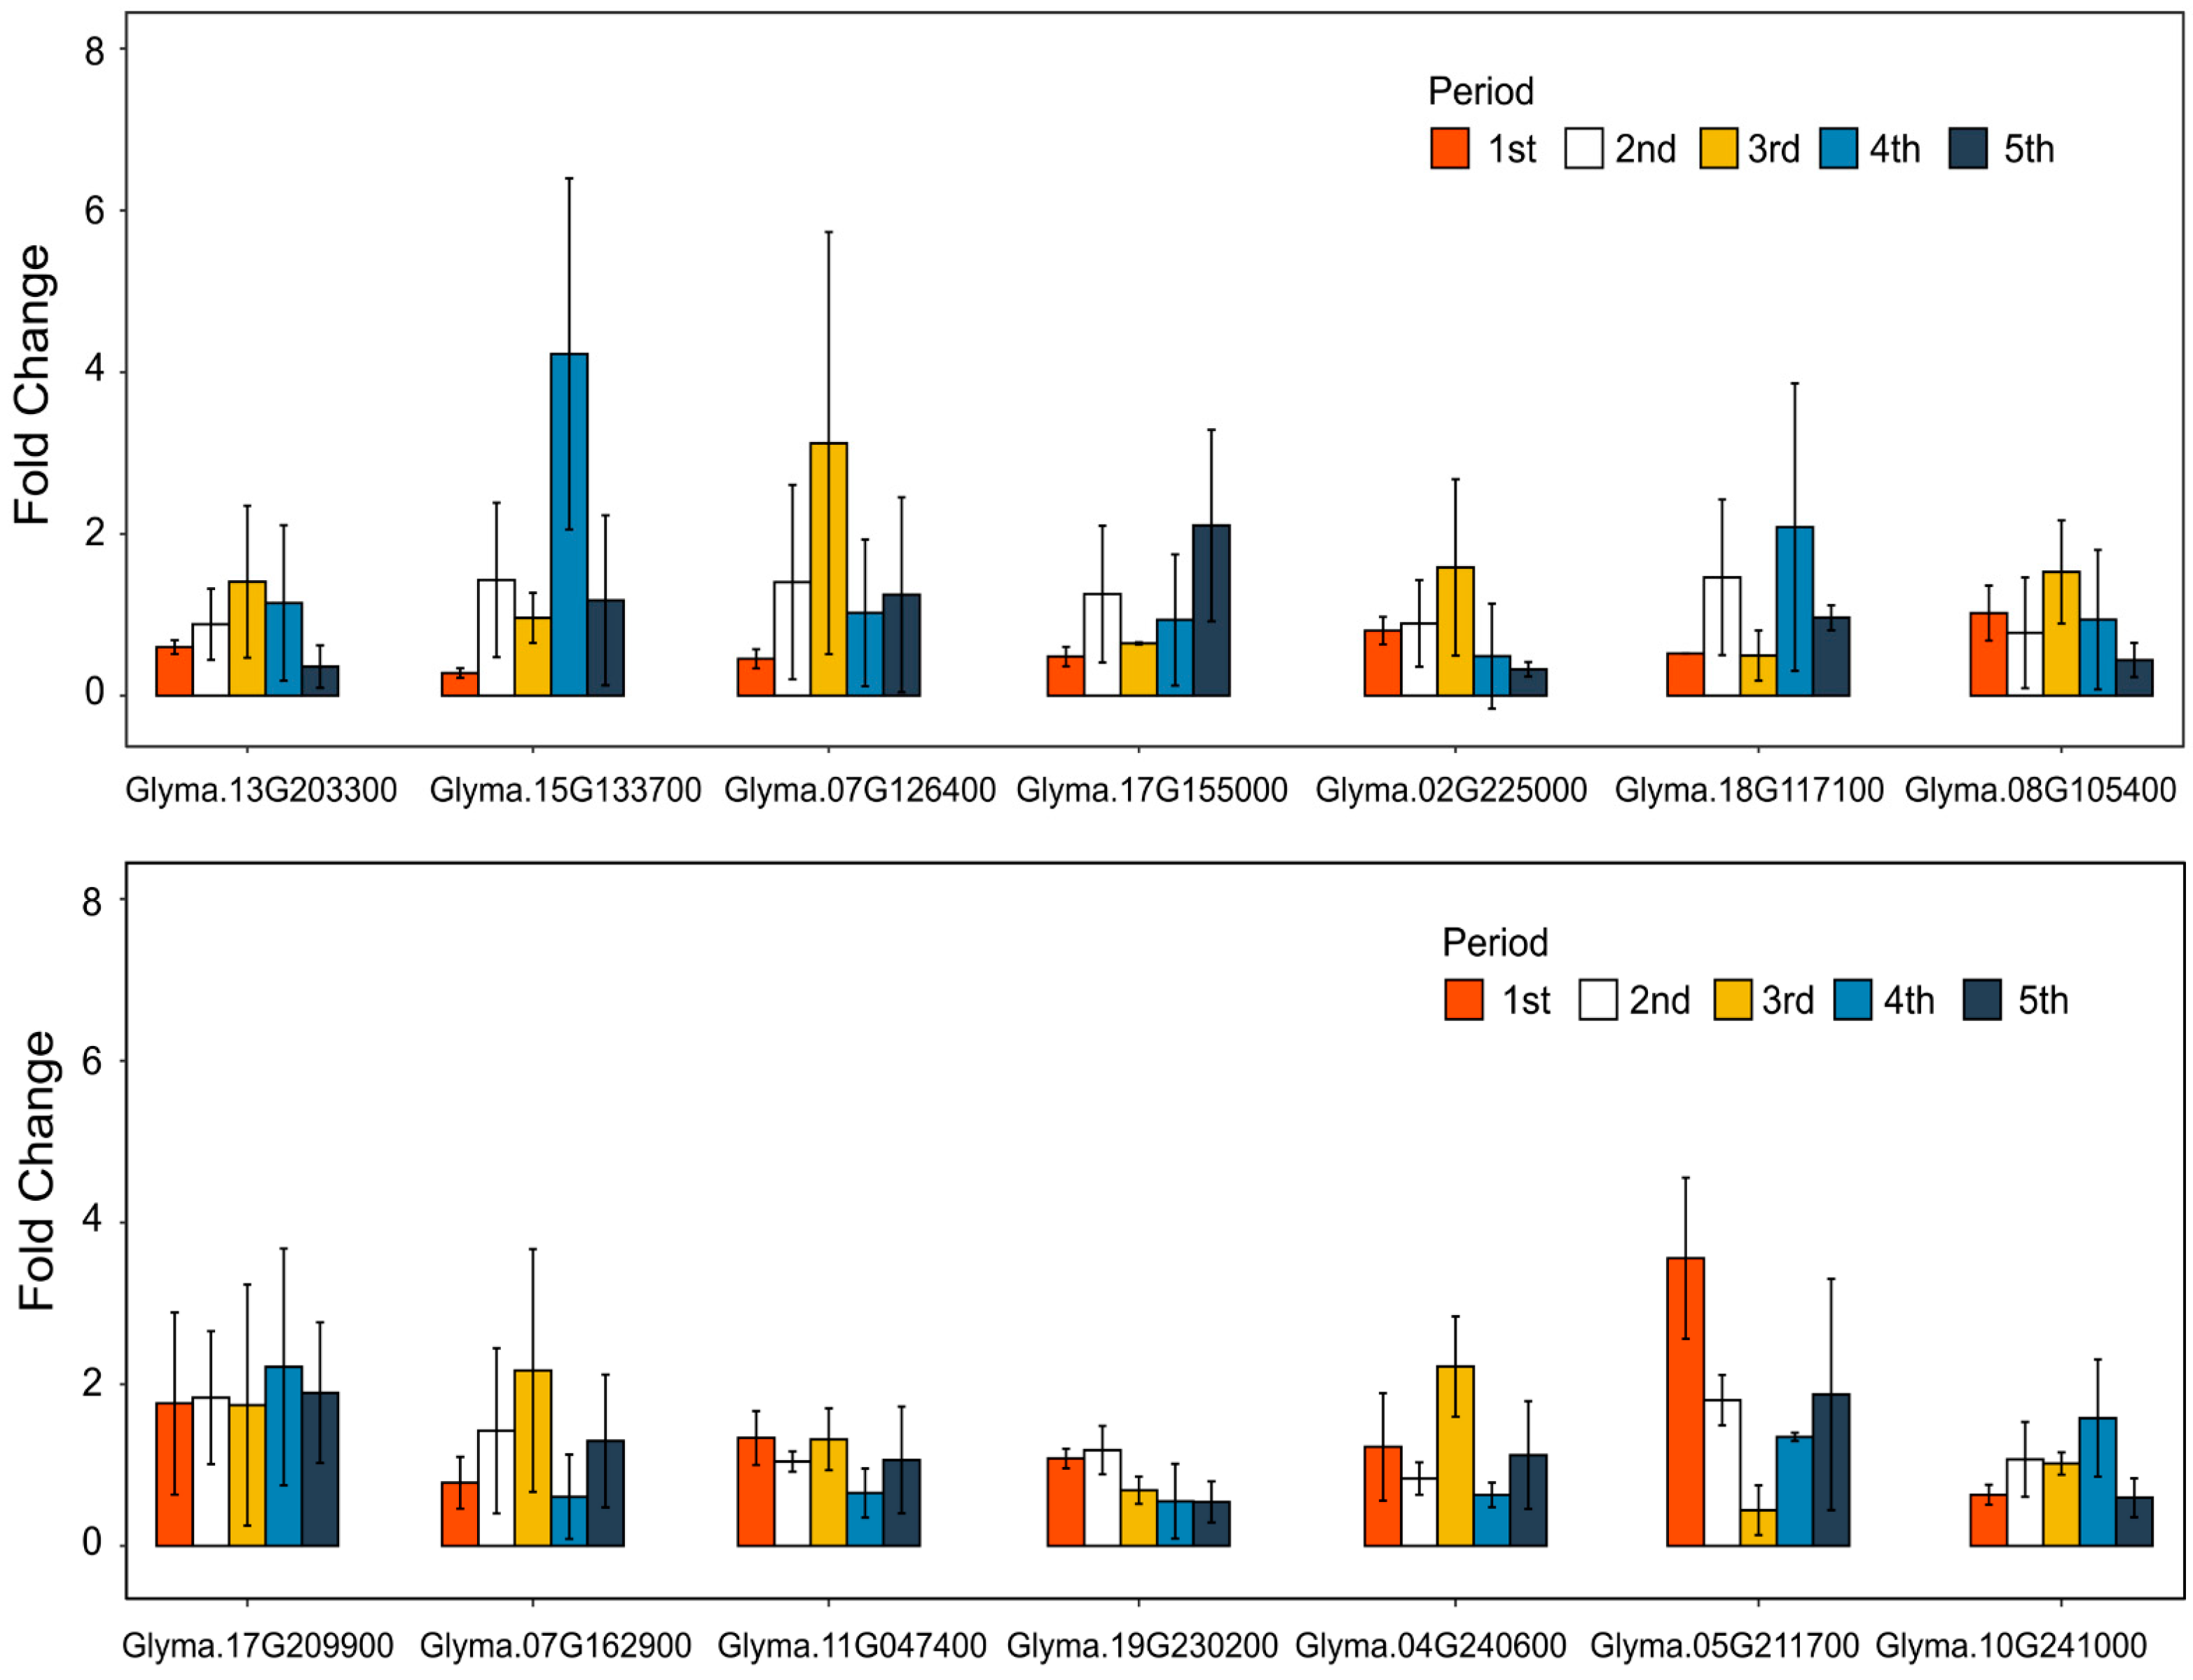
3.6. Quantitative Fluorescence Analysis Revealed the Similar Expression Pattern Contrasted with DEGs among Five Stages

Combining the results of GO enrichment analysis, KEGG enrichment analysis and WGCNA, 14 genes were selected for analyzing expression patterns of GmEOD1 (Figure 6). The results showed that the trends of qRT-PCR gene expression changes of most genes were consistent with those of RNA-seq, though the qRT-PCR results could not remain exactly the same as RNA-seq, indicating that the results of RNA-seq in this study remained high confidence.
Quantitative fluorescence analysis of the target gene in soybean seeds and leaves of T2 homozygous eod1 mutant and WT at different stages (Figure S10) revealed that GmEOD1 was expressed in both seeds and leaves. The expression of GmEOD1 in stage “before” was on a high level, and then gradually decreased during the stages one–two in which the seeds started to grow, and the expression increased during the stages two–fourth. Stage four had the highest ploidy, and then, the expression decreased again during stage five. The expression level of GmEOD1 gradually decreased in the stages one–two, increased in the stages two–four, was at the highest expression in the stage four, and then decreased in stage five, showing a wave-like change overall. In contrast, the expression of GmEOD1 in seeds showed a bell-shaped change. The expression gradually increased from stage one, reaching the highest level in stage three and then gradually decreasing. This result was confirmed by the number of DEGs in the transcriptome analysis in stage three.

4. Discussion

Seed size is a crucial factor for evolutionary fitness in plants, and it is also an essential agronomic trait in crop domestication [23]. While seed weight and size can be influenced by environmental cues, they are predominantly determined by internal developmental signals from maternal sporophytic and zygotic tissues. In soybean fields, seed size is an important parameter and, therefore, requires further elaboration and diversified study at the molecular level.

4.1. GmEOD1 Negatively Regulated the Seed Size and Maintained the Major Nutritional Physiological Substances

Ubiquitin-specific proteinase 15 (UBP15) acts as a downstream target of the ubiquitin protein receptor DA1 to promote cell proliferation and seed growth [39]. The ubp15/sod2 mutant produces small seeds and organs due to reduced cell proliferation. Glyma.13G259700 is a homologous gene of the Arabidopsis UBP15/SOD2 gene, encoding ubiquitin hydrolase, participating in the transport and metabolism of inorganic ions and other physiological activities, and positively regulating soybean seed size/weight. In this study, we created homozygous eod1 mutant plants using CRISPR/Cas9 technology-mediated genome editing tools. GmEOD1 mutant seeds were significantly larger than the wild-type seeds in terms of 100-seed weight (+15.7%) and seed shape (seed length +4.6%, seed width +8.0%, and seed thickness +7.2%) (Figure 3). This indicates that GmEOD1 has a negative effect on regulating seed size, resulting in significantly larger seeds when the GmEOD1 gene is knocked out. Compared to other seed size regulative genes, GmEOD1 exhibited a medium effect. For instance, RNAi plants with a silenced GmCIF1 transcript in soybeans showed a significant increase in 100-seed weight ranging from approximately 11.11% to 33.33% [40]. Seeds from GmFAD3-silenced soybeans showed an approximately 55% increase in 100-seed weight compared to those of mock-treated or vector-infected plants [41]. Similarly, the GmGA20OX-overexpressing lines in soybeans were apparently 56.20% larger than that of the wild type [42]. Although the seed size of soybeans was significantly enlarged in the above-mentioned studies, there was a certain trade-off effect between plant seed size and number [12]. In our study, the seed number and seed weight per plant were not significantly varied in the eod1 mutant compared to those of the control, indicating that the yield did not seem to be significantly enhanced. Moreover, the pot trials in this study lacked consistency in density for the identification of yield traits, and further field trials with uniform sowing density are needed for yield testing.
The amount of bioactive substances and nutrients determined the product quality of soybean resource [43]. In our study, the crude protein content of the eod1 mutant seeds was around 4.97% higher compared to the WT while the crude oil content was slightly reduced by 2.38% (Figure 3). It is reasonable to observe an inverse relationship between seed protein and oil concentration, where an increase in one component leads to a reduction in the other, the sum of the crude protein and oil increased significantly in mutants [44]. However, this variation pattern appears to differ from previous findings, where GmSWEET10a conferred simultaneous increases in soybean seed size and oil content but a reduction in protein content [9]. While it has been reported that the enlarged soybean seeds have a higher total amount of monounsaturated oils [45], there were no differences in the main five fatty acid fractions, total fatty acid, or soluble reducing sugar content between the mutant and WT, indicating that the major functional quality and utility of the mutant were maintained during the seed size enlargement. Previous studies have shown that soybean varieties with larger seeds contain lower levels of isoflavones, possibly due to the fact that isoflavones are lower in soybean cotyledons and 5.0–25.0-fold higher in the embryonic axis [46,47]. In this study, the soybean Daidzin content of the eod1 mutant seeds was significantly lower than that of the WT while there were no significant differences in the total soybean isoflavone content and other components. Overall, the eod1 mutant produced a significant increase in seed size without impairing the physiological trait quality of seeds and increasing the edible nutritional value.

4.2. GmEOD1 Enables Seed Development by Regulating Transcriptional Processes

In our study, E3 ubiquitin ligase is responsible for recognizing the lysine of specific target proteins, transferring ubiquitin molecules to the substrate protein during the ubiquitinated degradation [21]. Functional analysis of differentially expressed genes (DEGs) associated with five developmental stages of soybean seeds revealed that the most significant biological processes in GO enrichment analysis during the 1st stage were related to cyclin-dependent protein, photosynthesis, light harvesting, cell wall, and other processes (Table 1). These changes occurred during the first 10 days of early growth (R5 stage), when the seeds were still developing and cells were completing differentiation and proliferating substantially. Although seeds are not the main organ of photosynthesis, they are still capable of photosynthesis during this stage, providing carbon sources and intermediate substances for the synthesis of other nutrients such as sucrose and fatty acids [48]. During the third stage, the most significant biological processes of GO enrichment analysis mainly focused on cell proliferation, beta-glucan metabolic processes, and protein metabolic processes (Table 2). This indicated that the metabolic processes of sugars and proteins were gradually becoming more active with the increasing seed size during the middle seed development stages. For example, sucrose synthesized by plants is degraded to glucose and fructose by the action of enzymes, and then, pyruvate is produced through the process of glycolysis. Acetyl CoA is produced by the action of pyruvate dehydrogenase, followed by the synthesis of fatty acids [49]. Significant biological processes during the fourth stage mainly focused on xyloglucan metabolic processes and nutrient pool activities. Xyloglucan is a component of hemicellulose in the plant cell wall, with the main chain being cellulose and the side chains being oligosaccharides linked by a small number of xylose. The main components of plant cell walls are cellulose, hemicellulose, and structural proteins. Although seed size is determined by both endosperm and embryo development, it may also be related to the process of endosperm cellulification. Specifically, early endosperm cell fibrosis produces smaller seeds while delayed endosperm cellularization causes larger seeds in pods [23,50]. Therefore, changes in hemicellulose metabolism during late seed development may be associated with seed size growth. Another reason for the developmental differences in seed size may be that the seeds in the fourth stage were in transition between the R6 bulging stage and the early R7 maturation stage of soybean reproduction. This is accompanied by a gradual decrease in the water content of seeds and an increase in the proportion of nutrients. Moreover, the ubiquitin protein receptor DA1 contains two conserved ubiquitin-interacting motifs and a LIM-binding domain, which has protease activity and helps to regulate the activity of downstream substrates. The E3 ubiquitin ligase EOD/BB can activate DA1 activity to synergistically control seed size by cleaving downstream substrates [24]. Loss of function of the target gene GmEOD1 may lead to changes in gene function in mutants. Thus, further gene function analysis of the eod1 mutant at the gene expression level is needed.

4.3. The Natural Variation of GmEOD1 Is Related to Seed Weight

Many genes have been identified to participate in the regulation of seed size and weight, including those involved in the developmental processes of the seed coat, embryo, and endosperm [3,22]. Among them, several genes control the growth potential of the seed coat by regulating the proliferation and extension of integument cells [29]. For example, the KIX-PPD-MYC complex inhibits the expression of GIF1 by binding to the typical G-box sequence in its promoter, which, in turn, inhibits the proliferation and extension of integument cells and negatively regulates seed size [51]. Studies have shown that 40% of cultivated soybean varieties lack the PP2C-1 (Glyma.17g33690) allele, which is associated with the key transcription factor GmBZR1 (Glyma.17g36730) of brassinolide (BR) signal transduction [52]. Transgenic PP2C-1 has been found to significantly increase soybean seed size by promoting the accumulation of GmBZR1 dephosphorylation and enhancing integument cell size [52]. Therefore, the introduction of this allele may be applied to the improvement of soybean varieties, leading to better appearance quality. In our study, multiple SNP alleles of GmEOD1 in both promoter and genomic regions suggested that genomic variations and the regulation of gene expression of GmEOD1 may contribute to seed weight. Notably, the rare Hap2 of GmEOD1 showed relatively early maturity and most of these varieties were bred for high latitude regions in China, suggesting that GmEOD1-Hap2 may have contributed to the larger seed weight of soybeans (Figure 4). To improve soybean varieties, it is effective to modify genes in different organ developmental processes or the plant hormone-related pathways. The overexpression of positive regulation or knock out/down of negative inhibition genes are both effective strategies [29]. For example, seed size/weight can be enhanced by overexpressing GA20OX, which encodes an enzyme in the rate-limiting step of gibberellin biosynthesis, or NFYA, which encodes a transcription factor [44]. The down-regulation of BIG SEEDS1 (BS1) orthologs in soybeans by an artificial microRNA significantly increased soybean seed size and weight [53]. However, it may be difficult to break through the trade-off effect of seed size/weight and seed number. Therefore, modifying potential target genes on major cultivars will be a promising goal in the future soybean breeding using whole genome selection, genome editing, artificial intelligence, biosynthesis, and other cutting-edge technologies to generate or screen out the elite germplasms.

5. Conclusions

In conclusion, our study has successfully demonstrated the efficacy of CRISPR/Cas9-mediated targeted mutagenesis of GmEOD1 in enhancing soybean seed size. The resulting mutant displayed larger seeds and increased 100-seed weight without compromising plant productivity. This holds promise for improving yield and nutritional content in soybeans. The exploration of GmEOD1 sequence variations among different cultivars establishes a link between specific haplotypes and higher 100-seed weight, indicating the potential for targeted breeding efforts. Our transcriptomic analysis highlighted distinct gene expression patterns during seed development, revealing stages dedicated to growth, carbon accumulation, and nutrient storage. The identification of key regulatory genes through WGCNA provides valuable insights into the complex genetic regulation of seed size. Overall, this study provides essential groundwork and valuable resources for enhancing soybean seed size through molecular breeding strategies, offering opportunities for sustainable agricultural improvements and better quality soybean production.

Supplementary Materials

The following supporting information can be downloaded at: https://www.mdpi.com/article/10.3390/agronomy13092359/s1, Table S1. Primer sequence of sgRNA target; Table S2. Primer sequence of sgRNA target; Table S3. The haplotype classification of GmFT4 and maturity groups of representative soybean cultivars; Table S4. Methods for determination of substances related to seed development; Table S5. Seed sampling dates and growth periods; Table S6. Potential off-target analysis at the site of GmEOD1; Table S7. Changes of gene GmEOD1 in different stages; Table S8. Significant KEGG enrichment analysis of differential genes; Figure S1. GmEOD1-CRISPR/Cas9 vector map; Figure S2. PCR detection of GmEOD1-SP1 vector. M, D2000 Plus marker. -, Negative control. 1-10, PCR products of GmEOD1-SP1 bacterial broth. +, Positive control; Figure S3. Seed samplings of 5 stages of eod1 mutant and wild-type (WT) plants; Figure S4. Expression levels of GmEOD1 among different tissues. Figure S5. Molecular phylogenetic analysis of EOD1 gene in soybean (Red triangle, target gene; Blue square, wild-type soybean genes; Others, cultivated soybean genes); Figure S6. The scatter plot of DEGs in KEGG enrichment analysis of periods 1-5; Figure S7. Gene cluster diagram and module detecting; Figure S8. Module and trait diagram; Figure S9. Co-expression network analysis of hub genes in 4 modules (A, black; B, magenta; C, blue; D, pink); Figure S10. Quantitative expression of GmEOD1 in leaves and seeds respectively. (a) Leaves; (b) Seeds.

Author Contributions

Conceptualization, S.Y. and L.C.; Gene cloning, S.Y. and J.Z.; Soybean genetic transformation, L.C., Y.C., and J.D.; Phenotypic investigation, H.Y., J.Z., and C.X.; Physiological analysis: H.Y.; Genomic variation analysis, T.W. and B.J.; Writing—original draft preparation, H.Y., J.Z., and S.Y.; Writing—review and editing, S.S., L.C., and T.H. All authors have read and agreed to the published version of the manuscript.

Funding

This research was funded by National Natural Science Foundation, 32001566; China Agriculture Research System, CARS-04.

Data Availability Statement

Not applicable.

Acknowledgments

We express our gratitude to Yanjie Liu for graciously providing the site for phenotypic testing. We would also like to extend our thanks to Jinlu Tao, Yanfeng Zhou, Haiyan Zeng, Lingna Liu, and Meiyu Duan for their invaluable assistance during the phenotypic investigation.

Conflicts of Interest

The authors declare no conflict of interest.

References

  1. Kato, S.; Sayama, T.; Fujii, K.; Yumoto, S.; Kono, Y.; Hwang, T.-Y.; Kikuchi, A.; Takada, Y.; Tanaka, Y.; Shiraiwa, T. A major and stable QTL associated with seed weight in soybean across multiple environments and genetic backgrounds. Theor. Appl. Genet. 2014, 127, 1365–1374. [Google Scholar] [CrossRef] [PubMed]
  2. Stupar, R.M. Into the wild: The soybean genome meets its undomesticated relative. Proc. Natl. Acad. Sci. USA 2010, 107, 21947–21948. [Google Scholar] [CrossRef] [PubMed]
  3. Liu, S.; Zhang, M.; Feng, F.; Tian, Z. Toward a “green revolution” for soybean. Mol. Plant 2020, 13, 688–697. [Google Scholar] [CrossRef]
  4. Ray, D.D.; Sen, S.; Bhattacharyya, P.; Bhattacharyya, S. Study on seed size variation in soybean (Glycine max L. Merr.) and its correlation with yield. Int. J. Econ. Plants 2022, 9, 204–209. [Google Scholar]
  5. Ray, D.K.; Mueller, N.D.; West, P.C.; Foley, J.A. Yield trends are insufficient to double global crop production by 2050. PLoS ONE 2013, 8, e66428. [Google Scholar] [CrossRef]
  6. Smith, T.; Camper, H., Jr. Effects of seed size on soybean performance. Agron. J. 1975, 67, 681–684. [Google Scholar] [CrossRef]
  7. Hu, Z.; Zhang, H.; Kan, G.; Ma, D.; Zhang, D.; Shi, G.; Hong, D.; Zhang, G.; Yu, D. Determination of the genetic architecture of seed size and shape via linkage and association analysis in soybean (Glycine max L. Merr.). Genetica 2013, 141, 247–254. [Google Scholar] [CrossRef]
  8. Sharma, S.; Kaur, M.; Goyal, R.; Gill, B. Physical characteristics and nutritional composition of some new soybean (Glycine max (L.) Merrill) genotypes. J. Food Sci. Technol. 2014, 51, 551–557. [Google Scholar] [CrossRef]
  9. Wang, S.; Liu, S.; Wang, J.; Yokosho, K.; Zhou, B.; Yu, Y.-C.; Liu, Z.; Frommer, W.B.; Ma, J.F.; Chen, L.-Q. Simultaneous changes in seed size, oil content and protein content driven by selection of SWEET homologues during soybean domestication. Natl. Sci. 2020, 7, 1776–1786. [Google Scholar] [CrossRef]
  10. Sundaresan, V. Control of seed size in plants. Proc. Natl. Acad. Sci. USA 2005, 102, 17887–17888. [Google Scholar] [CrossRef]
  11. Sedbrook, J.C.; Phippen, W.B.; Marks, M. New approaches to facilitate rapid domestication of a wild plant to an oilseed crop: Example pennycress (Thlaspi arvense L.). Plant Sci. 2014, 227, 122–132. [Google Scholar] [CrossRef] [PubMed]
  12. Venable, D.L. Size-number trade-offs and the variation of seed size with plant resource status. Am. Nat. 1992, 140, 287–304. [Google Scholar] [CrossRef]
  13. Jakobsson, A.; Eriksson, O. A comparative study of seed number, seed size, seedling size and recruitment in grassland plants. Oikos 2000, 88, 494–502. [Google Scholar] [CrossRef]
  14. Jin, J.; Liu, X.; Wang, G.; Liang, M.; Shen, Z.; Chen, X.; Herbert, S.J. Agronomic and physiological contributions to the yield improvement of soybean cultivars released from 1950 to 2006 in Northeast China. Field Crops Res. 2010, 115, 116–123. [Google Scholar] [CrossRef]
  15. Ainsworth, E.A.; Yendrek, C.R.; Skoneczka, J.A.; Long, S.P. Accelerating yield potential in soybean: Potential targets for biotechnological improvement. Plant Cell Environ. 2012, 35, 38–52. [Google Scholar] [CrossRef] [PubMed]
  16. Gnan, S.; Priest, A.; Kover, P.X. The genetic basis of natural variation in seed size and seed number and their trade-off using Arabidopsis thaliana MAGIC lines. Genetics 2014, 4, 1751–1758. [Google Scholar] [CrossRef] [PubMed]
  17. Chen, Y.; Nelson, R.L. Genetic Variation and Relationships among Cultivated, Wild, and Semiwild Soybean. Crop Sci. 2004, 44, 316–325. [Google Scholar] [CrossRef]
  18. Amparo, L.; Larrinaga, A.R.; Robert, B. A multi-level test of the seed number/size trade-off in two Scandinavian communities. PLoS ONE 2018, 13, e0201175. [Google Scholar]
  19. Savadi, S. Molecular regulation of seed development and strategies for engineering seed size in crop plants. Plant Growth Regul. 2018, 84, 401–422. [Google Scholar] [CrossRef]
  20. Zhou, B.; Zeng, L. Conventional and unconventional ubiquitination in plant immunity. Mol. Plant Pathol. 2017, 18, 1313–1330. [Google Scholar] [CrossRef]
  21. Qin, T.; Liu, S.; Zhang, Z.; Sun, L.; He, X.; Lindsey, K.; Zhu, L.; Zhang, X. GhCyP3 improves the resistance of cotton to Verticillium dahliae by inhibiting the E3 ubiquitin ligase activity of GhPUB17. Plant Mol. Biol. 2019, 99, 379–393. [Google Scholar] [CrossRef] [PubMed]
  22. Li, N.; Li, Y. Signaling pathways of seed size control in plants. Curr. Opin. Plant Biol. 2016, 33, 23–32. [Google Scholar] [CrossRef] [PubMed]
  23. Li, N.; Xu, R.; Li, Y. Molecular networks of seed size control in plants. Annu. Rev. Plant Biol. 2019, 70, 435–463. [Google Scholar] [CrossRef] [PubMed]
  24. Li, Y.; Zheng, L.; Corke, F.; Smith, C.; Bevan, M.W. Control of final seed and organ size by the DA1 gene family in Arabidopsis thaliana. Genes Dev. 2008, 22, 1331–1336. [Google Scholar] [CrossRef] [PubMed]
  25. Dong, H.; Dumenil, J.; Lu, F.-H.; Na, L.; Vanhaeren, H.; Naumann, C.; Klecker, M.; Prior, R.; Smith, C.; McKenzie, N. Ubiquitylation activates a peptidase that promotes cleavage and destabilization of its activating E3 ligases and diverse growth regulatory proteins to limit cell proliferation in Arabidopsis. Genes Dev. 2017, 31, 197–208. [Google Scholar] [CrossRef]
  26. Disch, S.; Anastasiou, E.; Sharma, V.K.; Laux, T.; Fletcher, J.C.; Lenhard, M. The E3 ubiquitin ligase BIG BROTHER controls Arabidopsis organ size in a dosage-dependent manner. Curr. Biol. 2006, 16, 272–279. [Google Scholar] [CrossRef]
  27. Li, N.; Li, Y. Ubiquitin-mediated control of seed size in plants. Front. Plant Sci. 2014, 5, 332. [Google Scholar] [CrossRef]
  28. Eloy, N.B.; Gonzalez, N.; Van Leene, J.; Maleux, K.; Vanhaeren, H.; De Milde, L.; Dhondt, S.; Vercruysse, L.; Witters, E.; Mercier, R. SAMBA, a plant-specific anaphase-promoting complex/cyclosome regulator is involved in early development and A-type cyclin stabilization. Proc. Natl. Acad. Sci. USA 2012, 109, 13853–13858. [Google Scholar] [CrossRef]
  29. Vanhaeren, H.; Inzé, D.; Gonzalez, N. Plant growth beyond limits. Trends Plant Sci. 2016, 21, 102–109. [Google Scholar] [CrossRef]
  30. Tamura, K.; Nei, M.; Kumar, S. Prospects for inferring very large phylogenies by using the neighbor-joining method. Proc. Natl. Acad. Sci. USA 2004, 101, 11030–11035. [Google Scholar] [CrossRef]
  31. Kumar, S.; Stecher, G.; Tamura, K. MEGA7: Molecular evolutionary genetics analysis version 7.0 for bigger datasets. Mol. Biol. Evol. 2015, 33, 1870–1874. [Google Scholar] [CrossRef] [PubMed]
  32. Lei, Y.; Lu, L.; Liu, H.Y.; Li, S.; Xing, F.; Chen, L.L. CRISPR-P: A Web Tool for Synthetic Single-Guide RNA Design of CRISPR-System in Plants. Mol. Plant 2014, 7, 1494–1496. [Google Scholar] [CrossRef]
  33. Chen, L.; Cai, Y.; Liu, X.; Yao, W.; Guo, C.; Sun, S.; Wu, C.; Jiang, B.; Han, T.; Hou, W. Improvement of soybean Agrobacterium-mediated transformation efficiency by adding glutamine and asparagine into the culture media. Int. J. Mol. Sci. 2018, 19, 3039. [Google Scholar] [CrossRef] [PubMed]
  34. Zhang, L.-X.; Wei, L.; Tsegaw, M.; Xin, X.; QI, Y.-P.; Sapey, E.; Liu, L.-P.; Wu, T.-T.; Shi, S.; Han, T.-F. Principles and practices of the photo-thermal adaptability improvement in soybean. J. Integr. Agric. 2020, 19, 295–310. [Google Scholar] [CrossRef]
  35. Liu, L.; Song, W.; Wang, L.; Sun, X.; Qi, Y.; Wu, T.; Sun, S.; Jiang, B.; Wu, C.; Hou, W. Allele combinations of maturity genes E1-E4 affect adaptation of soybean to diverse geographic regions and farming systems in China. PLoS ONE 2020, 15, e0235397. [Google Scholar] [CrossRef] [PubMed]
  36. Li, B.; Dewey, C.N. RSEM: Accurate transcript quantification from RNA-Seq data with or without a reference genome. BMC Bioinform. 2011, 12, 323. [Google Scholar] [CrossRef]
  37. Yu, G. Statistical analysis and visualization of functional profiles for genes and gene clusters. J. Integr. Biol. 2012, 16, 284–287. [Google Scholar]
  38. Langfelder, P.; Horvath, S. WGCNA: An R package for weighted gene co-expression network analysis. BMC Bioinform. 2008, 9, 559. [Google Scholar] [CrossRef]
  39. Du, L.; Li, N.; Chen, L.; Xu, Y.; Li, Y.; Zhang, Y.; Li, C.; Li, Y. The ubiquitin receptor DA1 regulates seed and organ size by modulating the stability of the ubiquitin-specific protease UBP15/SOD2 in Arabidopsis. Plant Cell 2014, 26, 665–677. [Google Scholar] [CrossRef]
  40. Tang, X.; Su, T.; Han, M.; Wei, L.; Wang, W.; Yu, Z.; Xue, Y.; Wei, H.; Du, Y.; Greiner, S. Suppression of extracellular invertase inhibitor gene expression improves seed weight in soybean (Glycine max). J. Exp. Bot. 2017, 68, 469–482. [Google Scholar] [CrossRef]
  41. Singh, A.K.; Fu, D.-Q.; El-Habbak, M.; Navarre, D.; Ghabrial, S.; Kachroo, A. Silencing genes encoding omega-3 fatty acid desaturase alters seed size and accumulation of Bean pod mottle virus in soybean. Mol. Plant Microbe Interact. 2011, 24, 506–515. [Google Scholar] [CrossRef] [PubMed]
  42. Lu, X.; Li, Q.T.; Xiong, Q.; Li, W.; Bi, Y.D.; Lai, Y.C.; Liu, X.L.; Man, W.Q.; Zhang, W.K.; Ma, B. The transcriptomic signature of developing soybean seeds reveals the genetic basis of seed trait adaptation during domestication. Plant J. 2016, 86, 530–544. [Google Scholar] [CrossRef] [PubMed]
  43. Goyal, R.; Sharma, S.; Gill, B. Variability in the nutrients, antinutrients and other bioactive compounds in soybean [Glycine max (L.) Merrill] genotypes. J. Food Legumes 2012, 25, 314–320. [Google Scholar]
  44. Panthee, D.; Pantalone, V.; West, D.; Saxton, A.; Sams, C. Quantitative trait loci for seed protein and oil concentration, and seed size in soybean. Crop Sci. 2005, 45, 2015–2022. [Google Scholar] [CrossRef]
  45. Kering, M.K.; Zhang, B. Effect of priming and seed size on germination and emergence of six food-type soybean varieties. Int. J. Agron. 2015, 2015, 859212. [Google Scholar] [CrossRef]
  46. Ribeiro, M.; Mandarino, J.; CarrÃO-Panizzi, M.; Oliveira, M.; Campo, C.; Nepomuceno, A.; Ida, E. β-glucosidase activity and isoflavone content in germinated soybean radicles and cotyledons. J. Food Biochem. 2006, 30, 453–465. [Google Scholar] [CrossRef]
  47. Yuan, J.-P.; Liu, Y.-B.; Peng, J.; Wang, J.-H.; Liu, X. Changes of isoflavone profile in the hypocotyls and cotyledons of soybeans during dry heating and germination. J. Agric. Food Chem. 2009, 57, 9002–9010. [Google Scholar] [CrossRef]
  48. Tschiersch, H.; Borisjuk, L.; Rutten, T.; Rolletschek, H. Gradients of seed photosynthesis and its role for oxygen balancing. Biosystems 2011, 103, 302–308. [Google Scholar] [CrossRef]
  49. Ke, J.; Behal, R.H.; Back, S.L.; Nikolau, B.J.; Wurtele, E.S.; Oliver, D.J. The role of pyruvate dehydrogenase and acetyl-coenzyme A synthetase in fatty acid synthesis in developing Arabidopsis seeds. Plant Physiol. 2000, 123, 497–508. [Google Scholar] [CrossRef]
  50. Cheng, Z.J.; Zhao, X.Y.; Shao, X.X.; Wang, F.; Zhou, C.; Liu, Y.G.; Zhang, Y.; Zhang, X.S. Abscisic acid regulates early seed development in Arabidopsis by ABI5-mediated transcription of SHORT HYPOCOTYL UNDER BLUE1. Plant Cell 2014, 26, 1053–1068. [Google Scholar] [CrossRef]
  51. Liu, Z.; Li, N.; Zhang, Y.; Li, Y. Transcriptional repression of GIF1 by the KIX-PPD-MYC repressor complex controls seed size in Arabidopsis. Nat. Commun. 2020, 11, 1846. [Google Scholar] [CrossRef] [PubMed]
  52. Lu, X.; Xiong, Q.; Cheng, T.; Li, Q.-T.; Liu, X.-L.; Bi, Y.-D.; Li, W.; Zhang, W.-K.; Ma, B.; Lai, Y.-C. A PP2C-1 allele underlying a quantitative trait locus enhances soybean 100-seed weight. Mol. Plant 2017, 10, 670–684. [Google Scholar] [CrossRef] [PubMed]
  53. Ge, L.; Yu, J.; Wang, H.; Luth, D.; Bai, G.; Wang, K.; Chen, R. Increasing seed size and quality by manipulating BIG SEEDS1 in legume species. Proc. Natl. Acad. Sci. USA 2016, 113, 12414–12419. [Google Scholar] [CrossRef] [PubMed]
Figure 1. GmEOD1 gene structure and CRISPR/Cas9 target sequence (a) and homozygous targeted mutagenesis of GmEOD1 induced by CRISPR/Cas9 (b). The orange bands represent exons; the black lines represent introns; the underline represents the target sequence (named GmEOD1-SP1); the red letters are PAM sequences, i.e., archetypal interval sequences adjacent to motifs. The red arrow indicated the insertion of A nucleotide.
Agronomy 13 02359 g001
Figure 2. Mature seed (R8) phenotypes of eod1 and WT plants. (a) Phenotypes of eod1 mutant and WT plants. Red box, local close-up. (b,c) Phenotypes and mature seeds of eod1 and WT plants, respectively.
Agronomy 13 02359 g002
Figure 3. Analysis of seed size related agronomic traits (a) and physiological traits including protein, oil, soluble sugar and isoflavone contents (b) and five major fatty acid contents (c) between eod1 mutant and WT. The asterisk (*) indicates statistical significance, p < 0.05; ‘ns’ indicates no significant difference, p > 0.05.
Agronomy 13 02359 g003
Figure 4. Haplotype analysis of 156 varieties of GmEOD1 genome. INS1, the insertion of ACCAAT. INS2, the insertion of TGGAAGAGAGGGAGA.
Agronomy 13 02359 g004
Figure 5. Statistical histogram of the number of differential genes in comparison combinations.
Agronomy 13 02359 g005
Figure 6. qRT-PCR validation of candidate genes in stages 1–5. The x-axis represents the name of 14 candidate genes, y-axis shows the fold change (FC) value increase/decrease in expression level of the genes.
Agronomy 13 02359 g006
Table 1. Differential gene GO enrichment analysis (seed size correlation).
GOGO_IDGO termDEGs (eod1 vs. WT)p Value
1st2nd3rd4th5th
BPGO:0051726regulation of cell cycle43/16860000<0.001
BPGO:0000079regulation of cyclin-dependent protein serine/threonine kinase activity18/16860000<0.001
BPGO:0009765photosynthesis, light harvesting13/16860000<0.001
BPGO:1904029regulation of cyclin-dependent protein kinase activity18/16860000<0.001
BPGO:0048580regulation of post-embryonic development16/16860000<0.001
BPGO:0044264cellular polysaccharide metabolic process0049/201100<0.001
BPGO:0006073cellular glucan metabolic process0047/201100<0.001
BPGO:0044042glucan metabolic process0048/201100<0.001
BPGO:0042446hormone biosynthetic process0025/201100<0.001
BPGO:0010154fruit development0017/201100<0.001
BPGO:0008283cell proliferation0020/201100<0.001
BPGO:0042127regulation of cell proliferation0016/201100<0.001
BPGO:0008284positive regulation of cell proliferation0016/201100<0.001
BPGO:0010383cell wall polysaccharide metabolic process0027/201100<0.001
BPGO:0032269negative regulation of cellular protein metabolic process0031/201100<0.001
BPGO:0051248negative regulation of protein metabolic process0031/201100<0.001
BPGO:0045861negative regulation of proteolysis0013/201100<0.001
BPGO:0051273beta-glucan metabolic process0021/201100<0.001
BPGO:0052548regulation of endopeptidase activity0013/201100<0.001
BPGO:0010411xyloglucan metabolic process00012/1263 <0.001
BPGO:0000272polysaccharide catabolic process00020/12630<0.001
MFGO:0045735nutrient reservoir activity0016/222321/14520<0.001
MFGO:0046527glucosyltransferase activity0048/222300<0.001
MFGO:0016538cyclin-dependent protein serine/threonine kinase regulator activity17/18510000<0.001
CCGO:0005618cell wall48/16280000<0.001
CCGO:0009505plant-type cell wall20/16280000<0.001
Note: BP: biological process; MF: molecular function; CC: cellular component.
Table 2. Hub genes in four modules according to KWithin value and network function.
Gene NameFunctional DescriptionModuleKWithin Value in Module
Glyma.02G059900Protein DA1-related (Coexpressed with genes in roots specific coexpression subnetwork)Blue967.27
Glyma.01G179800Protein DA1-related (Coexpressed with genes in symbiotic leaves specific coexpression subnetwork)Blue684.12
Glyma.11G062400Protein DA1-relatedBlue81.61
Glyma.17G247700Protein DA1 OS (LIM domain)Blue875.54
Glyma.15G024700Nucleosome assembly protein 1-like 4Blue355.85
Glyma.03G088200Polysaccharide lyase family 4, domain III (CBM-like)Blue408.69
Glyma.13G259100E3 ubiquitin-protein ligase DA2Blue879.78
Glyma.15G249000E3 ubiquitin-protein ligase DA2Blue28.21
Glyma.12G057100E3 Ubiquitin ligase BIG BROTHERBlue110.05
Glyma.11G132700E3 Ubiquitin ligase BIG BROTHERBlue15.34
Glyma.15G182600Sucrose synthase 1-relatedPink77.61
Glyma.16G062000Galactose oxidaseBlack75.62
Glyma.11G03280040S Ribosomal protein S30/ubiquitin-like fubi (Co-expressed with genes in roots specific co-expression subnetwork)Magenta68.23
Disclaimer/Publisher’s Note: The statements, opinions and data contained in all publications are solely those of the individual author(s) and contributor(s) and not of MDPI and/or the editor(s). MDPI and/or the editor(s) disclaim responsibility for any injury to people or property resulting from any ideas, methods, instructions or products referred to in the content.

