Article

Threshold Values of Plant Water Status for Scheduling Deficit Irrigation in Early Apricot Trees

by
Abdelmalek Temnani
1,
Pablo Berríos
1,
Susana Zapata-García
1,
Pedro J. Espinosa
2 and
Alejandro Pérez-Pastor
1,*
1
Departamento de Ingeniería Agronómica, Universidad Politécnica de Cartagena (UPCT), Paseo Alfonso XIII, 48, ETSIA, 30203 Cartagena, Spain
2
Europe, Middle East & Africa Region (EMEA) Plant Health Portfolio, FMC Agricultural Solutions, 28046 Madrid, Spain
*
Author to whom correspondence should be addressed.
Agronomy 2023, 13(9), 2344; https://doi.org/10.3390/agronomy13092344
Submission received: 26 August 2023 / Revised: 5 September 2023 / Accepted: 6 September 2023 / Published: 8 September 2023
(This article belongs to the Section Water Use and Irrigation)

Abstract

:
Irrigated agriculture is facing a serious problem of water scarcity, which could be mitigated by optimizing the application of regulated deficit irrigation (RDI) strategies. For this reason, the aim of our study was to determine irrigation thresholds based on direct water status indicators of apricot trees under RDI to maximize water productivity. Three treatments were tested: (i) Control (CTL), irrigated at 100% of the crop evapotranspiration (ETc) during the entire crop cycle; (ii) RDI1, irrigated as CTL, except during fruit growth stages I–II when irrigation was reduced by 20% of CTL, and during late post-harvest, with an irrigation threshold of a moderate water stress of −1.5 MPa of stem water potential (Ψs); and (iii) RDI2, irrigated as RDI1, but during late post-harvest using a severe water stress threshold of −2.0 MPa of Ψs. As the irrigation scheduling of RDI1 and RDI2 did not affect yield and fruit quality, the crop water productivity was increased by 13.2 and 25.6%, respectively. This corresponded to 1124 and 2133 m3 ha−1 of water saved for RDI1 and RDI2. A water stress integral of 30.2 MPa day during post-harvest could be considered optimal since when 41 MPa day was accumulated, vegetative growth was reduced by 35%. The non-sensitive periods to water deficit were delimited by the accumulation of growing degree days (GDD) from full bloom, the end of fruit growth stages I–II corresponded to an accumulation of 640 °C GDD, and the beginning of the late post-harvest to an accumulation of 1840 °C GDD.

1. Introduction

Amongst the stone fruit trees, apricot [Prunus armeniaca L.] is one of the three most prominent worldwide crops, with peach and plum trees, in terms of production surface and water requirements. Although it is cultivated in many countries, approximately half of the world’s production is carried out in Mediterranean areas [1,2]. This is the case of the Region of Murcia in south-eastern Spain, where apricot trees represent almost 8% of the non-citrus fruit production area; and in the last five years, it has remained at approximately 8500 hectares, of which 82.9% have drip irrigation systems [3]. The most extensive cultivar in the region is ‘Búlida’; however, it has a medium flavor quality, so it is mainly destined for the agro-industry. On the other hand, the cultivar ‘Rojo Carlet’ has high flavor quality and medium-sized fruits with a reddish coloring on a yellow background, so its production is almost completely for fresh market [4].
It is widely known that in Mediterranean areas, due to climate change, irrigation water availability will decrease significantly, and the increase in temperatures will imply a higher crop water requirement [5,6,7,8]. The apricot is considered a high-water-requirement crop [9] and its commercial viability is conditioned by the availability of irrigation water [2]. The high evaporative demand of Mediterranean climates and rainfall generally below 300 mm per year, result in a water requirement of approximately 7000 m3 ha−1 per season for the SE Spain [10]. Despite this, it is considered a crop tolerant to water deficit, since it mainly presents avoidance and response mechanisms to maintain leaf turgor [1,11], although this behavior varies considerably depending on the cultivar [12].
The almost permanent water scarcity has caused that apricot cultivation in southeastern Spain to be performed under conditions of water infradotation. This, along with the imperative to reduce pressure over water resources from agriculture and to minimize the environmental impact, highlights the need to incorporate tools and strategies for irrigation scheduling that do not affect yield and fruit quality and maximize the irrigation water productivity. In this sense, the regulated deficit irrigation (RDI), i.e., reduce the water supply during a stage(s) of crop development with low sensitivity to water deficit [13], has been a validated strategy in several stone fruits to reduce water inputs in temperate zones, such as nectarine [14,15], sweet cherry [16,17], peach [18,19,20,21], flat peach [22], plum [23], almond [24,25,26] and apricot trees [1,10]. In apricot trees, the defined periods as sensitive to water deficit are the second rapid fruit growth stage and the early post-harvest, as they reduce fruit size and fruit number for the following season, respectively [1,10,27]. Ezzat et al. [28] indicated that the success of RDI strategies with moderate water stress level applied under semi-arid conditions depends on the cultivar.
To determine the intensity and duration of the RDI regime more precisely, it is necessary to complement the traditional estimation of crop evapotranspiration (ETc) [29] with direct indicators of plant water status [30]. Among the most sensitive indicators to the water regime, soil water availability and evaporative demand are the stem water potential (Ψs) and—up to a certain level of stress—the maximum daily trunk shrinkage (MDS) [31,32,33,34]. Pagán et al. [35] stated in mandarin, that it was possible to apply RDI during the second stage of fruit growth until the slowing of trunk growth. In terms of stress intensity, using the Ψs-based water stress integral (SΨ) [36], we can quantify the stress applied to the crop and thus be able to extrapolate our results to other agroclimatic zones. In this sense, an irrigation threshold of a Ψs of −1.8 MPa and a cumulative SΨ close to 28 MPa day until the fruits reach 60% of their final size should be considered for RDI in mandarin [35,37]. Recently, Temnani et al. [22] stated that in flat peach the non-sensitive period to water deficit would extend until the fruits reach 60% of their size and a cumulative SΨ of 30 MPa per day should be considered in order not to affect the crop sustainability in the medium term. For elaborating thresholds adaptable to other zones, the growing degree days (GDD) accumulation model proposed by Richardson et al. [38] is useful to delimit the specific periods for RDI, sometimes difficult to detect, on a more extrapolable scale.
Since apricot is a crop highly vulnerable to rising temperatures in the context of climate change and site-specific conditions [39], with a high-water requirement, the response to deficit irrigation conditions is cultivar-dependent [12,28] and there is no literature about cv. Rojo Carlet; the aim of our study was to determine irrigation thresholds based on direct indicators of the water status of adult ‘Rojo Carlet’ apricot trees under regulated deficit irrigation in a semi-arid Mediterranean climate to maximize water productivity.

2. Materials and Methods

2.1. Experimental Site and Design

The trial was carried out in a commercial orchard located in Murcia, SE Spain (38°10′26.7″ N, 1°11′49.9″ W) during 2015/16 and 2016/17 seasons. Because floral bud initiation and differentiation occur during the previous post-harvest period and water stress leads to decreased fruit yield in the following year, a season was considered as the period between each year’s harvest [10,40,41]. The plant material consisted of adult apricot [Prunus armeniaca L.] trees ‘Rojo Carlet’. The orchard was established in 2006 in a 7 m × 6 m tree spacing in an open vase training system with a central trunk and four to six main branches from 0.50 m in height. The trees were 3.9 m in height and 6.9 m in canopy diameter.
The climate in the Region of Murcia (1981–2010) is semi-arid Mediterranean type with mild winters and dry and very hot summers, with an average annual temperature close to 22.5 °C, rainfall generally below 300 mm, and a crop reference evapotranspiration (ET0) of 1435 mm [42]. The soil profile from 0 to 0.5 m depth has a clay textural class, 1.28 g cm−3 of bulk density, organic matter content of 0.8%, and a moderately alkaline soil pH of 8.6. The main macronutrients presented low levels at the beginning of this study [43].
The cultural practices (weed control, fertilization, and pruning) were carried out by the technical department following the usual criteria in the area. The nutrient requirement was calculated based on Espada [43] recommendations, which corresponded to an average of 108.5 kg of N, 17.0 kg of P and 147.7 kg of K per ha, without varying the amount between treatments or during the study period.
Trees were drip irrigated by means of one drip irrigation line per tree row, with six self-compensating drippers with a flow rate of 4 L h−1 per tree. The crop evapotranspiration (ETc) was estimated according to the FAO balance as ETc = ET0 × Kc; where, ET0 corresponded to the reference evapotranspiration according to FAO Penman-Monteith, and Kc to the crop coefficients [29], which were adapted from those recommended by Allen et al. [29] and Gómez-Aparisi [44] for adult trees, being, bloom and fruit set: 0.50, pit hardening: 0.70, ripening and harvesting: 0.85, post-harvest: 0.90–0.65. In addition, an irrigation application efficiency of 90% was considered. Irrigation scheduling depended on climatic demand and irrigation time was kept constant between 2.5 and 3.0 h. During autumn and winter (October to March) one to two irrigations per week were made, and in spring/summer (mid-April to September) the irrigation frequency was daily. For each replicate, the water applied was quantified by using volumetric water meters. The electrical conductivity of irrigation water varied between 1.0 and 1.7 dS m−1, according to the source used (irrigation canal, well or a mix of both).
A randomized experimental block trial design was established with three adjacent rows of six trees per block, all the measurements were taken in the trees of the central row, while the other two served as borders. Three treatments with three replicates (n = 3) were tested based on the irrigation regime, trees water status and information derived from Pérez-Pastor et al. [10]:
  • Control (CTL), irrigated at ~100% of the crop evapotranspiration (ETc) during the entire crop cycle.
  • Regulated deficit irrigation 1 (RDI1), irrigated as CTL, except during fruit growth stages I–II when irrigation was reduced by 20% of CTL, and from July onwards in late post-harvest, when an irrigation threshold of approximately −1.5 MPa of stem water potential (Ψs) was used, corresponding to a moderate water stress [10].
  • Regulated deficit irrigation 2 (RDI2), irrigated as CTL, except during fruit growth stages I–II when irrigation was reduced by 20% of CTL, and from July onwards in late post-harvest, when an irrigation threshold of approximately −2.0 MPa of Ψs was used, corresponding to a severe water stress [10].

2.2. Weather Conditions

The climatic data were monitored in real time and obtained from the Murcia region’s agroclimatic stations network. Reference evapotranspiration (ET0; mm), rainfall (mm), relative humidity ( R H ; %) and mean temperature ( t ; °C) were obtained on a daily scale from the ‘MO51: Fortuna’ agrometeorological station [45]. The vapor pressure deficit (VPD; kPa) was calculated using the t and R H based on the equation of Murray [46]; firstly, the saturation vapor pressure ( e s ; kPa) was determined according to the relation e s = 0.611 ( ( 17.27 · t ) / ( t + 237.3 ) ) ; subsequently, the partial vapor pressure ( e ; kPa) was determined as e = ( e s · R H ) / 100 ; and finally, the VPD was calculated as e s e .
The crop phenology was monitored by the model of growing degree day (GDD) [38], considering 7 °C as the base temperature [47] and accumulating from 1 February onwards at full bloom.

2.3. Plant Water Status

The stem water potential at solar midday (Ψs) was measured using a Scholander-type chamber model 3000 (Soil Moisture Equipment Corp., Goleta, CA, USA) every two weeks on four shaded and close to main branches adult leaves per replicate (n = 3 per treatment). Leaves were covered with an aluminized bag 1.5 h before measurement.
The water stress integral for each deficit irrigation treatment was determined with respect to the values of the CTL treatment from Equation (1) [36]:
S Ψ = i = 0 i = i Ψ i , i + 1 Ψ C T L n
where, S Ψ : water stress integral (MPa day); Ψ i , i + 1 : solar midday stem water potential for each time interval i ; Ψ C T L : Ψs of the CTL treatment, and n : number of days between two consecutive measurements.
Trunk diameter fluctuation (TDF) was monitored in two trees per replicate (n = 3 per treatment) using a linear variable displacement transducer (LVDT) sensor model DF (Solartron Metrology, Bognor Regis, UK), installed 30 cm above the soil on the main trunk and mounted on aluminum and invar holders. The TDF-data were acquired every minute and averaged every 15 min. From these, the cumulative weekly trunk growth was calculated, and the maximum daily trunk shrinkage (MDS) as the difference between the maximum and minimum daily trunk diameter [48].

2.4. Yield Parameters and Water Productivity

The evolution of fruit growth was determined by the increase in their equatorial diameter and measurements were made every 15 days on fifty randomly selected fruits per replicate (n = 3 per treatment) using a digital caliper model CD-15D (Mitutoyo Co., Sakado, Japan).
To determine yield, five trees per replicate (n = 3 per treatment) were harvested in each season. Likewise, yield was expressed as kg of fruit with commercial aptitude per tree. Fruit load was expressed as the total number of fruits per tree and fruit fresh weight as the ratio between kg per tree and the number of fruits harvested.
The irrigation water productivity ( W P I ) was determinate as W P I = Y / I W U , where Y : yield (kg ha−1) and I W U : irrigation water (m3 ha−1) [49,50]. In addition, the crop water productivity ( W P C ) was determinate as W P C = Y / T W U , where Y : yield (kg ha−1) and T W U : the total amount of water involved for crop production (m3 ha−1) [49,50]. For this purpose, in addition to the irrigation water, the effective rainfall was considered as an input. It was estimated for dry climates, where rainfalls less than 5 mm does not add water to the soil reserve and on the other hand, only 75% of rainfall greater than 5 mm can be considered as effective [51].

2.5. Fruit Quality Traits

To assess fruit quality at harvest, twenty fruits per replicate were randomly selected (n = 3 per treatment). First, flesh firmness was determined after removing the epidermis of the equatorial zone on both sides of the fruits with a fruit pressure tester model FT-327 (T.R. Turoni, Forlì, Italy) with a piston area of 0.5 cm2. Subsequently, juice chemical analyses were conducted according to Artés et al. [52]. Five juice samples per replicate (n = 3 per treatment) were squeezed and the total soluble solids content (TSS; °Brix) was determined using a hand-held refractometer model N-1E (ATAGO, Tokyo, Japan). The titratable acidity (TA) of these samples were determined by titrating 1 mL of juice with 0.1 mol L−1 NaOH and expressed as a percentage of malic acid. Finally, the maturity index was calculated as the TSS and TA ratio [53].

2.6. Statistical Analysis

Prior to the ANOVA, assumptions were tested: the normality of the error distributions of each dependent variable was evaluated according to the Shapiro–Wilk test (p < 0.05), and the homoscedasticity of the variances was evaluated with the Levene test (p < 0.05), using absolute residuals to minimize the possible effect of outliers and improve the power of the test [54,55,56]. Finally, when significant differences between treatments were detected, means were separated by Duncan’s test (p < 0.05).
To explore the relationships between the cumulative water stress intensity (SΨ) during post-harvest with crop and irrigation water productivity, vegetative growth, as well as with the irrigation water saved (%), the yield, total trunk growth and W P I variables of the deficit irrigated trees were normalized with those obtained in well-irrigated trees for both seasons (n = 3) and finally, simple linear regression curves were elaborated.
All the statistical analysis was carried out using the InfoStat software 2020 and its interface with R 4.0.5 [57].

3. Results

3.1. Weather and Irrigation

During the seasons delimited by each harvest, the accumulated ET0 was 1320 and 1281 mm for 2015/16 and 2016/17, respectively. The maximum evaporative demand was at the beginning of the season and up to mid-late post-harvest in summer (June to September), averaging 5.3 mm day−1 in both seasons. Nevertheless, maximums of up to 7.7 mm day−1 were reached in the early post-harvest. More specifically, the evaporative demand in both seasons averaged 275, 550, 102, 176 and 162 mm during early post-harvest, late post-harvest (RDI period), bloom, fruit growth stages I–II (RDI period) and ripening, respectively. The VPD showed a similar trend to the ET0, although the mean was slightly higher during 2015/16 between June and September, averaging 1.70 kPa, as compared to 1.56 kPa of 2016/17. The maximum values occurred in early post-harvest with 2.38 kPa on average. The accumulated rainfall was 192 and 360 mm for 2015/16 and 2016/17. Although the volume of rainfall was higher in the last season, almost 60% of this occurred during the winter dormancy period (Figure 1A). In terms of effective rainfall, it was 115 and 241 mm for 2015/16 and 2016/17, being in both seasons approximately 60–65% of the total.
The CTL treatment was irrigated with 6664 and 6385 m3 ha−1 in 2015/16 and 2016/17, respectively. In 2015/16, RDI1 and RDI2 treatments saved almost 10 and 20% of the water used in CTL. In contrast, in 2016/17 the savings were higher, reaching 17.6 and 33.4% for RDI1 and RDI2 (Figure 1B). The average water saved during this period was 663 and 1424 m3 ha−1 for RDI1 and RDI2. In contrast, during stages I–II of fruit growth (early March to late April), only an average reduction of 140 m3 ha−1 was achieved in both treatments (Figure 2C).

3.2. Plant Water Status

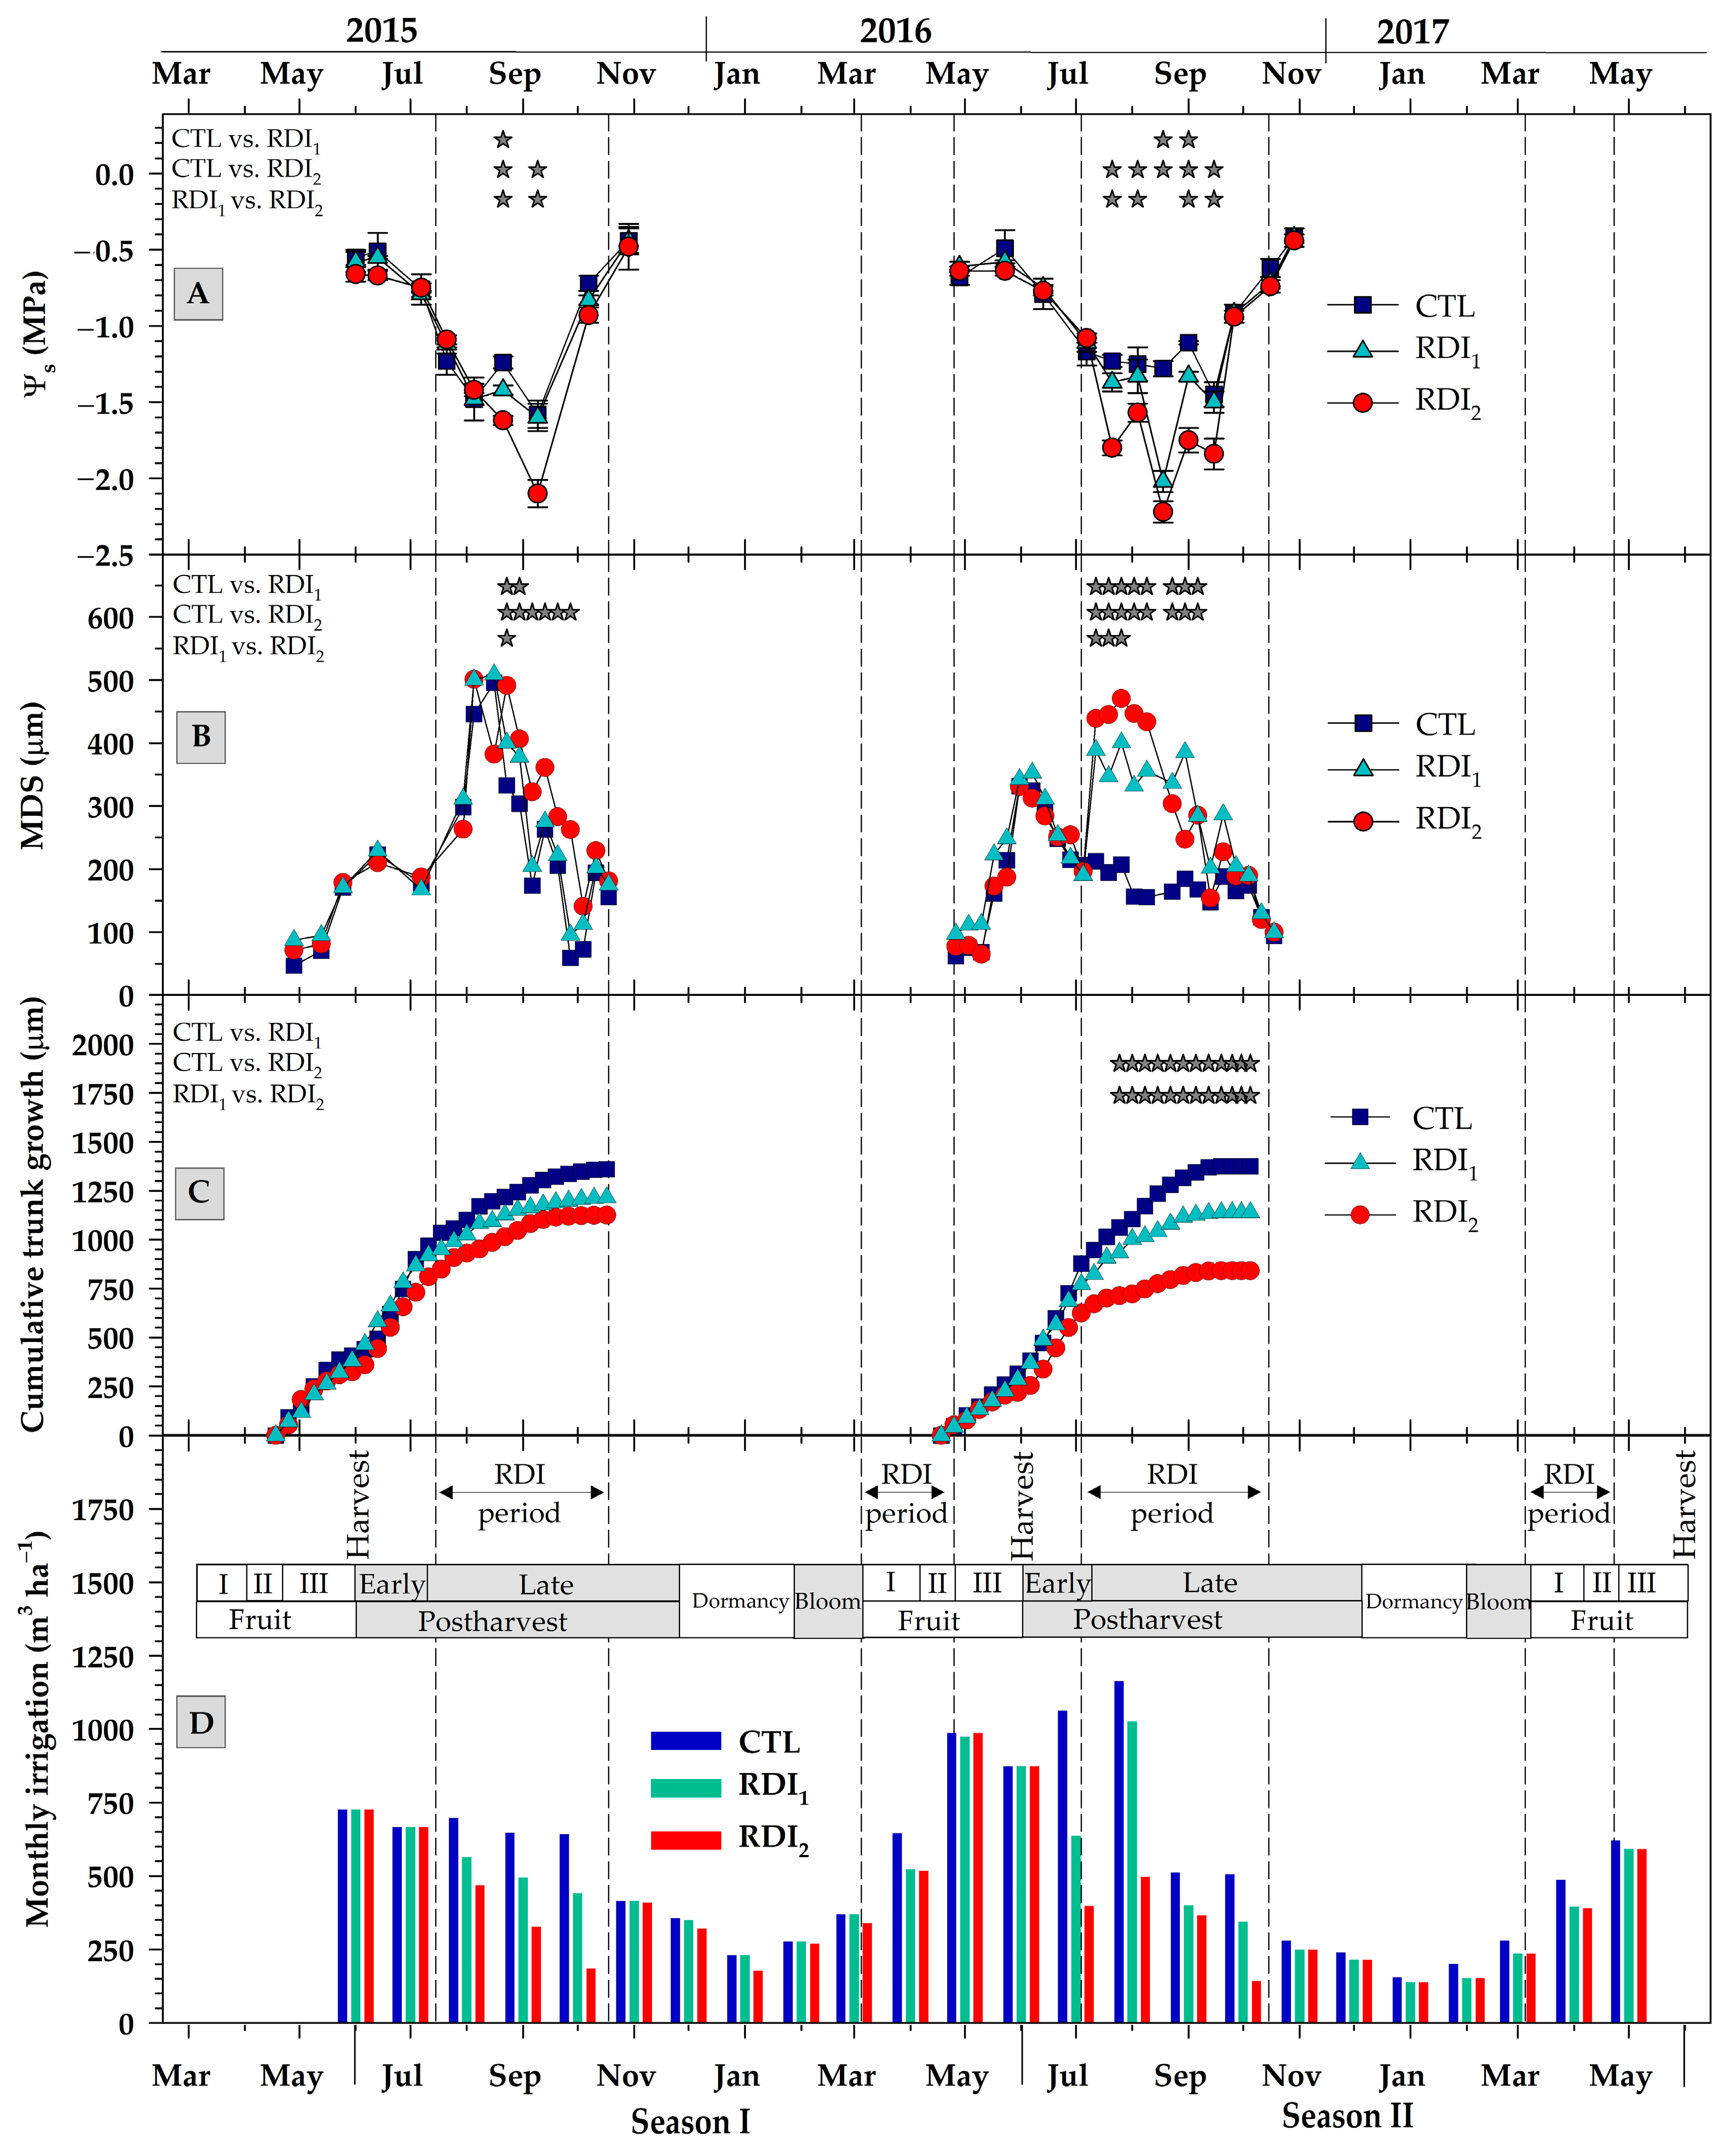
The Ψs varied according to the evaporative demand and the degree of irrigation reduction in the deficit irrigated treatments (Figure 2A). The Ψs average of CTL treatment was approximately −1.0 MPa for both seasons. The values ranged from −0.4 MPa immediately after harvest and prior to winter dormancy, to minimums approximately −1.4 MPa (2015/16) and −1.2 MPa (2016/17) at mid-post-harvest in summer (August). During the water deficit period of the first season, Ψs average was −1.3 and −1.5 MPa, for RDI1 and RDI2, respectively; while in the second season, the values reached were −1.4 and −1.6 MPa. It should be noted that during most of the water deficit period during the study period, the two RDI treatments showed values closer to the pre-established thresholds, −1.5 and −1.52 MPa for RDI1, and −1.75 and −1.82 MPa for RDI2, respectively, in each of the two seasons (Figure 2A).
According to the variation in the Ψs and the irrigation applied, the accumulation of water stress (SΨ) was lower in 2015/16 compared to 2016/17 in both deficit treatments. Additionally, the maximum differences between CTL and deficit irrigates trees Ψs were reached in the middle of the late post-harvest deficit period. In 2015/16, the maximum differences from CTL were 0.2 and almost 0.6 MPa for RDI1 and RDI2. In contrast, at the last season, the maximum differences were almost 0.8 and 1.0 MPa for RDI1 and RDI2, respectively. Interestingly, the increase in SΨ of RDI1 relative to RDI2 was quite proportional in both seasons, being on average 1.35 times higher in RDI2. Between seasons, the higher water reduction in the second season, resulted in an increase in cumulative SΨ related to the first season of 50.0 and 30.5% for RDI1 and RDI2, respectively. When the highest Ψs value of the control was considered for the calculation of SΨ, RDI2 reached values of 117.7 and 127.6 MPa day for each of the two seasons (Figure 1C).
The maximum daily trunk shrinkage (MDS) variation—expressed as weekly values—was strongly influenced by the plant water status assessed as Ψs. In 2015/16, during fruit ripening and early post-harvest, the MDS varied between 50 and 220 µm, reaching a maximum at harvest and with no differences between treatments. Once deficit irrigation began in the late post-harvest, as the Ψs decreased, the MDS increased steadily to a maximum of approximately 500 µm in all treatments. However, when the RDI2 treatment exceeded −1.5 MPa of Ψs, MDS was significantly higher regarding to CTL, increasing by an average of 27.7%, while at values approximately −1.5 MPa, RDI1 showed 13.2% higher MDS values than the control (Figure 2). In 2016/17, the differences in MDS were clearer. In the same way as in the previous season, no differences were detected between treatments during the period without water restrictions in the fruit ripening and harvest. Nevertheless, the MDS during fruit ripening averaged 80 µm and increased steadily to a peak of 350 µm at harvest, after which decreased to approximately 200 µm. Once the late post-harvest period started, with a Ψs lower than −1.5 MPa, the deficit irrigated treatments showed a significantly higher MDS than the CTL, especially in RDI2, reaching maximums of 350 to 480 µm, which decreased as ET0 started to decrease in September, until reaching the same values as CTL and similar to those observed during fruit ripening. The average MDS of the deficit period was approximately 72% higher than CTL in both deficit treatments (Figure 2).

3.3. Fruit and Trunk Growth

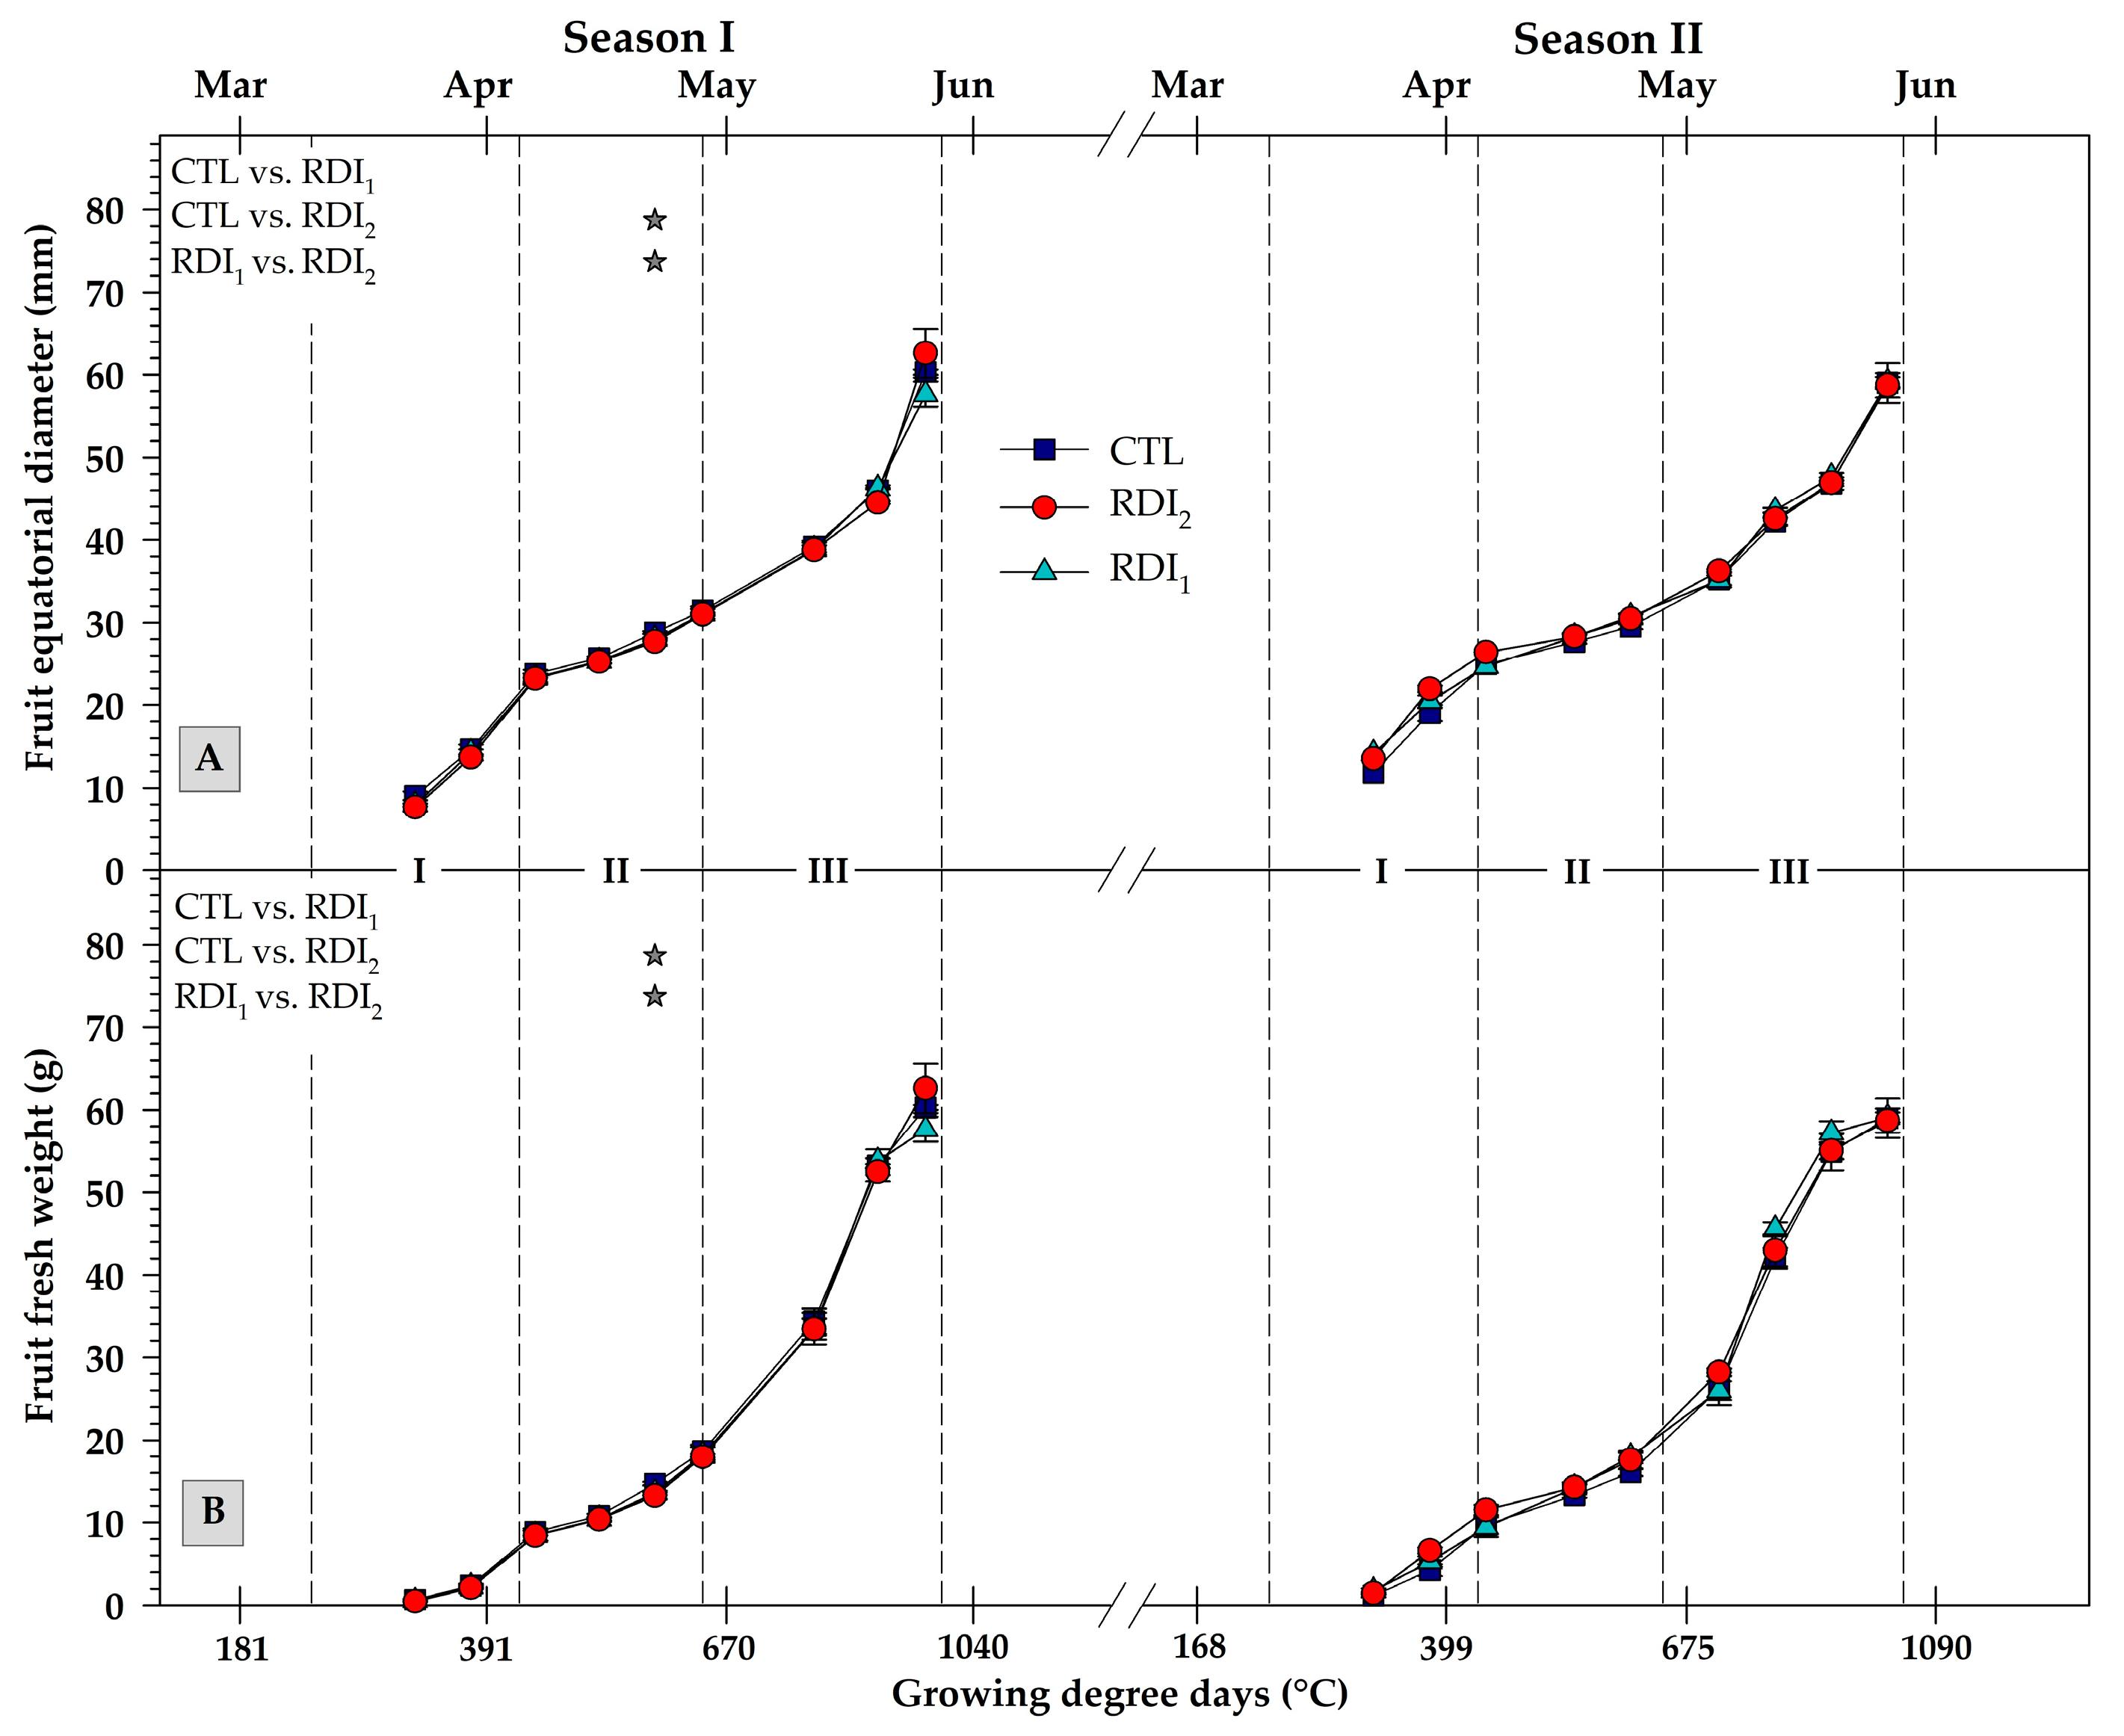
The equatorial fruit diameter and fresh weight followed a double sigmoid curve typical of the three stages of stone fruit growth (Figure 3) [27,30]. In the 2015/16 season and during the fruit growth stage II, which is dominated by the lignification of the endocarp, the deficit irrigation in the RDI2 treatment reduced fruit size and weight. Nevertheless, in subsequent evaluations, no differences between treatments were detected in any of the evaluations performed in both seasons (Figure 3).
The stage I of fruit growth began when 243 °C GDD was accumulated from full bloom (1 February) and ended when the fruits were approximately 25 mm in equatorial diameter and 10 g of fresh weight, with an accumulation of 430 °C GDD. In the stage II of slower growth, the equatorial fruit diameter and weight only increased by 13–15% of the final at harvest and ended with the accumulation of almost 650 °C GDD. Finally, in the second stage of the exponential growth (stage III), the increase in fruit diameter and weight was almost 50 and 40% of total, and the commercial maturity was reached at 990 °C GDD (Figure 3).
In both seasons, a slight decrease in the trunk growth was detected between fruit growth stage III and harvest. Subsequently, during early post-harvest, between 990 and 1840 °C GDD, the trunk grew exponentially in all treatments. In the late post-harvest from September onwards, when approximately 2760 °C GDD had been accumulated, no significant variation in the trunk growth was observed. Although the trunk growth was proportional to the irrigation reduction, no differences between treatments were detected in the first season. However, with the water stress intensity reached in 2016/17, in RDI2 trees the trunk growth was reduced by 38.8% in relation to the control (Figure 2C).

3.4. Yield and Irrigation Water Productivity

Harvesting was done in three cuts carried out on average every 4 days in both seasons, approximately 40% of the total yield was harvested in the last cut and was directly proportional to the number of fruits harvested, with no variation in fruit weight between cuts. Additionally, no effect of treatments on earliness or harvest distribution was detected.
In the 2015/16 season, despite the irrigation reduction, no yield nor water productivity variations were detected. Nevertheless, the yield without treatments effect was 27% higher in 2015/16 compared to 2016/17, this was related to the 25.2% higher fruit number and not to fruit weight. In the same way, the deficit irrigated treatments did not decrease yield in 2016/17, but the irrigation reduction significantly increased the irrigation water productivity ( W P I ) by 19.6 and 42.3% for RDI1 and RDI2. In the same sense but considering the effective rainfall, the crop water productivity ( W P C ) was significantly increased by 13.2 and 25.6% for RDI1 and RDI2 in relation to the control trees (Table 1).

3.5. Fruit Quality

No significant differences were detected between treatments on fruit quality at harvest in any of the parameters evaluated. In addition, although the number of fruits per tree was significantly higher in 2016/17, there was no variation between seasons (Table 2).

3.6. Effect of Water Stress on Crop Agronomic Response and Water Productivity

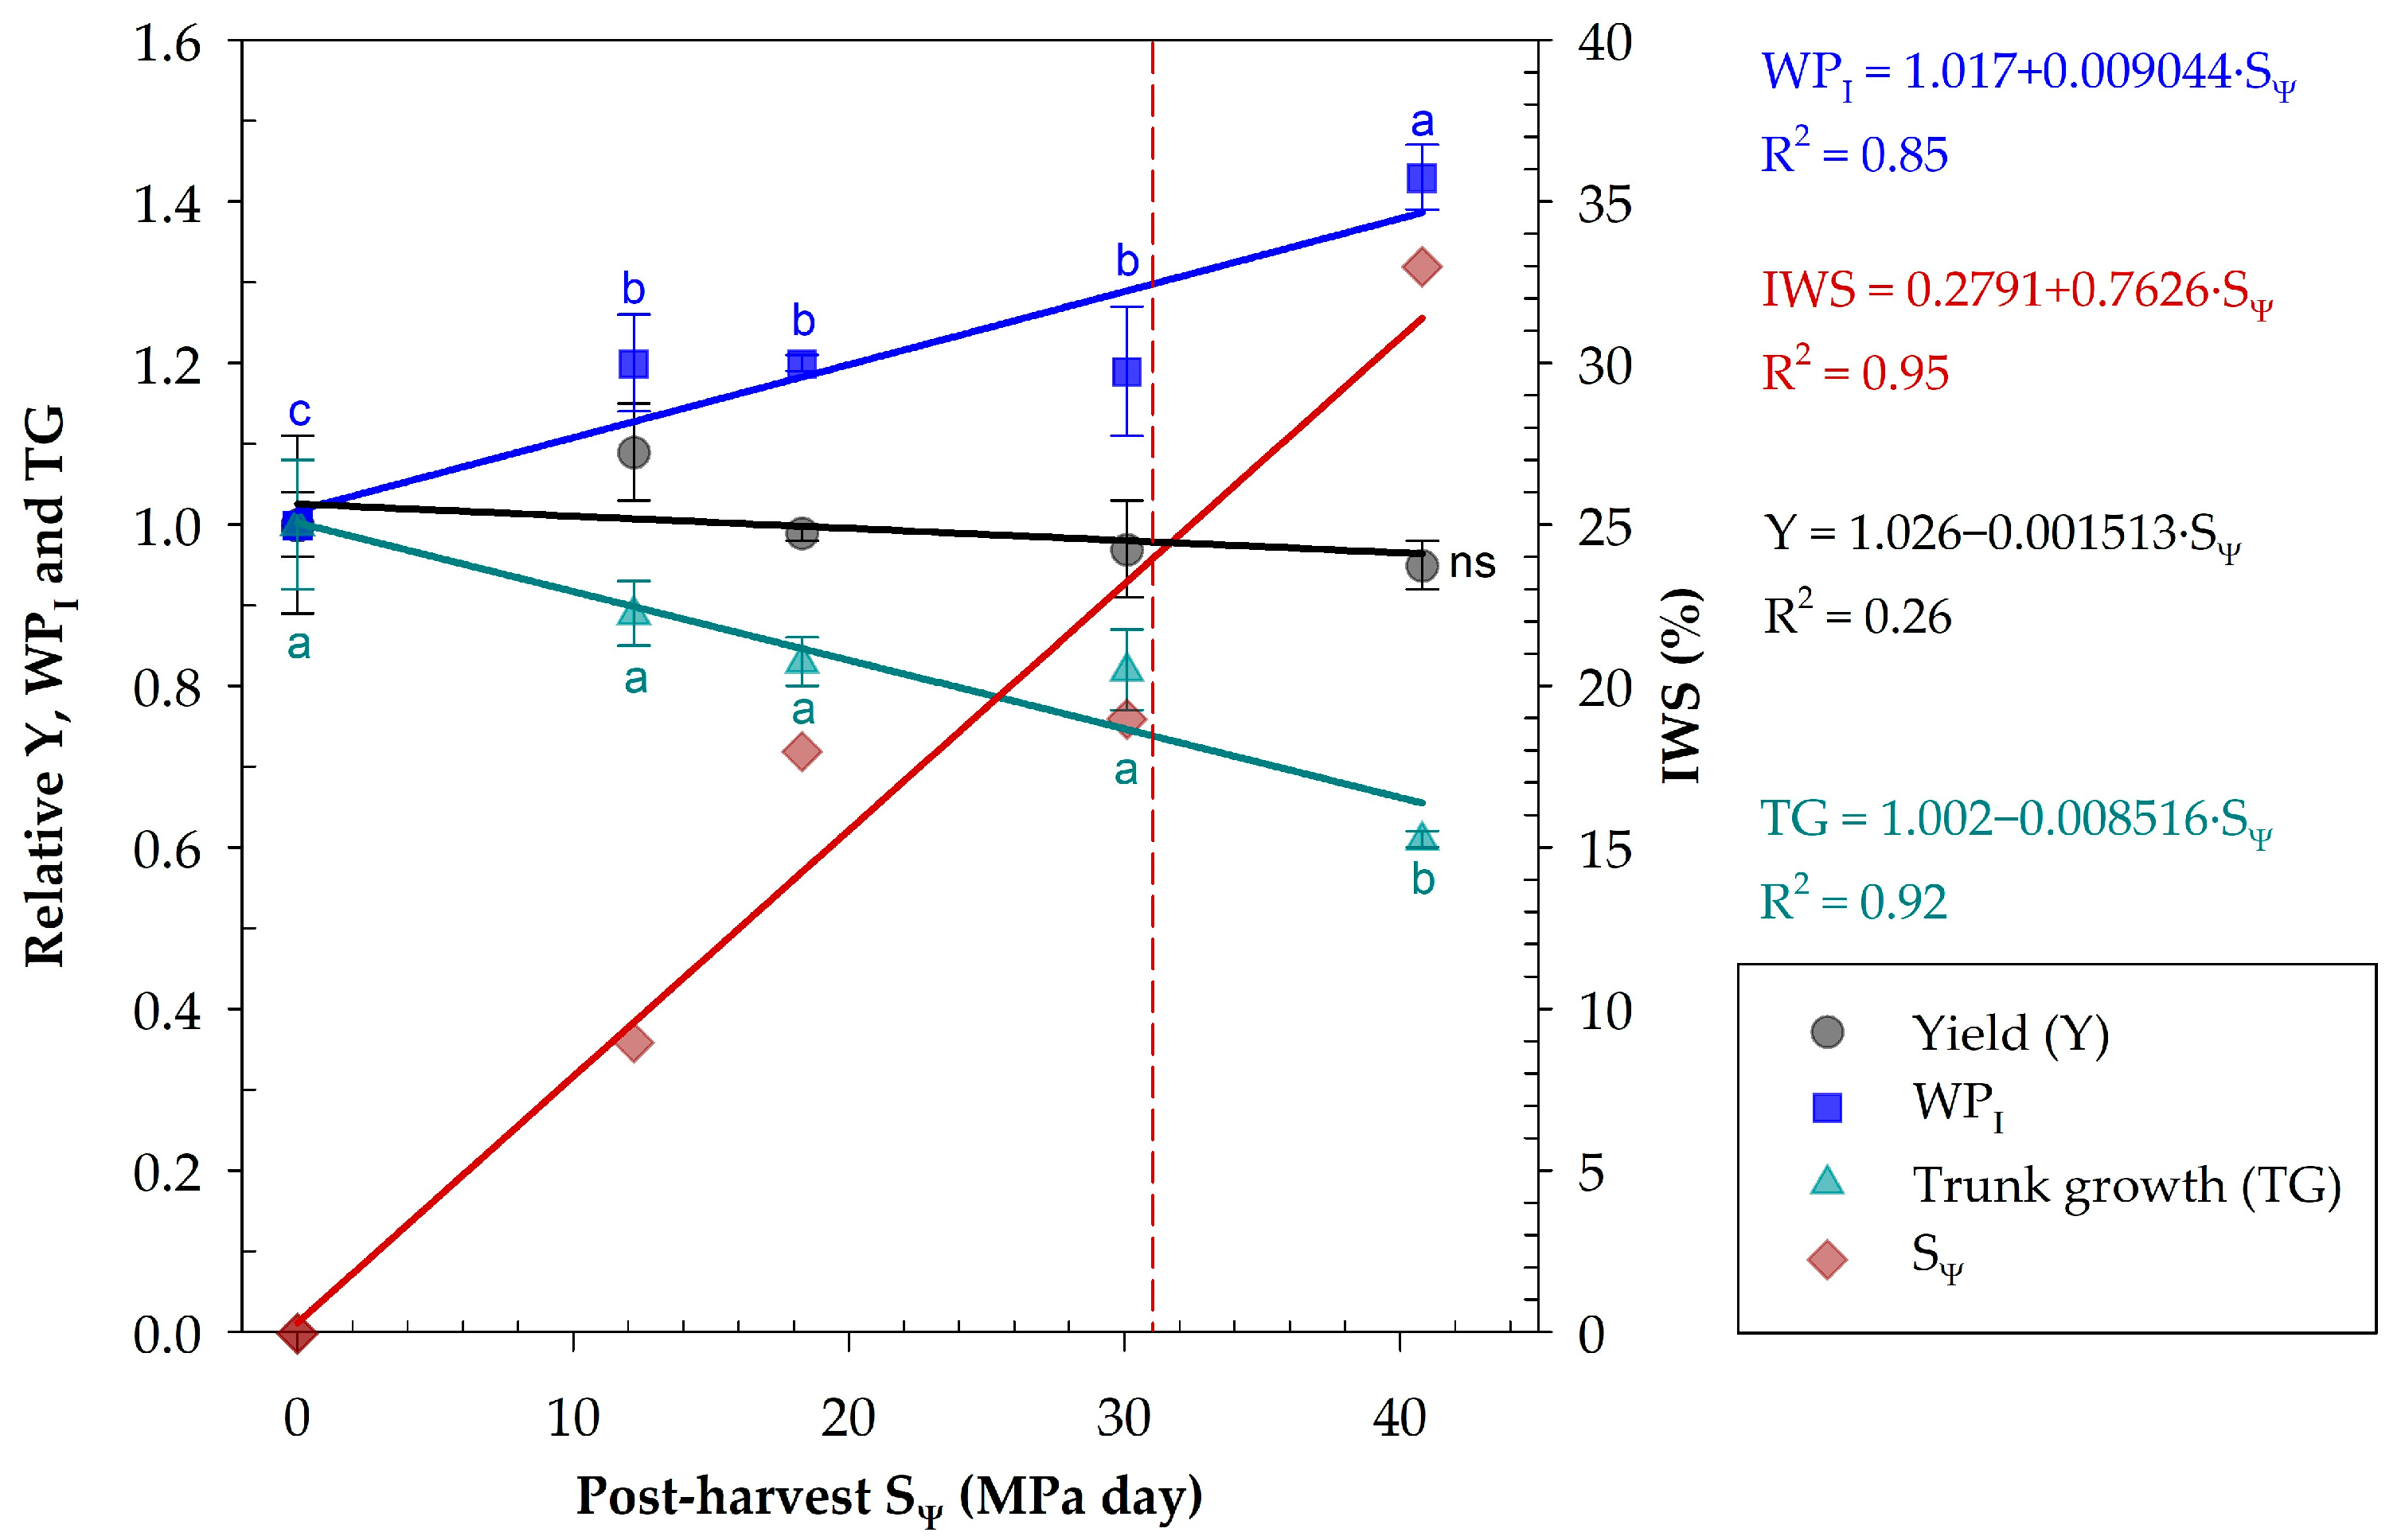
As expected, irrigation water saved was proportional to the water stress integral (SΨ) achieved during the regulated deficit irrigation regime, increasing by 0.76% over the volume used for well-irrigated trees for each MPa day of accumulated SΨ. Likewise, irrigation water productivity (WPI) increased significantly from 10 MPa day onwards, at a proportion between 1.13 and 1.40 of that achieved in trees without water restrictions. Interestingly and in agreement with the results described in Table 1, the yield was not reduced until SΨ reached a maximum value of 41 MPa day (128 MPa day relative to a Ψs of −0.42 MPa). However, when exceeding a SΨ of 30.2 MPa day, trunk growth was significantly reduced by 35% of the seasonal growth of well-watered trees (Figure 4).

4. Discussion

When subjected to a water stress integral (SΨ) of 30.2 MPa day during the post-harvest period, the early apricot tree cv. ‘Rojo Carlet’ showed a water saving of approximately 20% compared to well irrigated trees. Furthermore, water savings increased to 33% during the second season, when SΨ was raised to 41 MPa day, although vegetative growth was significantly reduced by 35% compared to the control (Figure 4), which could negatively affect the number of fruits per tree in the mid-term, and thus the crop yield [23,26].
Indeed, deficit irrigation scheduling consisting of maintaining a threshold value between −1.5 and −2 MPa of stem water potential (Ψs) considered for RDI1 and RDI2, respectively, during late post-harvest period, and a 20% reduction in the control during the stage I and II of fruit growth, increased the crop water productivity to 13.2 and 25.6% for RDI1 and RDI2, respectively, in relation to the control tree. This resulted in a maximum irrigation water reduction of 1124 and 2133 m3 ha−1 in RDI1 and RDI2, respectively, respect to 6385 m3 ha−1 for the control in the second season, without negatively affecting yield. Therefore, these two periods of RDI applied to apricot trees, could be considered as non-critical periods in which irrigation could be reduced without negatively affecting fruit yield and quality, similar to other deciduous fruit trees [10,14,19,20,58,59]. It is important to highlight that, the late post-harvest period showed a higher potential to reduce applied water due to its greater evaporative demand and duration (mid-July to mid-October).
All studies on crop response to RDI define the timing of the application of the water deficit and the degree of water stress applied to the plant, and its interaction with vegetative growth, and even on the ability of the fruit to experience compensatory growth after irrigation recovery during the fruit growth stage III [60]. Effectively, the delimitation of the non-critical periods in early fruit trees, for RDI scheduling requires the use of the growing degree day (GDD) accumulation model [38]. In our case, the beginning of fruit growth stage III and late post-harvest periods required approximately 640 and 1840 °C GDD from full bloom (≈1st of February), respectively (Figure 1A). Recently, Temnani et al. [22] delimited the cumulative thermal integral at the beginning of these two stages, approximately 577 and 1400 °C GDD, in flat peach trees cv. Carioca. In apricot trees cv. Búlida, Pérez-Pastor et al. [61] quantified the beginning of stage III fruit growth (approximately 50% of the final fruit size) at 11,234 °C growing degree hours (GDH). Interestingly, in late mandarin trees, the beginning of this critical period started when fruits reached approximately 60% of their final size [35,37].
Plant-based measurements are widely considered the most reliable indicators to assess water status and to schedule irrigation [32,62]. For this reason, knowledge of the threshold values of Ψs, which is the most widely used indicator of plant water status [63] due to its high sensitivity to water stress [33,64], would greatly facilitate a more efficient scheduling of deficit irrigation. For this reason, the use of SΨ, from the Ψs values, would allow us to quantify the water stress to which a plant is submitted in a phenological phase, previously delimited through the thermal integral [36].
Pérez Pastor et al. [30] detected in apricot trees cv. ‘Búlida’ a close correlation between the reduction in trunk growth rate with the water stress integral and therefore with the reduction in water applied. This correlation was linear from a water savings greater than 20% and SΨ > 140 MPa day. Meanwhile the cv. ‘Rojo Carlet’ presented a slightly lower SΨ of approximately 127.6 MPa day, when considering a single maximum CTL value for Ψs of −0.42 MPa (Figure 1). Similarly, Temnani et al. [22] found in flat peach trees that a water stress integral during post-harvest of 58 MPa day significantly reduced trunk growth, while it was not affected when SΨ was 30 MPa day. The different SΨ values obtained depending on the reference value used (a single value or different values from well-irrigated trees obtained during the period considered), should be standardized, in order to compare in a more accurate and useful way the response to water stress of a crop in different growing conditions.
It has been found in stone fruit trees that during the post-harvest period there is a high vegetative growth, being very important during the early post-harvest period [22,30]. For this reason, and if the fruit is early maturing with a long post-harvest period, it is necessary to delimit not only the beginning of the deficit irrigation period, but also the water stress level applied to the crop. This would avoid a negative effect on tree size, due to the known sensitivity of vegetative growth to water deficit in fruit trees [13,20,21].
Another important aspect is the level of water stress applied during the fruit growth stage I and II, due to the fact that if it were excessive, the capacity of the fruit to experience a compensatory growth during the deficit period, once the water is restored in stage III, would be reduced, affecting the size of the final fruit, and reducing the weight of the fruit and the yield of the crop. Indeed, Ruiz-Sánchez et al. [2] found in apricot fruits a compensatory capacity for growth when irrigation is restored. Pérez Pastor et al. [30] defined a threshold value of leaf water potential at predawn of −0.6 MPa in this period to ensure the compensatory fruit growth. These authors justified this growth to the greater dry fruit growth rates with respect to fresh fruit growth rates during the deficit period (stages I and II). Likewise, Pagán et al. [35] observed a compensatory growth of mandarin fruit subjected to a threshold value of −1.6 MPa of Ψs previously during the deficit period. In ‘Rojo Carlet’ apricot trees, a 23% reduction in water applied with respect to the control reduced fruit diameter in RDI2 during stage II, promoting compensatory growth later in phase III, after irrigation was restored (Figure 3).
The irrigation regime clearly affected the maximum daily trunk shrinkage (MDS), which increased significantly with Ψs values < −1.5 MPa, reaching values 72% higher in RDI2 than those of the control (Figure 2). Ortuño et al. [65] stated that in adult fruit trees under water deficit, the increase in MDS has been associated with a decrease in Ψs values. However, these authors also mentioned that this pattern can change at values below a Ψs threshold due to the depletion of water stored in the trunk, the decrease in transpiration and/or the decreased conductance of water from the bark to the xylem at a certain water potential. In nectarine trees this Ψs threshold has been delimited approximately −1.5 MPa [31]. This value can be appreciated for ‘Rojo Carlet’ apricot trees approximately −1.7 MPa (Figure 2).

5. Conclusions

Threshold values based on plant water status indicators for regulated deficit irrigation have been defined for early apricot ‘Rojo Carlet’ in order to increase water productivity. In this sense, irrigation scheduling based on stem water potential values between −1.5 and −2 MPa during the late post-harvest, and a 20% reduction in the ETc during fruit growth stages I and II, increased crop water productivity by 25.6%, achieving water savings up to 2133 m3 ha−1 without affect yield or fruit quality. In addition, a water stress integral of 30.2 MPa day during post-harvest could be considered optimal since when 41 MPa day was accumulated, the vegetative growth was reduced by 35%, which may affect crop productivity in the mid-term.

Author Contributions

Conceptualization, A.P.-P.; methodology, A.P.-P., P.J.E. and A.T.; validation, A.T. and P.B.; formal analysis, A.T., P.B. and S.Z.-G.; investigation, A.T., A.P.-P. and P.B.; resources, A.T., S.Z.-G. and P.J.E.; data curation, A.T., S.Z.-G. and A.P.-P.; writing—original draft preparation, A.T., P.B. and A.P.-P.; writing—review and editing, A.P.-P., A.T. and P.J.E.; visualization, A.T. and P.B; supervision, A.P.-P. and A.T.; project administration, A.P.-P. and A.T.; funding acquisition, A.P.-P. All authors have read and agreed to the published version of the manuscript.

Funding

This study was funded by the Spanish Ministry of Science of Innovation (PID2019-106226RB-C22), the European Union (LIFE13 ENV/ES/000539), and International Joint Programming Actions 2017 described in the National R&D&I Program oriented towards the challenges of society, by the Ministry of Economy, Industry and Competitiveness—National Research Agency (AEI) (PCIN-2017-091). This work is a result of the AGROALNEXT programme and was supported by MCIN with funding from European Union NextGenerationEU (PRTR-C17.I1) and by Fundación Séneca with funding from Comunidad Autónoma Región de Murcia (CARM).

Data Availability Statement

Data will be made available on request.

Acknowledgments

The authors thank to the Irrigation Community of Campotéjar, for letting them use the facilities to carry out this study. Special thanks to J.M. de la Rosa and C. Castillo for their help in field and laboratory tasks. Susana Zapata acknowledges her research fellowship of the FMC Agriculture Sciences chair with Universidad Politécnica de Cartagena.

Conflicts of Interest

The authors declare that they have no known competing financial interest or personal relationship that could have appeared to influence the work reported in this paper.

References

  1. Torrecillas, A.; Corell, M.; Galindo, A.; Pérez-López, D.; Memmi, H.; Rodríguez, P.; Cruz, Z.N.; Centeno, A.; Intrigliolo, D.S.; Moriana, A. Agronomical Effects of Deficit Irrigation in Apricot, Peach, and Plum Trees. In Water Scarcity and Sustainable Agriculture in Semiarid Environment: Tools, Strategies, and Challenges for Woody Crops; Garcia-Tejero, I., Duran, V., Eds.; Elsevier: London, UK, 2018; pp. 87–109. [Google Scholar]
  2. Ruiz-Sánchez, M.C.; Domingo, R.; Torrecillas, A.; Pérez-Pastor, A. Water Stress Preconditioning to Improve Drought Resistance in Young Apricot Plants. Plant Sci. 2000, 156, 245–251. [Google Scholar] [CrossRef]
  3. CARM. Estadística Agraria de Murcia 2019/20, 1st ed.; Comunidad Autónoma de la Región de Murcia, Ed.; Consejería de Agua, Agricultura, Ganadería, Pesca y Medio Ambiente: Murcia, Spain, 2020; Volume Informe 28. [Google Scholar]
  4. Llácer, G. La elección de variedades de albaricoque en la Comunidad Valenciana. Comunitat Valencia. Agrar. 2000, 17, 26–32. [Google Scholar]
  5. Torelló-Sentelles, H.; Franzke, C.L.E. Drought Impact Links to Meteorological Drought Indicators and Predictability in Spain. Hydrol. Earth Syst. Sci. 2022, 26, 1821–1844. [Google Scholar] [CrossRef]
  6. Vargas, J.; Paneque, P. Challenges for the Integration of Water Resource and Drought-Risk Management in Spain. Sustainability 2019, 11, 308. [Google Scholar] [CrossRef]
  7. Vicente-Serrano, S.M.; McVicar, T.R.; Miralles, D.G.; Yang, Y.; Tomas-Burguera, M. Unraveling the Influence of Atmospheric Evaporative Demand on Drought and Its Response to Climate Change. Wiley Interdiscip. Rev. Clim. Chang. 2020, 11, e632. [Google Scholar] [CrossRef]
  8. Vicente-Serrano, S.M.; Domínguez-Castro, F.; Reig, F.; Beguería, S.; Tomas-Burguera, M.; Latorre, B.; Peña-Angulo, D.; Noguera, I.; Rabanaque, I.; Luna, Y.; et al. A near Real-Time Drought Monitoring System for Spain Using Automatic Weather Station Network. Atmos. Res. 2022, 271, 106095. [Google Scholar] [CrossRef]
  9. Steduto, P.; Hsiao, T.C.; Fereres, E.; Raes, D. Crop Yield Response to Water. In FAO Irrigation and Drainage Paper No 66; Cambridge University Press: Cambridge, UK, 2012. [Google Scholar]
  10. Pérez-Pastor, A.; Domingo, R.; Torrecillas, A.; Ruiz-Sánchez, M.C. Response of Apricot Trees to Deficit Irrigation Strategies. Irrig. Sci. 2009, 27, 231–242. [Google Scholar] [CrossRef]
  11. Torrecillas, A.; Galego, R.; Pérez-Pastor, A.; Ruiz-Sánchez, M.C. Gas Exchange and Water Relations of Young Apricot Plants under Drought Conditions. J. Agric. Sci. 1999, 132, 445–452. [Google Scholar] [CrossRef]
  12. Losciale, P.; Gaeta, L.; Corsi, M.; Galeone, C.; Tarricone, L.; Leogrande, R.; Stellacci, A.M. Physiological Responses of Apricot and Peach Cultivars under Progressive Water Shortage: Different Crop Signals for Anisohydric and Isohydric Behaviours. Agric. Water Manag. 2023, 286, 108384. [Google Scholar] [CrossRef]
  13. Chalmers, D.J.; Mitchell, P.D.; van Heek, L. Control of Peach Tree Growth and Productivity by Regulated Water Supply, Tree Density, and Summer Pruning [Trickle Irrigation]. J. Am. Soc. Hortic. Sci. 1981, 106, 307–312. [Google Scholar] [CrossRef]
  14. De la Rosa, J.M.; Conesa, M.R.; Domingo, R.; Aguayo, E.; Falagán, N.; Pérez-Pastor, A. Combined Effects of Deficit Irrigation and Crop Level on Early Nectarine Trees. Agric. Water Manag. 2016, 170, 120–132. [Google Scholar] [CrossRef]
  15. De la Rosa, J.M.; Domingo, R.; Gómez-Montiel, J.; Pérez-Pastor, A. Implementing Deficit Irrigation Scheduling through Plant Water Stress Indicators in Early Nectarine Trees. Agric. Water Manag. 2015, 152, 207–216. [Google Scholar] [CrossRef]
  16. Blanco, V.; Torres-Sánchez, R.; Blaya-Ros, P.J.; Pérez-Pastor, A.; Domingo, R. Vegetative and Reproductive Response of ‘Prime Giant’ Sweet Cherry Trees to Regulated Deficit Irrigation. Sci. Hortic. 2019, 249, 478–489. [Google Scholar] [CrossRef]
  17. Blanco, V.; Domingo, R.; Pérez-Pastor, A.; Blaya-Ros, P.J.; Torres-Sánchez, R. Soil and Plant Water Indicators for Deficit Irrigation Management of Field-Grown Sweet Cherry Trees. Agric. Water Manag. 2018, 208, 83–94. [Google Scholar] [CrossRef]
  18. Ruiz-Sánchez, M.C.; Abrisqueta, I.; Conejero, W.; Vera, J. Deficit Irrigation Management in Early-Maturing Peach Crop. In Water Scarcity and Sustainable Agriculture in Semiarid Environment: Tools, Strategies, and Challenges for Woody Crops; Academic Press: Cambridge, MA, USA, 2018; pp. 111–129. [Google Scholar] [CrossRef]
  19. Naor, A. Irrigation Scheduling of Peach-Deficit Irrigation at Different Phenological Stages and Water Stress Assessment. Acta Hortic. 2006, 713, 339–349. [Google Scholar] [CrossRef]
  20. Girona, J.; Gelly, M.; Mata, M.; Arbonès, A.; Rufat, J.; Marsal, J.; Arbonè, A.; Rufat, J.; Marsal, J. Peach Tree Response to Single and Combined Deficit Irrigation Regimes in Deep Soils. Agric. Water Manag. 2005, 72, 97–108. [Google Scholar] [CrossRef]
  21. Vera, J.; Abrisqueta, I.; Abrisqueta, J.M.; Ruiz-Sánchez, M.C. Effect of Deficit Irrigation on Early-Maturing Peach Tree Performance. Irrig. Sci. 2013, 31, 747–757. [Google Scholar] [CrossRef]
  22. Temnani, A.; Berríos, P.; Zapata-García, S.; Pérez-Pastor, A. Deficit Irrigation Strategies of Flat Peach Trees under Semi-Arid Conditions. Agric. Water Manag. 2023, 287, 108464. [Google Scholar] [CrossRef]
  23. Intrigliolo, D.S.; Ballester, C.; Castel, J.R. Carry-over Effects of Deficit Irrigation Applied over Seven Seasons in a Developing Japanese Plum Orchard. Agric. Water Manag. 2013, 128, 13–18. [Google Scholar] [CrossRef]
  24. Girona, J.; Mata, M.; Marsal, J. Regulated Deficit Irrigation during the Kernel-Filling Period and Optimal Irrigation Rates in Almond. Agric. Water Manag. 2005, 75, 152–167. [Google Scholar] [CrossRef]
  25. Goldhamer, D.A.; Viveros, M.; Salinas, M. Regulated Deficit Irrigation in Almonds: Effects of Variations in Applied Water and Stress Timing on Yield and Yield Components. Irrig. Sci. 2006, 24, 101–114. [Google Scholar] [CrossRef]
  26. Egea, G.; Nortes, P.A.; Domingo, R.; Baille, A.; Pérez-Pastor, A.; González-Real, M.M. Almond Agronomic Response to Long-Term Deficit Irrigation Applied since Orchard Establishment. Irrig. Sci. 2013, 31, 445–454. [Google Scholar] [CrossRef]
  27. Torrecillas, A.; Domingo, R.; Galego, R.; Ruiz-Sánchez, M.C. Apricot Tree Response to Withholding Irrigation at Different Phenological Periods. Sci. Hortic. 2000, 85, 201–215. [Google Scholar] [CrossRef]
  28. Ezzat, A.; Salama, A.-M.; Szabó, S.; Yaseen, A.-A.; Molnár, B.; Holb, I.-J. Deficit Irrigation Strategies on Tree Physiological and Chemical Properties: Treatment Effects, Prediction Based Model Analyses and Inter-Correlations. Agronomy 2021, 11, 1361. [Google Scholar] [CrossRef]
  29. Allen, R.G.; Pereira, L.S.; Raes, D.; Smith, M. Crop Evapotranspiration; FAO 56; FAO: Rome, Italy, 1998; p. 300. [Google Scholar]
  30. Pérez-Pastor, A.; Ruiz-Sánchez, M.C.; Domingo, R. Effects of Timing and Intensity of Deficit Irrigation on Vegetative and Fruit Growth of Apricot Trees. Agric. Water Manag. 2014, 134, 110–118. [Google Scholar] [CrossRef]
  31. de la Rosa, J.M.; Dodd, I.; Domingo, R.; Pérez-Pastor, A. Early Morning Fluctuations in Trunk Diameter Are Highly Sensitive to Water Stress in Nectarine Trees. Irrig. Sci. 2016, 34, 117–128. [Google Scholar] [CrossRef]
  32. Jones, H.G. Irrigation Scheduling: Advantages and Pitfalls of Plant-Based Methods. J. Appl. Bot. 2004, 55, 2427–2436. [Google Scholar] [CrossRef]
  33. Ortuño, M.F.; Brito, J.J.; García-Orellana, Y.; Conejero, W.; Torrecillas, A. Maximum Daily Trunk Shrinkage and Stem Water Potential Reference Equations for Irrigation Scheduling of Lemon Trees. Irrig. Sci. 2009, 27, 121–127. [Google Scholar] [CrossRef]
  34. Egea, G.; Pagán, E.; Baille, A.; Domingo, R.; Nortes, P.A.; Pérez-Pastor, A. Usefulness of Establishing Trunk Diameter Based Reference Lines for Irrigation Scheduling in Almond Trees. Irrig. Sci. 2009, 27, 431–441. [Google Scholar] [CrossRef]
  35. Pagán, E.; Robles, J.M.; Temnani, A.; Berríos, P.; Botía, P.; Pérez-Pastor, A. Effects of Water Deficit and Salinity Stress on Late Mandarin Trees. Sci. Total Environ. 2022, 803, 150109. [Google Scholar] [CrossRef]
  36. Myers, B.J. Water Stress Integral—A Link between Short-Term Stress and Long-Term Growth. Tree Physiol. 1988, 4, 315–323. [Google Scholar] [CrossRef] [PubMed]
  37. Berríos, P.; Temnani, A.; Zapata, S.; Forcén-Muñoz, M.; Franco, J.A.; Pérez-Pastor, A. Sensitivity to Water Deficit of the Second Stage of Fruit Growth in Late Mandarin Trees. Irrig. Sci. 2023, 41, 35–47. [Google Scholar] [CrossRef]
  38. Richardson, E.A.; Seeley, S.D.; Walker, D.R.; Anderson, J.L.; Ashcroft, G.L. Pheno-Climatography of Spring Peach Bud Development. HortScience 1975, 10, 236–237. [Google Scholar] [CrossRef]
  39. Milošević, T.; Milošević, N. Behavior of Apricot (Prunus armeniaca L.) under Climate Change. In Cultivation for Climate Change Resilience: Temperate Fruit Trees; Abul-Soad, A.A., Al-Khayri, J.M., Eds.; CRC Press: Boca Raton, FL, USA, 2023; Volume 2, pp. 234–256. ISBN 9781003351153. [Google Scholar]
  40. Uriu, K. Effect of Post-Harvest Soil Moisture Depletion on Subsequent Yield of Apricot. Proc. Am. Soc. Hortic. Sci. 1964, 84, 93–97. [Google Scholar]
  41. Ruiz-Sánchez, M.C.; Egea, J.; Galego, R.; Torrecillas, A. Floral Biology of ‘Bulida’ Apricot Trees Subjected to Postharvest Drought Stress. Ann. Appl. Biol. 1999, 135, 523–528. [Google Scholar] [CrossRef]
  42. AEMET. Servicios Climáticos: Valores Climatológicos Normales. Available online: https://www.aemet.es/es/serviciosclimaticos/datosclimatologicos/valoresclimatologicos (accessed on 11 October 2021).
  43. Espada, J.L. Abonado de Los Frutos Caducifolios. In Guía Práctica de la Fertilización Racional de los Cultivos en España; Ministerio de Medio Ambiente y Medio Rural y Marino, Ed.; Secretaría General Técnica del Ministerio de Medio Ambiente y Medio Rural y Marino: Madrid, Spain, 2005; Volume II, pp. 205–212. ISBN 978-84-491-0997-3. [Google Scholar]
  44. Gómez-Aparisi, J. Respuesta al Riego de Las Especies Frutales de Hueso: Albaricoque, Ciruelo y Cerezo. Frutic. Prof. 1990, 30, 106–113. [Google Scholar]
  45. SIAM. Visor Del Sistema de Información Agraria de Murcia. Available online: http://siam.imida.es/apex/f?p=101:41:1216327970564392 (accessed on 30 June 2015).
  46. Murray, F.W. On the Computation of Saturation Vapor Pressure. J. Appl. Meteorol. 1967, 6, 203–204. [Google Scholar] [CrossRef]
  47. Marra, F.P.; Inglese, P.; DeJong, T.M.; Johnson, R.S. Thermal Time Requirement and Harvest Time Forecast for Peach Cultivars with Different Fruit Development Periods. Acta Hortic. 2002, 592, 523–529. [Google Scholar] [CrossRef]
  48. Goldhamer, D.; Fereres, E. Irrigation Scheduling of Almond Trees with Trunk Diameter Sensors. Irrig. Sci. 2003, 23, 11–19. [Google Scholar] [CrossRef]
  49. Fernández, J.E.; Alcon, F.; Diaz-Espejo, A.; Hernandez-Santana, V.; Cuevas, M.V. Water Use Indicators and Economic Analysis for On-Farm Irrigation Decision: A Case Study of a Super High Density Olive Tree Orchard. Agric. Water Manag. 2020, 237, 106074. [Google Scholar] [CrossRef]
  50. Rodrigues, G.C.; Pereira, L.S. Assessing Economic Impacts of Deficit Irrigation as Related to Water Productivity and Water Costs. Biosyst. Eng. 2009, 103, 536–551. [Google Scholar] [CrossRef]
  51. Dastane, N.G. Effective Rainfall in Irrigated Agriculture. FAO Irrig. Drain. Eng. 1978, 4, 25. [Google Scholar]
  52. Artés, F.; Escriche, A.J.; Martínez, J.A.; Marín, J.G. Quality Factors in Four Varieties of Melon (Cucumis melo L.). J. Food Qual. 1993, 16, 91–100. [Google Scholar] [CrossRef]
  53. Jayasena, V.; Cameron, I. °Brix/Acid Ratio as a Predictor of Consumer Acceptability of Crimson Seedless Table Grapes. J. Food Qual. 2008, 31, 736–750. [Google Scholar] [CrossRef]
  54. Levene, H. Robust Tests for Equality of Variances. In Contributions to Probability and Statistics; Olkin, I., Ed.; Stanford University Press: Palo Alto, CA, USA, 1960; pp. 278–292. [Google Scholar]
  55. O’Brien, R.G. A Simple Test for Variance Effects in Experimental Designs. Psychol. Bull. 1981, 89, 570–574. [Google Scholar] [CrossRef]
  56. Yitnosumarto, S.; O’Neill, M.E. On Levene’s Test of Variance Homogeneity. Austrian J. Stat. 1986, 28, 230–241. [Google Scholar] [CrossRef]
  57. di Renzo, J.A.; Casanoves, F.; Balzarini, M.G.; Gonzalez, L.; Tablada, M.; Robledo, C.W. Infostat—Software Estadístico. Available online: https://www.infostat.com.ar (accessed on 15 April 2022).
  58. Girona, J.; Marsal, J.; Mata, M.; Arbonés, A.; Mata, A. The Combined Effect of Fruit Load and Water Stress in Different Peach Fruit Growth Stages (Prunus persica L). Acta Hortic. 2002, 584, 149–152. [Google Scholar] [CrossRef]
  59. Thakur, A.; Singh, Z. Responses of ‘Spring Bright’ and ‘Summer Bright’ Nectarines to Deficit Irrigation: Fruit Growth and Concentration of Sugars and Organic Acids. Sci. Hortic. 2012, 135, 112–119. [Google Scholar] [CrossRef]
  60. Ruiz-Sanchez, M.C.; Domingo, R.; Castel, J.R. Review. Deficit Irrigation in Fruit Trees and Vines in Spain. Span. J. Agric. Res. 2010, 8, 5–20. [Google Scholar] [CrossRef]
  61. Pérez-Pastor, A.; Ruiz-Sánchez, M.C.; Domingo, R.; Torrecillas, A. Growth and Phenological Stages of Búlida Apricot Trees in South-East Spain. Agronomie 2004, 24, 93–100. [Google Scholar] [CrossRef]
  62. Lakso, A.N.; Santiago, M.; Stroock, A.D. Monitoring Stem Water Potential with an Embedded Microtensiometer to Inform Irrigation Scheduling in Fruit Crops. Horticulturae 2022, 8, 1207. [Google Scholar] [CrossRef]
  63. Shackel, K.; Ahmadi, H.; Biasi, W.; Buchner, R.; Goldhamer, D.; Gurusinghe, S.; Hasey, J.; Kester, D.; Krueger, B.; Lampinen, B.; et al. Plant Water Status as an Index of Irrigation Need in Deciduous Fruit Trees. HortTechnology 1997, 7, 23–29. [Google Scholar] [CrossRef]
  64. Naor, A. Midday Stem Water Potential as a Plant Water Stress Indicator for Irrigation Scheduling in Fruit Trees. Acta Hortic. 2000, 537, 447–454. [Google Scholar] [CrossRef]
  65. Ortuño, M.F.; Conejero, W.; Moreno, F.; Moriana, A.; Intrigliolo, D.S.; Biel, C.; Mellisho, C.D.; Pérez-Pastor, A.; Domingo, R.; Ruiz-Sánchez, M.C.; et al. Could Trunk Diameter Sensors Be Used in Woody Crops for Irrigation Scheduling? A Review of Current Knowledge and Future Perspectives. Agric. Water Manag. 2010, 97, 1–11. [Google Scholar] [CrossRef]
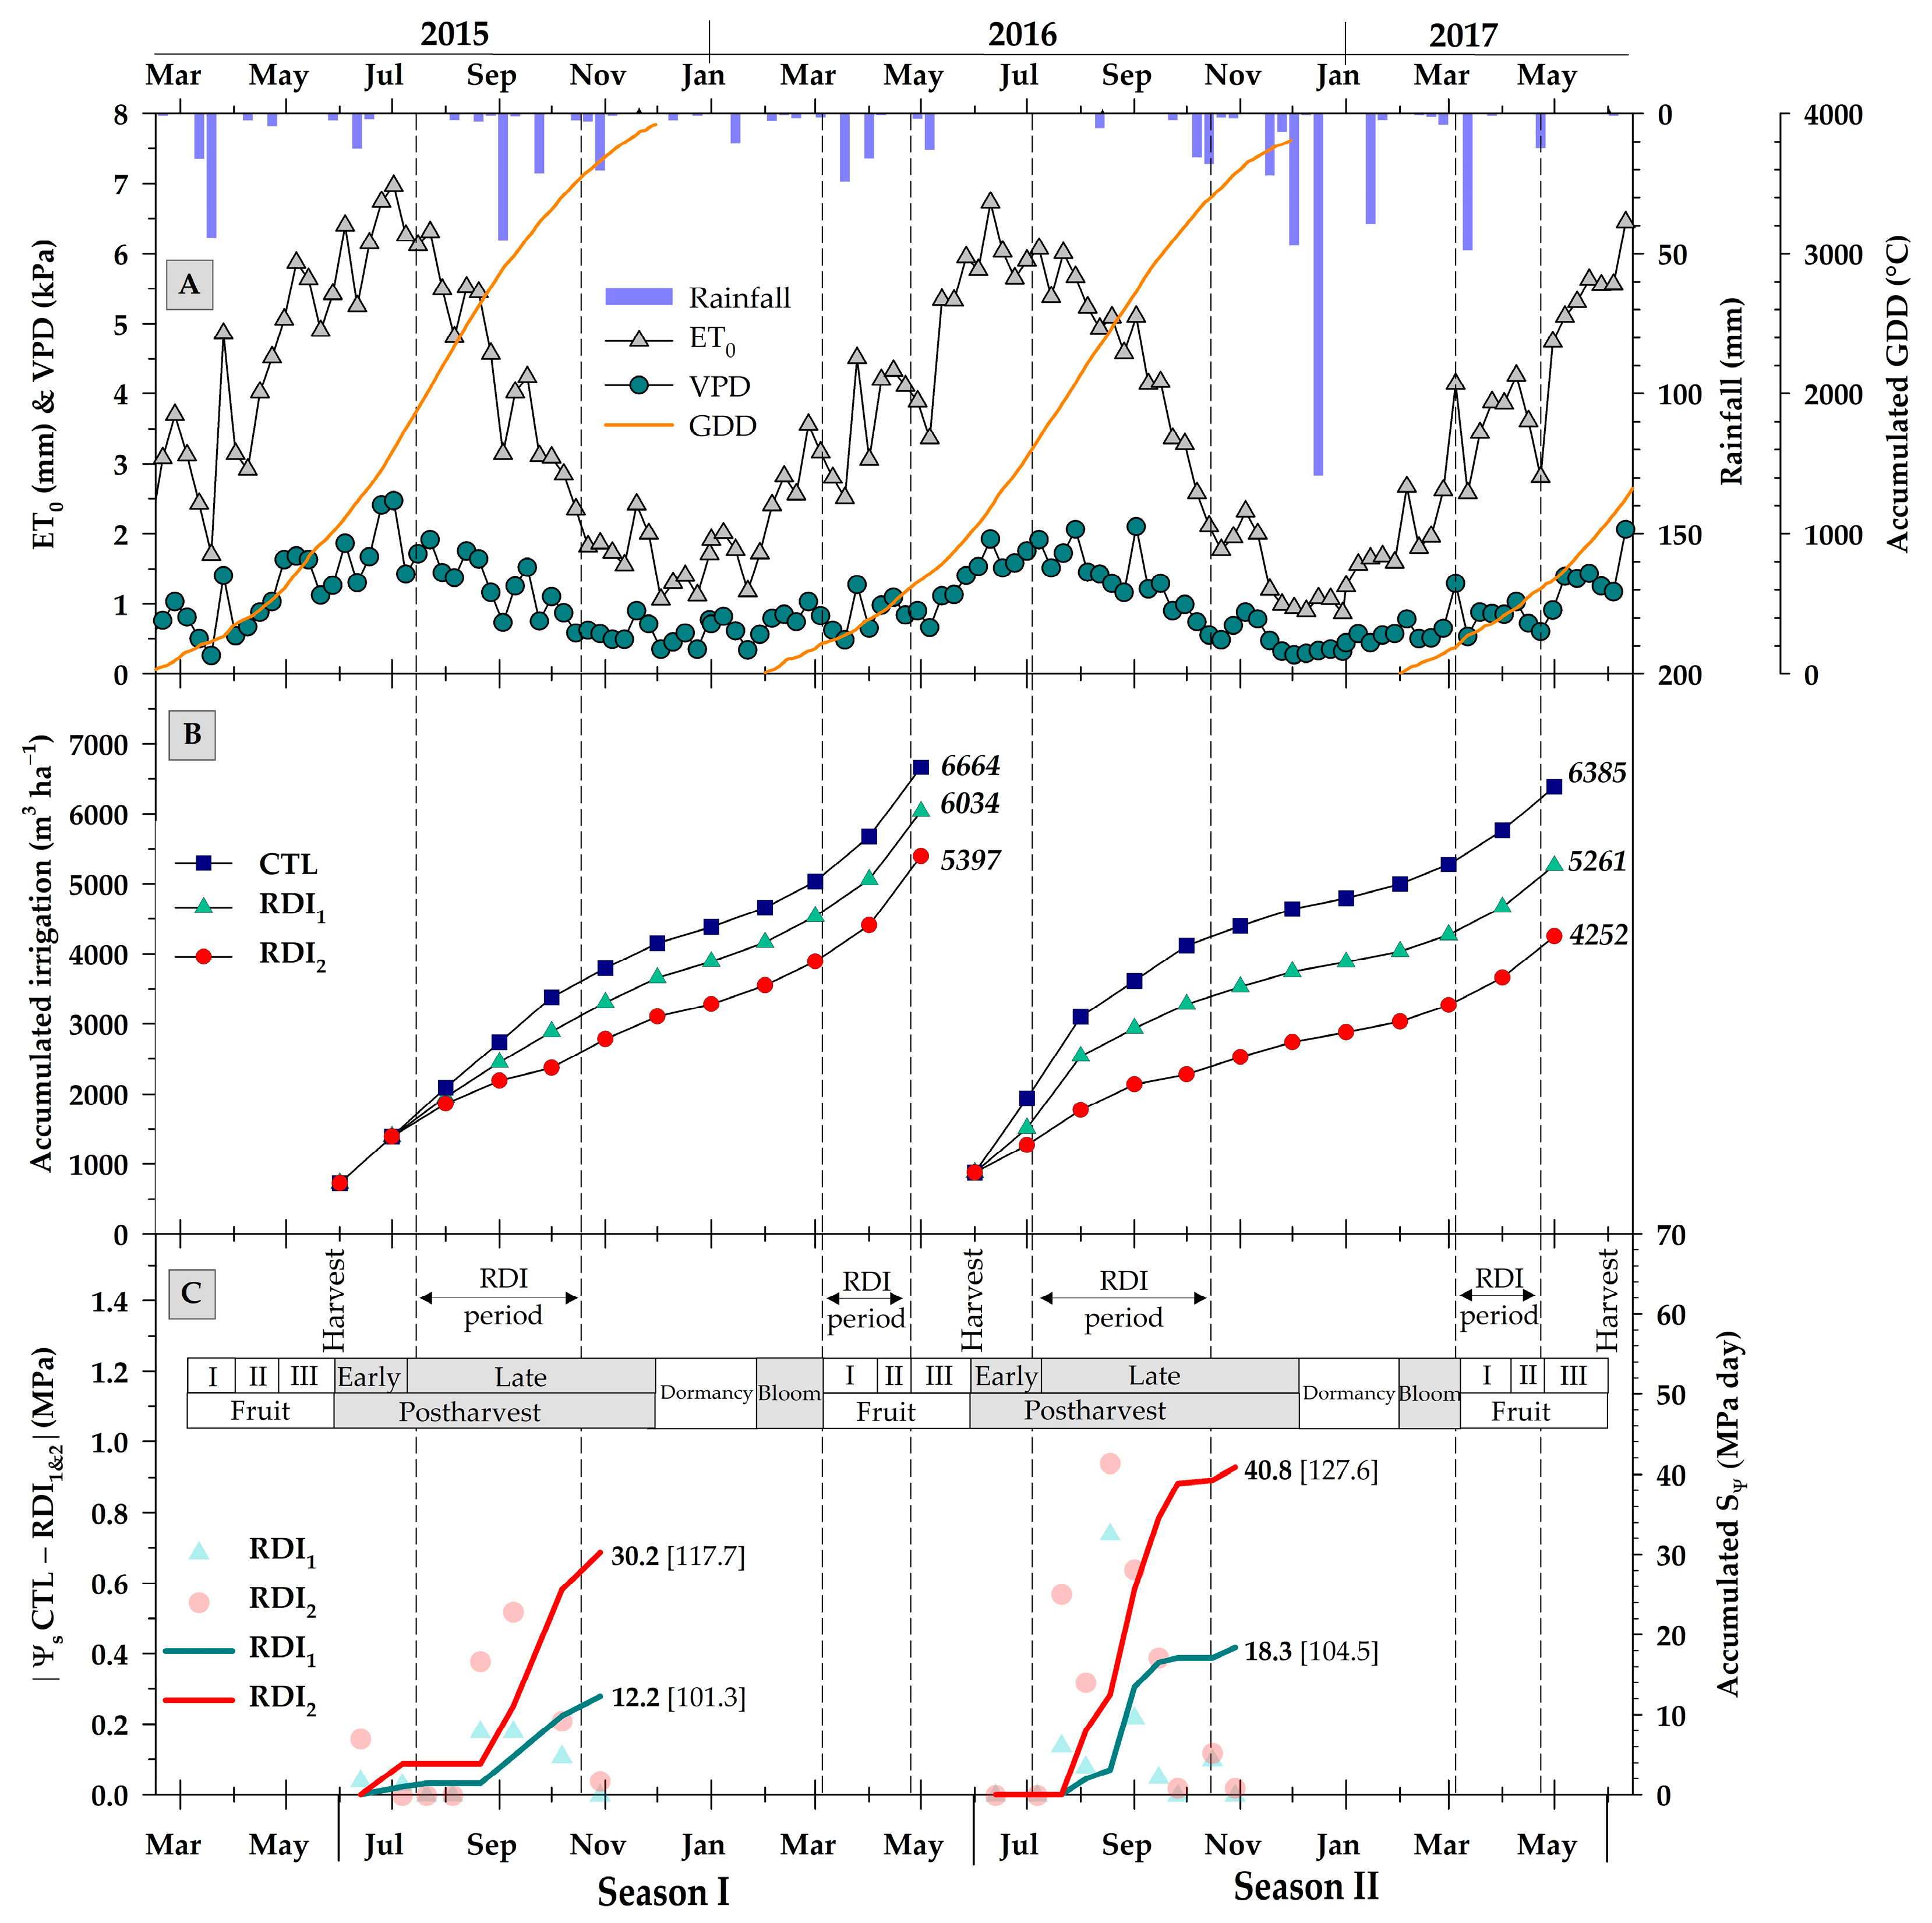
Figure 1. Seasonal changes of weekly reference crop evapotranspiration (ET0), vapor pressure deficit (VPD), weekly accumulated rainfall and growing degree days (GDD) accumulation from May 2015 until June 2018 (A). Monthly accumulated irrigation (B) and, variation in solar midday stem water potential (Ψs) relative to the control (CTL) treatment for regulated deficit irrigation (RDI1 and RDI2) treatments (symbols) and cumulative water stress integral (SΨ) for treatments RDI1&2 (continuous lines) during post-harvest (C). The values in square brackets are the accumulated SΨ with respect to the maximum CTL value of Ψs = −0.42 MPa for both seasons. In addition, the phenological phases during the study are detailed (I, II and III correspond to the fruit growth stages). Vertical dashed lines indicate the period of RDI1&2.
Agronomy 13 02344 g001
Figure 2. Seasonal change of the weekly solar midday stem water potential (Ψs) (A), maximum daily trunk shrinkage (MDS) (B), cumulative weekly trunk growth (C), and monthly irrigation (D) for the control (CTL) and regulated deficit irrigation (RDI1&2) treatments (n = 3). In addition, the phenological phases during the study are detailed (I, II and III correspond to the fruit growth stages). Vertical dashed lines indicate the period of RDI1&2. The grey stars indicate significant differences between CTL vs. RDI1, CTL vs. RDI2 and RDI1 vs. RDI2, according to the ANOVA (p < 0.05).
Agronomy 13 02344 g002
Figure 3. Evolution of the fruit equatorial diameter (A) and fresh weight (B) according to growing degree days (GDD) accumulation from full bloom (± standard error, n = 3). The vertical dashes lines indicate the fruit growth stages I, II and III. The grey stars indicate significant differences between CTL vs. RDI1, CTL vs. RDI2 and RDI1 vs. RDI2, according to the ANOVA (p < 0.05).
Agronomy 13 02344 g003
Figure 4. Relationship between the cumulative water stress integral (SΨ) during post-harvest of adult apricot trees under regulated deficit irrigation and yield (Y) (black), irrigation water productivity (WPI) (blue) and trunk growth (TG) (green) relative to the values observed in well-irrigated trees (± standard error, n = 3), and with the percentage of irrigation water saved (IWS) (red). The solid lines correspond to the linear regression between variables and the red dashed line to the proposed SΨ threshold. Horizontal letters for the same parameter indicate significant differences according to Duncan’s test (p < 0.05) and ns: not significant.
Agronomy 13 02344 g004
Table 1. Yield parameters, and irrigation ( W P I ) and crop ( W P C ) water productivity.
Season/
Treatment
YieldFruit LoadFruit Weight W P I W P C
(kg Tree−1)(Fruits Tree−1)(g FW)(kg m−3)(kg m−3)
2015/16CTL123.2204160.34.403.75
RDI1134.5233657.65.314.46
RDI2119.2192362.65.264.33
2016/17CTL101.0171159.03.77 c2.73 c
RDI199.7168659.14.51 b3.09 b
RDI295.9163658.75.37 a3.43 a
Season (S)*****nsns***
Treatment (T)nsnsns****
S × Tnsnsnsnsns
Each value corresponds to the mean of n = 3 replicates. FW: fresh weight. Different letters for the same parameter and season indicate significant differences according to Duncan’ test (p < 0.05). *: p < 0.05; **: p < 0.01; ***: p < 0.001 and ns: non-significant, according to the ANOVA.
Table 2. Fruit quality parameters.
Season/
Treatment
FirmnessTATSSMI
(kg cm−2)(%)(°Brix)(TSS/TA)
2015/16CTL7.41.2910.17.8
RDI17.31.2610.58.0
RDI27.21.2710.28.3
2016/17CTL7.31.249.807.9
RDI17.11.2310.38.4
RDI26.81.249.807.8
Season (S)nsnsnsns
Treatment (T)nsnsnsns
S × Tnsnsnsns
Each value corresponds to the mean of n = 3 replicates. TA: titratable acidity, TSS: total soluble solids and MI: maturity index. ns: non-significant, according to the ANOVA (p < 0.05).
Disclaimer/Publisher’s Note: The statements, opinions and data contained in all publications are solely those of the individual author(s) and contributor(s) and not of MDPI and/or the editor(s). MDPI and/or the editor(s) disclaim responsibility for any injury to people or property resulting from any ideas, methods, instructions or products referred to in the content.