3.1. Characteristics of the Raw Materials and Initial Mixtures
Moisture, pH and EC of RS, SS and the initial mixtures (IMs) were initially characterised independently during both seasons (
Table 1). Although RS was harvested in rice fields during different seasons and sludge did not come from the same wastewater treatment plants (WWTPs), the values obtained for these parameters did not statistically differ, except for moisture. RS2 presented significantly higher moisture values (16.6%) than RS1 (7.03%). Despite these differences, in both RS:SS ratios (1:8 and 1:6) RS counteracted the excessive moisture of SS. The IMs showed adequate contents with 73.5% during S1 (IM1) and 69.9% during S2 (IM2) when taking into account that a range of 60–70% provides maximum microbial activity [
32]. The pH of both IMs was suitable for starting the composting process (7.22 in IM1 and 7.53 in IM2). Although the microorganisms responsible for degradation act within wide pH ranges, the recommended range for this process is around 5.5 to 8.5 because most of the enzymes present in microorganisms are active within this pH range [
33]. The larger amount of RS used in IM2 together with slightly, but not significantly, higher pH values in RS2 generated a mixture with significantly higher alkaline pH values. In addition, IM2 showed lower conductivity (5.52 dS/m vs. 8.12 of IM1), possibly due to the lower conductivity of the raw materials, but it was not possible to determine EC in RS given its hygroscopic nature.
One of the main constituents of composted organic waste is organic carbon. Total carbon consists of TOC and inorganic carbon in the form of carbonates and bicarbonates. TOC generally represents more than 90% of the total carbon in composts [
34]. No significant differences in the TOC and OOC concentrations were observed for IMs, although there were differences in these parameters for SS1 and SS2 and the proportion of straw was higher in S2 (
Table 2).
Humic substances, a major reservoir of organic carbon in soils and aquatics environments, are divided into humin (a fraction that is not soluble in water at any pH), humic acids (a fraction that is not soluble in water under acidic conditions) and fulvic acids (soluble in water under all pH conditions) [
35]. The results obtained for HS, HA and FA are shown in
Table 2. RS2 had significantly higher HS and HA concentrations than RS1. These higher concentrations, together with the higher proportion of straw used during S2, produced an IM with a significantly larger amount of HS and HA.
Microorganisms in composting processes require not only an energy source (degradable organic carbon) but also N for their development and activity [
16].
Table 3 shows the organic, mineral and total N concentrations and the C/N ratio. The total N concentrations in both raw materials and mixtures showed significant differences between seasons. Organic N in RS1 (0.775%) was almost half that in RS2 (1.33%), probably due to RS1 coming from the previous season and the important N losses that occurred during its storage. These differences were not detected in the IMs because N was provided mainly by SS. In mineral N, only significant differences were seen in NO
3−-N. Indeed SS2 showed lower values than SS1 (453 mg kg
−1 and 2047, respectively), which resulted in significantly lower NO
3−-N in IM2 than in IM1. An adequate C/N ratio in IMs is fundamental for the appropriate degradation of materials by means of microbiological activity throughout the process. The IM1 and IM2 C/N ratios were 13.5 and 12.1, respectively, which are far from 25 to 30 which is generally considered optimal. However, in a study about the influence of different C/N ratios on the microbiological activity of distinct RS and SS blends, Roca-Pérez et al., (2005) [
36] indicate C/N values of around 17 as being adequate because they lead to greater microorganism growth and better mixture homogeneity with, consequently, greater microbiological attachment. Likewise, Ferrer et al., (2002) [
27] adequately composted SS and RS in a study about the effects of urea addition and municipal solid waste (MSW)-compost extract inoculation during SS and RS composting, for which they used mixtures with C/N ratios ranging from 11.8 to 13.7.
SS showed a higher concentration of macronutrients than RS, except for K (
Table 3). This low content was due to the fact that K is highly soluble in water and remains dissolved in the effluent during the wastewater treatment process [
37]. SS showed wide variability in all the elements due to the different origins of the wastewater treated in WWTPs. Similarly, RS contents were also variable because they came from harvests of different campaigns. The values agree with the range obtained by Iranzo et al., (2004), [
25] during the characterisation of 30 RS and 7 SS as composting materials. Significant differences in raw materials led to different concentrations in the IMs, except for Mg. Both mixtures presented interesting macronutrient values, especially P, which was higher than those reported in previous studies [
26].
SS presented substantially higher micronutrient and heavy metals contents than RS (
Table 4). Heavy metals are normal in industrial and domestic wastewater and come from different sources of waste, such as batteries, paints, fertilisers, pesticides, pigments and galvanised pipes [
38,
39]. Both SS did not exceed the quality standards in force at the time for treated SS (threshold concentrations of Cd, Cu, Ni, Pb, Zn and Cr are 20, 1000, 300, 750, 2500 and 1000 mg kg
−1 dry weight for soils with pH ˂ 7 and 40, 1750, 400, 1200, 4000 and 1500 dry weight for soils with pH > 7 respectively) [
40] and fertilising products (threshold concentrations of Cd, Cu, Ni, Pb, Zn and Cr are 0.7, 70, 25, 45, 200 and 70 mg kg
−1 dry weight for the higher quality products (class A); 2, 300, 90, 150, 500 and 250 mg kg
−1 dry weight for the medium quality products (class B) and 3, 400, 100, 200, 1000 and 300 mg kg
−1 dry weight for the lower quality products (class C) respectively) [
41]. In macronutrient contents, significant differences in raw materials led to different concentrations in the mixtures of almost all the micronutrients (Zn, Ni, Pb, Cd and Cr). Similar Fe contents were obtained in both IMs in spite of significant differences in raw materials. On the contrary, IM1 and IM2 differed in Cu and Mn, but neither straws nor sludges were significantly different, probably due to the distinct RS:SS ratios.
3.2. Composting Process
Temperature and aeration are essential parameters in a composting process [
17]. The composting material was turned and mixed by a bridge turner for its cooling and aeration 34 and 22 times during S1 and S2, respectively. Turning was carried out according to the temperature measured every hour daily. In the beginning, turning was conducted very frequently to achieve the homogenisation of materials. Proper aeration allows temperature control, eliminates excess moisture and CO
2, and provides O
2 for biological processes [
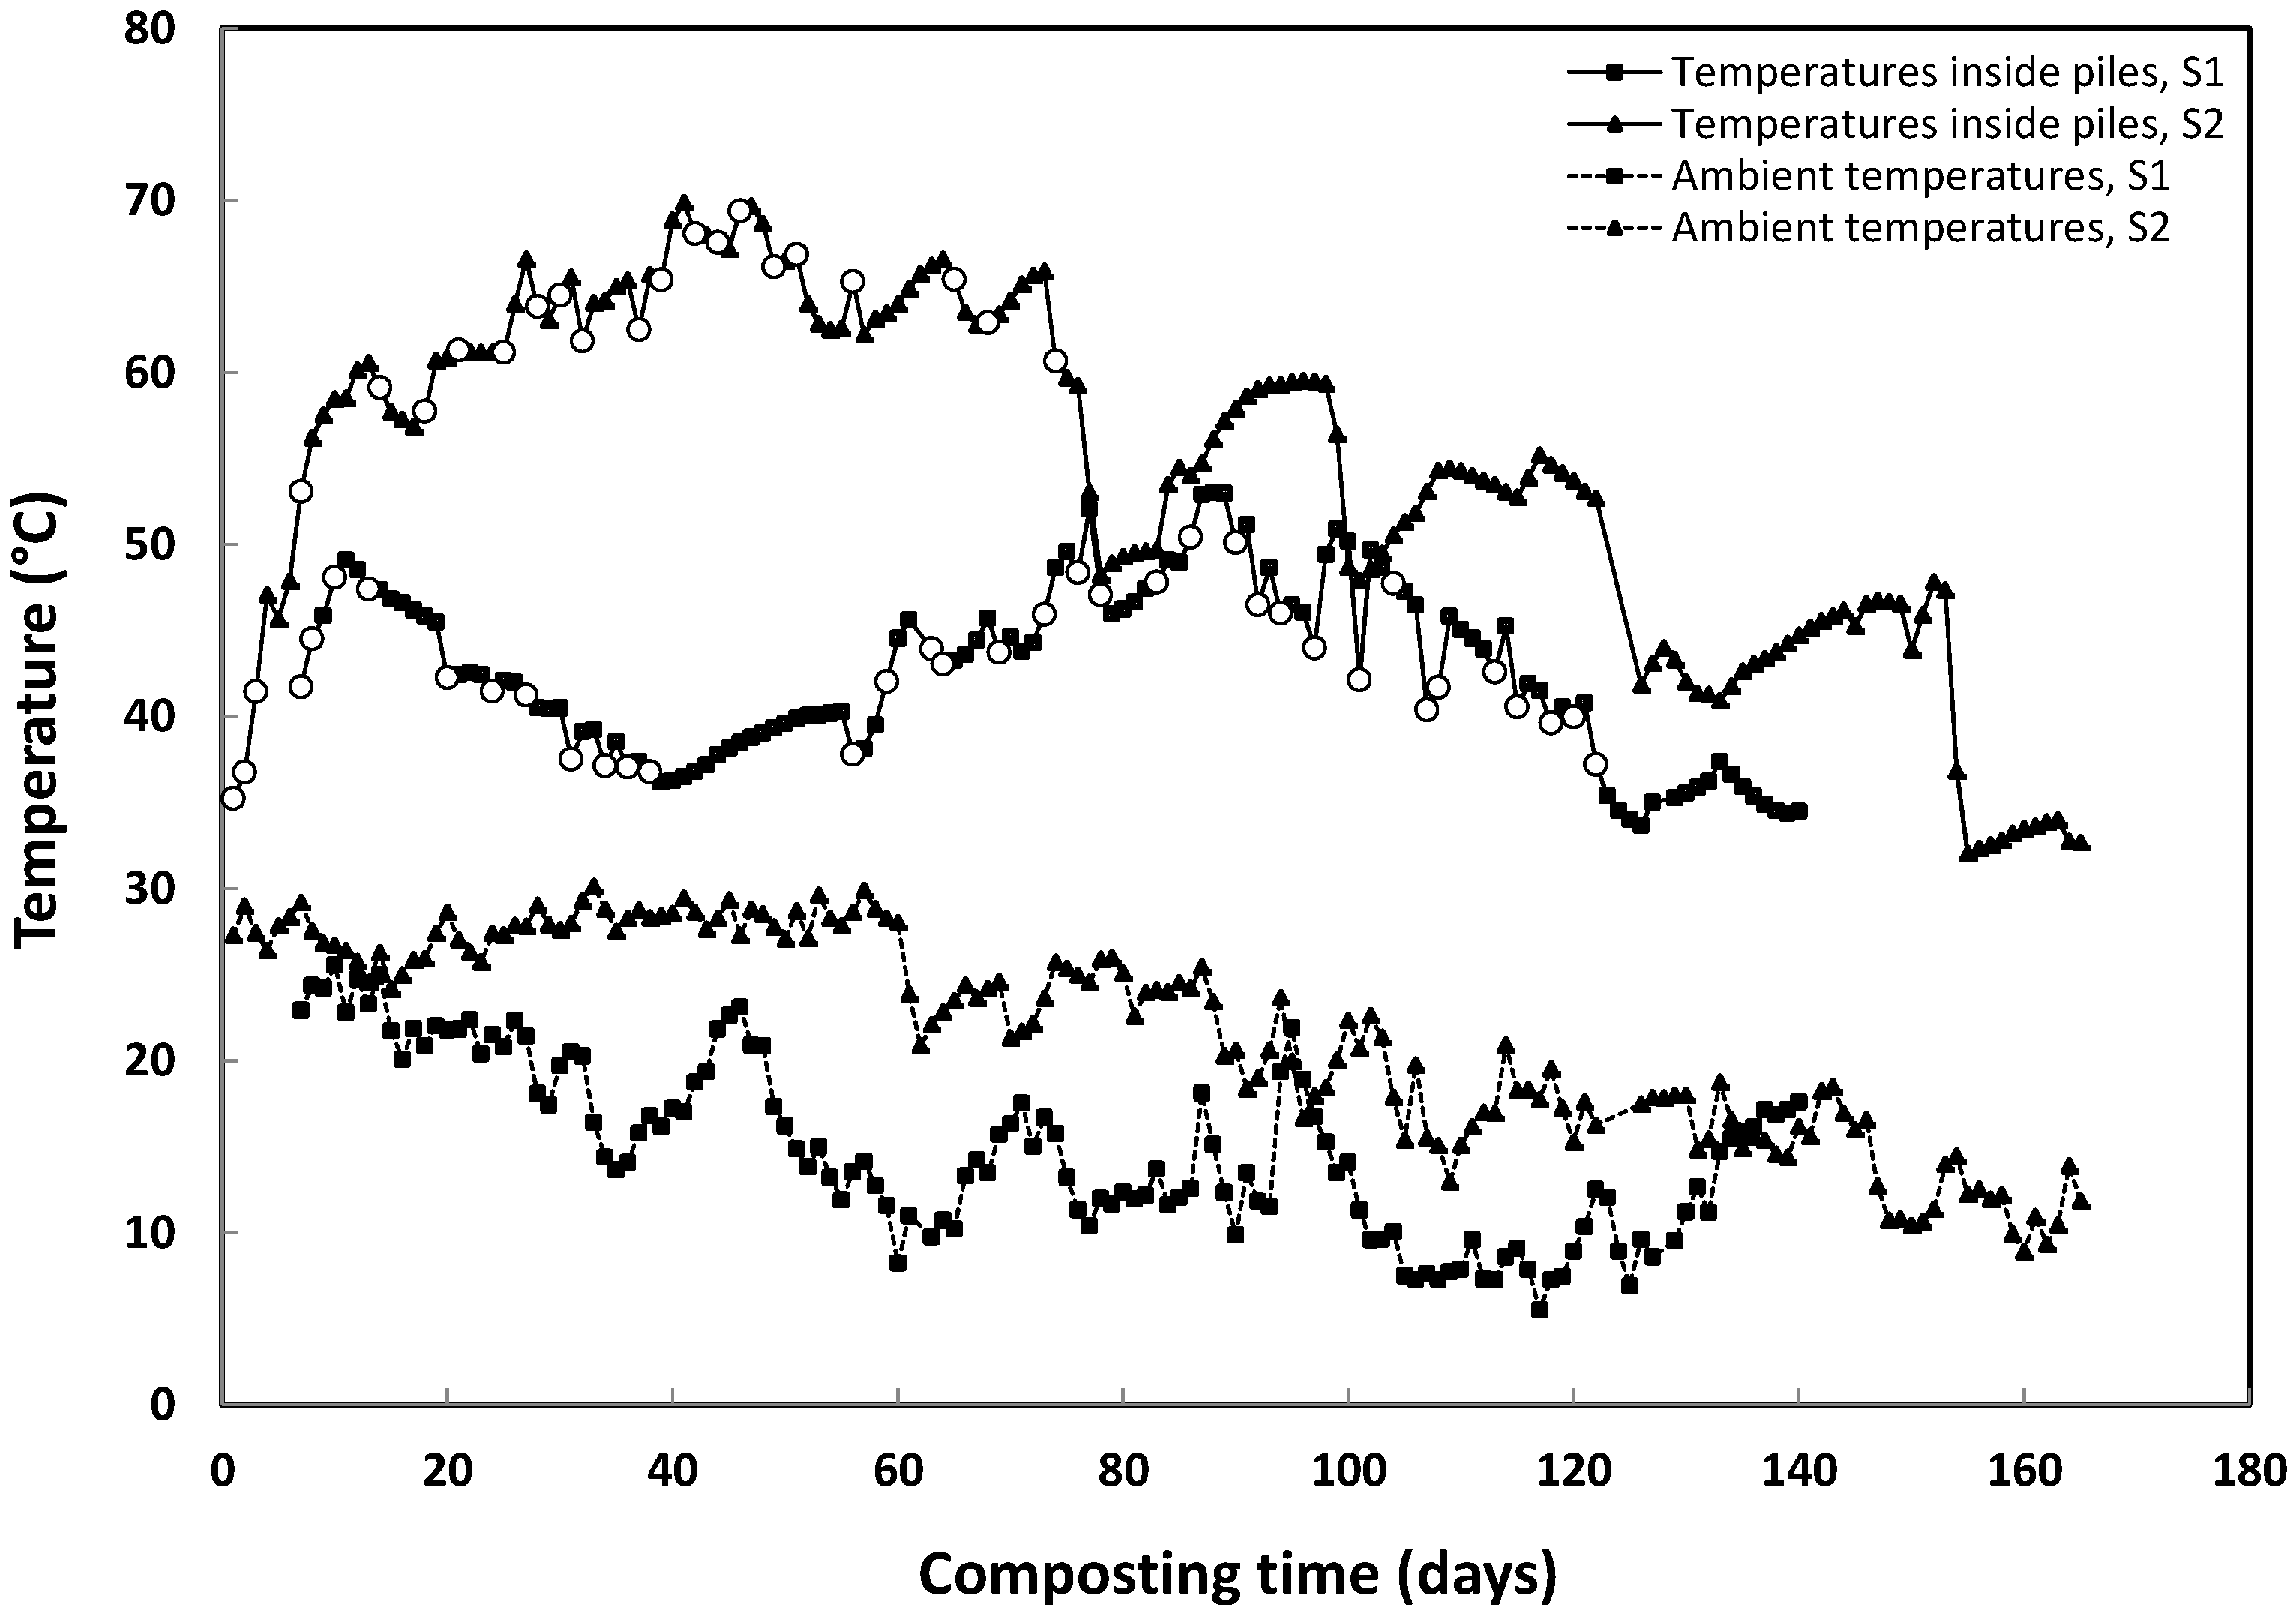
16]. The temperature values obtained inside each pile during the processes, and the ambient temperatures and turnings carried out during both seasons, are shown in
Figure 1. During S1, the process occurred within the upper range of mesophilic temperatures (T < 55 °C). These temperatures allow greater mass loss because they maximise the biodegradation rate [
42]. However, thermophilic temperatures (T > 55 °C) were not reached because the maximum value was 53 °C, obtained on days 88 and 89. Although this temperature may be insufficient to ensure the complete sanitation of the resulting products, the microbiological analyses of final composts showed E. coli contents less than 1000 MPN g
−1 and the absence of Salmonella spp. in 25 g, meeting the legislation requirements [
41]. The difficulty in reaching high temperatures was probably due to the initial stability of the employed SS. Indeed Maulini-Duran et al., (2002) [
43] demonstrated that composting processes of wastewater sewage sludge biologically treated by anaerobic digestion attained lower temperatures than raw sludge composting due to the significant stabilisation of organic matter in digested sludge. According to the obtained data, an increase in the initial proportion of RS was considered to favour a more vigorous process and to increase the RS management capacity of the commercial facility. Thus during S2, the RS:SS ratio of 1:6 (w:w) was used. This ratio made it possible to reach higher temperatures: from 67 °C to 70 °C for 40–48 composting days. This compost was acceptable in sanitation terms (absence of
Salmonella spp. in 25 g and <1000 MPN g
−1 of
Escherichia coli). During both processes, at around 127 days of composting the temperature began to not substantially increase after turnings, which indicates the beginning of the maturation phase.
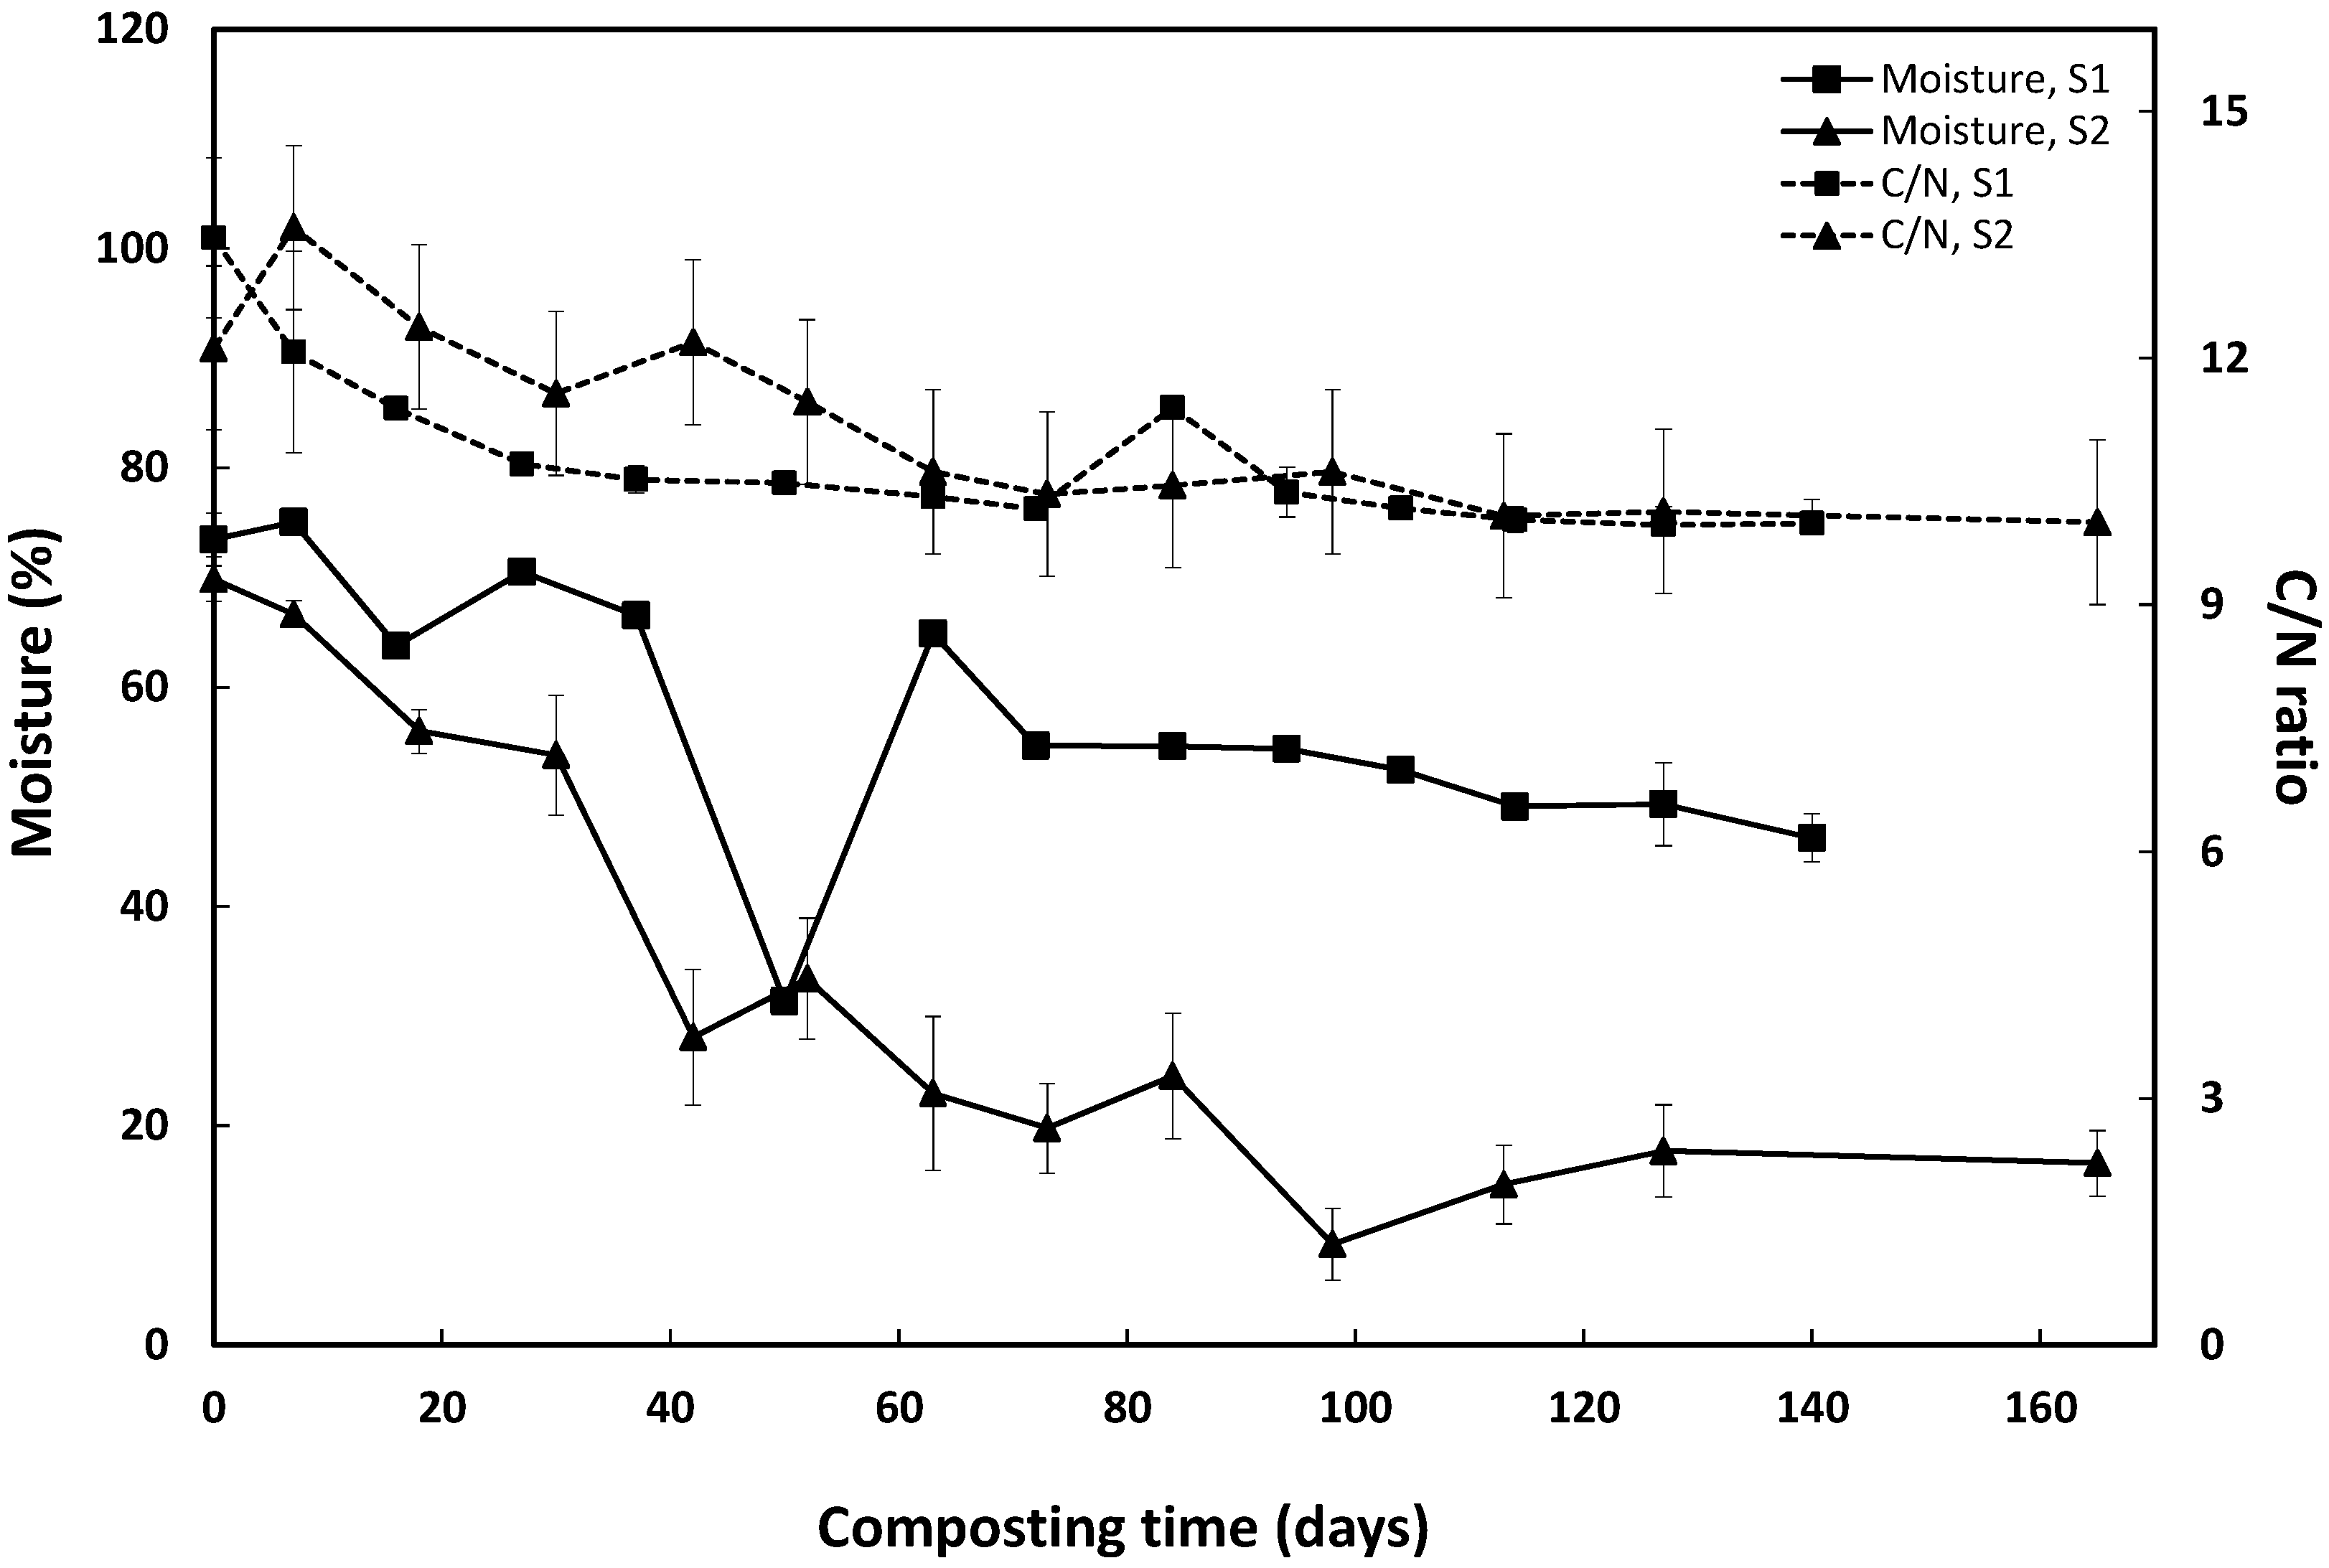
In addition to temperature, moisture content and the C/N ratio also strongly influence microbial activity. The evolution of these parameters during both seasons is shown in
Figure 2. Moisture content decreased in the first 50 days during both S1 and S2, but this decrease during S1 was accompanied by a significant drop in temperatures, unlike S2. When moisture is very low, the process can be prematurely stopped and the inhibition of microbiological activity may occur by entraining temperature reduction [
42]. Therefore, during S1, intensive watering was carried out using a hose connected to a tank attached to a forklift truck to reach the highest points of piles. Despite the low moisture content during S2, no irrigation was performed because temperatures indicated adequate process progress. During both seasons, the C/N ratio gradually lowered until it stabilised by the end of composting. This trend is usual in such processes and agrees with other studies of SS composting with different bulking agents [
37,
44].
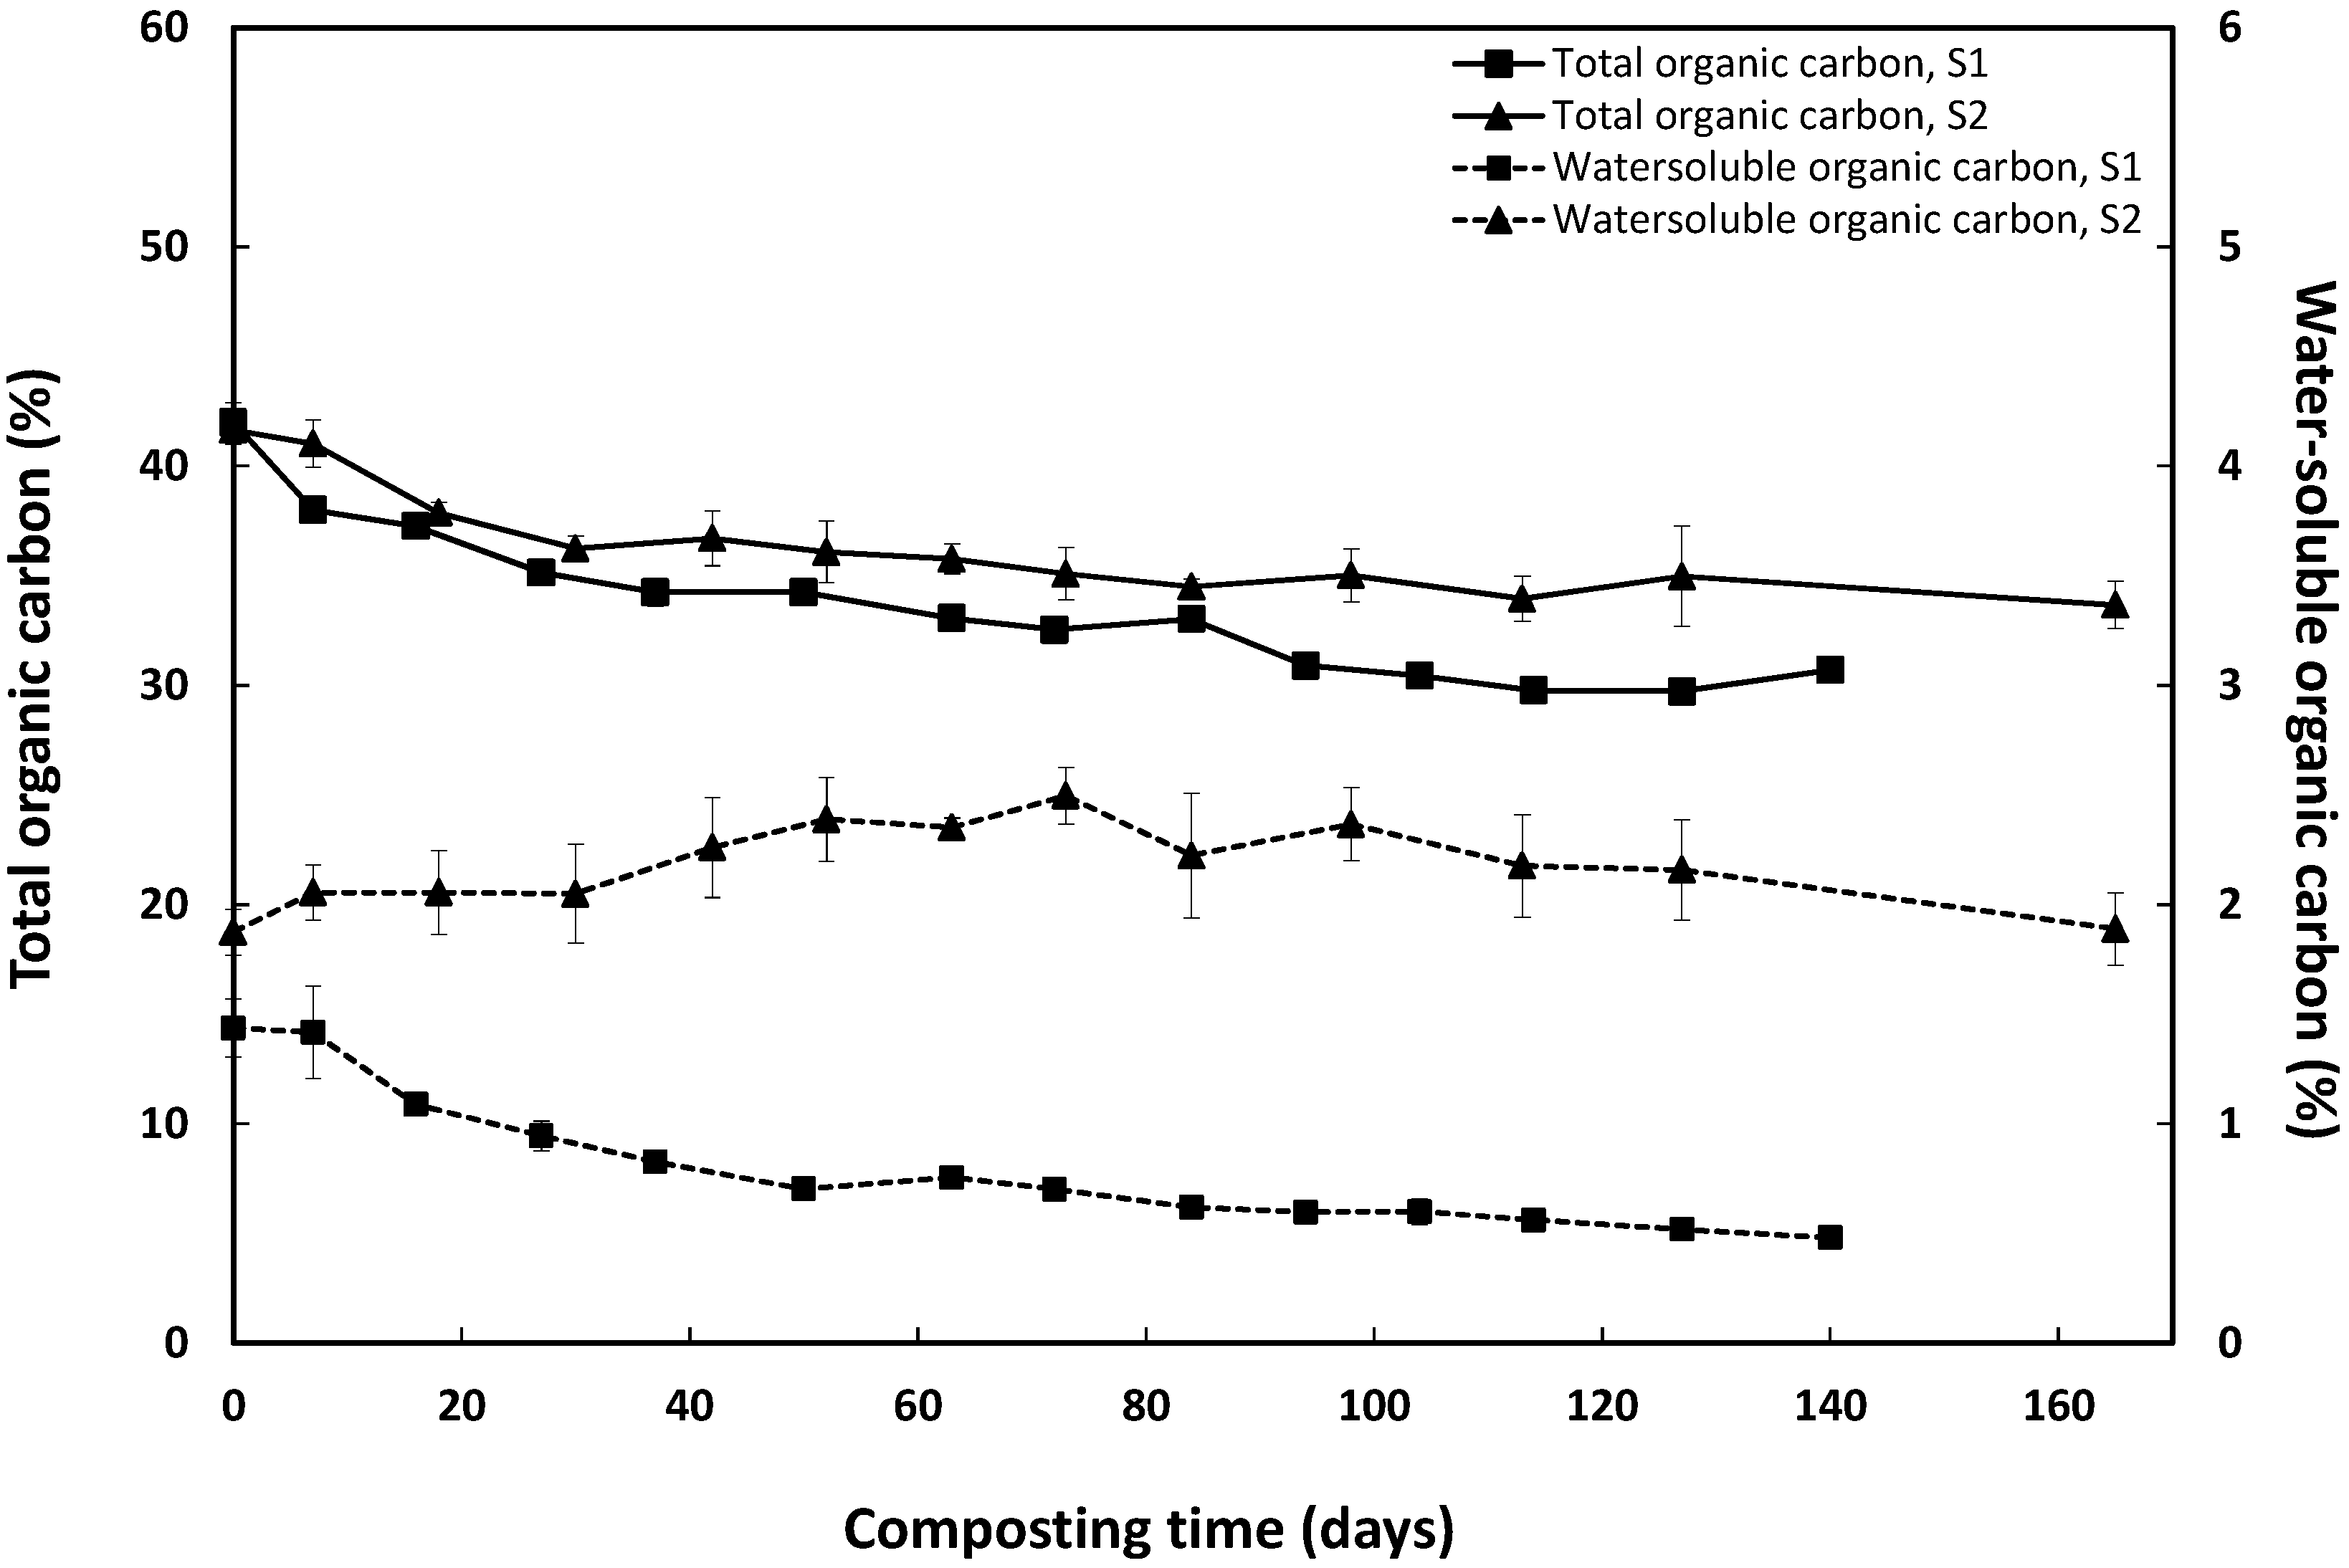
The decrease in the C/N ratio was supported by reductions in total and water-soluble organic C (
Figure 3). At the end of composting, TOC reduction was greater during S1 (27%) than during S2 (19%). Microbial degradation, which causes decomposition and loss of organic matter, would have been promoted by both moisture conditions during S1 and material homogeneity being better as a result of the lower RS:SS ratio. WSOC content is an indicator of the quantities of readily degradable substances in or generated from organic materials [
45]. The initial values of 1.44% and 1.88% for IM1 and IM2, respectively, were lower than those usually generated in mixtures with other raw materials due to the relative initial stability of the previously digested sludge. Indeed Sanchez-Monedero et al., (2001) [
46] reported WSOC content to be 2.43% for an IM while composting primary aerobic sewage sludge and cotton waste. During S1, this parameter decreased throughout the process (67%). However, during S2, it behaved differently because the amount of the bulking agent was larger. The final value (1.89%) was practically the same as the initial value as a result of a balance between the degradation rates of labile organic compounds and the mineralisation of the resulting fractions.
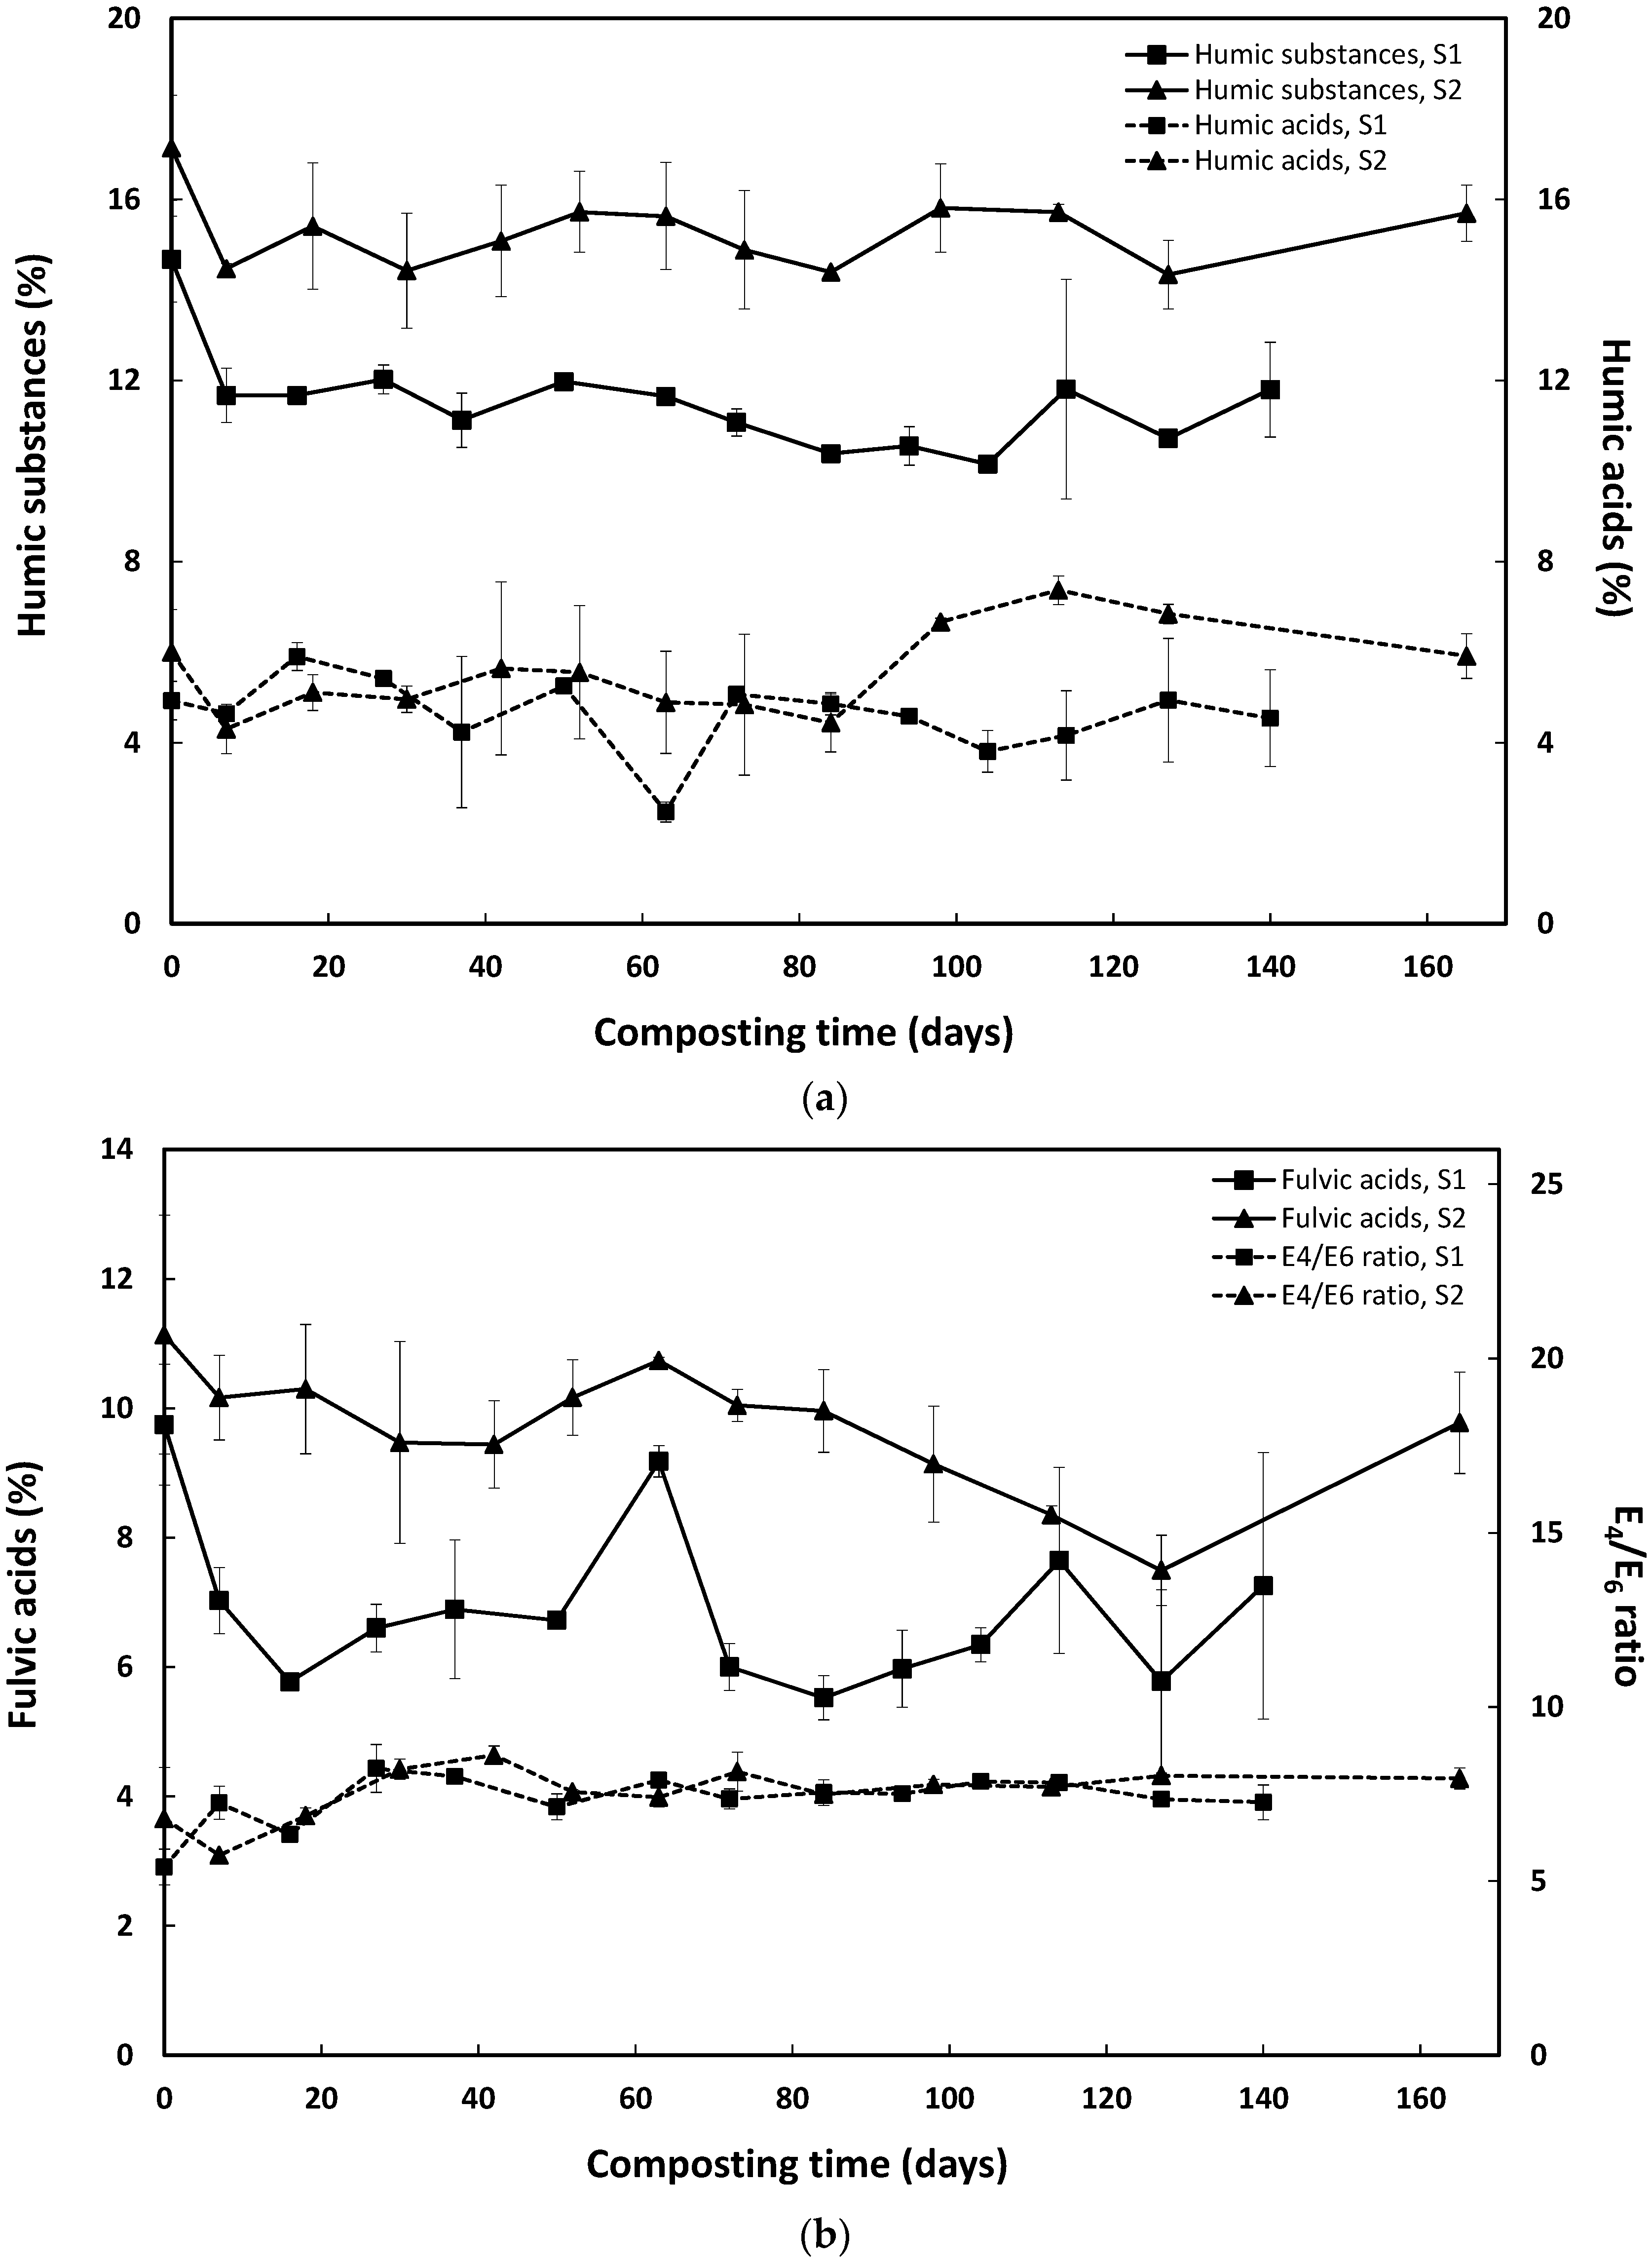
The evaluation of the degree of organic matter humification during composting is an agronomic criterion for assessing compost quality [
23]. Organic matter humification during composting is evidenced by the formation of humic acids with increases in molecular weight, aromatic characteristics and functional groups [
16]. As the process progresses, humic substances are produced, humic acids increase, while the fulvic acid fraction decreases or remains unchanged [
16,
47]. In our study, the data obtained for HS, HA, FA contents and the E
4/E
6 ratio of humic acids generally showed wide variability (
Figure 4). This variability was due to both the extreme sensitivity of the analytical method and the material’s wide variability. A similar variation was observed by Canet and Pomares in 1995 [
48] in a study of MSW composting on the industrial scale.
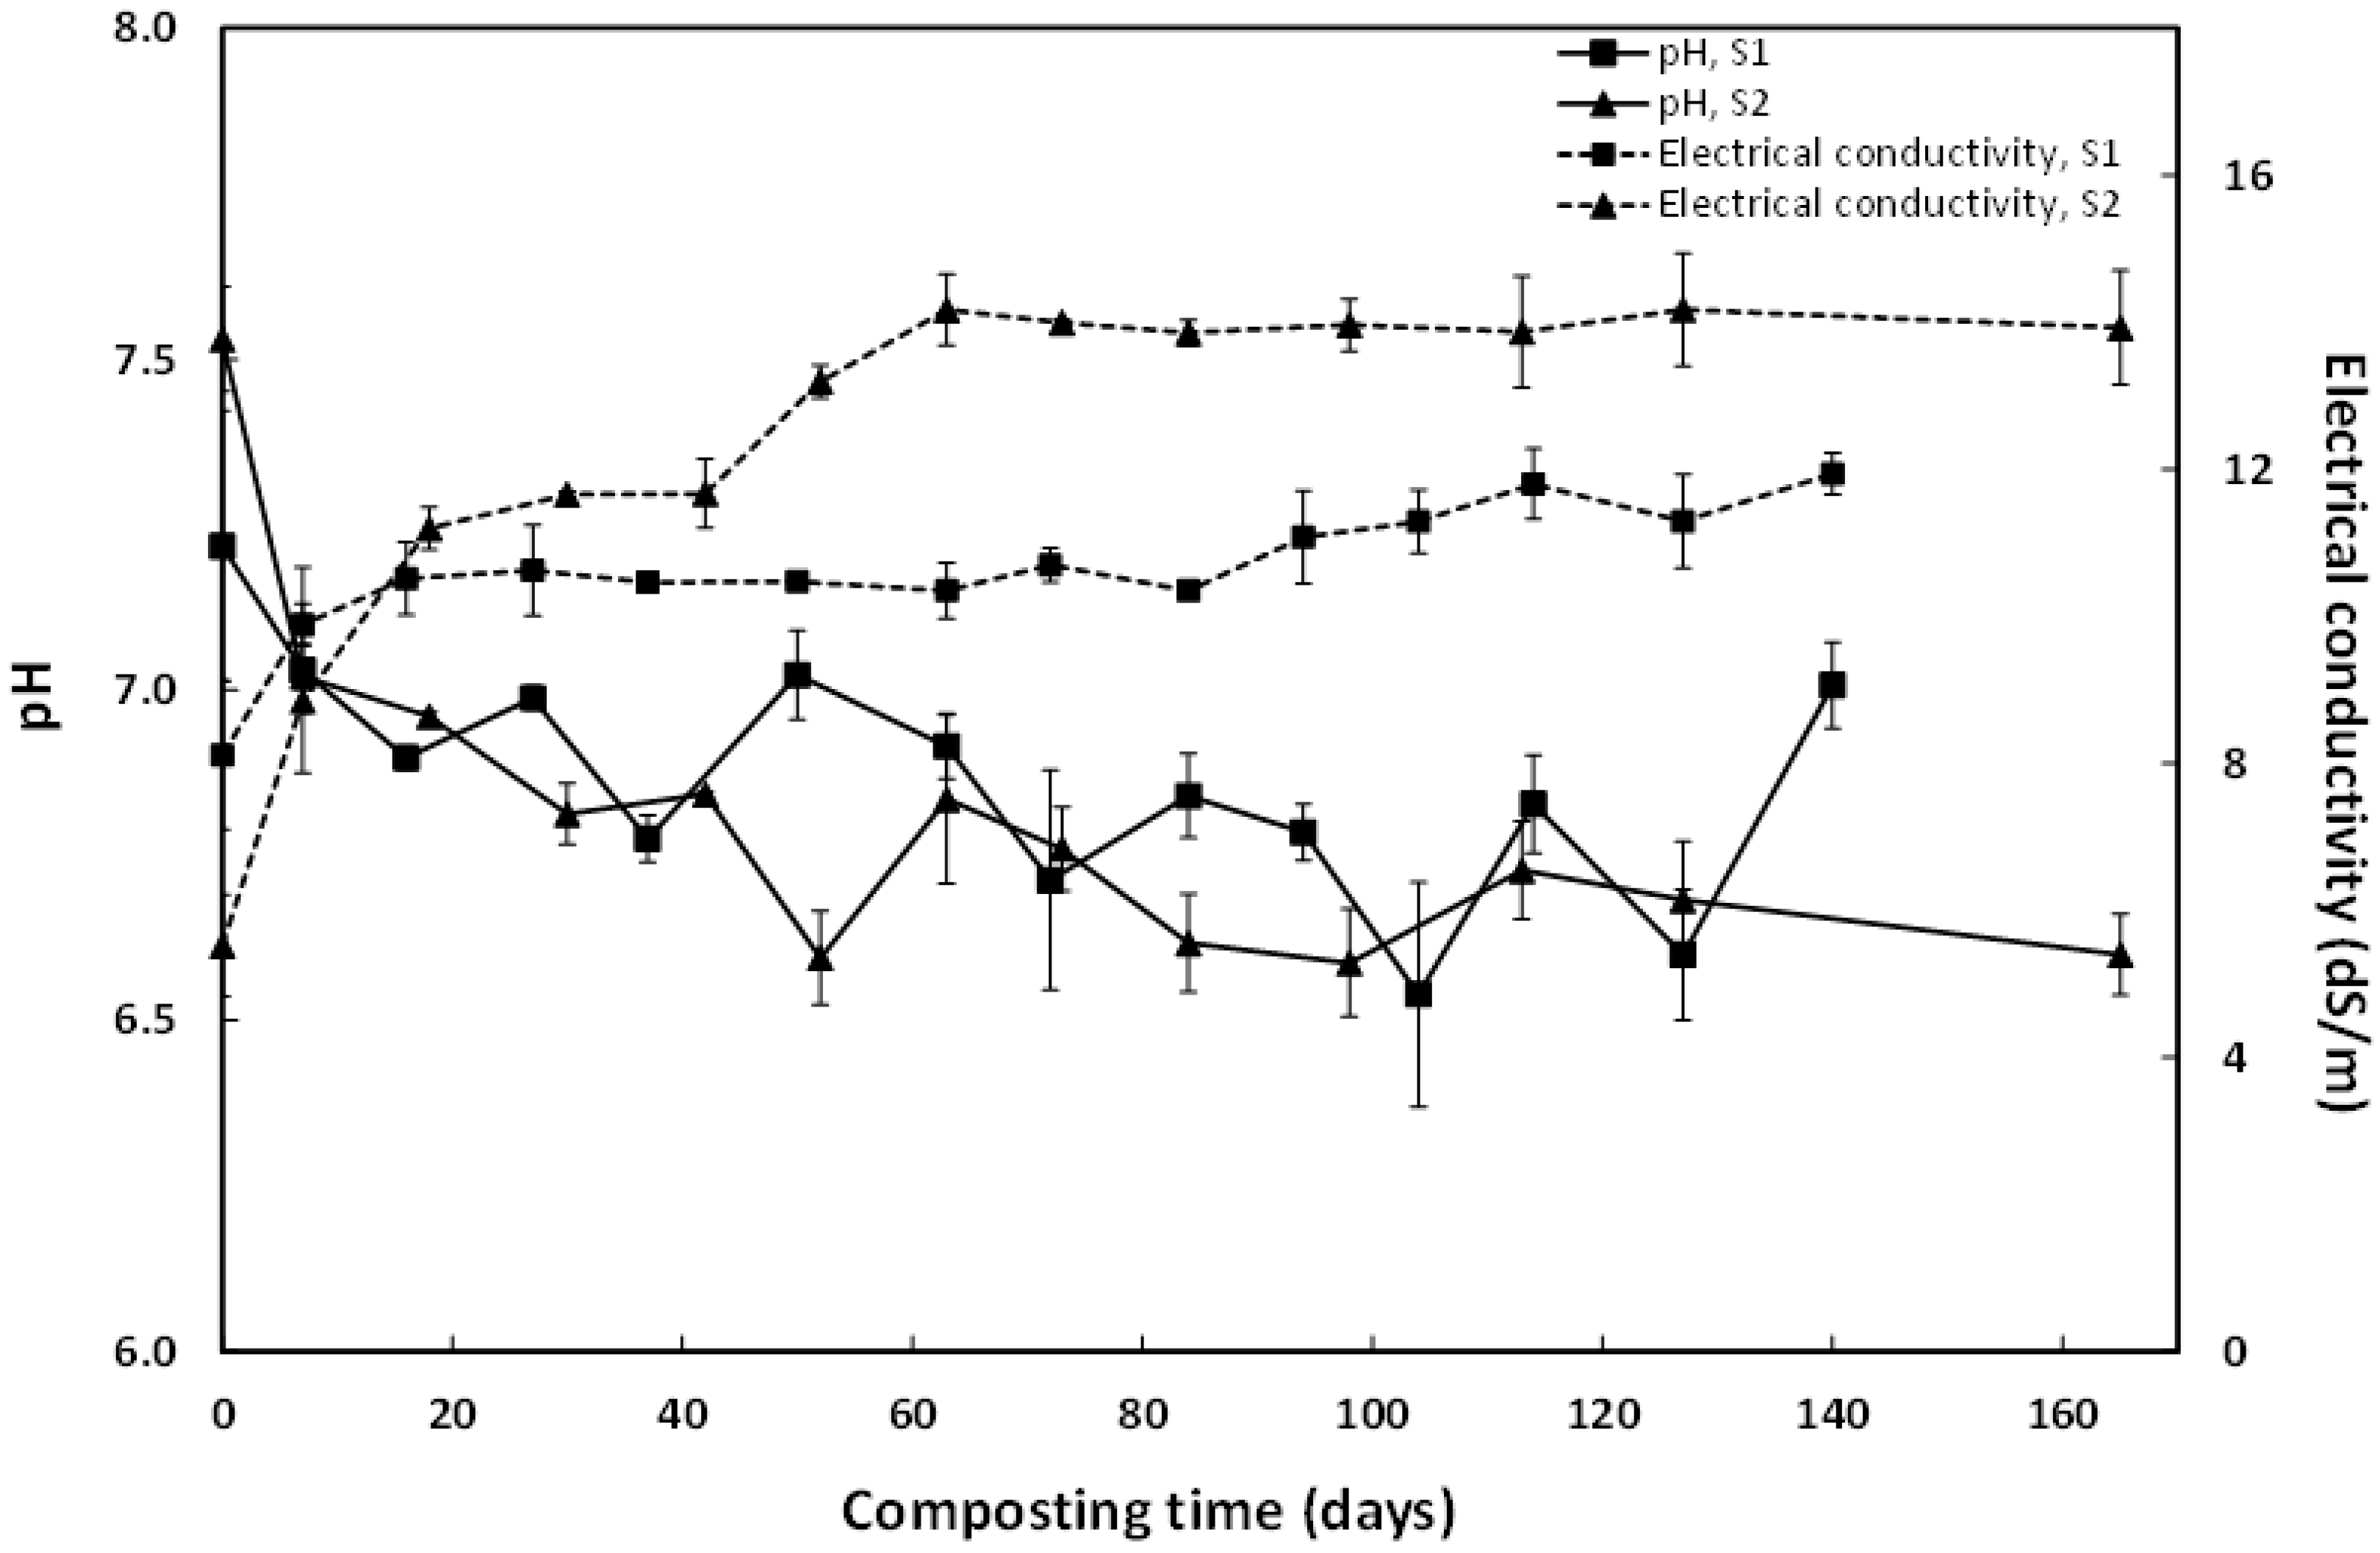
The evolution of pH and EC during processes is shown in
Figure 5. Microbial activity during a composting process can be favoured by adequate pH, with optimum values between 5.5 and 8.0 [
16]. During both seasons, the pH values fell within this optimal range. pH evolution during composting usually moves towards neutrality as a result of the gradual disappearance of the simplest and most reactive organic forms throughout the process. In our study, the pH values at the beginning of processes were slightly alkaline, probably due to the large quantity of ammonium released from the N components present in sludge. However, during composting, the pH values were under 7 most of the time due to the production of organic acids by carbohydrate and lipid degradation [
23].
Large increases in EC were observed in the initial phase for both seasons, caused by the release of soluble salts like ammonium and phosphate that result from the decomposition of readily biodegradable organic substrates [
49]. However, these values stabilised as the process progressed because of a balance between a decrease due to the reduction of water-soluble substances, ammonia volatilisation and the precipitation of mineral salts [
22] and an increase in the total salt concentration because organic matter disappeared. The incorporation of a larger amount of straw in IM2 resulted in a greater increase in the degree of salinity, with a rise of 152% versus 47% for S1.
During a composting process, N is lost by NH
3 volatilisation, leaching and denitrification. At the same time, N concentration increases as a consequence of a concentration effect due to the weight reduction of a pile. In our study, as an outcome of both situations the initial total N and the final total N were close during both seasons (3.13% initial N —3.07% final N and 3.45% initial N —3.37% final N, for S1 and S2, respectively) (
Figure 6).
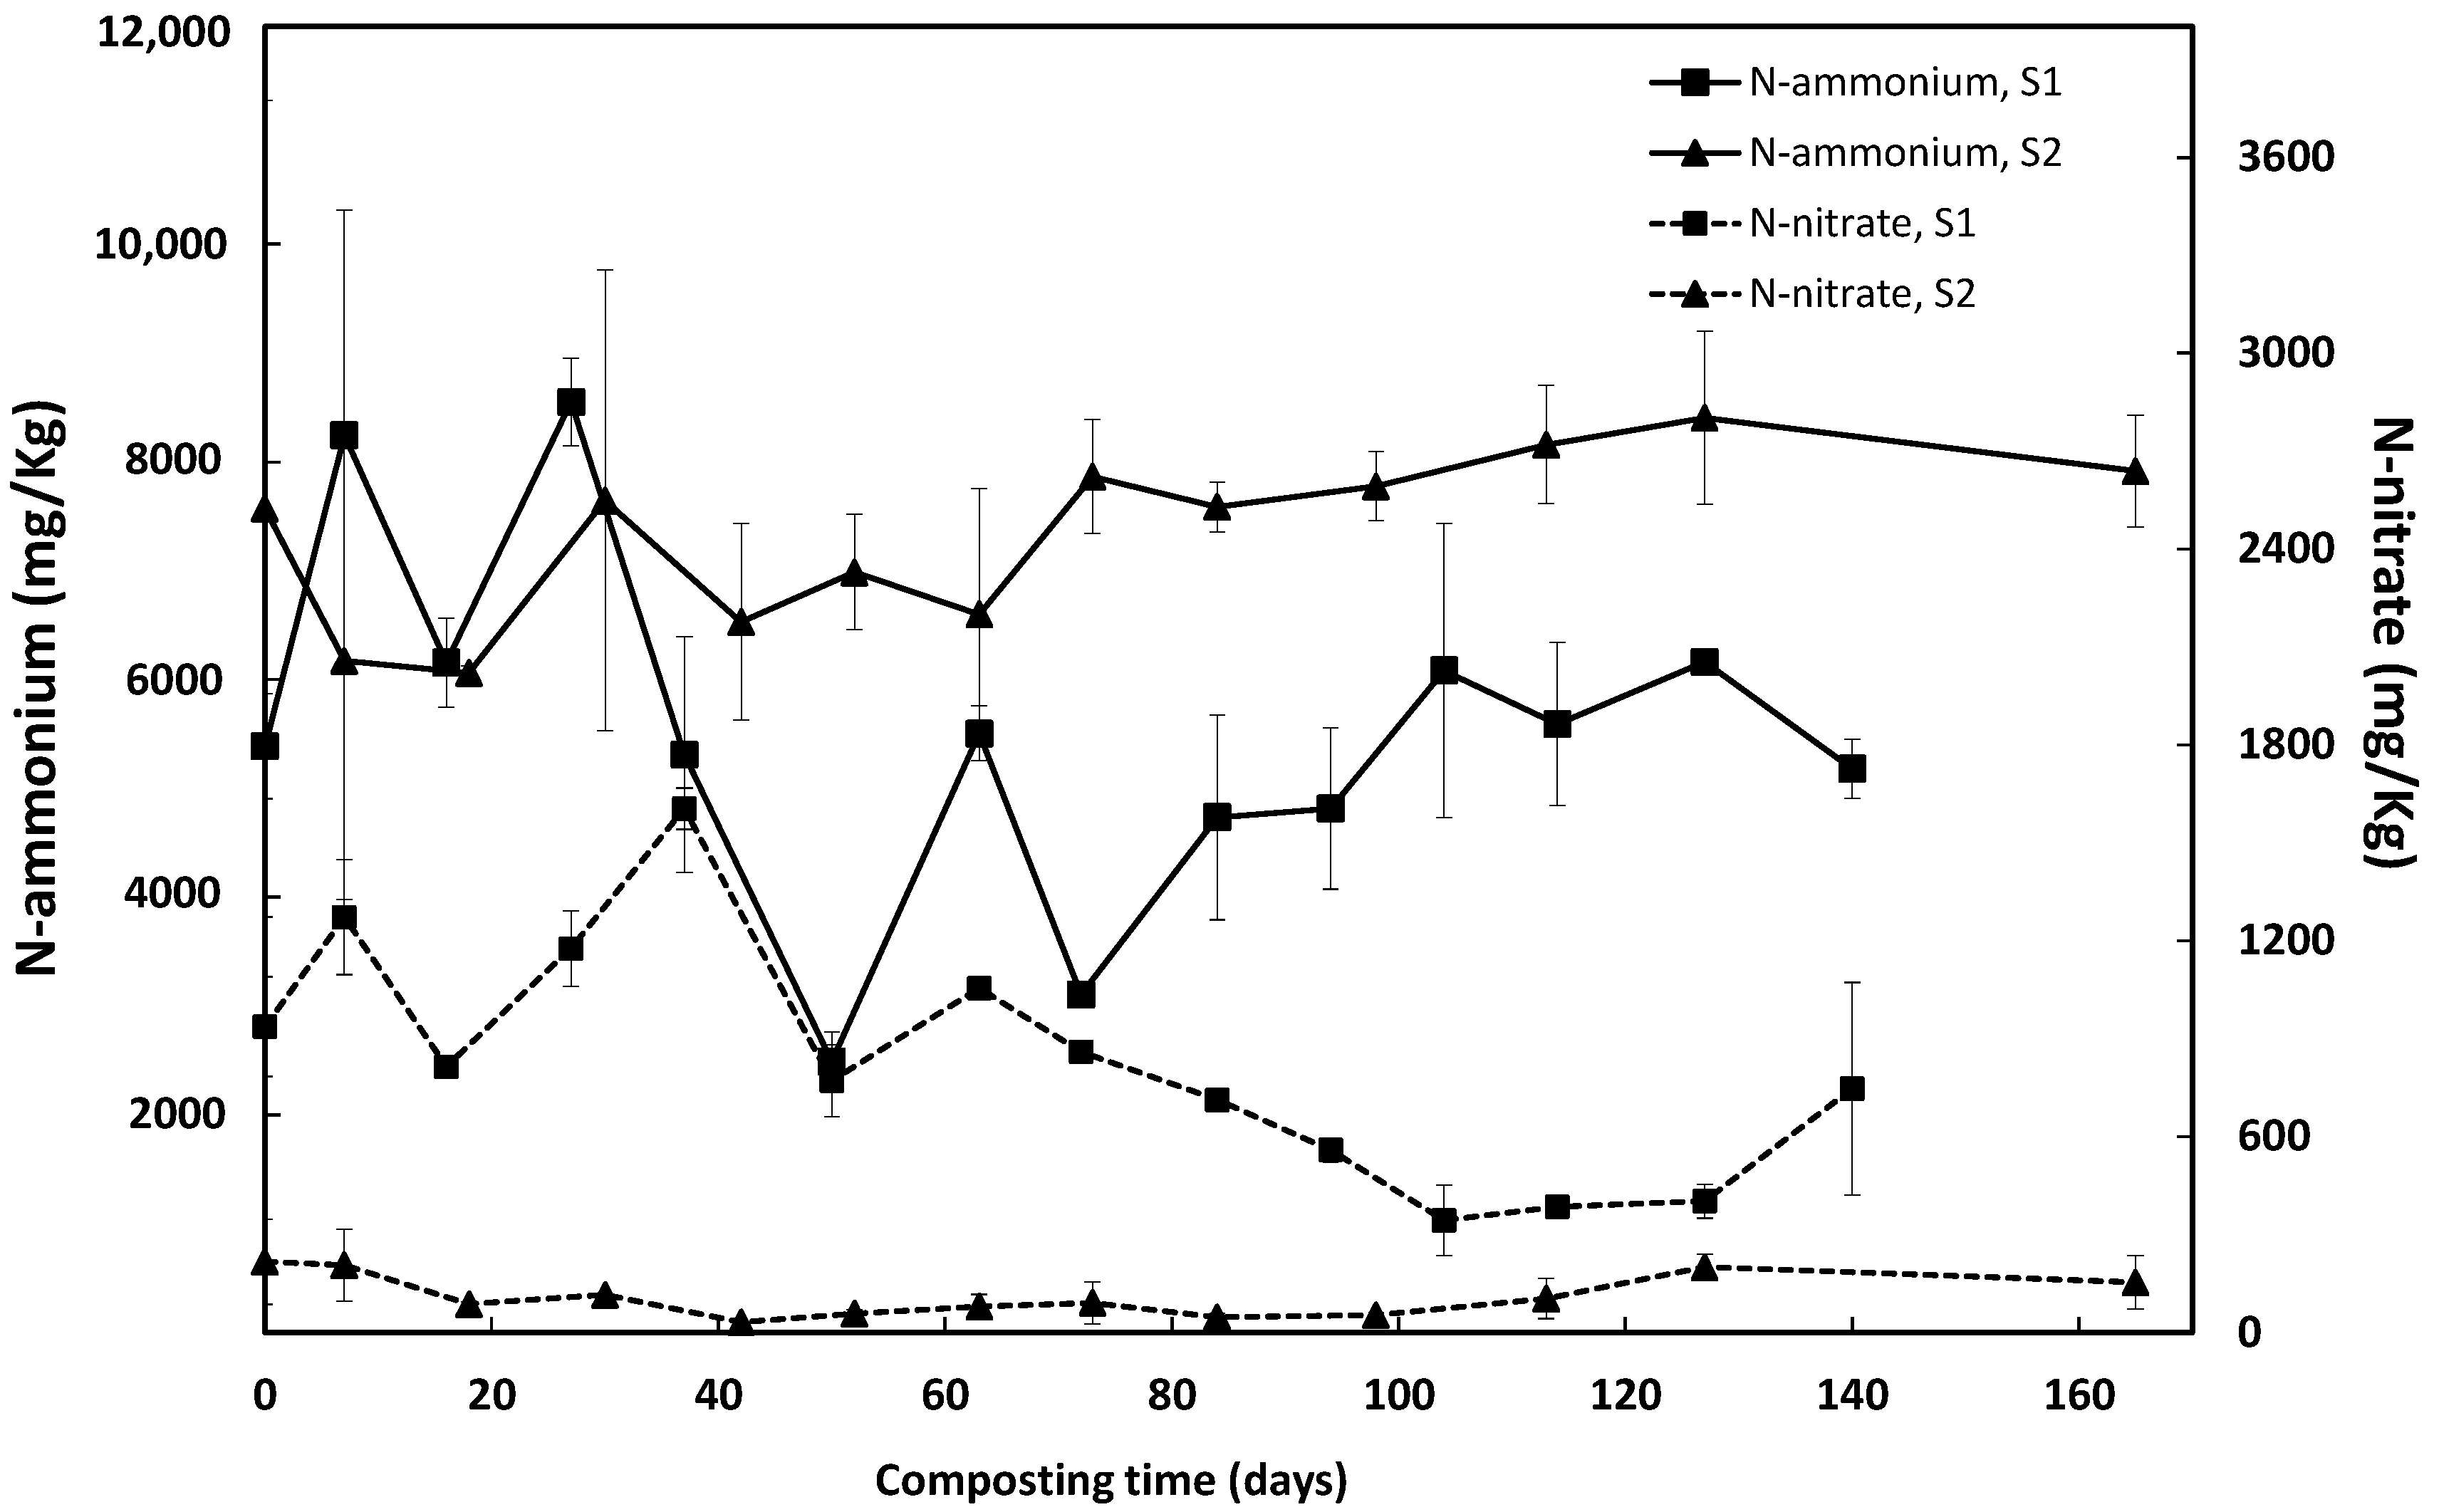
The mineral N, NH
4+-N and NO
3−-N concentrations (
Figure 7) varied throughout the process during both seasons. During S1, the NH
4+-N concentration lowered by 4% after 140 days of composting. This reduction could have been due to nitrification and NH
3 volatilisation [
50]. However, volatilisation was not favoured due to the moderate pH values of processes (pH < 8) [
51]. On the contrary, during S2 NH
4+-N increased by 5% after 165 days of composting, probably because of the predominance of the ammonification process, which converts organic N into NH
4+ [
23].
The expected increase in NO3−-N, which is normally seen at the end of composting processes, was not observed in either season. No important leaching losses occurred as the conditions under which composting was conducted did not favour the formation of leachates. Indeed, windrows were built under cover to avoid the influence of possible precipitation, and irrigation was occasional (once during S1) or nil (during S2). The most likely explanation for the lack of NO3−-N accumulation would be that important denitrification would have taken place during S1 and, in agreement with the TOC and WSOC results, the higher RS:SS ratio during S2 would have slowed down the process and, therefore, that of nitrification.
3.3. Yields Obtained and Analytical Characteristics of the Composts
After completing the process, the composted mixtures were sieved. The amounts of compost obtained per season were 14,135 kg (weight basis) of C1 (average of the two composts obtained during S1) and 7960 kg of C2 (average of the two composts obtained during S2). The composts generated per kg of initial RS, the RS required for the formation of one kg of compost and the yields obtained during both seasons are shown in
Table 5. During S2, a larger quantity of RS was used to produce one kg of compost compared to S1. As one of the present study objectives was to valorise the maximum amount of RS possible, the composting process during S2 would be the most appropriate. Increasing the bulking agent during S2 resulted in significantly lower yields in wet weight, but similarly to dry weight, which suggests that changes were due mainly to water losses.
In both seasons, compost granulometry met legislation requirements (>90% compost particles >25 mm, <2% gravel particles >5 mm, <1.5% impurities >2 mm) [
52]. The final moisture, pH and EC values of composts are shown in
Table 6. As a result of the low moisture contents throughout the process, C2 (26.2%) was significantly drier than C1 (46.2%) and met the legislation requirement of 40% maximum moisture [
52]. The pH values in both C1 and C2 (6.94 and 6.96, respectively) fell within the recommended range according to previous studies [
53]. Indeed these values are especially interesting for their application in soils like the alkaline ones found in the Valencia region. C1 and C2 significantly differed in EC, and had higher values than IM1 and IM2, due to lack of watering and the salt concentration as a result of reduced organic matter. Both composts had high EC values, which should be considered in their doses for field application purposes. However, given the nutrient richness of the sludge composts, the ratio of salt input per unit of compost may be advantageous compared to other poorer composts, such as MSW. Furthermore, the improvement in soil structure that compost application produces can favour salt washing and might, thus, reduce salinity problems.
The total, oxidisable and WSOC of composts are indicated in
Table 7. TOC in C1 and C2 corresponded to 52.4% and 56.5% of total organic matter, respectively, being higher than the minimum content (35%) indicated in the legislation [
52]. Due to the different organic matter evolution during composting, C1 and C2 significantly differed in TOC and OCC values, although no significant differences were observed in the IMs. The larger amount of RS during S2 would have slowed down the process. The higher proportion of RS led to an increase in plant components, such as cellulose, hemicellulose and lignin, the last of which is the most difficult component to degrade. While composting SS and green waste, after 135 days of composting Jouraiphy et al., (2005) [
54] found that 61% and 70% of cellulose and hemicellulose, respectively, was degraded, but only 37% of lignin. This slower process resulted in less mature composts according to the final WSOC values with 1.86% for C2 versus 0.475% for C1 and despite the process taking more days than during the first season. According to Bernal et al., (1998) [
55] and Hue and Liu (1995) [
56], who set WSOC at <1.7% and WSOC at <1%, respectively, as a limit for mature composts from a wide range of wastes, C1 would be a mature compost, while C2 would not.
HS contents were significantly different in composts, as they were in the IMs, with values of 9.62% and 15.6% for C1 and C2, respectively (
Table 7). HA and FA were higher in C2 than in C1 (8.38% HA and 7.17% FA vs. 4.28% HA and 5.34% FA) where a bigger straw fraction was used. The values in both composts agree with the 13.4% HS, 7.97% HA and 5.21% FA reported by Zhao et al., (2016) [
17] for an RS compost with SS.
Table 8 presents the N contents and C/N ratios. The total N in all the composts was high, with higher values in C2 than in C1. There was good sustaining N despite the many performed turnings because the final contents were in the same order as those in the IMs. Values were higher than those reported by other authors in SS and RS composts, such as Jusoh et al., (2013) [
53] (1.80%) and Zhao et al., (2016) (1.86%) [
17]. In the same way, total N was high compared to most manures [
57,
58], which shows its interesting potential as an N organic fertiliser. High ammonium levels stood out, which were not negative because N richness is very important in an organic fertiliser, but it must be taken into account to obtain the correct dose of compost. The final C/N ratio values of 10.1 and 9.72 for C1 and C2, respectively, met legislation requirements for fertilizing products (C/N < 20) [
52] and agreed with those considered by Fialho et al., (2010) [
59], who estimated that final values to be about 10, which indicates slow microbial activity and the material’s stabilisation.
As seen in
Table 8, macronutrient contents increased during both processes due to the drop in the total mass. Significant differences between both seasons were observed for all the nutrients. Similar P
2O
5 (4.97%), K
2O (1.04%), MgO (1.25%) and Na
2O (0.307%) contents were obtained by Ferrer et al., (2002) [
27] in an SS and RS compost.
The micronutrient and heavy metal contents of composts are shown in
Table 9. Although the composting process intrinsically reduces the availability of heavy metals compared to other organic waste stabilisation methods, the heavy metals content in composted waste materials must be controlled to protect soil quality and avoid contamination [
60]. Cu, Ni, Pb, Cr and Hg for C1 and C2 concentrations would allow their inclusion in class B fertiliser products by Spanish legislation [
41]. However, Cd and Zn concentrations were slightly higher than the maximum permitted values (2 mg kg
−1 for Cd and 500 mg kg
−1 for Zn). Higher Cd and Zn values of 2.5 and 610 mg kg
−1 have also been reported by Roca-Pérez et al., (2009) [
26] in SS and RS composts. In general, the micronutrients and heavy metals values increase during the composting process due to the microbial degradation of the organic matter and loss of volatile solids [
60]. Therefore, despite the IMs containing Cd and Zn at the allowed values, their concentrations during composting led to high Cd and Zn values. Starting with raw materials with lower Cd and Zn values could have avoided exceeding limitations. New legislation has been recently published in Spain [
61] to set standards for sustainable nutrition in agricultural soils. The concentrations of the heavy metals in C1 and C2 would comply with the established levels. Valuable micronutrient concentrations suitable for agricultural use were obtained in both seasons, and the high Fe levels in C1 and Mn in C1 and C2 are especially interesting. In S1, both micronutrients and heavy metals (except Mn and Cd) showed much higher contents compared to the IMs than during S2, which confirms greater organic matter degradation as the TOC, OCC and WSOC values also indicate.


