1. Introduction
In 2022, Brazil had the thirteenth largest strawberry yield area across the globe, with 5279 hectares cultivated and an average productivity of 41.46 tons per hectare [
1]. In this scenario, the ‘Albion’ and ‘San Andreas’ cultivars, both classified as photoperiod-neutral days, occupied approximately 65% of the total area established with strawberry cultivation in Brazil. This is because they present better phytosanitary quality and robustness against biotic stresses [
2]. The state of Rio Grande do Sul (RS), located in the southern region of Brazil until 2022, was the third-largest national producer of strawberries. Because it has specific characteristics compared to other regions of the country, it has preferentially adopted the soilless cultivation system in a protected environment using day-neutral cultivars [
3].
Soilless systems increase the number of plants per area, mainly by reducing the spacing between the plants. This higher density can lead to a lower yield per plant and higher yield per area, proven by studies, which, when using higher plant spacing, obtained higher averages of the total yield per plant, and with lower spacing, higher yield values occurred [
4].
The yield system and the management employed can alter the behaviour of the plant, and it is known that excessive cold hours promoted significant increases in the number of axillary buds, the delay in the onset of spring flowering, and the stimulation of the stolon yield [
5]. However, there is no knowledge that other factors can influence plant behaviour, such as the yield of bare-root or tray plants, the stage of maturation of the roots of pre-planted plants resulting from the increased time of permanence of the plants in the nursery, and variations in the humidity of the substrate in the initial period, which can modify the development of the root system and the development of the plant. It is important to note that plant behaviour can be altered with variations in planting time, climatic conditions, and the cultivar used [
6,
7,
8,
9,
10].
Plant acquisition costs varied according to the type of plant. According to information from the company Bioagro Comercial Agropecuária, in 2023, cold-preserved plants from Spain had the highest cost, followed by bare-root plants imported from Argentina and Chile and mini tray plants with national young roots with matrices from Spain.
In RS, most of the plants used were bare-root plants from Argentina or Chile and cold-preserved plants from Spain. The preference for imported plants occurred because phytosanitary inspection procedures were mandatory. Only 4% of the plants used were domestic [
4]. Nevertheless, the yield of mini tray plants and national tray plants showed a reduction of phytosanitary problems since they were produced in an inert substrate. According to agroclimatic zoning, the northeastern region of the state of RS presents suitable conditions for the yield of strawberry plants [
11]. This region has some specific characteristics, as these nurseries are situated above 900 m above sea level, and the formation of flower buds is anticipated concerning nurseries located at a low height above sea level (h.a.s.l.) [
12].
Considering the importance and essential nature of strawberry culture for Brazil, especially for the South region, this work was carried out with the objective is to study the complex of adaptively significant traits of the ‘Albion’ strawberry using different technological methods of cultivation to improve the quality of planting material of berry products and reduce dependence on imports.
2. Materials and Methods
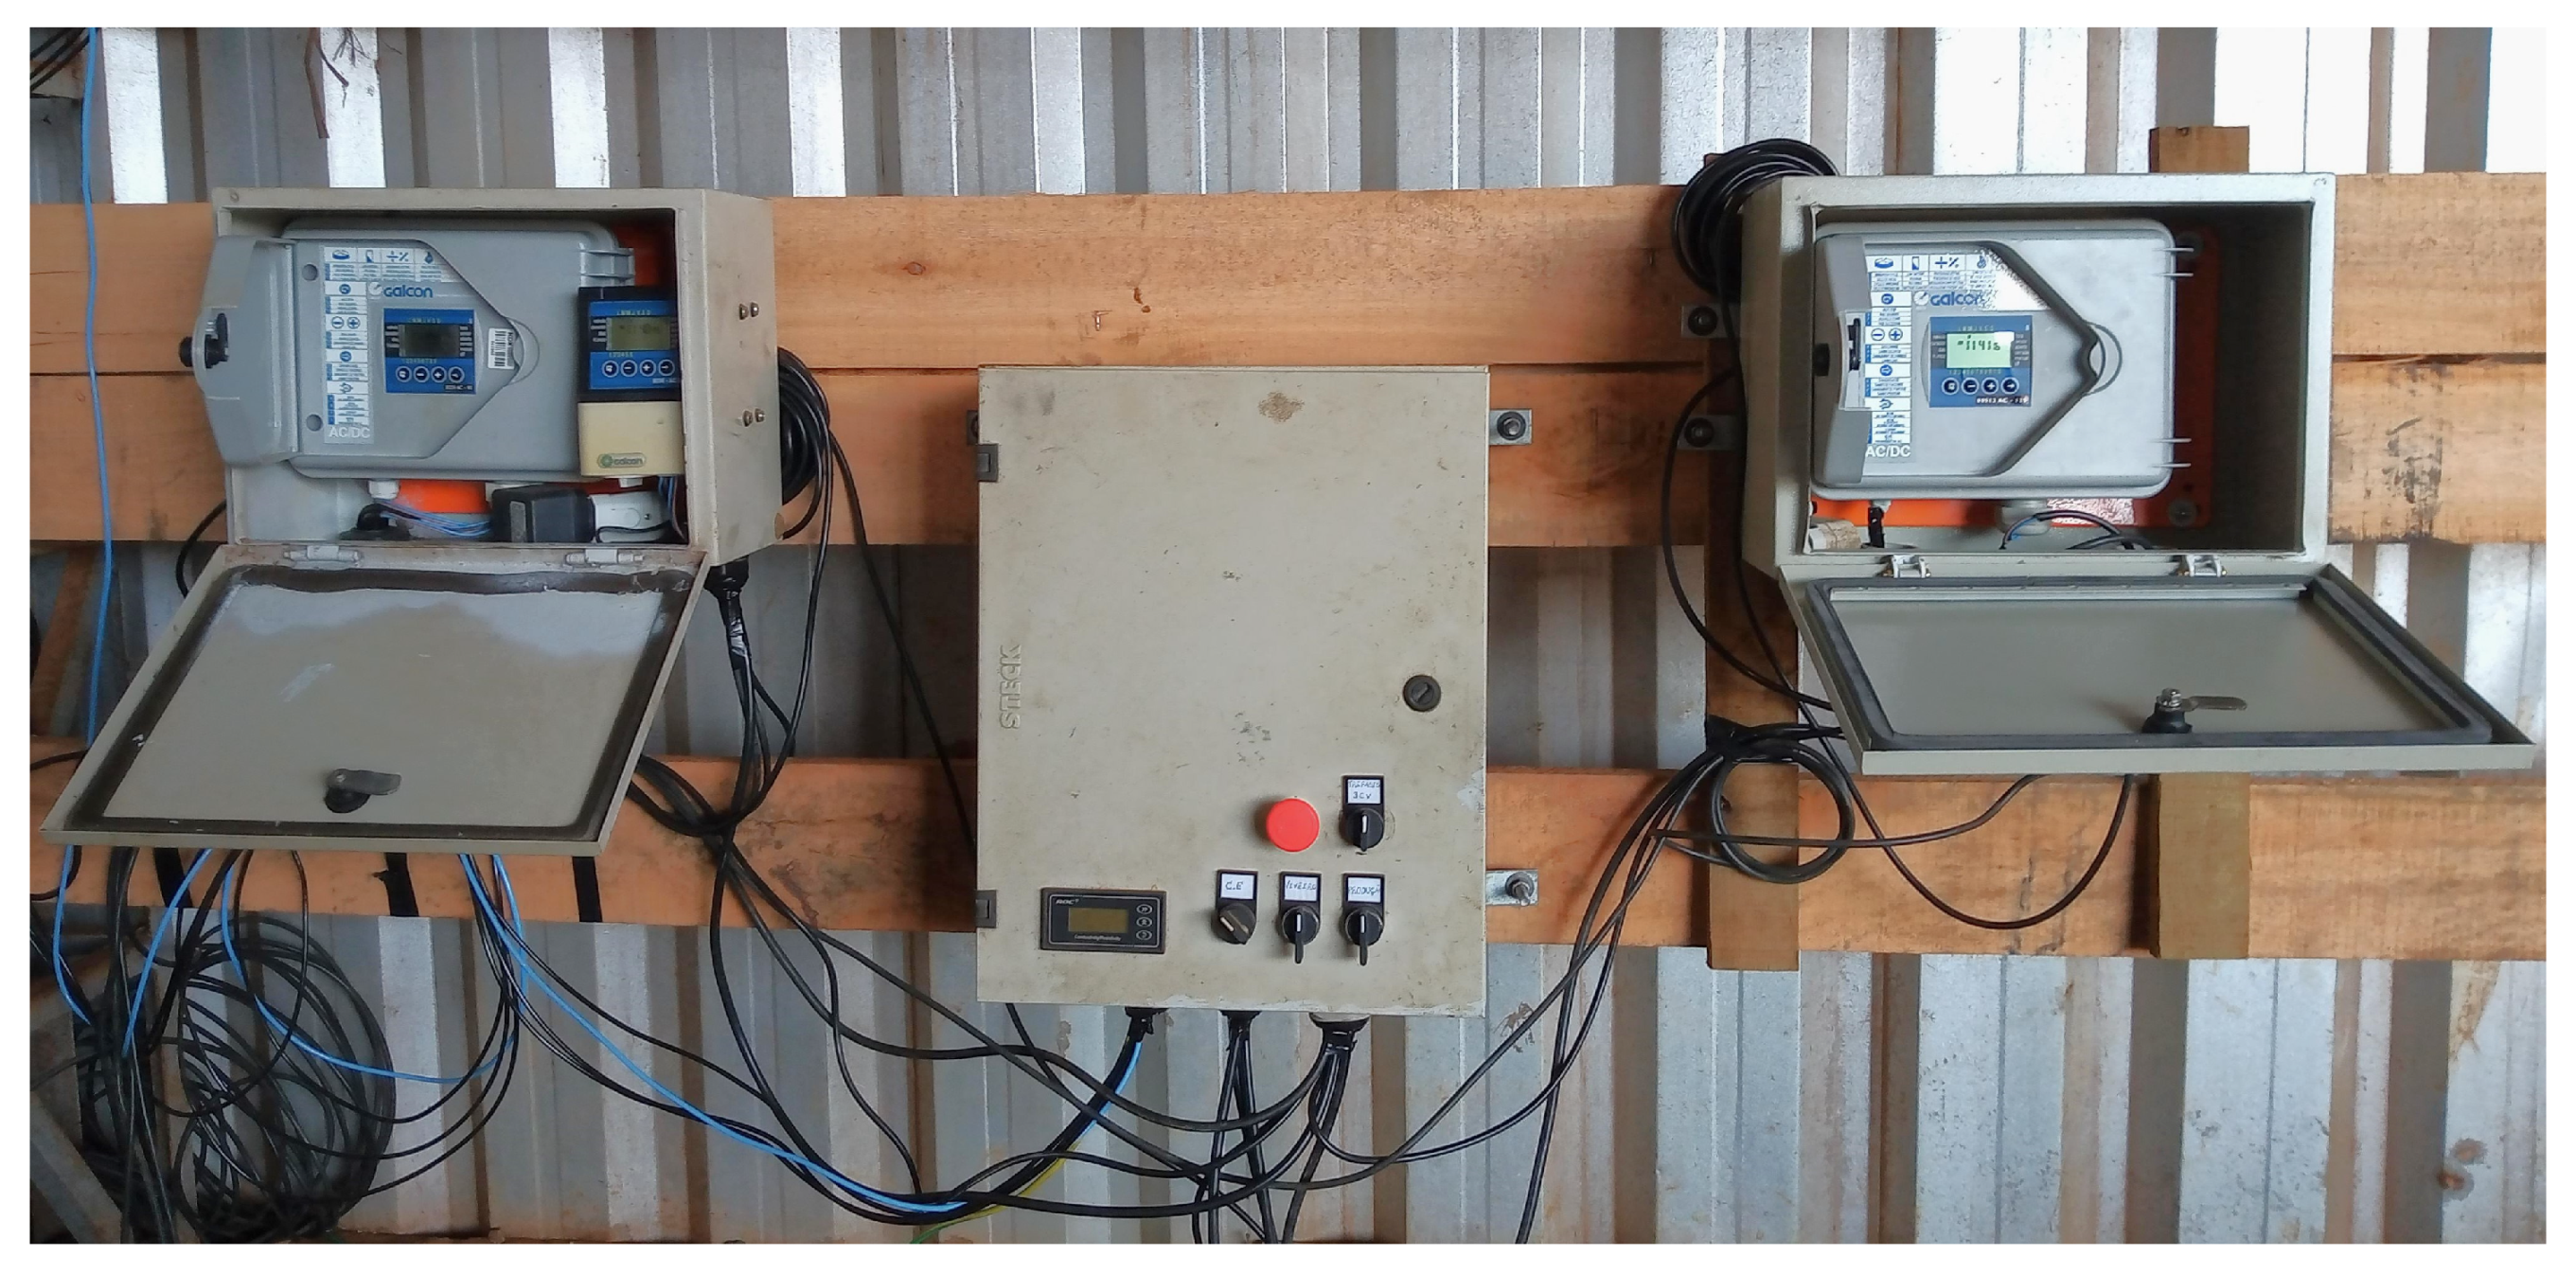
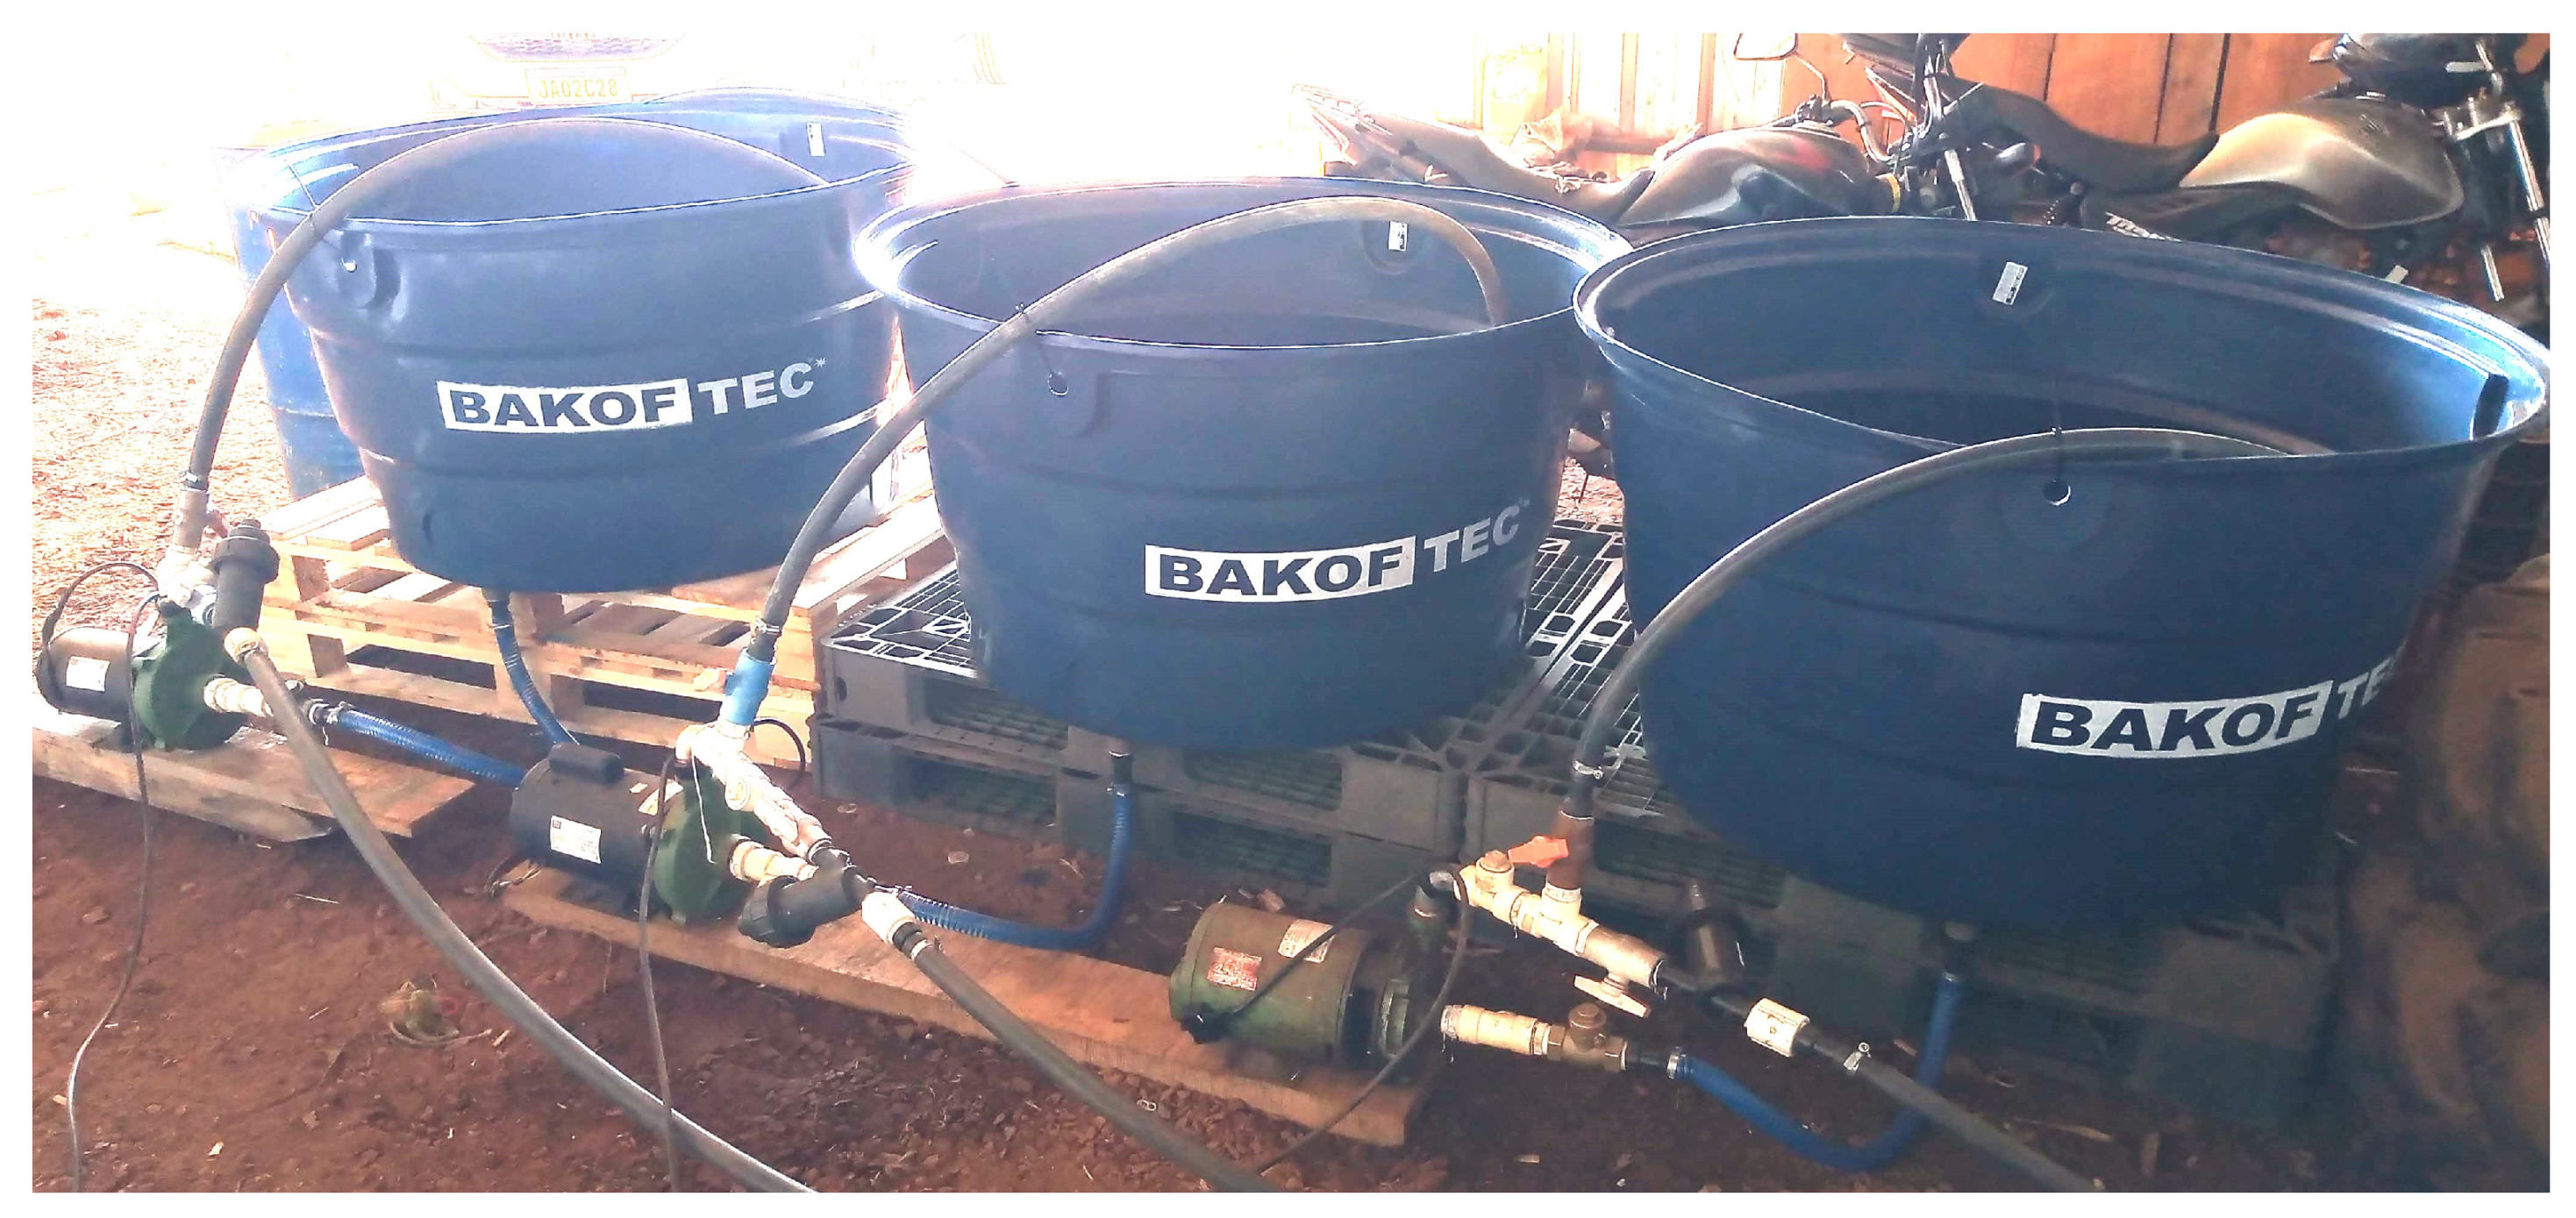
The work was carried out from June (winter) 2021 to April (fall) 2022 in a 14 m
2 greenhouse located in the company Resíduo Agrícola Zero (
Appendix A,
Figure A1,
Figure A2 and
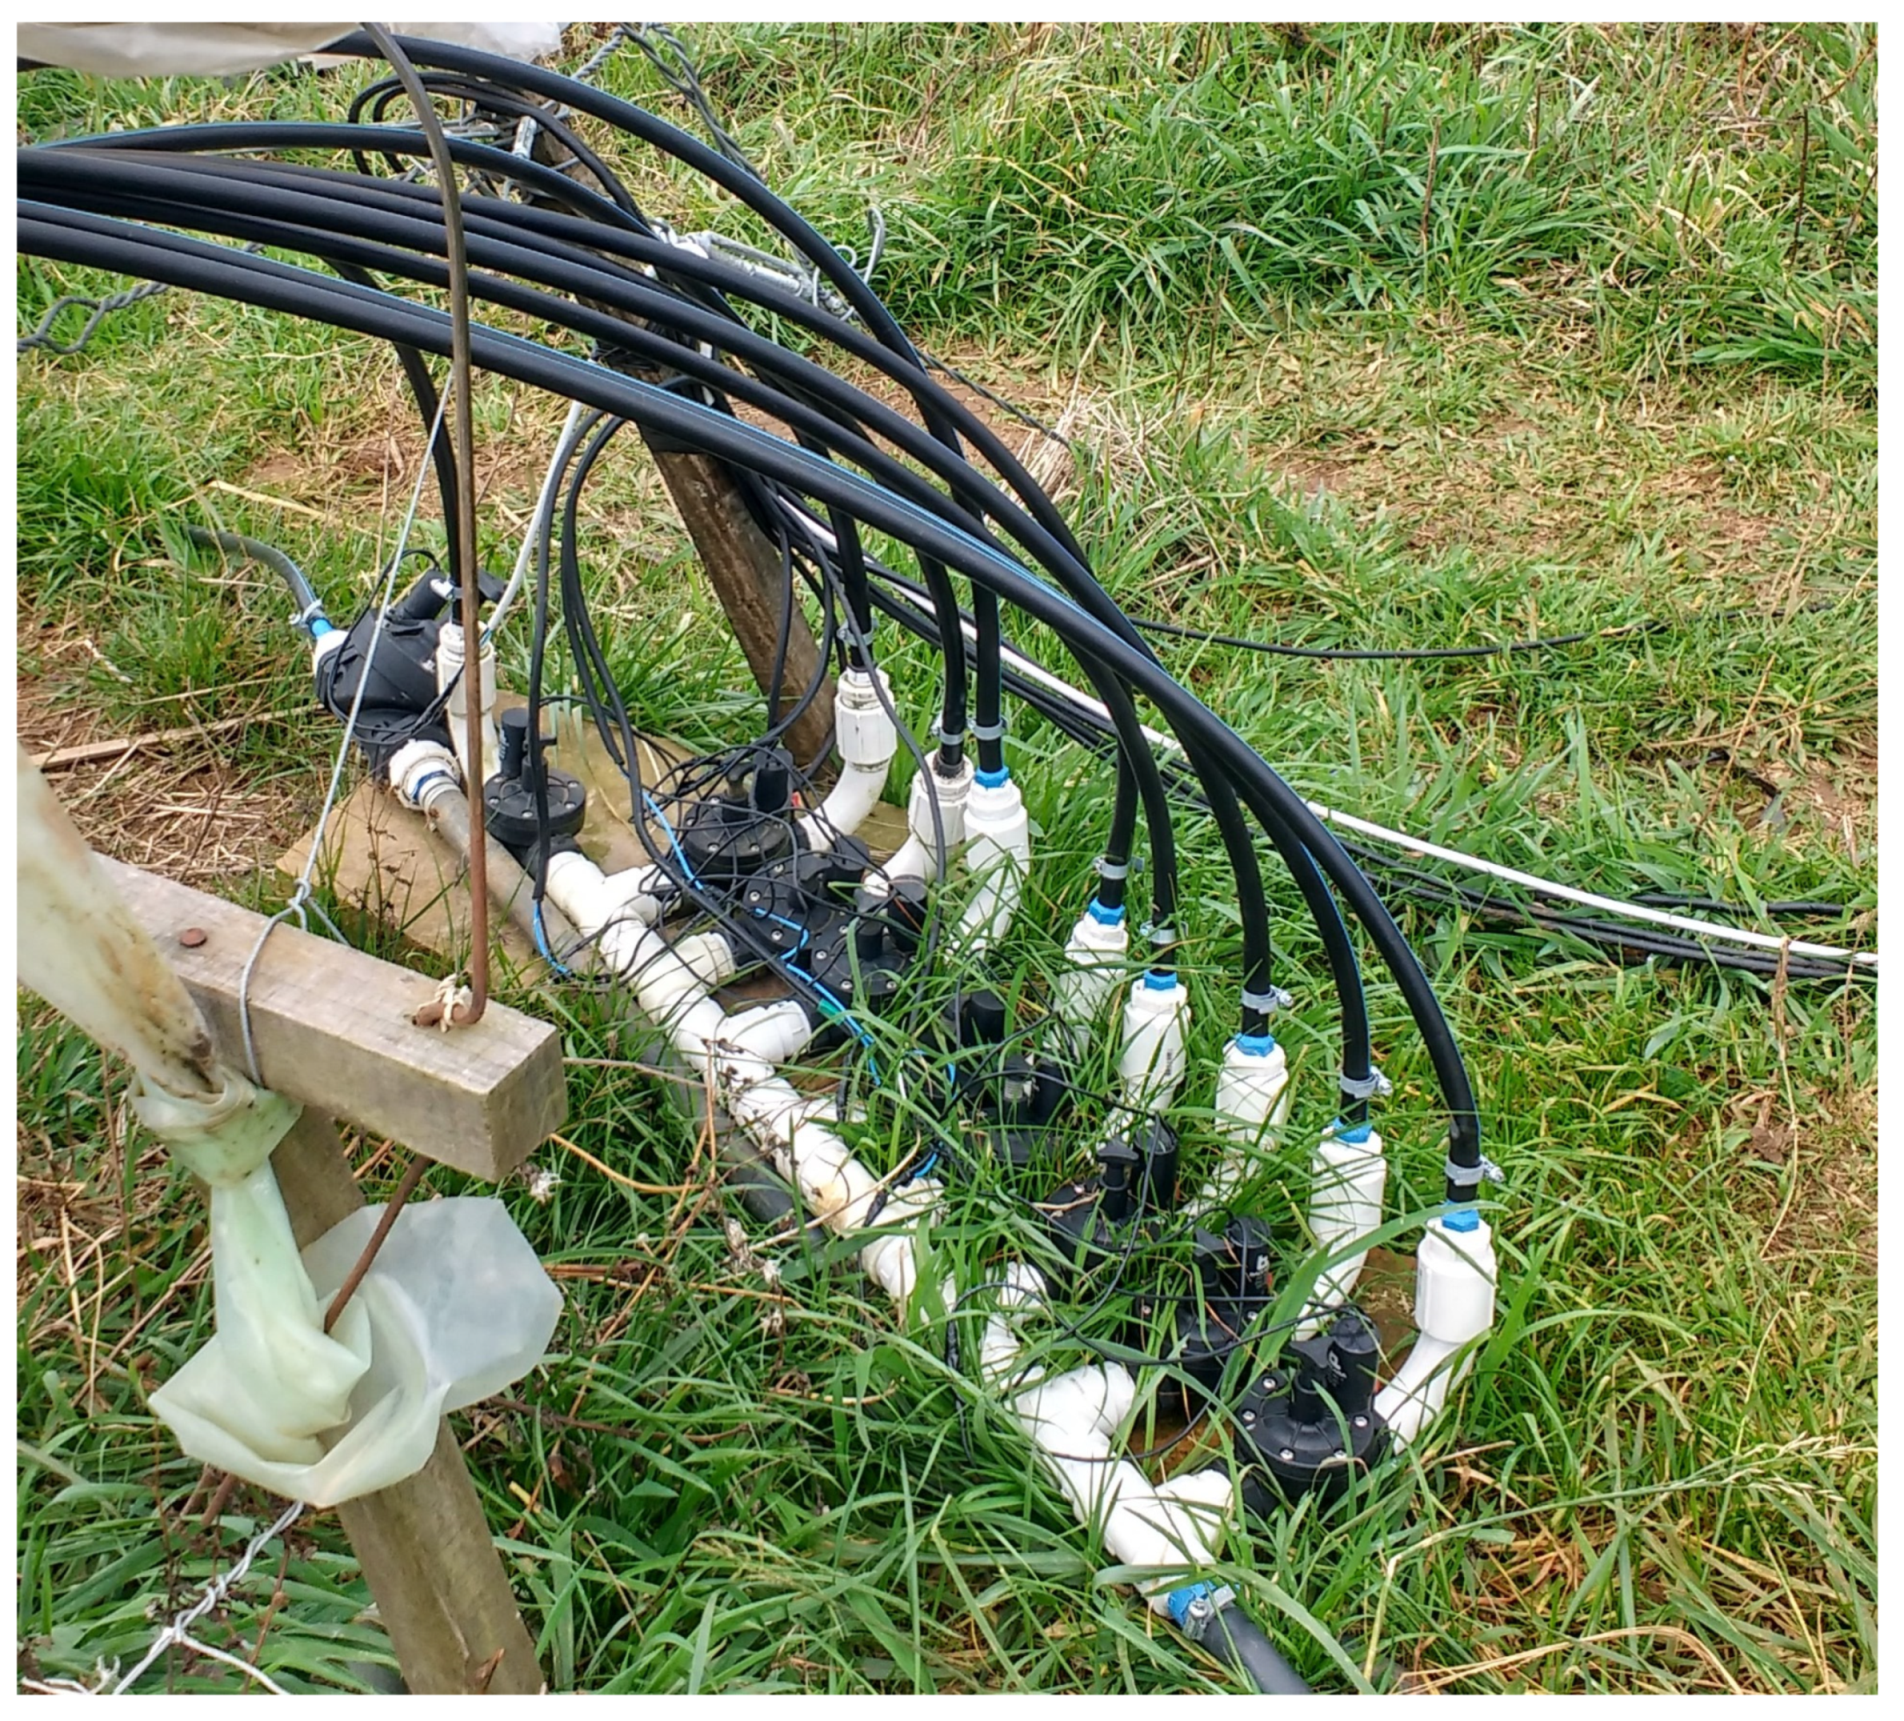
Figure A3) in the municipality of Vacaria (28°23′38″ S, 50°51′19″ W, and 970 m from sea level), RS (Brazil). Meteorological data of relative humidity and temperature inside the greenhouse were collected by an EE08 sensor (E+E Elektronik Ges.m.b.H., Engerwitzdorf, Austria) and PAR radiation data by an S-LIA-M003 sensor (Onset Computer Corporation, Bourne, MA, USA), and data were stored in an H21-USB data logger (Onset Computer Corporation, Bourne, MA, USA).
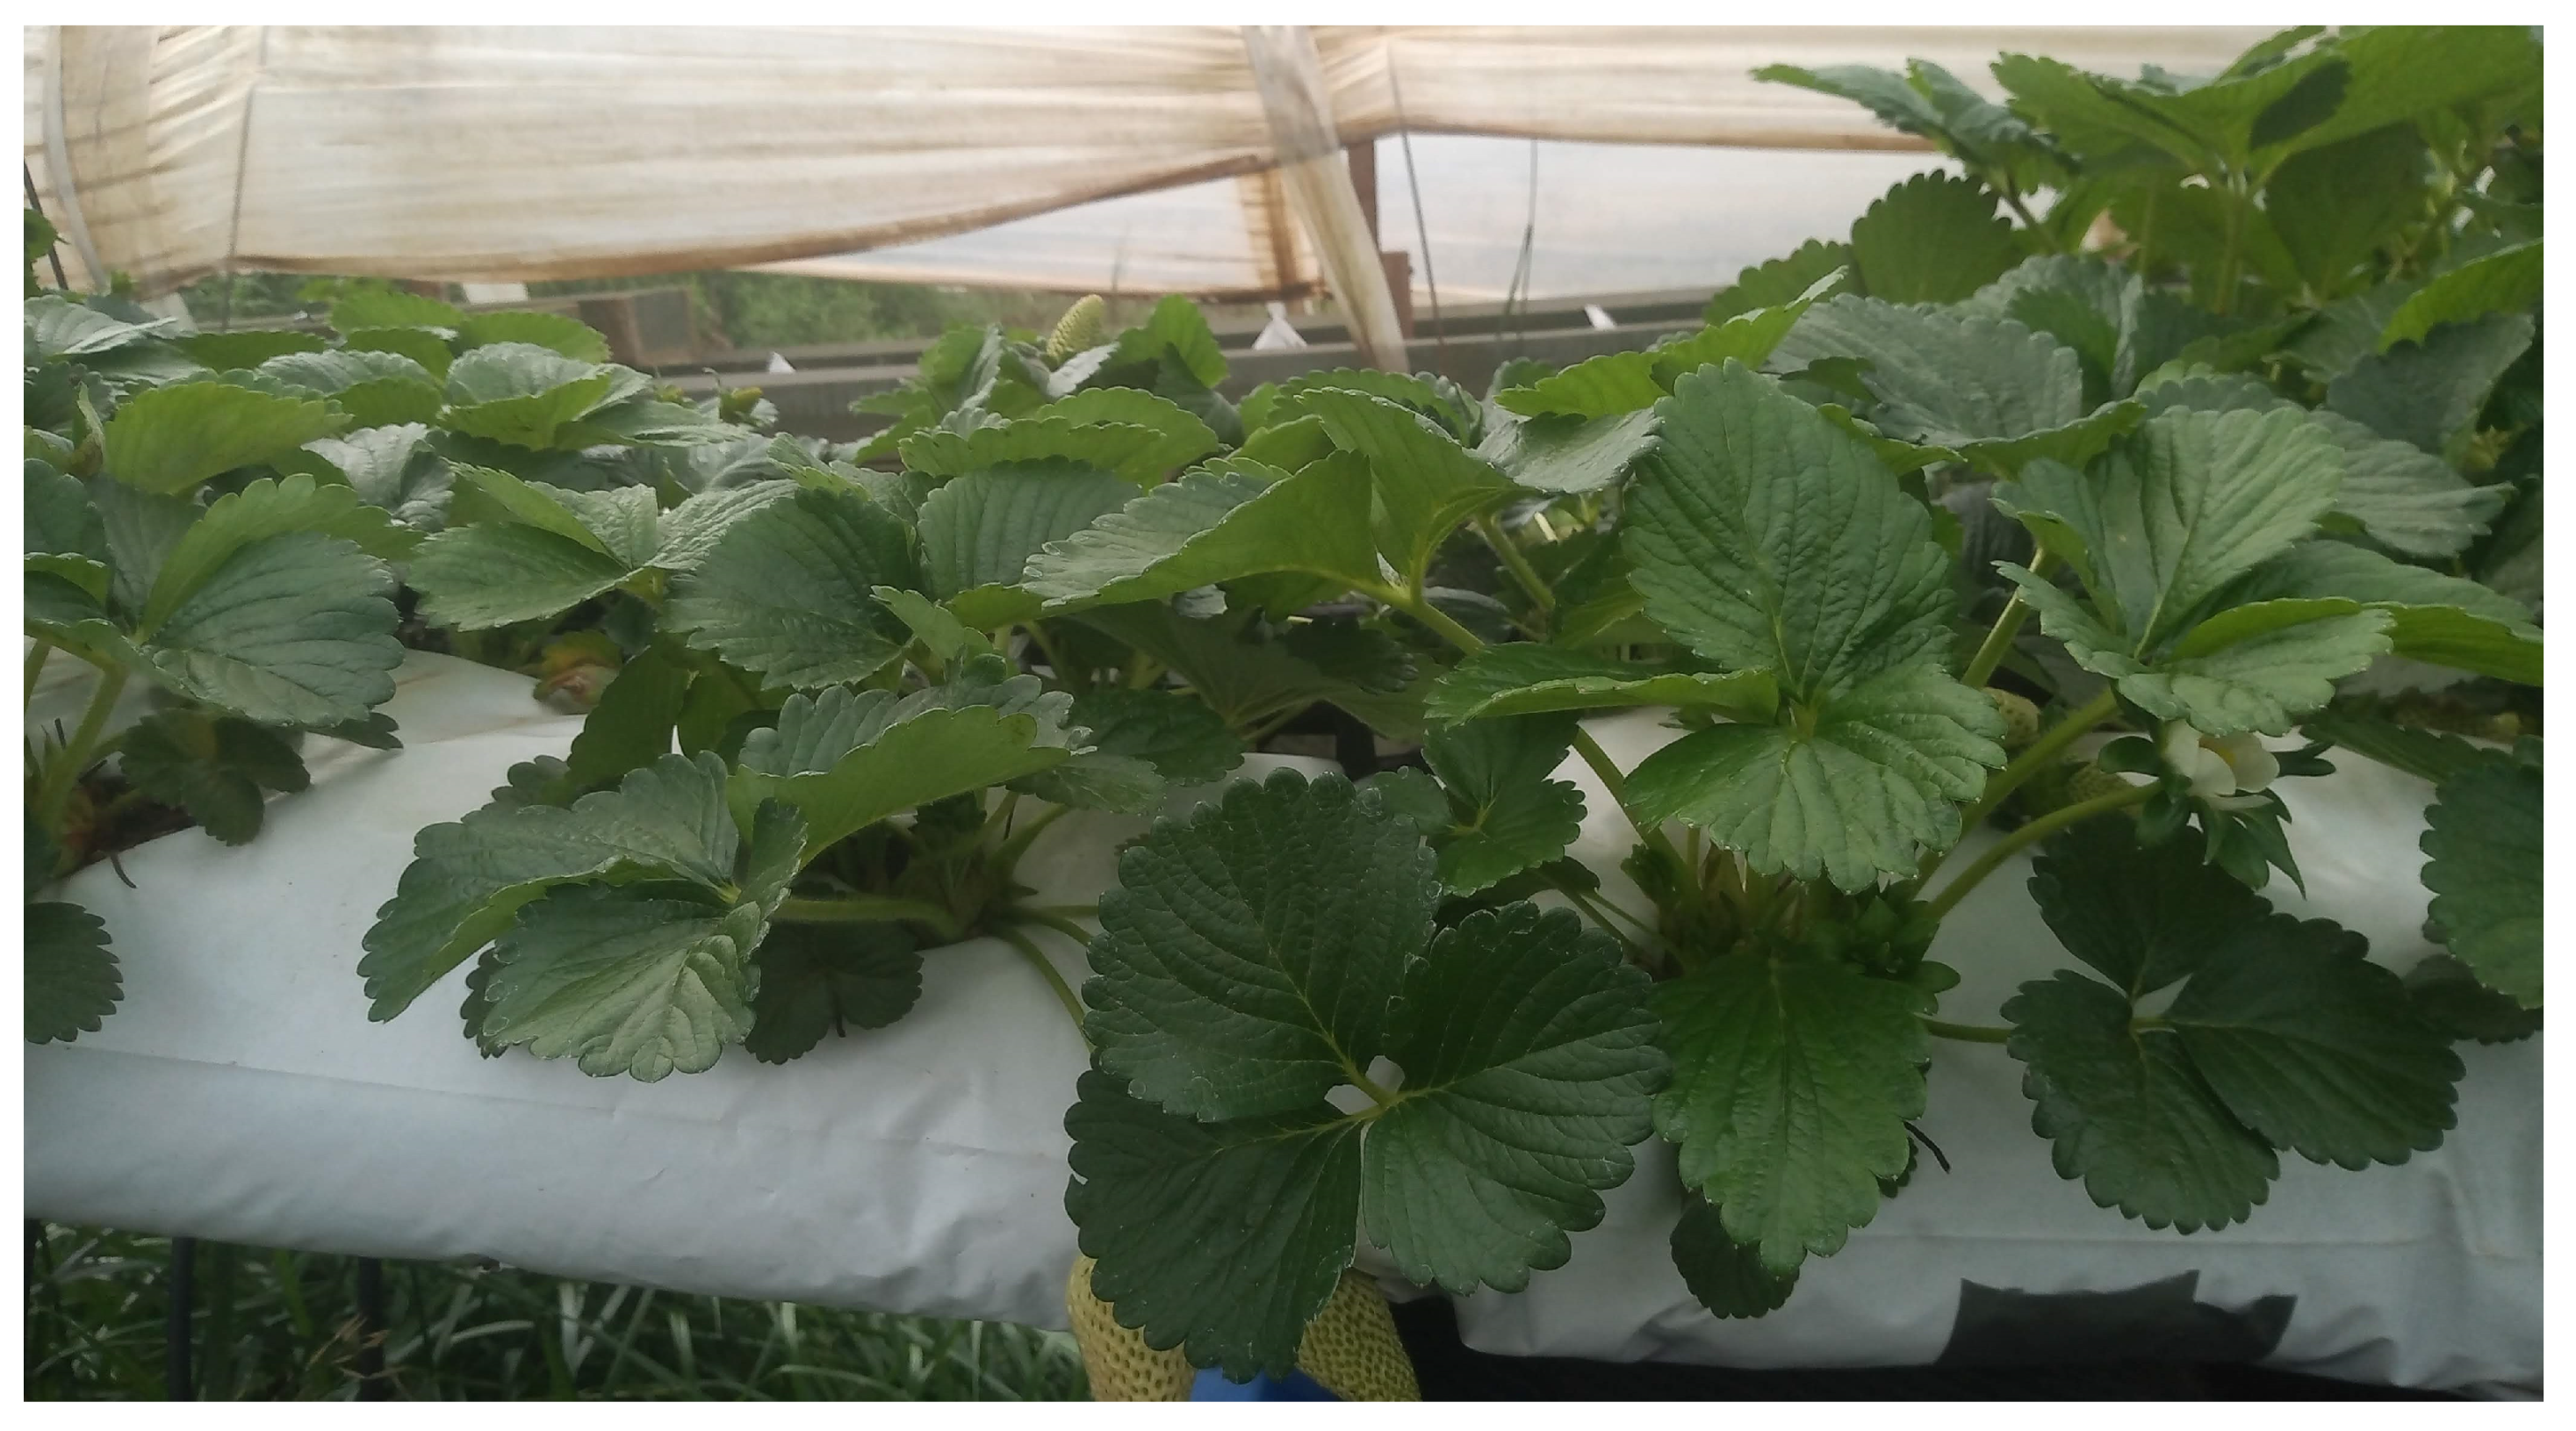
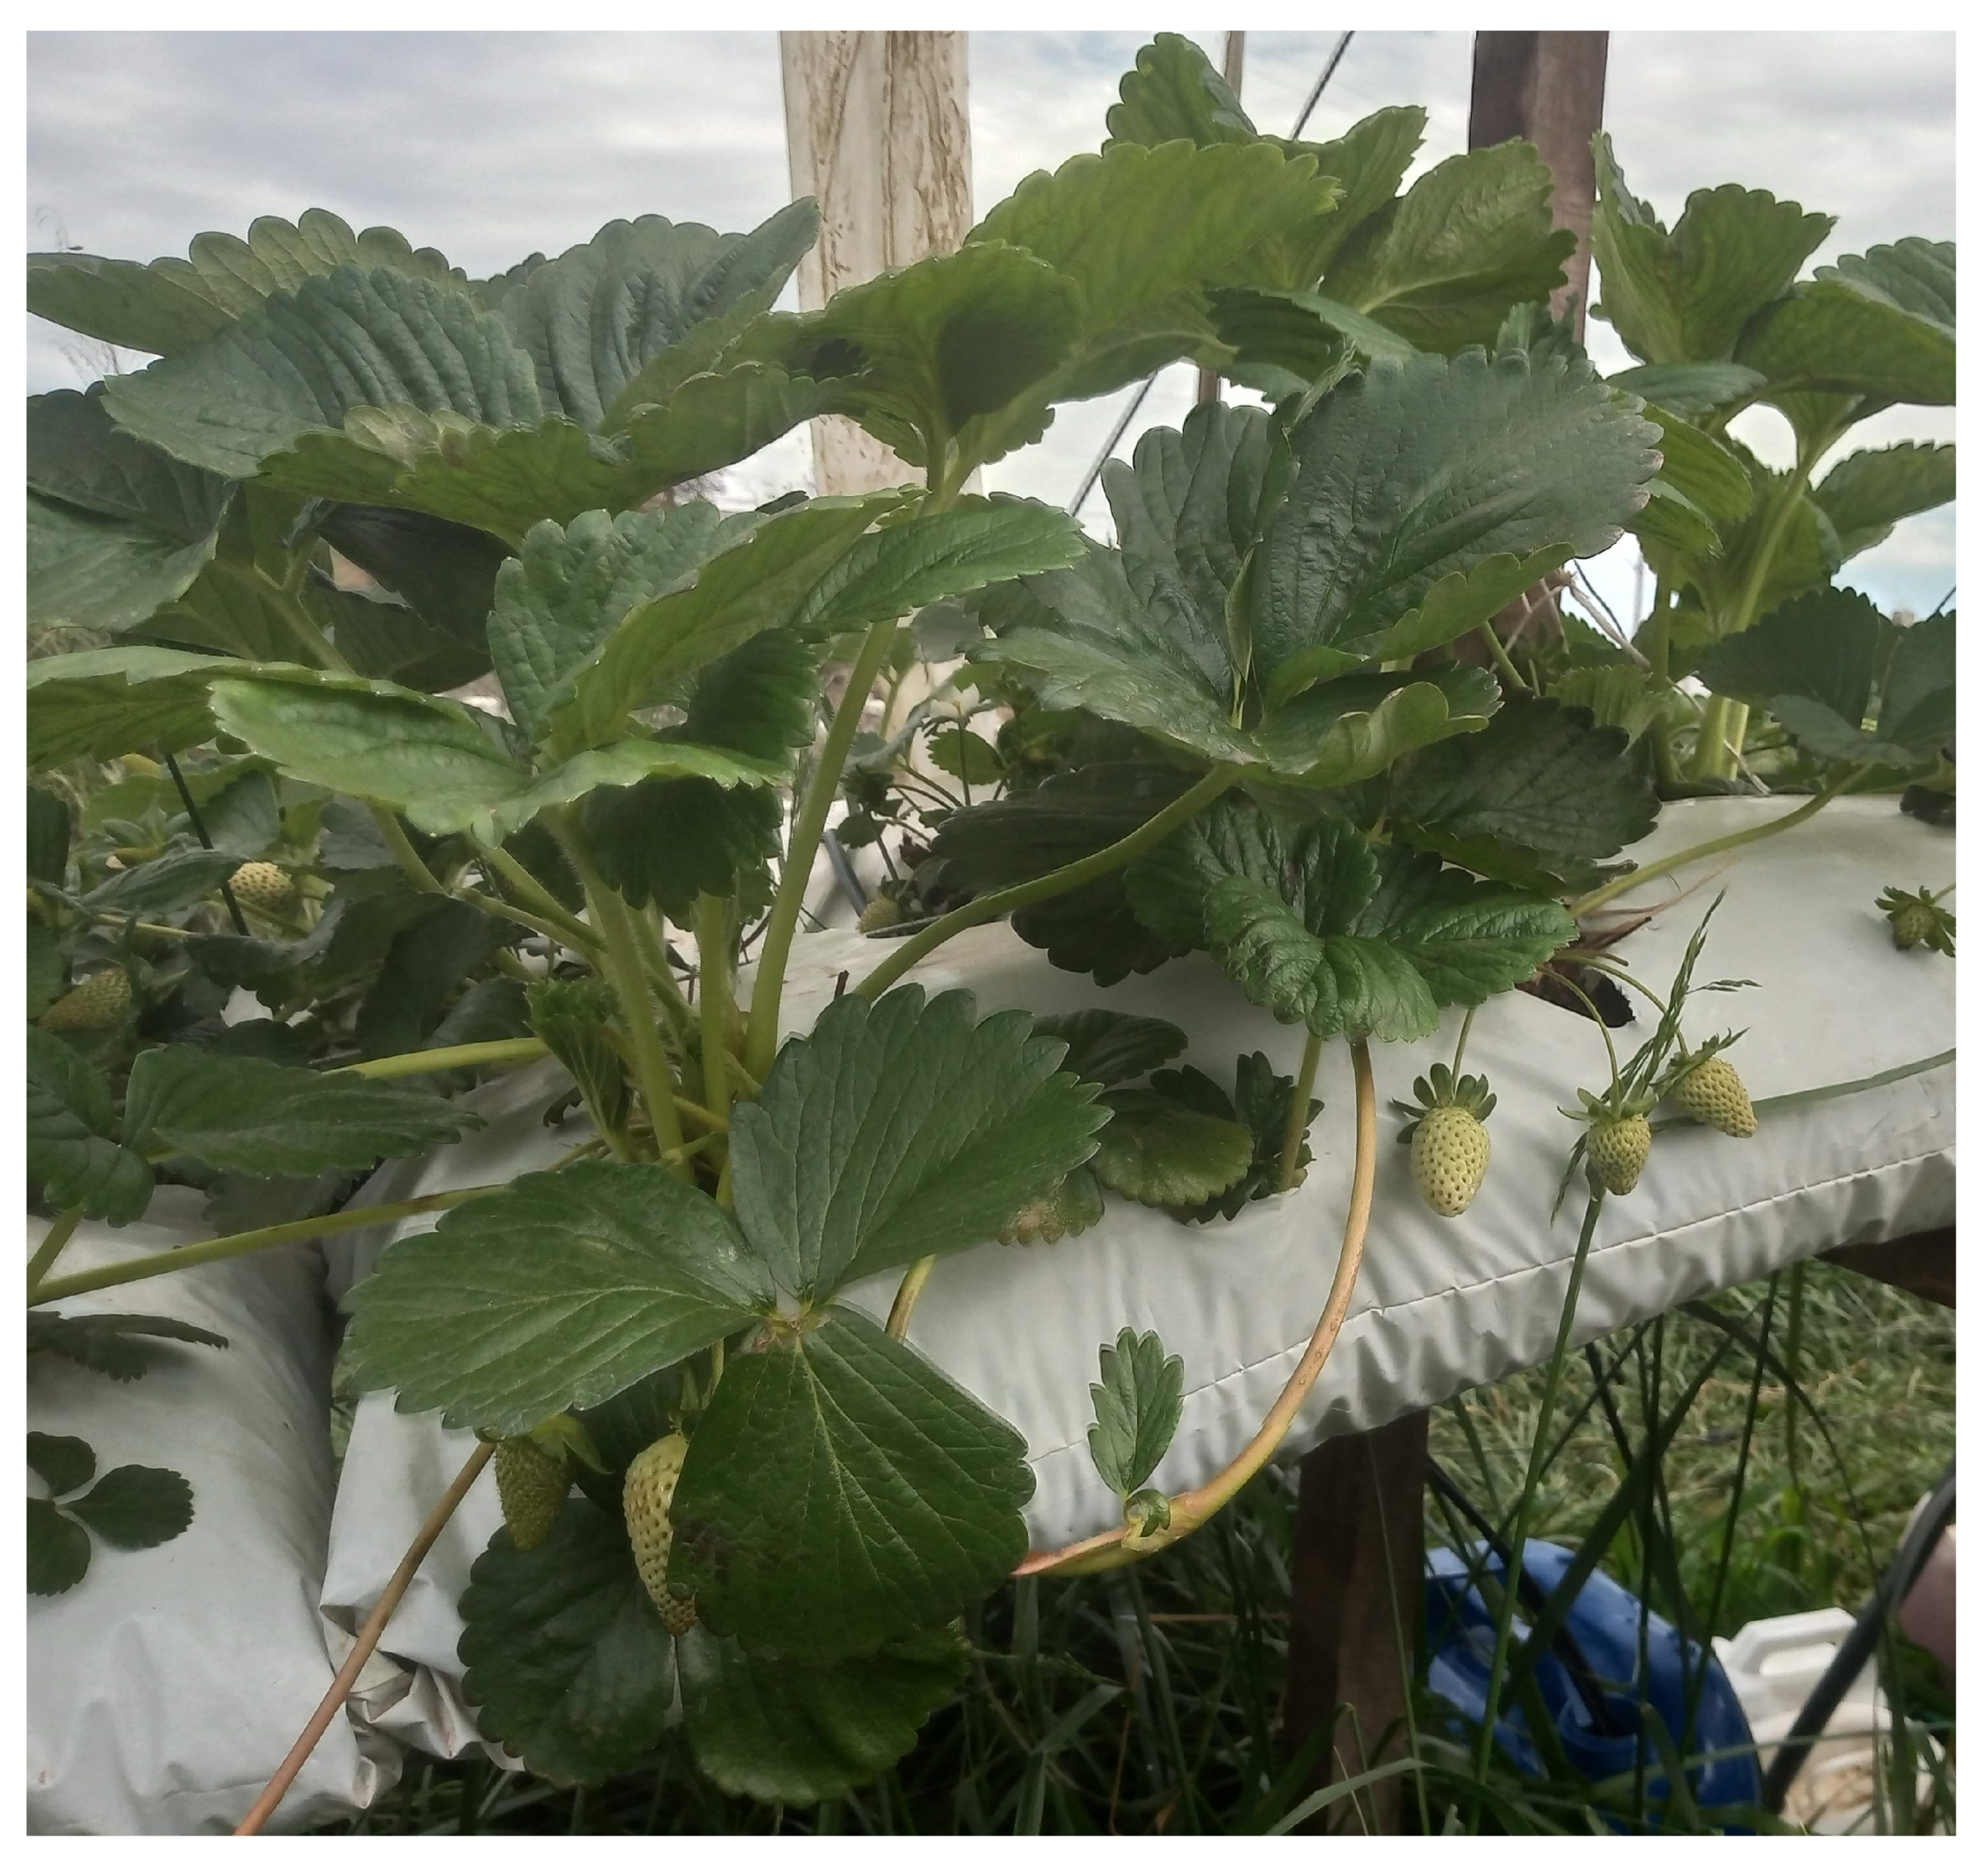
Albion’s cultivar constituted the plant material of the research. The cultivation system used was without soil in the substrate. In June 2021, the plants were transplanted into polyethylene bags (36 L) with dimensions of 25 cm wide, 120 cm long, and 18 cm high (
Appendix A,
Figure A4,
Figure A5 and
Figure A6). The planted plants were previously classified as having similar root systems and crown diameters. The spacing between plants was 15 cm and between rows and 20 cm between plants. The number of plants per square meter was 14.4 un. The substrate constitution was made up of granulated coconut fibre, with readily available water retention of 11%, aeration of 49%, and a pH of 6.5. The sodium (Na) concentration was within the recommended levels of less than 0.5 mmol L
−1. The polyethylene bags were placed on wooden support frames at an 80 cm height and irrigated with an automatic drip system consisting of one spaghetti dripper for every four plants. The flow rate of each dripper was 2 L h
−1. Depending on the variations in environmental conditions and the phenological status of the plant, irrigation pulses and irrigation periods were changed. The nutrient solution supplied to the plants had macronutrient concentrations (in mmol L
−1) of 0.91 N-NO
3, 0.22 N-NH
4, 0.59 P-H
2PO
4−, 2.90 K-K
2O, 1.85 Ca, 1.03 Mg, and 2.18 S-SO
42− and micronutrient concentrations (in μmol L
−1) of 65 Fe, 130 B, 73 Mn, 28 Cu, 27 Zn, and 16 Mo. The other management practises (irrigation, ecological pest and disease management, greenhouse management, etc.) were performed according to the recommendations and technical requirements for the cultivation of the strawberry ‘Albion’ cultivar in soilless cultivation practised in Brazil.
In this study, treatments consisted of five types of plants: mini plants in trays with young roots (E1); plants in trays with mature roots and initial reduction of fertigation (E2); plants in trays with mature roots (E3); plants with bare roots as a control (E4), and plants in trays with mature roots preserved by the cold (E5). The experiment was conducted in a randomized block design with three replications. The experimental units consisted of four plants. Tray plants and plants in trays with cold-preserved mature roots were produced in the study area; in the latter type, plants were kept at −1.5 °C for 60 days. The mini plants in trays with young roots were produced by the company Agro-Industrial Lazzeri Ltd. (Vacaria, RS, Brazil) and were handled as fresh plants, not having gone through the chilling process. Plants with bare roots were imported from Chile and had the necessary refrigeration for transportation and mandatory quarantine before being authorized for planting.
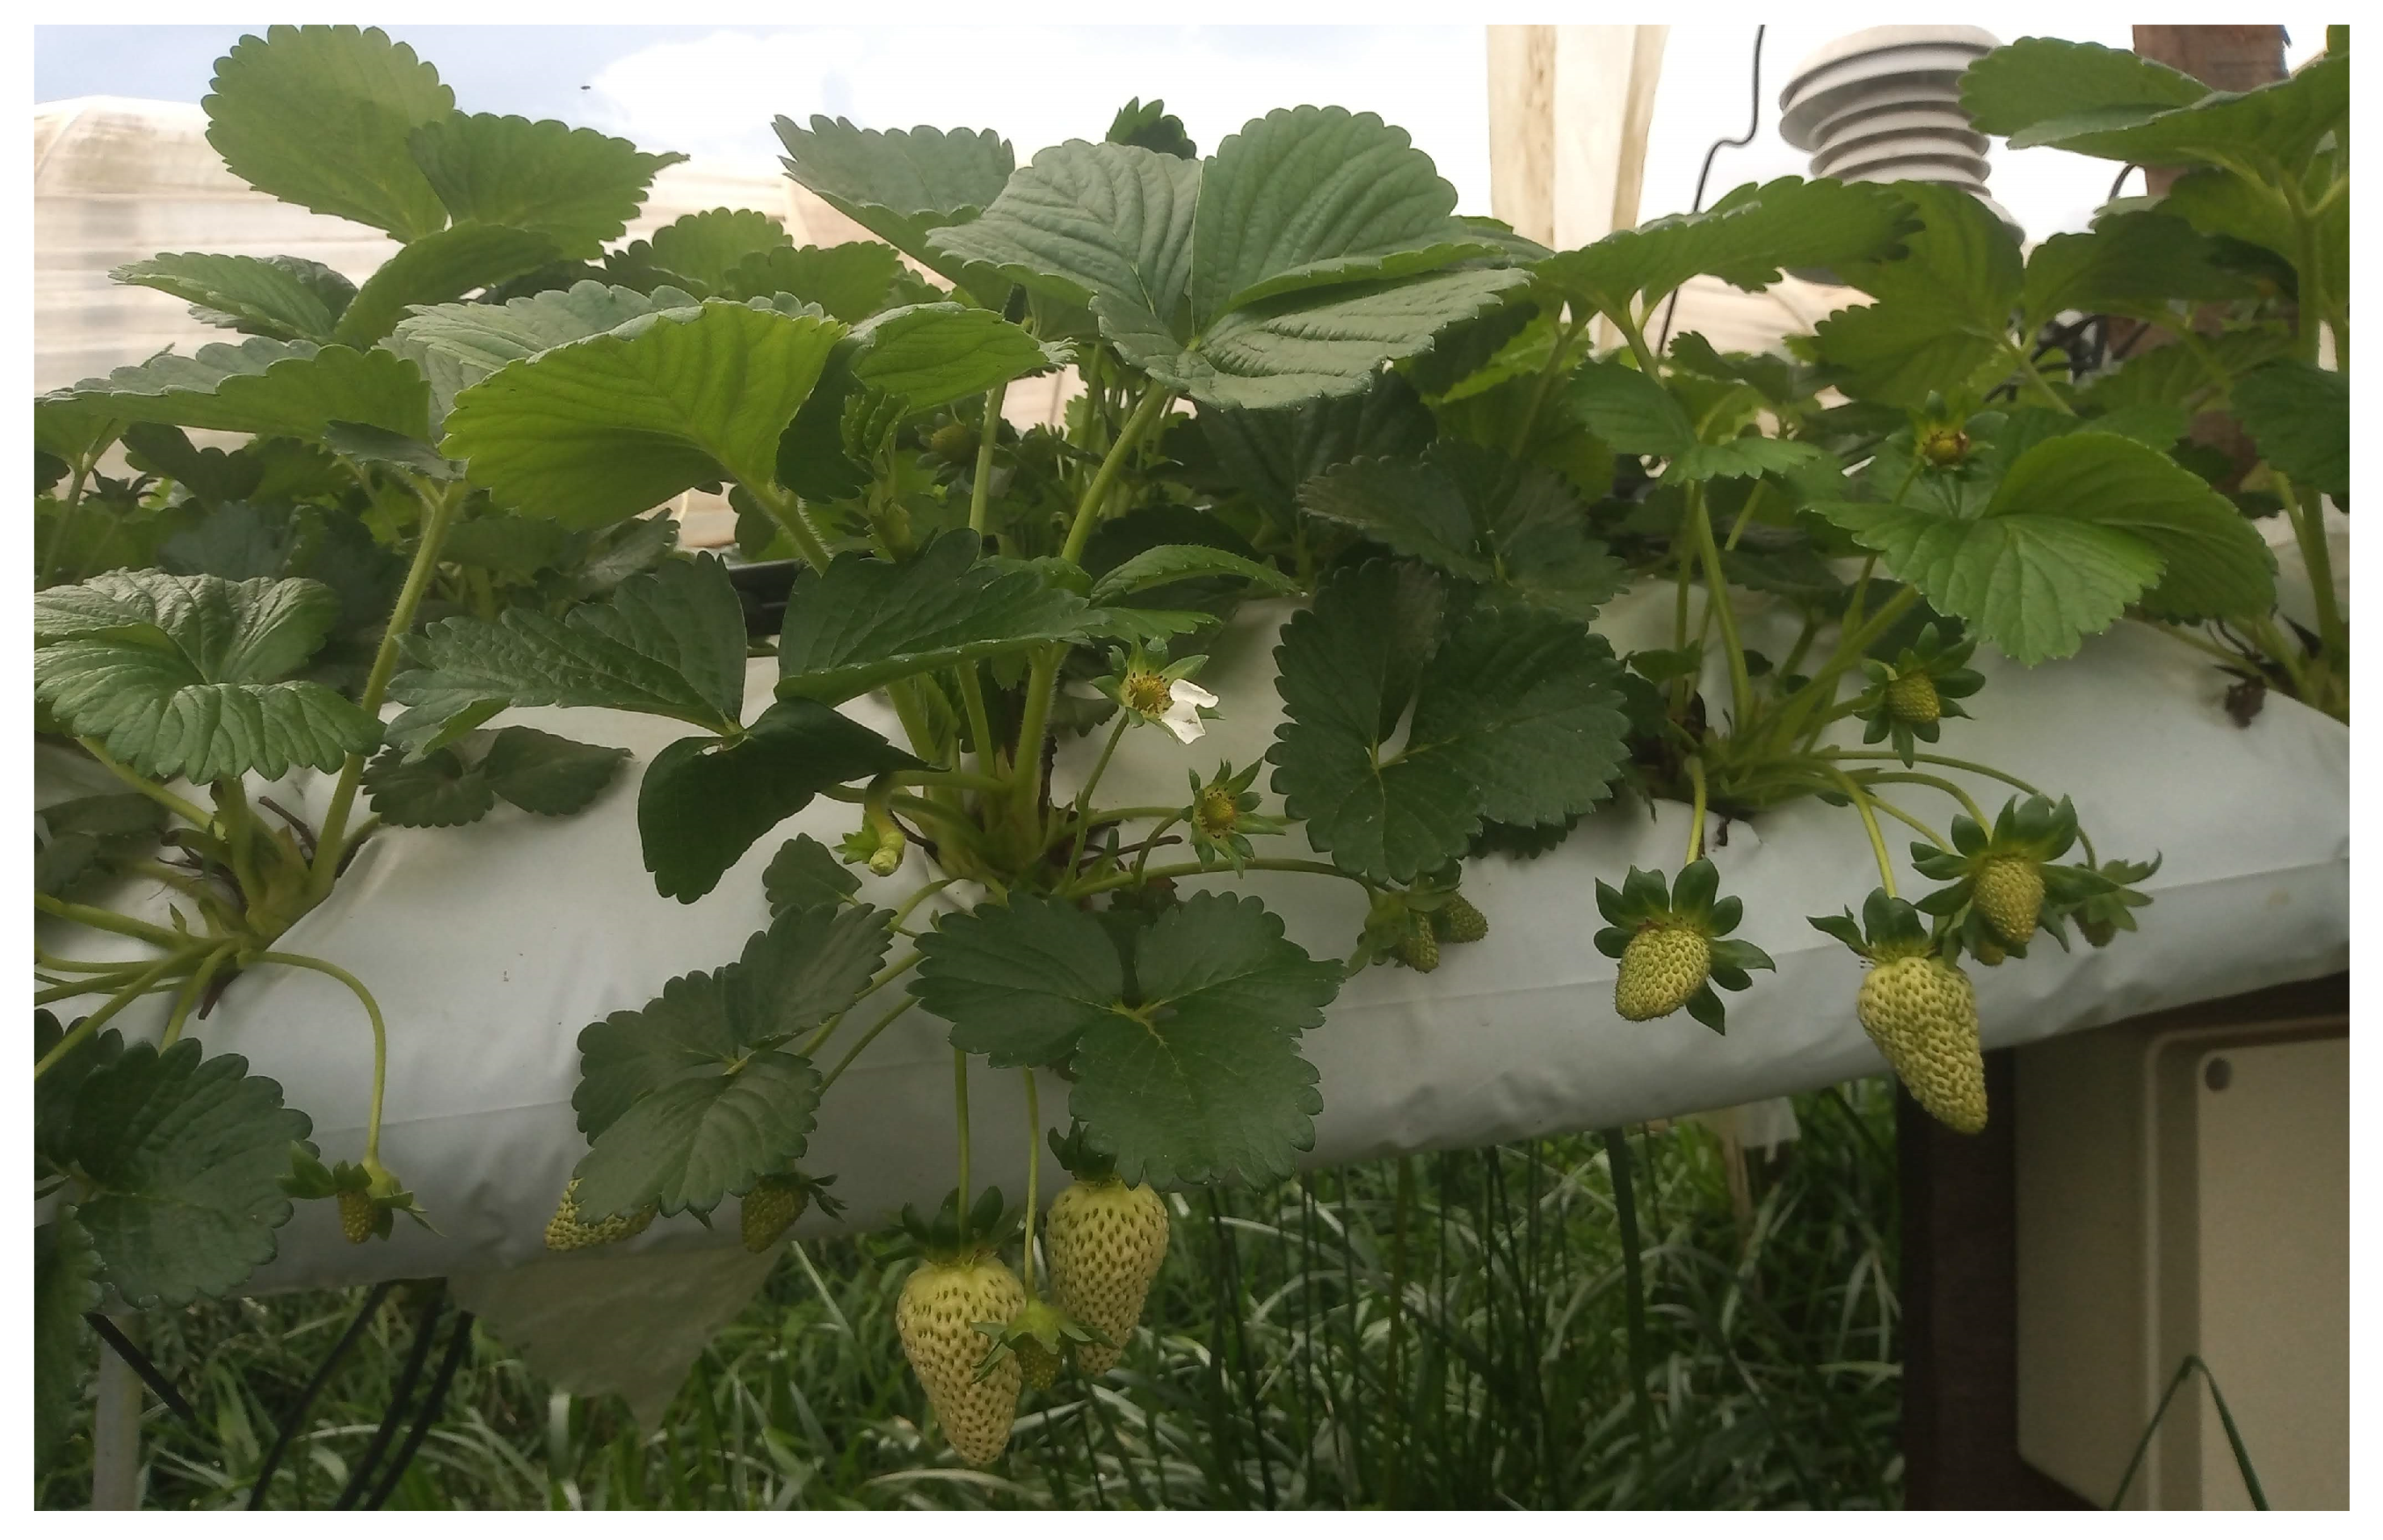
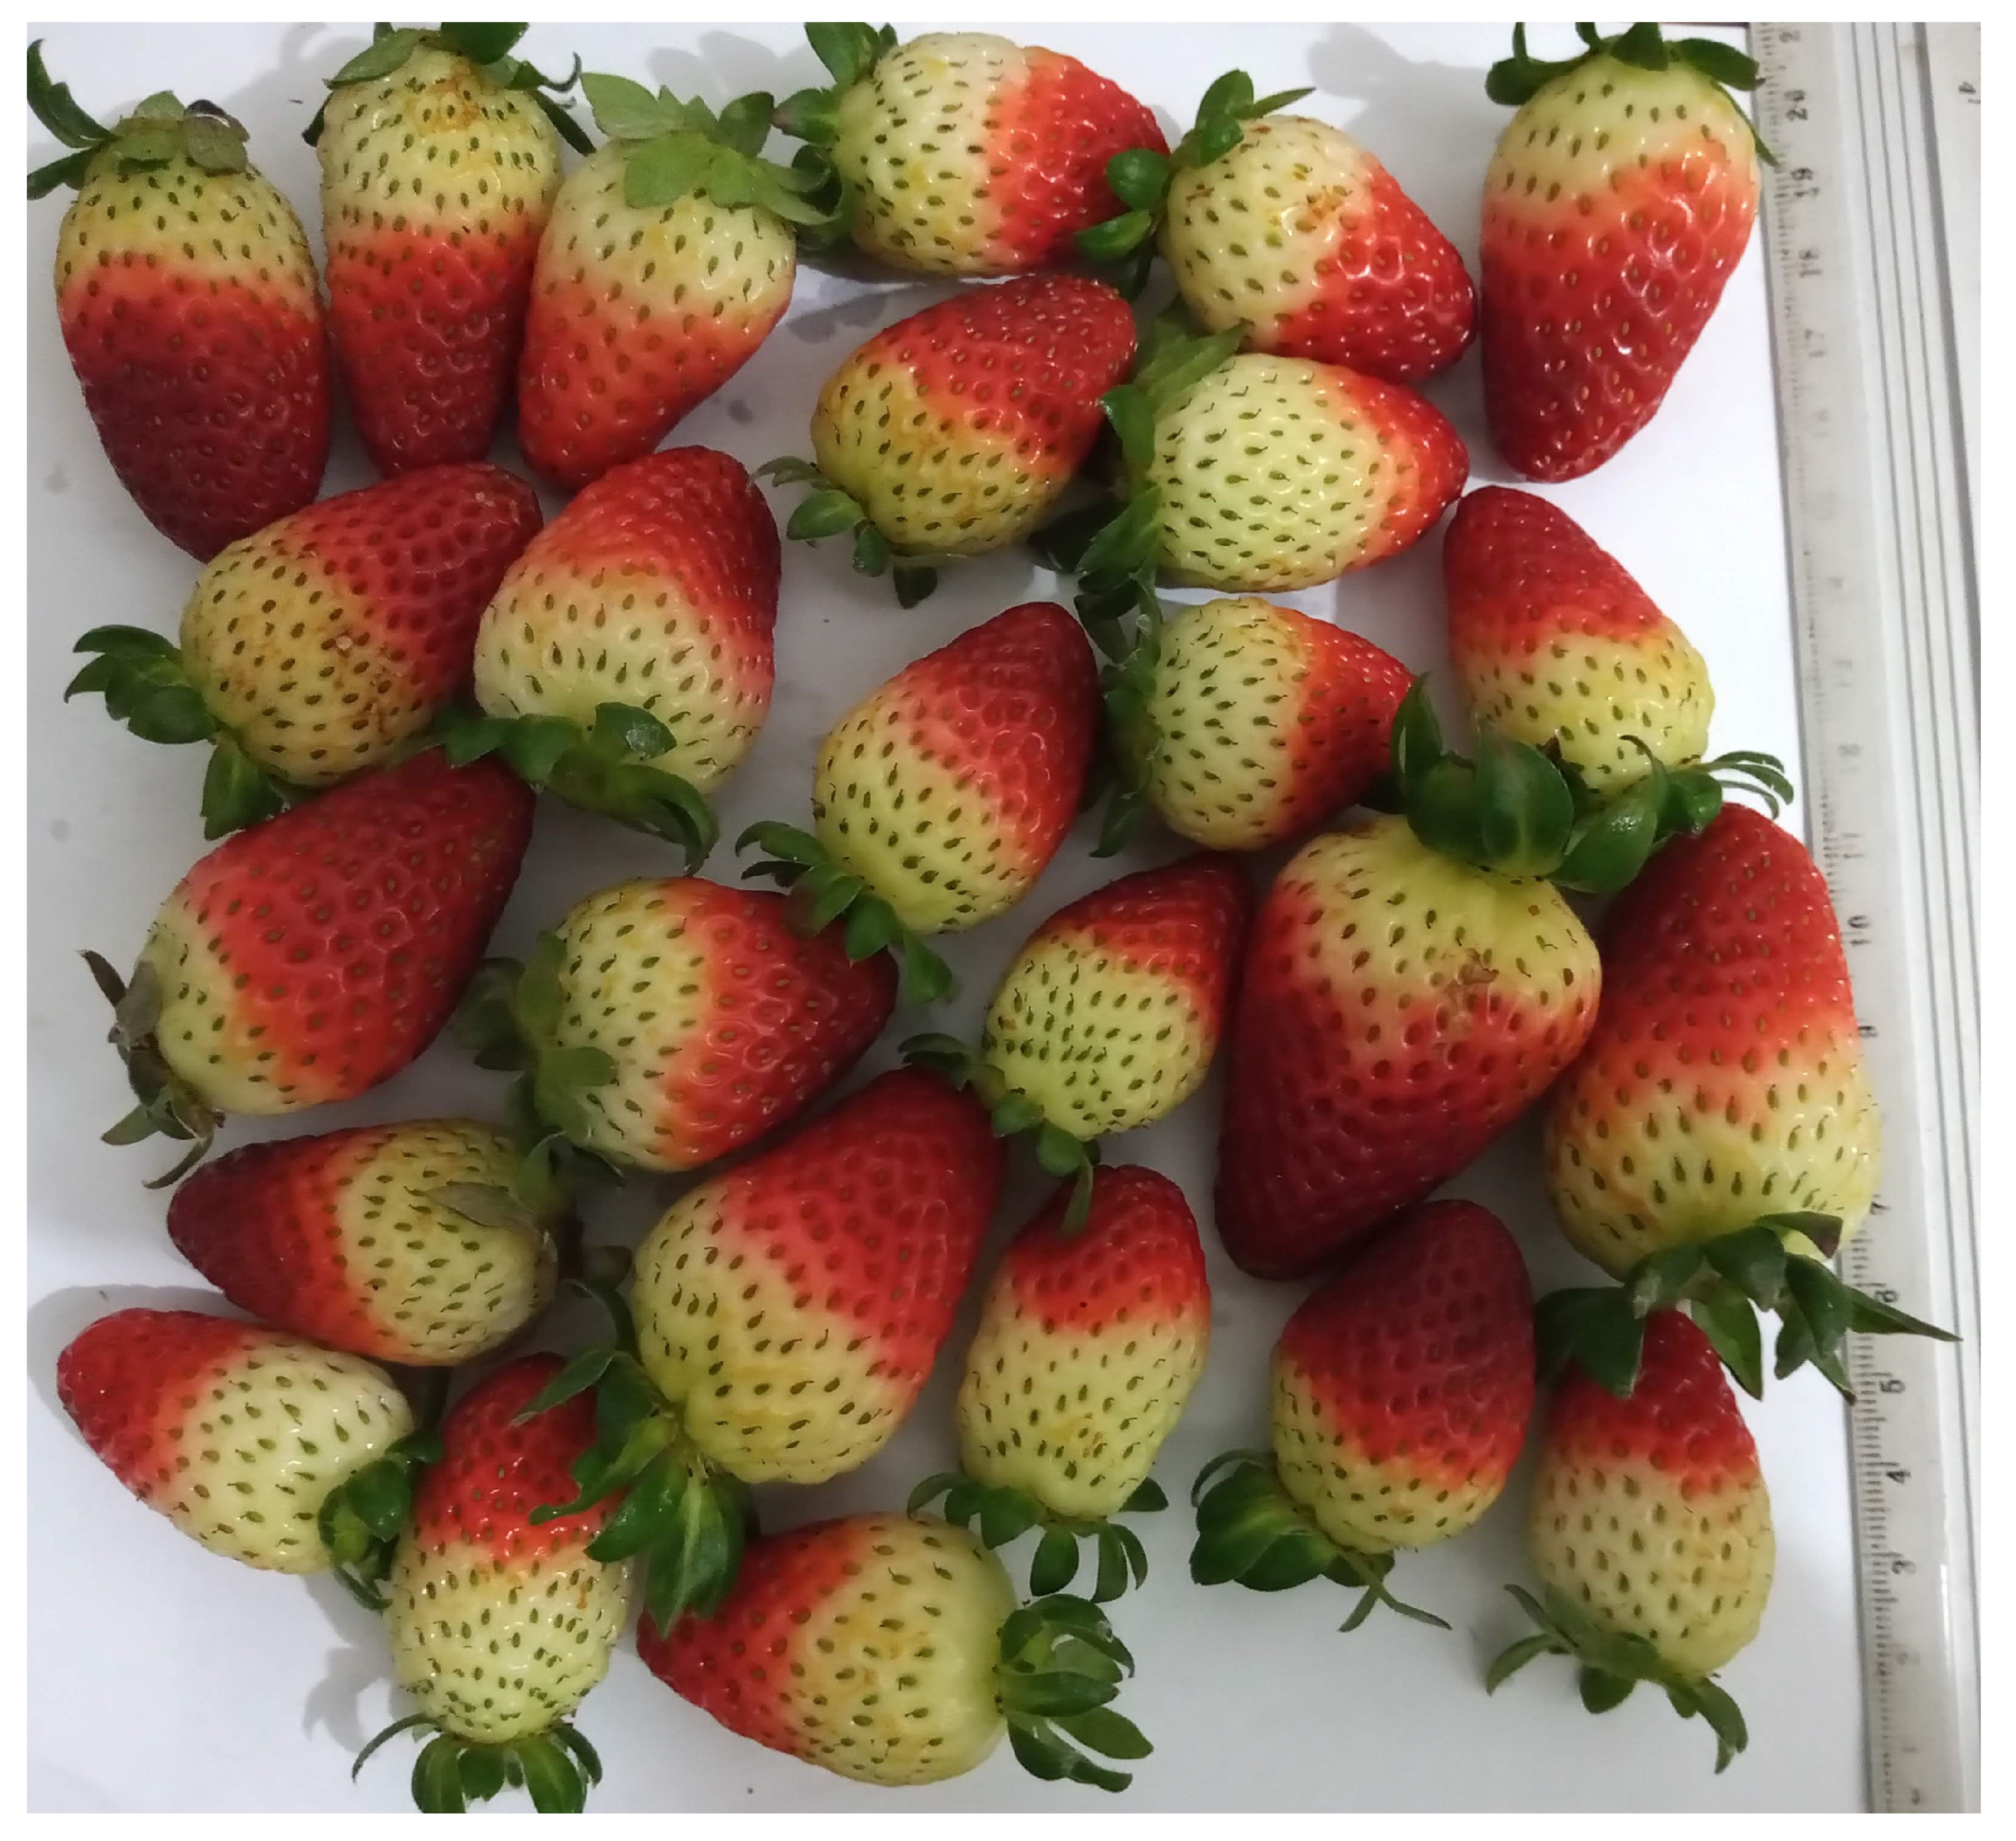
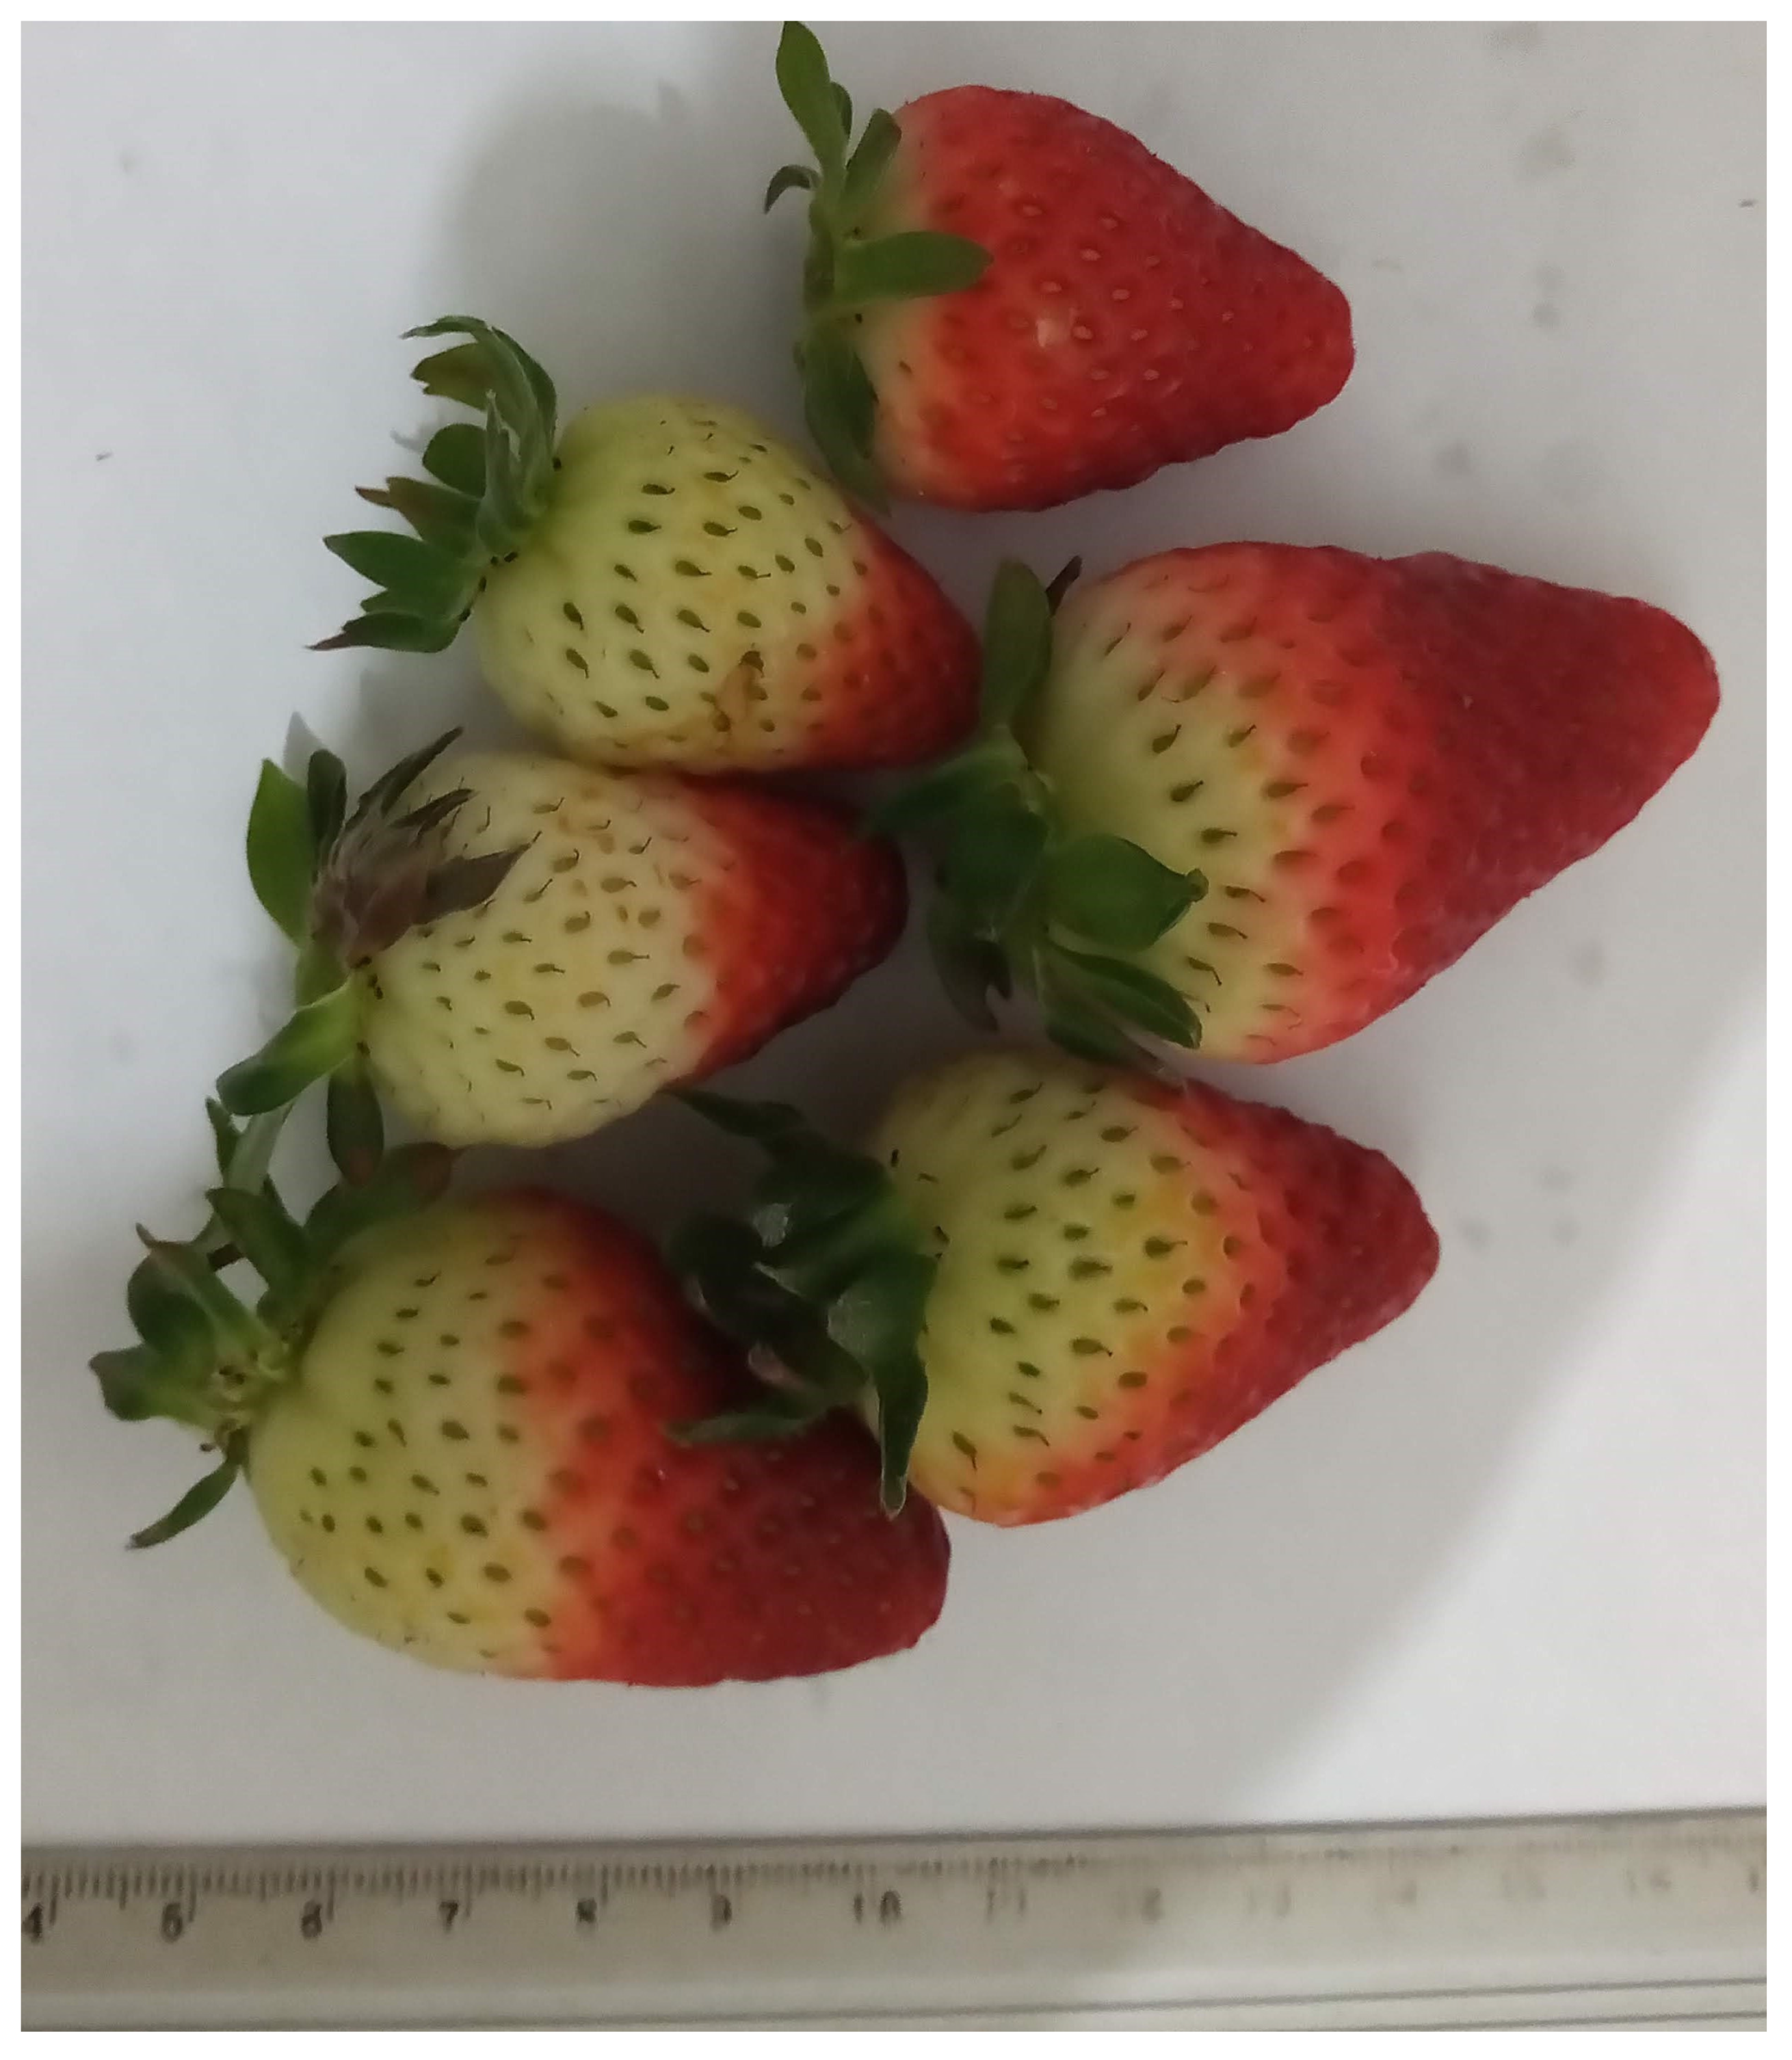
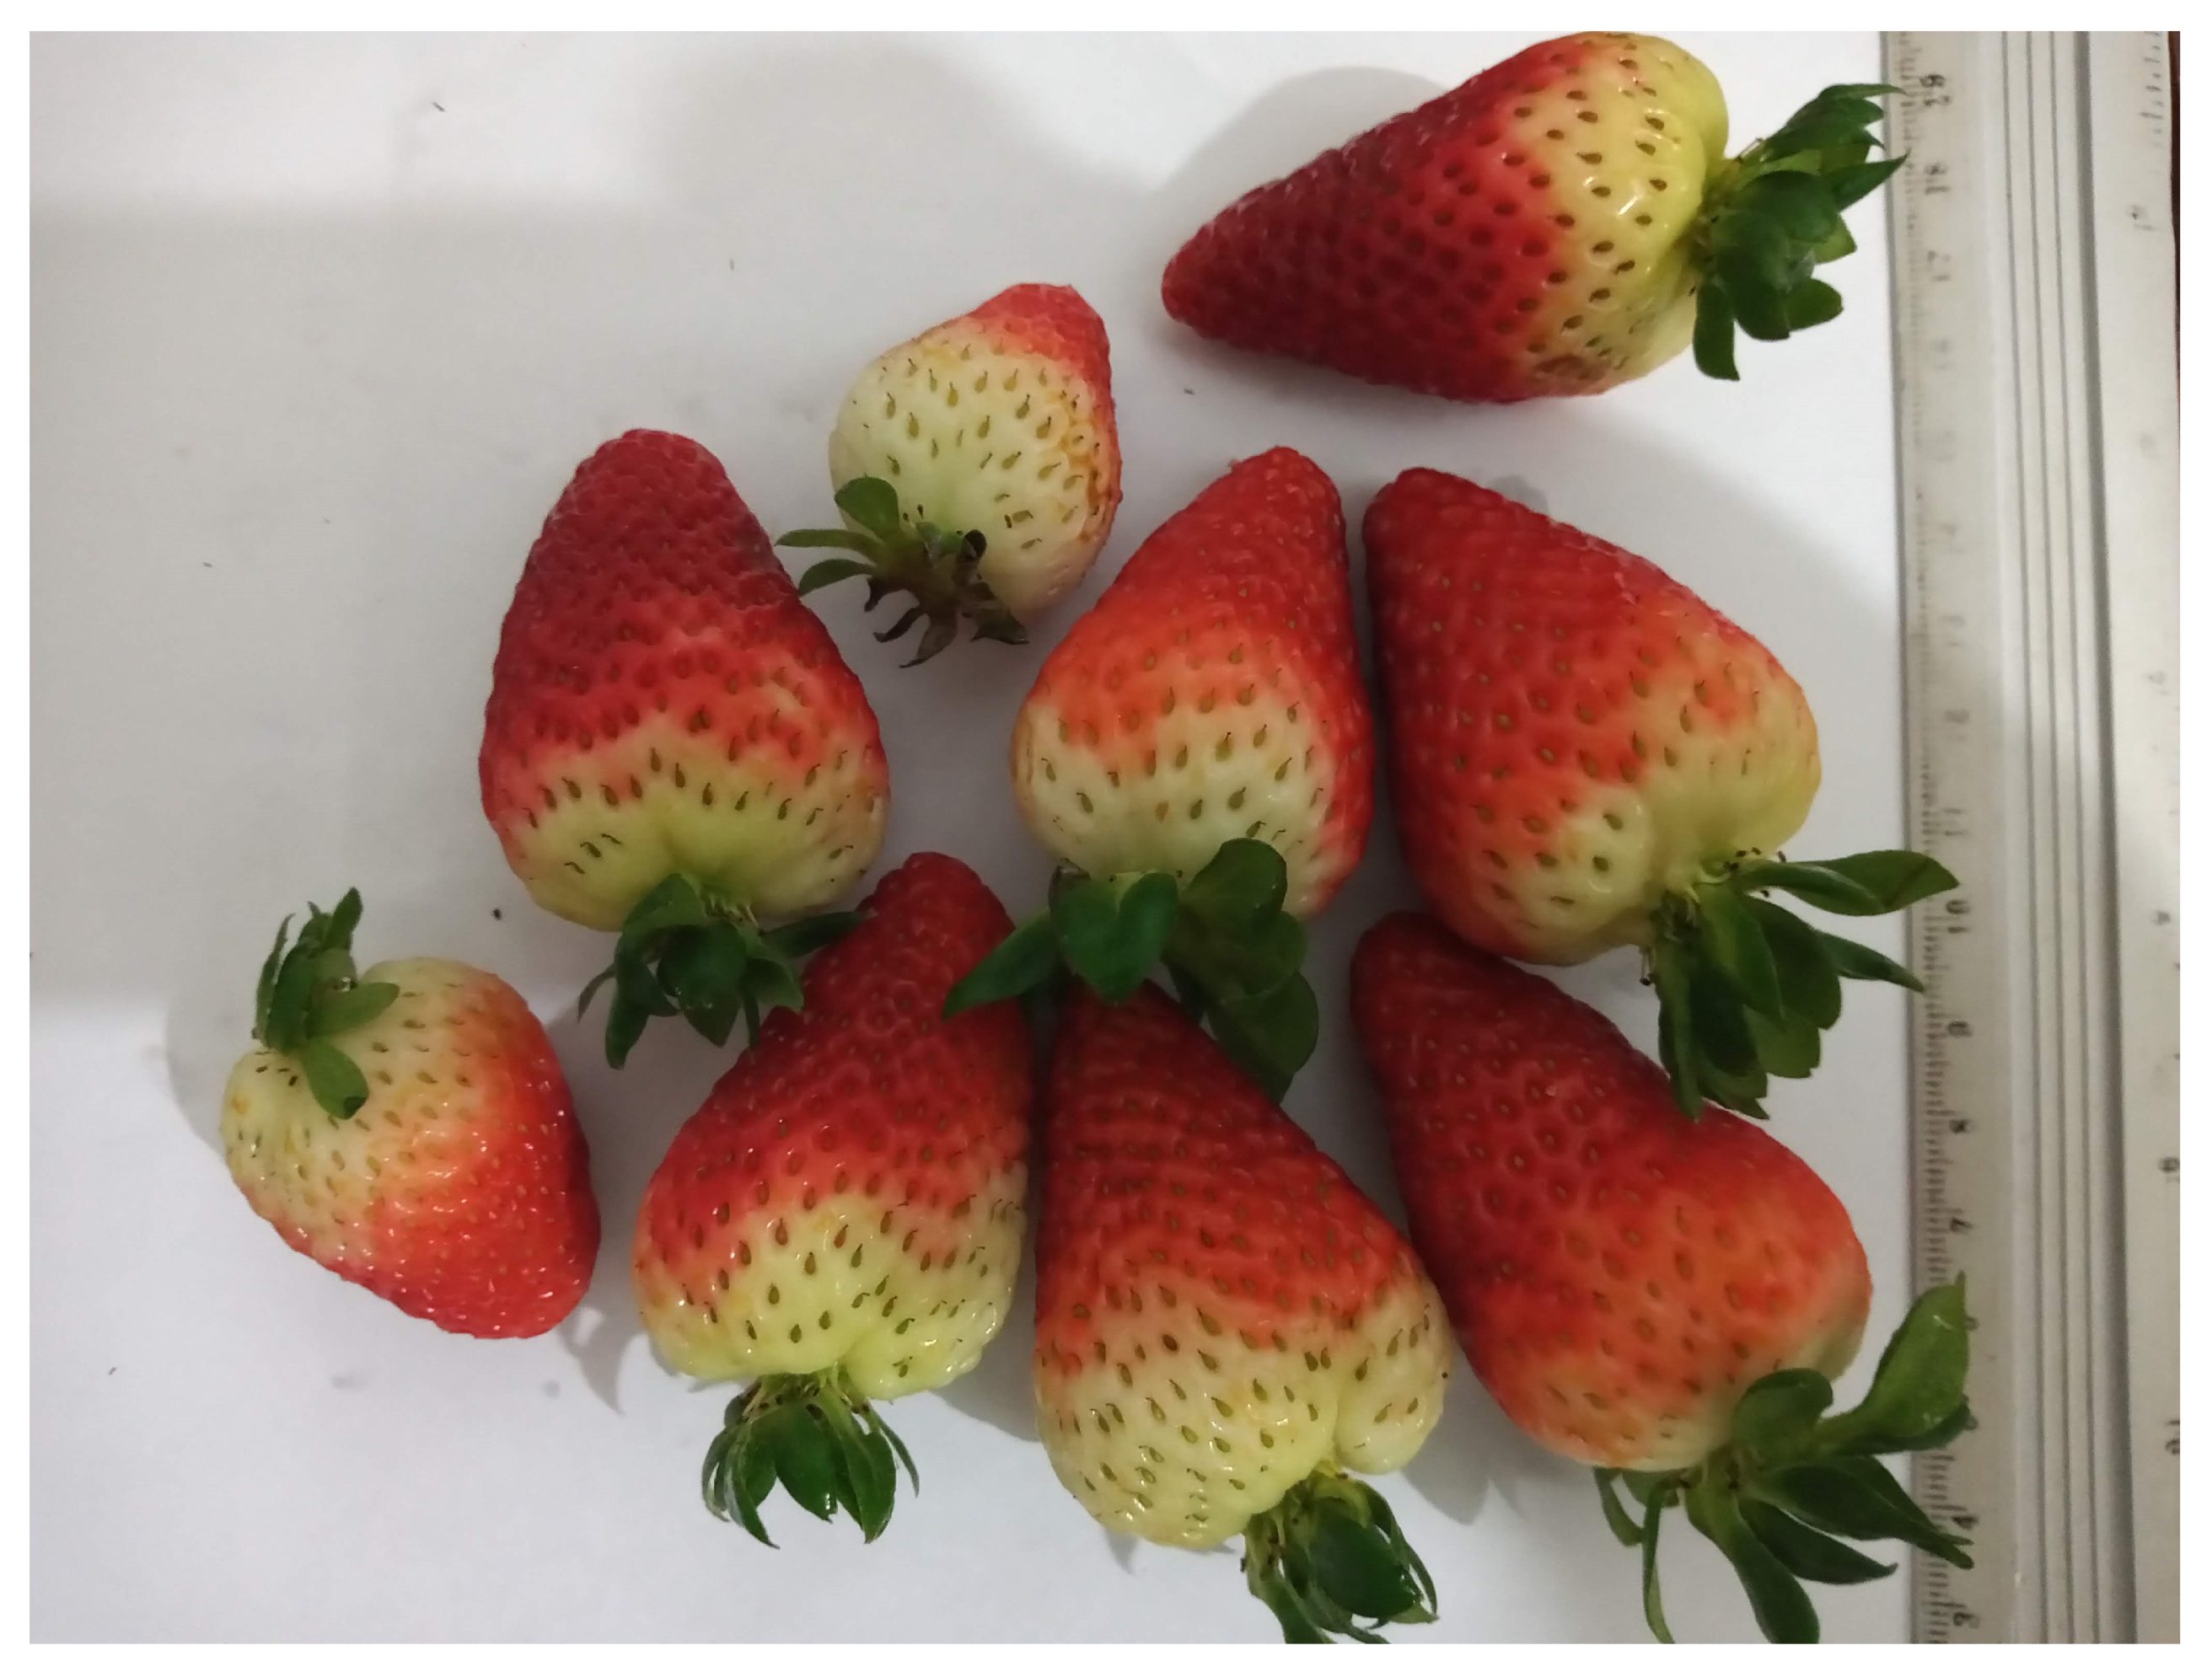
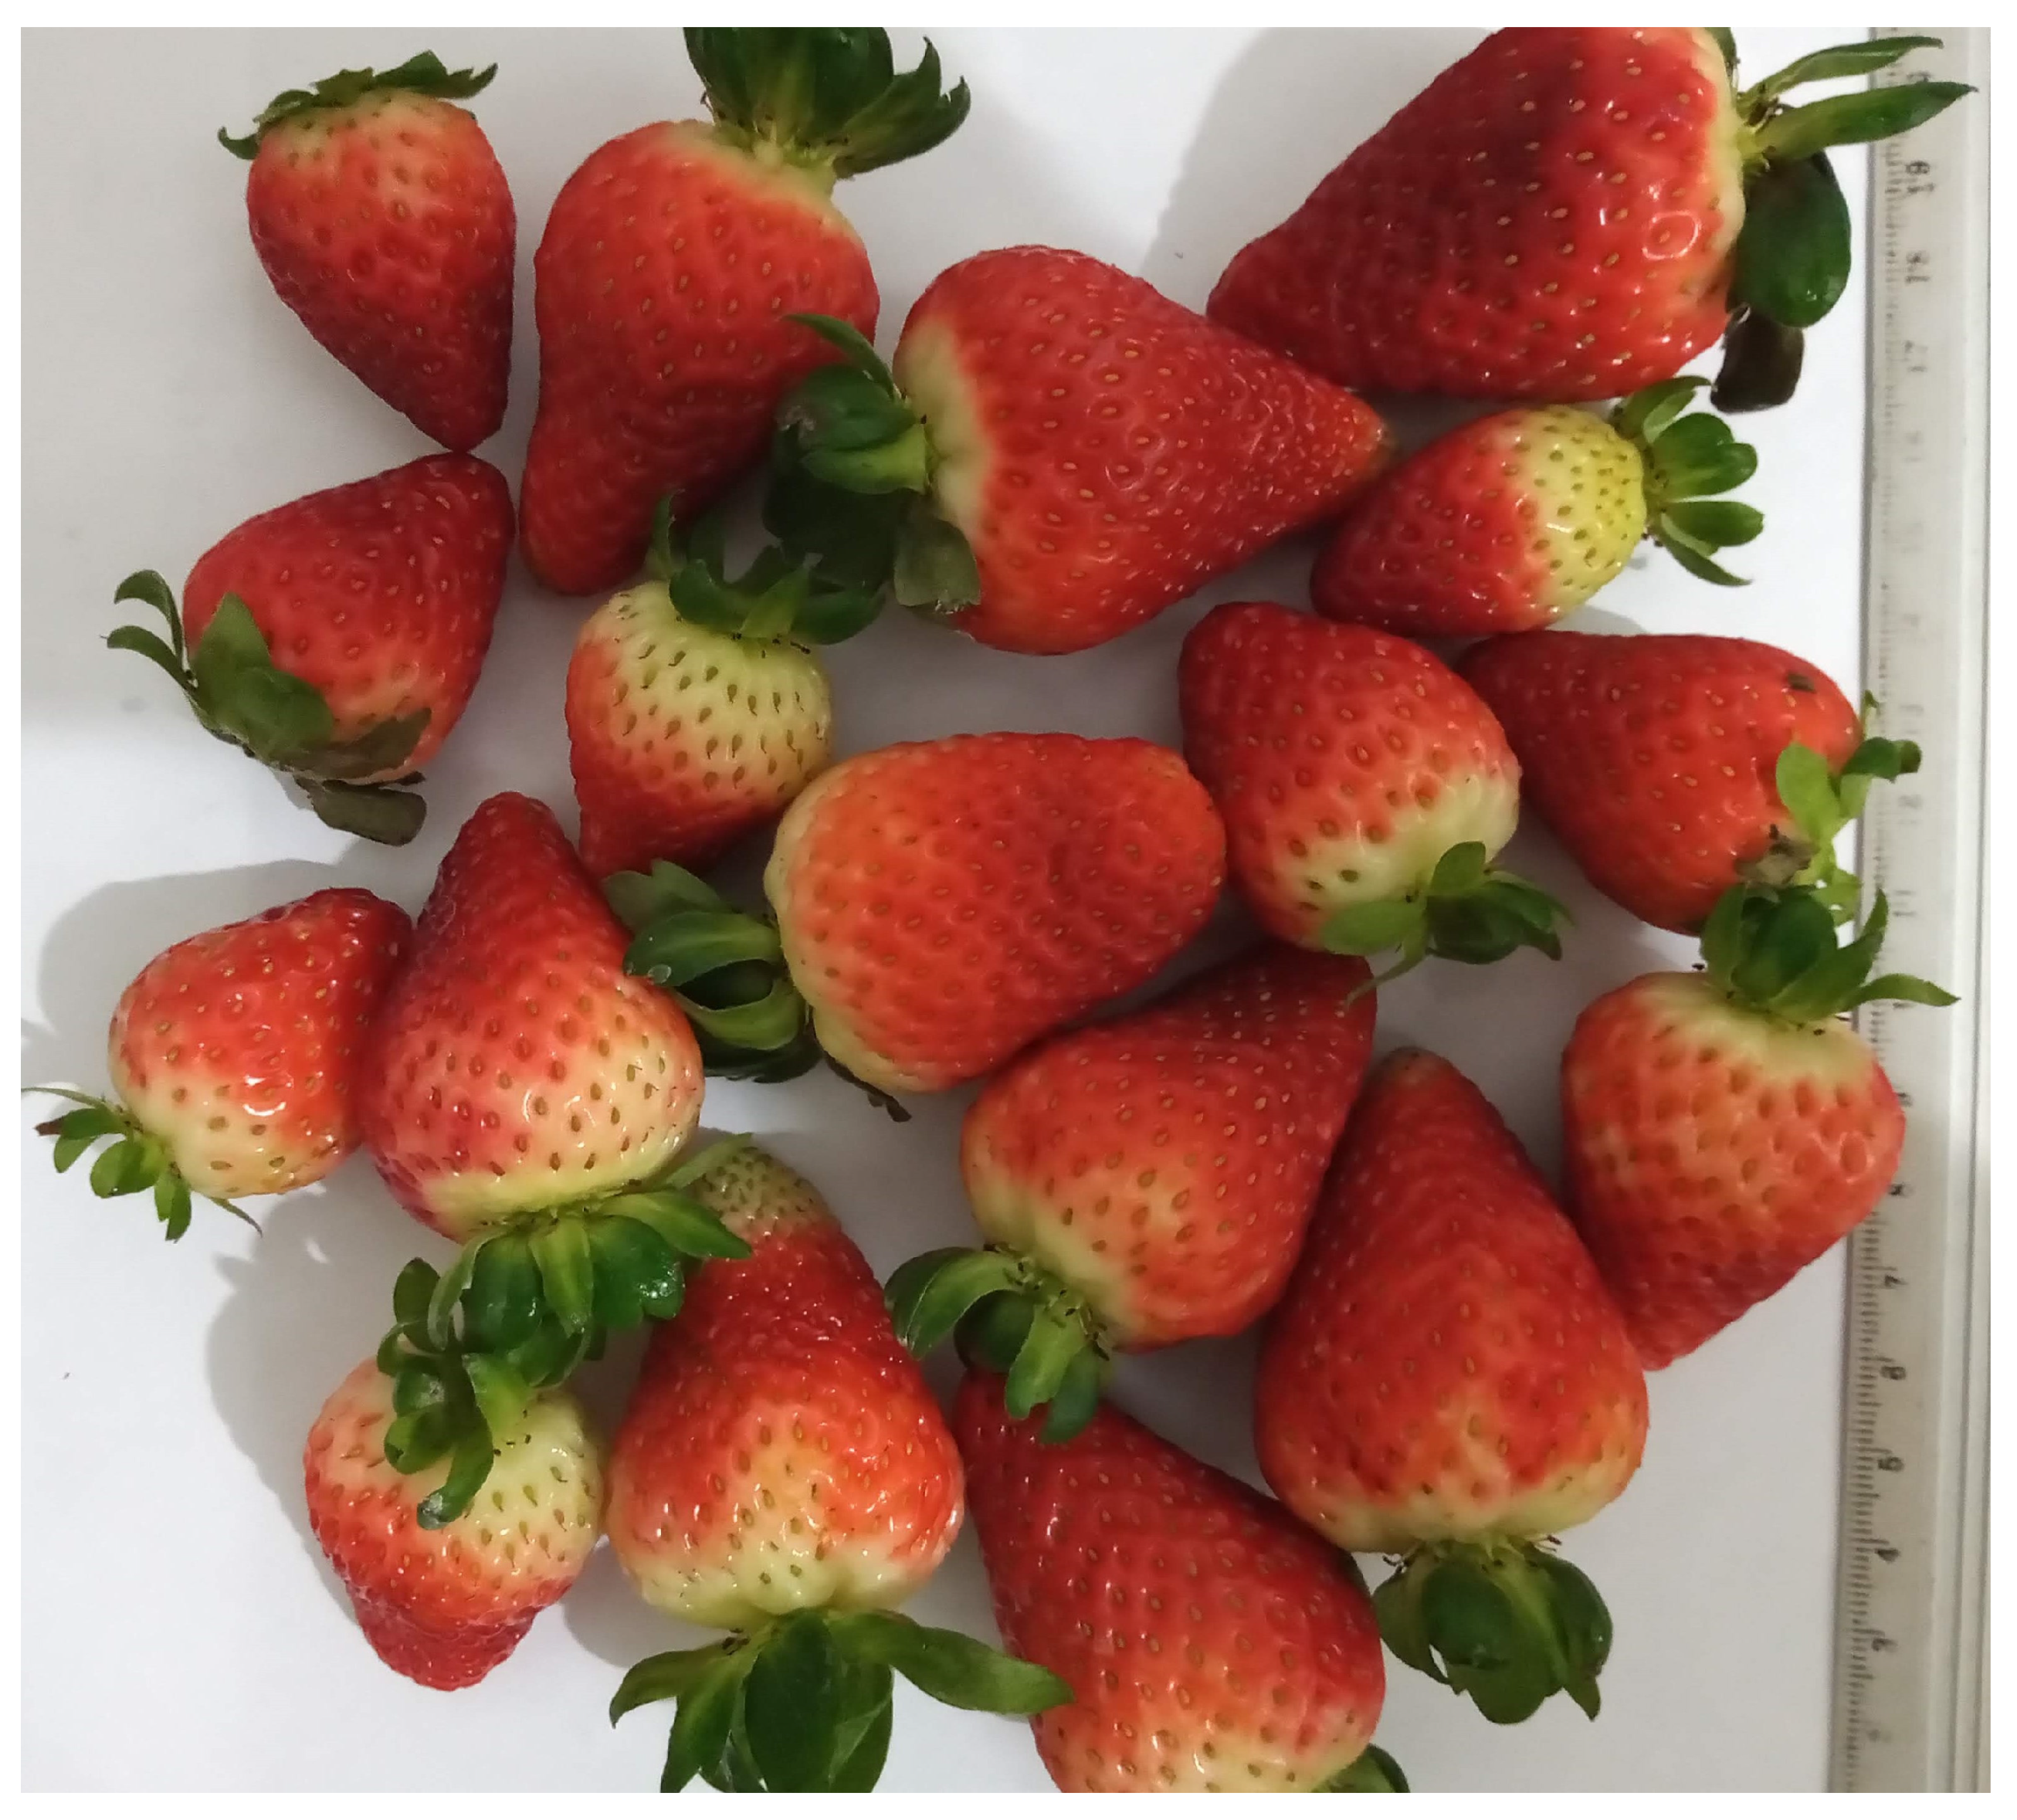
The yield and vegetative development attributes of the treatments were evaluated. The productivity attributes data were total yield per plant in grams (g), yield per plant with fruits above 10 g, total yield per hectare in tons (T), and total yield per hectare with fruits above 10 g (T). Fruits were weighed weekly for the determination of productivity attributes. Ripe fruit from each treatment was harvested throughout the experimental period. Strawberries were separated by size and external colour, and damaged fruit was removed. Vegetative development data were mean plant diameter in centimetres (cm), mean number of buds per plant in units (un), and mean number of stolons per plant (un). The number of buds and stolons per plant was counted weekly. The size of the plant canopy was measured with a millimetre ruler. The analysis was performed by calculating the average of the equatorial and longitudinal diameters between the ends of the most distant leaves (
Appendix A,
Figure A7,
Figure A8,
Figure A9,
Figure A10 and
Figure A11).
The calculations used to determine the total yield per plant were performed using Equation (1):
where
The calculations used to determine the total yield per hectare plant were performed using Equation (2):
where
STha: Total sum of production per ha (T/ha);
SPS: Weekly sum of production (g);
NP: Number of plants per square meter = 14.4;
Mha: Number of square meters per hectare = 10,000.
Calculations used to determine the average plant diameter plant were performed using Equation (3):
where
TCP: Average plant diameter (cm);
DE: Equatorial diameter (cm);
DL: Longitudinal diameter (cm).
The climate of the region is the humid subtropical Cfb type, according to the Köppen classification, characterized by mild temperatures and rainfall with little variation throughout the year, without a dry season, and by the fact that the average temperature of the hottest month does not reach 22 °C. The average annual rainfall is 1100 mm to 2000 mm, evenly distributed throughout the year. The area experiences severe and frequent frosts, with an average period of occurrence of 10 to 25 days per year. The average maximum temperature of the warmest month of the year (January, summer) is 28 °C, and the average temperature of the coldest month (July, winter) is −4.2 °C. The annual insolation is approximately 2.5 h. The minimum and maximum temperatures in the growing environment were −5.51 °C and 39.48 °C, respectively.
According to data from the National Institute of Meteorology (INMET), on 12 June 2016, Vacaria, RS, registered −8.9 °C at the BASF station. The highest accumulated precipitation in 24 h was 132.4 mm on 8 July 2020, surpassing the record that was 123.6 mm on 18 August 1965. The lowest relative humidity index was 10% in the afternoons of 9 May 2013 and 30 August 2015. Since 2008, the highest wind gust reached 44.8 m/s (161.3 km h−1) on the morning of 5 April 2017.
From the climatic data collected inside the greenhouse during the experiment, the shortest period of solar radiation was on 27 June 2021, with 10 h and 12 min, and the longest was on 2 January 2022, with 14 h and 42 min. During the study time, the variation between the shortest and longest photoperiod was 4 h and 30 min.
The experimental period between June 20 (1st week) and 15 August 2021 (9th week) had low minimum temperatures and a photoperiod of short days (
Figure 1).
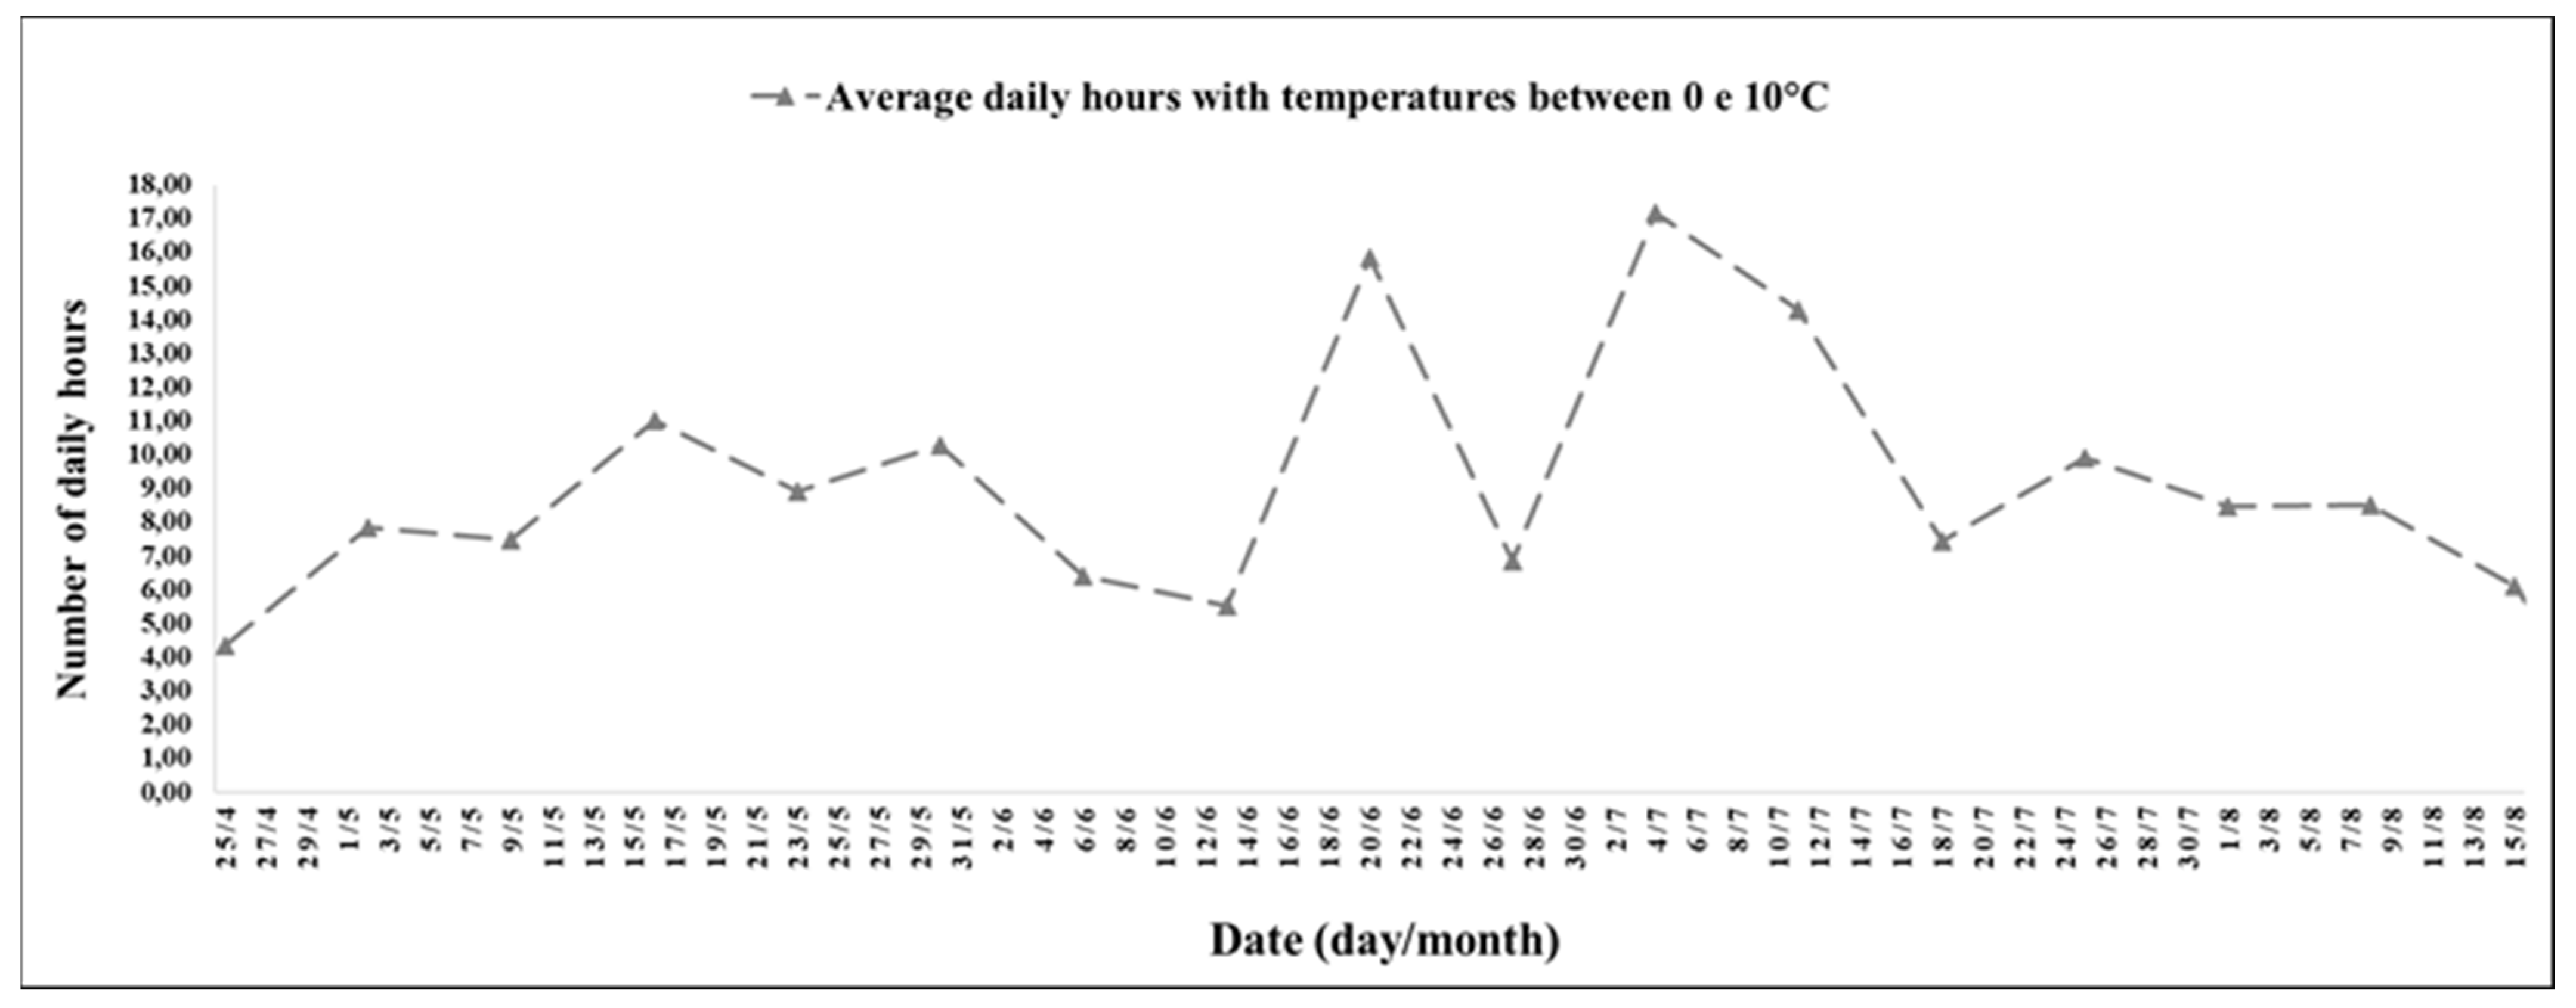
The interval between the 1st and 9th week stood out for the record of 10 h and 31 min, with temperatures between 0 and 10 °C, and the highest records were on 20 June (1st week), with 15 h and 52 min; 4 July (3rd week), with 17 h and 10 min; and 11 July 2021 (4th week), with 14 h and 17 min (
Figure 2).
During the experimental period between the 1st and 9th week, the average photoperiod was 10 h and 35 min, and the lowest record was on 27 June 2021 (2nd week), with 10 h and 7 min, and the highest was on 15 August 2021 (9th week), with 10 h and 54 min.
The experimental period between August 22 (10th week) and 17 October 2021 (18th week) was a transitional period between winter and spring and had some hours with low temperatures at night and a high number of hours with mild temperatures during the day (
Figure 3) and an increasing photoperiod of short days (
Figure 1).
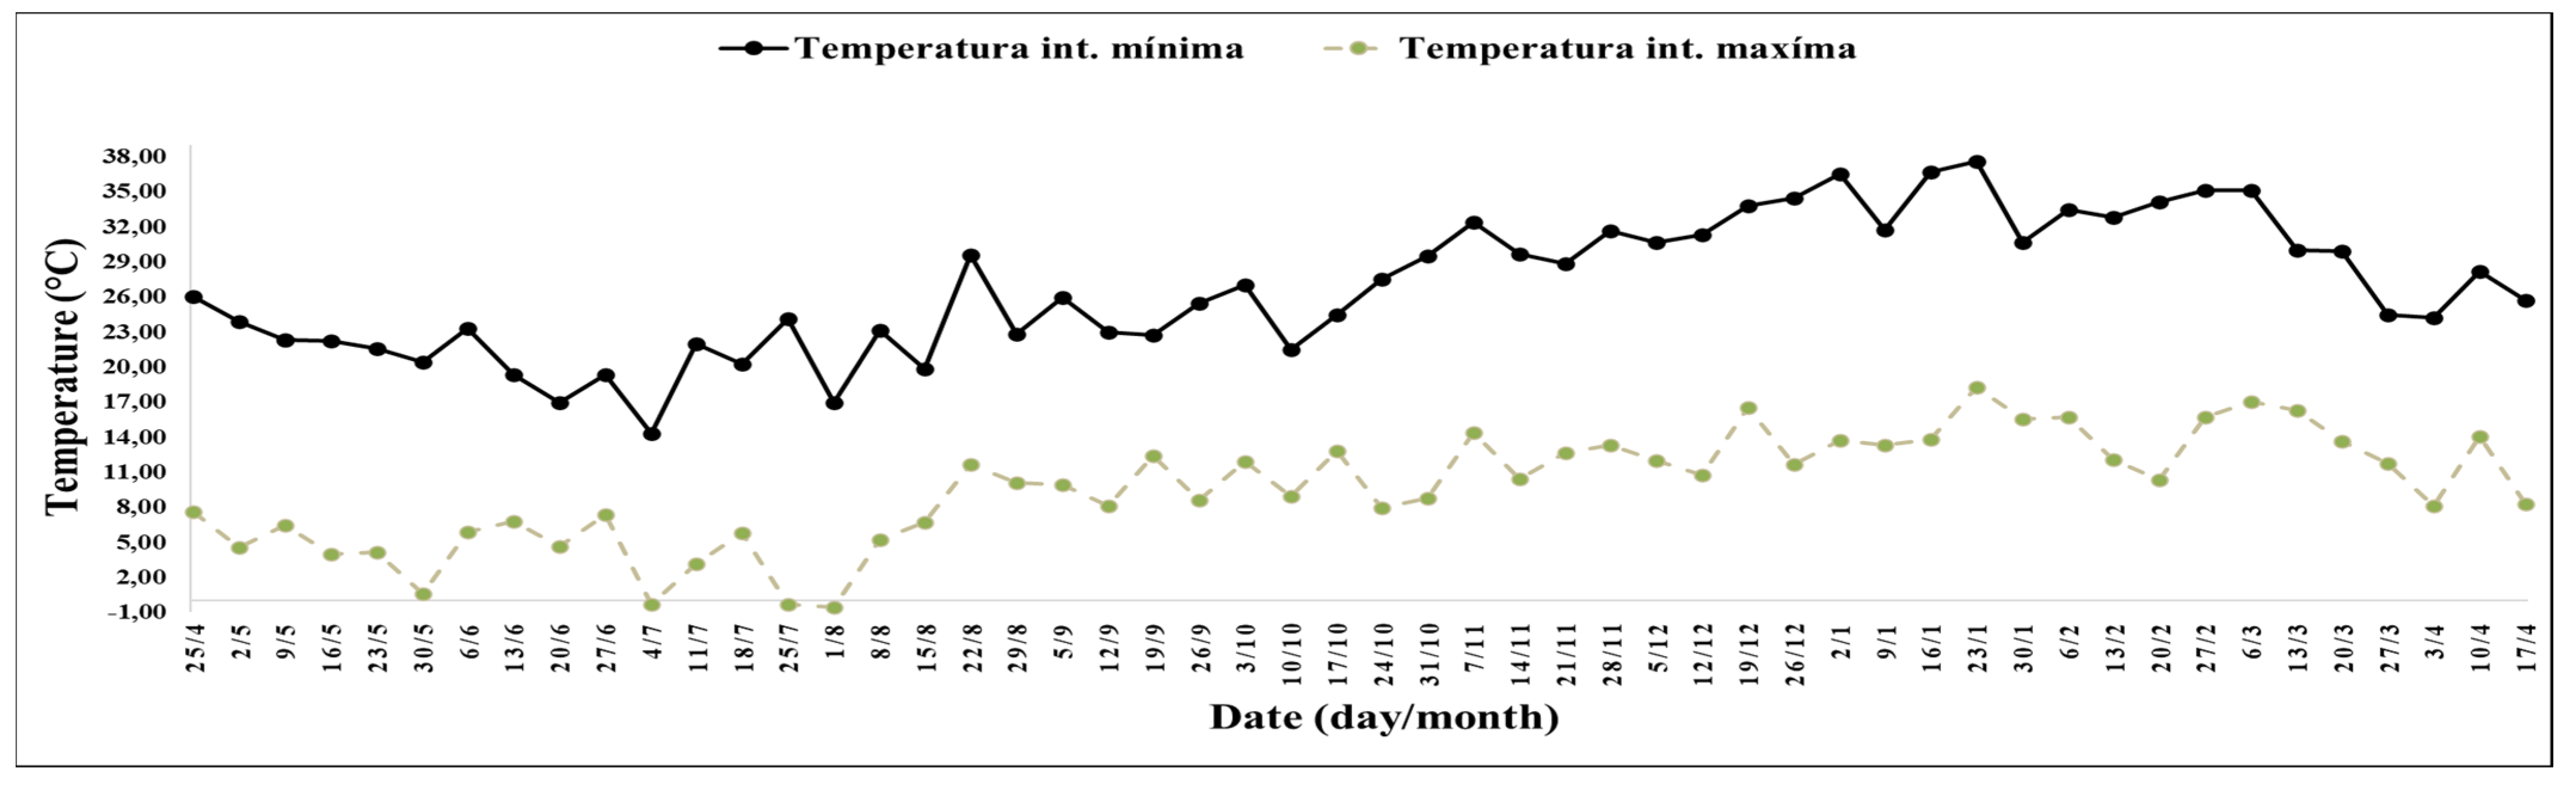
The interval between the 10th and 18th week stood out for the record of 11 h and 33 min daily, with temperatures between 10 and 16 °C (
Figure 3), and with average minimum temperatures of 10.51 °C and maximum temperatures of 24.75 °C (
Figure 4).
During the experimental period between the 10th and 18th week, the average photoperiod was 11 h and 52 min, and the lowest record was on 22 August (10th week), with 11 h and 13 min, and the highest was on 17 October 2021 (18th week), with 12 h and 34 min.
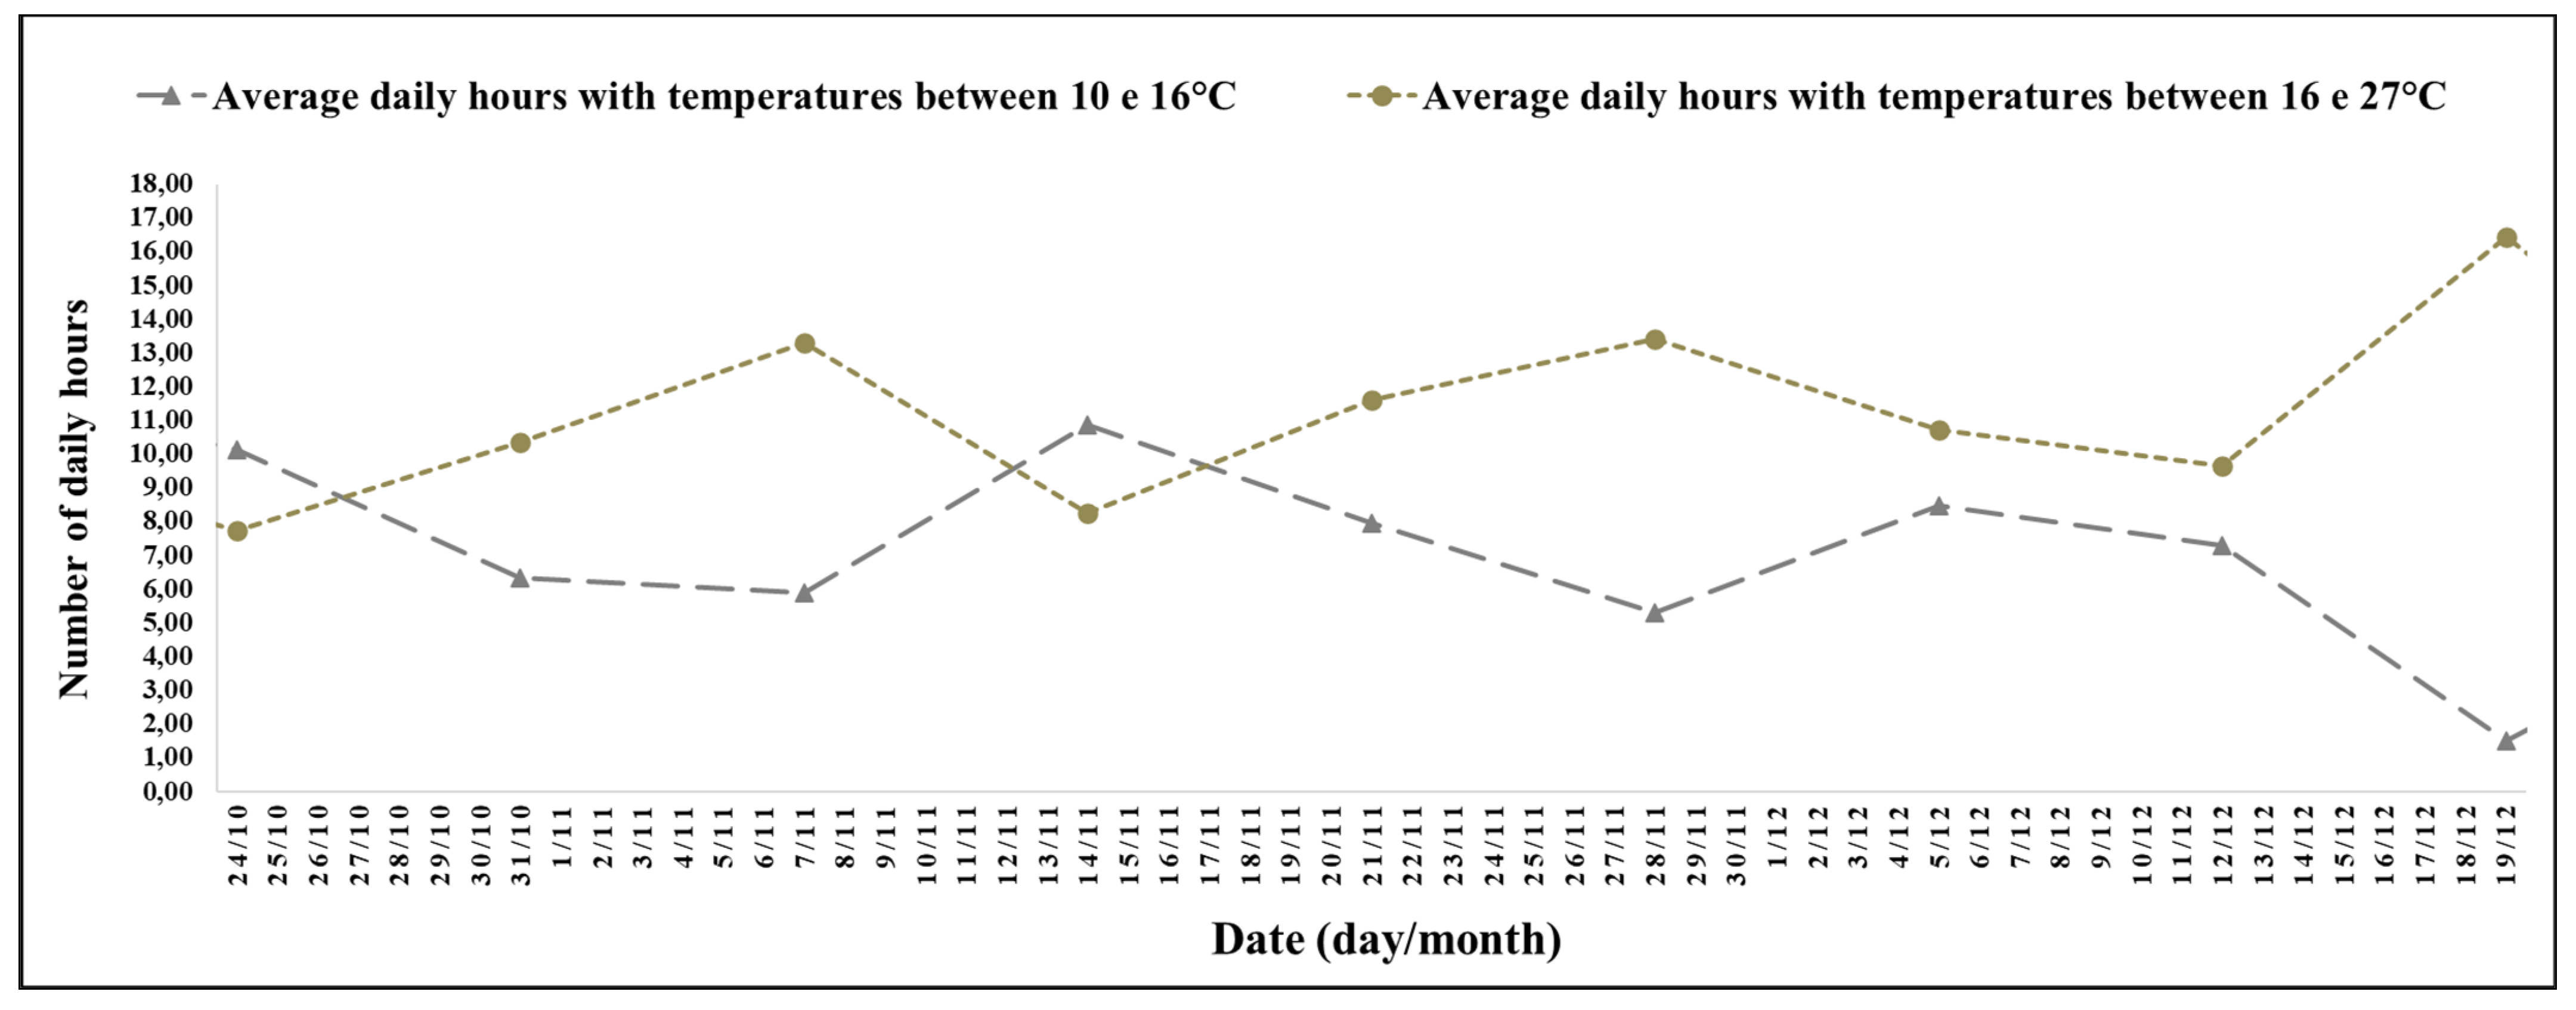
The experimental period between 24 October (19th week) and 19 December 2021 (27th week) had a high number of hours with mild temperatures (
Figure 5), increasing maximum temperatures, and an increasing photoperiod of long days (
Figure 1).
The interval between the 19th and 27th week stood out for the record of 11 h and 17 min daily with temperatures between 10 and 16 °C (
Figure 3) and with the average minimum temperatures of 11.38 °C and maximum temperatures of 30.06 °C.
During the experimental period between the 19th and 27th week, the average photoperiod was 13 h and 33 min; the smallest record was on 19 October 2021 (19th week), with 12 h and 59 min, and the largest was 19 December 2021 (27th week), with 14 h.
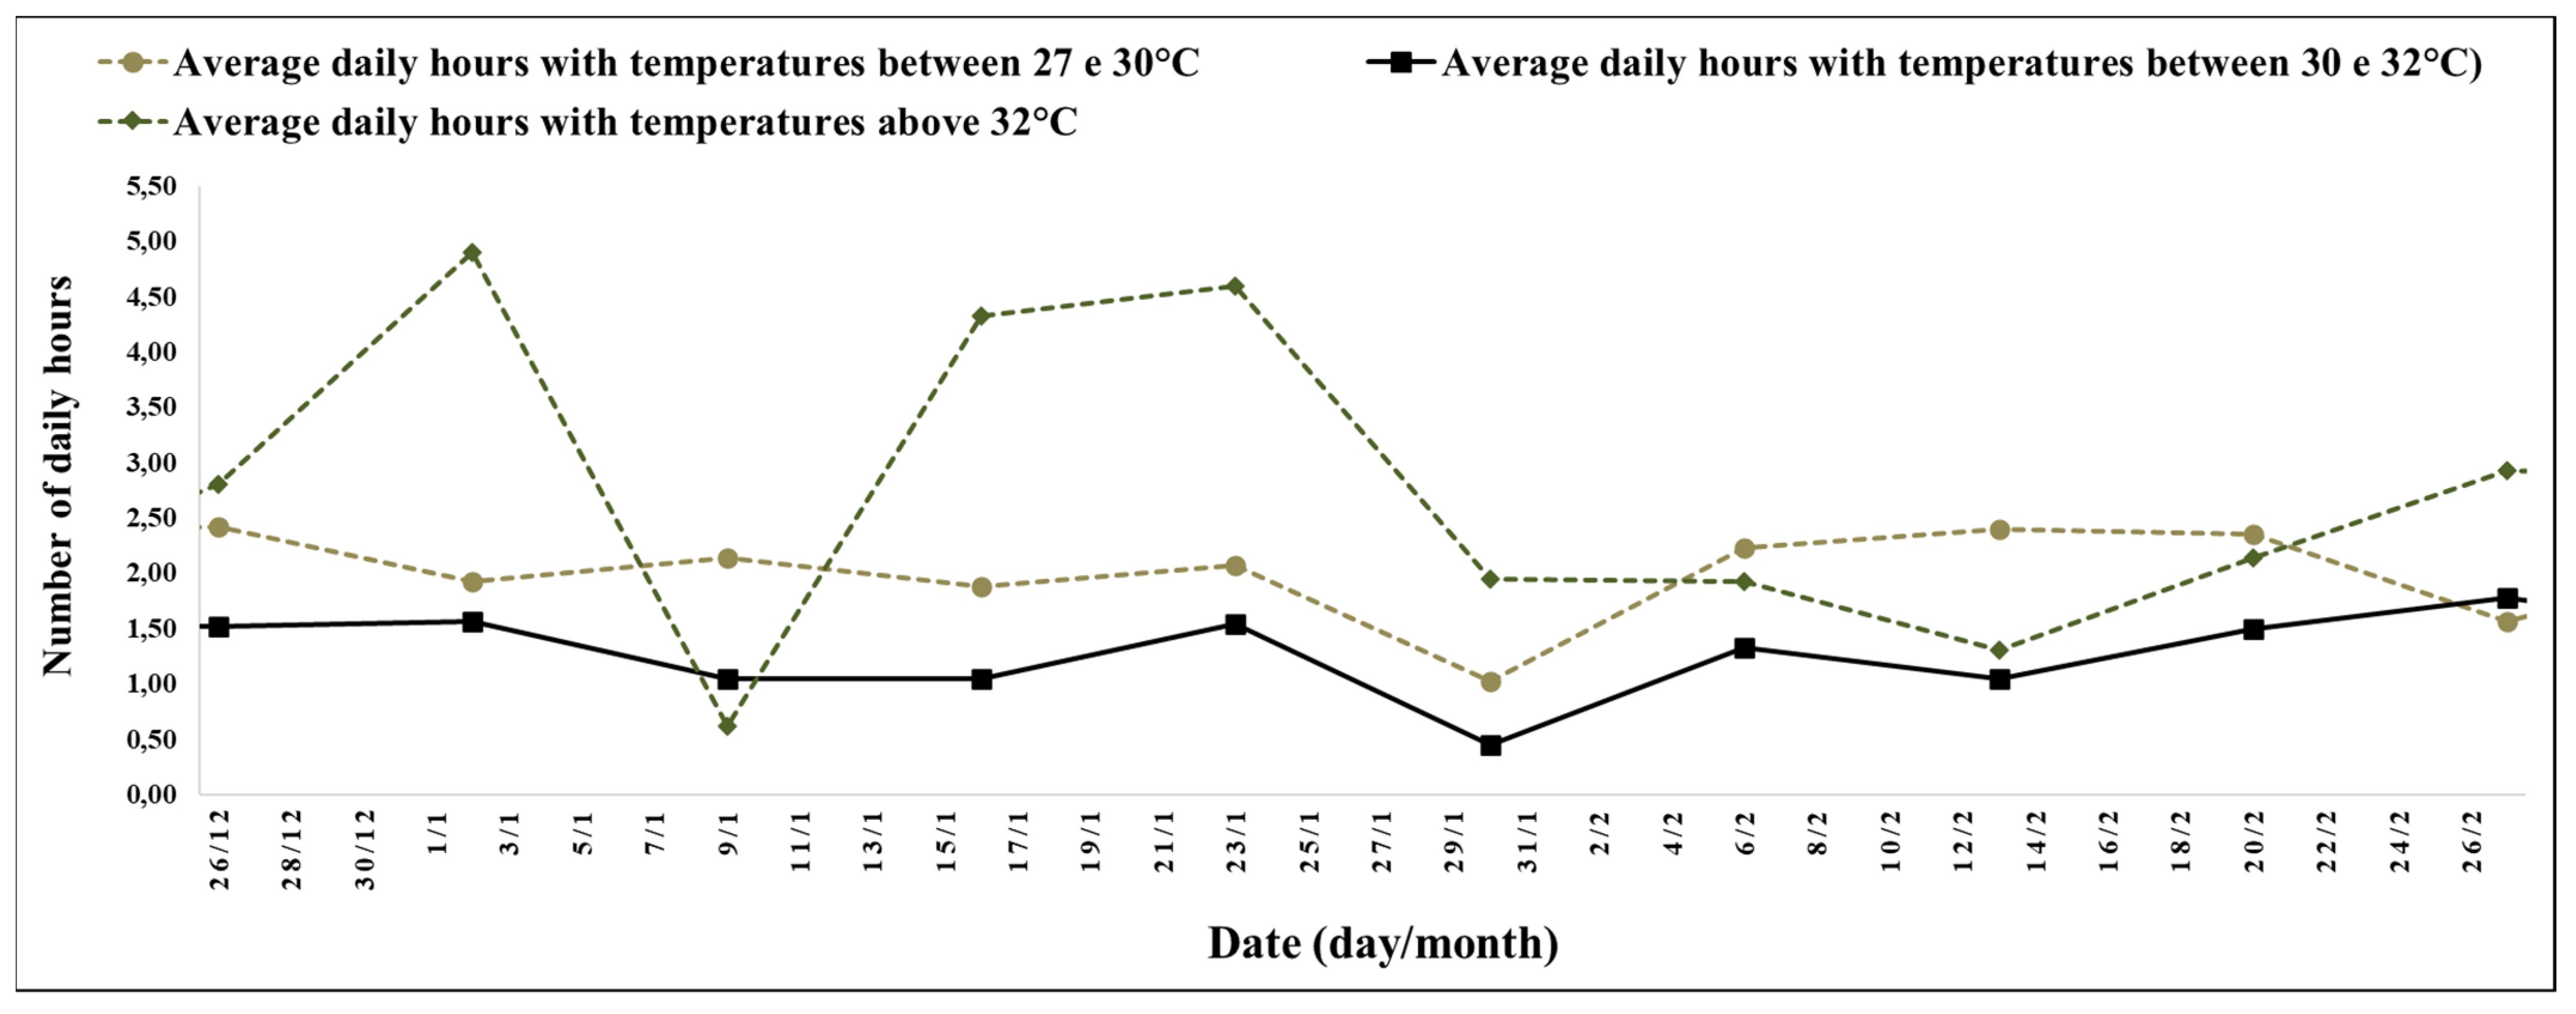
The experimental period between 26 December (28th week) and 27 February 2022 (41st week) was a high number of hours with high temperatures (
Figure 6) and a decreasing long-day photoperiod (
Figure 1).
The interval between the 28th and 41st week stood out for the record of 6 h and 2 min, with temperatures above 27 °C, and 2 h and 45 min of the day, with temperatures above 32 °C with an average of minimum temperatures of 14.04 °C and maximum temperatures of 34.34 °C (
Figure 4).
For the experimental period between the 28th and 41st week, the average photoperiod was 13 h and 32 min; the lowest record was on 27 February 2022 (41st week), with 12 h and 40 min, and the highest was on 26 December 2021 (28th week), with 14 h and 4 min.
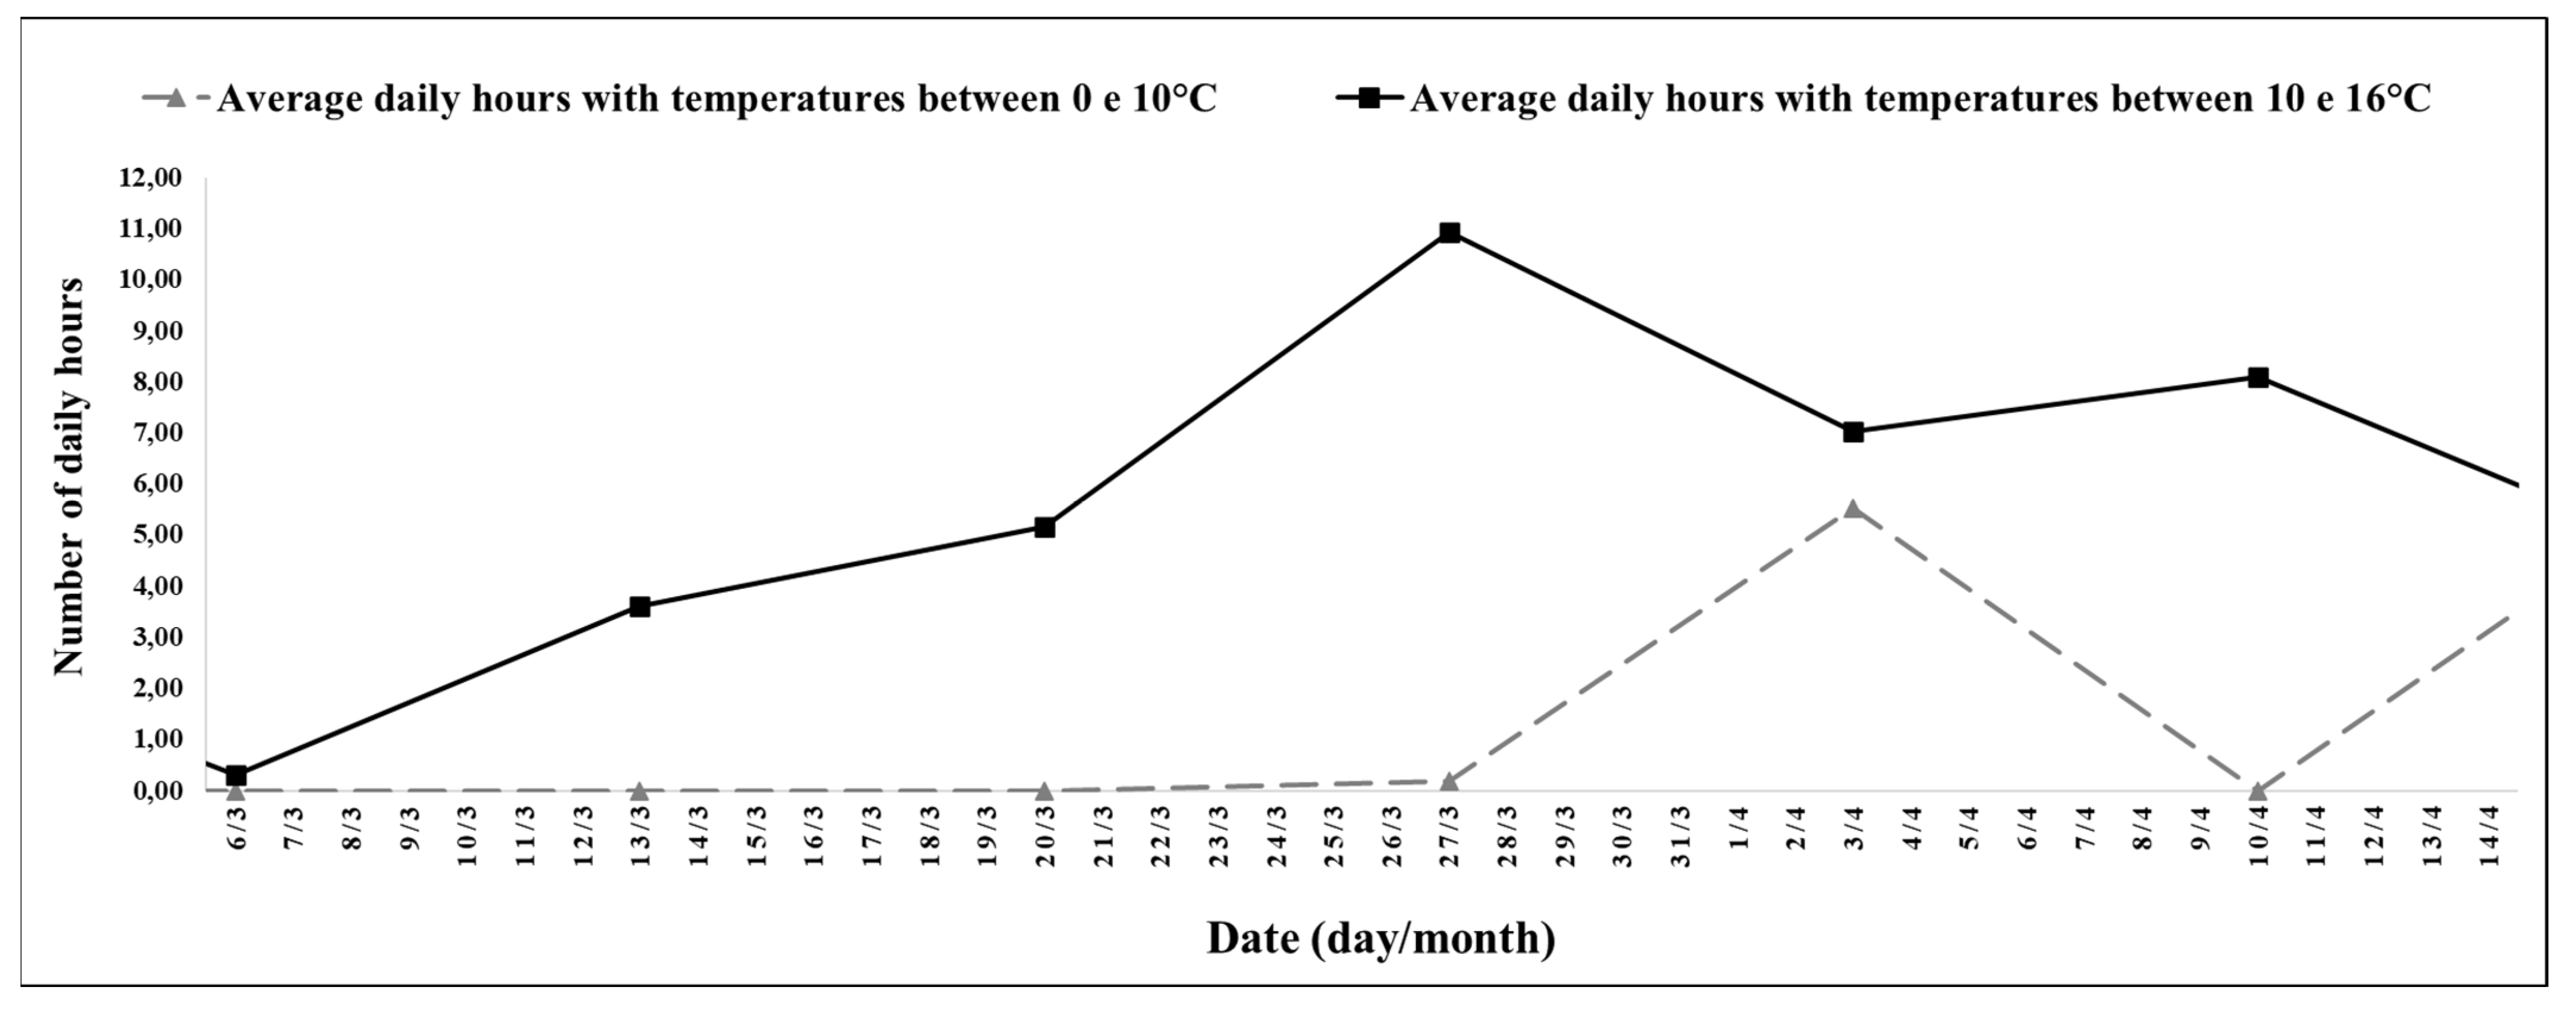
The experimental period between 6 March (42nd week) and 10 April 2022 (47th week) was a high number of hours with mild temperatures and a decreasing photoperiod of short days (
Figure 1) in the last 3 weeks, and for the period between 27 April (45th week) and 10 May 2022 (47th week), there was an increase in the number of hours, with temperatures between 0 and 10 °C (
Figure 7).
The interval between the 42nd and 47th week stood out for its duration of 5 h and 52 min, with temperatures between 10 and 16 °C, with a minimum average temperature of 13.51 °C, and a maximum of 28.68 °C (
Figure 4). Between the 45th and 47th week, it stood out for its duration of 1 h and 54 min, with temperatures between 0 and 10 °C.
For the experimental period between the 42nd and 47th week, the average photoperiod was 12 h and 02 min; the smallest record was on 10 April 2022 (47th week), with 11 h and 29 min, and the largest was on 6 March 2022 (42nd week), with 12 h and 36 min.
The variables (total yield per plant, yield per plant with fruit above 10 g, total yield per hectare, total yield per hectare with fruit above 10 g, average plant diameter, average number of buds per plant, and number of stolons per plant) were analyzed with simple ANOVA (one way). Significant means were compared by Tukey’s honestly significant difference test (p < 0.05). Analyses were performed using SPSS software version 27.0 (SPSS, IBM, Chicago, IL, USA).
3. Results
The results obtained from Tukey’s test are presented in
Table 1 and
Table 2 below, which show the minimum significant difference, the difference between the means of the performance of the experiments with different types of strawberry plants, the ‘Albion’ cultivar, and the standard deviation and
p-value.
Among the plant types and productivity attributes, there were no significant variations regarding the total yield per plant, the yield per plant with fruits above 10 g, the total yield per hectare, and the total yield per hectare with fruits above 10 g (
Table 1), demonstrating that the treatments did not affect the yield in the first year of the yield.
There was no significant variation between the plant type and plant diameter (
Table 2). Regarding the number of buds per plant (
Figure 6), the plants in trays with mature roots preserved by the cold (E5) presented a higher number of buds compared to the plants in trays with mature roots (E3) (
Table 2).
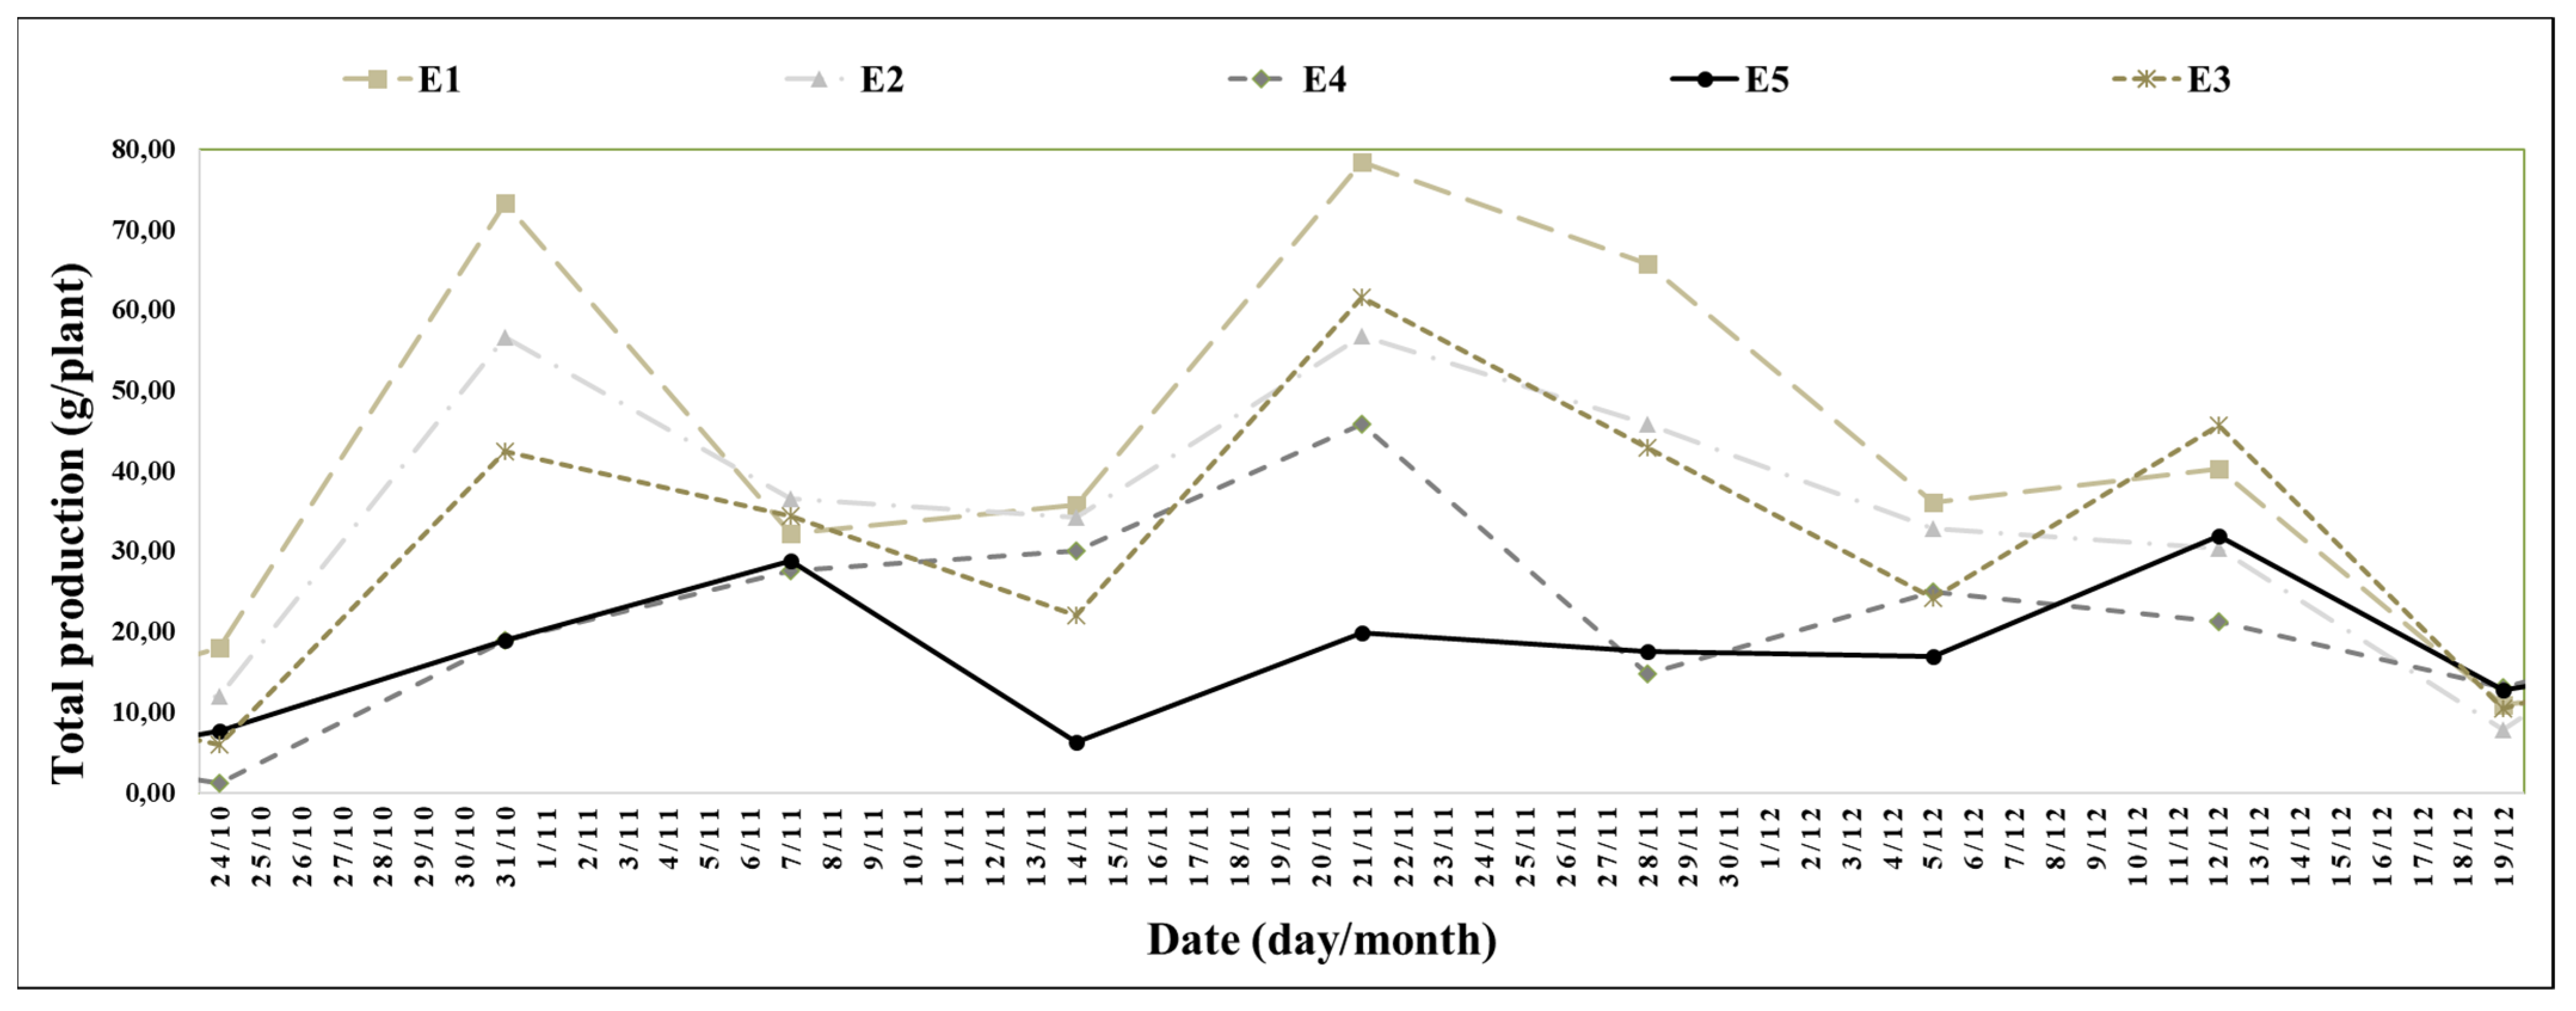
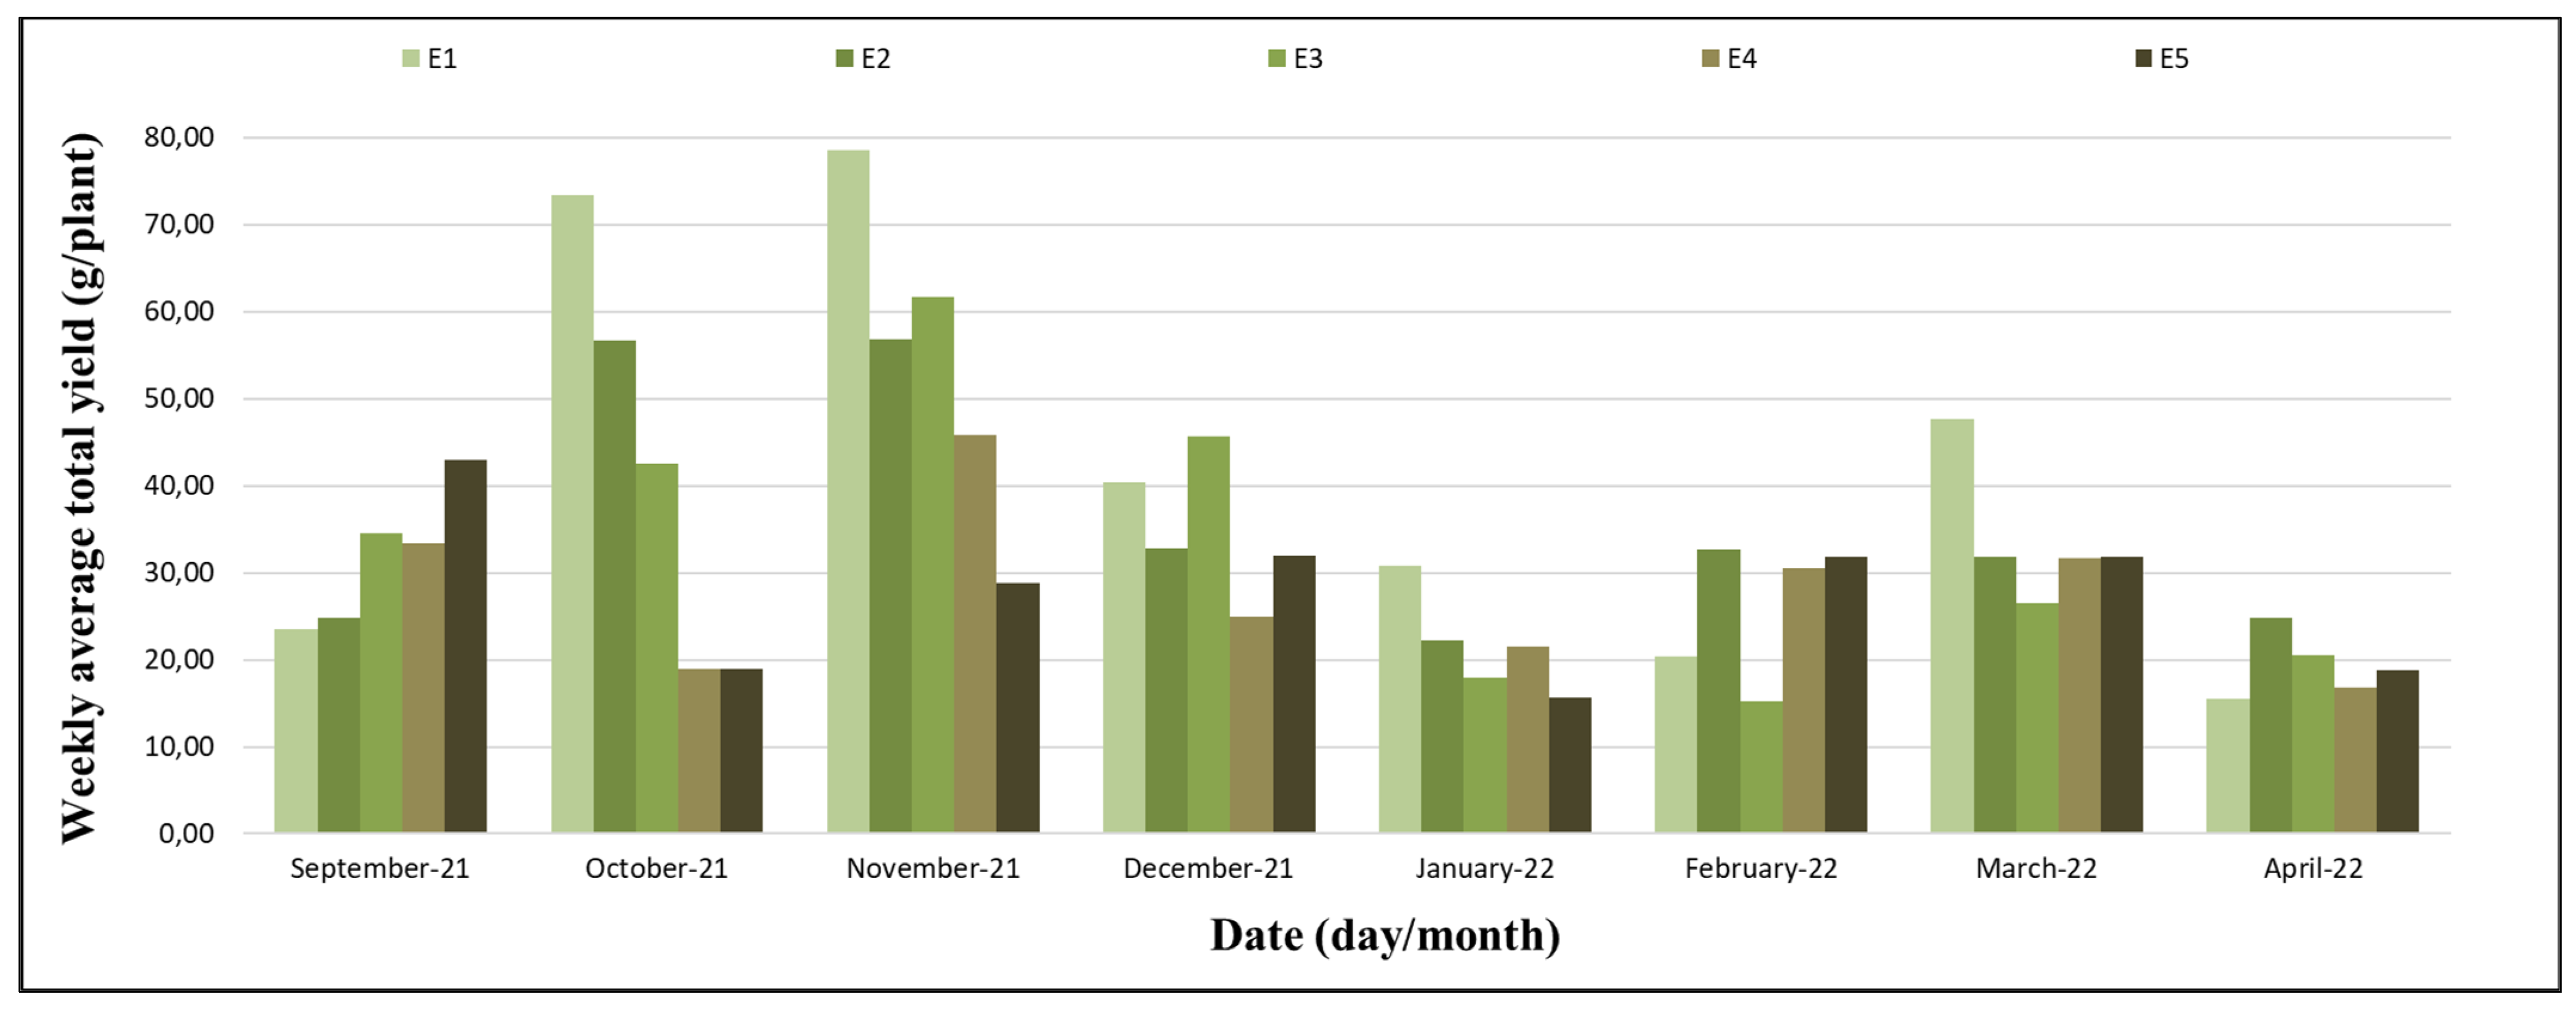
The production started on 12 September 2021 (the 13th week) and ended on 10 April 2022 (the 47th week). September and the first half of October were characterized by favourable conditions for the beginning of flowering and production; the second half of October until December were the times of intensification of flowering and ripening of the fruits, and this was the period with the higher yields. From January to March, the yields were average, and in the first half of April, the yields were low (
Figure 8).
The interval between the 19th and 27th week stood out for the highest yields, with the highest yield indices in two moments: at the end of October and in the first half of November (
Figure 9).
For the experimental period between the 19th and the 27th week, the average photoperiod was 13 h and 32 min; the lowest record was on 19 December 2021 (the 27th week), with 12 h and 59 min, and the highest was on 17 October 2021 (the 18th week), with 14 h.
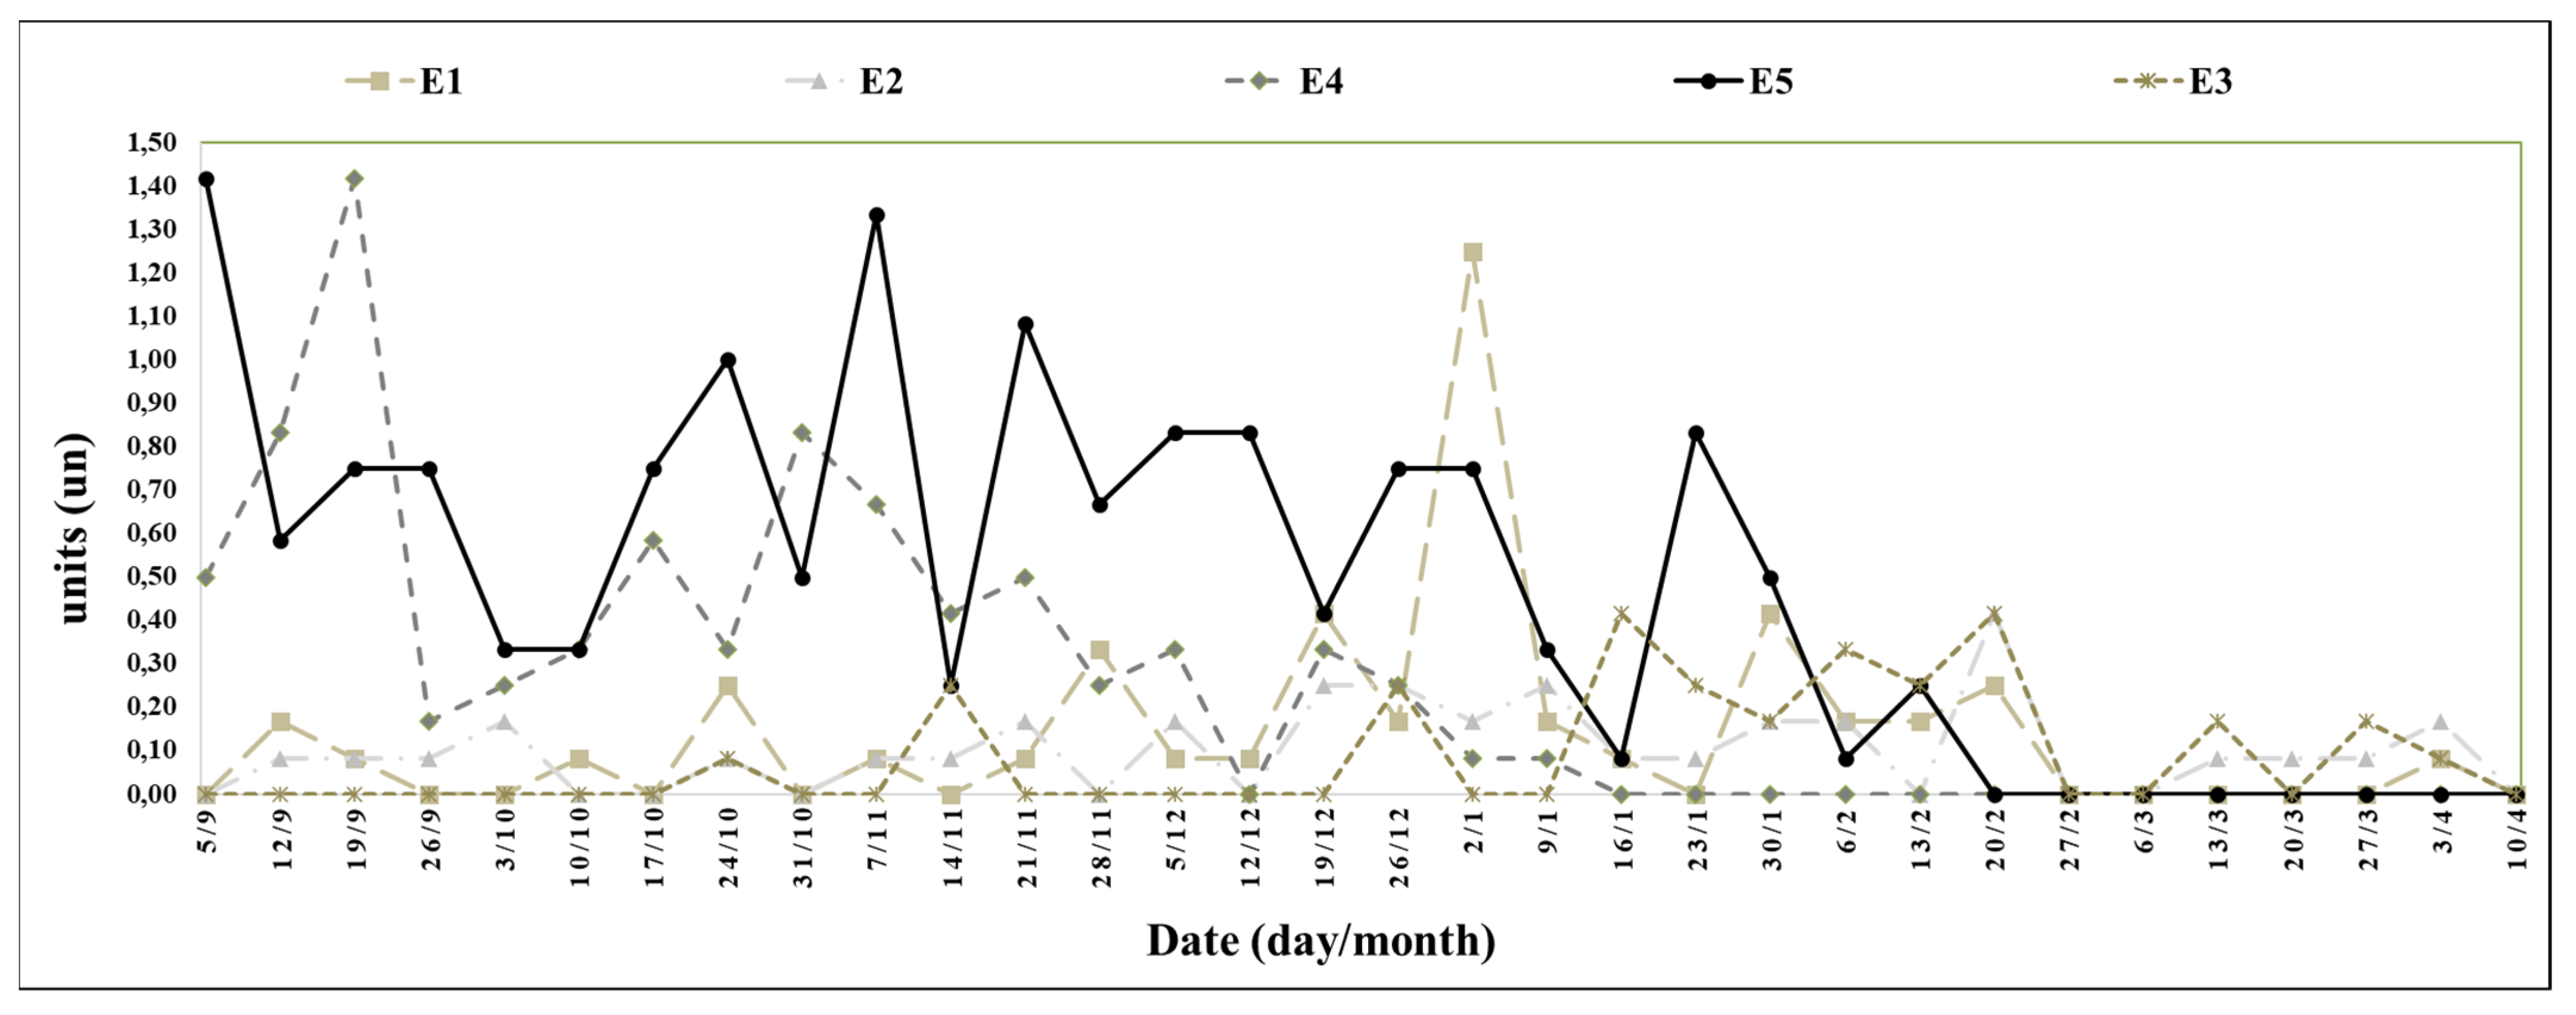
Treatment E5 produced the highest number of stolons, followed by treatment E4 (
Figure 10), with no significant variation between treatments E4 and E5 (
Table 2).
The experimental period between 7 November 2021 (the 21st week) and 6 March 2022 (the 38th week) was when the highest development of axillary buds per plant occurred (
Figure 11). Treatment E3 produced the lowest number of buds per plant, followed by treatments E1, E4, and E2; treatment E5 produced the highest number of buds per plant, and there were significant variations between treatments E3 and E5 (
Table 2).
4. Discussion
The types of plants did not cause significant variations in the total yield (
Table 1) and plant diameter (
Table 2), although, in specific seasons, there were relevant oscillations in productivity between the treatments (
Figure 8); however, they were not statistically significant. The experiment was implemented in winter, a period of low temperatures and a short photoperiod. These climatic conditions, being favourable to partial dormancy, restricted the manifestations of productivity, regardless of the characteristics of each treatment. In the spring period, with the gradual increase in temperature and photoperiod, climatic conditions were favourable to fruit yield, allowing the variations in productivity resulting from the treatments to be expressed. In summer, high temperatures (
Figure 4) and photoperiod (
Figure 1) favoured vegetative growth, inhibiting the increase in productivity, regardless of the characteristics of the treatments used (
Figure 8). According to studies, air temperature presents high correlation coefficients with growth, photosynthetic active radiation (PAR), and relative humidity with flowering and fruit yield [
12,
13]. While day-neutral varieties do not respond to the photoperiod, day length was a determinant of plant photosynthetic capacity [
14]. Researchers demonstrated that when the ‘Albion’ cultivar was subjected to a photoperiod variation of 4 h, in the first year of the yield, an increase in fresh mass and fruit size and length was observed, and in the second year of the yield, increases in fresh mass, the number of fruits per plant, and fruit diameter were observed [
15].
The interval between the 1st and 9th week, for presenting a high number of hours with temperature between 0 and 10 °C (
Figure 2), was characterized by favourable conditions of partial dormancy and the stimulation of flowering. According to researchers, when strawberry plants are in temperature ranges from 0 to 5 °C, low vegetative development is observed, becoming partially dormant [
16,
17,
18]. At temperatures between 6 and 10 °C, regardless of the photoperiod, the stimulation of floral induction and flowering is observed [
19,
20]. These behaviours can be understood through the analysis of the maximum quantum efficiency (φP₀) of photosynthetic system II (PS II), in which studies have shown that at temperatures equal to or greater than 5 °C, the maximum quantum efficiency is greater than 0.8 φP₀. These data indicated that under these conditions, the photosynthetic system is still efficient, since at 0 °C, the φP₀ dropped to less than 0.6, thus causing stress to the plants [
21,
22].
The interval between the 10th and 18th weeks, due to the increase in the number of hours of daytime temperatures in the range of 10 and 16 °C, was characterized by conditions favourable to flowering and the beginning of yield. According to studies, the conditions favourable to flowering were the increasing photoperiod of approximately 12 h (
Figure 1); the high number of hours with temperatures between 10 and 16 °C (
Figure 3); the averages of minimum temperatures of approximately 10 °C [
19,
20]; the averages of the maximum temperatures below the limit of inhibition of floral induction of 24 °C [
19,
23]; and adequate reserves of starch, essential for the intensity of floral induction and flowering [
24]. Some studies have shown good flowering conditions with the combination of a 21-day photoperiod of 10 to 12 h and temperatures between 15 and 18 °C [
15,
25,
26].
Within the analyzed interval of the 10th and 18th week, the strawberry yield began; the start occurred on 12 September 2021 (the 13th week), and during the analyzed period, the yield ended on 17 August 2021 (the 18th week). The plants, having gone through the previous period of partial dormancy and floral induction, showed low productivity without significant variations between the treatments (
Figure 8).
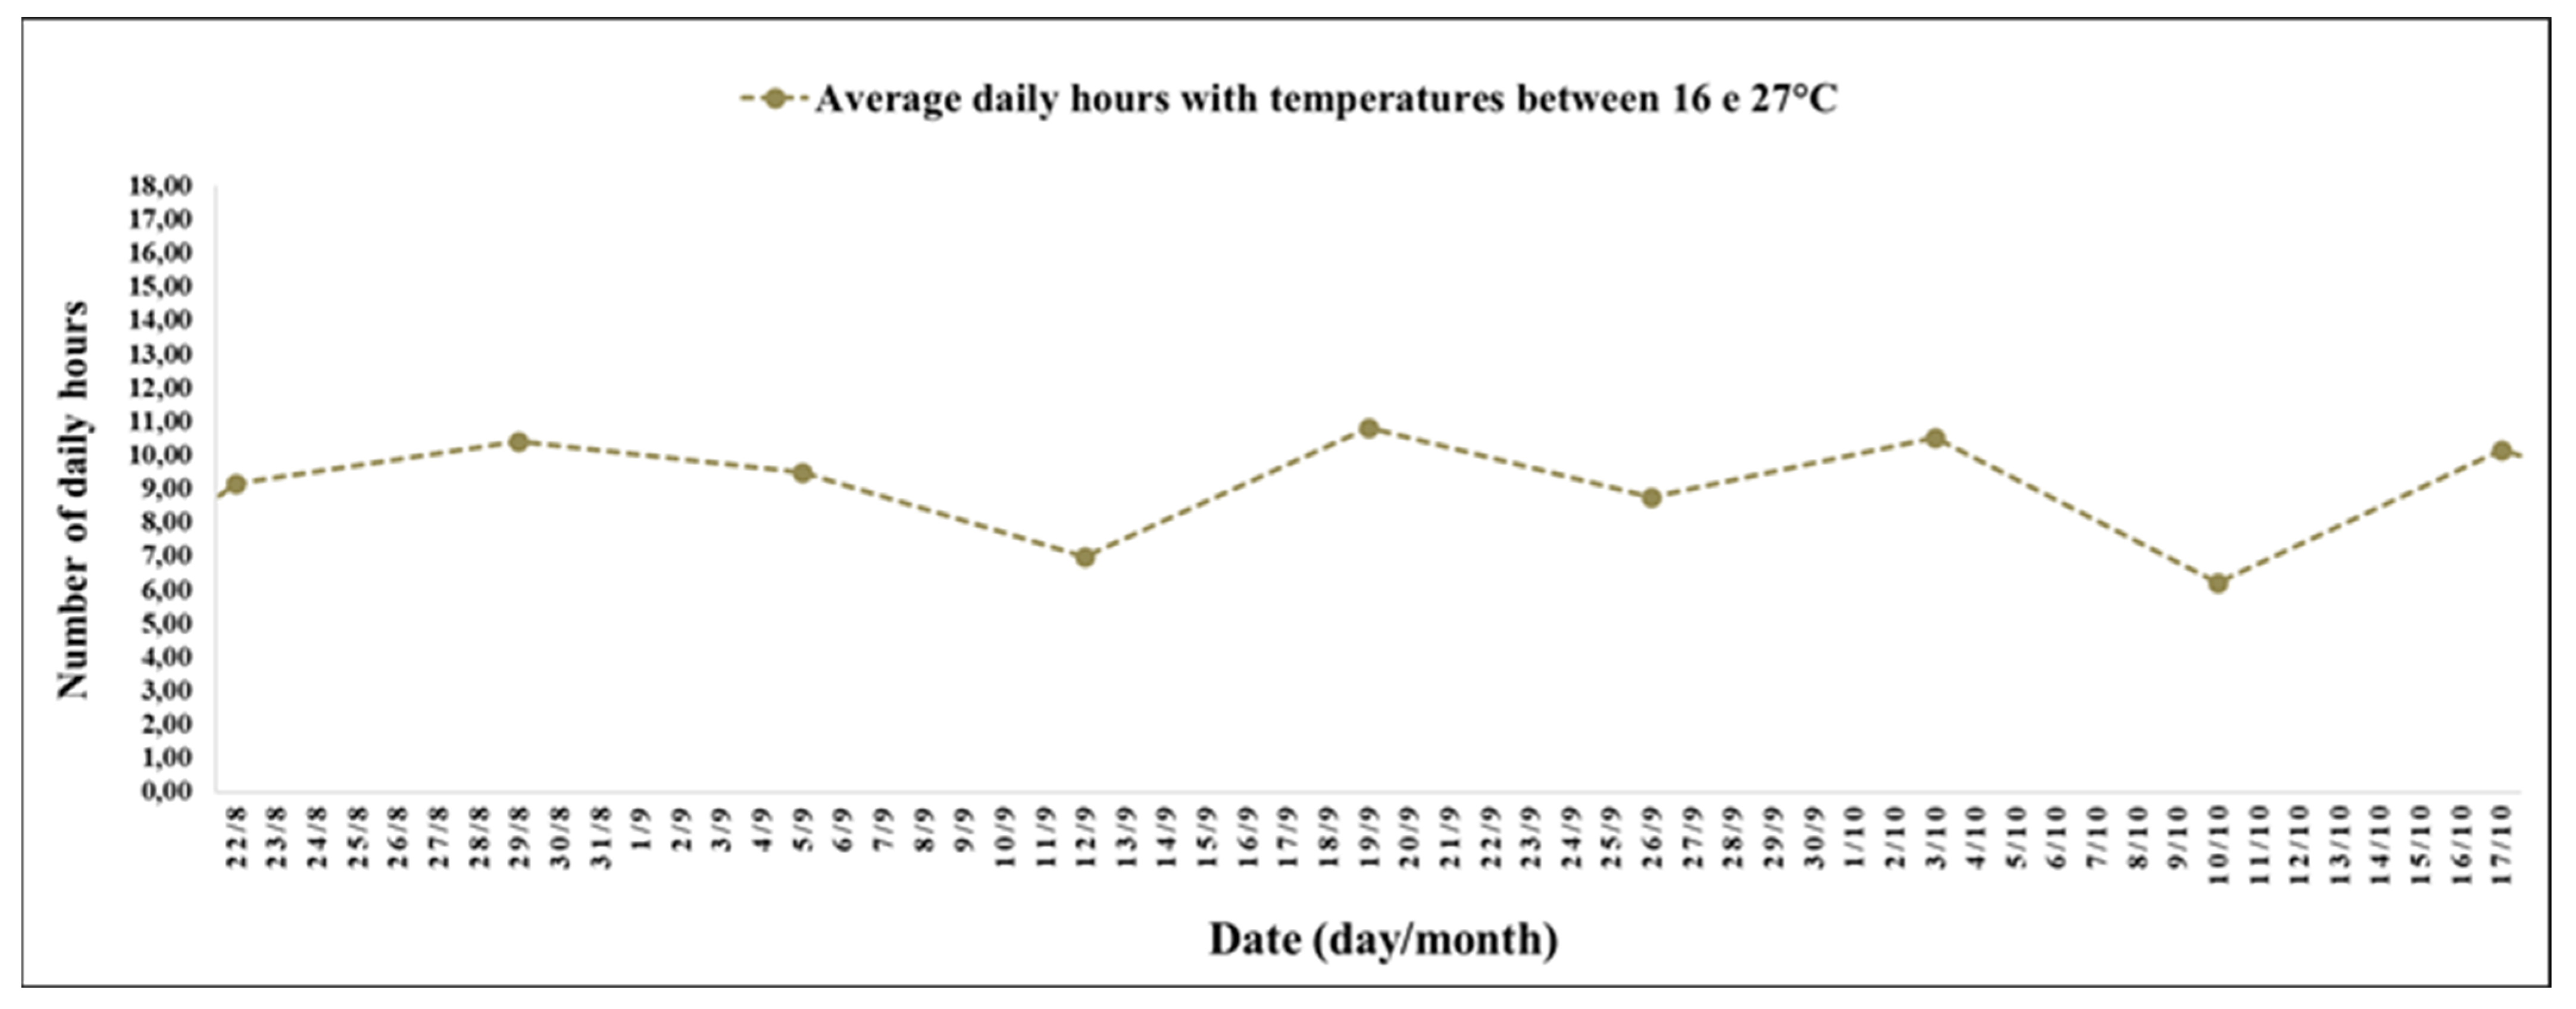
The interval between the 19th and 27th weeks was characterized by conditions favourable to the intensification of flowering and fruit ripening. According to studies, the conditions favourable to flowering and fruit ripening were the increasing photoperiod of approximately 14 h (
Figure 1), suitable for the growth of floral stems, flowers, and young leaves [
27]; the high number of hours with temperatures between 16 and 27 °C (
Figure 5), conducive to flowering and fruiting [
14,
28]; and the average minimum temperatures above 10 °C, suitable for floral induction [
19,
20]. However, average maximum temperatures above 27 °C were recorded. The research showed that temperatures above 27 °C were unsuitable for flowering and may cause physiological disorders [
29]. These observations were studied by the studies of Rivero et al. (2022) [
18], who, when exposing the ‘Delizzimo’ cultivar for 10 weeks in temperatures between 16 and 26 °C, induced 90% to 93% of flowering. The process was intensified with the increase in the temperature and photoperiod; however, above 27 °C, flowering was delayed.
In the experimental period between the 19th and 27th weeks, the highest yields were observed, with moments of high productivity on 31 October (the 20th week), 21 November (the 23rd week), and 28 November 2021 (the 24th week). In the moments of high productivity, there were significant variations in productivity between the treatments, with the lowest results in treatments E4 and E5 (
Figure 9). The cause of the low productivity in treatments E4 and E5 was due to the pre-planting processes of refrigeration and cold storage, processes that delayed the onset of spring flowering, increasing the number of axillary buds (
Figure 11) and stolons (
Figure 10) [
5,
30].
The interval between the 28th and 41st weeks was characterized by vegetative growth, an increased number of axillary buds (
Figure 11), and low productivity without significant variations in productivity among the treatments (
Figure 8). The favourable conditions for vegetative growth were the photoperiod of approximately 13 h (
Figure 1), suitable for vegetative growth [
28]; the high number of hours with temperatures above 27 °C (
Figure 6); and the average maximum temperatures of 34 °C. These data were observed by several researchers, demonstrating that plants grown under a long photoperiod (LD) and high temperatures showed greater leaf growth, with a higher aerial/root ratio [
5,
31,
32].
The interval between the 42nd and 47th weeks was characterized by plants with the formation of new root systems at the base of the axillary buds. The favourable conditions for the formation of new roots were the decreasing photoperiod of approximately 11 h (
Figure 1) and the high number of hours with temperatures between 0 and 16 °C (
Figure 7). This was corroborated by the study of Park et al. (2023) [
5], who, although new root formation was not influenced by the photoperiod, with the increase in the photoperiod from 12 to 16 h at a photosynthetic photon flux density (PPFD) greater than 300 µmol/m
2 s, increased the root fresh and dry biomass from 95 to 108% and from 41 to 44%, respectively. However, the roots slowed their development in plants with low starch accumulation [
33,
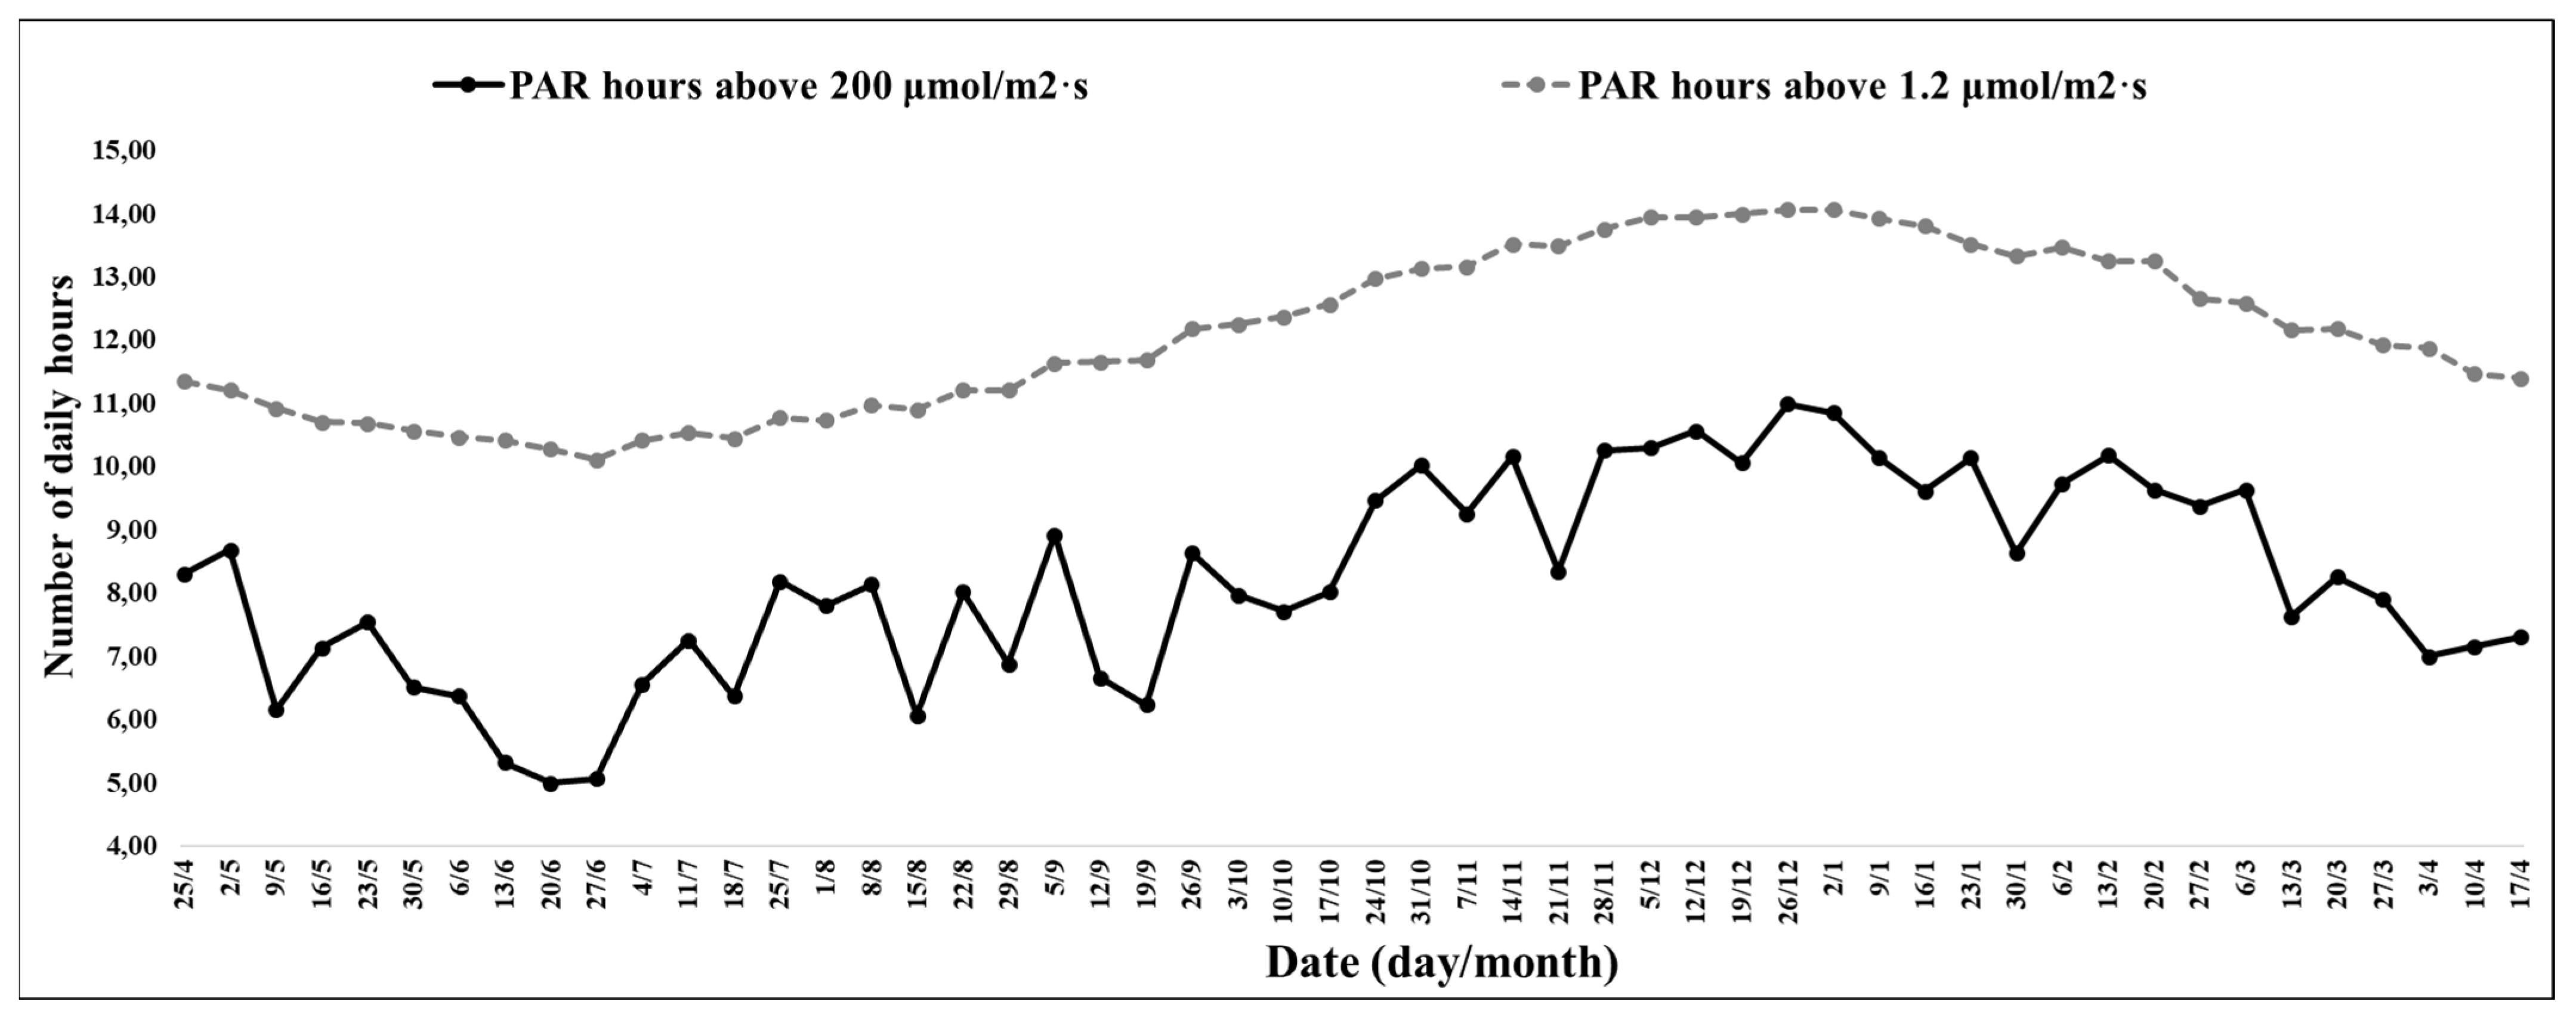
34]. The possible cause was the reduced photosynthetic capacity caused by the low photoperiod of 4 h and 52 min with PAR above 200 µmol/m
2 s (
Figure 2). The rooting stimulus and climatic conditions determined the low productivity, with no significant variations in productivity among the treatments (
Figure 8).
There were no significant variations in plant diameter among the treatments (
Table 2). The non-significant effect of plant diameter was influenced by the reduced nitrogen concentration in the nutrient solution and by the 15 cm plant spacing used in the experiment. According to the study, an increase in the leaf area, changes in the photosynthetic rate, and an increase in the number of canopies and flower clusters per plant only occurred with the plant spacing greater than 20 cm [
32,
33,
34], and it should be noted that when the apical meristems are committed to form inflorescence meristems, the apical dominance is released, and the upper axillary buds of the main canopy develop into branch crowns [
35]. However, the experiment showed the direct relationship between the number of buds and the numerical values of the plant diameter, demonstrating that the treatments that achieved the highest plant vigor also obtained the highest number of buds (
Table 2).
The experimental period between the 21st and 38th weeks occurred when the highest development of axillary buds per plant was observed (
Figure 11), corresponding to the time of the highest temperatures (
Figure 8), the highest solar radiation indices (
Figure 1), and the number of hours with PAR above 200 µmol/m
2 s (
Figure 1), demonstrating the need for the combination of high temperature and high PAR climatic factors for the development of axillary buds. Similar situations were also observed in studies by Campbell et al. (1986) [
36], in which for the plants present under high temperatures, regardless of CO
2 concentration, and even the plants under a low PAR index (200 µmol/m
2 s), low carboxylation occurred since this study considered the saturation level of PAR between 600 and 800 µmol/m
2 s. With values observed by some researchers under 500 µmol/m
2 s of PAR, a slow increase in the photosynthetic rate occurred, and with the increase in the PPFD from 200 to 450 µmol/m
2 s, the number of stolons and the development of the fresh and dry mass of the aerial part increased from 38 to 80% and the fresh and dry mass of the root from 19 to 48% [
37,
38,
39].
In the experiment, there was an increase in the number of stolons in treatments E4 and E5, as they were the only two treatments in which the plants underwent a pre-planting period of refrigeration and cold storage treatment, which is corroborated by the study of Guevara-Matus et al. (2023) [
40], in which there was an increase in the number of stolons of plants of the cultivar ‘Albion’ when exposed to vernalization periods below 6 °C.


 ,
, 


