Article

Grassland Carbon Change in Northern China under Historical and Future Land Use and Land Cover Change

1
Jiangsu Key Laboratory of Crop Genetics and Physiology/Jiangsu Key Laboratory of Crop Cultivation and Physiology, Agricultural College, Yangzhou University, Yangzhou 225009, China
2
College of Environment Science and Engineering, Yangzhou University, Yangzhou 225127, China
3
National Field Scientific Observation and Research Station of Hulunbuir Grassland Ecosystem in Inner Mongolia, Institute of Agricultural Resources and Regional Planning, Chinese Academy of Agricultural Sciences, Beijing 100081, China
*
Author to whom correspondence should be addressed.
Agronomy 2023, 13(8), 2180; https://doi.org/10.3390/agronomy13082180
Submission received: 22 June 2023 / Revised: 13 August 2023 / Accepted: 18 August 2023 / Published: 20 August 2023
(This article belongs to the Section Agroecology Innovation: Achieving System Resilience)

Abstract

:
Land use and land cover (LULC) change has greatly altered ecosystem carbon storage and exerted an enormous impact on terrestrial carbon cycling. Characterizing its impact on ecosystem carbon storage is critical to balance regional carbon budgets and make land use decisions. However, due to the availability of LULC data and the strong variability in LULC change, uncertainty remains high in quantifying the effect of LULC change on the historical and future carbon stock. Based on four historical LULC maps and one future LULC projection, this study combined the Land Use and Carbon Scenario Simulator (LUCAS) with a process-based CENTURY model to evaluate the historical and future LULC change and its impact on grassland carbon storage from 1991 to 2050 in northern China. Results showed that grassland experienced a drastic decrease of 16.10 × 10³ km2 before 2005, while agriculture and barren land increased by 16.91 × 10³ km2 and 3.73 × 10³ km2, respectively. After that, grassland was projected to increase, agriculture kept steady, and barren land decreased. LULC change has resulted in enormous total ecosystem carbon loss, mainly in agro-pasture areas; the maximum 8.54% of carbon loss happened in 2000, which was primarily attributed to agriculture to grassland, forest to grassland, grassland to agriculture, and grassland to barren. Before 2000, the grassland net biome productivity was projected to be −15.54 Tg C/yr and −2.69 Tg C/yr with and without LULC change. After 2001, the LULC change showed a positive impact on the grassland carbon balance, and the region was projected to be a carbon sink. Ecological projects have made a significant contribution to grassland carbon storage. The paper provides a framework to account for the effects of LULC change on ecosystem carbon and highlights the importance of improving grassland management in balancing the grassland carbon budget, which is helpful to understand the regional carbon budget and better inform local land use strategies.

1. Introduction

An accurate account of the terrestrial carbon budget is important to understand global climate change and make regional carbon management policies [1]. However, the global and regional carbon balance can be affected by multiple environmental factors (e.g., climate change, land use and land cover (LULC) change, and natural disturbance), and the mechanism of its temporal and spatial variation is complicated and remains far from certain [2,3,4]. Among the affecting factors, LULC change can alter terrestrial landscapes and, subsequently, ecosystem structure and function; it has become one of the most direct anthropogenic driving factors of terrestrial carbon cycling [5,6,7]. Globally, the carbon emissions from LULC change in 2022 were 1.1 ± 0.7 Gt C/yr, which account for approximately 31% of the total anthropogenic carbon emitted since the industrial revolution [8]. They have become the second-largest carbon emission source after fossil fuels. However, due to the varied magnitude, spatial, and temporal patterns between countries and different climatic regions, LULC change is still the largest source of uncertainty in the estimation of the global carbon budget [1,9,10]. Thus, the accurate estimation of LULC-induced carbon budgets is vital for balancing regional carbon budgets and better understanding the impact of human activities on the ecological environment.
In recent decades, increased attention has been given to evaluate the effects of LULC change on terrestrial ecosystem carbon storage. Methods include statistical models (e.g., field investigation and bookkeeping model) [10,11], remote sensing inversion [12,13], and process-based model simulation [14,15]. These studies have provided valuable data for estimating historical LULC change-induced emissions for different regions. However, due to the variation in LULC data and estimation methods (e.g., structure and parameterization), uncertainty remains high among various studies [16,17]. Moreover, previous studies regarding model-based quantification of carbon dynamics focused mostly on historical assessments at the regional and global scales [11,18], and relatively few studies have attempted to assess the potential impacts of future LULC change on terrestrial carbon uptake [12,19].
Grasslands are one of the most widespread vegetation types worldwide; they occupy approximately 30 million km2 and cover almost 1/5 of the earth’s land surface. They store a large amount of carbon and play a significant role in the global carbon cycle [20]. In China, grasslands are the biggest terrestrial ecosystem, accounting for approximately 40% of the national land area [21]. They make a big contribution to national carbon storage and have significant effects on regional climate and the global carbon cycle [4,20]. China’s grasslands have experienced a large-scale farmland reclaim since the 17th century [22]. More than 7 million hectares of natural grassland in northern China were tilled and utilized [23], and the most dramatic grassland cover change occurred in the last half of the 20th century due to changing land use policy, increasing population, and grazing pressure [21,24]. Since 2000, Chinese ecological restoration programs (e.g., Grain to Green Program, Returning Grazing Land to Grassland Project) have been in place to restore the degraded ecosystems and relieve human pressure on land through decreasing deforestation, converting cropland to grassland and forest, and reducing the impacts of overgrazing [25,26]. While a wide range of approaches have been used to estimate the carbon sequestration capacity in China’s grassland over recent decades [4,13,20,27], there are few studies on a comprehensive assessment of the carbon budget from historical and future grassland cover change in China [2,11].
Overall, the scarcity of long-term grassland transition data and estimation methods has resulted in the high uncertainty of previous studies, which rarely capture the effects of grassland cover change on ecosystem carbon stock in China. In this study, a spatially continuous region that covers the temperate grassland in northern China was selected as the study area, and a coupled Land Use and Carbon Scenario Simulator (LUCAS) and process-based CENTURY model were used to simulate the carbon change from LULC change during the period of 1991–2050. Our objectives are to (1) quantify the history of grassland carbon change from LULC change in different eco-regions, (2) simulate the future grassland carbon change with and without LULC change by setting different scenarios, and (3) quantify the effect of different LULC change types on carbon emissions in northern China.

2. Materials and Methods
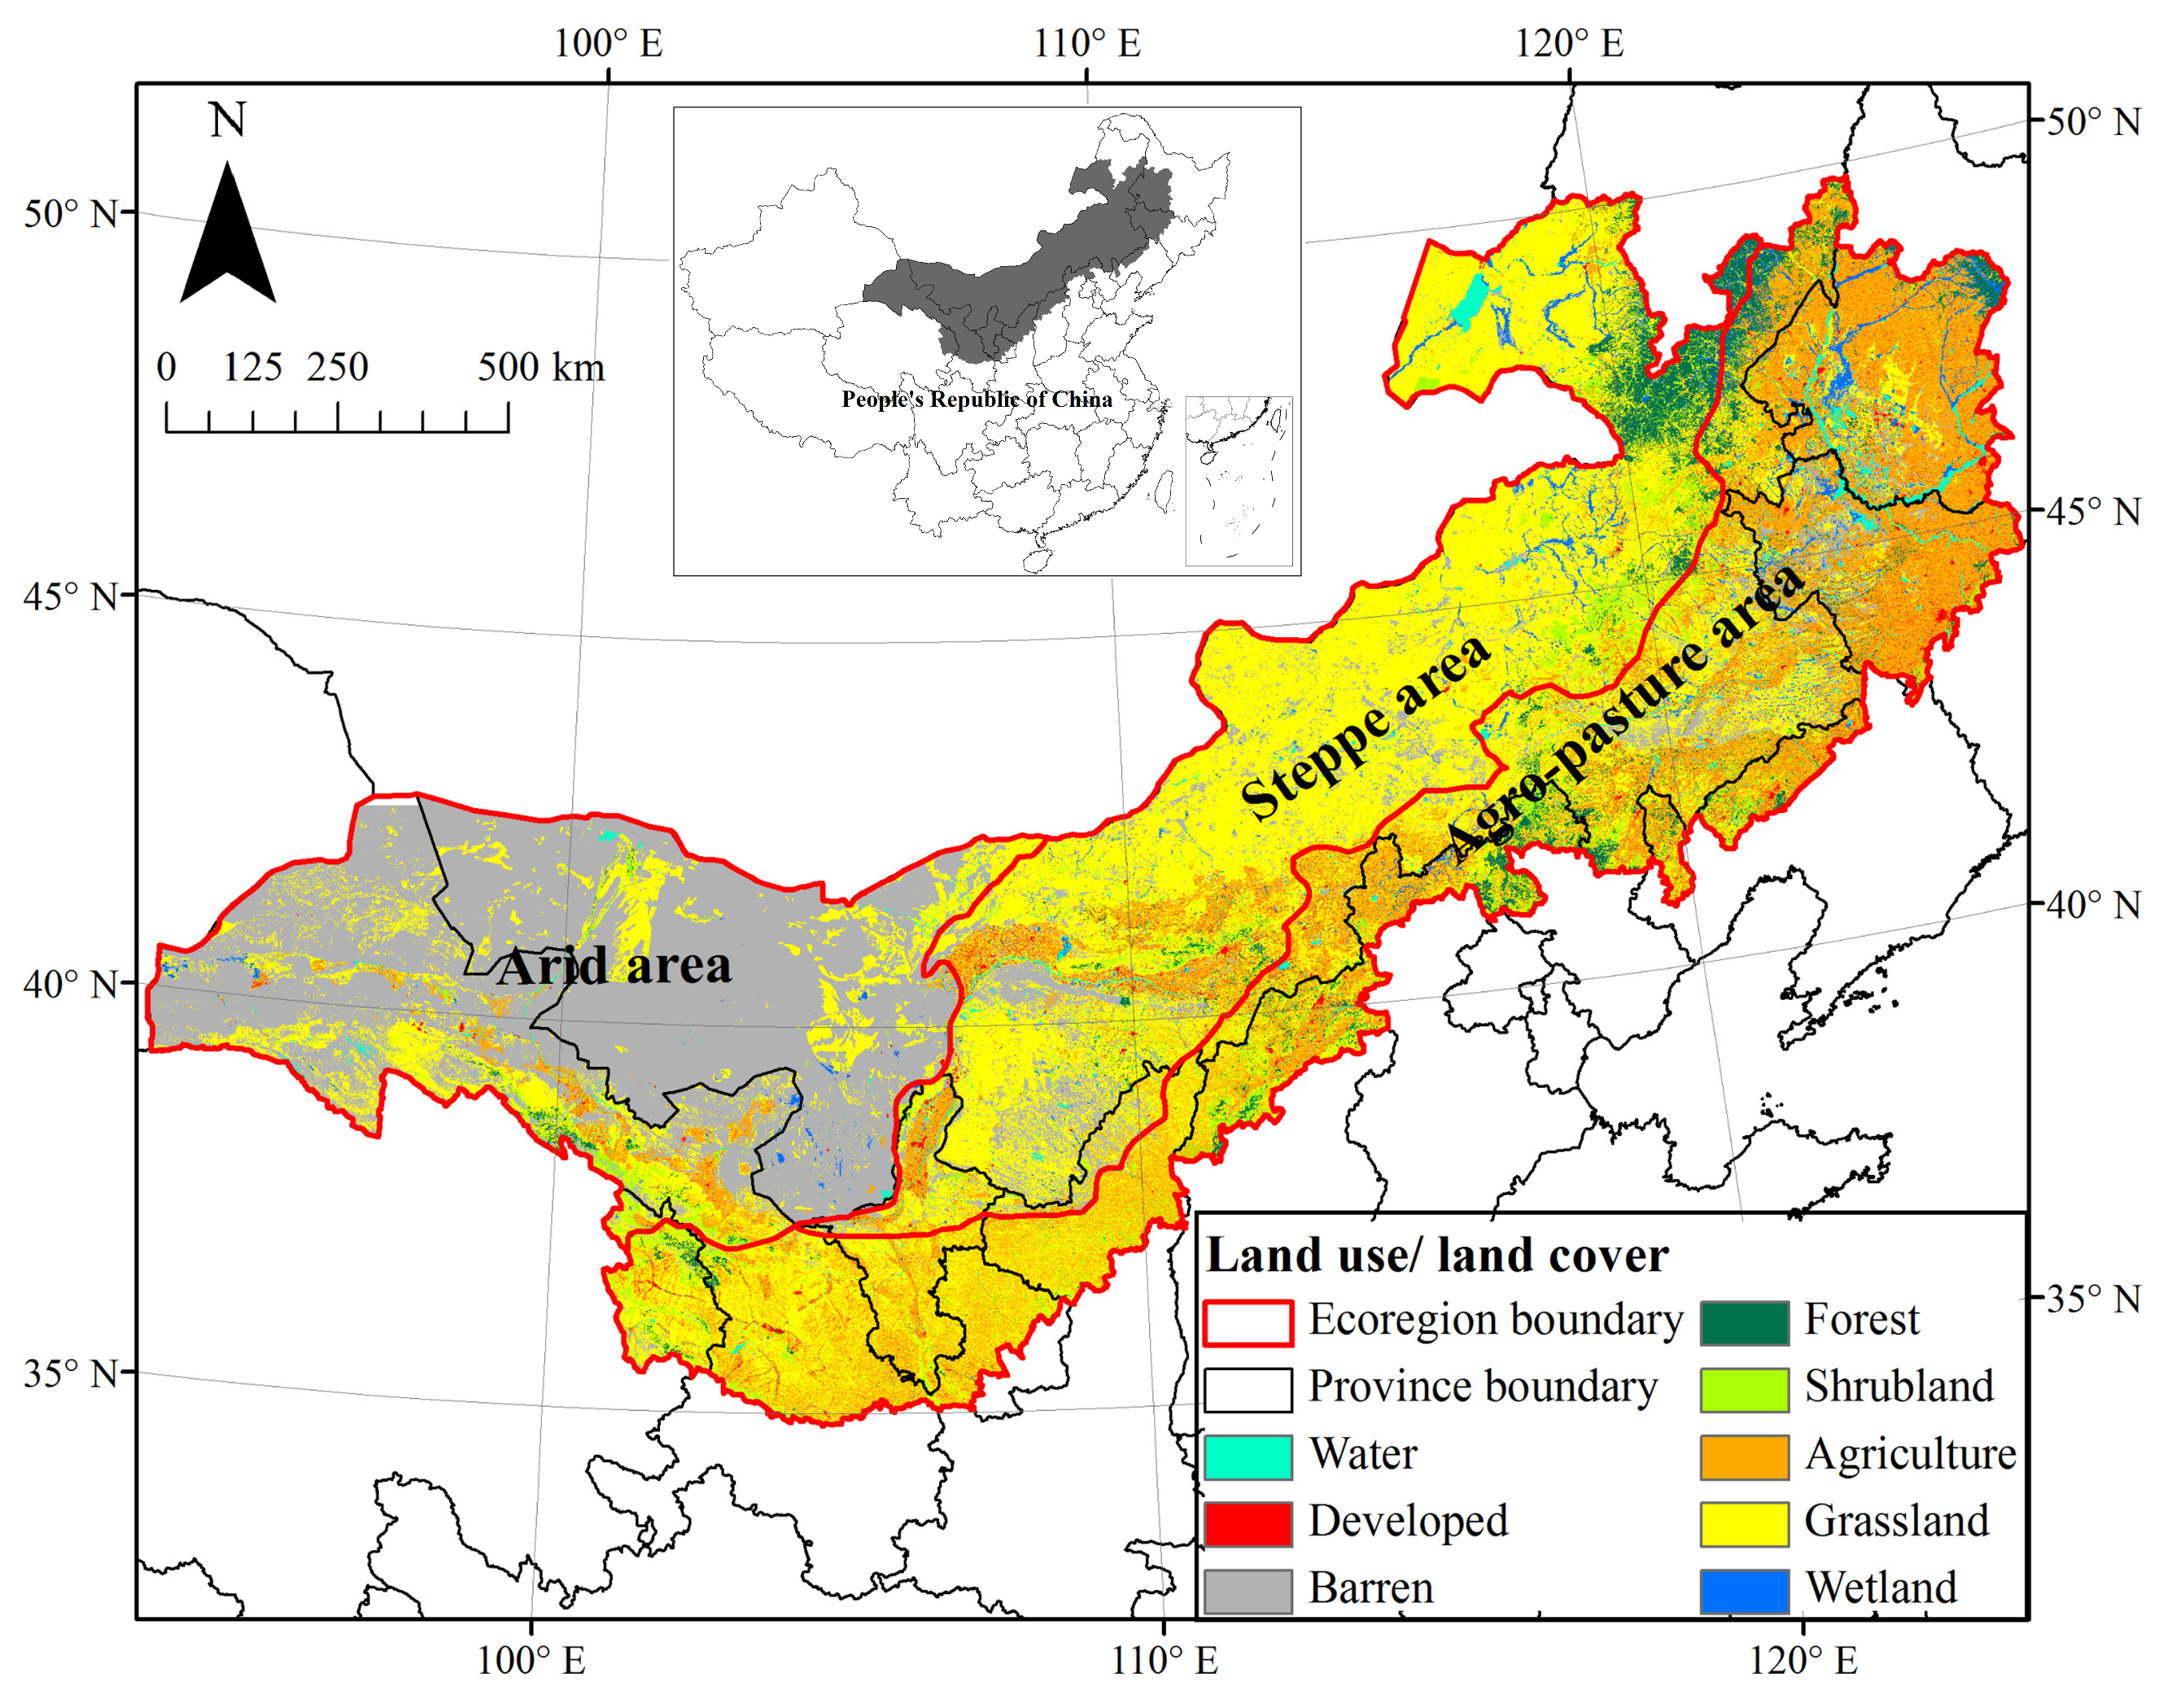
2.1. Study Area

The study was conducted in the grassland-dominated region of northern China, with an area of 1.73 billion km (Figure 1). The region is distributed across ten provinces and is located between latitudes 35° to 50° N and longitudes 93.5° to 128° E. The mean elevation is 1164 m, ranging from −92 m to 5500 m. The region has a semi-arid to arid continental climate that is characterized by a decrease in precipitation (55 mm to 700 mm) as it moves from east to west and a decrease in temperature (−9 °C to 14 °C) as it moves from south to north. Grassland (40%), barren (27%), and cropland (20%) are the main LULC types, while other LULC types are confined to a few small regions. According to the climate conditions and land use management patterns, the region is divided into three eco-regions: the steppe area in the northeast, the agro-pasture area in the southeast, and the arid area in the west. The ecosystem in the steppe area is mainly grassland (67%) with small areas of forest (5%) and cropland (8%). The LULC change in this region is mainly characterized by overgrazing-induced degradation and the intensification of anthropogenic land use practices, such as coal mining and farmland reclaim [24]. The agro-pasture area is a transition zone between the arid and semi-arid pastoral grasslands in the northwest and the traditional humid intensive cultivation region in the southeast [28]. The two dominant LULC types are cropland (44%) and grassland (33%). The region experienced severe LULC change between grassland and cropland because of the extensive cultivation of rotation tillage in historical periods and the grassland protection policies in recent years. The arid area is dominated by barren landscapes (76%) with a more severe climate condition of annual rainfall of <100 mm. Small areas of grassland (18%) and cropland (3%) are also distributed in the region.

2.2. Model Description

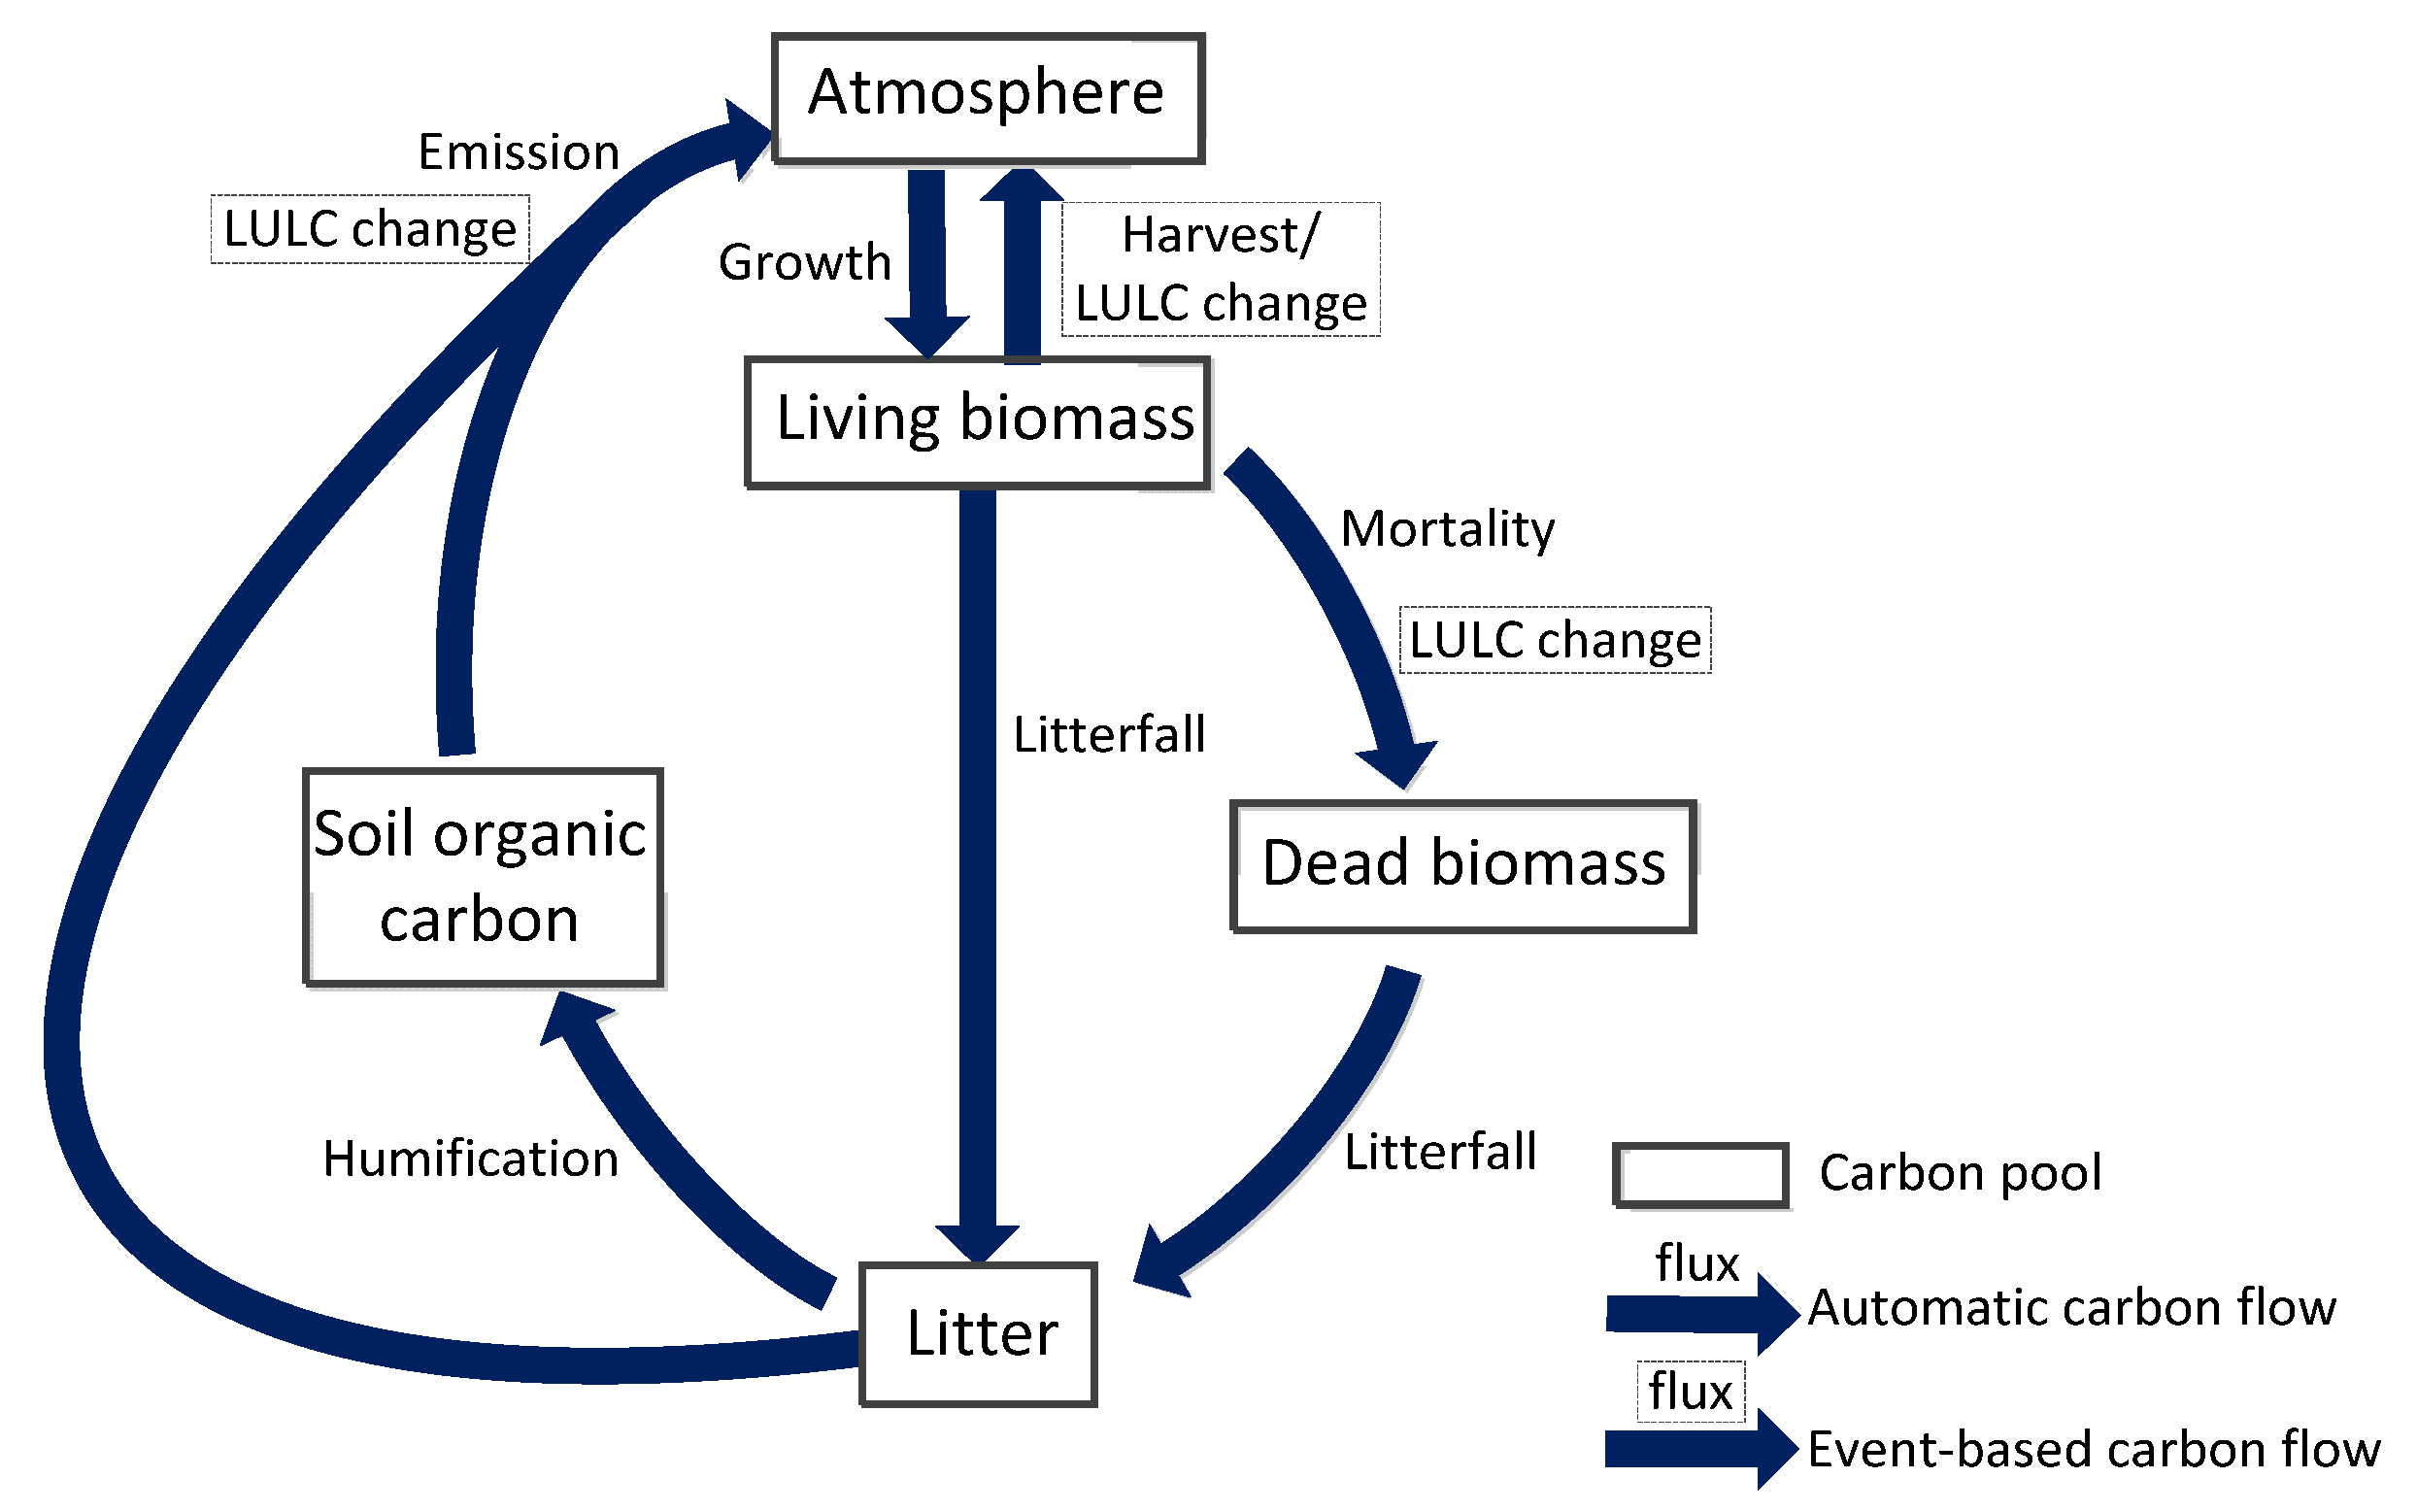
2.2.1. Land Use and Carbon Scenario Simulator (LUCAS)

LUCAS is an integrated modeling platform to evaluate the effects of land-use and management actions on regional carbon dynamics from a local to a national scale [29,30,31]. It structurally integrates two models: the state-and-transition simulation model (STSM) and the stock and flow model (SFM). STSM is used to project land use, land cover, and ecosystem disturbance based on historical and future LULC change scenarios. Technically, STSM is a stochastic, non-stationary Markov Chain model where the landscape is first divided into a set of simulation cells, with each cell assigned a discrete LULC class. Transitions targets were developed using a time series of historical or future data describing the rate of change between land-use and land-cover classes and were used within the model to move cells between LULC classes over time [32]. SFM is developed to track five carbon stocks as continuous state variables (Figure 2), including the atmosphere, living biomass, dead biomass, litter, and soil. It can track the amount of material in any number of carbon stocks over time for each simulation cell in the STSM [29]. Within each timestep of the model, carbon can flow from one stock to another within a simulation cell at specified rates. Flows can occur for any simulation cell and timestep in the simulation and are either triggered in response to an STSM transition (e.g., harvest) or occur automatically (e.g., plant growth). Based on the carbon flow between carbon pools, our designed SFM in the LUCAS is shown in Figure 2.

2.2.2. CENTURY Model

CENTURY is a process-based model that is developed to simulate long-term carbon (C), nutrient (N), phosphorus (P), and sulfur (S) dynamics for different plant-soil ecosystems, including grasslands, forests, crops, and savannas [33,34]. It consists of a plant productivity sub-model, a soil organic matter (SOM) sub-model, and a water budget sub-model. CENTURY has been tested in different vegetation ecosystems and in different vegetation types around the world using extensive long-term field observations [35,36,37,38]. The model correctly predicted the effect of grazing, burring, fertilization, irrigation, and land use change on plant production and seasonal live biomass patterns. In this study, a spatial CENTURY 4.5 model integrated with geographic information system technology was used to model the grassland and shrubland carbon dynamics on a regional scale, which was also used to generate carbon flux proportions by LULC class between a set of simplified carbon pools. The basic modeling unit was a pixel with 10 km resolution, and each pixel held the unique plant parameters and environmental factor data according to different locations and different grassland types. The model was also calibrated and validated using field measurements of soil organic carbon density (SOCD) and above-ground biomass (AGB), and results showed good agreement between the measured and simulated SOCD and AGB [37].

2.2.3. Model Integration

LUCAS was developed to project changes in ecosystem carbon dynamics resulting from LULC change processes. The CENTURY model can simulate long-term carbon dynamics for different plant-soil ecosystems. To integrate the two models, the CENTURY model was used to calibrate and derive input parameters for the LUCAS-SFM (Figure 3). Three types of parameters need to be provided by the CENTURY model: the initial carbon density maps of four carbon pools (aboveground biomass, belowground biomass, litter, and SOC), the carbon flux proportion between pools, and the annual net primary production (NPP) at the eco-region scale for each vegetation type. A calibration scenario was first run in CENTURY for 500 years to an equilibrium state using the average climate data from 1951–2010 and a fixed CO2 of 332 ppm, with the aim of generating the carbon pool estimates and flux rates and calibrating a suit of carbon flux proportions for each vegetation type that will be used in the LUCAS model. Furthermore, an additional CENTURY climate scenario was simulated using the historical climate data of 1951–2010 to derive the initial carbon pool density and annual growth rates (NPP) for the LUCAS model. The conceptual diagram of the integration of the two models is shown in Figure 3.

2.3. Input Data

2.3.1. CENTURY Simulation Inputs

To spatially run the CENTURY model in the grassland region of northern China, a set of datasets was prepared. To develop the gridded historical climate time-series data sets, the plot-based monthly precipitation and maximum and minimum temperatures were obtained from 670 meteorological stations in China from 1951 to 2010. Furthermore, an ordinary kriging method for maximum and minimum temperature and an inverse distance weight interpolation method were adopted to generate continuous gridded climate data. The gridded future climate data for the period of 2011 to 2050 was predicted using the PRECIS (Providing Regional Climates for Impacts Studies) climate modeling system with a horizontal spatial resolution of 0.44° × 0.44° in rotation coordinates (approximately 50 km in the mid-latitude). The monthly precipitation, maximum and minimum air temperature, and CO2 concentration for the years 2011 to 2150 predicted under the SRES B2 scenario were used in this study. The data were then downscaled to 10 km grid pixels to match the CENTURY processing grid.
The soil property maps (organic matter, pH and bulk density, soil texture (sand, silt, and clay proportions), and spatial reference information) were generated from the 1:1 million soil type map [39]. The database was developed by the Institute of Soil Science, Chinese Academy of Sciences, and was compiled based on the second national soil survey conducted in the 1970s–1980s. For our modeling, the soil surface properties of the upper 0–20 cm soil profile were used at a 10 km grid resolution.
The grassland type map was extracted from the grassland resource map of China at a scale of 1:1 million. The map was compiled by the Commission for Integrated Survey of Natural Resources, Chinese Academy of Sciences, and was interpreted from air photos, MSS images, topographical maps, and field investigations. The map was then unified and classified into 18 grassland types. For this study, the grassland type map was organized at a 10 km grid resolution and was then attributed to each CENTURY modeling grid cell.
Besides, the plant biophysical parameters, including lignin content, optimal temperature, C/N ratio, plant height of the dominant species, and stem depth for each grassland type, were also prepared. The parameters were extracted from literature, field measurements, and historical data statistics. A detailed description can be found in [37].

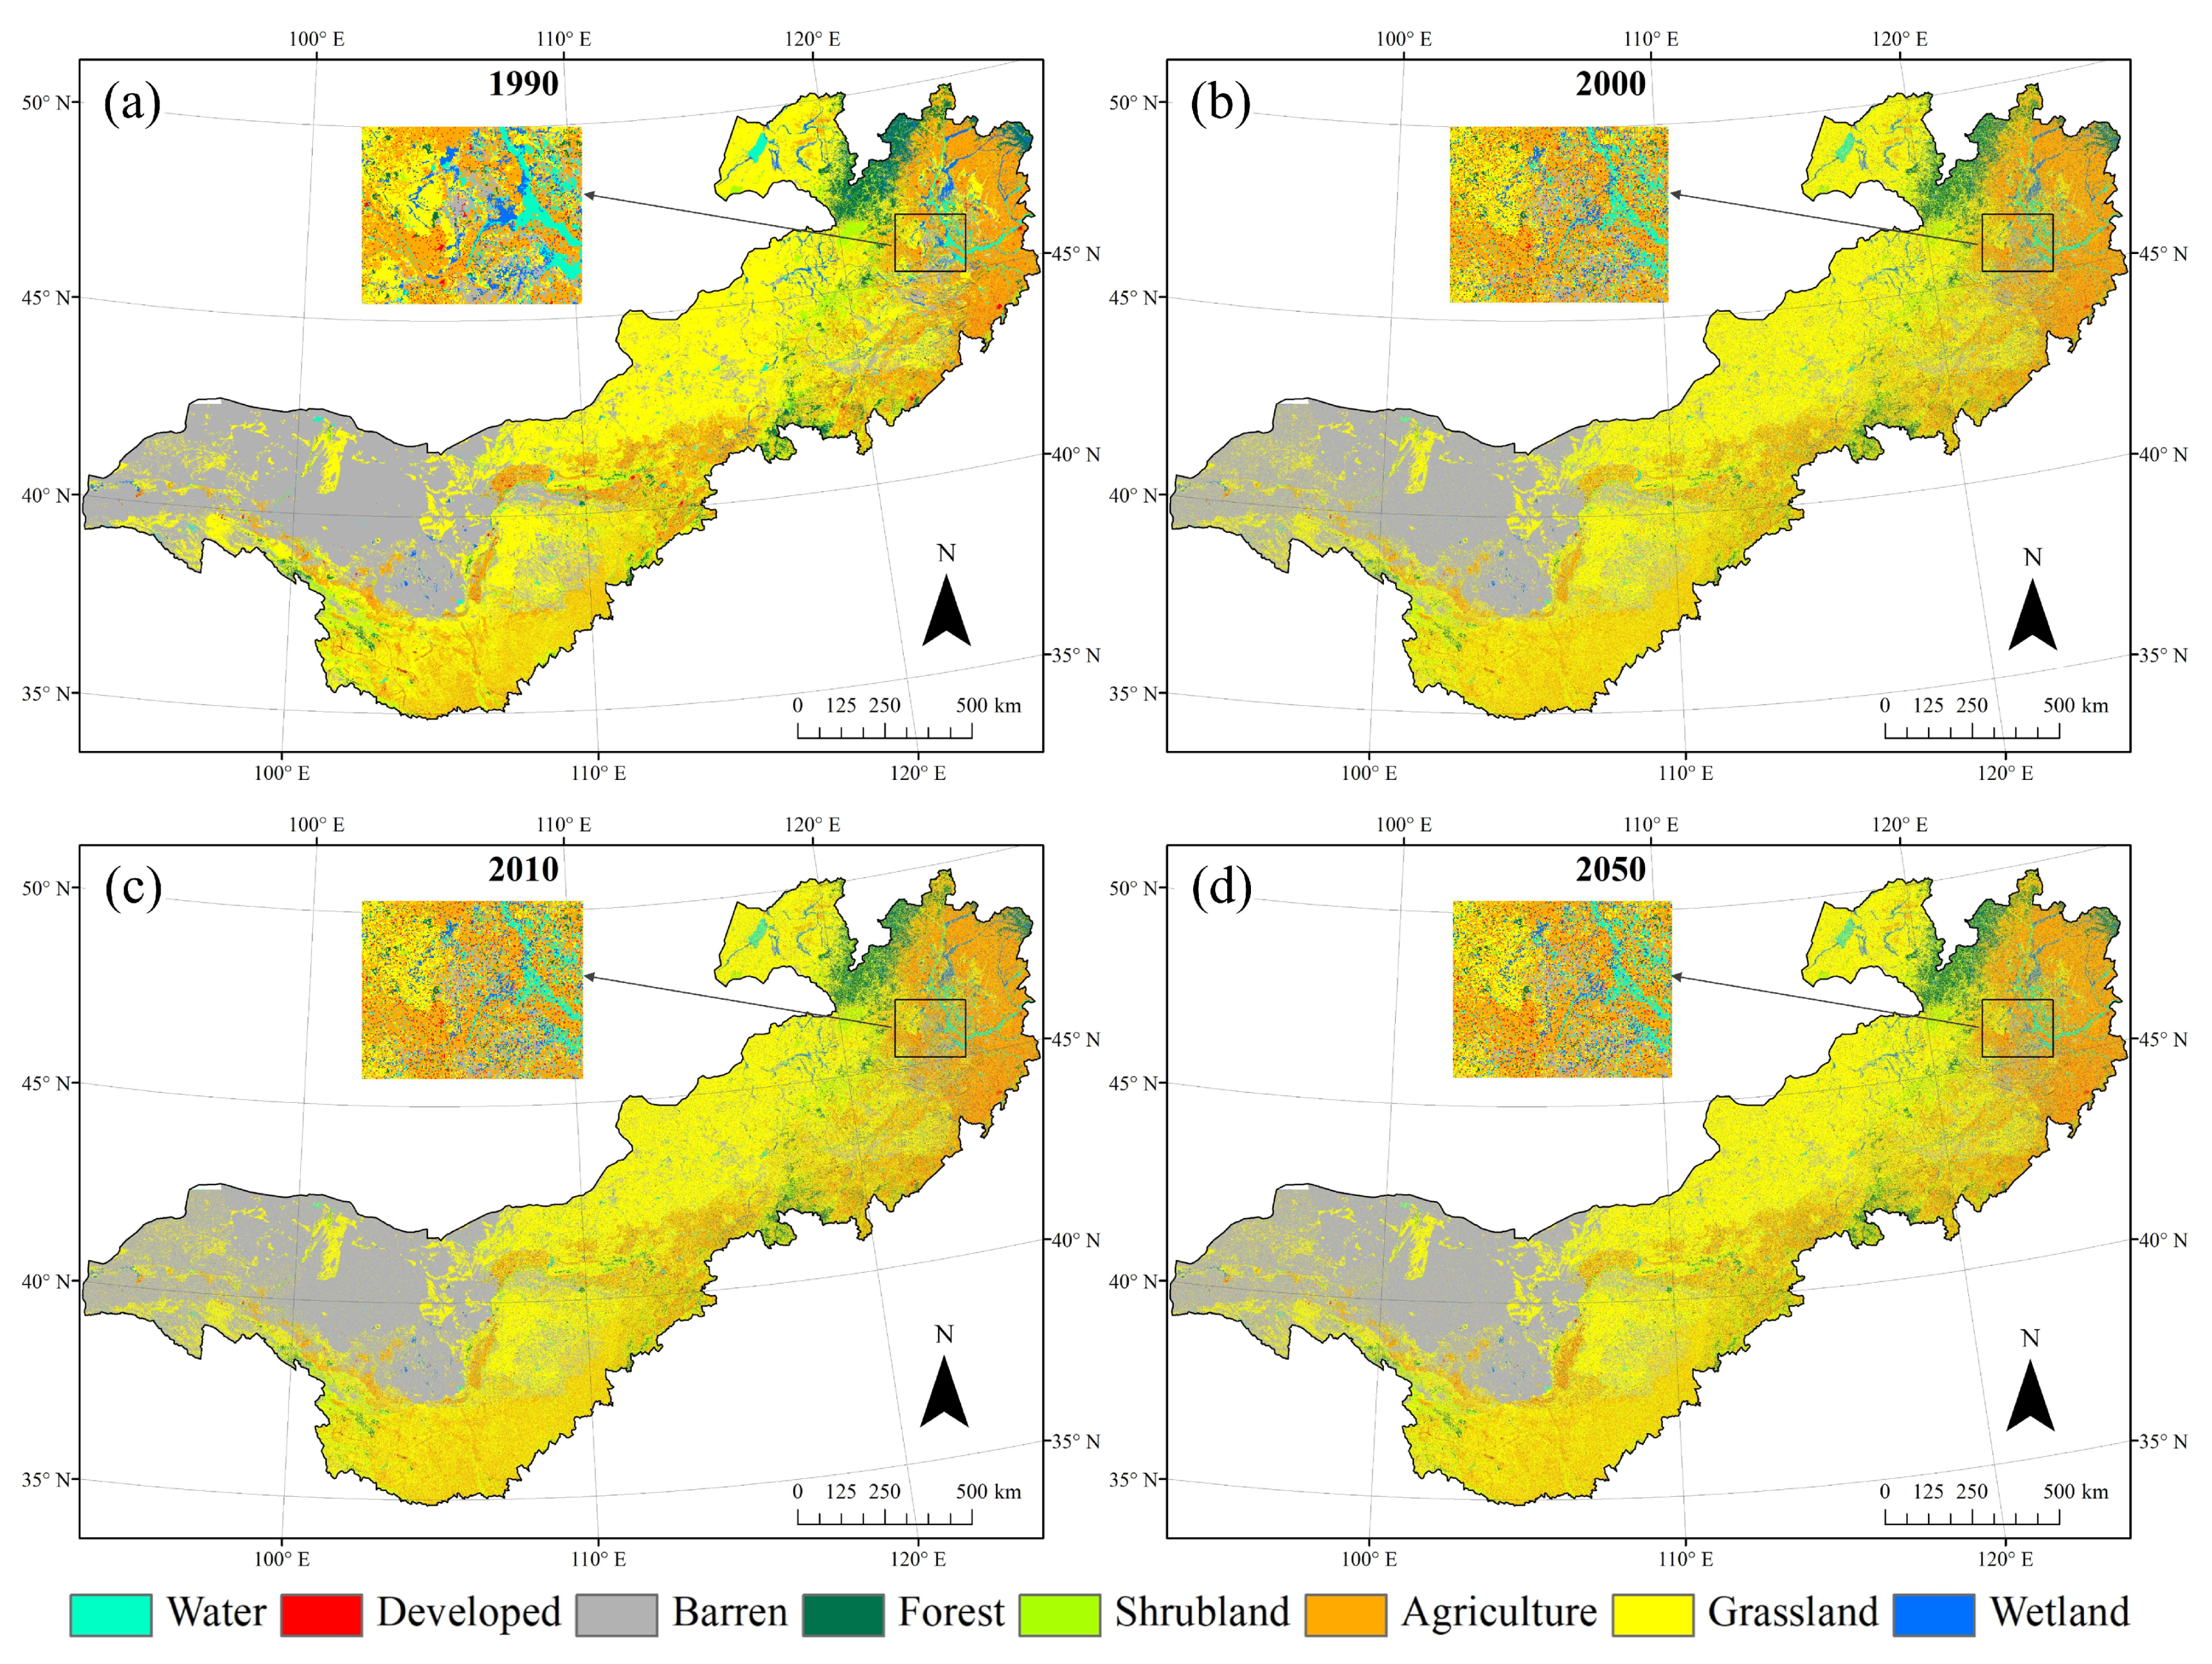
2.3.2. LULC Change Dataset

Four periods (1990, 2000, 2005, and 2010) of 1 km-resolution historical LULC data were provided by the Data Center for Resources and Environmental Sciences, Chinese Academy of Sciences (RESDC). The data were interpreted from Landsat TM/ETM imagery with six aggregated land-cover classes and 25 subclasses and were then validated using field investigations with a classification accuracy of above 90% [40,41]. In our study, we defined eight LULC classes by reaggregating the 25 subclasses: grassland, agriculture, forest, shrubland, developed, barren, wetland, and water.
Future LULC change data was downscaled from the Land Use Harmonization (LUH) dataset (http://luh.umd.edu/data.php) (accessed on 25 October 2021). The LUH project proposed a standard global grid-based land use states and transitions data set at 0.5° resolution for 2005–2100. Based on the coupled Shared Socioeconomic Pathways (SSPs) and Representative Concentration Pathways (RCPs) scenario framework, the dataset is well received within the global change research community for century-scale LULC-relevant studies. In this study, the global LULC projections from 2005 to 2050 for the RCP 4.5 scenario were used. The RCP 4.5 scenario is a stabilization scenario, which means the radiative forcing level stabilizes at 4.5 W/m2 before 2100 through the employment of a range of technologies and strategies for reducing greenhouse gas emissions [42]. Furthermore, the integrated cross-walked method, combined with land-use histories and expert knowledge-derived downscaling methods, was used to generate LULC transition proportion data for the whole region from 2011 to 2050. A total of 21 RCP land-use transitions were considered with a 0.5° × 0.5° cell; a detailed description can be found in [43].

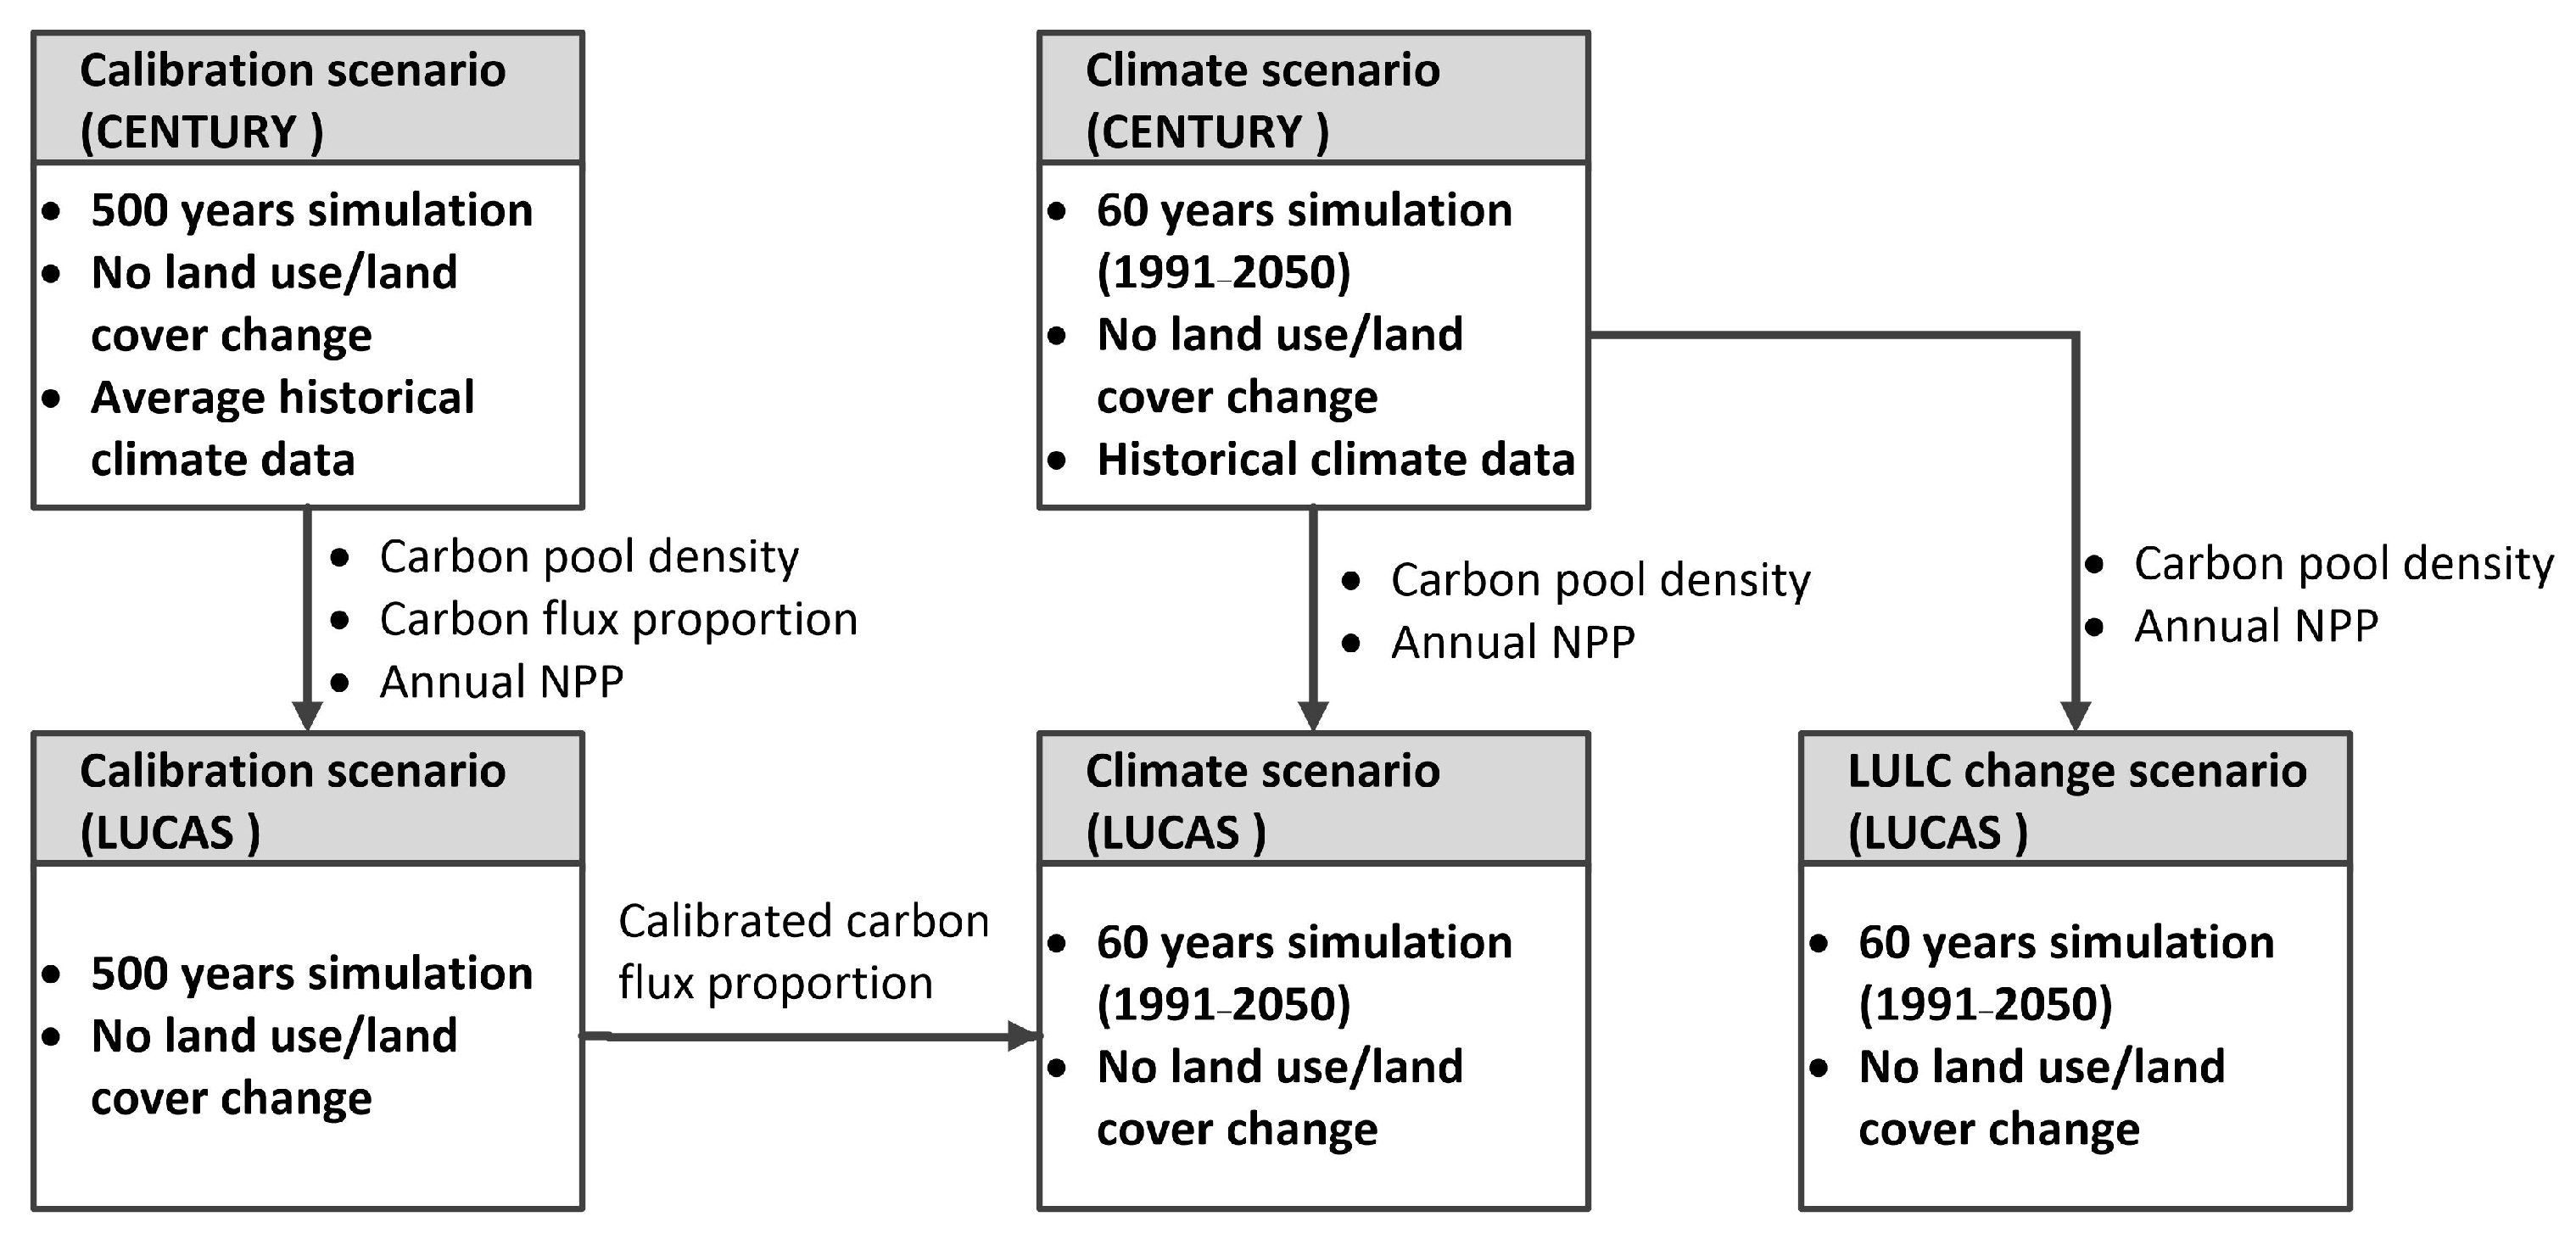
2.4. Simulation Scenarios

To better understand the LULC change effect on the carbon storage in the study region, three scenarios were conducted using the LUCAS model: the calibration scenario (LUCAS_CALIB), the climate scenario (LUCAS_CLIM), and the LULC change scenario (LUCAS_LULCC). LUCAS_CALIB was conducted to parameterize and calibrate the LUCAS SFM model and to examine the reliability of the LUCAS model in projecting carbon dynamics. The purpose of LUCAS_CLIM and LUCAS_LULCC was to illustrate how climate and LULC change impact ecosystem carbon storage and flux. The climate scenario was conducted with no LULC change, while the LULC change scenario does. For the LUCAS_CALIB, the LUCAS model was first run under no LULC change for 500 years using the three types of parameters provided by the CENTURY simulation. The carbon flow proportions of the SFM were then calibrated by comparing the LUCAS simulated carbon pool density and carbon flux with the CENTURY outputs. Our results showed that the LUCAS SFM can replicate the carbon stock and flow estimates produced by CENTURY properly (see Figure S1 in the Supplementary Material). Furthermore, the calibrated carbon flow proportion, CENTURY-simulated annual NPP, and initial carbon pool density in 1990 were used in the LUCAS_CLIM and LUCAS_LULCC to simulate carbon dynamics from 1990 to 2050, and the historical and projected future climate data were used.

2.5. Model Initialization

The starting land cover of each simulation cell was derived from the LULC map of 1990 of the RESDC. Climate data are not directly used within the LUCAS model. To simulate the impacts of historical and future changes in climate, LUCAS relies on the NPP generated from the CENTURY model to drive annual growth for grassland, shrubland, and cropland. Their initial carbon pool and carbon flux were based on the estimates of a 500-year CENTURY calibration simulation. The annual NPP of forests was derived from the MODIS NPP product (MOD17A3). The soil carbon density of barren and wetland and the carbon pool density of forest were extracted from the field investigation and literature, and the carbon flow proportion of forest was obtained from Sleeter’s publication [29]. For all other land cover types, transition-triggered flow rates were set to zero, and no carbon fluxes were simulated. Initial ecosystem carbon pools were based on a look-up table approach where each cell was assigned an initial carbon stock value (live biomass, dead biomass, litter, and soil) based on the combination of the strata of each cell (e.g., eco-region) and the state type of each cell (e.g., LULC class). All other stocks (e.g., aquatic, atmosphere, harvest products) and LULC classes (e.g., developed, barren, water) were initialized to zero.
Within the LUCAS_LULCC scenario, the LUCAS STSM needs a combination of transition probabilities and transition targets to drive the land-use change. The transition target explicitly defined LULC changes from one class to another; for this model, we defined five transition types and 42 transition pathways that covered all the transition possibilities (see Table S1 in the Supplementary Material). The five transition types are grassland gain, grassland loss, urbanization, land use change, and vegetation change. Transition probability defines the amount of area for each transition target. LUCAS simulates transitions between LULC state classes in annual timesteps; the transition probabilities were calculated from historical LULC data and downscaled future LULC projections.

3. Results

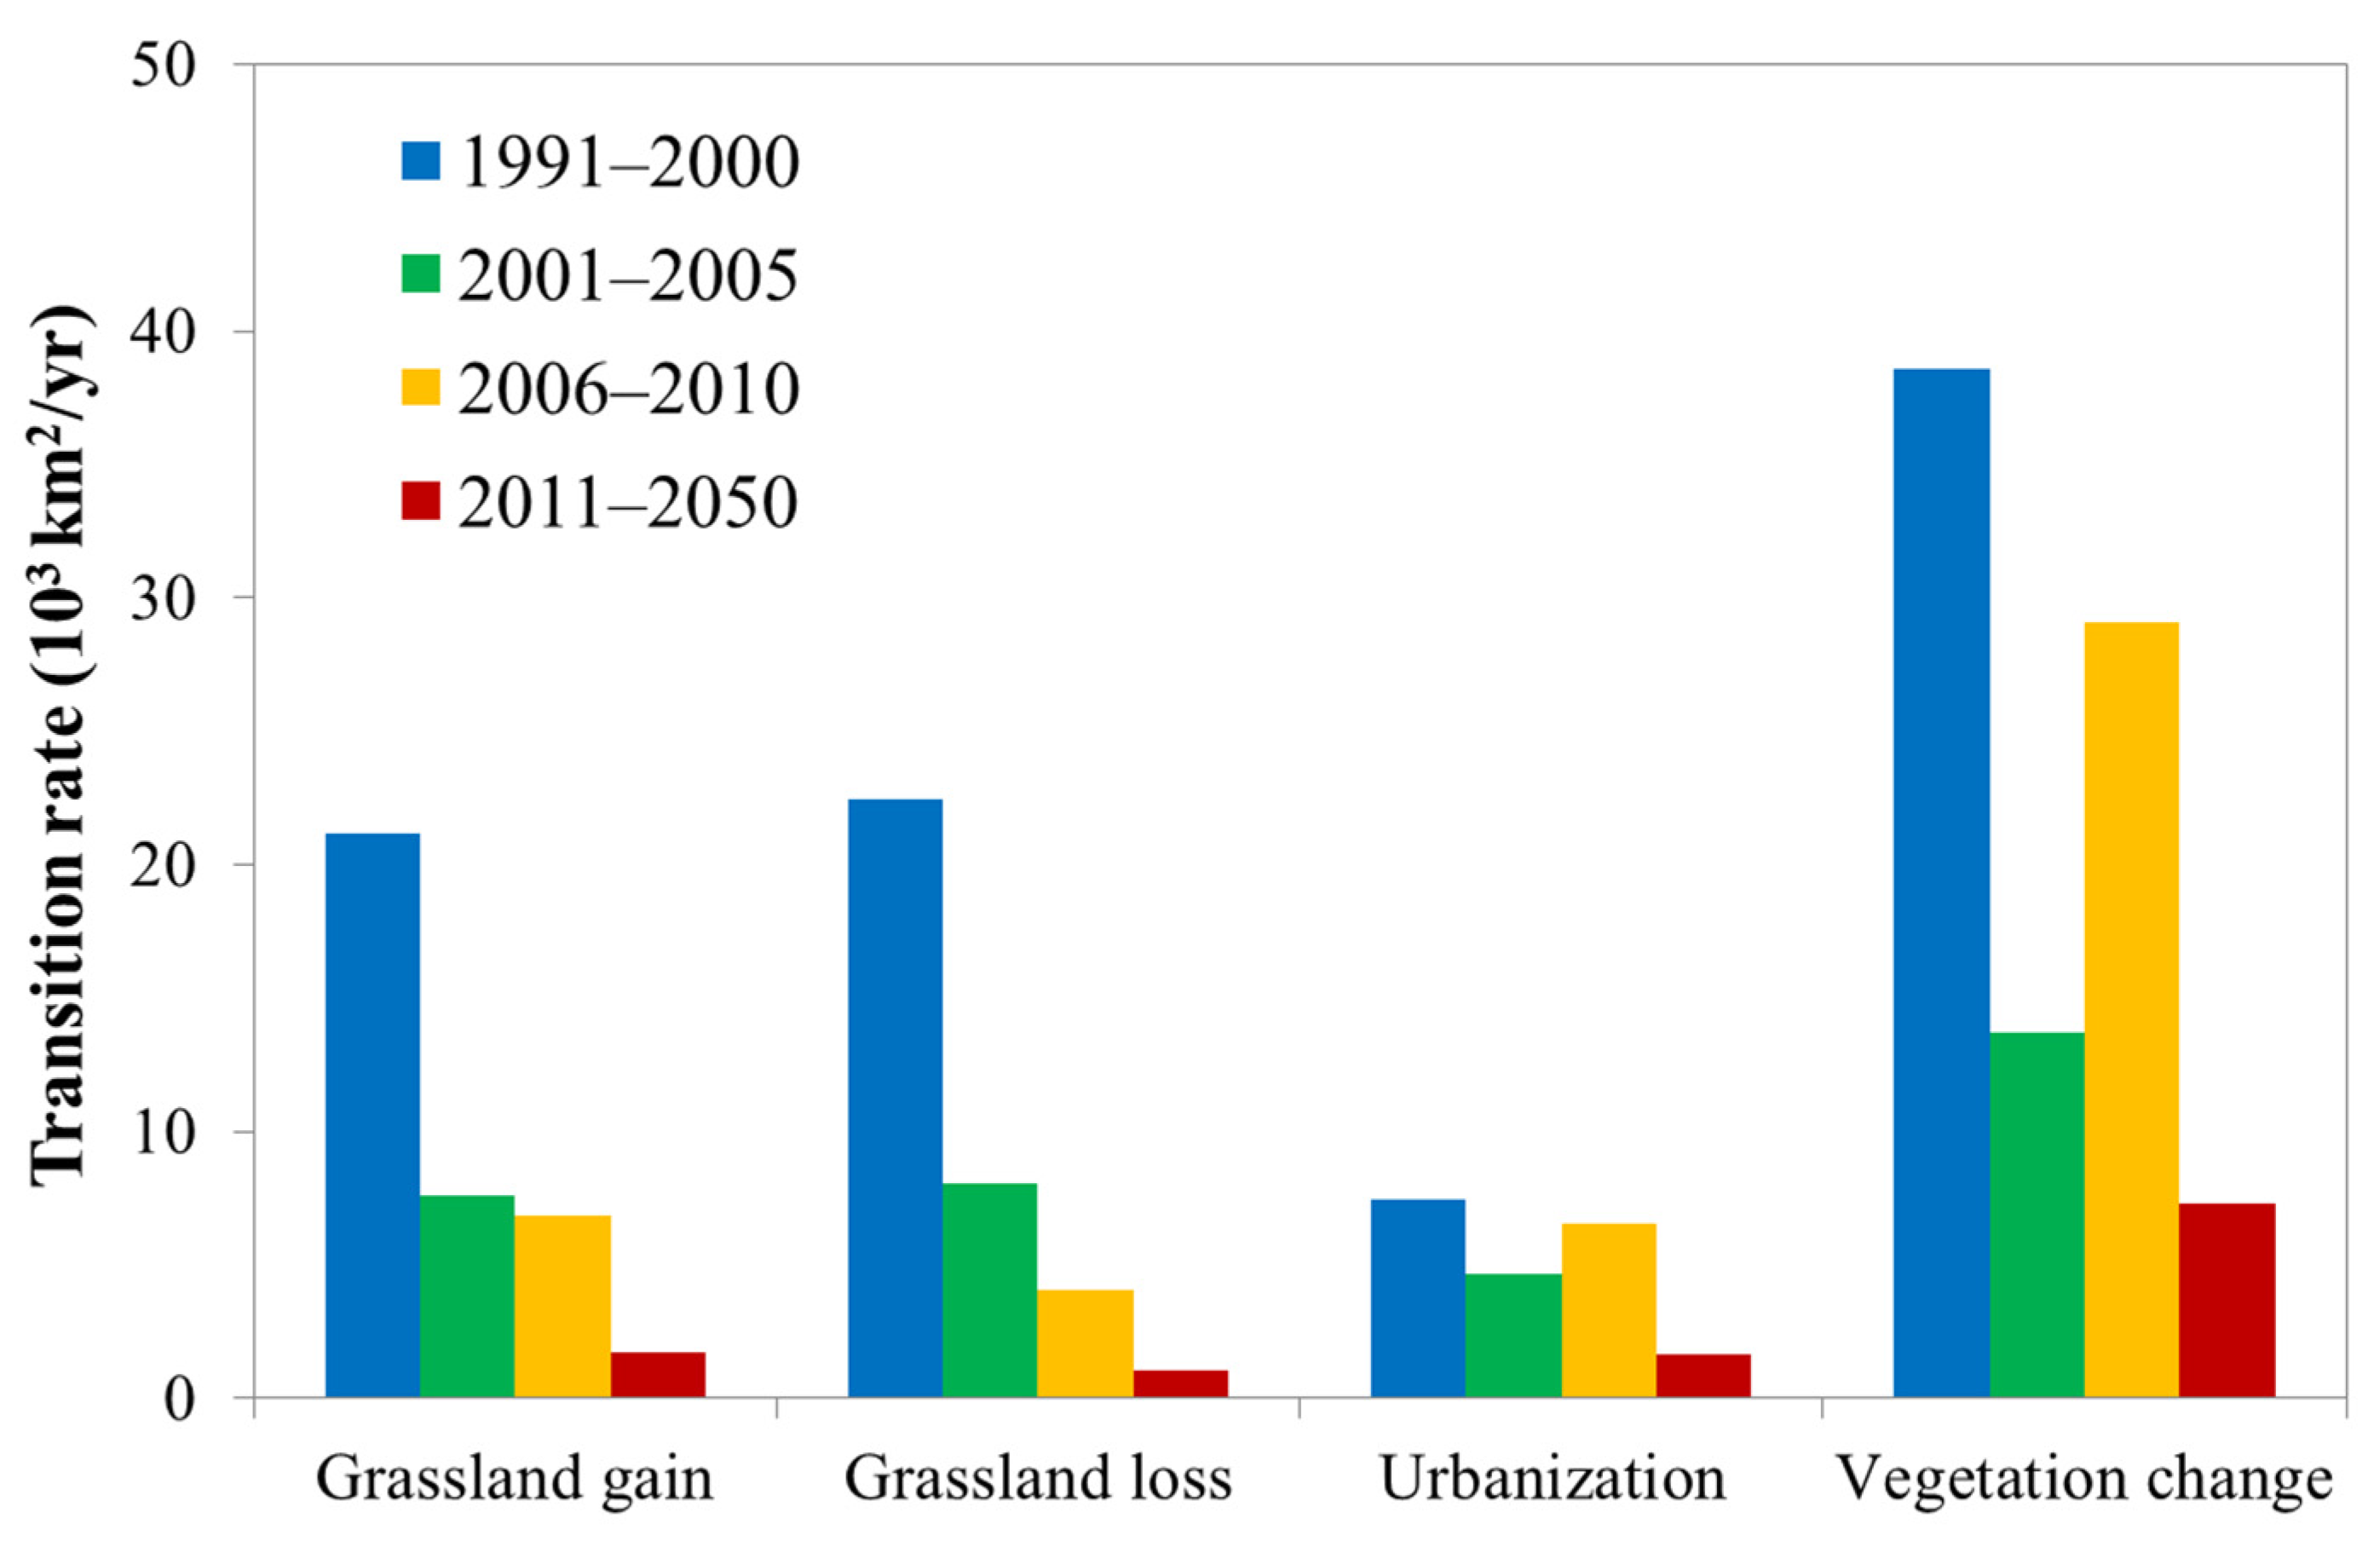
3.1. LULC Change during 1990–2050

Using the initial LULC map, transition types, and annual transition probabilities, the LULC change from 1991 to 2050 was projected by LUCAS STSM (Figure 4 and Table 1). The LULC projections were also verified by comparing the LUCAS STSM projected LULC maps with RESDC LULC data. The results showed a high correction between the two datasets, which indicated the LUCAS STSM can exactly project the annual LULC changes (see Figure S2 in Supplementary Material). Our projected LULC change showed that the area of grassland experienced a rapid decrease before the year 2005 from 706.84 × 10³ km2 to 690.74 × 10³ km2, which might be caused by farmland reclaim and overgrazing-induced degradation. After that, the grassland area steadily increased and reached 697.44 × 10³ km2 in the year 2050. The area of shrubland also experienced a rapid decrease before 2000 from 63.10 × 10³ km2 to 59.66 × 10³ km2, followed by a rapid increase between 2000 and 2005 to 61.40 × 10³ km2, after which the area steadily increased until 2050. For agriculture, the area increased sharply from 331.06 × 10³ km2 in 1990 to 348.86 × 10³ km2 in 2000; after that, the area kept steady and will be 348.40 × 10³ km2 in 2050. The barren and forest areas showed a similar trend, with an increasing area before 2005 and then a decrease till 2050. The area of developed land was projected to be steadily increasing, and wetland areas were continuously decreasing during the whole period.
Considering the LULC transition types (Figure 5), a much higher transition rate of LULC change during 1990–2000 (21.18 × 10³ km2/yr, 22.48 × 10³ km2/yr, 7.48 × 10³ km2/yr, and 38.6 × 10³ km2/yr for grassland gain, grassland loss, urbanization, and vegetation change, respectively) was observed than the period after 2000 (5.38 × 10³ km2/yr, 4.39 × 10³ km2/yr, 4.30 × 10³ km2/yr, and 16.70 × 10³ km2/yr for grassland gain, grassland loss, urbanization, and vegetation change, respectively), especially for grassland gain and grassland loss. After 2010, the transition rate of the four types decreased, and the period 2011–2050 was projected to have the smallest transition rate. For grassland change, the transition rate of grassland loss (22.48 × 10³ km2/yr and 8.08 × 10³ km2/yr for 1991–2000 and 2001–2005, respectively) was higher than that of grassland gain (21.18 × 10³ km2/yr and 7.62 × 10³ km2/yr for 1991–2000 and 2001–2005, respectively) before the year 2005, which resulted in a continuous decrease of grassland area during this period. After that, a higher transition rate of grassland gain (6.82 × 10³ km2/yr and 1.71 × 10³ km2/yr for 2006–2010 and 2011–2050, respectively) is observed than that of grassland loss (4.07 × 10³ km2/yr and 1.02 × 10³ km2/yr for 2006–2010 and 2011–2050, respectively).

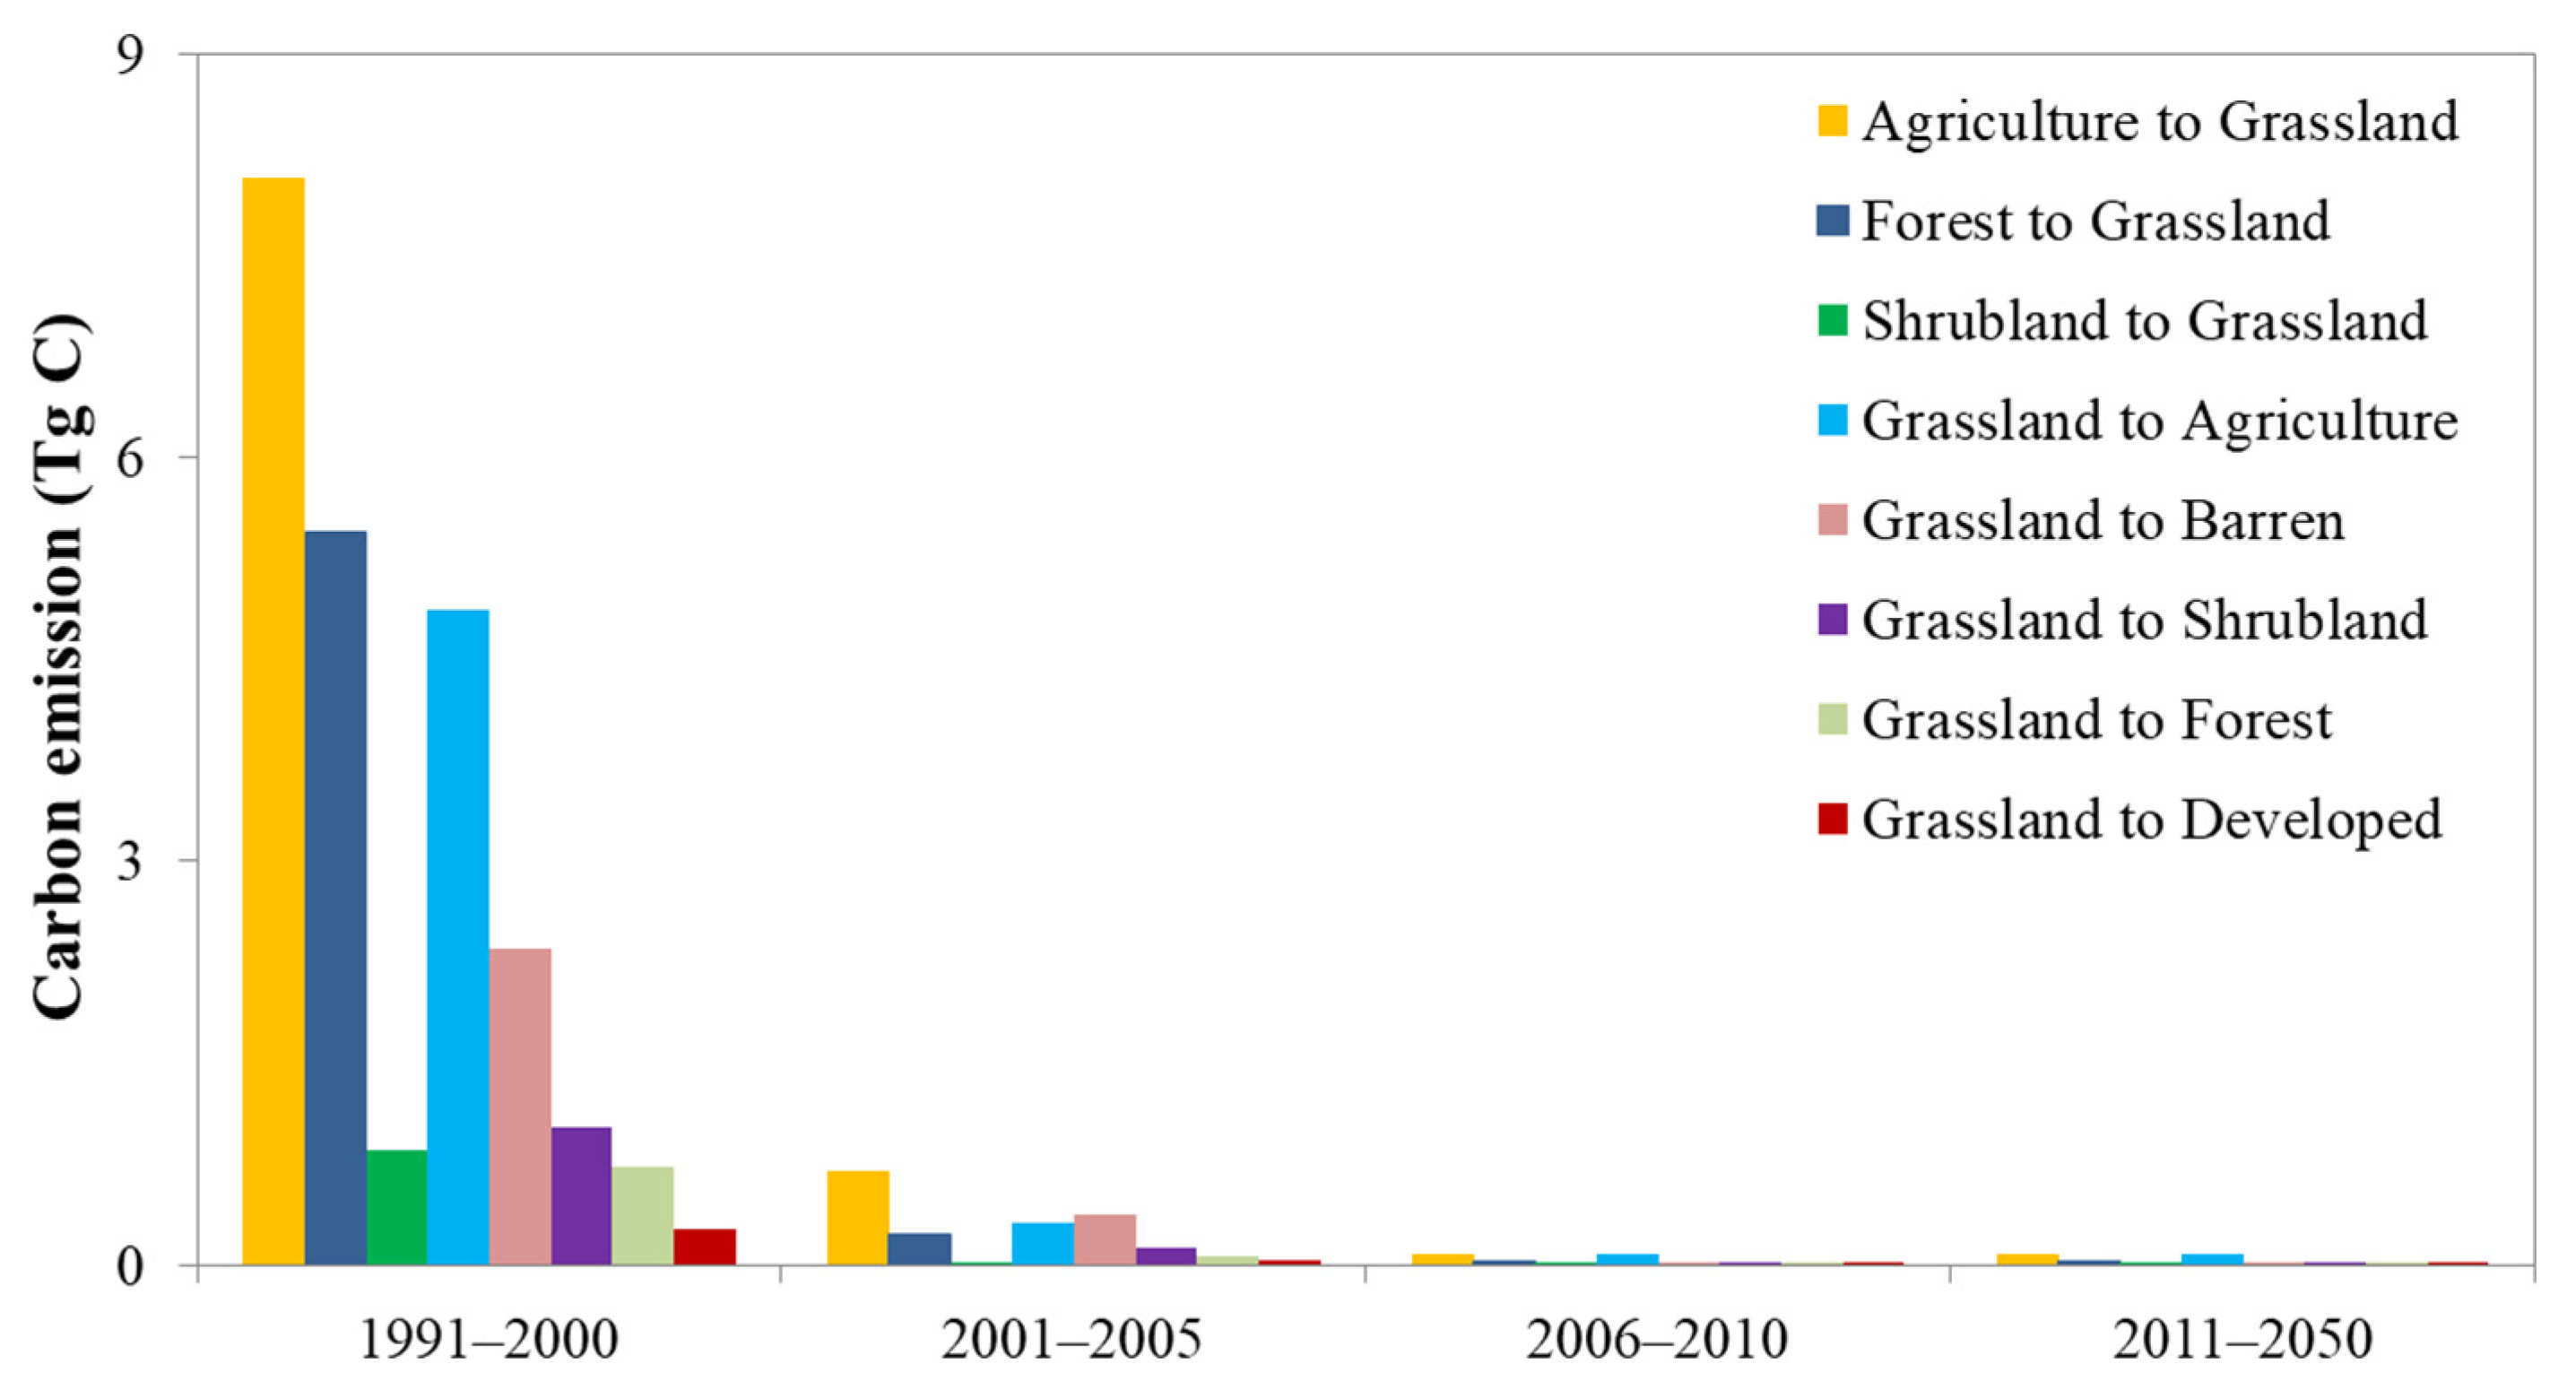
3.2. LULC Change-Induced Carbon Loss in the Whole Region

The total ecosystem carbon (TEC) simulated under the LUCAS_CLIM and LUCAS_LULCC scenarios is shown in Figure 6. Under the LUCAS_CLIM scenario, the TEC in the whole region was steadily increasing from 4.97 Pg C in 1990 to 5.29 Pg C in 2050 (Figure 6a). Under the LUCAS_LULCC scenario, an obvious TEC loss was observed. Before 2000, the TEC decreased at an annual rate of 24.9 Tg C/yr; the minimum value was 4.65 Pg C in the year 2000, with a 7.12% carbon loss compared to the LUCAS_CLIM simulated carbon. After that, the TEC of the region increased at an annual rate of 9.7 Tg C/yr and reached 5.17 Pg C in 2050, which is 2.35% smaller than the LUCAS_CLIM simulated carbon. For the three eco-regions, the LULC change has resulted in greater TEC loss in the agro-pasture area than in the other two regions. In the agro-pasture area, the maximum TEC loss happened in 2000, with an 8.54% lower carbon value compared to the LUCAS_CLIM scenario (Figure 6b).
During the period of 1991–2000, the largest carbon emission was produced by grassland gain (14.52 Tg C/yr), followed by vegetation change (13.44 Tg C/yr) (Table 2). The carbon emission resulting from grassland loss (9.91 Tg C/yr) was less than that of grassland gain. During 2001 and 2005, carbon emissions resulting from LULC change were sustainably reduced to 1.27 Tg C/yr, 1.22 Tg C/yr, 0.38 Tg C/yr, and 0.97 Tg C/yr, respectively. These emissions were produced by grassland gain, grassland loss, urbanization, and vegetation change. After 2005, carbon emissions resulting from LULC change were further reduced, and grassland loss produced more carbon emissions than grassland gain.

3.3. LULC Change-Induced Grassland Carbon Loss

The -induced carbon loss was quantified through LUCAS_CLIM simulations minus LUCAS_LULCC simulations, and the carbon loss and grassland area during 1990 to 2050 are shown in Figure 7. Our simulations indicated that the LULC change between 1991 and 2050 resulted in continuous grassland carbon loss in northern China, and the variation had a significant negative relationship with grassland area (correlation coefficient = 0.91). Before 2000, the carbon loss showed substantial annual variability with a higher standard deviation, which resulted from a large-scale LULC change from and to grassland. The greatest carbon loss happened in the period of 2001–2005, with 0.12 ± 0.001 Pg C/yr. At this time, the grassland area almost reached the lowest level (691.93 ± 0.95 × 10³ km2). Afterward, the grassland is gradually recovering with an increasing area, and the carbon loss is slowing down. The majority of grassland carbon loss caused by LULC change came from carbon loss in SOC (92.6%), with a small proportion from living biomass (3.5%) and litter (3.5%). Considering grassland change types (Figure 8), the largest carbon emission was produced by the conversion from agriculture to grassland, followed by forest to grassland, grassland to agriculture, and grassland to barren.

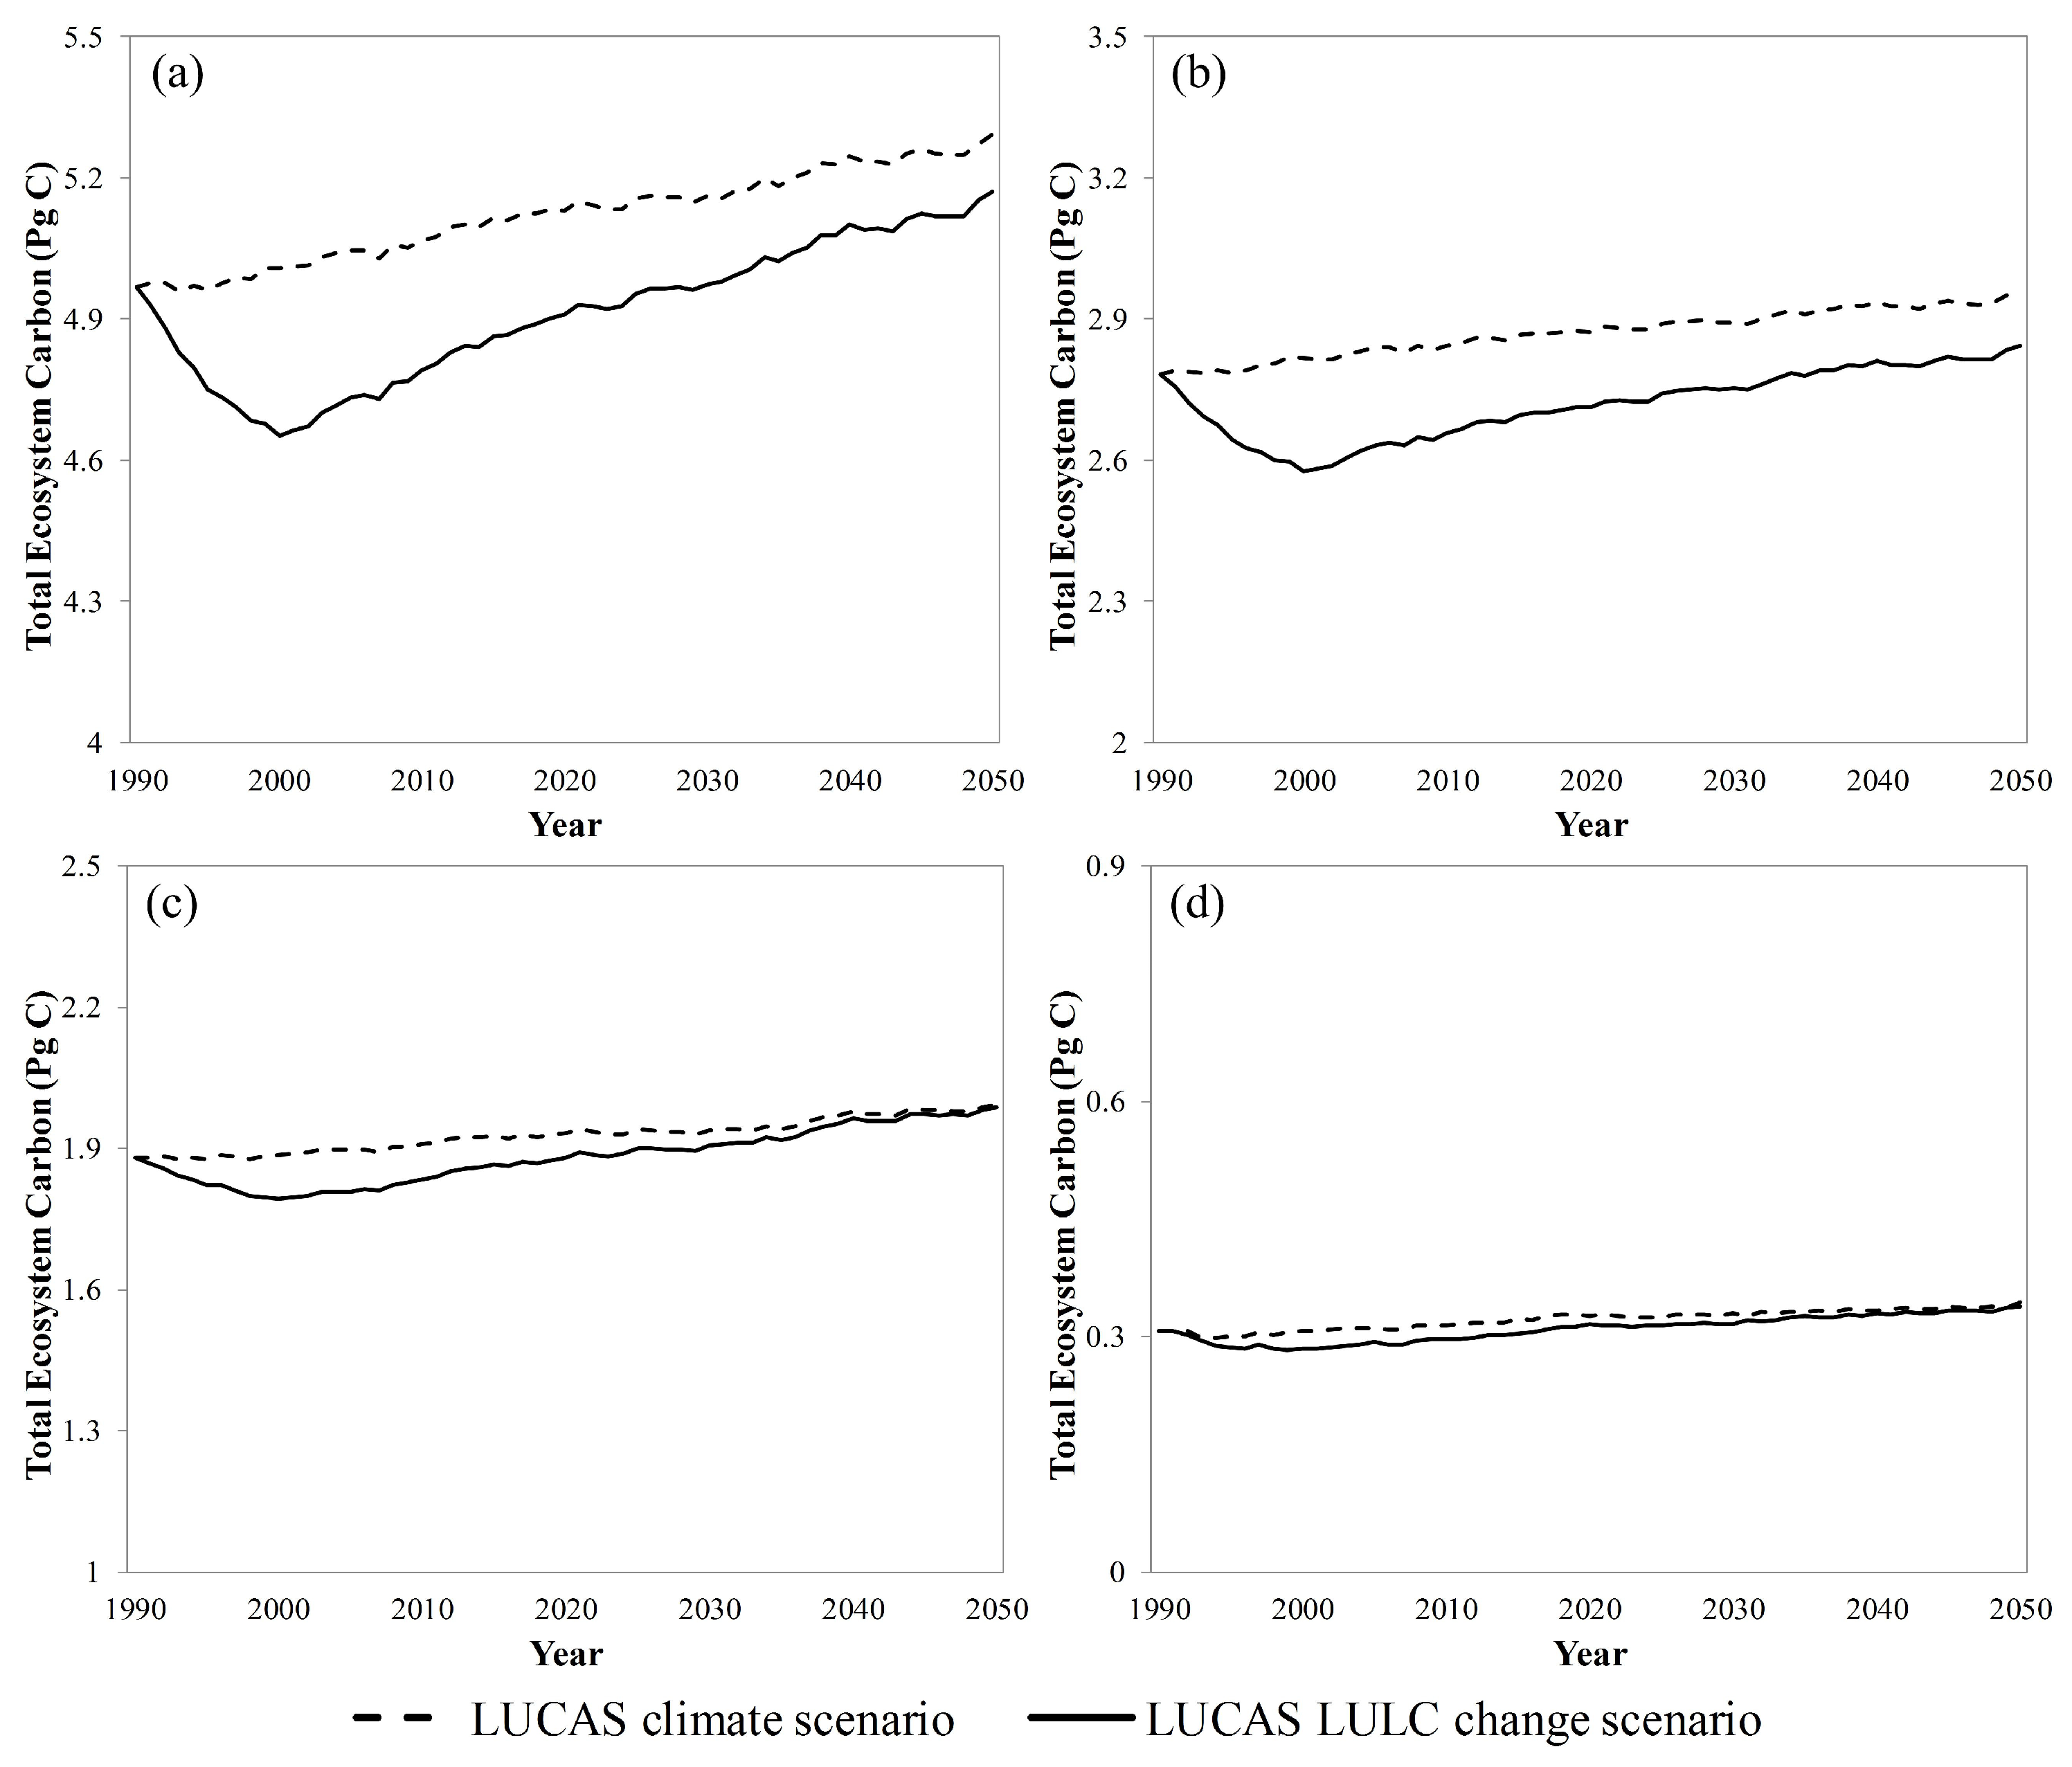
3.4. Grassland Net Biome Productivity Dynamics

Net biome productivity (NBP), which equals NPP minus heterotrophic respiration and losses from land change and disturbance [44], was used for characterizing the carbon sink at regional and larger spatial scales. Our model simulations suggested that the grassland NBP dynamics in northern China varied among different eco-regions (Table 3). Under the LUCAS_CLIM scenario, the agro-pasture area and steppe area were projected to be carbon sources with negative NBP values before 2010, resulting in a carbon source for the grassland ecosystem of the whole region. After that, the grassland ecosystem was projected to be a carbon sink. Under the LUCAS_LULCC scenario, the LULC change showed a significant impact on the carbon balance (NBP) in the region. Before 2000, smaller NBP values were simulated with the LULC change effect; the grassland NBP of the whole region is −15.54 Tg C/yr. The impact of LULC change on the grassland carbon balance is greater in agro-pasture areas than in the other two regions, with NBP simulated to be −8.63 Tg C/yr compared to −0.88 Tg C/yr in LUCAS_CLIM. During 2001–2010, the agro-pasture area was projected to be carbon neutral (0.006 Tg C/yr), and the steppe area was still a carbon source (−0.36 Tg C/yr). The grassland ecosystem in the whole region was a carbon sink during this period due to the contribution of the arid area. After 2001, the LULC change showed a positive impact on the grassland carbon balance; greater NBP values were projected than those of LUCAS_CLIM.

4. Discussion

4.1. Impact of LULC Change on Grassland Carbon Change

In the last half of the 20th century, LUCC in the grassland region of northern China has experienced cropland expansion and overgrazing due to rapid population growth and high demands for food and energy, leading to large-scale ecosystem degradation in this region [22]. The area of grassland, shrubland, and water bodies decreased rapidly during this period, while farmland and barren land obviously expanded. Since the beginning of the 21st century, the Chinese government has implemented a series of ecological projects, such as grassland protection, returning farmland to forest and grassland, and returning grazing land to grassland. These projects together cover 23.2% of China’s grasslands, mainly in northern China, which contributed greatly to vegetation restoration and reduction and are critical motivations for the increases in the area of grassland and the loss of barren land [26]. The “Grain-for-Green” Program launched in 1999 has converted 14.67 million ha of cropland into forestland and grassland and increased grassland and forest coverage by 4.5% until 2010 [45,46]. In addition, the continuously increasing population and fast-growing economy also led to a change from a largely rural society into a predominantly urban society. Therefore, the developed region observed a continuous and rapid increase during 1990–2050 [18]. Economic drivers and policy regulation were the main drivers of LUCC change in the region.
LULC dynamics are complex transformation processes; they will disturb the equilibrium carbon stock in the original ecosystem, affect the carbon exchange in soil-plant-atmosphere systems, and impact the ecosystem carbon balance [24], and then a certain time is needed to reach a new equilibrium between carbon inflows and outflows in the new ecosystem [47]. During this process, the ecosystem may act either as a carbon source or a carbon sink. Spatially, regional LULC change type and magnitude may vary significantly due to different regional carbon management policies or climate conditions and will lead to a completely different carbon budget [48]. Our results demonstrated that the LULC change has a significant impact on carbon storage in terrestrial ecosystems. Before the year 2000, the decrease in carbon storage was closely associated with the dramatic LULC dynamics converted from forest and grassland, which contain more carbon storage than other LULC types [15], to other LULC types, which have caused the loss of vegetation biomass and soil carbon stock. In grassland ecosystems, more than 16 times more carbon stocks were stored in soils than in vegetation [49]. This suggests the importance of soils in sequestering carbon in response to grassland change. Farmland reclamation in the grassland regions will decrease carbon sequestration during the early restoration stage because crop harvesting always leaves the soil bare without plant or residual cover in non-growing seasons, which can not only result in severe wind erosion and consequently carbon losses from surface soil but also change soil texture via decreasing silt- and clay-sized particles and thus reduce carbon sequestration capacity. However, the SOC stocks may enhance in the late stage after cropland converts to natural ecosystems [49]. A similar finding was also reported for forest planting, where the loss of soil carbon was dominated by erosion rather than mineralization during the plantation preparation [50]. Guo and Gifford (2002) indicated that soil carbon stocks declined by 42% and 59% after land use changes from forest to crop and from pasture to crop, respectively [47]. Thus, substantial grassland areas converted to cropland and forest before 2000 have resulted in enormous TEC losses, mainly in soil. Since the year 2000, ecological restoration projects have played an important role in LULC change and carbon accumulation in the region. Grassland protection practices, such as conversion of bare land to grassland and grassland development, have exerted effects on grassland development and further improved carbon storage. Deng et al. (2014) found that in the regions of the “Grain-for-Green” program, cropland conversion into forest or grassland indicated a positive impact on soil carbon stocks, which initially showed a decrease trend during the early stage (<5 years) and then an increase in net carbon gains. SOC stocks accumulated at an average rate of 0.33 Mg/ha/yr in the top 20 cm [50]. Recent studies also demonstrated that arid and semiarid ecosystems with significant vegetation greening trends, as affected by ecological restoration and climate humidification, proved to be a significant carbon sink over the past decades [51]. He et al. (2016) indicated that grassland restoration on abandoned sloping cropland enhanced the accumulation of carbon in soils in arid and semi-arid regions [52]. Xu et al. (2019) revealed that ecological restoration measures implemented for forests and grasslands could largely increase SOC storage in China [53,54]. Overall, land-use activities have begun to affect terrestrial carbon storage favorably with an increasing grassland area after the year 2000; the region has turned into a carbon sink, and the carbon pools in this region may greatly benefit from several ecological restoration projects [26,55].
The effect of LULC change on carbon storage may also differ within grassland types and eco-regions. Song et al. (2018) found that the conversion from croplands to grasslands reduced plant biomass carbon stock in meadows and desert steppe, whereas it enhanced it in typical steppe [49]. The non-uniform effects of the conversion from croplands to grasslands on ecosystem carbon stock among grassland types may be attributed to differences in climate conditions and initial SOC. Temperature and soil moisture may have different impacts on soil SOC decomposition in different climate conditions, and conversion time may influence plant litter accumulation and its contribution to soil SOC. In addition, our study also found different grassland change patterns in the three eco-regions (see Figure S3 in the Supplementary Material). The most drastic grassland change happened in the agro-pasture area, and the grassland area in this eco-region is decreasing during 1991–2050. The conversion from grassland to cropland has contributed the most to the TEC loss in the whole region. In the arid area and steppe area, relatively stable grassland change was observed; the grassland area was observed to decrease before 2005 and then increase after that. The two eco-regions are the main regions that conduct ecological restoration projects, which have promoted regional carbon storage.

4.2. Model Limitations and Further Work

The LUCAS model provides a transparent and computationally efficient method for producing regional-scale projections of carbon dynamics resulting from LULC change and disturbance. However, possible uncertainties and limitations still exist in our study. Firstly, climate data are not used directly within the LUCAS model. To evaluate the impacts of future changes in climate and improve computational efficiencies, LUCAS relies on an NPP parameter generated from either a process-based model or recent historical data to drive annual growth. Uncertainties associated with parameters related to climate (i.e., the effect of precipitation and temperature on NPP) can be introduced. Research should be carried out to explore alternative methods of generating regionally specific NPP projections across a range of climate scenarios so as to address uncertainties in future growth production. Moreover, our study only considered the future LULC change under the low radiative forcing scenario (RCP 4.5) from all four types of RCP scenarios; future studies should model the future carbon emissions under different emission pathway scenarios.
Input LULC data are among the largest uncertainty sources in carbon stock estimation. Diao et al. (2020) revealed that dense time-series LULC data can provide a more accurate accounting of the effects of land use change on ecosystem carbon [56]. Yu et al. (2019) found that different LULC data produced opposite estimates of carbon emissions from the same model [17]. They also revealed that LUH data has underestimated cropland expansion and overestimated forest recovery, rooted in the coarse resolution and FAO cropland statistics, resulting in over- or under-estimation of carbon emissions and large uncertainties. Policy regulation, which is very hard to predict, is another main driver of the LULC change and carbon balance. Taking no account of this factor in the future LULC simulation will result in an overestimation of carbon storage. Thus, for an accurate accounting of LULC change-induced carbon emissions and to better serve global carbon budget accounting, finer resolution and high-density historical and future LULC data considering various socioeconomic and policy factors (e.g., future land use simulation model (FLUS)) should be considered in future research [57,58].
In addition to human activities, natural factors (e.g., vegetation succession and other natural disturbances) and the coupled effects of climate change and disturbance events (including harvest activities and a wide range of human management actions) also affect LULC change. For example, grasslands are most susceptible to drought conditions [59], and grassland degradation and desertification take place mostly easily in arid and semi-arid regions, such as Northwest China and the agro-pastoral interlaced zone, which is generally ecologically fragile and vulnerable to environmental change [18,60]. Animal and insect damage, such as locust (Schistocerca gregaria) and pika (Ochotona curzoniae) in alpine meadows, can severely damage rangeland vegetation and change vegetation community composition, resulting in the acceleration of desertification and degradation of vegetation communities [61,62]. Our approach did not account for these effects and may result in an overestimation of carbon storage.

5. Conclusions

This study coupled a transparent LUCAS model with a process-based CENTURY model to estimate the effects of LULC change on grassland carbon balance in northern China. The results showed that the grassland area experienced a drastic decrease before 2010 and a steady increase afterward, while the agriculture area increased before 2010 and then kept steady, and the area of barren land increased before 2010 and then decreased. Economic factors and policy regulation were the main drivers of LUCC change in the region. LULC change has resulted in enormous TEC loss mainly in agro-pasture areas, which was primarily attributed to LULC change from agriculture to grassland, from forest to grassland, from grassland to agriculture, and from grassland to barren. LULC change also showed a significant impact on the grassland carbon balance in the study region; a smaller NBP value before 2000 and a larger NBP value after 2000 were projected under the LUCAS_LULCC scenario when compared to the LUCAS_CLIM scenario. Future efforts should include finer resolution and high-density LULC data and account for the coupled effects of climate change and disturbance events.

Supplementary Materials

The following supporting information can be downloaded at: https://www.mdpi.com/article/10.3390/agronomy13082180/s1. Figure S1: Comparison of carbon stock estimated from LUCAS SFM and CENTURY models; Figure S2: Comparison of LULC class area between LUCAS STSM simulations and RESDC LULC maps; Figure S3: Averaged annual grassland carbon loss and grassland area for the three eco-regions from 1991 to 2050; Table S1: The five transition types and 42 transition pathways used for the LUCAS STSM model.

Author Contributions

Conceptualization, Z.L. and X.X.; methodology, Z.L. and X.W.; software, Z.L. and Q.T.; validation, B.C.; investigation, Q.T. and X.W.; resources, B.C. and X.X.; data curation, Z.L. and X.X.; writing—original draft preparation, Z.L. and X.X.; writing—review and editing, Z.L., C.S. and X.X.; funding acquisition, X.X. All authors have read and agreed to the published version of the manuscript.

Funding

This research was funded by the National Key Research and Development Program of China (grant numbers: 2021YFD1300500 and 2021YFF0703904); the Special Funding for Modern Agricultural Technology Systems from the Chinese Ministry of Agriculture (grant number: CARS-34); the Fundamental Research Funds Central Non-profit Scientific Institution (grant number: 1610132021016); and the Special Fund for Independent Innovation of Agricultural Science and Technology in Jiangsu, China (CX(21)3063).

Data Availability Statement

Data sharing not applicable.

Acknowledgments

The authors would like to acknowledge Benjamin M. Sleeter, Jinxun Liu, Tamara S. Wilson, Jason Sherba, and Zhiliang Zhu with the U.S. Geological Survey for their instructions to couple and run the LUCAS model. We also thank Wenlong Zhao with the Lanzhou University for providing the spatial CENTURY 4.5 model. Special thanks to APEX Resource Management Solution Ltd. for providing SyncroSim software and the Land Use and Carbon Scenario Simulator (LUCAS) Model. We also acknowledge the Data Center for Resources and Environmental Sciences, Chinese Academy of Sciences, and Land-Use Harmonization (LUH) project for providing the historical and future LULC dataset.

Conflicts of Interest

The authors declare no conflict of interest.

References

  1. Hong, C.; Burney, J.A.; Pongratz, J.; Nabel, J.E.M.S.; Mueller, N.D.; Jackson, R.B.; Davis, S.J. Global and regional drivers of land-use emissions in 1961–2017. Nature 2021, 589, 554–561. [Google Scholar] [CrossRef] [PubMed]
  2. Yang, Y.; Shi, Y.; Sun, W.; Chang, J.; Zhu, J.; Chen, L.; Wang, X.; Guo, Y.; Zhang, H.; Yu, L.; et al. Terrestrial carbon sinks in China and around the world and their contribution to carbon neutrality. Sci. China Life Sci. 2022, 65, 861–895. [Google Scholar] [CrossRef] [PubMed]
  3. Tian, H.; Melillo, J.; Lu, C.; Kicklighter, D.; Liu, M.; Ren, W.; Xu, X.; Chen, G.; Zhang, C.; Pan, S.; et al. China’s terrestrial carbon balance: Contributions from multiple global change factors. Glob. Biogeochem. Cycles 2011, 25, GB1007. [Google Scholar] [CrossRef]
  4. Fang, J.; Yang, Y.; Ma, W.; Mohammat, A.; Shen, H. Ecosystem carbon stocks and their changes in China’s grasslands. Sci. China Life Sci. 2010, 53, 757–765. [Google Scholar] [CrossRef]
  5. Friedlingstein, P.; Houghton, R.A.; Marland, G.; Hackler, J.; Boden, T.A.; Conway, T.J.; Canadell, J.G.; Raupach, M.R.; Ciais, P.; Le Quéré, C. Update on CO2 emissions. Nat. Geosci. 2010, 3, 811–812. [Google Scholar] [CrossRef]
  6. Scott, C.E.; Monks, S.A.; Spracklen, D.V.; Arnold, S.R.; Forster, P.M.; Rap, A.; Äijälä, M.; Artaxo, P.; Carslaw, K.S.; Chipperfield, M.P.; et al. Impact on short-lived climate forcers increases projected warming due to deforestation. Nat. Commun. 2018, 9, 157. [Google Scholar] [CrossRef]
  7. Stephens, L.; Fuller, D.; Boivin, N.; Rick, T.; Gauthier, N.; Kay, A.; Marwick, B.; Armstrong, C.G.; Barton, C.M.; Denham, T.; et al. Archaeological assessment reveals Earth’s early transformation through land use. Science 2019, 365, 897–902. [Google Scholar] [CrossRef]
  8. Friedlingstein, P.; O’Sullivan, M.; Jones, M.W.; Andrew, R.M.; Gregor, L.; Hauck, J.; Le Quéré, C.; Luijkx, I.T.; Olsen, A.; Peters, G.P.; et al. Global Carbon Budget 2022. Earth Syst. Sci. Data 2022, 14, 4811–4900. [Google Scholar] [CrossRef]
  9. Gasser, T.; Crepin, L.; Quilcaille, Y.; Houghton, R.A.; Ciais, P.; Obersteiner, M. Historical CO2 emissions from land use and land cover change and their uncertainty. Biogeosciences 2020, 17, 4075–4101. [Google Scholar] [CrossRef]
  10. Hartung, K.; Bastos, A.; Chini, L.; Ganzenmüller, R.; Havermann, F.; Hurtt, G.C.; Loughran, T.; Nabel, J.E.M.S.; Nützel, T.; Obermeier, W.A.; et al. Bookkeeping estimates of the net land-use change flux—A sensitivity study with the CMIP6 land-use dataset. Earth Syst. Dynam. 2021, 12, 763–782. [Google Scholar] [CrossRef]
  11. Yang, F.; He, F.; Li, S.; Li, M.; Wu, P. A new estimation of carbon emissions from land use and land cover change in China over the past 300 years. Sci. Total Environ. 2023, 863, 160963. [Google Scholar] [CrossRef]
  12. Hou, H.; Zhou, B.-B.; Pei, F.; Hu, G.; Su, Z.; Zeng, Y.; Zhang, H.; Gao, Y.; Luo, M.; Li, X. Future Land Use/Land Cover Change Has Nontrivial and Potentially Dominant Impact on Global Gross Primary Productivity. Earth’s Future 2022, 10, e2021EF002628. [Google Scholar] [CrossRef]
  13. Ding, L.; Li, Z.; Shen, B.; Wang, X.; Xu, D.; Yan, R.; Yan, Y.; Xin, X.; Xiao, J.; Li, M.; et al. Spatial patterns and driving factors of aboveground and belowground biomass over the eastern Eurasian steppe. Sci. Total Environ. 2022, 803, 149700. [Google Scholar] [CrossRef] [PubMed]
  14. Jiang, W.; Deng, Y.; Tang, Z.; Lei, X.; Chen, Z. Modelling the potential impacts of urban ecosystem changes on carbon storage under different scenarios by linking the CLUE-S and the InVEST models. Ecol. Model. 2017, 345, 30–40. [Google Scholar] [CrossRef]
  15. Zhu, L.; Song, R.; Sun, S.; Li, Y.; Hu, K. Land use/land cover change and its impact on ecosystem carbon storage in coastal areas of China from 1980 to 2050. Ecol. Indic. 2022, 142, 109178. [Google Scholar] [CrossRef]
  16. van Marle, M.J.E.; van Wees, D.; Houghton, R.A.; Field, R.D.; Verbesselt, J.; van der Werf, G.R. New land-use-change emissions indicate a declining CO2 airborne fraction. Nature 2022, 603, 450–454. [Google Scholar] [CrossRef] [PubMed]
  17. Yu, Z.; Lu, C.; Tian, H.; Canadell, J.G. Largely underestimated carbon emission from land use and land cover change in the conterminous United States. Glob. Chang. Biol. 2019, 25, 3741–3752. [Google Scholar] [CrossRef]
  18. Chang, X.; Xing, Y.; Wang, J.; Yang, H.; Gong, W. Effects of land use and cover change (LUCC) on terrestrial carbon stocks in China between 2000 and 2018. Resour. Conserv. Recycl. 2022, 182, 106333. [Google Scholar] [CrossRef]
  19. Tharammal, T.; Bala, G.; Narayanappa, D.; Nemani, R. Potential roles of CO2 fertilization, nitrogen deposition, climate change, and land use and land cover change on the global terrestrial carbon uptake in the twenty-first century. Clim. Dyn. 2019, 52, 4393–4406. [Google Scholar] [CrossRef]
  20. Ni, J. Carbon storage in grasslands of China. J. Arid. Environ. 2002, 50, 205–218. [Google Scholar] [CrossRef]
  21. Kang, L.; Han, X.; Zhang, Z.; Sun, O.J. Grassland ecosystems in China: Review of current knowledge and research advancement. Philos. Trans. R. Soc. B Biol. Sci. 2007, 362, 997–1008. [Google Scholar] [CrossRef]
  22. Liu, M.; Tian, H. China’s land cover and land use change from 1700 to 2005: Estimations from high-resolution satellite data and historical archives. Glob. Biogeochem. Cycles 2010, 24, 129022811. [Google Scholar] [CrossRef]
  23. Orie, L.; Ma, R.; George, S.; Tian, S.; Arthur, W.; Wan, C.; Wang, Z.; Wu, J.; Zhang, X. Grasslands and Grassland Sciences in Northern China; The National Academies Press: Washington, DC, USA, 1992; p. 230. [Google Scholar]
  24. John, R.; Chen, J.; Lu, N.; Wilske, B. Land cover/land use change in semi-arid Inner Mongolia: 1992–2004. Environ. Res. Lett. 2009, 4, 045010. [Google Scholar] [CrossRef]
  25. Yin, H.; Pflugmacher, D.; Li, A.; Li, Z.; Hostert, P. Land use and land cover change in Inner Mongolia—Understanding the effects of China’s re-vegetation programs. Remote Sens. Environ. 2018, 204, 918–930. [Google Scholar] [CrossRef]
  26. Lu, F.; Hu, H.; Sun, W.; Zhu, J.; Liu, G.; Zhou, W.; Zhang, Q.; Shi, P.; Liu, X.; Wu, X.; et al. Effects of national ecological restoration projects on carbon sequestration in China from 2001 to 2010. Proc. Natl. Acad. Sci. USA 2018, 115, 4039–4044. [Google Scholar] [CrossRef] [PubMed]
  27. Xin, X.; Jin, D.; Ge, Y.; Wang, J.; Chen, J.; Qi, J.; Chu, H.; Shao, C.; Murray, P.J.; Zhao, R.; et al. Climate Change Dominated Long-Term Soil Carbon Losses of Inner Mongolian Grasslands. Glob. Biogeochem. Cycles 2020, 34, e2020GB006559. [Google Scholar] [CrossRef]
  28. Liu, J.-H.; Gao, J.-X.; Lv, S.-H.; Han, Y.-W.; Nie, Y.-H. Shifting farming–pastoral ecotone in China under climate and land use changes. J. Arid. Environ. 2011, 75, 298–308. [Google Scholar] [CrossRef]
  29. Sleeter, B.M.; Liu, J.; Daniel, C.; Frid, L.; Zhu, Z. An integrated approach to modeling changes in land use, land cover, and disturbance and their impact on ecosystem carbon dynamics: A case study in the Sierra Nevada Mountains of California. AIMS Environ. Sci. 2015, 2, 577–606. [Google Scholar] [CrossRef]
  30. Daniel, C.J.; Sleeter, B.M.; Frid, L.; Fortin, M.-J. Integrating continuous stocks and flows into state-and-transition simulation models of landscape change. Methods Ecol. Evol. 2018, 9, 1133–1143. [Google Scholar] [CrossRef]
  31. Sleeter, B.M.; Liu, J.; Daniel, C.; Rayfield, B.; Sherba, J.; Hawbaker, T.J.; Zhu, Z.; Selmants, P.C.; Loveland, T.R. Effects of contemporary land-use and land-cover change on the carbon balance of terrestrial ecosystems in the United States. Environ. Res. Lett. 2018, 13, 045006. [Google Scholar] [CrossRef]
  32. Daniel, C.J.; Frid, L.; Sleeter, B.M.; Fortin, M.-J. State-and-transition simulation models: A framework for forecasting landscape change. Methods Ecol. Evol. 2016, 7, 1413–1423. [Google Scholar] [CrossRef]
  33. Parton, W.J.; Schimel, D.S.; Cole, C.V.; Ojima, D.S. Analysis of Factors Controlling Soil Organic Matter Levels in Great Plains Grasslands. Soil Sci. Soc. Am. J. 1987, 51, 1173–1179. [Google Scholar] [CrossRef]
  34. Parton, W.J.; Stewart, J.W.B.; Cole, C.V. Dynamics of C, N, P and S in grassland soils: A model. Biogeochemistry 1988, 5, 109–131. [Google Scholar] [CrossRef]
  35. Parton, W.J.; Scurlock, J.M.O.; Ojima, D.S.; Gilmanov, T.G.; Scholes, R.J.; Schimel, D.S.; Kirchner, T.; Menaut, J.-C.; Seastedt, T.; Garcia Moya, E.; et al. Observations and modeling of biomass and soil organic matter dynamics for the grassland biome worldwide. Glob. Biogeochem. Cycles 1993, 7, 785–809. [Google Scholar] [CrossRef]
  36. Ťupek, B.; Launiainen, S.; Peltoniemi, M.; Sievänen, R.; Perttunen, J.; Kulmala, L.; Penttilä, T.; Lindroos, A.-J.; Hashimoto, S.; Lehtonen, A. Evaluating CENTURY and Yasso soil carbon models for CO2 emissions and organic carbon stocks of boreal forest soil with Bayesian multi-model inference. Eur. J. Soil Sci. 2019, 70, 847–858. [Google Scholar]
  37. Zhao, W.; Qi, J.; Sun, G.; Li, F. Spatial patterns of top soil carbon sensitivity to climate variables in northern Chinese grasslands. Acta Agric. Scand. Sect. B Soil Plant Sci. 2012, 62, 720–731. [Google Scholar] [CrossRef]
  38. Gupta, S.; Kumar, S. Simulating climate change impact on soil carbon sequestration in agro-ecosystem of mid-Himalayan landscape using CENTURY model. Environ. Earth Sci. 2017, 76, 394. [Google Scholar] [CrossRef]
  39. Shi, X.Z.; Yu, D.S.; Warner, E.D.; Pan, X.Z.; Petersen, G.W.; Gong, Z.G.; Weindorf, D.C. Soil Database of 1:1,000,000 Digital Soil Survey and Reference System of the Chinese Genetic Soil Classification System. Soil Surv. Horiz. 2004, 45, 129–136. [Google Scholar] [CrossRef]
  40. Liu, J.; Liu, M.; Deng, X.; Zhuang, D.; Zhang, Z.; Luo, D. The land use and land cover change database and its relative studies in China. J. Geogr. Sci. 2002, 12, 275–282. [Google Scholar]
  41. Liu, J.; Liu, M.; Tian, H.; Zhuang, D.; Zhang, Z.; Zhang, W.; Tang, X.; Deng, X. Spatial and temporal patterns of China’s cropland during 1990–2000: An analysis based on Landsat TM data. Remote Sens. Environ. 2005, 98, 442–456. [Google Scholar] [CrossRef]
  42. Thomson, A.M.; Calvin, K.V.; Smith, S.J.; Kyle, G.P.; Volke, A.; Patel, P.; Delgado-Arias, S.; Bond-Lamberty, B.; Wise, M.A.; Clarke, L.E.; et al. RCP4.5: A pathway for stabilization of radiative forcing by 2100. Clim. Chang. 2011, 109, 77. [Google Scholar] [CrossRef]
  43. Jason, T.S.; Benjamin, M.S.; Adam, W.D.; Owen, P. Downscaling global land-use/land-cover projections for use in region-level state-and-transition simulation modeling. AIMS Environ. Sci. 2015, 2, 623–647. [Google Scholar]
  44. Schulze, E.-D.; Wirth, C.; Heimann, M. Managing Forests After Kyoto. Science 2000, 289, 2058–2059. [Google Scholar] [CrossRef]
  45. Deng, L.; Shangguan, Z.-P.; Li, R. Effects of the grain-for-green program on soil erosion in China. Int. J. Sediment Res. 2012, 27, 120–127. [Google Scholar] [CrossRef]
  46. Cao, S.; Chen, L.; Liu, Z. An Investigation of Chinese Attitudes toward the Environment: Case Study Using the Grain for Green Project. AMBIO A J. Hum. Environ. 2009, 38, 55–64. [Google Scholar] [CrossRef]
  47. Guo, L.B.; Gifford, R.M. Soil carbon stocks and land use change: A meta analysis. Glob. Change Biol. 2002, 8, 345–360. [Google Scholar] [CrossRef]
  48. Müller-Wenk, R.; Brandão, M. Climatic impact of land use in LCA—Carbon transfers between vegetation/soil and air. Int. J. Life Cycle Assess. 2010, 15, 172–182. [Google Scholar] [CrossRef]
  49. Song, J.; Wan, S.; Peng, S.; Piao, S.; Ciais, P.; Han, X.; Zeng, D.-H.; Cao, G.; Wang, Q.; Bai, W.; et al. The carbon sequestration potential of China’s grasslands. Ecosphere 2018, 9, e02452. [Google Scholar] [CrossRef]
  50. Deng, L.; Liu, G.-b.; Shangguan, Z.-p. Land-use conversion and changing soil carbon stocks in China’s ‘Grain-for-Green’ Program: A synthesis. Glob. Chang. Biol. 2014, 20, 3544–3556. [Google Scholar] [CrossRef] [PubMed]
  51. He, Z.; Lei, L.; Zeng, Z.-C.; Sheng, M.; Welp, L.R. Evidence of Carbon Uptake Associated with Vegetation Greening Trends in Eastern China. Remote Sens. 2020, 12, 718. [Google Scholar] [CrossRef]
  52. He, S.; Liang, Z.; Han, R.; Wang, Y.; Liu, G. Soil carbon dynamics during grass restoration on abandoned sloping cropland in the hilly area of the Loess Plateau, China. CATENA 2016, 137, 679–685. [Google Scholar]
  53. Xu, L.; Yu, G.; He, N. Increased soil organic carbon storage in Chinese terrestrial ecosystems from the 1980s to the 2010s. J. Geogr. Sci. 2019, 29, 49–66. [Google Scholar] [CrossRef]
  54. Li, Y.; Liu, W.; Feng, Q.; Zhu, M.; Yang, L.; Zhang, J. Effects of land use and land cover change on soil organic carbon storage in the Hexi regions, Northwest China. J. Environ. Manag. 2022, 312, 114911. [Google Scholar] [CrossRef] [PubMed]
  55. Lai, L.; Huang, X.; Yang, H.; Chuai, X.; Zhang, M.; Zhong, T.; Chen, Z.; Chen, Y.; Wang, X.; Thompson, J.R. Carbon emissions from land-use change and management in China between 1990 and 2010. Sci. Adv. 2016, 2, e1601063. [Google Scholar] [CrossRef] [PubMed]
  56. Diao, J.; Liu, J.; Zhu, Z.; Li, M.; Sleeter, B.M. Substantially Greater Carbon Emissions Estimated Based on Annual Land-Use Transition Data. Remote Sens. 2020, 12, 1126. [Google Scholar] [CrossRef]
  57. Liu, X.; Liang, X.; Li, X.; Xu, X.; Ou, J.; Chen, Y.; Li, S.; Wang, S.; Pei, F. A future land use simulation model (FLUS) for simulating multiple land use scenarios by coupling human and natural effects. Landsc. Urban Plan. 2017, 168, 94–116. [Google Scholar] [CrossRef]
  58. Li, X.; Chen, G.; Liu, X.; Liang, X.; Wang, S.; Chen, Y.; Pei, F.; Xu, X. A New Global Land-Use and Land-Cover Change Product at a 1-km Resolution for 2010 to 2100 Based on Human–Environment Interactions. Ann. Am. Assoc. Geogr. 2017, 107, 1040–1059. [Google Scholar] [CrossRef]
  59. Xu, H.-j.; Wang, X.-p.; Zhang, X.-x. Decreased vegetation growth in response to summer drought in Central Asia from 2000 to 2012. Int. J. Appl. Earth Obs. Geoinf. 2016, 52, 390–402. [Google Scholar] [CrossRef]
  60. Song, X.; Yang, G.; Yan, C.; Duan, H.; Liu, G.; Zhu, Y. Driving forces behind land use and cover change in the Qinghai-Tibetan Plateau: A case study of the source region of the Yellow River, Qinghai Province, China. Environ. Earth Sci. 2009, 59, 793–801. [Google Scholar] [CrossRef]
  61. Peng, W.; Ma, N.L.; Zhang, D.; Zhou, Q.; Yue, X.; Khoo, S.C.; Yang, H.; Guan, R.; Chen, H.; Zhang, X.; et al. A review of historical and recent locust outbreaks: Links to global warming, food security and mitigation strategies. Environ. Res. 2020, 191, 110046. [Google Scholar] [CrossRef]
  62. Yang, J.; Wang, S.; Su, W.; Yu, Q.; Wang, X.; Han, Q.; Zheng, Y.; Qu, J.; Li, X.; Li, H. Animal Activities of the Key Herbivore Plateau Pika (Ochotona curzoniae) on the Qinghai-Tibetan Plateau Affect Grassland Microbial Networks and Ecosystem Functions. Front. Microbiol. 2022, 13, 950811. [Google Scholar] [CrossRef] [PubMed]
Figure 1. The study region and land use and land cover map of 2010 were provided by the Data Center for Resources and Environmental Sciences, Chinese Academy of Sciences.
Agronomy 13 02180 g001
Figure 2. Conceptual diagram of the designed stock and flow model in LUCAS.
Agronomy 13 02180 g002
Figure 3. The framework for integrating the LUCAS model with the CENTURY model.
Agronomy 13 02180 g003
Figure 4. The initial LULC map of the year 1990 (a) and LUCAS STSM projected LULC maps for the years 2000 (b), 2010 (c), and 2050 (d).
Agronomy 13 02180 g004
Figure 5. Annual transition rate of LULC transition types between 1991 and 2050.
Agronomy 13 02180 g005
Figure 6. Total ecosystem carbon simulated under the LUCAS_CLIM and LUCAS_LULCC scenarios for the whole region (a), agro-pasture area (b), steppe area (c), and arid area (d).
Agronomy 13 02180 g006
Figure 7. Average annual grassland carbon loss and grassland area in the whole study area from 1991 to 2050. The error bar is the standard deviation calculated from the interannual variability of the study target.
Agronomy 13 02180 g007
Figure 8. Annual carbon emissions due to land use change.
Agronomy 13 02180 g008
Table 1. The area of LUCAS STSM projected LULC classes between 1991 and 2050 (unit: 103 km2).
LULC Class199020002005201020202050
Grassland706.84693.43690.74691.56692.89697.44
Agriculture331.06348.86347.97348.00348.08348.40
Barren462.84464.46466.57464.92461.85452.31
Developed24.6925.4226.2226.7027.6030.17
Forest65.1265.5966.0566.0366.0165.88
Shrubland63.1059.6661.4061.7562.4364.33
Water30.5029.5828.4228.6229.0330.30
Wetland34.6931.8931.5131.3631.0930.19
Table 2. Annual carbon emissions due to land use change (unit: Tg C/yr).
LULC Transition Type1991–20002001–20052006–20102011–2050
Grassland gain14.521.270.100.12
Grassland loss9.911.220.860.34
Urbanization2.260.380.110.11
Vegetation change13.440.970.240.36
Table 3. Annual grassland NBP for different eco-regions projected under the LUCAS_CLIM and LUCAS_LULCC scenarios.
Annual NBP
(Tg C/yr)
LUCAS_CLIM ScenarioLUCAS_LULCC Scenario
1991–20002001–20102011–20501991–20002001–20102011–2050
Whole region−2.69−0.751.45−15.540.412.44
Agro-pasture area−0.88−0.950.65−8.630.0061.12
Steppe area−2.70−0.260.32−7.32−0.360.52
Arid area0.890.460.480.410.760.80
Disclaimer/Publisher’s Note: The statements, opinions and data contained in all publications are solely those of the individual author(s) and contributor(s) and not of MDPI and/or the editor(s). MDPI and/or the editor(s) disclaim responsibility for any injury to people or property resulting from any ideas, methods, instructions or products referred to in the content.

