Article

Diversity Assessment of Winged Bean [Psophocarpus tetragonolobus (L.) DC.] Accessions from IITA Genebank

by
Temitope Esther Olatunde Shonde
1,2,
Moses Adeolu Adebayo
3,
Ayomide Ajoke Bhadmus
1,4,
Idris Ishola Adejumobi
5,
Olaniyi A. Oyatomi
1,
Benjamin Faloye
1 and
Michael T. Abberton
1,*
1
Genetic Resources Centre, International Institute of Tropical Agriculture (IITA), Ibadan 200001, Nigeria
2
Department of Crop Production and Soil Science, Faculty of Agriculture, Ladoke Akintola University of Technology (LAUTECH), Ogbomoso 210214, Nigeria
3
Department of Crop and Animal Science, Faculty of Agriculture, Ajayi Crowther University (ACU), Offa-Meta Campus, Oke-Ebo 211271, Nigeria
4
Department of Plant Breeding and Seed Technology, College of Plant Science and Crop Production (COLPLANT), Federal University of Agriculture (FUNAAB), Abeokuta 111101, Nigeria
5
Department of Biotechnology, University of Kisangani, Kisangani 2012, Democratic Republic of the Congo
*
Author to whom correspondence should be addressed.
Agronomy 2023, 13(8), 2150; https://doi.org/10.3390/agronomy13082150
Submission received: 5 June 2023 / Revised: 11 July 2023 / Accepted: 12 July 2023 / Published: 16 August 2023
(This article belongs to the Special Issue Plant Genetic Resources and Biotechnology)

Abstract

:
The capability of winged bean to support food and nutrition security in sub-Saharan Africa is recurrently being affected by several constraints, which include a lack of genetic improvement. The dearth of adequate information on the level of available genetic diversity in winged bean germplasm has been a major setback in planning appropriate improvement programs. Fifteen winged bean accessions were assessed for genetic diversity using 10 quantitative traits and 10 simple sequence repeat (SSR) markers. The accessions were laid out in RCBD with three replicates for two growing seasons. Leaf samples were obtained from 10 plants representing each accession for SSR marker genotyping. The accessions exhibited significant (p < 0.05) differences for measured traits. Broad-sense heritability estimates varied from 10.31% for days to first plant maturity to 72.67% for pod weight. Pod weight had a positive and significant correlations with pod length (0.53, p < 0.05), pod width (0.70, p < 0.01), and number of seeds per pod (0.64, p < 0.01). However, the number of seeds per pod was negatively correlated with days to maturity (−0.71, p < 0.01). Number of seeds per pod was positively predicted by pod weight, seed thickness, and days to maturity. Cluster analysis delineated the accessions into two distinct groups. Average number of alleles of 4.2, gene diversity of 0.25, and polymorphic information content of 0.22 were recorded. Analysis of molecular variance revealed intra-accession variation of 95% as compared to inter-accession variation of 5%. Two primary genetic groups were identified and only three accessions, namely TPt-6, TPt-126, and TPt-48, showed genetic purity. The results of this study provide the basis for exploiting the existing diversity for winged bean improvement.

1. Introduction

Winged bean [Psophocarpus tetragonolobus (L.) DC], (2n = 18), is a leguminous crop being cultivated for consumption and economic values. The crop has the potential to enhance food and nutrition security in tropical regions, especially in sub-Saharan Africa (SSA) [1]. Most parts of the winged bean plant, including immature pods seeds, leaves, flowers, and tubers, are edible and are rich in protein and other nutrients [2]. The crop can be grown as a grain legume, green vegetable, tuber crop, forage, and as a cover crop [2]. Winged bean has a higher percentage of crude protein (30–38%) in the seeds when compared to other legumes like cowpea (Vigna unguiculata—23%), pigeon pea (Cajanus cajan—22%), and lima bean (Phaseolus lunatus—23%) [3,4] The tuberous root contains about 20% protein and 25–30% carbohydrates [5]. The fresh young bean pod contains Vitamins C and B6, niacin, riboflavin, and other minerals such as iron, copper, manganese, and calcium [6]. Roasted and boiled tuberous roots have been reported to improve the nutritional needs of the peoples of Malaysia, Myanmar, Papua New Guinea, Indonesia, Ghana, and Nigeria [5]. Aside from nutritional benefits, it has the ability to fix atmospheric nitrogen to soil, thus making it a good option as a cover crop [7].
Despite the many attributes of winged bean as a crop with food security potential in SSA, its production is limited by multiple factors, including a lack of genetic improvement with respect to the desirable agronomic, nutritional, and biochemical characteristics, a lack of value chain demand, and a lengthy life cycle. The lack of research and breeding programs to develop improved varieties, as well as to synthesize adequate knowledge on the utilization of the crop, has affected its economic potential in society and has resulted in winged bean being categorized among the underutilized or orphan crops.
Assessing the genetic diversity of the available winged bean germplasm is the starting point for bringing winged bean into the limelight of leguminous crops of economic importance. This exercise is essential for elucidating the extent and level of genetic variability in the available genetic resources and assisting in the identification of the genes that control the expression of essential biological functions that could be exploited for its improvement. The knowledge of genetic diversity helps crop improvement experts to identify and select progenitors with good characteristics for the development of superior progenies towards targeted breeding objectives. The desirable attributes that can be genetically manipulated and improved upon include high yield potential, biotic and abiotic stress tolerance/resistance, and food quality attributes. The genetic improvement of winged bean will transform it into a veritable tool for combating food insecurity and facilitating sustainable agriculture, particularly in SSA.
Genetic diversity in crops can be assessed using classical and molecular approaches. Of the two, molecular assessment has proven to be more accurate, effective, and reliable [8]. Although the classical approach which is based on the differentiation in the morphology of the crop has been helpful, the highly significant genotype by environment interaction (GEI) effect on the expression of many important agronomic traits that are polygenic in nature has been the major setback in the use of this approach. The molecular approach, which involves the use of molecular markers and a good understanding of agro-morphological variations that exist in the germplasm of a crop has greatly facilitated the development of improved genotypes with desirable agronomic attributes [9]. Of the molecular markers that have been used for profiling winged bean, simple sequence repeats (SSRs) markers have been the most preferred since single nucleotide polymorphisms (SNPs) markers are yet to be developed [6,7,10]. SSRs are co-dominant, abundant in genomes, and highly polymorphic and are preferred for crops where SNPs are not available yet [7].
The objectives of this study were to: (i) estimate the variance components and heritability for the traits of economic importance in winged bean and identify accession(s) with superior performance for these traits and (ii) assess the level of genetic diversity among 15 winged bean accessions using phenotypic and microsatellite (SSR) markers. This study will contribute to the development of a protocol to evaluate genetic diversity and the selection of parents for future winged bean breeding programs.

2. Materials and Methods

2.1. Germplasm and Experimental Site

Seeds of 15 winged bean accessions were obtained from the Genetic Resources Centre (GRC) of the International Institute of Tropical Agriculture (IITA), Ibadan, Oyo State, Nigeria (Table 1). The experiments were carried out at the Research Field and Bioscience Center of IITA, Ibadan, located in the transition forest savanna agro-ecology of Nigeria (latitude 70°30′ N, longitude 30°54′ E, altitude 227.2 m above sea level, an alfisol soil of the Egbeda series and an average annual rainfall of 1308 mm and monthly rainfall ranging between 0.05 and 86.5 mm; and the minimum and maximum temperatures ranging between 20 and 27 °C).

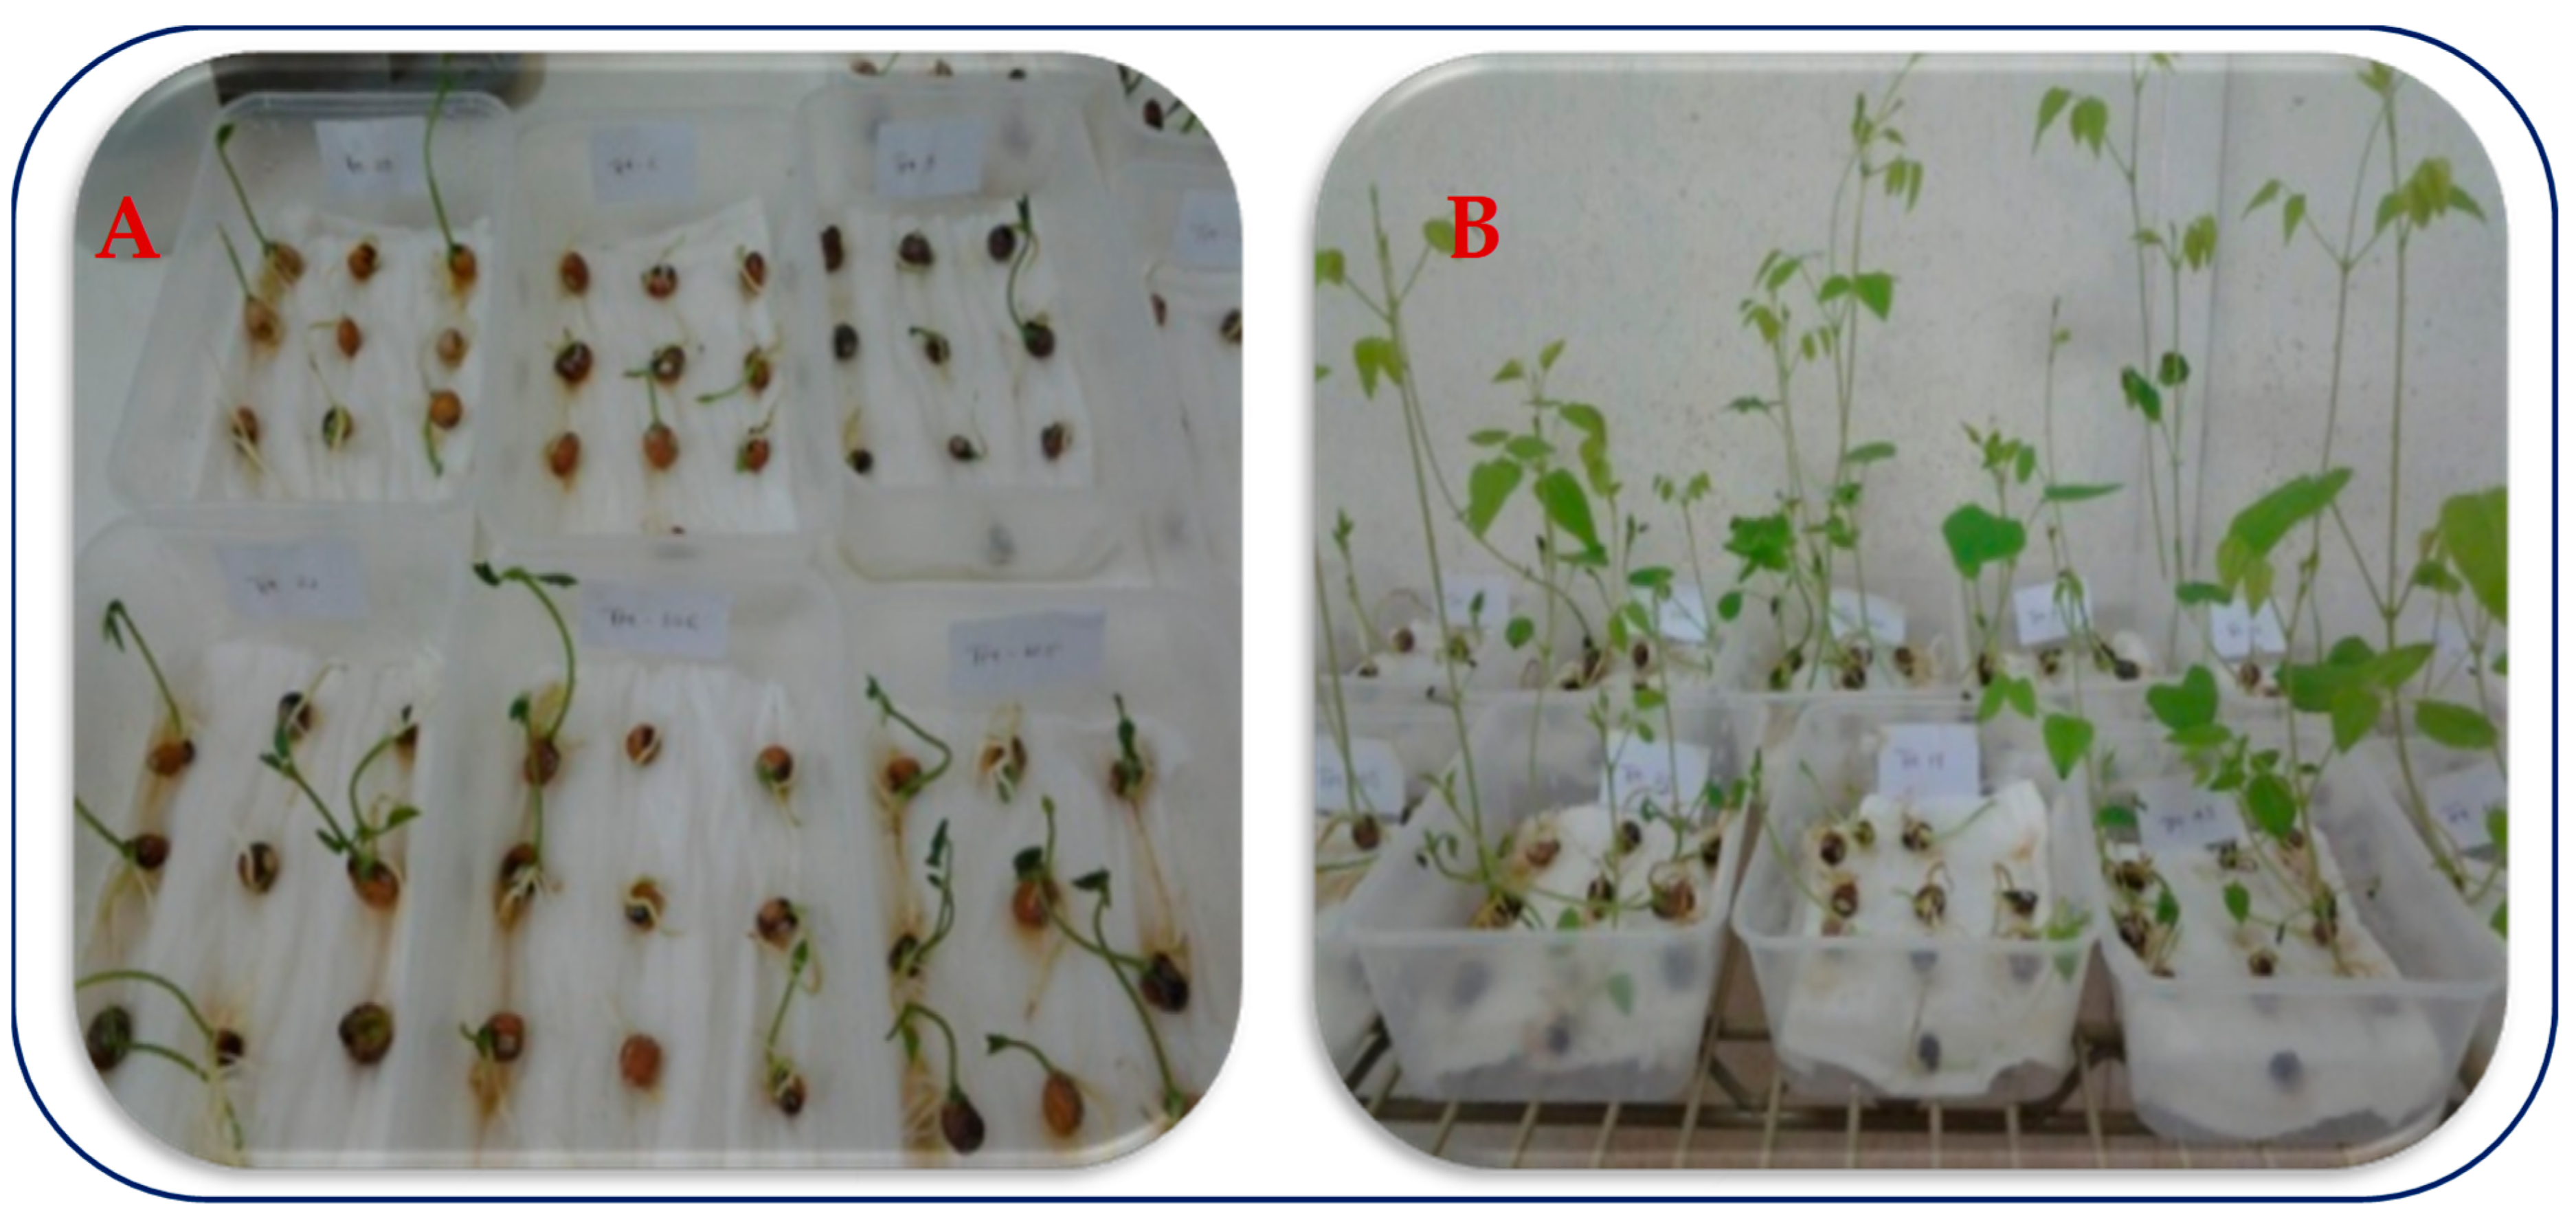
Seed Viability Assessment

The experiment to assess seed viability was conducted at the GRC germination laboratory. Ten seeds of each accession were scarified mechanically by cutting through the seed coat opposite the micropyle with a scalpel blade so as to allow water imbibition to break external dormancy and were later treated with fungicide (mancozeb) to prevent seed infection and death. Seedburo K-22 germination paper sheets (also known as Kimpak or crepe paper) were cut and arranged in transparent polyethylene boxes (7 to 14 mm layers per box) and autoclaved. Seeds were sown in the polyethylene boxes according to the standard operating laboratory procedure and were kept in a growth room at 25 °C with photoperiod 12/12. Emergence count for each accession was performed at 10 and 15 days after sowing. Each box was examined for the number of germinated seeds, percentage of dead seeds, normal seedling vigor, and percentage of germination Plates A and B (Figure 1).

2.2. Agro-Morphological Characterization

Scarified seeds were planted at the IITA Ibadan Research Station in May 2017 and 2018. Entries were arranged using a randomized complete block design (RCBD) in three replicates. Plot size was 5 × 5 m with a spacing of 1 m between rows and 1 m between plants within a row. No fertilizer was applied during the evaluation process and manual weeding was carried out when needed to keep the plot weed free. Plants were staked at eight weeks after planting and were protected from insect attacks with 0.5% karate and Cyperdeforce (lambda-cyhalothrin) from the period of flower bud initiation to pod maturity. Ten plants were tagged in each plot for data collection.

2.3. Data Collection

Data were collected on a plot basis for a total of 13 quantitative traits. The traits were measured using a seed counter, metric rulers, a Vennier caliper, and a weighing balance, as described in Table 2.

2.4. Statistical Analyses

Data collected on a plot basis were subjected to analysis of variance (ANOVA) using the lmer Test package in R Software version 4.3.0 [11] following the model below:
Yijl = µ + Geni + Repj + Yearl + Gen × Year(il) + Errorijl
where Yijl denotes the trait mean score of the ith accession in the jth replication and lth year, µ is the grand mean, Geni is the effect of the ith accession expressed as a deviation from the mean of all plots, Repj is the jth replication effect, Yearl is the lth year effect, Gen x Year(il) is the ith genotype by lth year interaction effect, and Errorijl is the residual (or random error) effect.
Replication was considered as a random effect whereas accessions and year were considered as fixed effects. Error (δ2e), genotypic (δ2g) and phenotypes (δ2p) variances were calculated from expected mean squares (EMS) of ANOVA following Kresovich [12].
Error variance.
δ2e = MSe
Genotypic variance.
δ 2 g =   M s g M s g l r l
Genotypic by environment interaction variance.
δ 2 g l =   M s g M s g l l r
Phenotypic variance.
δ 2 p = δ 2 g + ( δ 2 e r l ) + ( δ 2 g l l )
where MSg = mean square of genotype; MSgl = mean square due to accession by year interaction; MSe = error mean square (mean square of error); l = number of years; r = number of replications.
Broad-sense heritability (H2), phenotypic coefficient of variance (PCV), and genotypic coefficient of variance (GCV) were calculated using the values derived from the variance components. H2 was classified as low (<30%), medium (30–60%), and high (>60%), according to Johnson et al. [13]. Following Deshmukh et al. [14], PCV or GCV greater than 20% was rated as high, between 10 and 20% was rated medium, and lower than 10% was regarded as low.
H 2 = δ 2 g δ 2 g + δ 2 g l l + δ 2 e r l × 100
P C V = δ 2 p μ × 100
G C V = δ 2 g μ × 100
where, δ2p = phenotypic variance, δ2g = genotypic variance, δ2gl = genotype by year interaction variance; δ2e: residual variance, r = number of replications; l = number of years; µ: grand mean of the trait.
The degree of relationships or associations among the assessed traits were determined using the Pearson’s correlation coefficients and visualized using the ggpairs function in the ggplot2 package [15]. Principal component analysis (PCA) was performed using the PRCOMP function implemented in R [16] to identify the important traits that contributed to the observed genotypic variation. Hierarchical cluster analysis was carried out based on the Ward.D2 method using the Unweighted Pair Group Method with Arithmetic Mean (UPGMA). The final hierarchical cluster was built and viewed using the Dendextend package [17] and circlize package [18] in R. The optimum number of clusters was identified using the NbClust package [19]. Path coefficient analysis was based on structural equation modeling and implemented using the Lavaan package [20]. In this model, seed weight per pod and number of seeds per pod were considered as response variables against the agronomic traits as predictor variables. The path diagram from the Lavaan outputs was constructed using the semPlot package [21] to depict the direct effect of these traits on seed weight and number of seeds per pod for suitability for indirect selection.

2.5. Molecular Characterization

Young leaf samples of three-week old plants were taken for genomic DNA (gDNA) extraction using a modified sodium dodecyl sulfate (SDS) extraction protocol [22]. The leaf samples were collected randomly from three replicates in tens for the 15 accessions. The resultant genomic DNA was checked for degradation and quality using the agarose gel electrophoresis method by running the extracted genomic DNA samples on 1% agarose gel and visualizing under UV fluorescence using a gel documentation system (ENDUROTM GDS). DNA quantity and purity were checked using a Nanodrop spectrophotometer (ND-1000) (Thermo Fisher Scientific, Carlsbad, CA, USA).
The SSR sequences were based on the primer sequence reported by Vatanparast et al. [23]. The length of nucleotides was nine for trinucleotide and one for tetra-nucleotide repeat motifs for both forward and reverse primers, as shown in Table 3. The microsatellite regions were amplified using EconoTaq PLUS 2X Master Mix Catalog No. 30035 (Lucigen, Middleton, WI, USA). A PCR reaction volume of 20 µL containing 40 ng of g DNA 1 µL, 10 mM of each primer 1 µL, 10 µL EconoTaq PLUS 2X Master Mix, and 7 µL nuclease free water (Catalog No. E476) (AMRESCO LLC, Solon, OH, USA) were used. The PCR amplification was performed in a thermocyler for each reaction with an initial denaturation at 95 °C for 5 min followed by 35 cycles consisting of 95 °C at 30 s (denaturation), 50 °C for 30 s (annealing), and 72 °C at 30 s (extension) and a final extension at 72 °C for 10 min (final extension). The amplified product was visualized by agarose gel electrophoresis (Sunrise 96, Biometra, Gottingen, Germany), at 100 volts for two hours. The PCR products from the 10 SSR markers were co-loaded for fragment analysis, which was performed using a 1:10 dilution of the fluorescently labelled PCR amplicons, LIZ500 sizing standard, and Hi-DiTM Formamide Catalog No. 4311320 (Thermo Fisher Scientific, Carlsbad, CA, USA) mixture, and were denatured at 95 °C for five minutes. After denaturation, the fragments analysis was performed using a 50 cm capillary array, POP-7TMon an ABI PRISM™ 3500xl. Genetic Analyzer (Applied Biosystems, Thermo Fisher Scientific, Carlsbad, CA, USA), and peak and allele sizes were scored using GeneScan™ Software V3.7 and interpreted using GeneMapper®v5.0. (Applied Biosystems, Thermo Fisher Scientific, Carlsbad, CA, USA).
Data files of the molecular data were assembled in a database (Genemapper v 5.0) [24] and allele sizes were checked for congruency and adjusted according to the allelic references provided in the gene mapper manual for SSR markers. Data obtained were exported to an excel sheet. The fragment size of each primer was checked, and missing data were removed. Descriptors of genetic diversity, such as allele number per marker, allele frequency, gene diversity, and polymorphic information content (PIC) were calculated using Power Marker v 3.25 software [25]. The PIC of each SSR marker was calculated using the Power Marker v 3.25 software. PIC gives an indication of the discriminatory power of an SSR locus by considering not only the number of alleles that are expressed but also the relative frequencies of those alleles. Genetic relationships were determined by cluster analysis using UPGMA. Analysis of molecular variance (AMOVA) was performed to study the differences between the UPGMA clusters. AMOVA pairwise comparisons between groups and estimation of molecular diversity (expected heterozygosity-He) within groups were conducted using GenAlex 6.5 [26].

3. Results

3.1. Variability in Agronomic Traits of 15 Winged Bean Accession

Results of combined ANOVA across years for the measured traits are presented in Table 4. Accessions x year interaction effects were not significant for all the assessed traits except for days to first plant maturity and seed weight. The year effect was also significant (p < 0.05) for pod width and days to first plant maturity only. Significant (p < 0.05) differences were detected among accessions for the traits that were evaluated (Table 4).

3.2. Genetic Variances and Broad-Sense Heritability of Agronomic Traits

Genotypic coefficients of variation (GCV) varied from a lower classification of 1.40% for seed width and 17.67% for seed weight to a high classification of 23.24% for fodder weight. A similar result was recorded for phenotypic coefficients of variation (PCV) that varied from a lower classification of 2.15% for seed width to a medium classification of 18.32% for pod weight, and a high classification of 21.26% and 29.71% for seed weight and fodder weight, respectively. Broad-sense heritability (H2) ranged between 10.31% for days to first plant maturity (medium) to 72.67% for pod weight (high). High H2 (>60%) was observed in fodder weight, Pod weight and seed weight (Table 4).

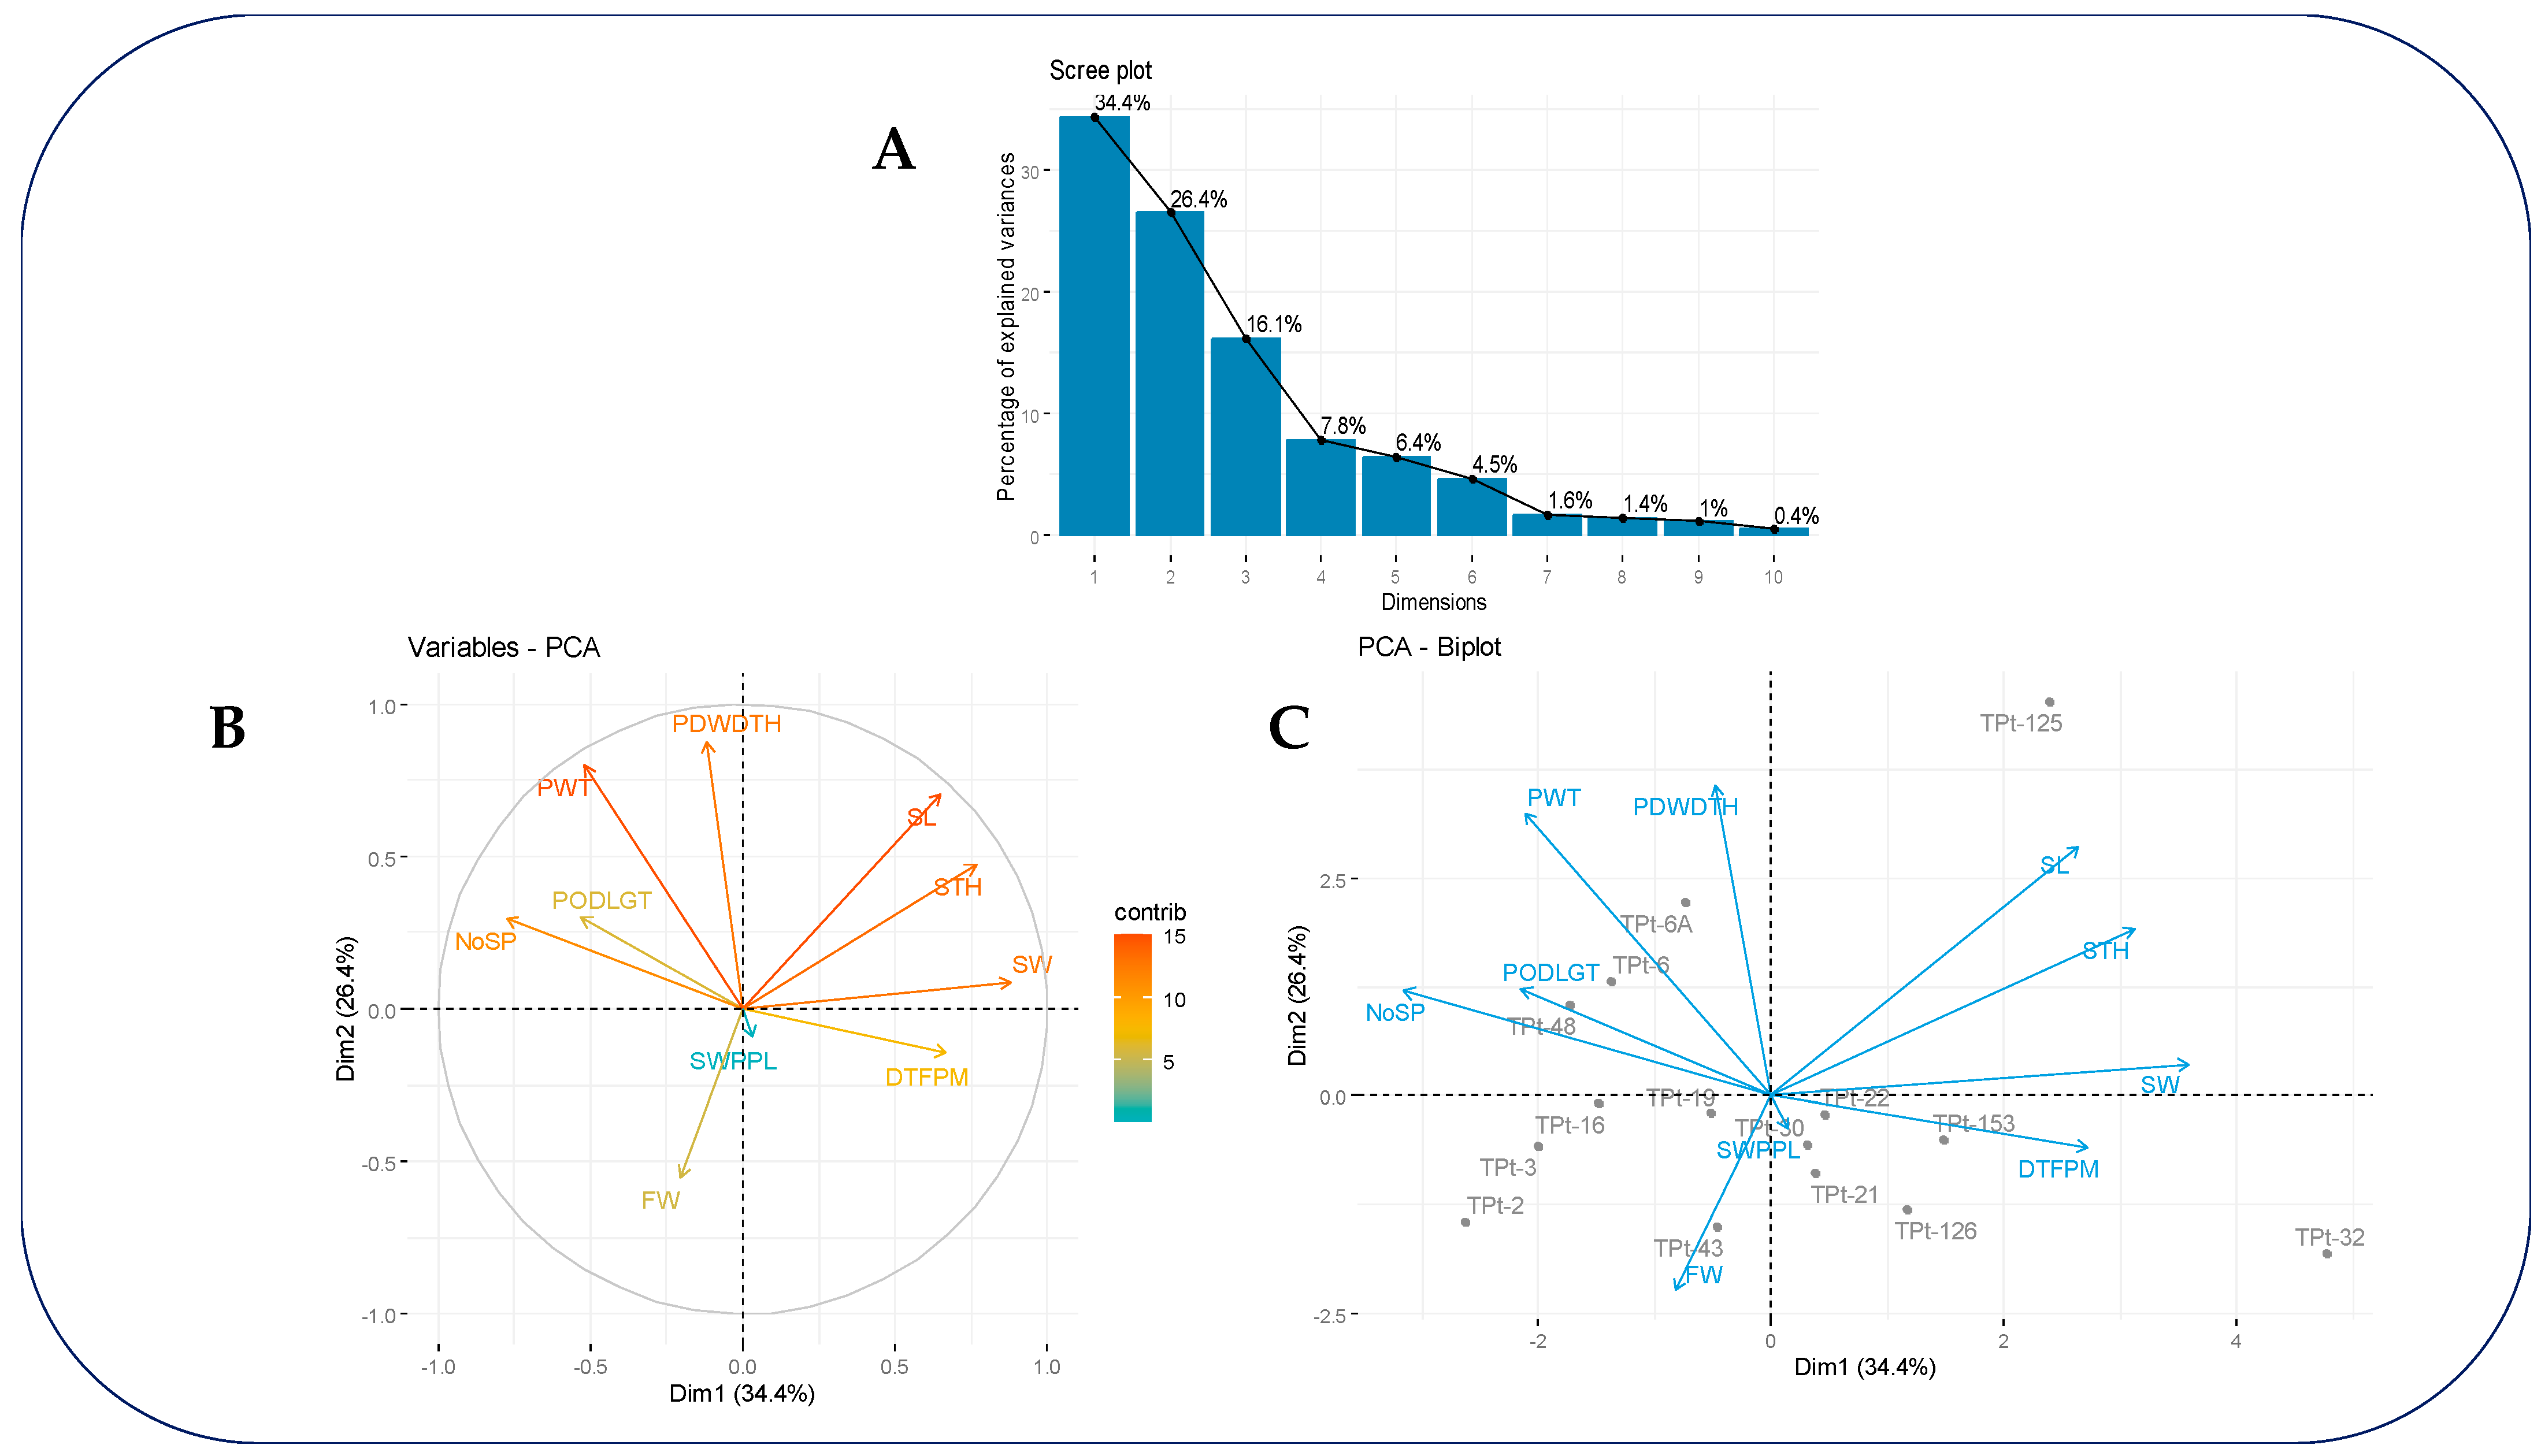
3.3. Dimension Reduction Analysis of Agronomic Traits

The results of the PCA showed that the first three principal components (PC1 to PC3) contributed largely to the observed phenotypic variance (Figure 2A). These PCs had eigenvalues greater than one and accounted for 76.89% of the total genetics (Table 5). PC1 accounted for 34.36% of the variation, with major contributions from number of seeds per pod, seed width, and seed thickness (Table 5 and Figure 2B). PC2 accounted for 26.42%, with major contributions from pod width, seed length, fodder weight and pod weight (Table 5 and Figure 2B). PC3 accounted for 16.12%, with major contributions to pod length and seed weight (Table 5). The genotype by traits biplot revealed that accessions TPt-6A and TPt-6 had a good performance for pod weight. Accession TPt-48 had a good performance for pod length. Accession TPt-43 had a good performance for fodder weight and accessions TPt-32 and TPt-153 had a good performance for days to first pod maturity (Figure 2C).

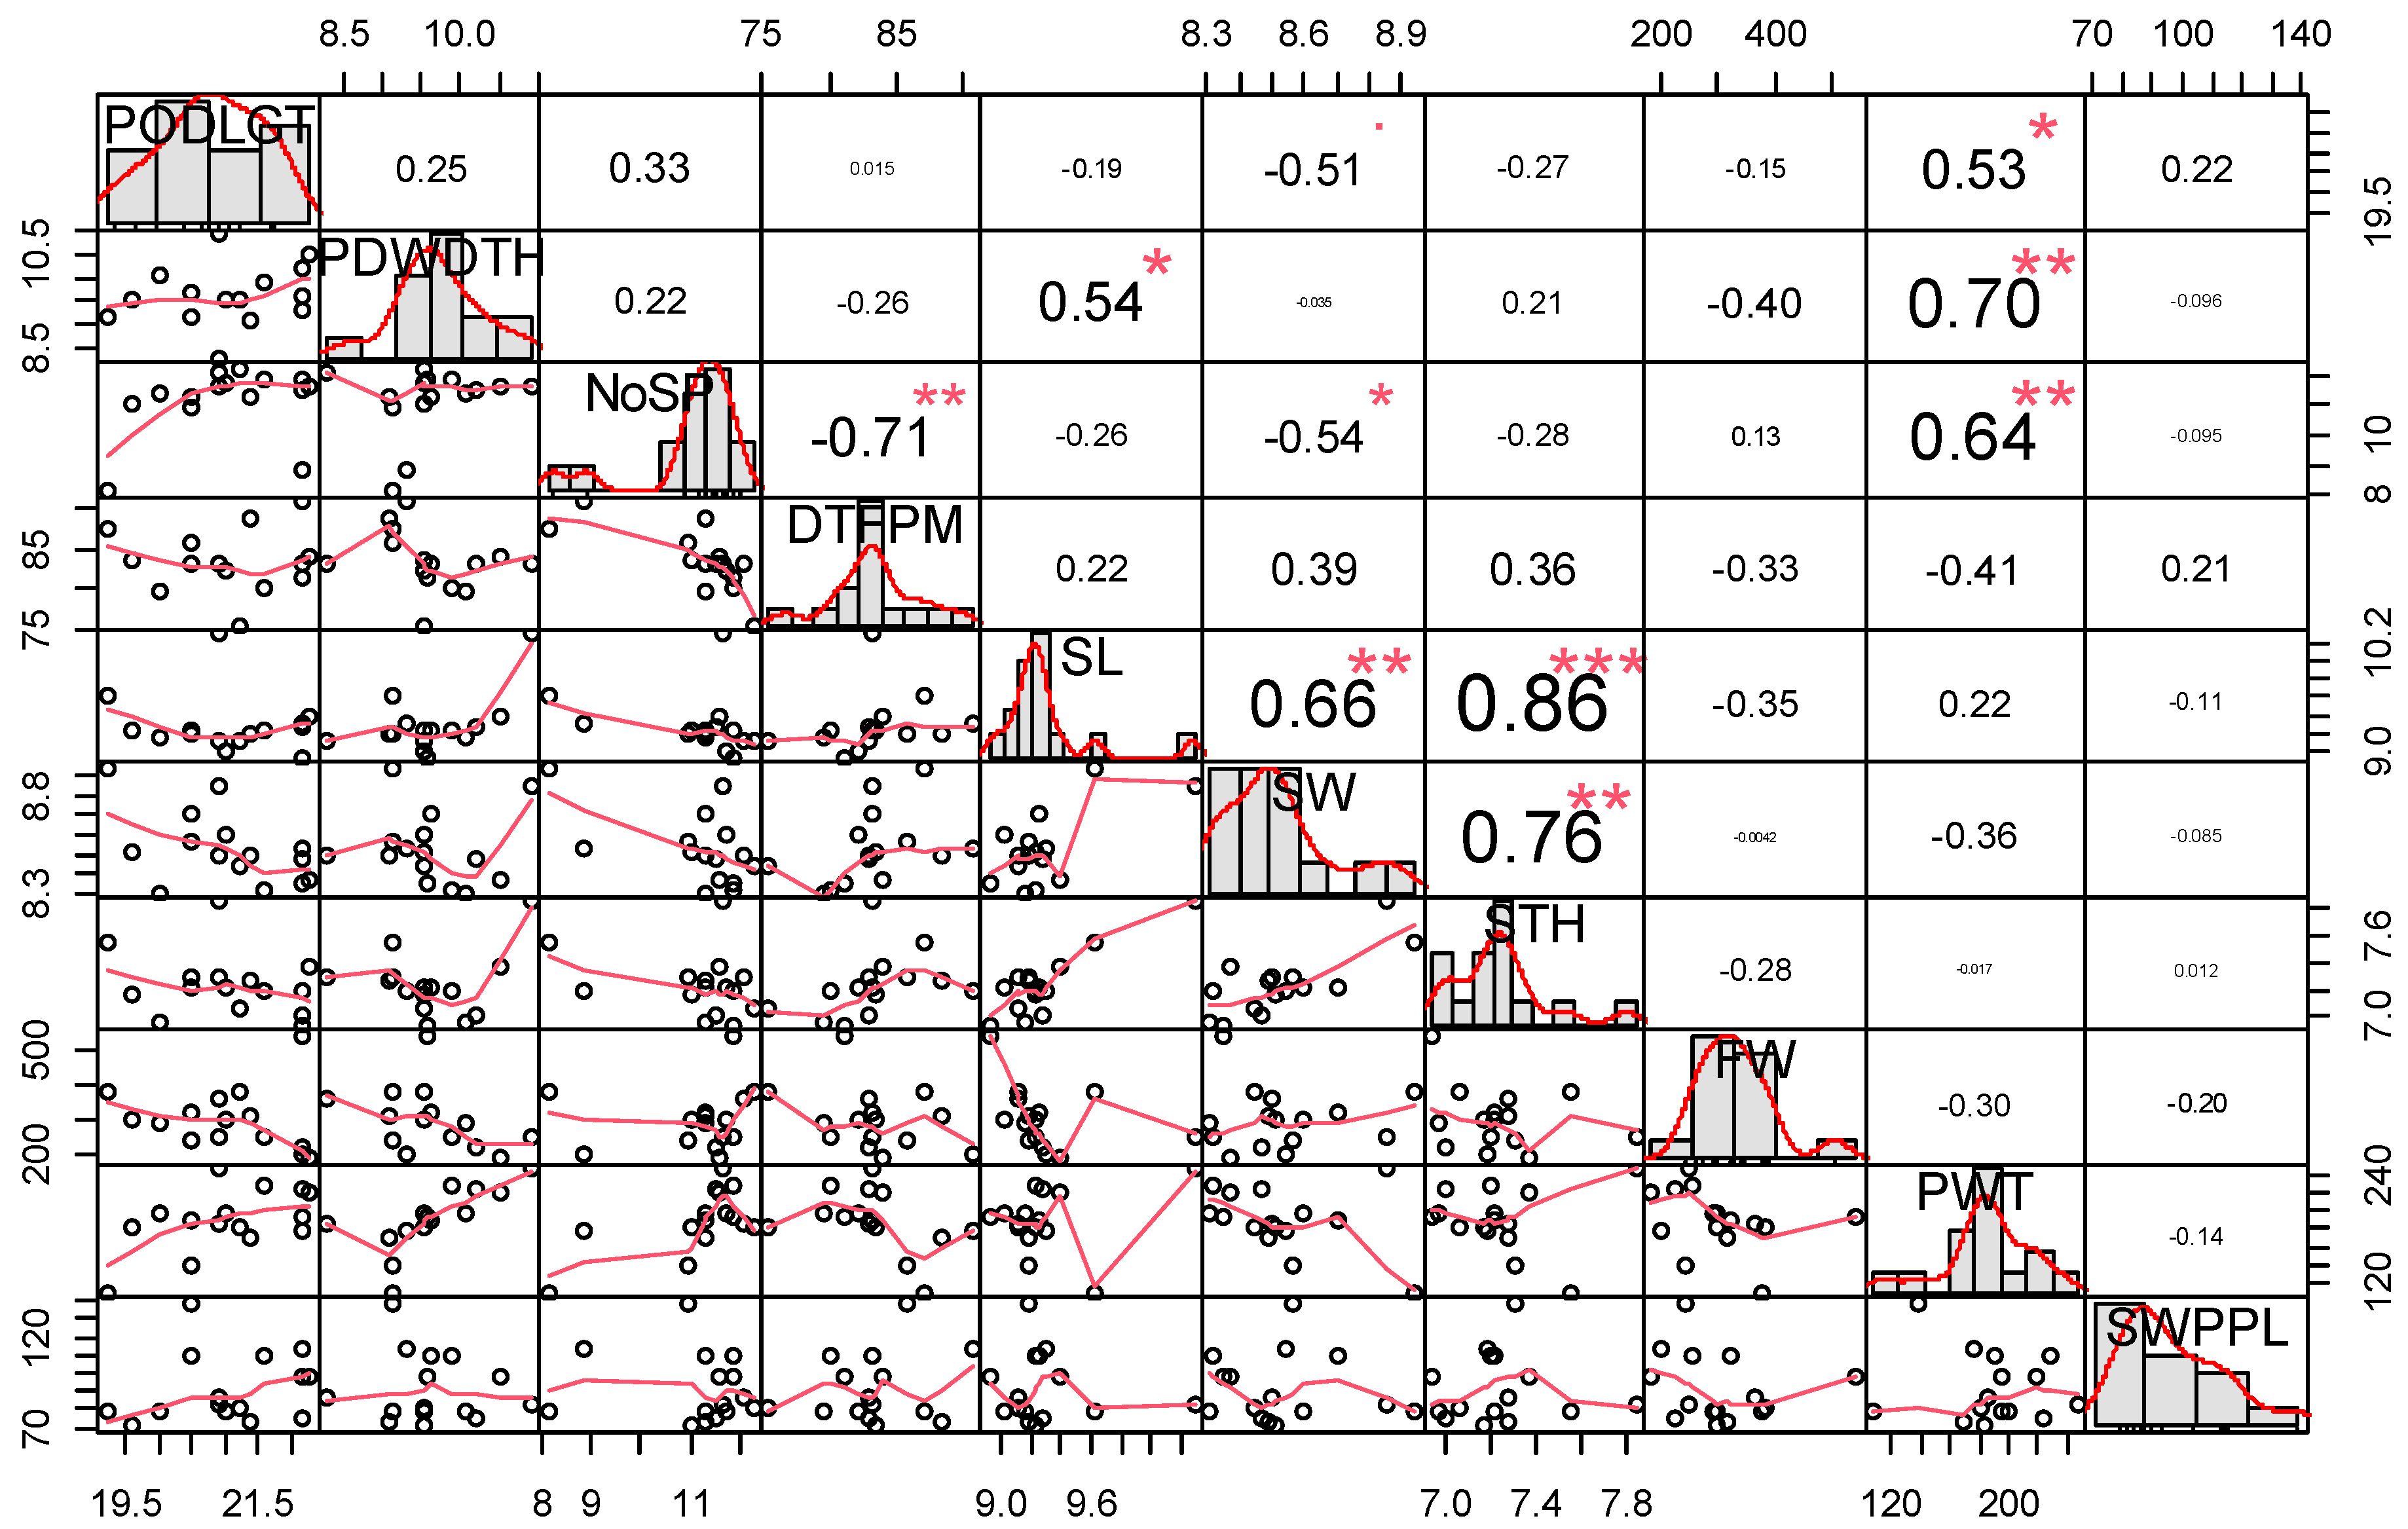
3.4. Phenotypic Correlation among Measured Agronomic Traits

The phenotypic correlation among evaluated winged bean traits are presented in Figure 3. A significant and positive correlation was observed between pod weight and pod length (r = 0.53, p < 0.05). Pod width exhibited a positive and significant correlation with seed length (r = 0.54, p < 0.05) and pod weight (r = 0.70, p < 0.01). Significant correlations were also recorded between number of seeds per pod and pod weight (0.64, p < 0.01). Seed thickness had significant correlations with seed length (r = 0.86, p < 0.001), seed width (r = 0.76, p < 0.01) and number of seeds per pod (0.64). Seed length was significantly correlated with seed weight (r = 0.66, p < 0.01) and seed thickness (r = 0.86, p < 0.0001), seed weight (r = 0.76, p < 0.01). A negative but significant correlation was observed for days to first plant maturity and number of seeds per pod (r = −0.71, p < 0.01).

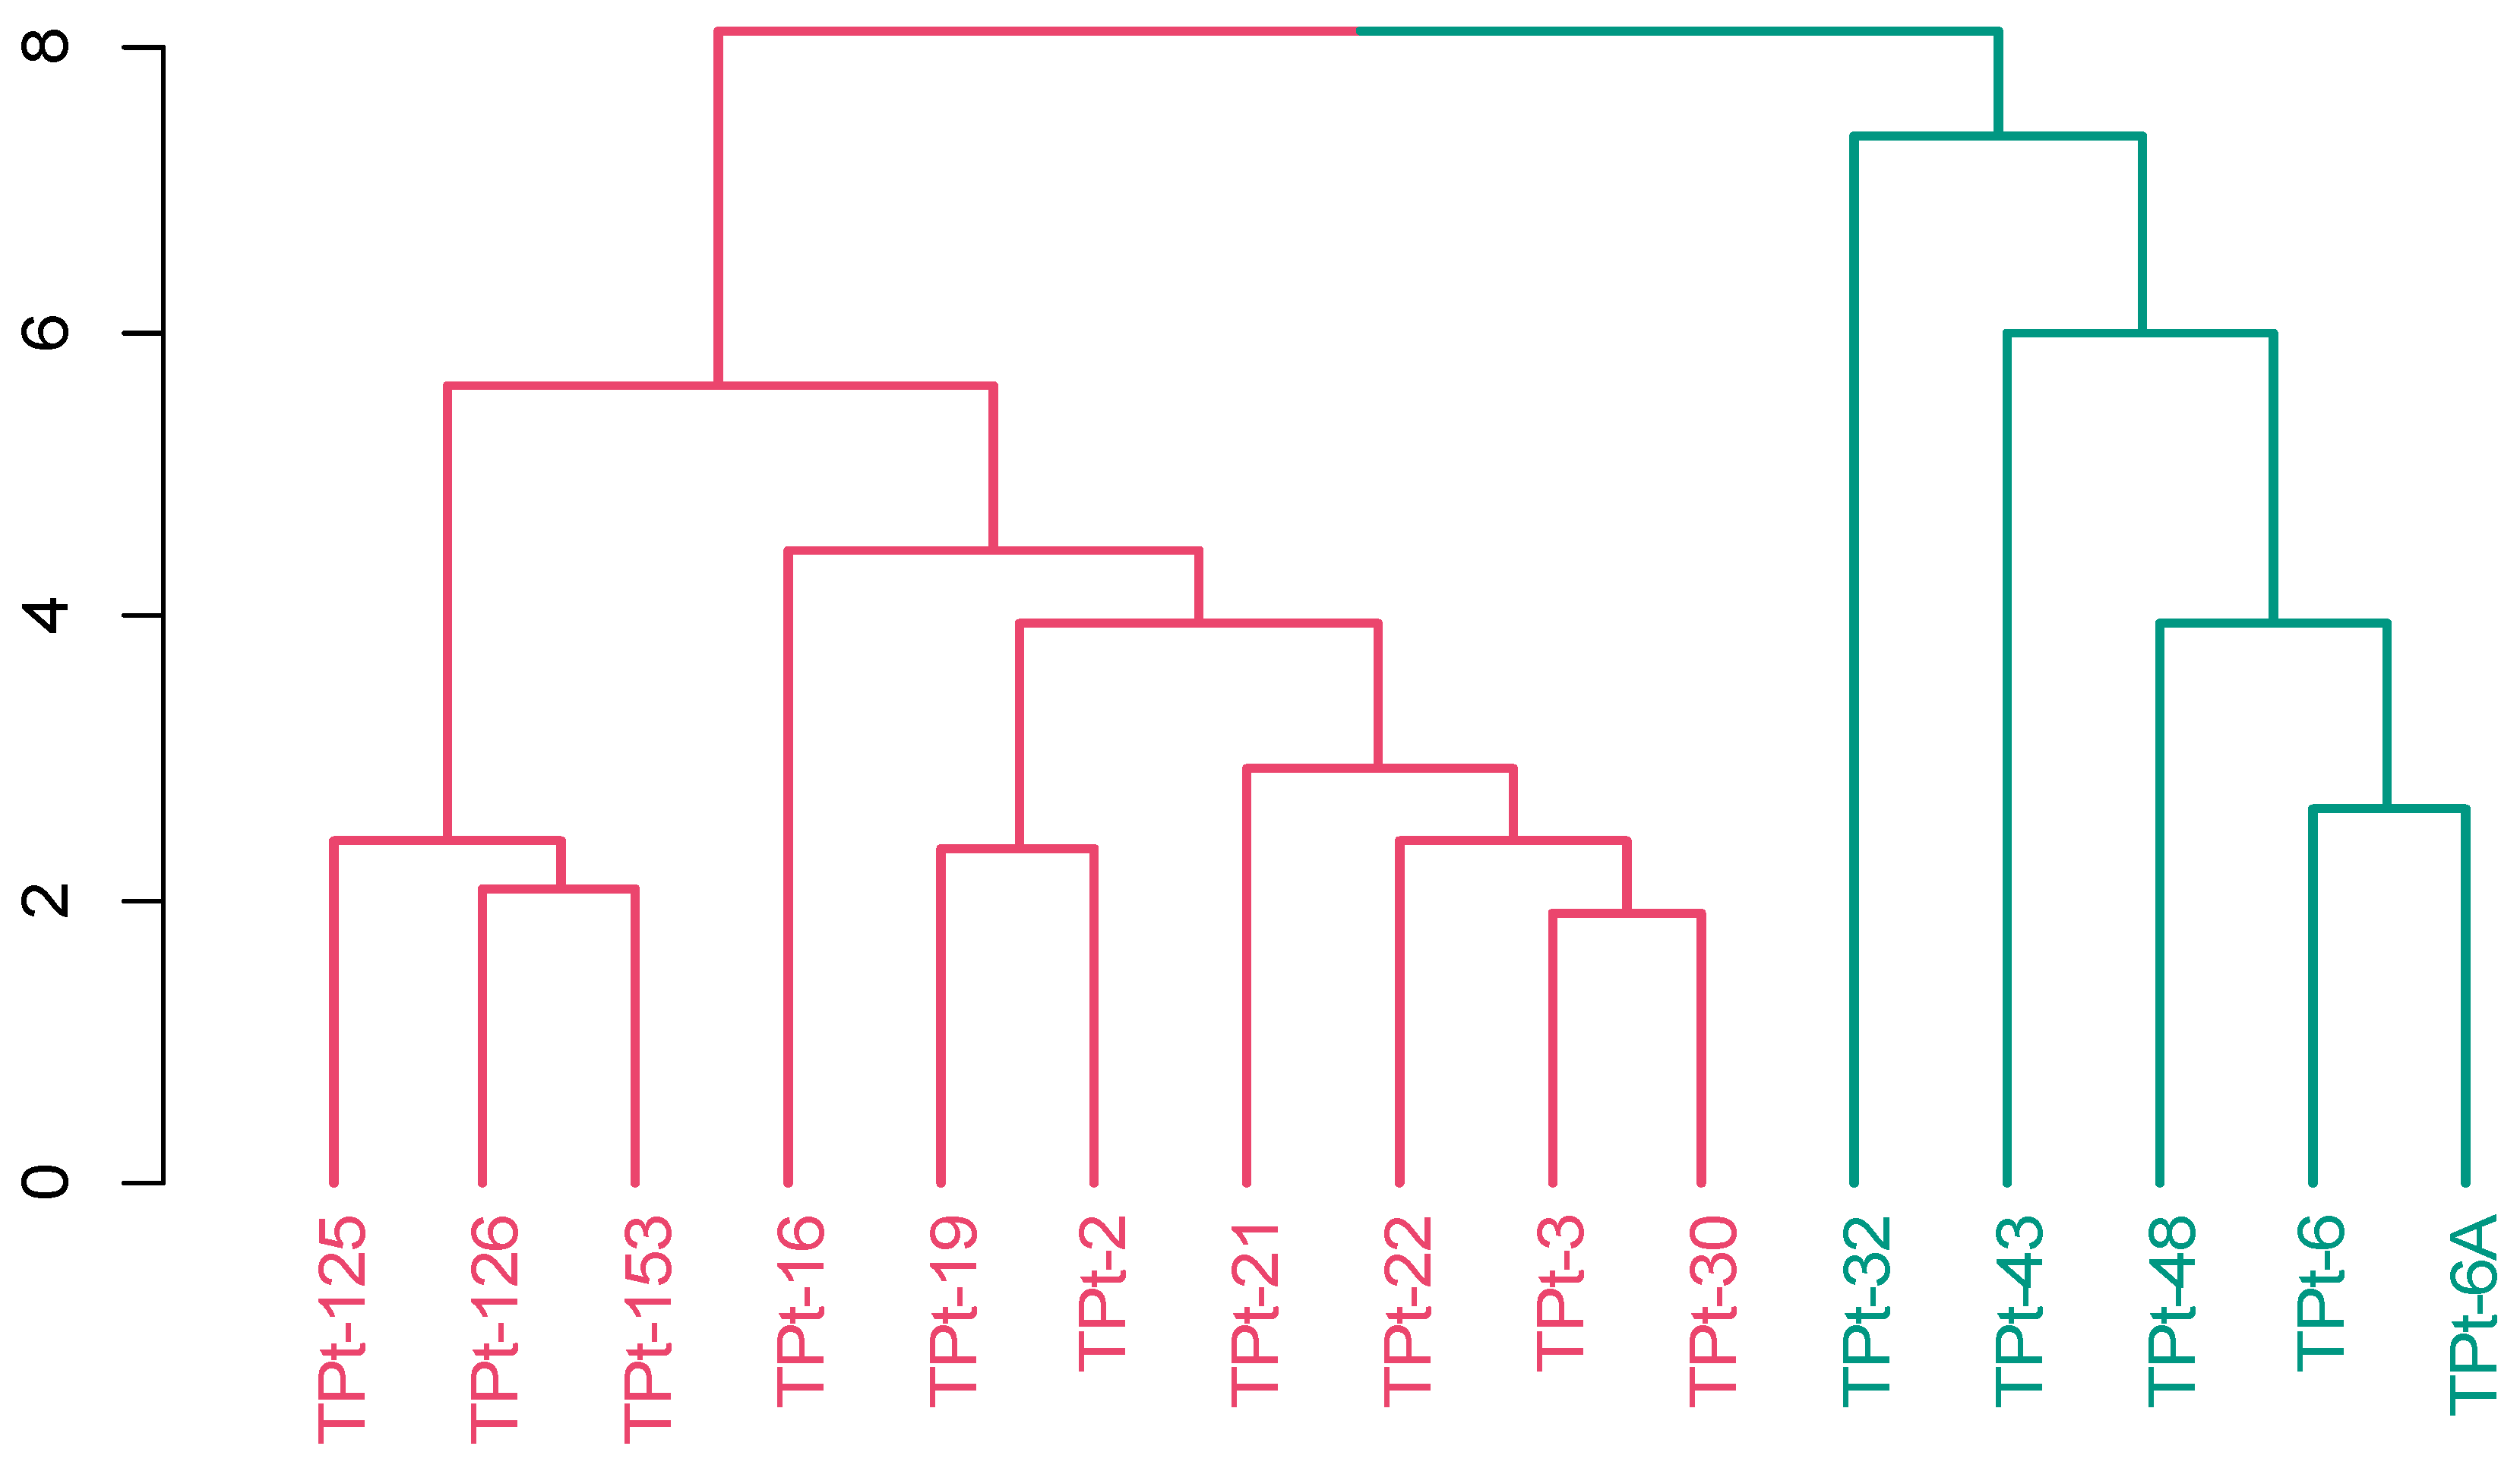
3.5. Phenotypic Diversity among 15 Studied Winged Bean Accessions Based on Gower’s Distance

Hierarchical clustering based on Gower’s distance using the evaluated agronomic traits produced two clusters (Figure 4). Cluster one consisted of ten accessions (TPt-125, TPt-126, TPt-153, TPt-16, TPt-19, TPt-2, TPt-21, TPt-22, TPt-3 and TPt-30) characterized by seed length, seed width, and seed thickness, while cluster two had five accessions (TPt-32, TPt-43, TPt-48, TPt-6, and TPt-6A) characterized by number of seeds per plot and days to first plant maturity (Table 6).

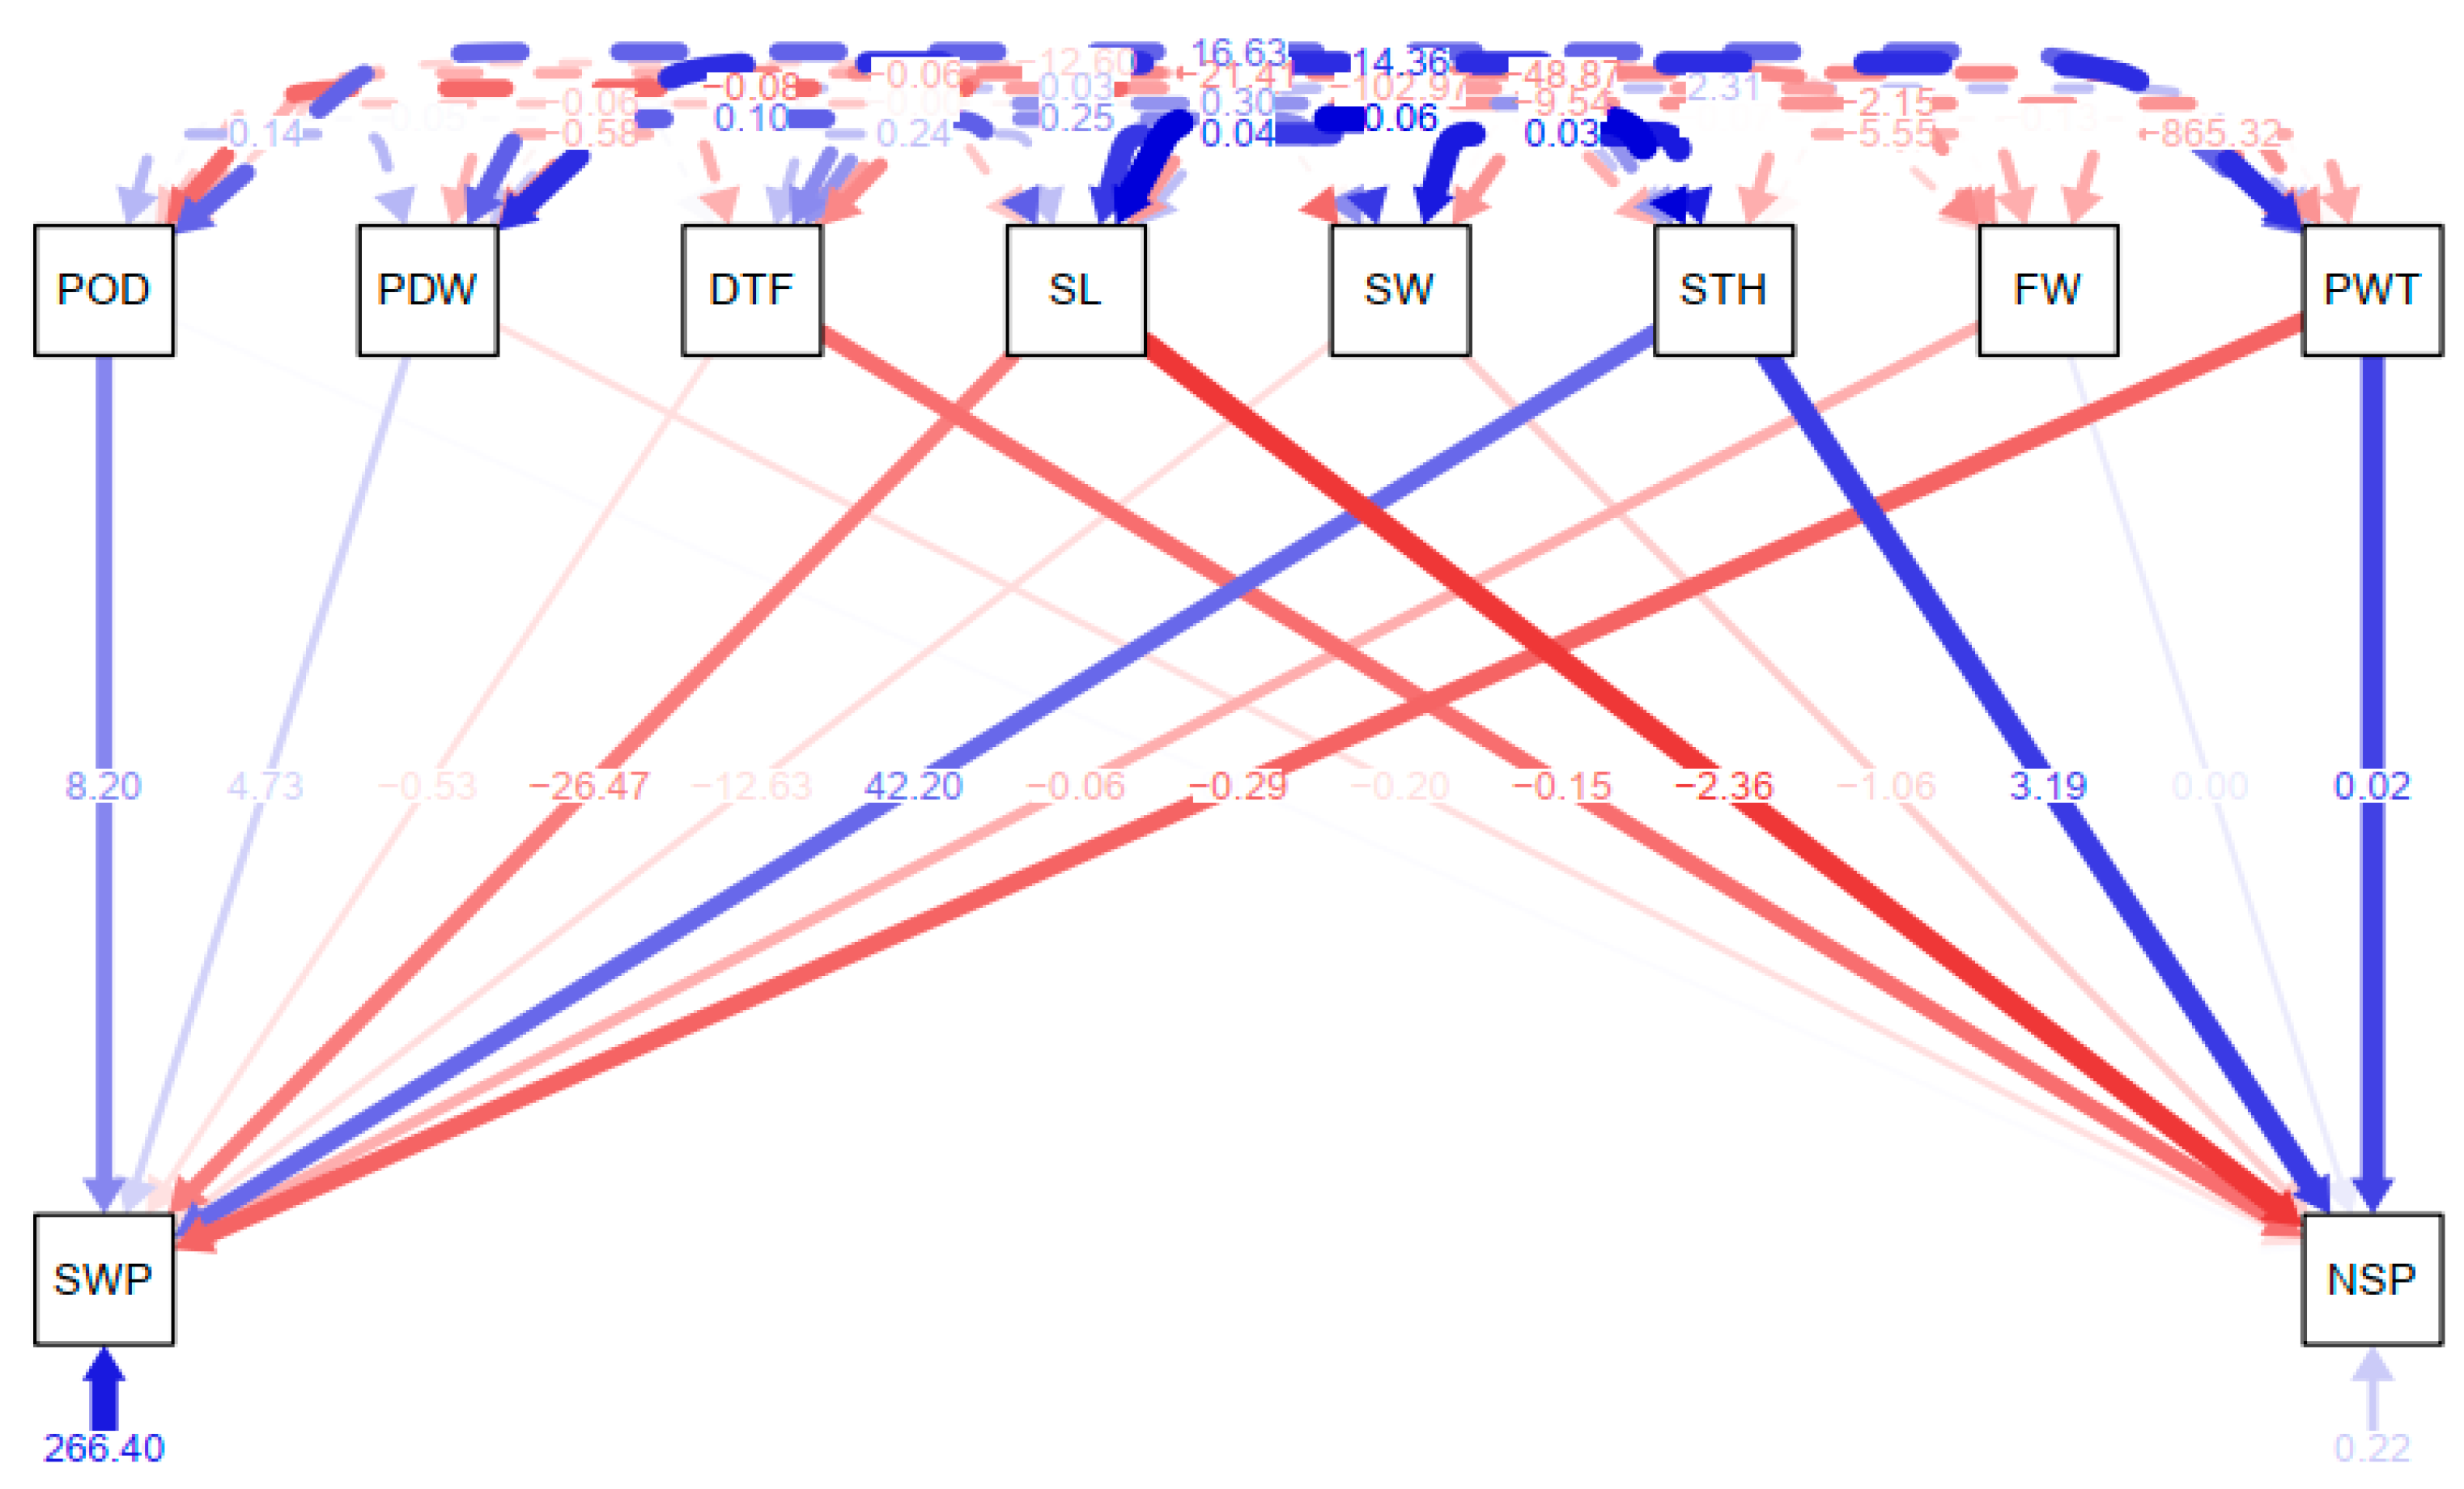
3.6. Path Coefficient Analysis for Correlated Agronomic Traits

The path analysis conducted to depict the direct effects of agronomic traits on the yield components for suitability for indirect selection is presented in Figure 5. Structural equation modeling was deployed where seed weight and number of seeds per pod were considered response variables against other correlated agronomic traits. The chi-square test of the model fit was moderately significant (χ2 (4) = 2.455, p = 0.653). Overall, fit indices were in good range (RMSEA = 0.00 [0.00, 0.09], p = 0.81; CFI = 1.00; SRMR = 0.01). Pod weight significantly predicted the number of seeds per pod (b = 0.02, SE = 0.007, p = 0.003) such that a one-unit increase in pod weight will bring about a 0.02-unit increase in number of seeds per pod. Seed thickness significantly predicted the number of seeds per pod (b = 3.19, SE = 1.38, p = 0.021) such that a one-unit increase in seed thickness was associated with a 3.19-unit increase in number of seeds per pod. Days to maturity significantly predicted the number of seeds per pod (b = −0.15, SE = 0.054, p = 0.006) such that a one-unit increase in days to maturity was associated with a 0.15-unit decrease in the number of seeds per pod.

3.7. Genetic Diversity among the 15 Winged Bean Accessions

3.7.1. Polymorphisms Detected by Simple Sequence Repeats (SSRs)

The SSR markers, allele frequency, gene diversity, number of alleles amplified in each locus, and PIC values are presented in Table 7. The ten SSRs loci detected a total of 42 polymorphic alleles. The number of alleles for each SSR loci ranged between 3 and 6, with an average value of 4.2 alleles. The PIC values varied from 0.0888 to 0.4606, with a mean of 0.2178. SSRs 879, and 3111, both tetra nucleotide primers detected the highest number of fragments (six) and, therefore, were the most informative primers while each of SSRs 24,704, 747, and 854 gave the least number of fragments (three).

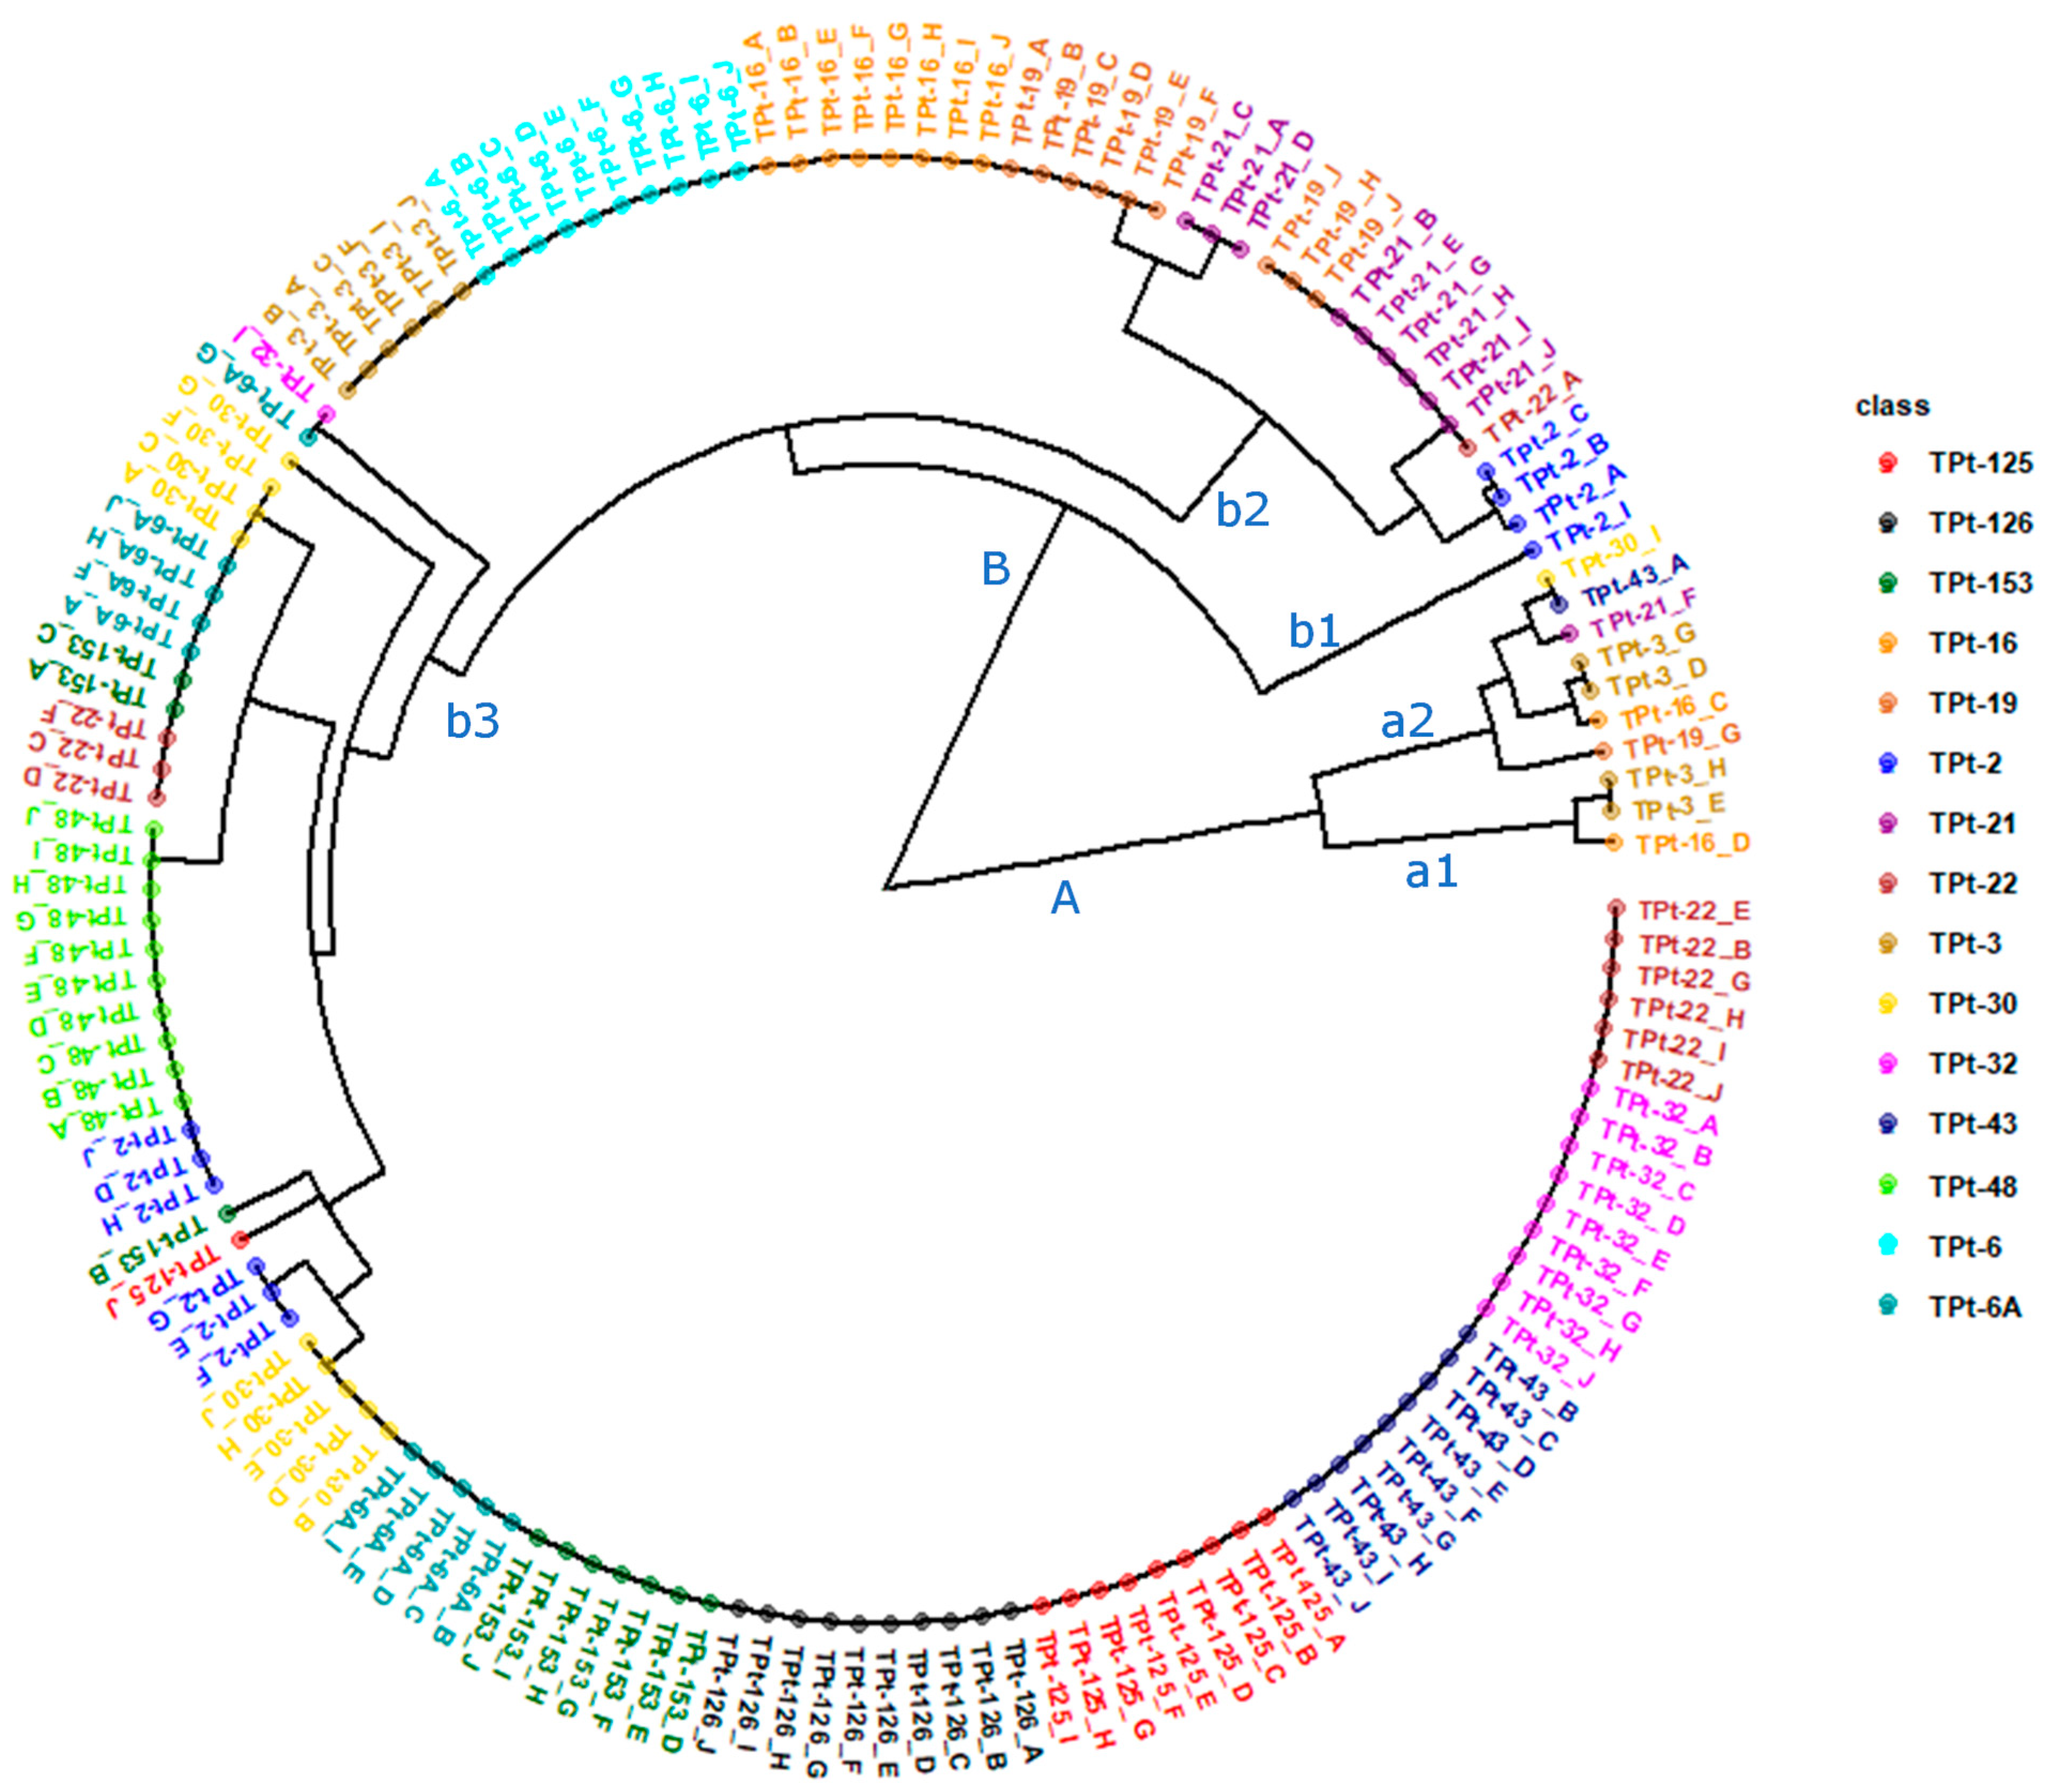
3.7.2. Analysis of Molecular Variance (AMOVA) and Cluster Analysis

The AMOVA of the 150 individuals sampled from the 15 accessions (10 plants per accession) showed between-accession variation of 5% and within-accession variation of 95%. This suggests the presence of low genetic differentiation among the accessions as a whole germplasm. However, high intra accession diversity exists among the individuals of each accession (Table 8). The output of the Jaccard dissimilarity matrix revealed the presence of two genetic groups or clusters—A and B (Figure 6). Cluster A can be subdivided into two subgroups (a1 and b1) comprising individuals from different winged bean accessions while cluster B can be partitioned into three subgroups (b1, b2, and b3). Though the 150 individuals were from 15 accession, the results did not show a complete segregation of the ten plants from each accession into the same subgroup for many accessions. Only three accessions (TPt-6, TPt-126, and TPt-48) showed no intra-accession variation. Each of the nine other accessions (TPt-32, TPt-43, TPt-125, TPt-16, TPt-153, TPt-19, TPt-21, TPt-22, and TPt-3) had over 50% of their individuals grouped together. The rest of the accessions had less than 50% of their individuals clustered together.

4. Discussion

4.1. Variability in Measured Traits as Identifiers of Gene Reservoirs for Winged Bean Improvement

Winged bean production is challenged by numerous constraints such as low yield, prolonged life cycle, photoperiodic sensitivity, and indeterminate growth habit and flowering, which require the attention of legume breeders in countries where the crop exists [27,28]. The genetic variability existing among the winged bean accessions for the agronomic traits considered in this study suggests the presence of gene reservoir for winged bean improvement. Breeding for improved yield and other desirable agronomic traits can be challenging for breeders especially with crops with minimal information on the indices that determine response to selection [29]. The medium to high broad-sense heritability estimates observed for seed weight, pod weight, fodder weight, seed width, number of seeds per pod, and pod length in this study are good indicators of the proportion of the variation among accession means that is due to the variation in genotypic effects for the traits, suggesting the repeatability in performance for the traits when the trials are repeated. These traits made major contributions to the observed genetic variability among the studied winged bean accessions as detected through moderate-to-high genetic correlation coefficient estimates. Previous studies have also reported high heritability estimates for seed weight, pod weight, fodder weight, seed width, and number of seeds per pod [5]. Genetic variability is particularly useful as it facilitates the selection of good progenitors for progeny development from where selection can be applied towards the development of superior winged bean varieties [30]. In our study, the ten accessions were grouped together based on maturity, longer, wider, and thicker seeds, and another cluster with five accessions were grouped together largely by higher number of seeds per pod and earliness.

4.2. Potentials of Measured Traits for Indirect Selection in Winged Bean Improvement

The positive and strong relationships among pod weight, pod length, pod width, and number of seeds per pod, as well as between seed length and seed width and thickness, could provide a useful guide for correlated response during selection. Adegboyega et al. [5], Tanzi et al. [27], and Schinavito et al. [28] similarly observed positive relationships between seed yield and other traits (pod width, seed length, fodder weight, and pod weight) in a panel of accessions studied for genetic diversity and the impact of staking on winged bean production. Some of the challenges for the crop’s improvement are lengthy life cycle, photoperiodic sensitivity, and indeterminate growth habit and flowering of the genotypes [31]. Thus, any means to select for improved yield and good seed characteristics through indirect selection for other correlated agronomic traits will be of advantage, as this study revealed that higher productivity depicted by number of seeds per pod could be predicted by heavier pods, longer and thicker seeds, and earliness.

4.3. SSR Markers Revealed Intra-Accession Genetic Variation within the Winged Bean Germplasm

For effective conservation and utilization of germplasm in breeding programs, it is necessary to assess the genetic diversity using molecular tools [32]. In our study, 10 SSR loci were used to assess the genetic diversity in the studied accessions to ascertain the presence or absence of intra-accession variability. This was targeted at providing useful information that will facilitate proper conservation and utilization of assembled winged bean germplasm.
The amplification of the SSR loci recorded an average PIC value of 0.22, which is comparable to recent studies on pigeon pea [33], munged bean [8], and common bean [34], although this value is lower than that reported for cowpea [31] and Bambara groundnut [35]. The observed low PIC values in this study could arise from the small population size used for genotyping as well as the limited number of SSR primers used for profiling. In previous studies, Chandra et al. [7] successfully used RAPDs and ISSRs to capture considerable genetic diversity among 24 winged bean accessions in which a PIC of 0.17 and 0.213 were reported for RAPDs and ISSR primers, respectively. Wong et al. [6] equally reported a PIC of 0.16 for 18 primers and suggested that it might be because of the low validation rate of polymorphic markers that were screened, which was in turn due to the limited number of accessions that were screened. The PIC values are expected to increase with increased number of accessions covering a broader range of geographical origins.
In this study, the analysis of molecular variance revealed a within-group variability of 95% as compared to between groups of 5%, which suggests the presence of large intra-accession variability compared to inter-accession variability. This is not surprising, as the accessions used in this study were sourced from different locations/origins/countries, mostly from local farmers and conserved in the IITA- gene bank. The genetic analysis further revealed the nature of the intra-accession similarities and dissimilarities that exist within germplasm. It should be noted that, in the clustering the genotypes, geographical origin was not considered as a co-factor.
Our results may not necessarily indicate a high level of genetic diversity in the studied accessions as diversity is not conditioned by the allelic divergence at many loci only but also by complementary alleles with dominance or epistatic genetic effects [36,37]. However, the existence of a high level of intra-accession diversity in the germplasm has been established. The outcomes of the phenotypic characterization and molecular analysis presented in this report may form the basis for further studies aimed at exploiting existing variation for winged bean improvement.

Author Contributions

Conceptualization, T.E.O.S., M.A.A. and M.T.A.; Methodology, T.E.O.S., M.A.A. and O.A.O.; Supervision M.A.A. and M.T.A.; Writing original draft, T.E.O.S.; Manuscript review and editing, T.E.O.S., M.A.A., A.A.B., I.I.A., O.A.O., B.F. and M.T.A. All authors have read and agreed to the published version of the manuscript.

Funding

This research is funded by the Global Crop Diversity Trust and Consortium of International Agricultural Research Centers (CGIAR) through Genetic Resources Centre IITA.

Data Availability Statement

Data can be obtained upon request from the corresponding author.

Acknowledgments

The authors express gratitude to the seed bank staff of the Genetic Resources Center, IITA, Ibadan, staff members of Bioscience Centre, IITA, Ibadan and Inqaba Biotec South Africa and West Africa Ltd.

Conflicts of Interest

The authors declare that the research was conducted in the absence of any potential conflict of interest.

References

  1. Tanzito, G.; Ibanda, P.A.; Ocan, D.; Lejoly, J. Use of charcoal (biochar) to enhance tropical soil fertility: A case of Masako in Democratic Republic of Congo. J. Soil Sci. Environ. Manag. 2020, 11, 17–29. [Google Scholar] [CrossRef]
  2. Sriwichai, S.; Monkham, T.; Sanitchon, J.; Jogloy, S.; Chankaew, S. Dual-Purpose of the Winged Bean (Psophocarpus tetragonolobus (L.) DC.), the Neglected Tropical Legume, Based on Pod and Tuber Yields. Plants 2021, 10, 1746. [Google Scholar] [CrossRef] [PubMed]
  3. Aletor, V.A.; Aladetimin, O.O. Proximate composition of some underutilized Nigeria legumes. Nahrung 1989, 33, 999–1007. [Google Scholar] [CrossRef] [PubMed]
  4. Koshy, E.P.; John, P.; Scaria, S. Winged bean: The wings that carry away malnutrition. Acad. Rev. 1999, 3, 77–80. [Google Scholar]
  5. Adegboyega, T.T.; Abberton, M.T.; AbdelGadir, A.H.; Dianda, M.; Maziya-Dixon, B.; Oyatomi, O.A.; Ofodile, S.; Babalola, O.O. Evaluation of Nutritional and Antinutritional Properties of African Yam Bean (Sphenostylis stenocarpa (Hochst ex. A. Rich.) Harms.) Seeds. J. Food Qual. 2020, 2020, 6569420. [Google Scholar] [CrossRef]
  6. Wong, Q.N.; Tanzi, A.S.; Ho, W.K.; Malla, S.; Blythe, M.; Karunaratne, A.; Massawe, F.; Mayes, S. Development of Gene-Based SSR Markers in Winged Bean (Psophocarpus tetragonolobus (L.) DC.) for Diversity Assessment. Genes 2017, 8, 100. [Google Scholar] [CrossRef]
  7. Mohanty, C.S.; Verma, S.; Singh, V.; Khan, S.; Gaur, P.; Gupta, P.; Nizar, M.A.; Dikshit, N.; Pattanayak, R.; Shukla, A.; et al. Characterization of winged bean (Psophocarpus tetragonolobus (L.) DC.) based on molecular, chemical and physiological parameters. Am. J. Mol. Biol. 2013, 03, 187–197. [Google Scholar] [CrossRef]
  8. Gupta, S.K.; Bansal, R.; Gopalakrishna, T. Development and characterization of genic SSR markers for mungbean (Vigna radiata (L.) Wilczek). Euphytica 2013, 195, 245–258. [Google Scholar] [CrossRef]
  9. Egan, A.N.; Schlueter, J.; Spooner, D.M. Applications of next-generation sequencing in plant biology. Am. J. Bot. 2012, 99, 175–185. [Google Scholar] [CrossRef]
  10. Omena, B.O.; Nkang, N.A.; Odesola, A.; Kafilat, D.; Okeh, I. Genetic diversity assessment of winged bean (pso-phorcarpus tetragonolobus) accessions revealed by Inter-Simple Sequence Repeat (ISSR) markers. J. Plant Biol. Crop Res. 2020, 3, 1014. [Google Scholar]
  11. Kuznetsova, A.; Brockhoff, P.B.; Christensen, R.H.B. lmerTest Package: Tests in linear mixed effects models. J. Stat. Softw. 2017, 82, 1–26. [Google Scholar] [CrossRef]
  12. Kresovich, S. Quantitative genetics in maize breeding. Field Crops Res. 1990, 23, 78–79. [Google Scholar] [CrossRef]
  13. Johnson, H.W.; Robinson, H.F.; Comstock, R.E. Genotypic and Phenotypic Correlations in Soybeans and Their Implications in Selection 1. Agron. J. 1955, 47, 477–483. [Google Scholar] [CrossRef]
  14. Deshmukh, S.; Basu, M.; Reddy, P. Genetic variability, character association and path coefficients of quantitative traits in Virginia bunch varieties of groundnut. Indian J. Agric. Sci. 1986, 56, 816–821. [Google Scholar]
  15. Kassambara, A.; Mundt, F. Package ‘Factoextra’, CRAN-R Packag. 2020. Available online: http://cran.nexr.com/web/packages/factoextra/factoextra.pdf (accessed on 4 April 2023).
  16. R Core Team. R: A Language and Environment for Statistical Computing; R Foundation for Statistical Computing: Vienna, Austria, 2017. [Google Scholar]
  17. Galili, T. Dendextend: An R package for visualizing, adjusting, and comparing trees of hierarchical clustering. Bioinformatics 2015, 31, 3718–3720. [Google Scholar] [CrossRef] [PubMed]
  18. Gu, Z.; Gu, L.; Eils, R.; Schlesner, M.; Brors, B. circlize implements and enhances circular visualization in R. Bioinformatics 2014, 30, 2811–2812. [Google Scholar] [CrossRef]
  19. Charrad, M.; Ghazzali, N.; Boiteau, V.; Maintainer, A.N. Determining the Best Number of Clusters in a Data Set. Cran. 2015. Submitted 13 April 2015; published 2nd May 2022 13:01:42 UTC. Available online: https://www.google.com.hk/url?sa=t&rct=j&q=&esrc=s&source=web&cd=&ved=2ahUKEwiPko76jI2AAxVO6WEKHR5aCDIQFnoECBoQAQ&url=https%3A%2F%2Fcran.r-project.org%2Fweb%2Fpackages%2FNbClust%2FNbClust.pdf&usg=AOvVaw0_6opCPIS9Hd4qstjJ_HW0&opi=89978449 (accessed on 4 April 2023).
  20. Rosseel, Y. lavaan: AnRPackage for Structural Equation Modeling. J. Stat. Softw. 2012, 48, 1–36. [Google Scholar] [CrossRef]
  21. Epskamp, S. semPlot: Unified Visualizations of Structural Equation Models. Struct. Equ. Model. A Multidiscip. J. 2015, 22, 474–483. [Google Scholar] [CrossRef]
  22. Dellaporta, S.L.; Wood, J.; Hicks, J.B. A plant DNA mini preparation: Version II. Plant Mol. Biol. Report. 1983, 1, 19–21. [Google Scholar] [CrossRef]
  23. Vatanparast, M.; Shetty, P.; Chopra, R.; Doyle, J.J.; Sathyanarayana, N.; Egan, A.N. Transcriptome sequencing and marker development in winged bean (Psophocarpus tetragonolobus; Leguminosae). Sci. Rep. 2016, 6, 29070. [Google Scholar] [CrossRef]
  24. Chatterji, S.; Pachter, L. Reference based annotation with GeneMapper. Genome Biol. 2006, 7, R29. [Google Scholar] [CrossRef] [PubMed]
  25. Liu, K.; Muse, S.V. Power Marker integrated analysis environment for genetic marker data. Bioinformatics 2005, 29, 2128–2129. [Google Scholar] [CrossRef] [PubMed]
  26. Peakall, R.; Smouse, P. GenAlEx 6.5: Genetic analysis in Excel. Population genetic software for teaching and research-an update. Bioinformatics 2012, 28, 2537–2539. [Google Scholar] [CrossRef] [PubMed]
  27. Tanzi, A.S.; Ho, W.K.; Massawe, F.; Mayes, S. Development and interaction between plant architecture and yield-related traits in winged bean (Psophocarpus tetragonolobus (L.) DC.). Euphytica 2019, 215, 36. [Google Scholar] [CrossRef]
  28. Schiavinato, I.V.M.A. Influence of photoperiod and temperature on the development of winged bean plants. RBrasFisiolVeg 1996, 8, 105–110. [Google Scholar]
  29. Adejumobi, I.; Agre, A.P.; Onautshu, O.D.; Adheka, G.J.; Cipriano, M.I.; Jean-Claude, L.K.; Joseph, L.M. Assessment of yam landraces (Dioscorea spp.) of DR Congo for reaction to pathological diseases, yield potential and tuber quality characteristics. Agronomy 2022, 12, 599. [Google Scholar] [CrossRef]
  30. Amoo, I.A.; Adebayo, O.T.; Oyeleye, A.O. Chemical evaluation of winged beans. Afr. J. Food Agric. Nutr. Dev. 2006, 6. [Google Scholar] [CrossRef]
  31. Gupta, S.K.; Gopalakrishna, T. Development of unigene-derived SSR markers in cowpea (Vigna unguiculata) and their transferability to other Vigna species. Genome 2010, 53, 508–523. [Google Scholar] [CrossRef]
  32. Li, G.; Ra, W.-H.; Park, J.-W.; Kwon, S.-W.; Lee, J.-H.; Park, C.-B.; Park, Y.-J. Developing EST-SSR markers to study molecular diversity in Liriope and Ophiopogon. Biochem. Syst. Ecol. 2011, 39, 241–252. [Google Scholar] [CrossRef]
  33. Dutta, S.; Kumawat, G.; Singh, B.P.; Gupta, D.K.; Singh, S.; Dogra, V.; Gaikwad, K.; Sharma, T.R.; Raje, R.S.; Bandhopadhya, T.K.; et al. Development of genic-SSR markers by deep transcriptome sequencing in pigeonpea [Cajanus cajan (L.) Millspaugh]. BMC Plant Biol. 2011, 11, 17. [Google Scholar] [CrossRef]
  34. Blair, M.W.; Hurtado, N.; Chavarro, C.M.; Muñoz-Torres, M.C.; Giraldo, M.C.; Pedraza, F.; Tomkins, J.; Wing, R. Gene-based SSR markers for common bean (Phaseolus vulgaris L.) derived from root and leaf tissue ESTs: An integration of the BMc series. BMC Plant Biol. 2011, 11, 50. [Google Scholar] [CrossRef] [PubMed]
  35. Molosiwa, O.O.; Aliyu, S.; Stadler, F.; Mayes, K.; Massawe, F.; Kilian, A.; Mayes, S. SSR marker development, genetic diversity and population structure analysis of Bambara groundnut [Vigna subterranea (L.) Verdc.] landraces. Genet. Resour. Crop Evol. 2015, 62, 1225–1243. [Google Scholar] [CrossRef]
  36. Adebayo, M.A.; Kolawole, A.O.; Adebayo, T.A. Assessment of new generation of drought-tolerant maize (Zea mays L.) hybrids for agronomic potential and adaptation in the derived savanna agro-ecology of Nigeria. Int. J. Agron. Agric. Res. 2015, 7, 45–54. [Google Scholar]
  37. Adebayo, M.A.; Menkir, A.; Gedil, M.; Blay, E.; Gracen, V.; Danquah, E.; Funmilayo, L. Diversity assessment of drought tolerant exotic and adapted maize (Zea mays L.) inbred lines with microsatellite markers. J. Crop Sci. Biotechnol. 2015, 18, 147–154. [Google Scholar] [CrossRef]
Figure 1. Plate (A,B): Winged bean germination test: Plate (A) from incubation at 10 days after sowing, and Plate (B) at 15 days after sowing in the germination room.
Agronomy 13 02150 g001
Figure 2. PCA screen plot (A), variable contribution (B) and accession biplot (C) accounting for the total variability observed in PC1 and PC2. PODLGT = Pod length; PDWDTH = Pod width; NoSP = Number of seeds per pod; DTFPM = Days to first plant maturity; SL = Seed length; SW = Seed width; STH = Seed thickness; FW = Fodder weight; PWT = Pod weight; SWPPL = Seed weight.
Agronomy 13 02150 g002
Figure 3. Pearson’s correlation coefficients among measured agronomic traits. PODLGT = Pod length; PDWDTH = Pod width; NoSP = Number of seed per pod; DTFPM = Days to first plant maturity; SL = Seed length; SW = Seed width; STH = Seed thickness; FW = Fodder weight; PWT = Pod weight; SWPPL = Seed weight; *, **, *** = significant at p < 0.05, 0.01, and 0.0001, respectively.
Agronomy 13 02150 g003
Figure 4. Hierarchical clustering showing the grouping of 15 winged bean accessions into two clusters using ten agronomic traits based on the Gower’s dissimilarity matrix Cluster one (Red) and cluster two (Green);Y-axis represent the scale of genetic distance between the accessions.
Agronomy 13 02150 g004
Figure 5. Path coefficient analysis between response and independent winged bean variables. POD = Pod length; PDW = Pod width; NSP = Number of seeds per pod; DTF = Days to first plant maturity; SL = Seed length; SW = Seed width; STH = Seed thickness; FW = Fodder weight; PWT = Pod weight; SWP = Seed weight. (Red color indicates direct negative impact while Blue color indicates direct positive impact).
Agronomy 13 02150 g005
Figure 6. Genetic relationships of 150 individuals obtained from 15 winged bean accessions visualized with Jaccard’s dissimilarity matrix; where A and B represents the two major group while a1, a2, b1, b2, and b3 are the sub clusters.
Agronomy 13 02150 g006
Table 1. Accession numbers, sources, and qualitative morphological characters of the studied 15-winged bean accessions.
S/NAccession NoSourceSCSSFLCSTEMCLRPPSPPSLSS
1TPt-2NigeriaBrownish orangeOvalPastel violetGreenabsentFlat on sutureDeltoid-large
2TPt-3NigeriaYellowish brownOvalLight violetpurplepresentFlat on sutureOvate Lanceolate-medium
3TPt-6NigeriaYellowish brownOvalPastel violetGreenpresentFlat on sideOvate-large
4TPt-16IndonesiaBrownish orangeRoundLight violetGreenabsentFlat on sideOvate
Lanceolate-large
5TPt-19NigeriaYellowish brownOvalPale blueGreenabsentFlat on sutureDeltoid-large
6TPt-21Papua New GuineaViolet brownRoundLight violetGreenabsentFlat on sidesDeltoid-medium
7TPt-22Papua New GuineaBrownish YellowRoundPastel violetpurpleabsentFlat on sidesDeltoid-large
8TPt-32UnknownYellowish brownOvalPale violetGreenabsentFlat on sutureDeltoid-large
9TPt-43UnknownTan OvalLight violetGreenish purple presentFlat on sidesDeltoid-large
10TPt-48UnknownYellowish brownOvalPale violetGreenpresentFlat on sutureDeltoid-large
11TPt-125UnknownTan OvalPastel violetGreenabsentFlat on sutureDeltoid-large
12TPt-126UnknownYellowish brownOvalLight violetGreenabsentFlat on sidesDeltoid-large
13TPt-153UnknownLight brownOvalLight violetGreenish purple absentFlat on sidesDeltoid-large
14TPt-6ANigeriaBrownish orangeOvalLight violetGreenabsentFlat on sutureDeltoid-large
15TPt-30UnknownBrownish orangeRoundPastel violetGreenabsentFlat on sidesDeltoid-large
SC = seed colour, SS = seed shape, FLC = flower colour, STEMCLR = stem colour, PPS = presence of pod speck, LSS = leaf shape and size.
Table 2. Descriptions of the 13 quantitative traits measured on the studied 15-winged bean accessions in 2017 and 2018 seasons.
S/NTraitsDescription of MeasurementCollection Period
1Days to First Flower (DTFF)number of days from planting to when a plant in a plot emerged first flower6 WAP
2Days to First Pod (DTFP),number of days from planting to when a plant in a plot emerged first Pod8 WAP
3Days to 50% Flower (DT5F)number of days from planting to when 50% of the plants in a plot emerged flower6–8 WAP
4Vine length (VL7WAP)measured as the distance between the stem and the last leaf at the top node6–7 WAP
5Number of pods per peduncle (NPPP)counting the number of pods for tagged plant on a plot8–12 WAP
6Pod length (PODLGTH)measured from the point of attachment to the tip of the podAt Maturity
7Pod width (PODWDTH)measured from the edge of one wing to that of the opposite wing at the middle of the podAt Maturity
8Number of seeds per pods (NSP)Counted and averaged over ten tagged plants in a plot.At Harvest
9Seed weight (SW)measured using a sensitive digital scale as mean weight of ten dry seedsAt Harvest
10Seed thickness (STH)measured using a Vennier caliper as mean thickness of ten dry seeds At Harvest
11Seed length (SL)measured using a Vennier caliper as mean length of ten dry seedsAt Harvest
12Seed width (SDTHW)measured using a Vennier caliper as mean width of ten dry seedsAt Harvest
13Fodder weight (FW)measured as the weight of leaf mass or abundance of leaf mass at maturityAt Harvest
WAP = Weeks after planting.
Table 3. Names and sequences of the 10 SSR primers used for winged bean PCR amplification.
SSR Primer NameDyes5′ Forward Sequence 3′5′ Reverse Sequence 3′
SSR-246-Fam ACC TCA TAG AGG AAT ACG ACCAA TAT GTG GAG GAA GTA GA
SSR-704Atto-532GAT TGT TGT GAG ATT GAA GTATG CAA ATA GCT TAC AAA AG
SSR-7476-Fam ACT TTG TGA AAA TGA AGG TA AAT TTA ATA TGG CTG CTA AA
SSR-854Atto-532CTC TAA AAT TCT CAC ACT CGCGA ATT TCT TTC AAT TCT TA
SSR-860Atto-532TGA GGA AAA TAA AAA GAA AACGA GTG TGA GAA TTT TAG AG
SSR-879Atto-565GCA ACA CTT TAG CTC ATT ATGAA CTT CAA CAC TAT TCC AA
SSR-1104Atto-565CTT CAA CTG CTT GTT CTA CT TAA AGA AGA AAG AGG AAA GG
SSR-31116-Fam AGT TGG AAA GTA GCA GAG TTGGT GTG AGA AGC ATA ATA AA
SSR-5819Atto-550AAT AAT GTC AAT TAC GCA GTGAA CTG AAG CCA TGT AGT AG
SSR-11100Atto-550AAT AGA AGG CTT GGT GTCCTT CCT CTT CTC TTC GTC T
Table 4. Traits mean squares, genetic variance, coefficient of variation, and broad-sense heritability for agronomic traits in winged bean.
SourceDFPODLGTPDWDTHNoSPDTFPMSLSWSTHFWPWTSWPPL
Accessions145.45 *2.42 **3.12 **83.78 *0.62 *0.20 **0.33 *49,038 *7227.3 ***2265.16 ***
Year12.991736.4 ***2.46551.19 *0.3370.0240.103678846.06
Accessions * Year143.211.711.7475.14 *0.5150.1220.2710,9272033.2705.95 *
Residual 1.540.991.596.160.5740.2830.41145.0641.54618.75
CV 7.3610.5214.637.396.163.295.7648.0421.9520.85
Mean 21.049.6311.1683.399.288.537.24304.32189.3991.39
δ2g 0.370.120.591.440.020.010.015003.26875.00260.87
δ2p 0.910.401.3213.960.100.030.068173.121204.00377.53
GCV (%) 2.903.576.861.441.511.401.4223.2415.6217.67
PCV (%) 4.536.6010.314.483.472.153.2629.7118.3221.26
H2 (%) 40.9929.2644.3110.3118.9242.7518.8361.2272.6769.10
PODLGT = Pod length; PDWDTH = Pod Width; NoSP = Number of Seeds per Pod; DTFPM = Days to first plant maturity; SL = Seed Length; SW = Seed Width; STH = Seed Thickness; FW = Fodder Weight,; PWT = Pod weight; SWPPL = Seed Weight; δ2g = Genotypic variance; δ2p = Phenotypic variance; GCV = Genotypic coefficient of variation; PCV = Phenotypic coefficient of variation; H2 = Broad-sense heritability; DF = Degree of freedom; CV = Coefficient of variation *, **, *** = significant at p < 0.05, 0.01, and 0.001 respectively.
Table 5. Principal component analysis and contributions of agronomic traits to the genetic variability of 15 winged bean accessions.
VariablePC1PC2PC3
PODLGT−0.5290.3010.559
PDWDTH−0.1180.877−0.046
NoSP−0.7750.295−0.262
DTFPM0.667−0.1470.574
SL0.6480.703−0.168
SW0.8810.088−0.271
STH0.7670.472−0.115
FW−0.202−0.550−0.550
PWT−0.5190.799−0.010
SWPPL0.035−0.0930.694
Eigen value3.4362.6421.612
Percentage of variance (%)34.35726.42416.117
Cumulative of variance (%)34.35760.78176.898
PODLGT = Pod length; PDWDTH = Pod width; NoSP = Number of seed per pod; DTFPM = Days to first plant maturity; SL = Seed length; SW = Seed width; STH = Seed thickness; FW = Fodder weight, PWT = Pod weight; SWPPL = Seed weight.
Table 6. Cluster descriptions of the two hierarchical clusters formed on the basis of ten measured traits of the 15 winged bean accessions.
TraitsCluster One—Red (10)Cluster Two—Green (5)
MinMaxMeanMinMaxMeanF-Value
PODLGT19.2022.2020.66 a19.6022.3021.24 a1.20 ns
PDWDTH9.1510.929.64 a8.3010.519.63 a0.00 ns
NoSP8.1311.6310.18 b11.0012.2511.65 a8.30 *
DTFPM83.2090.8086.04 a75.5088.5082.08 b4.78 *
SL9.1910.299.53 a8.929.399.16 b5.82 *
SW8.548.948.72 a8.318.608.44 b16.65 **
STH7.187.857.42 a6.937.707.14 b6.44 *
FW203.00380.00280.40 a185.00546.00316.50 a0.51 ns
PWT108.00247.00172.20 a170.00228.00198.00 a1.98 ns
SWPPL78.50138.90104.64 a70.40109.4084.77 a4.31 ns
Significance level: “p < 0.01” = **, “p < 0.05” = *, “p > = 0.05” = ns; Means followed by the same alphabets across each row are not significantly different at a 5% p-value threshold. The bold values indicate significant traits associated with each cluster group.
Table 7. Locus number, allele frequency, number of alleles per locus, gene diversity, and PIC of ten SSR markers used for profiling 15 winged bean accessions.
Locus NoAllele FrequencyNo of AllelesGene DiversityPIC
SSR-240.940030.11440.1109
SSR-7040.933330.12630.1218
SSR-7470.940030.11440.1109
SSR-8540.933330.12630.1218
SSR-8600.920040.15080.1462
SSR-8790.626760.50410.4229
SSR-11040.926740.13870.1342
SSR-31110.580060.54190.4596
SSR-58190.953350.09030.0888
SSR-111000.540050.55220.4606
Mean0.82934.20.24590.2178
PIC: polymorphic information content.
Table 8. Analysis of molecular variance showing inter and intra accession variance of 150 individuals obtained from 15 winged bean accessions.
VariationdfSSMSEst. Var.%
Among Accession21.7330.8670.0135%
Within Accession14733.1800.2260.22695%
Total14934.913 0.239100%
Disclaimer/Publisher’s Note: The statements, opinions and data contained in all publications are solely those of the individual author(s) and contributor(s) and not of MDPI and/or the editor(s). MDPI and/or the editor(s) disclaim responsibility for any injury to people or property resulting from any ideas, methods, instructions or products referred to in the content.

