Article

Assessment of Heat Risk of Winter Wheat Cropping Based on Long-Term Meteorological Data

1
School of Agronomy, Anhui Agricultural University, Hefei 230036, China
2
Office of VP for Research & Graduate Studies, Agricultural Research Station, Qatar University, Doha 2713, Qatar
*
Author to whom correspondence should be addressed.
These authors contributed equally to this work.
Agronomy 2023, 13(8), 2149; https://doi.org/10.3390/agronomy13082149
Submission received: 3 July 2023 / Revised: 24 July 2023 / Accepted: 11 August 2023 / Published: 16 August 2023
(This article belongs to the Section Agroecology Innovation: Achieving System Resilience)

Abstract

:
The frequency of heat events is likely to increase due to global climate change, posing an increasing risk to wheat production. To optimize crop management strategies for coping with future climates, it is crucial to quantify the high-temperature occurrence during cropping seasons. Here, sixty-six years (1955~2020) of meteorological data during wheat reproductive growth were collected from six meteorological stations in the Huaibei Plain of Anhui Province. These data were analyzed to quantify the pattern and characteristics of post-anthesis heat stress for wheat crops. Five levels of annual mean daily maximum temperature (Tmax) were defined, from normal to extreme temperatures. Six crop developmental phases of winter wheat, i.e., phase i to phase vi, were divided from flowering to maturity. The data suggest an annual mean temperature of 17~24 °C from flowering to maturity, with an annual effective cumulative temperature ranging from 725 °C d to 956 °C d. The mean temperature and effective cumulative temperature increased as crop growth progressed, along with more frequent heat events during phase ii (8~14 days after anthesis) and phase iii (15~21 days after anthesis). We also found that the frequency of extremely high temperatures (≥33 °C) from 1990 to 2020 was significantly greater than that from 1957 to 1990. Interestingly, it was found that the intensity of post-anthesis night temperatures also increased with crop growth, i.e., from phase i to phase vi. Wheat grain yield increased with increasing effective accumulative temperature and Tmax, but it started to decline when thresholds of effective accumulative temperature and Tmax were reached. Overall, these findings could provide guidelines for winter wheat cropping in the Huaibei Plain, China, or similar climate and cropping regions.

1. Introduction

As one of the three major staple foods, wheat (Triticum aestivum L.) occupies 19.9% of the total food sown area and 20.1% of total grain production in China [1], playing a vital role in sustaining food security. In the wheat growing season, higher temperatures are likely to reduce crop yield and thus food production [2]. According to IPCC (2022) reports, the global atmospheric temperature has increased by 1.2 °C since the end of the 19th century and will continue to rise further [3]. The extremely hot weather across the globe during 2022 has caused greater heat stress to food crops than ever [3]. It is projected that under future global climate change, extreme heat will become more intense and frequent [3]. This will likely impact wheat growth and development, thus posing a risk to global food security.
Research reports that high temperatures often occur during the reproductive stage, greatly compromising wheat grain setting, grain filling, and quality [4]. Liu et al. [2] found that heat stress during the flowering stage could reduce grain number and size, thereby seriously affecting wheat grain yield. The optimum temperature for wheat flowering ranges from 12 °C to 22 °C [5]. Floret abortion and reduced spikelet and grain formation per spike generally occur as the temperature exceeds these optimum limits [6]. For example, when the post-anthesis temperature exceeds 30 °C, it inhibits pollen and microspore development, and it may even lead to complete male sterility and wheat yield reduction. If the high temperature lasts for 1 to 3 days during this period, the wheat yield is significantly reduced [7,8].
High temperatures during grain development reduce final grain size by curtailing grain-filling duration [9]. For instance, an increase of 5.4 °C above the optimal temperature reduces the grain filling duration of wheat by 8 days [10]. Starch content, which accounts for about 70% of wheat grain dry weight, is significantly reduced when high temperatures occur during the grain-filling phase of the crop [11,12]. Soluble starch synthase, a key enzyme regulating starch synthesis [13], is highly sensitive to heat stress. High temperatures during grain filling can inhibit starch synthase, sucrose conversion to starch [14], and ultimately starch accumulation in grains. Also, high temperatures accelerate leaf senescence, reducing assimilation rate and duration and leading to poor grain filling. In contrast to starch, which is correlated with grain size, protein is an important indicator of grain quality in wheat. High temperatures reduce grain quality by impairing traits such as protein synthesis, leaf nitrogen content [15], amino acid composition, and the precipitation index of grain [16]. In recent years, heat stress has become one of the most important environmental factors affecting wheat grain yield and quality. Despite efforts to cope with heat impacts on wheat crops, there is a lack of quantitative research on the frequency and intensity of high temperatures in the key wheat-producing regions in China. Therefore, quantifying the spatiality and temporality of high-temperature occurrence is greatly significant for guidance in grain cultivation and planting.
The Huang-Huai-Hai Plain is an important grain production base in China. Located in the south of the Huang-Huai-Hai Plain, it constitutes one of the main wheat production areas of the country, with a temperate monsoon climate with four distinct seasons. The Huaibei Plain covers 37,400 square kilometers, of which 2.14 million hectares are cultivated land, accounting for 57.2% of the total area of the Huaibei Plain and 47.8% of the province’s cultivated land. The grain-filling period for winter wheat in this region generally ranges from mid-April to late May. High temperatures frequently occur during this period and significantly impact grain filling and the yield of the crops [17]. Even though most previous analyses examined the impact of increasing mean growing-season temperatures on crop yields, a few recent studies combined temperature data with local crop phenology. For example, Zhao et al. [18] analyzed and quantified the temperature data in discussing the probability of extreme weather events in Anhui Province, along with the detailed impacts of the long-term weather conditions recorded from the weather station. However, the impacts of increasing growing-season mean temperatures and heat stress events from the compounding impacts of temperatures and local crop phenology on crop yield are yet to be resolved. Therefore, it is necessary to quantify the characteristics of heat stress with reference to wheat grain filling and to provide guidelines for wheat cropping systems [19,20].
The objective of this study is to analyze the characteristics of variation in daily temperature data, including daily maximum temperature, daily minimum temperature, and daily average temperature during the reproductive period of wheat crops over sixty-six years, from six weather stations in Huaibei Plain, Anhui province. In the current study, we not only quantify the frequency and intensity of high temperatures in Huaibei Plain using historical meteorological data combined with crop phenology but also analyze the occurrence probability of heat stress during different developmental phases, i.e., from anthesis to maturity, of winter wheat. These findings would provide insights to manage winter wheat cropping in climates and cropping regions similar to Huaibei Plain, China.

2. Materials and Methods

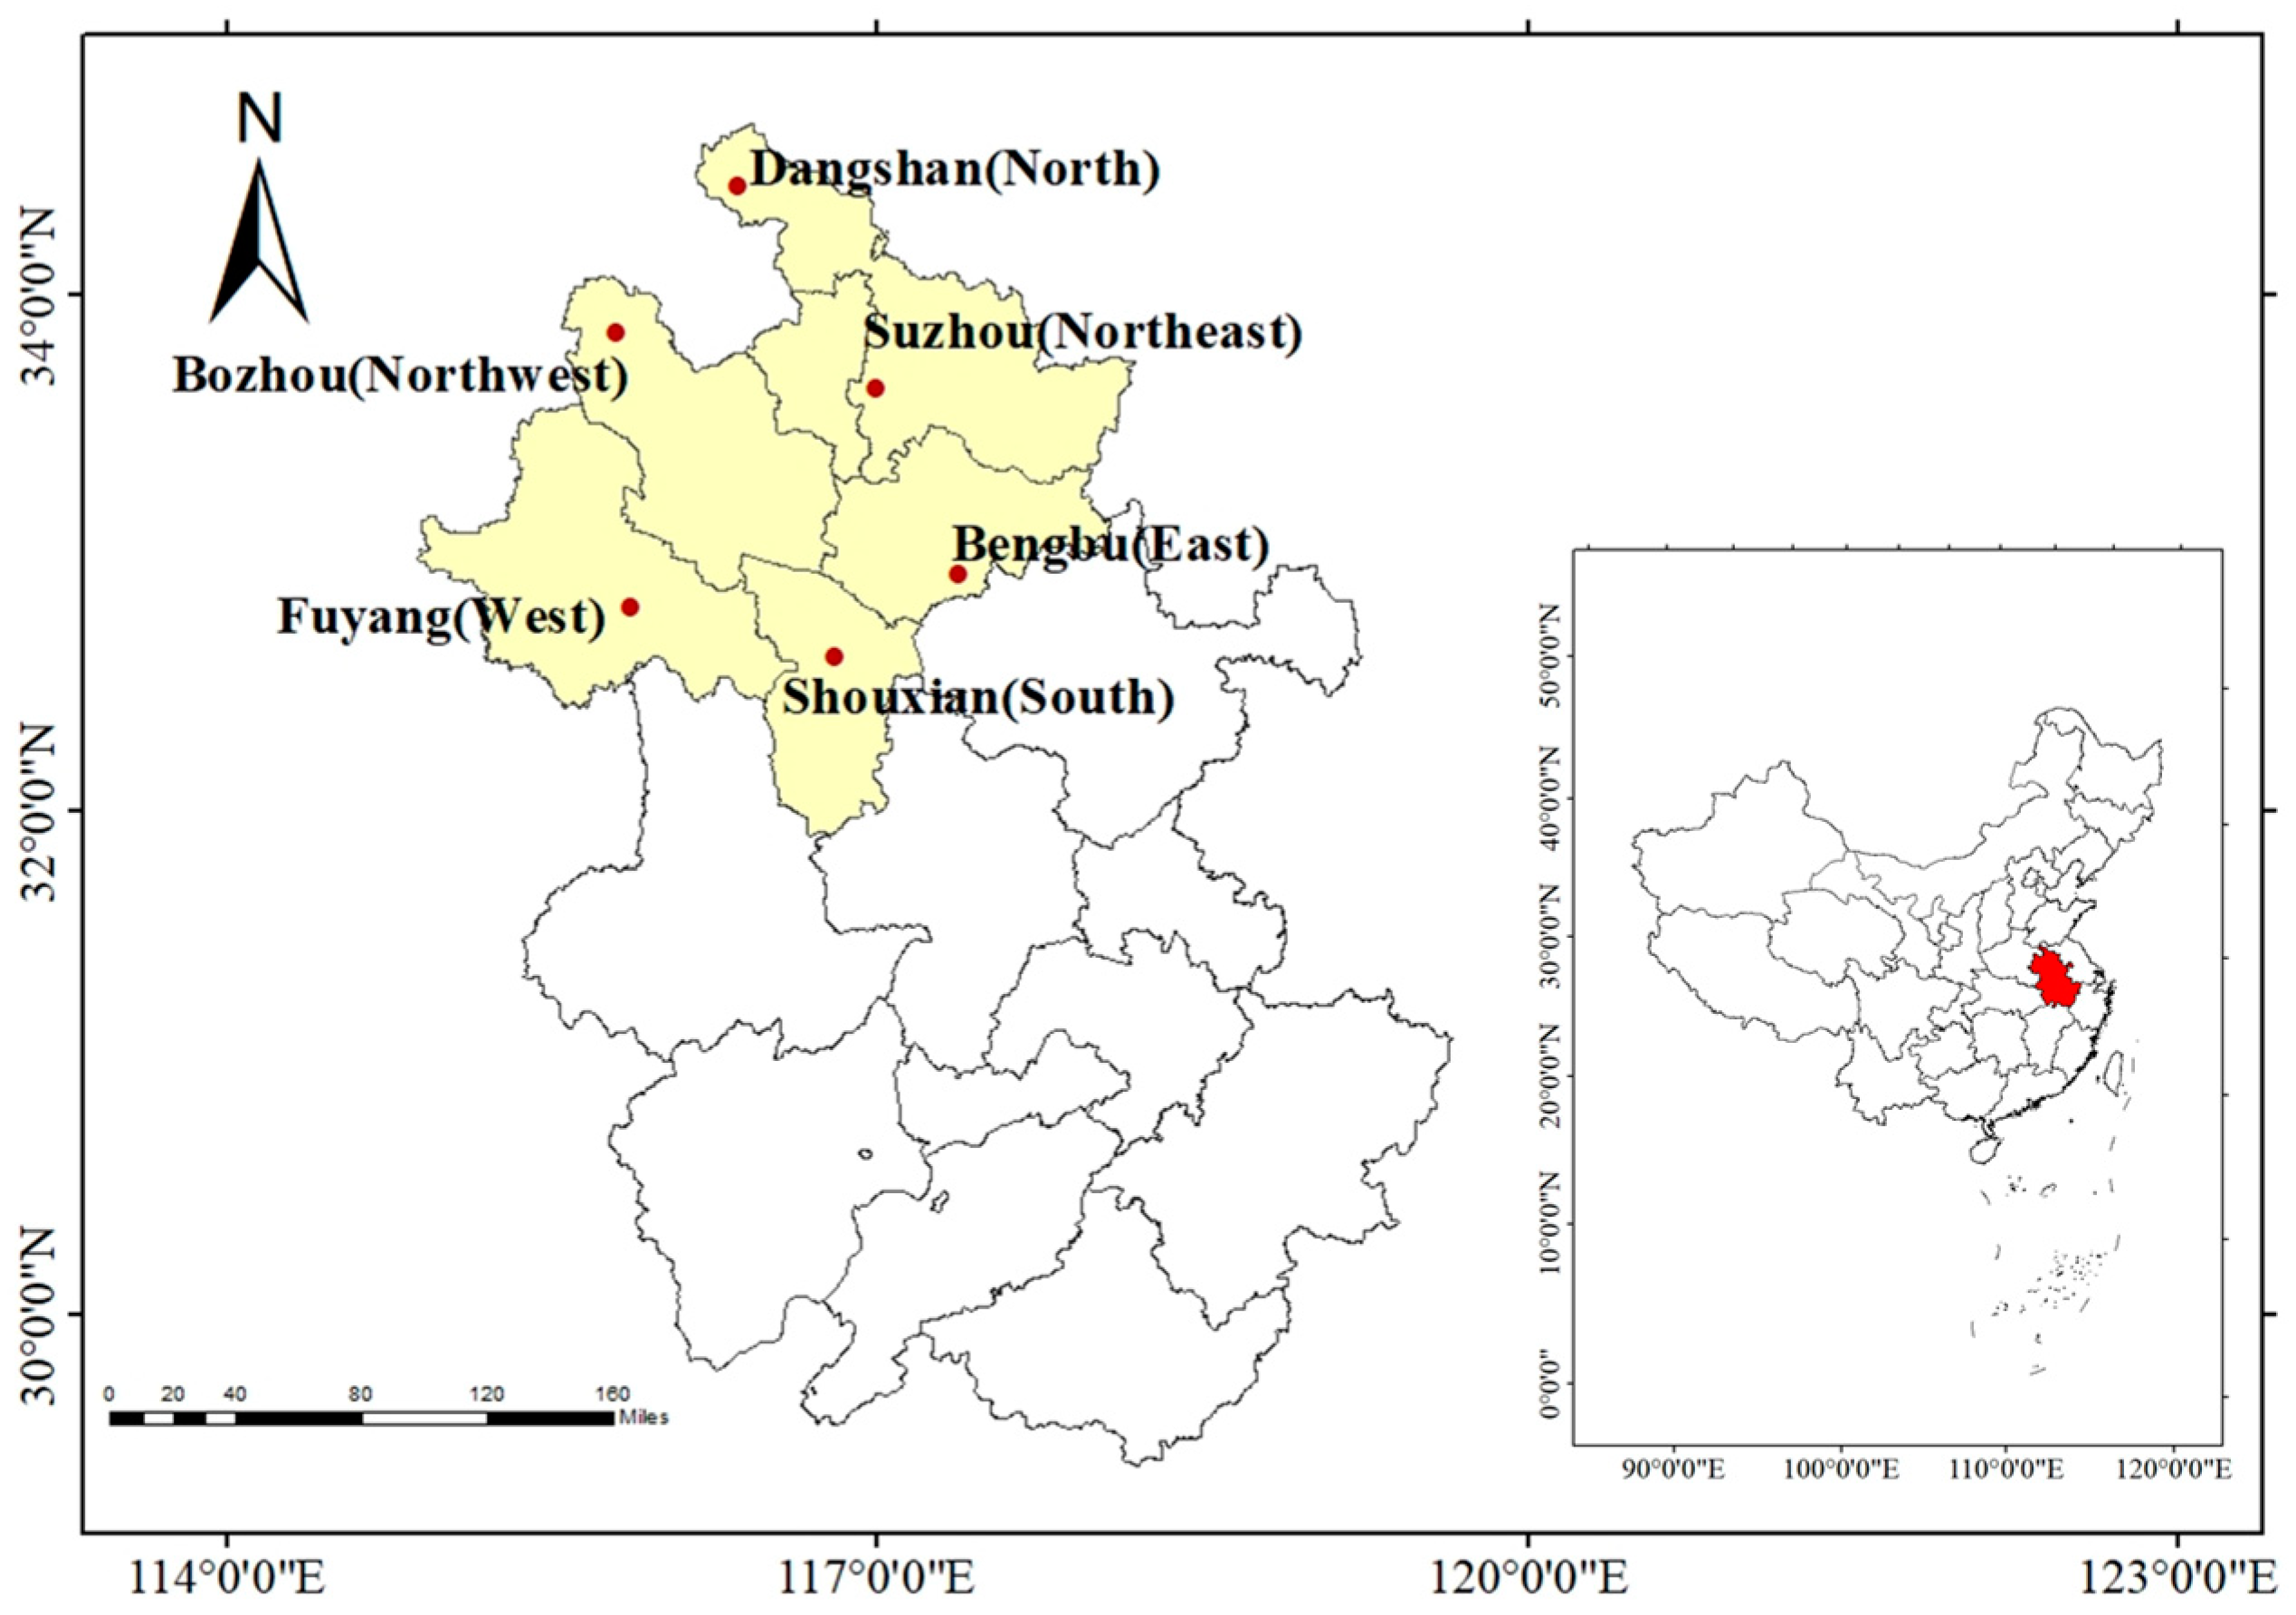
2.1. Study Site and Data Source

All data related to temperature were obtained from the China Meteorological Data Sharing Service System (CMDC, http://data.cma.cn/, accessed on 27 January 2021), including annual, monthly, and daily temperature data. Six representative weather stations were selected in the Huaibei Plain of Anhui Province, China: Bengbu (Bb), Fuyang (Fy), Shouxian (Sx), Dangshan (Ds), Suzhou (Sz), and Bozhou (Bz). (Figure 1). Wheat production data for Fuyang, Bozhou, Suzhou, and Bengbu were only available from 1999 to 2020.

2.2. Division of Wheat from Flowering to Maturity

According to typical local farming practices, wheat cultivation is characterized by crop sowing from late October to early November, jointing and booting from late February to mid-April, and grain filling and maturity from mid-April to late May. The wheat grain-filling phase, a critical developmental period, usually occurs from 20 April to 31 May. It is well documented that the period from flowering to maturity is an important period for wheat yield and quality. Temperatures ranging 15~24 °C are considered optimal for the early phases of grain developmental and filling, i.e., the phase of pollen tip growth (0~7 days after anthesis (DAA)) and grain setting (8~14 DAA) in wheat crops [21]. A temperature above 30 °C is detrimental to grain filling, particularly during 10~21 DAA [22]. The effects of high temperatures significantly differed for different phases of wheat development, from flowering to maturity. Based on the results of the above study, we divided the flowering-to-maturity period of wheat into six phases. Phase i, from 20 April to 26 April (1~7 DAA); phase ii, from 27 April to 3 May (8~14 DAA); phase iii, from 4 May to 10 May (15~21 DAA); phase iv, from 11 May to 17 May (22~28 DAA); phase v, from 18 May to 24 May (29~35 DAA); phase vi, from 25 May to 31 May (36~42 DAA), as shown in Table 1.

2.3. Kriging Interpolation Quantifies the Probability of Spatial Distribution of Thermal Stress

The Kriging method is one of the most widely used spatial interpolation methods. Compared with the inverse range-weighted interpolation (IDW) method, the Kriging method considers the spatially related attributes of descriptive objects in the process of data meshing, which makes the interpolation results more scientific and closer to the actual situation. By giving the interpolation error (Kriging variance), the reliability of interpolation becomes clearer [23]. ArcGIS Desktop 10.7 software (Environmental Systems Research Institute (ESRI) Inc.; Redlands, CA, USA. www.zhanshaoyi.com/15142.html, accessed on 2 October 2022) was used to analyze the spatial distribution of temperature data and to determine the probability of thermal stress occurrence in the Huaibei Plain by quantifying temperature data.

2.4. Frequency of High Temperature

The thermal stress index, or heat stress index, is used to comprehensively test the occurrence and impact of heat stress between anthesis and maturity. In this study, we selected three thermal stress indices, including accumulated heat stress days (AHSD), heat stress intensity (HSI), and heat degree days (HDD). AHSD is defined as the number of days when Tmax ≥ 30 °C after anthesis; HSI is defined as the average Tmax for days when Tmax ≥ 30 °C after anthesis; and HDD is defined as total heat degree-days after anthesis [24].

3. Results

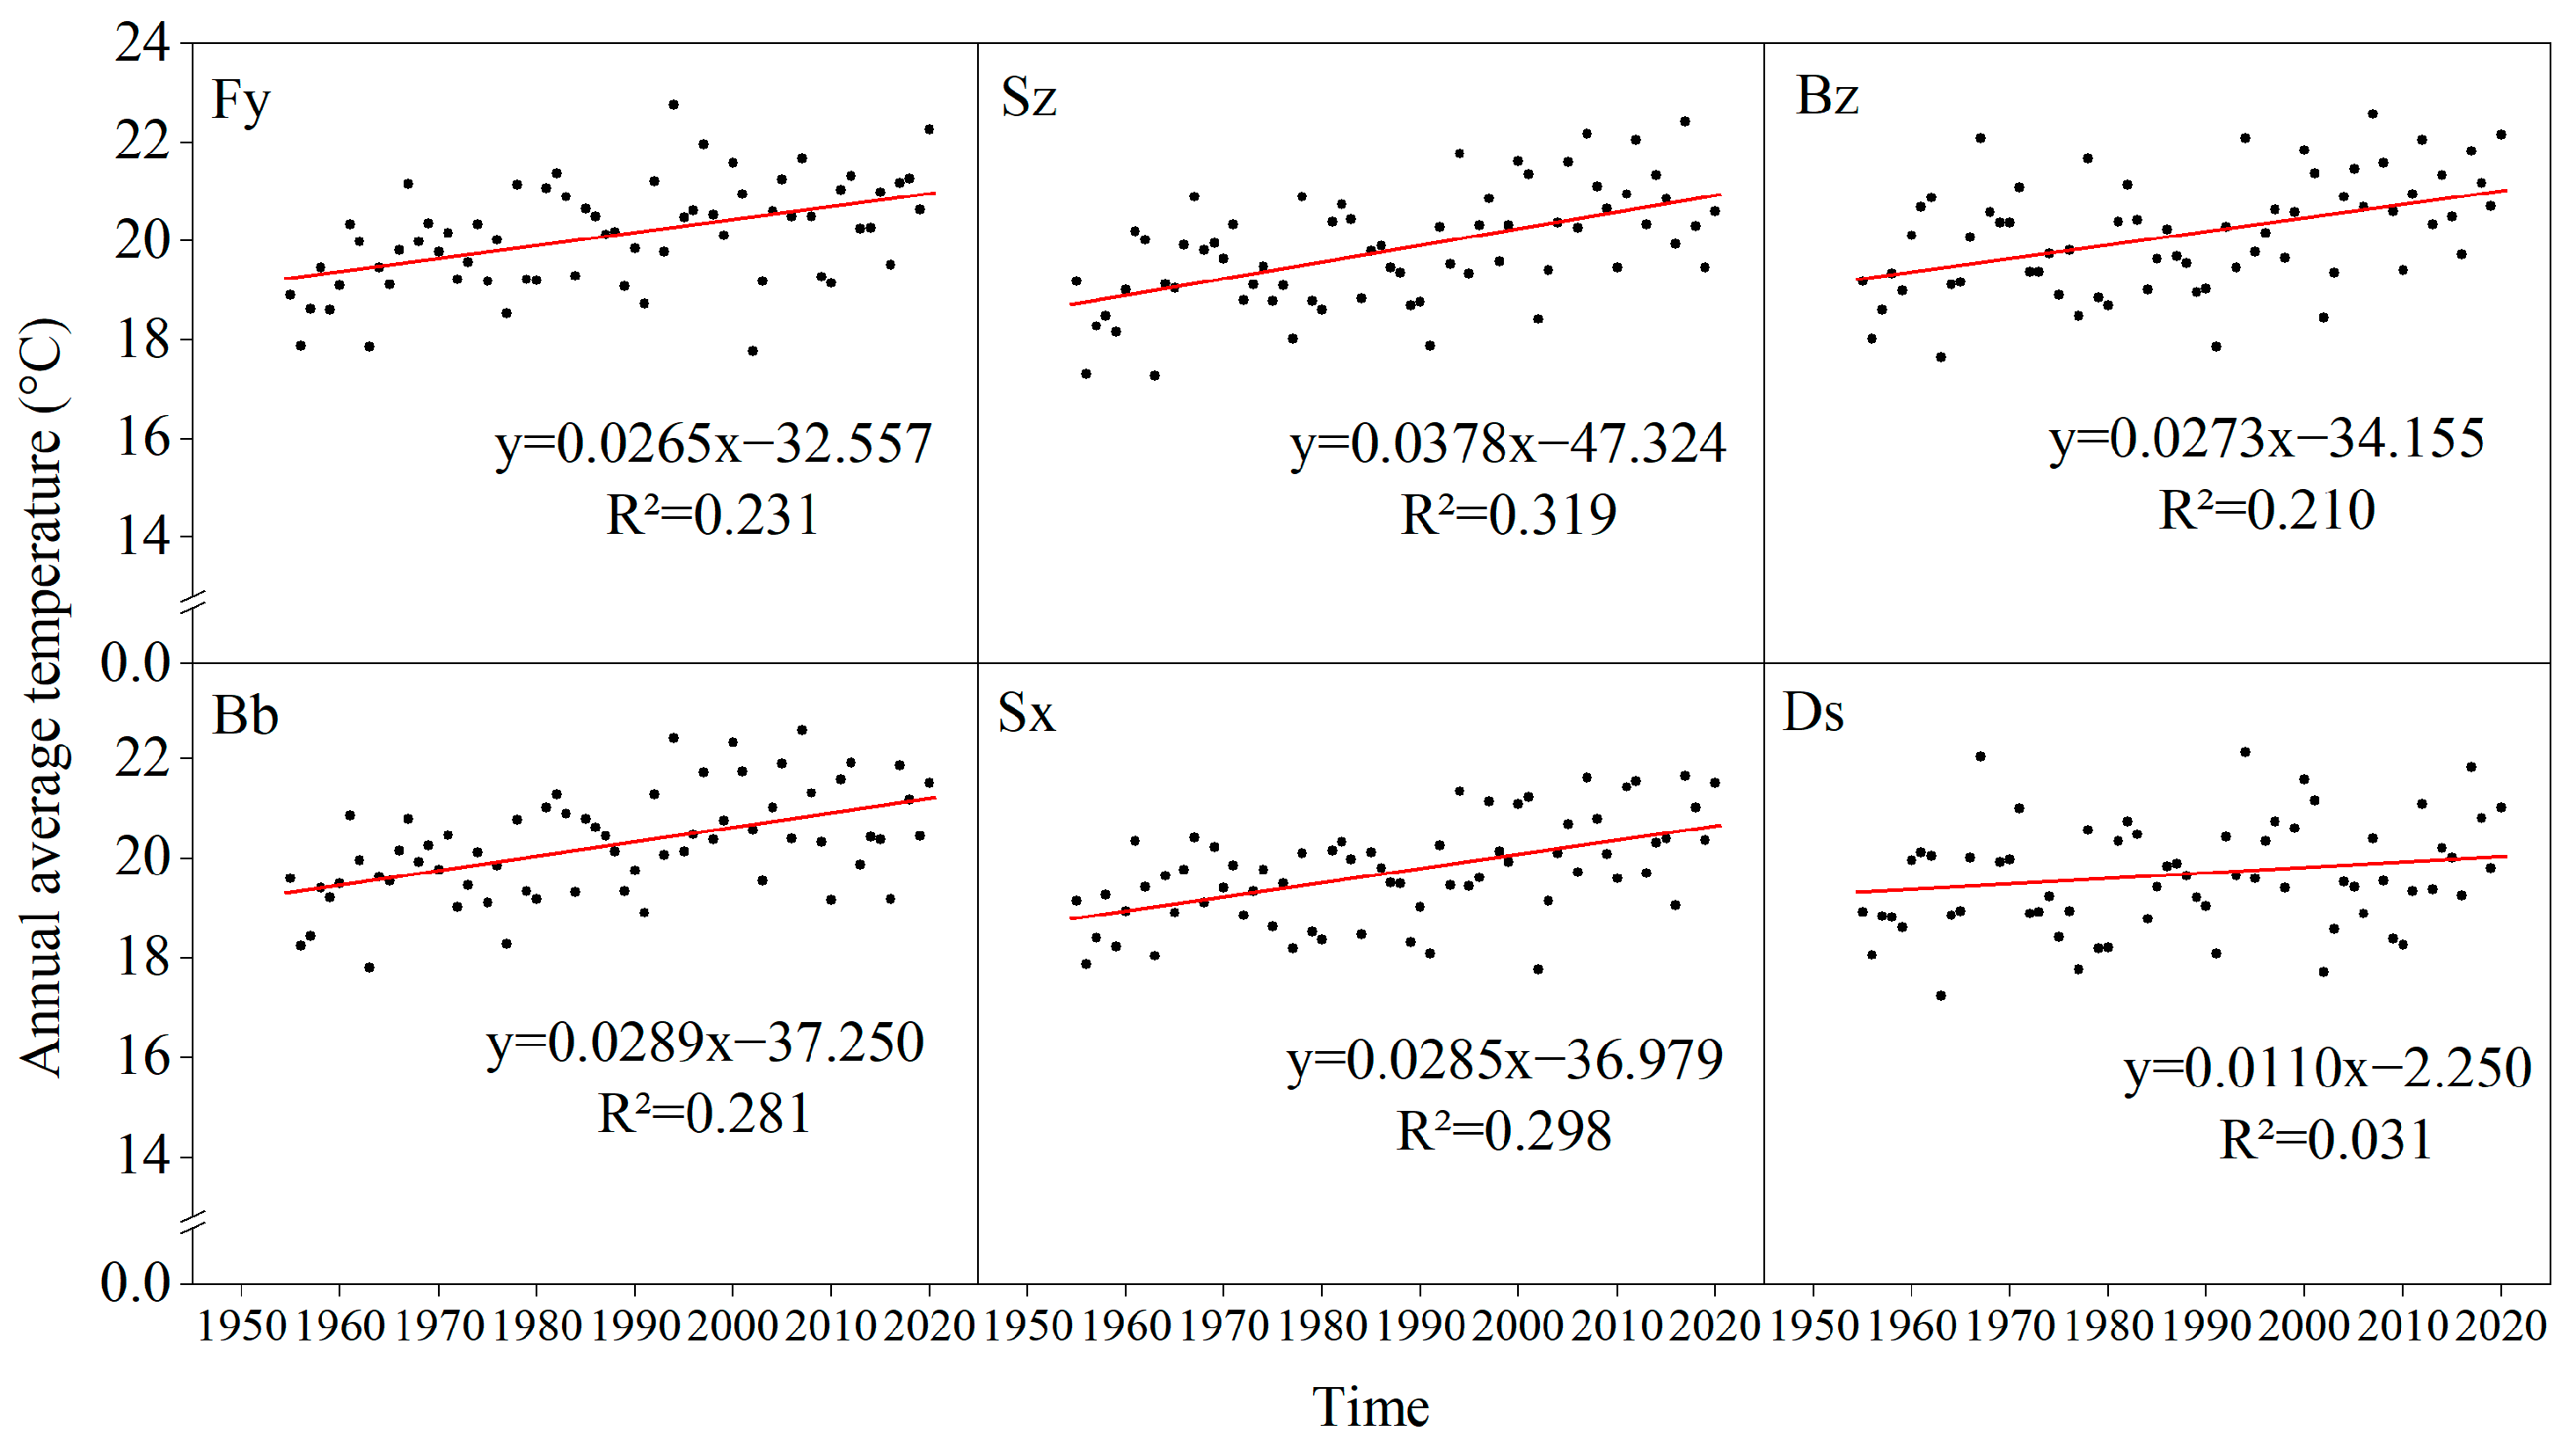
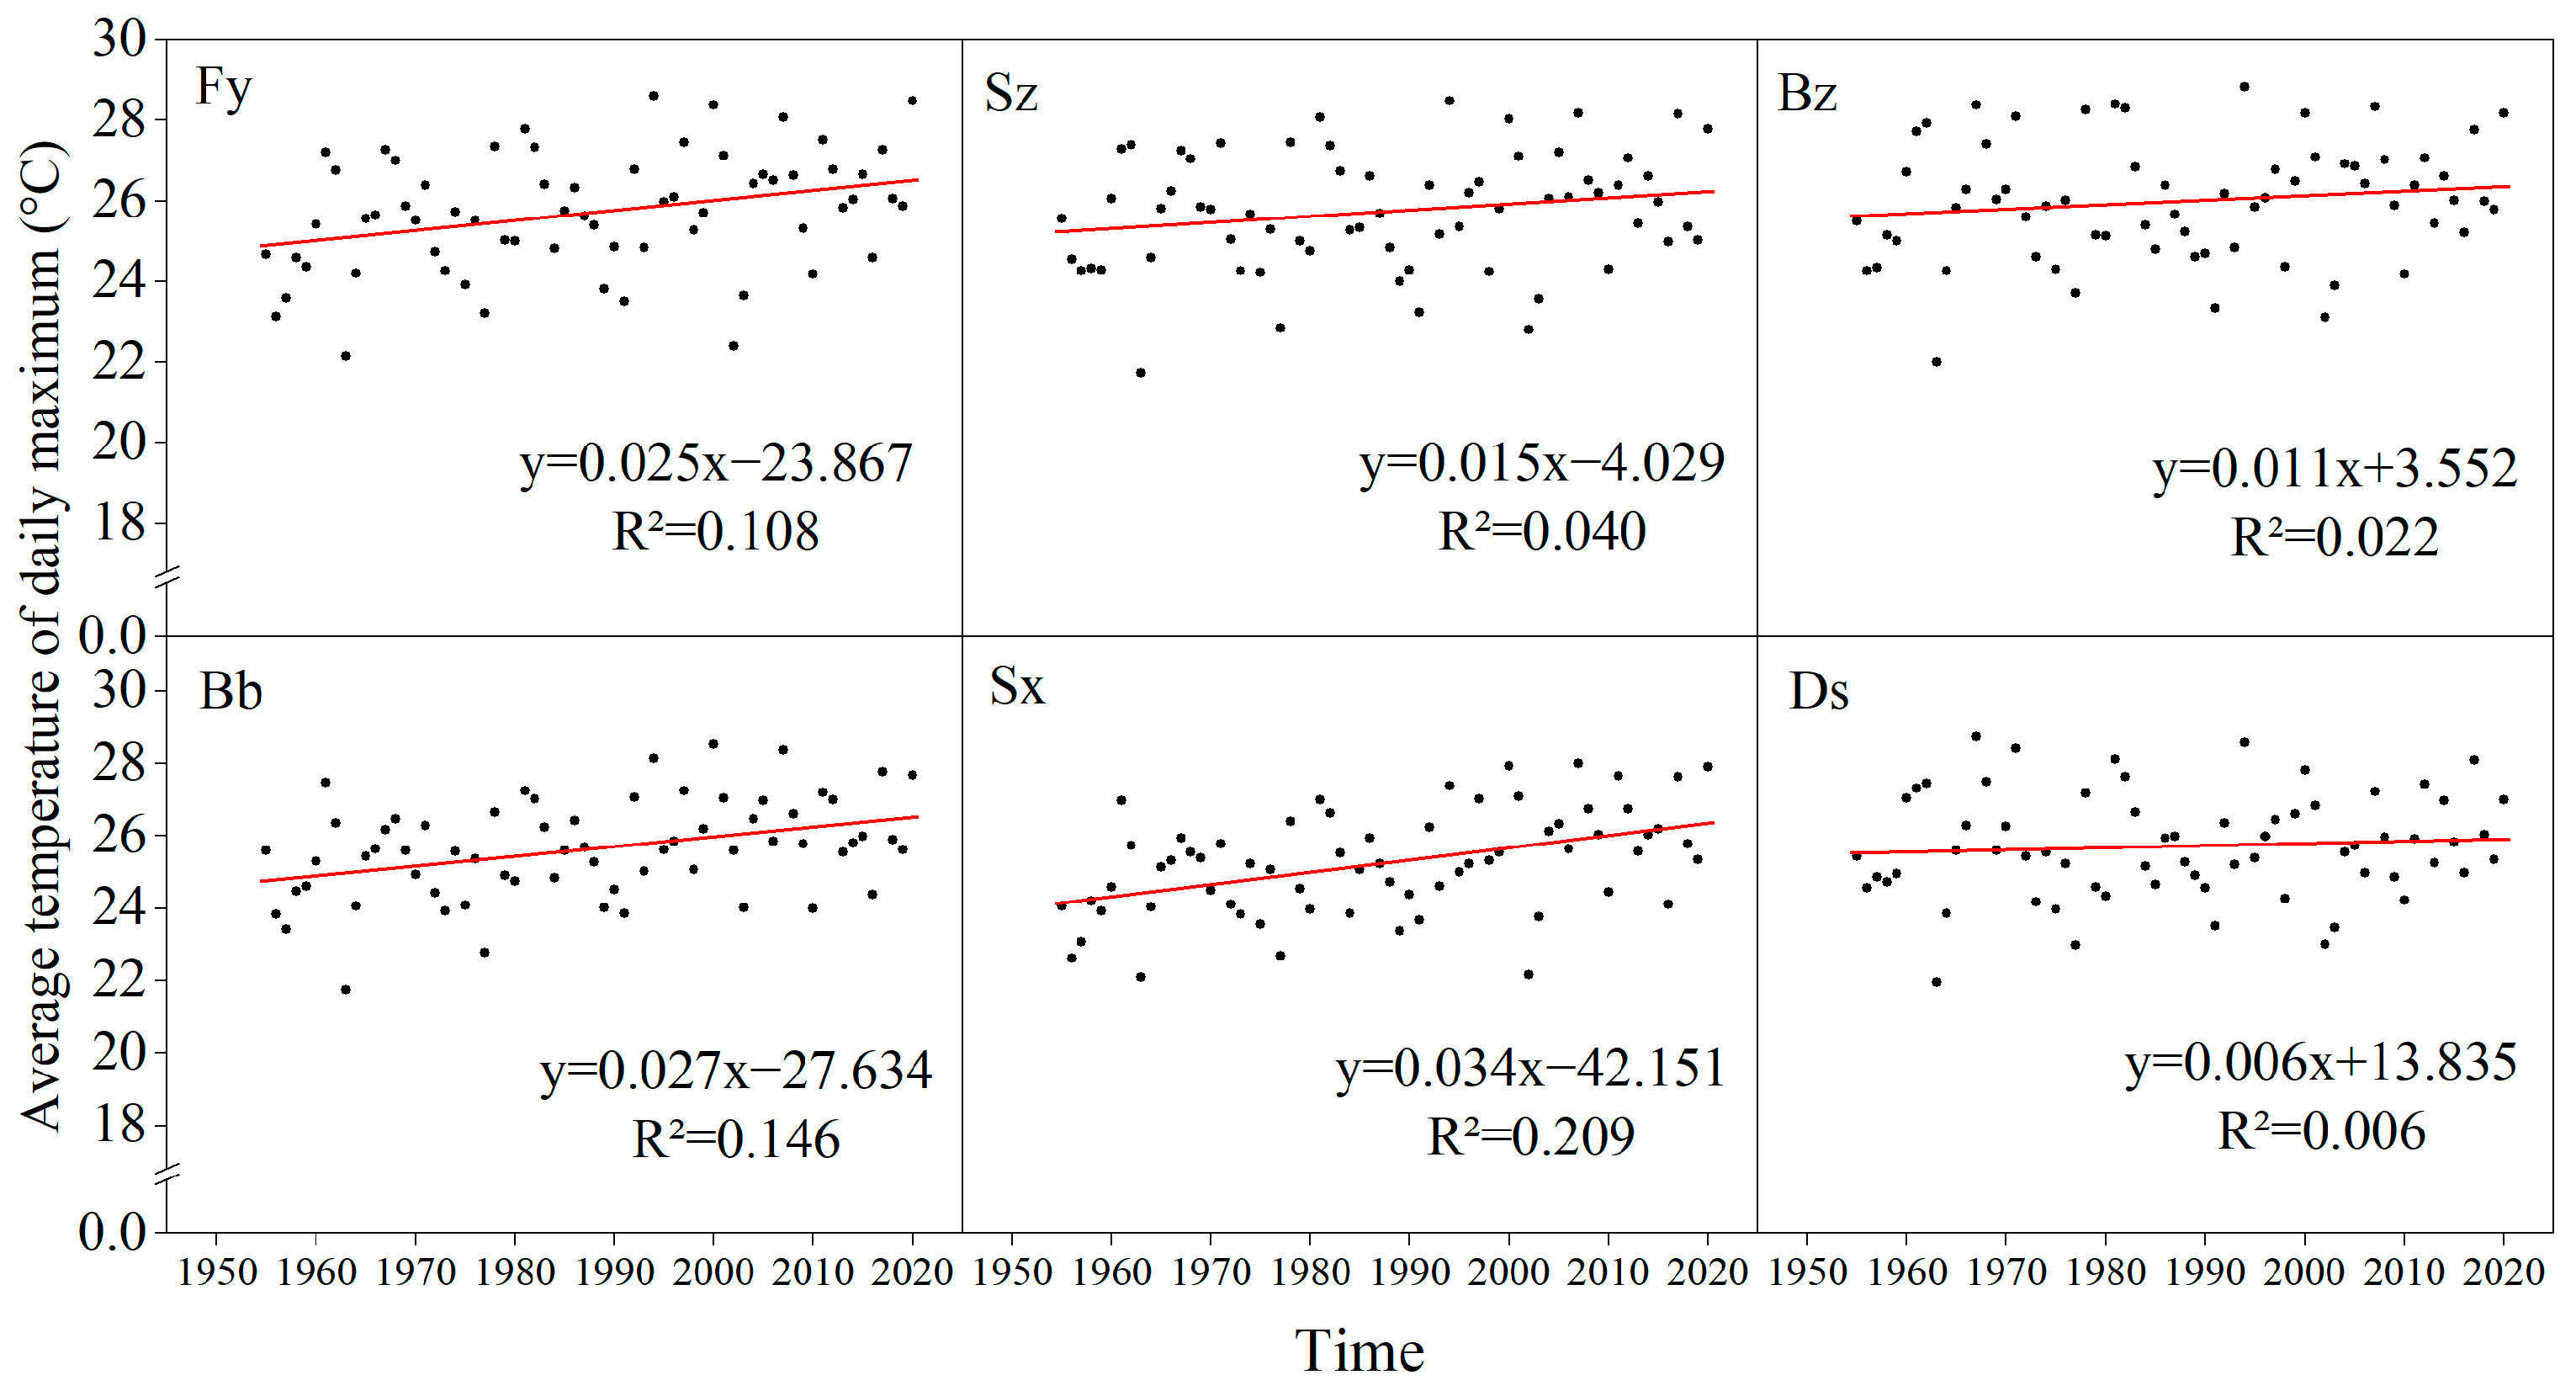
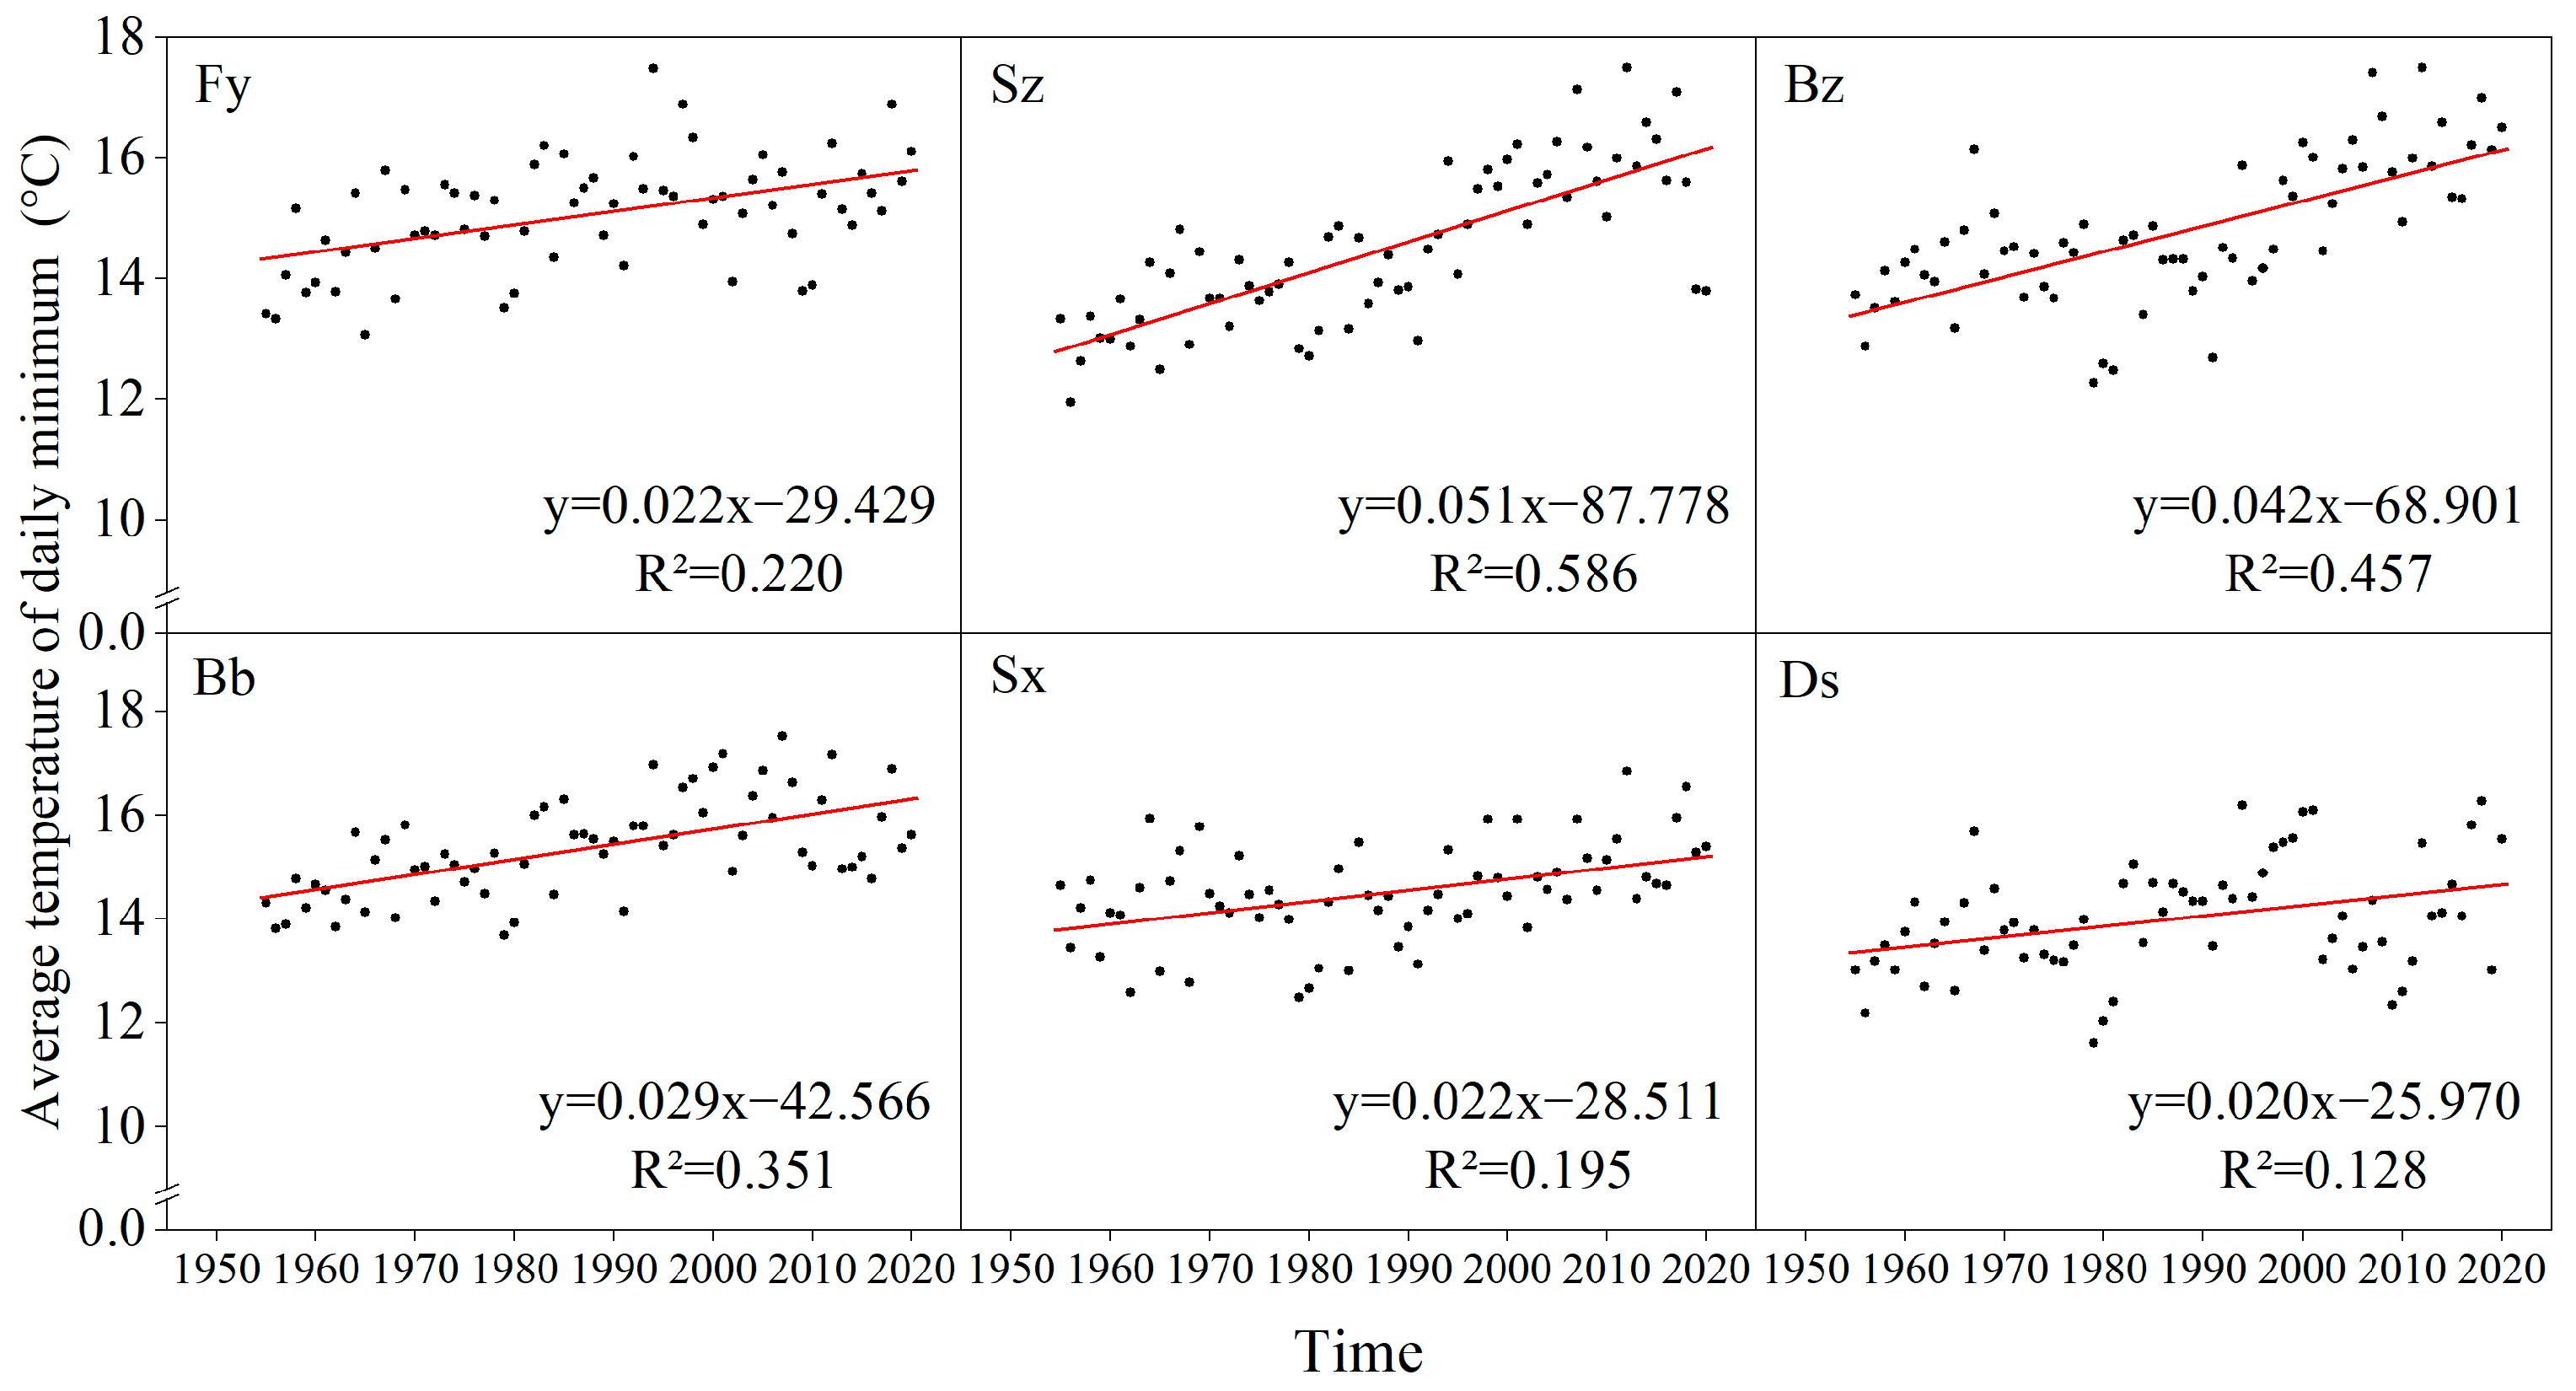
3.1. Mean Temperature, and Daily Maximum and Minimum Temperatures from Flowering to Maturity in Wheat

The average annual temperature during wheat developmental phases, i.e., flowering to maturity, across the six studied sites from 1955 to 2020 is presented in Figure 2. The annual temperature ranged between 17 °C and 24 °C, showing an upward trend over the years across all the studied sites. This temperature trend was further fitted by positive linear functions (Figure 2), with the maximum slope for Suzhou and the lowest for Dangshan, indicating that Suzhou and Dangshan sites were most and least affected by climate change, respectively.
The daily maximum temperatures for developmental phases from flowering to maturity in wheat crops across the six sites from 1955 to 2020 are presented in Figure 3. The daily average maximum temperature during these crop developmental phases for Fuyang, Suzhou, Bozhou, Bengbu, Shouxian, and Dangshan was 25.7 °C, 25.7 °C, 26.0 °C, 25.6 °C, 25.3 °C, and 25.7 °C, respectively. The daily average maximum temperature across these sites increased most significantly for phase ii, followed by phase iii. While phases ii and iii represent the rapid grain-filling stage of wheat, it suggests that high temperatures were most likely to occur during the most sensitive growth phase of the crop. The slope of the first-order equation was the highest for the average daily maximum temperature in Shouxian and the lowest in Bengbu. This shows that the increasing trend of daily maximum temperature for flowering to maturity phases of the wheat crop was greatest in Shouxian and relatively gentle in Bengbu.
The daily minimum temperature showed an upward trend with years across these sites, as presented by positively linear functions (Figure 4). The minimum line slope was highest for Suzhou and lowest for Dangshan, indicating that wheat crops during flowering to maturity were most affected by climate change in Suzhou and least in Dangshan.

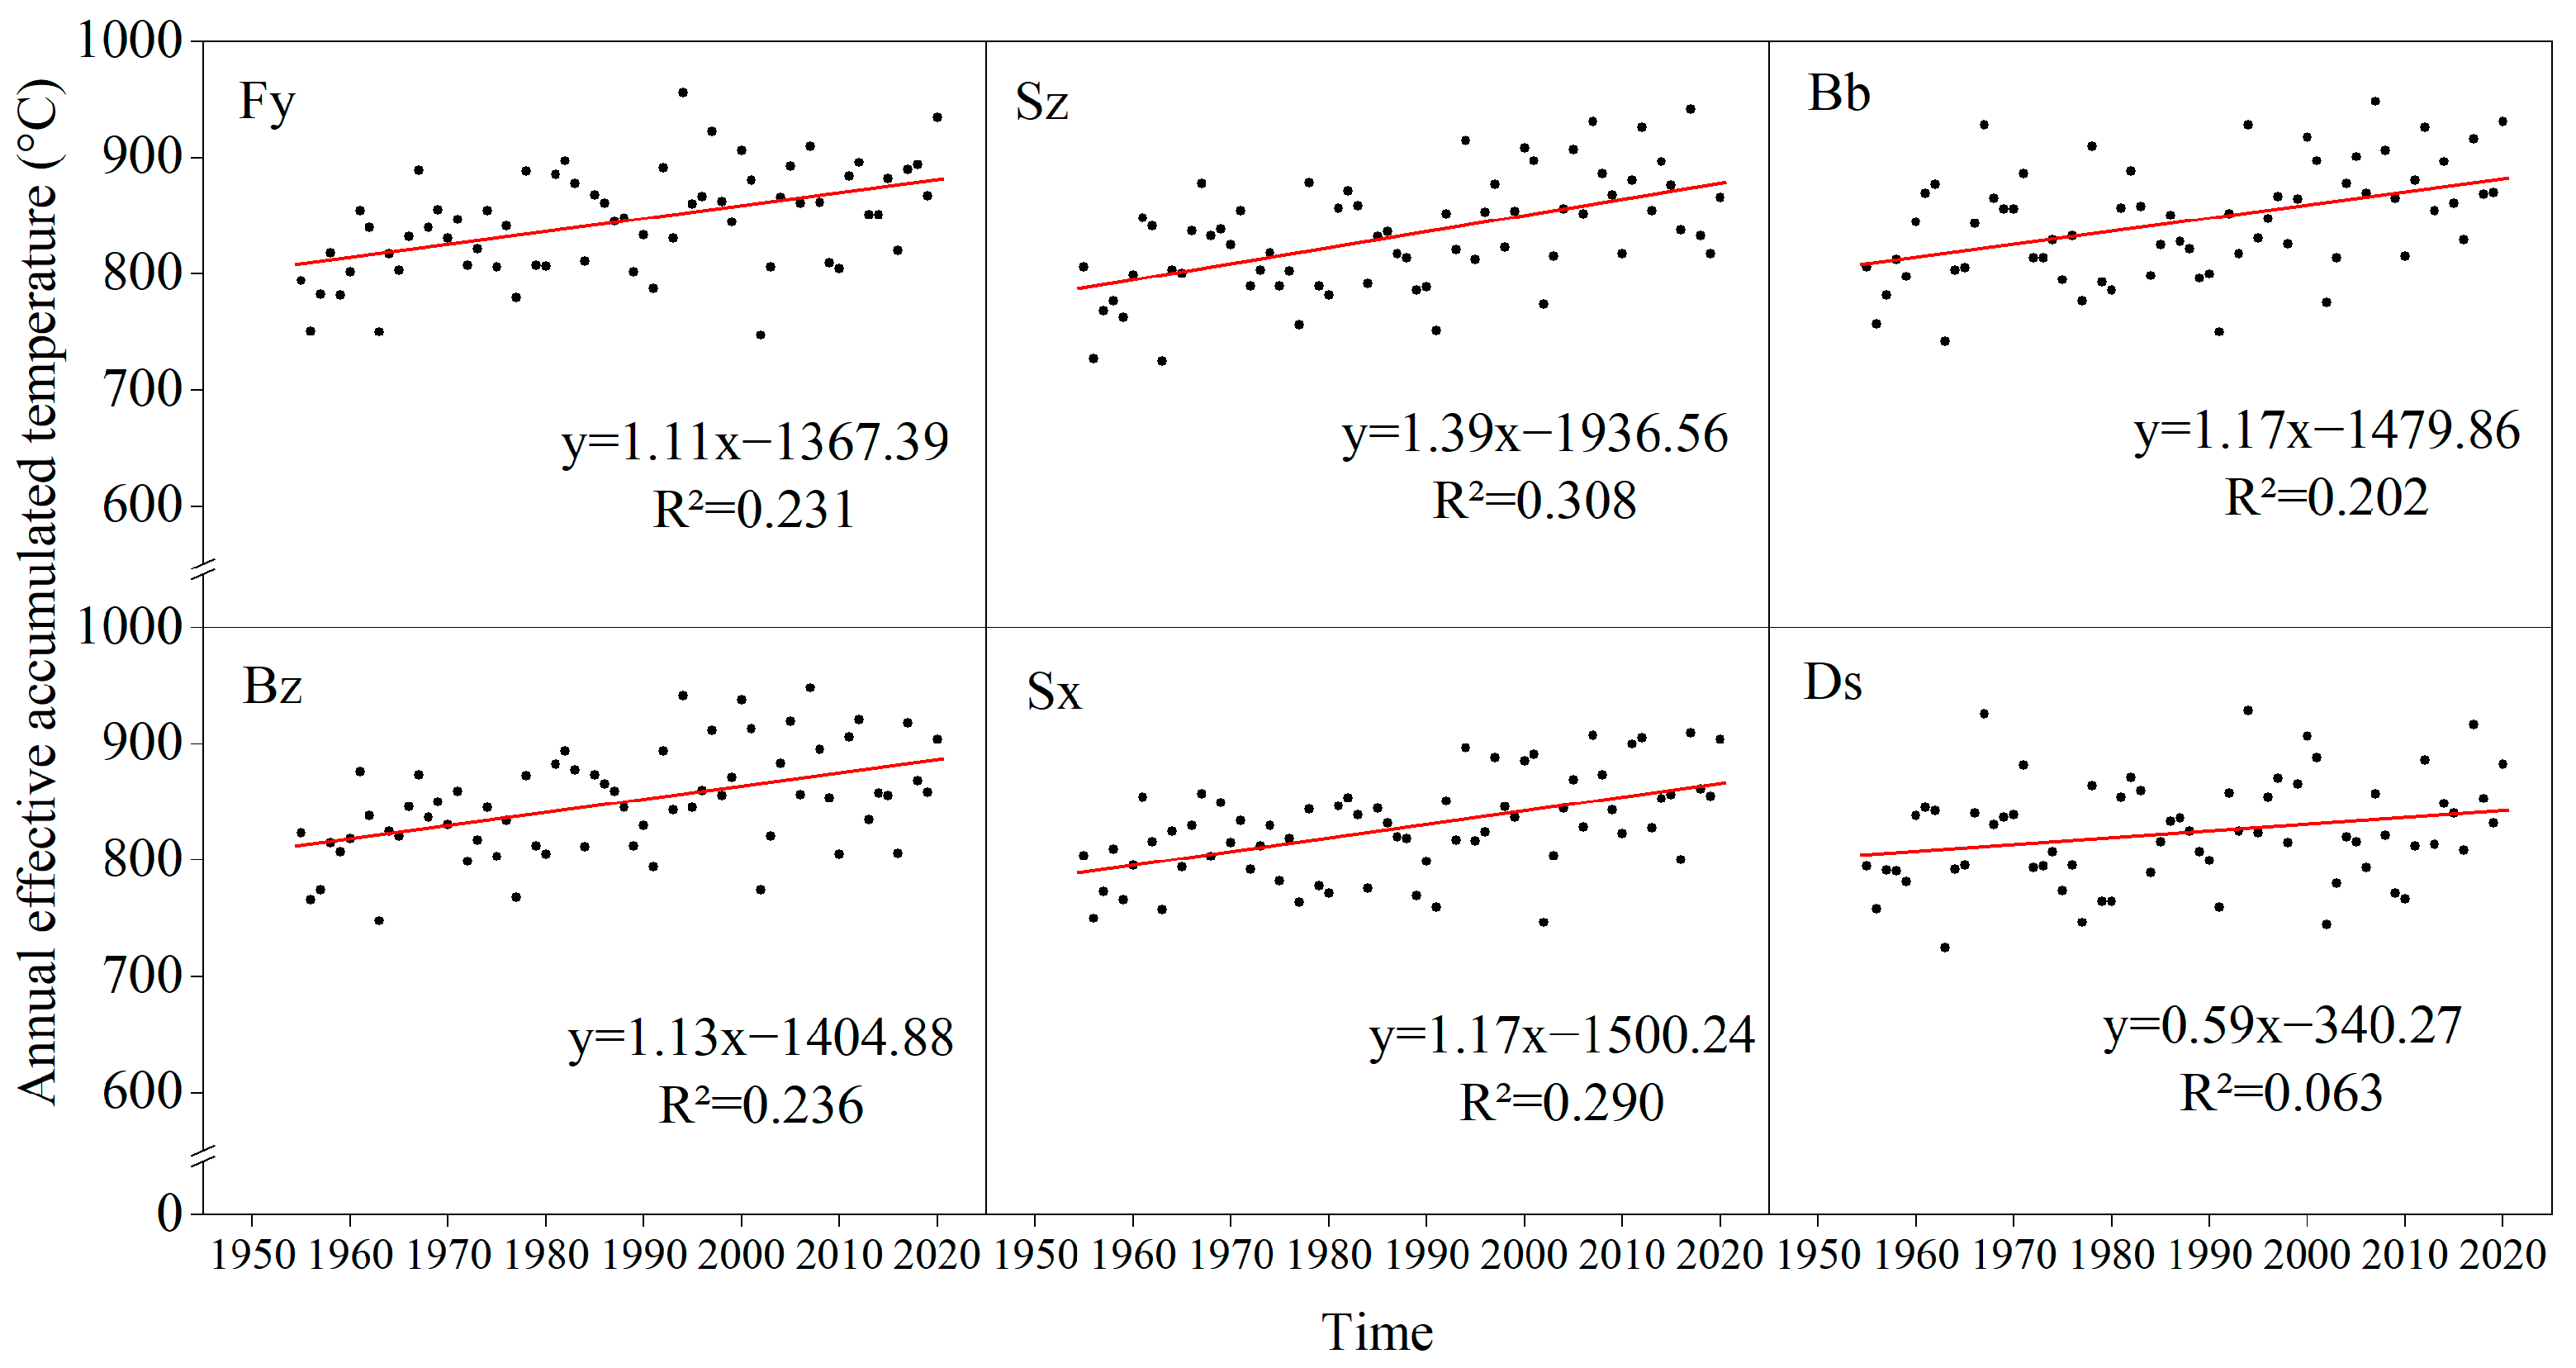
3.2. Effective Accumulated Temperature from Flowering to Maturity in Wheat

The effective accumulated temperature for developmental phases, i.e., flowering to maturity, in wheat across six sites from 1955 to 2020 is presented in Figure 5. The effective accumulated temperature varied between 725 °C d and 956 °C d, showing an upward trend across the studied sites, and it was fitted by positive linear functions (Figure 5). It can be seen that the maximum line slope was in Suzhou while the lowest was in Dangshan, indicating that the flowering to maturity period of wheat crops was most affected by climate change in Suzhou, while Dangshan was relatively stable under changing climate.

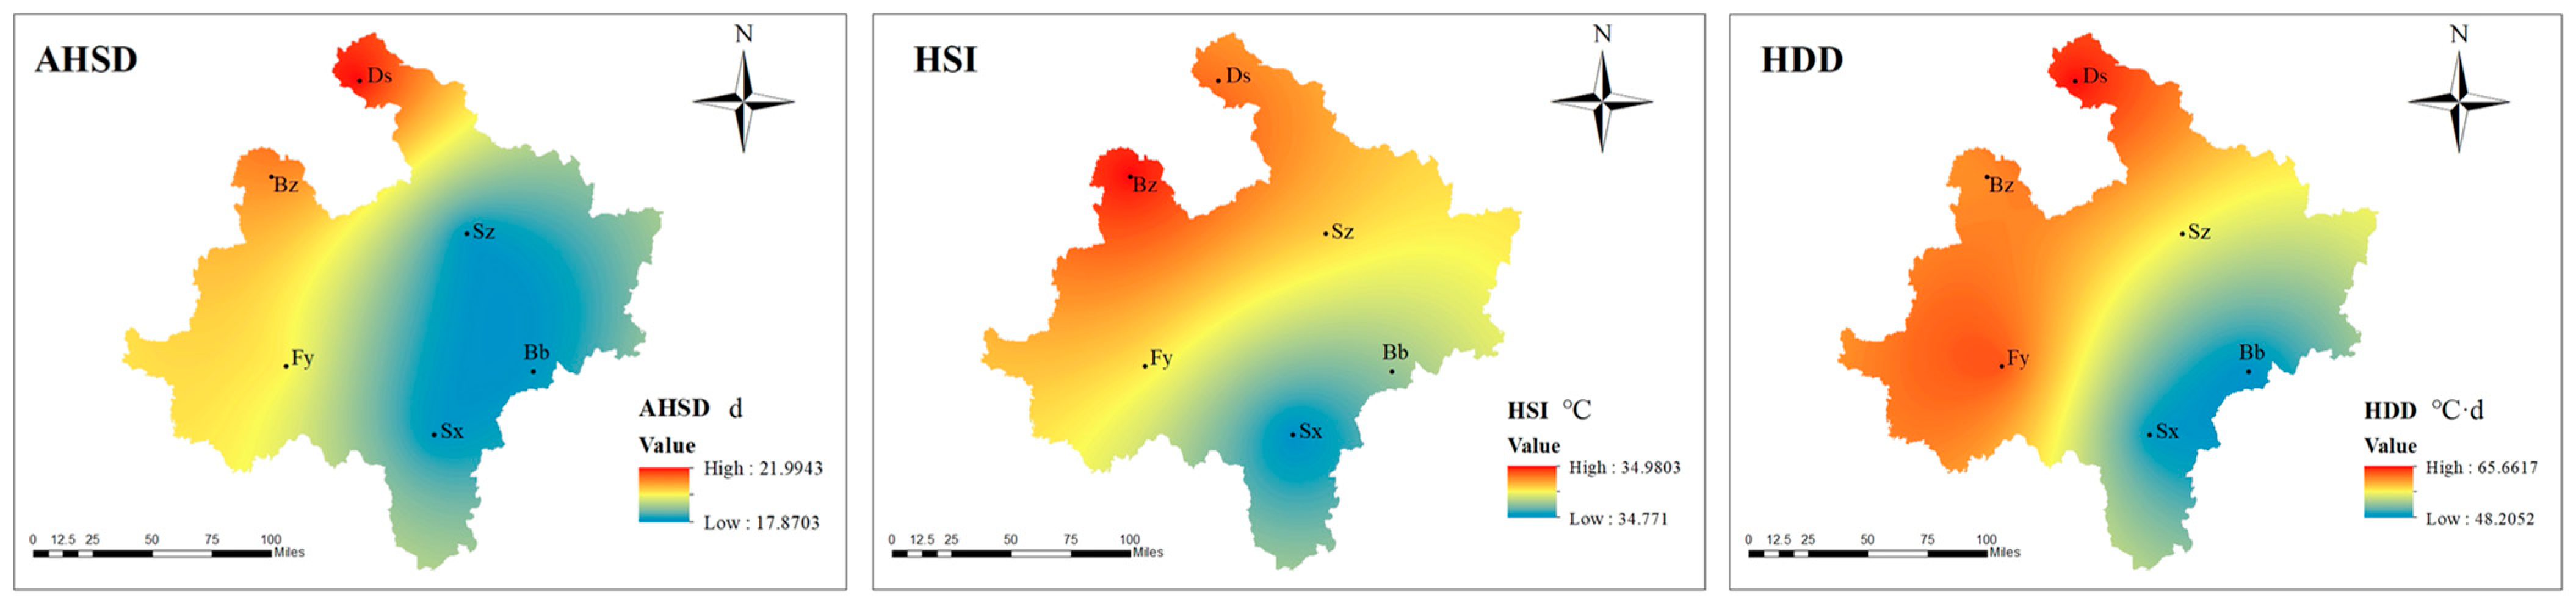
3.3. Spatial Variation of Heat Stress from Flowering to Maturity in Wheat

The heat stress indices (AHSD, HSI, and HDD) relating to the time from flowering to maturity in wheat at six sites from 1955 to 2020 are presented in Figure 6. The heat stress intensity decreased from northwest to southeast, and AHSD, HSI, and HDD values gradually decreased in the same direction (Figure 6). Across the studied sites, the heat stress indices of AHSD and HDD were the largest for Dangshan and the smallest for Bengbu. During the developmental phases from flowering to maturity, the heat stress index of AHSD for Dangshan was 4 days higher than that for Shouxian, and the mean value of HDD for Bozhou was 17.5 °C higher than that for Shouxian. Our results suggest that the northern part of the Huaibei Plain is relatively more susceptible to heat stress compared to the southern part.

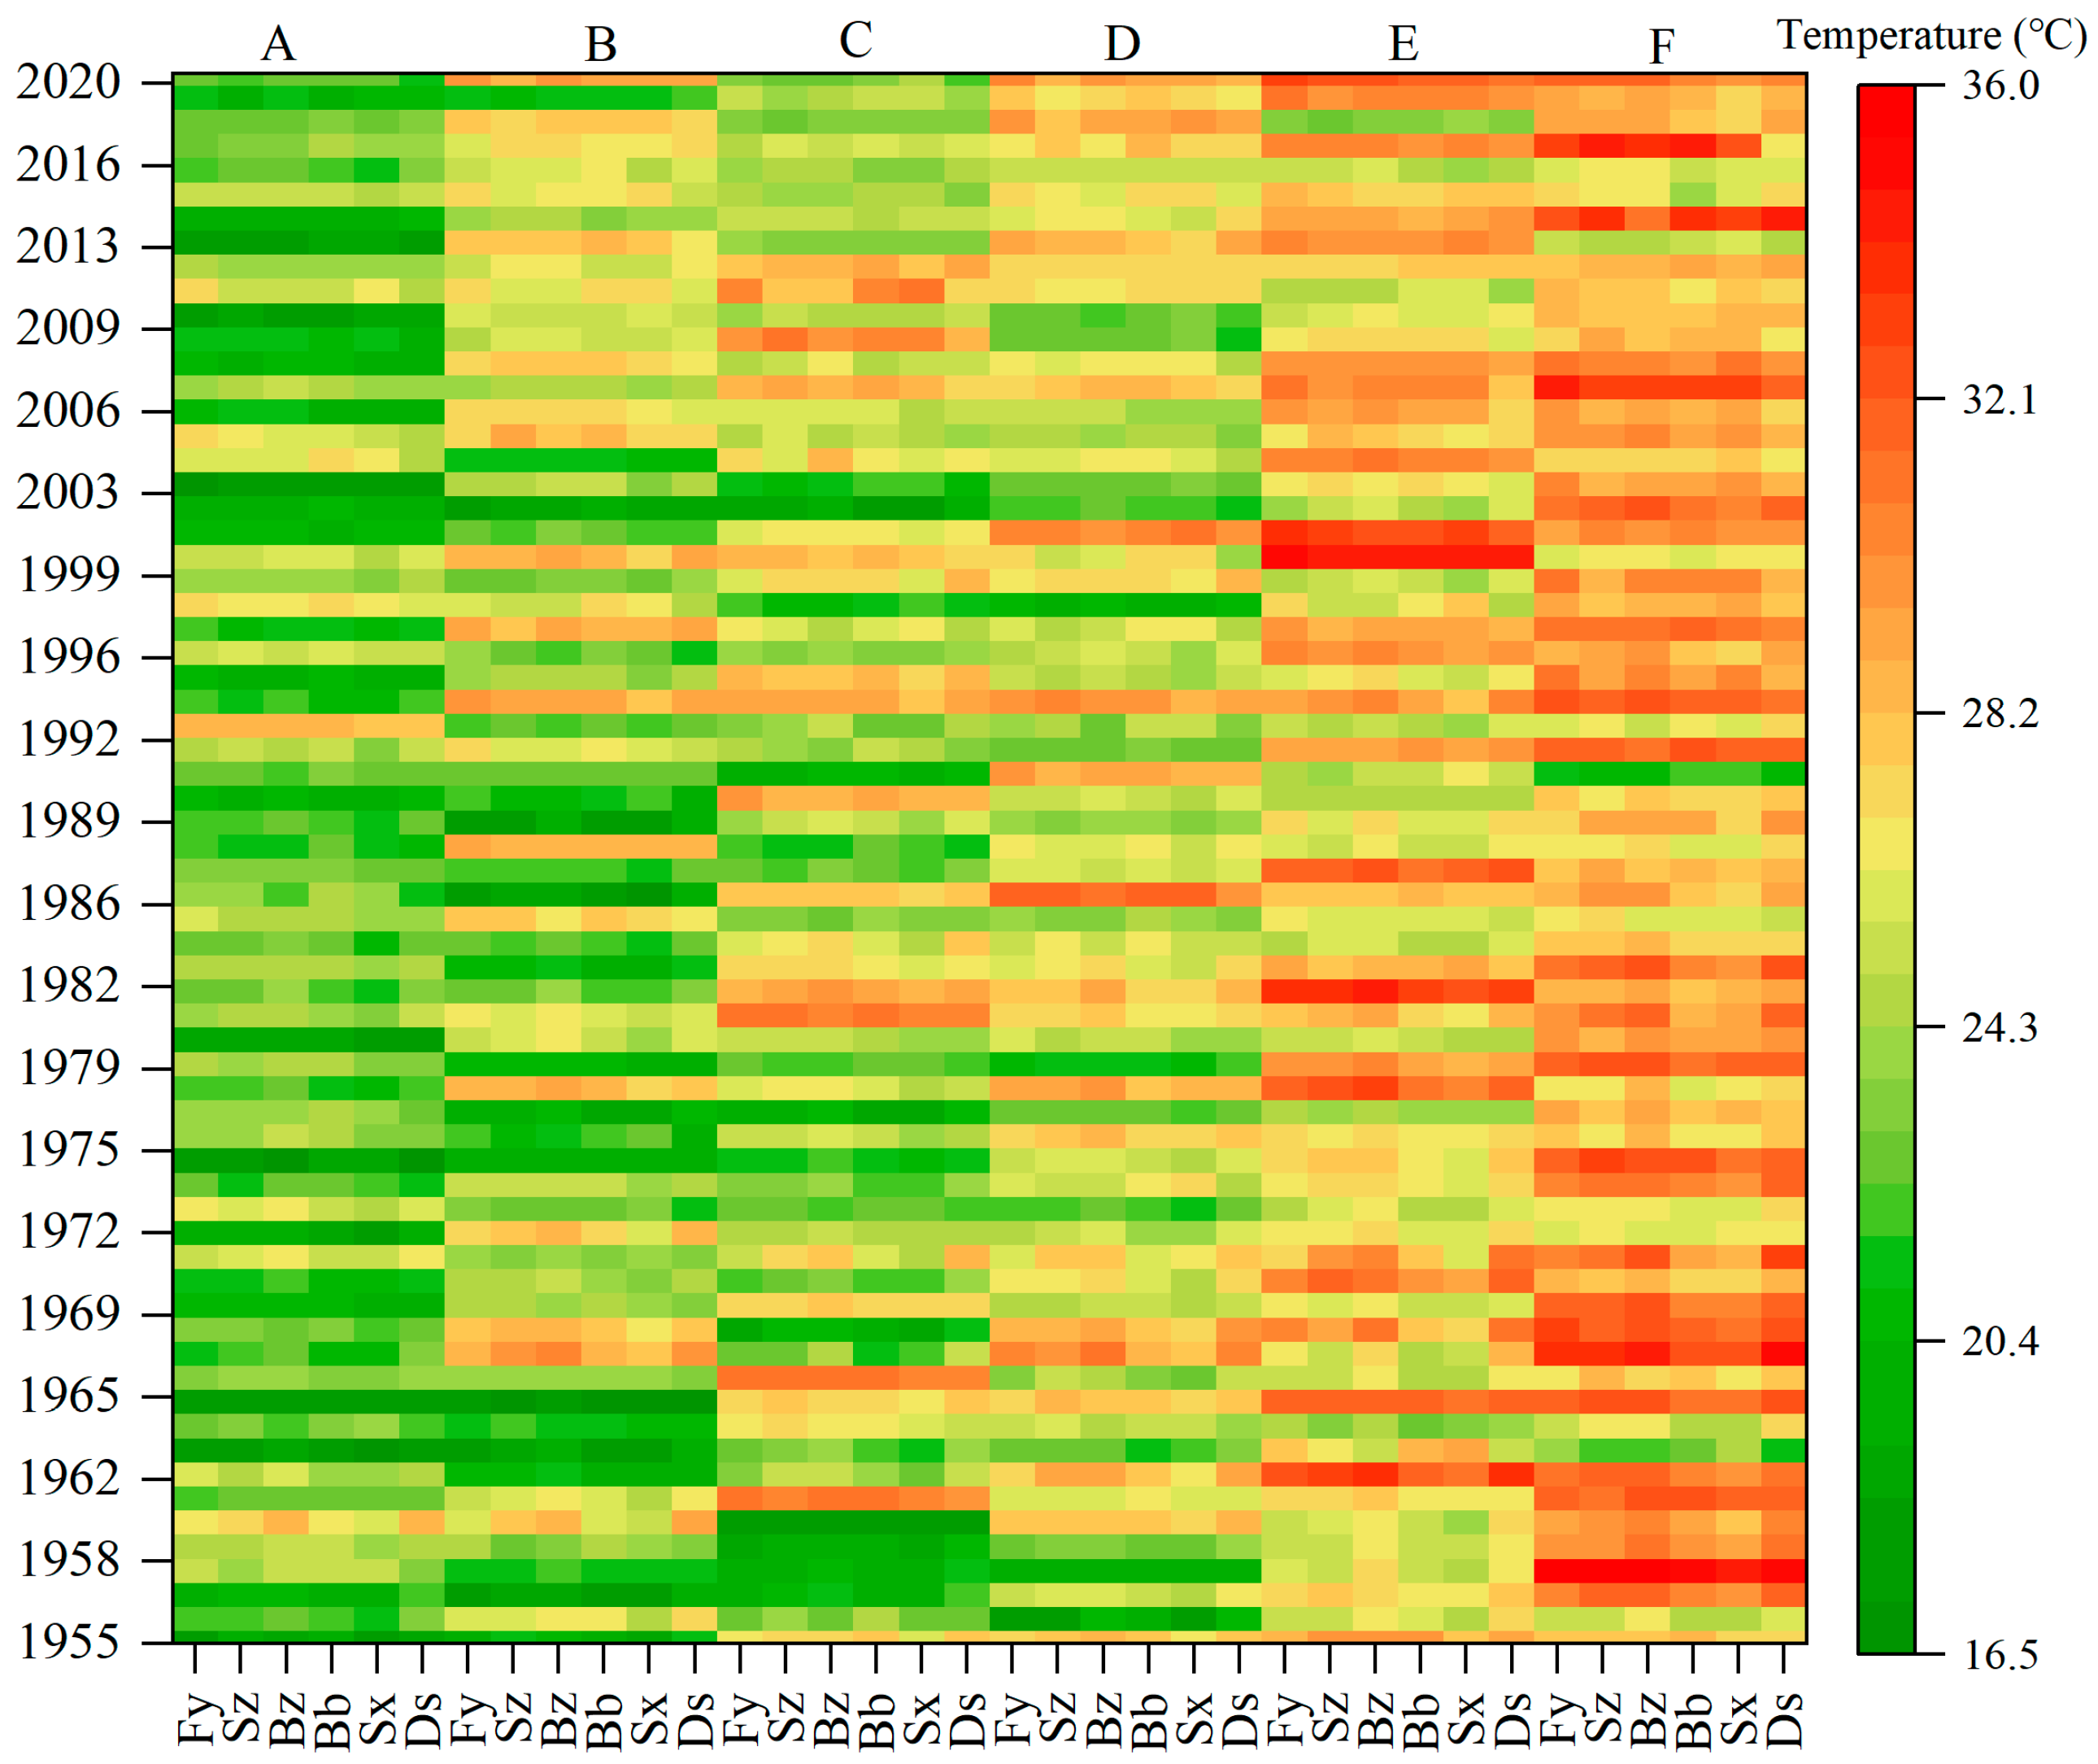
3.4. Stage Variation of Daily Maximum and Minimum Temperatures from Flowering to Maturity in Wheat

The probability of occurrence of daily mean maximum and minimum temperatures was approximately 50% for each developmental phase of the wheat crop, but the daily mean maximum and minimum temperatures showed an increasing trend from phase i to phase vi (Table 2 and Table 3). The percentage of temperature ≥ 3 °C for daily mean maximum and minimum temperatures was highest in phase ii, followed by phase iii. The probability of temperature ≥ 5 °C for daily mean maximum and minimum temperature was highest for phases i, ii, and iii, which indicates that the temperature is most likely to fluctuate during these phases.

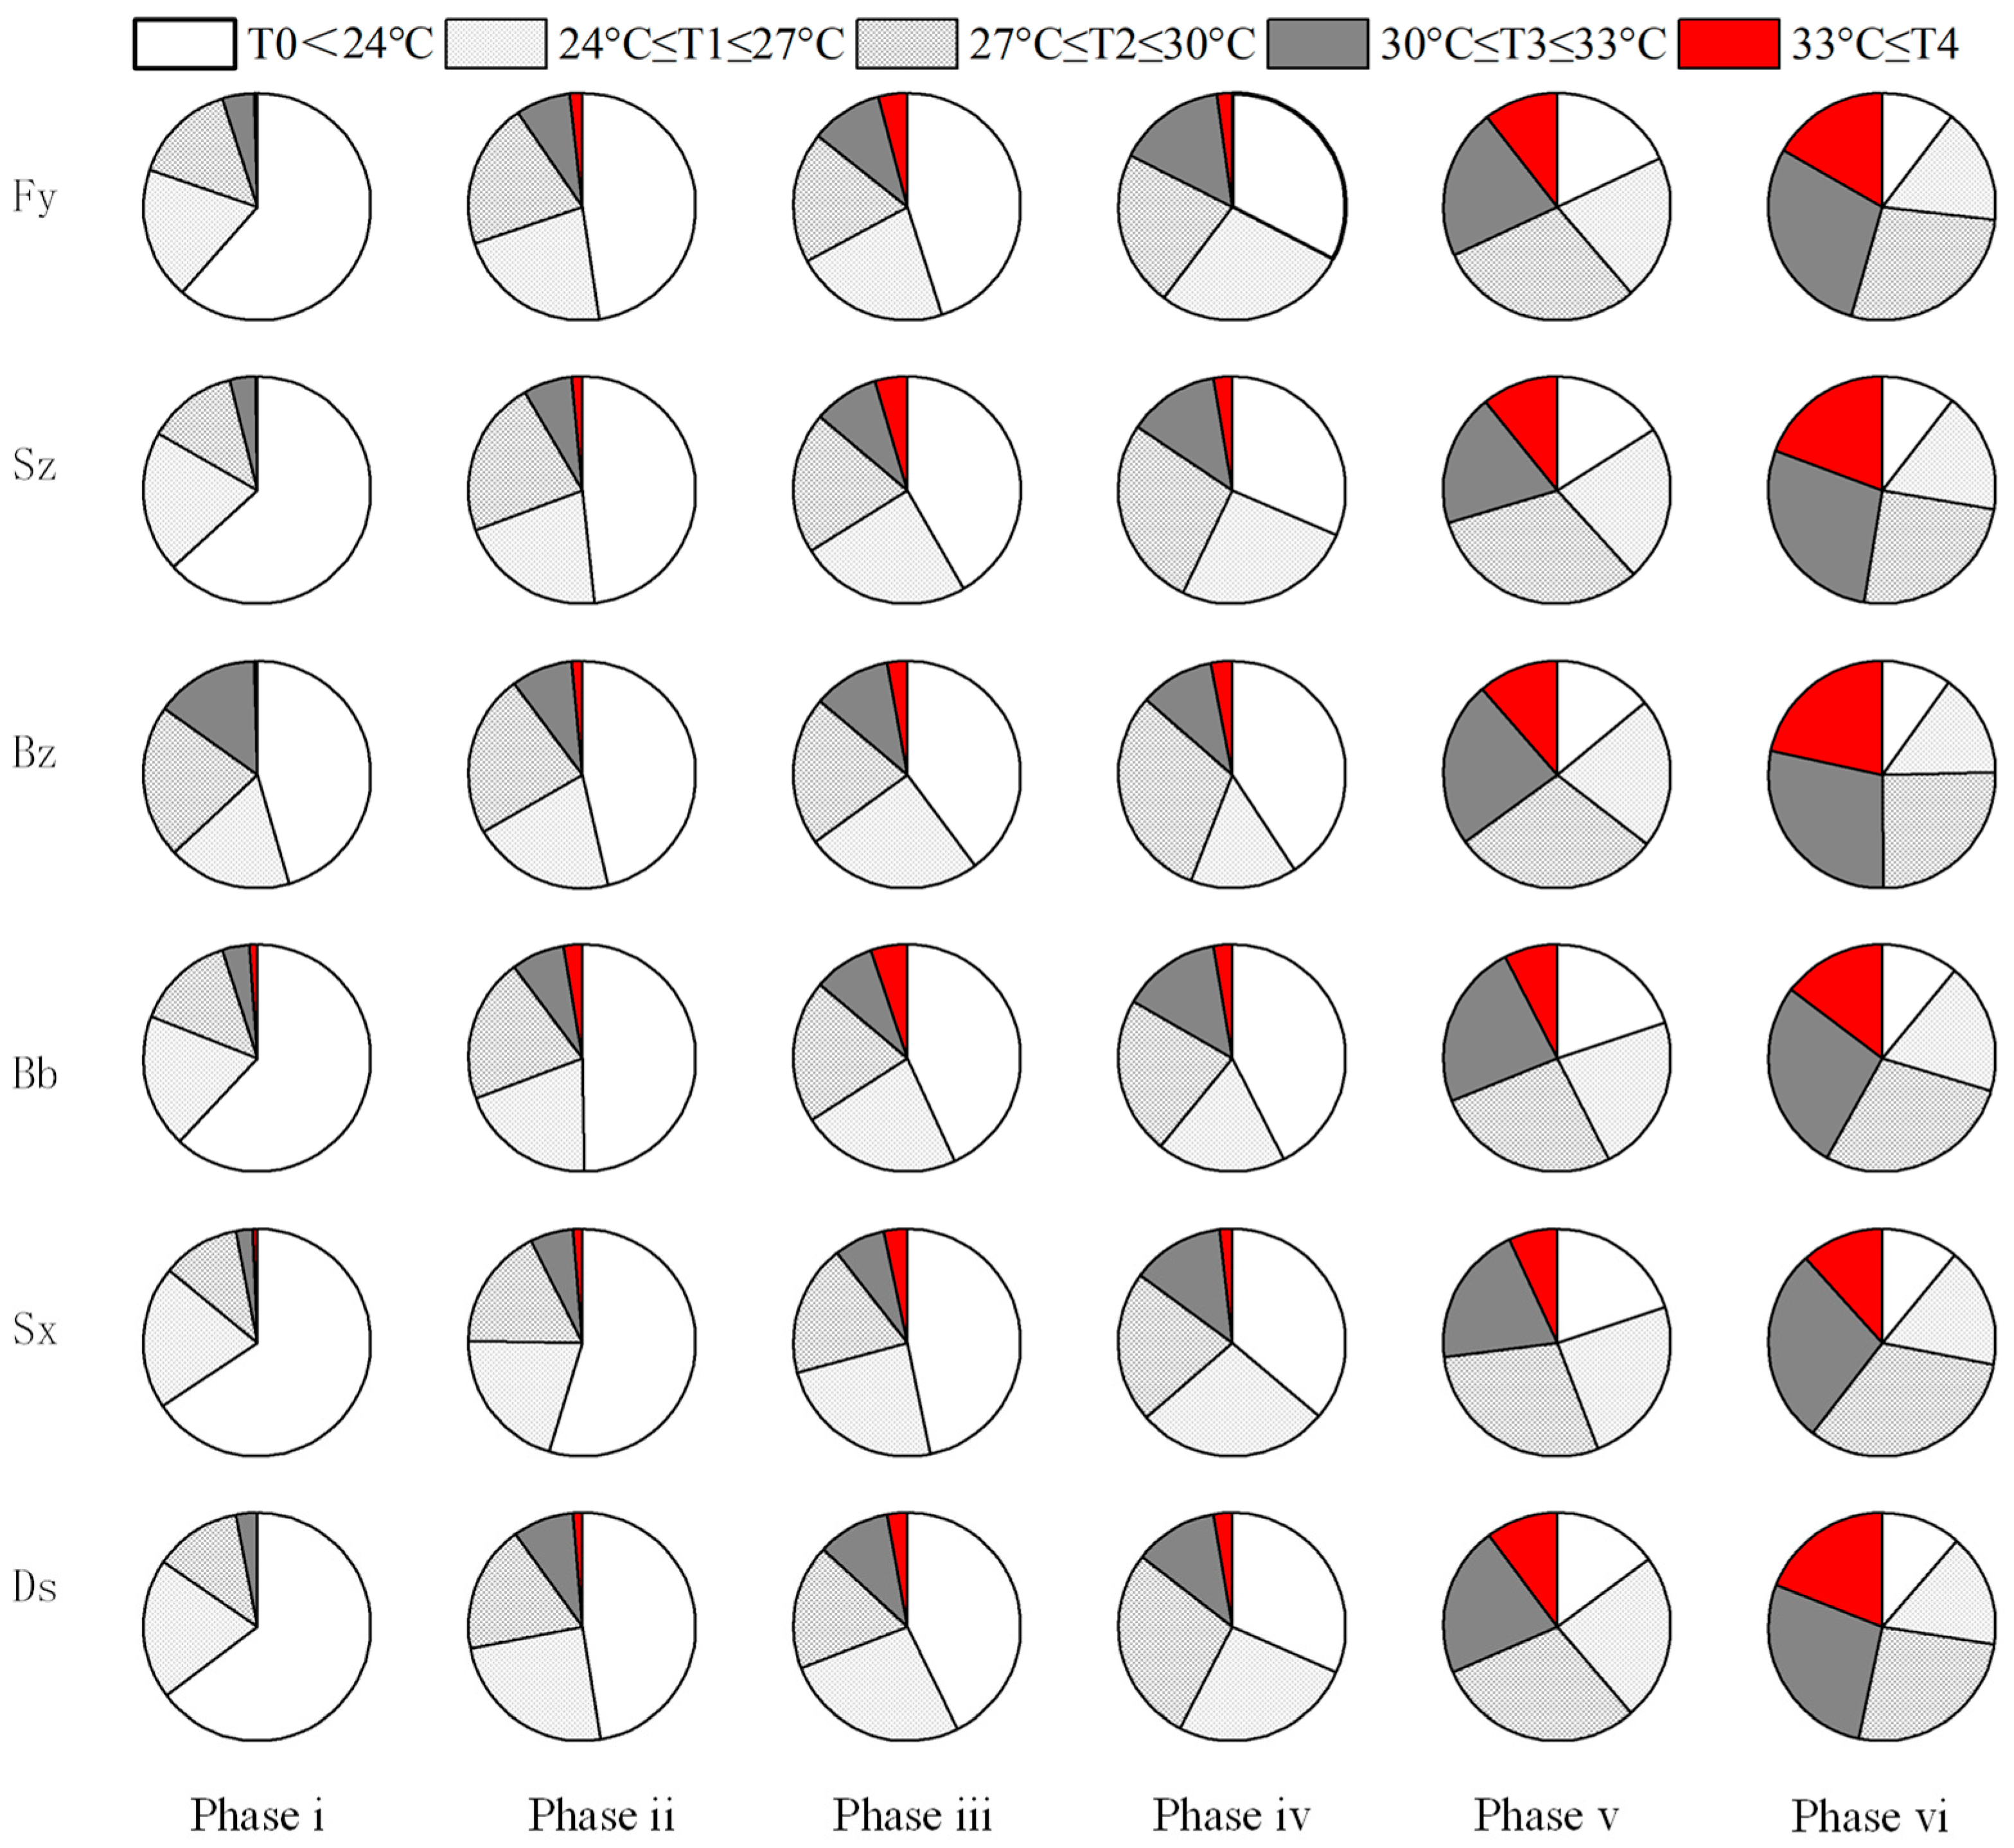
3.5. Distribution of Heat Stress Occurrence in Six Phases

The increasing trend for temperatures from phase i to phase vi is presented in Figure 7. From 1955 to 2020, temperatures ≥ 24 °C accounted for more than half of the total time across the six locations, and the probabilities of temperatures ≥ 27 °C, ≥ 30 °C and ≥33 °C were 37.95~43.72%, 16.85~20.11%, and 3.93~7.36%, respectively. In recent years, the frequency of temperature ≥ 24 °C tends to increase, and temperatures ≥ 30 °C during each phase across six locations in the Huaibei Plain mainly occurred during phases v and vi, and heat stress may also occur during phases iii and iv.
The probability pattern of the occurrence of post-flowering high temperatures was similar across the six sites (Fuyang, Suzhou, Bozhou, Bengbu, Shouxian, and Dangshan). From phase i to phase vi, the probability of occurrence of T0 ≤ 24 °C continuously decreased, and for T4 ≥ 33 °C, it gradually increased. Further, T0 ≤ 24 °C mainly occurred during phases i and ii, 30 °C ≤ T3 ≤ 33 °C and 33 °C ≤ T4 mainly occurred in phases v and vi (Figure 8). In addition, extremely high temperatures, i.e., ≥30 °C and 33 °C, also occur during phases i, ii, iii, and iv, with a significantly higher probability of occurrence of these temperature extremes for phase iii than that for phases i, ii, and iv.

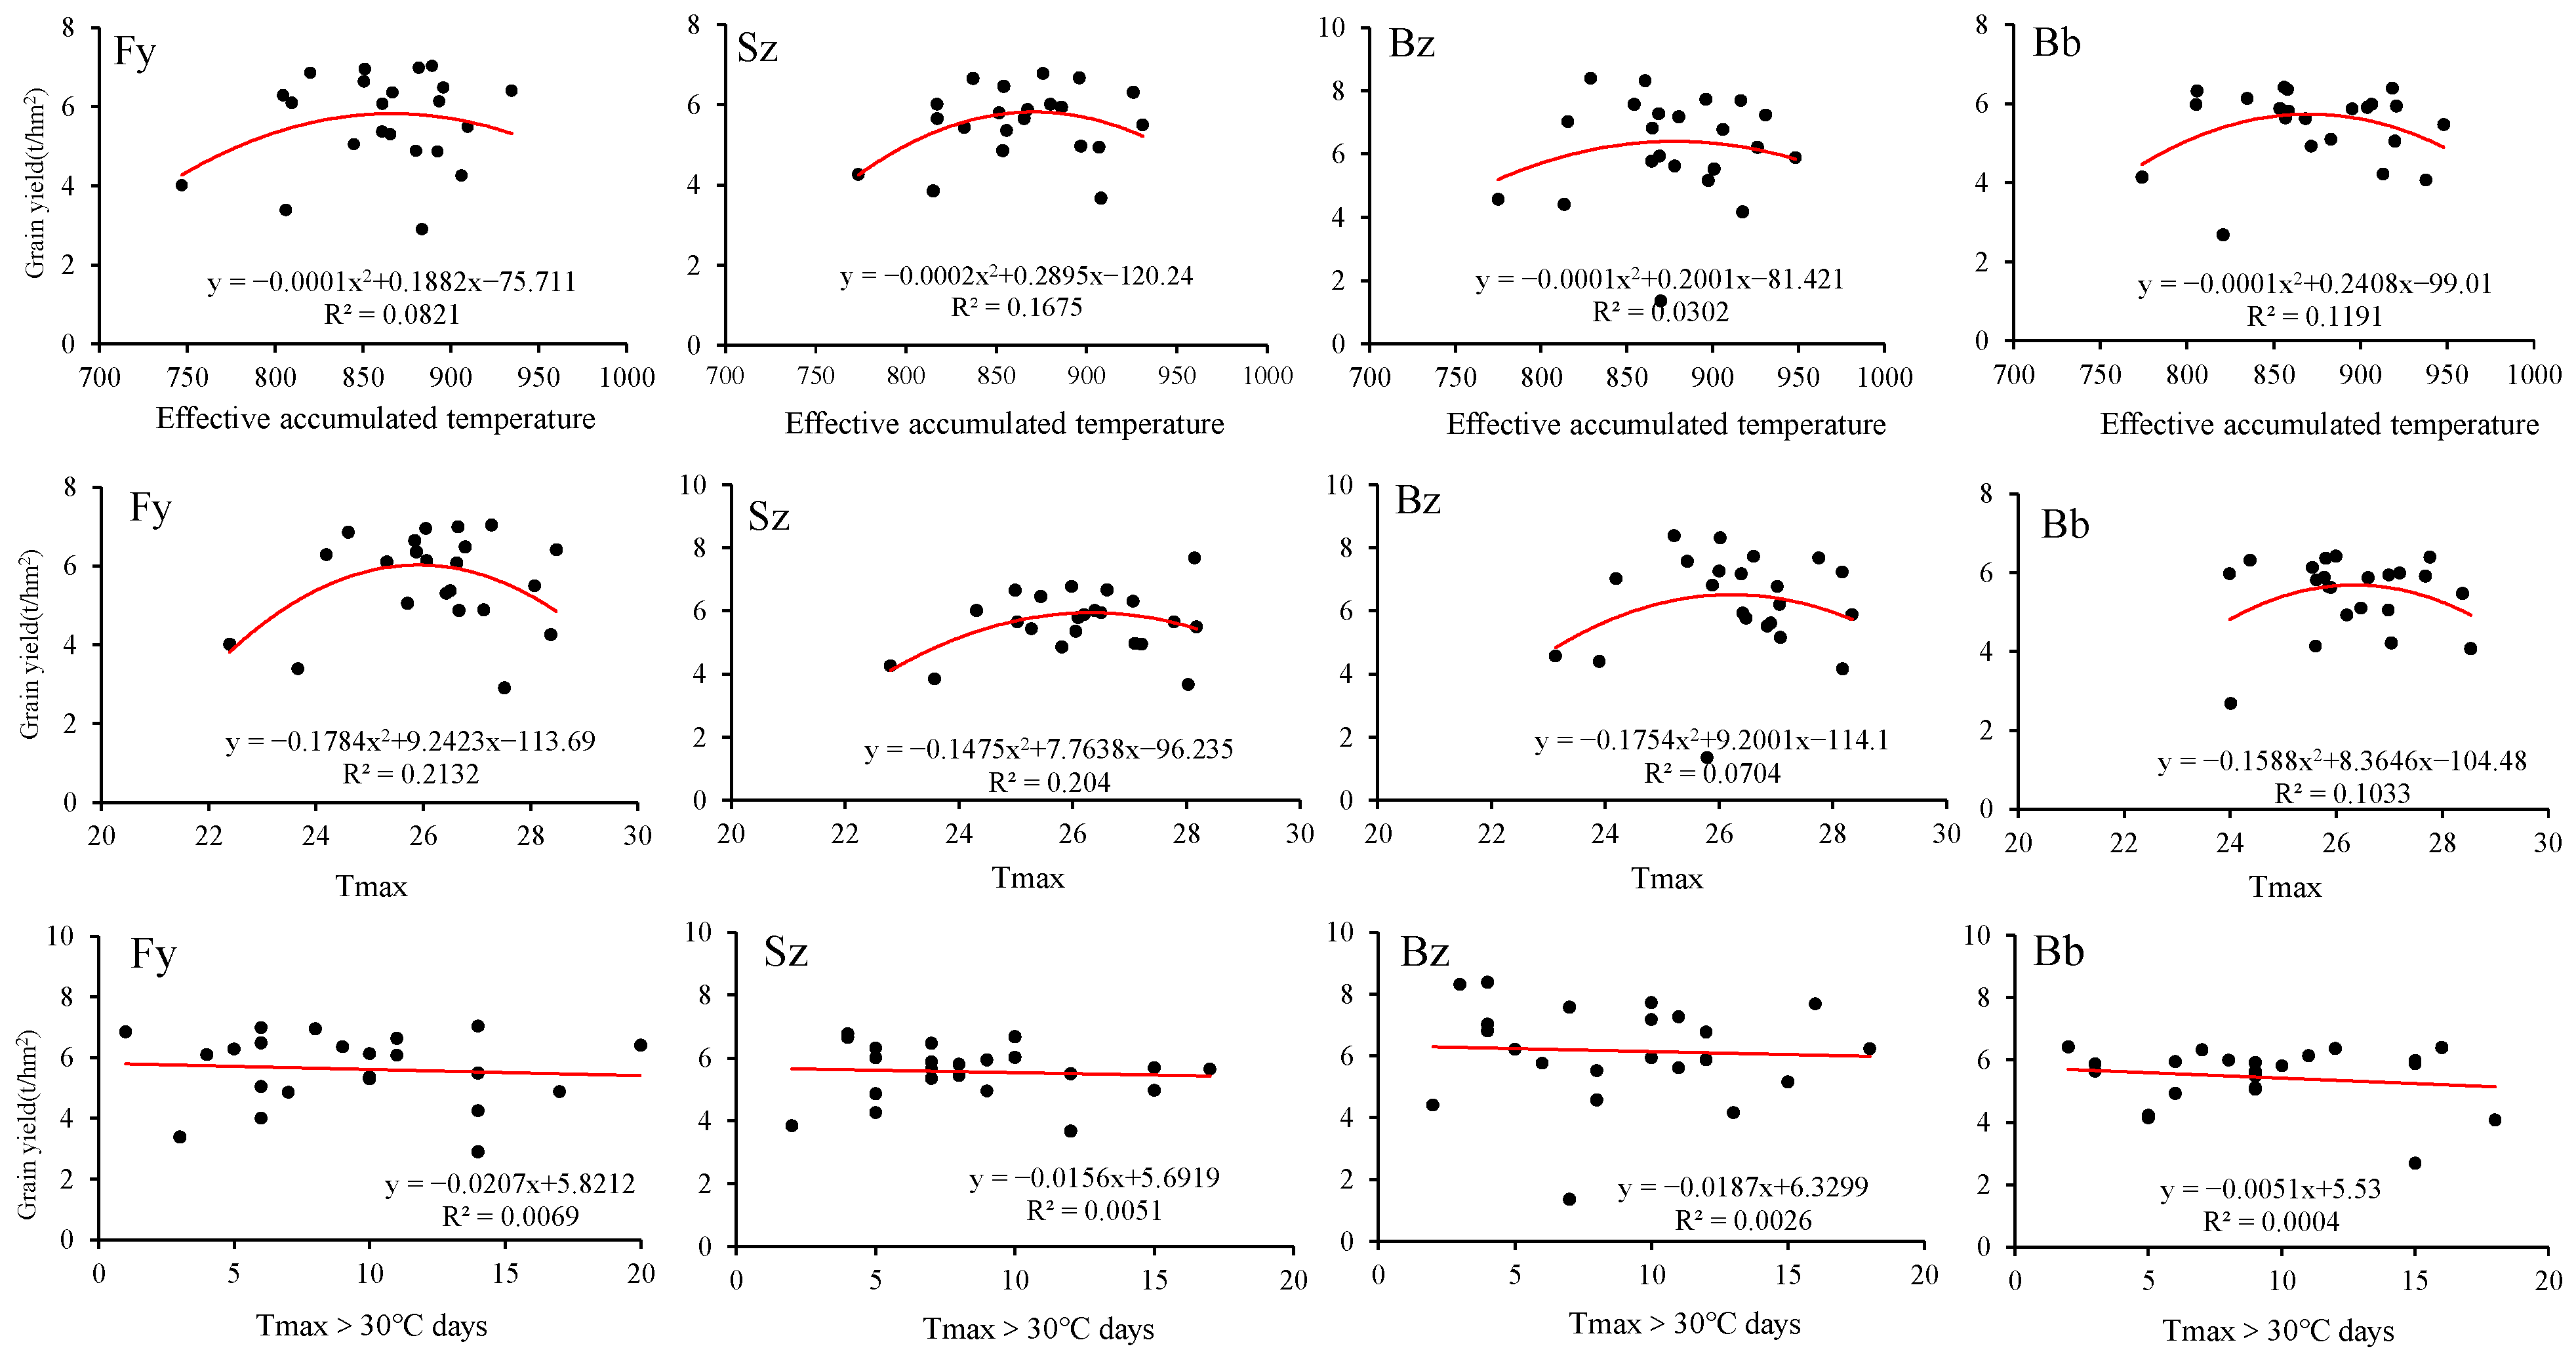
3.6. Relationship between Wheat Grain Yield and Mean Daily Maximum Temperature (Tmax)

Analyzing the relationship between wheat grain yield and post-flowering effective accumulative temperature, daily mean maximum temperature (Tmax), and the days of Tmax > 30 °C for 22 years in the Huaibei Plain (Figure 9), the yield per unit area of wheat ranged from 2 to 8 t/hm2. The relationship between wheat yield, effective accumulated temperature, and Tmax showed an increasing and then decreasing trend as the temperature reached a certain threshold. For example, grain yield increased with increasing effective accumulated temperature up to about 860 °C and then decreased as accumulated temperature exceeded 860 °C. The higher the Tmax threshold, the more significant grain yield losses were observed. Therefore, we speculate that the effective accumulated temperature of 860 °C d and Tmax of 26 °C may be the temperature threshold for normal grain filling of wheat, beyond which yield loss of wheat may occur. In addition, the analysis suggests that the grain yield decreases with increasing temperatures (Tmax > 30 °C).

4. Discussion

4.1. Characteristics of High-Temperature Occurrence and Its Effect on Wheat Growth and Development

With a warming climate, heat events occur more frequently, especially during the reproductive growth period (flowering to maturity) of wheat crops. Extremely high temperatures during the winter wheat growing season in Huaibei Plain show an increasing trend with an obvious yield-reducing effect [17]. Accurate assessment of crop development stages is crucial to assessing the intensity of heat stress, and the Biologische Bundesanstalt, Bundessortenamt und CHemische Industrie (BBCH) scale is the most accurate scale to assess crop growth and development [25]. The wheat flowering to maturity stages selected in this study belong to the 6th to 9th stages of the BBCH scale. In this study, the annual mean temperature, annual effective cumulative temperature, daily maximum temperature, and daily minimum temperature all showed a fluctuating upward trend from 1957 to 2020, with the probability of heat stress risk increasing between 1990 and 2020 compared to the period 1957 to 1990. The thermal stress indices, including AHSD, HSI, and HDD, progressively decreased in the Huaibei Plain from the Northwest to the Southeast, with the highest thermal stress index in Dangshan in the north. The frequency of extremely high temperatures increased from phase i to phase vi, with a marked increase in the frequency of extremely high temperatures during phases ii and iii.
Warmer temperatures can accelerate crop growth and development, resulting in lower grain yields in temperate and tropical regions due to a shorter crop duration [26]. Liu et al. [24] used a multiple linear regression model to assess the mean temperature change from heading to maturity, showing that the change in average temperature and frequency of heat stress from heading to maturity can explain approximately 29% of grain yield variation in Chinese winter wheat. Another study suggested that 30% of wheat yields were affected by temperature extremes [27]. Lesk et al. [28] found that heat stress from 1964 to 2007 reduced the grain production of Canadian wheat by 10%. Model projections of future climate change indicated that the heat stress intensity index will increase significantly in most parts of the world during sensitive periods (BBCH 6) of crop growth, and the negative effects of heat stress on wheat reproduction will be further amplified, particularly during the heat-sensitive period of grain development [24]. In our study, the frequency of extremely high temperatures showed a marked increase during phases ii and iii, which belong to the rapid grain filling period in wheat. Rapid grain filling is an important period for the formation of wheat grain yield. During this period, wheat photosynthates are constantly transported to the grain, and the speed of photosynthate transportation directly affects the final grain weight and yield. Studies have shown that when the temperature is over 35 °C in the rapid grain filling stage of wheat, different green organs of wheat become yellowing and degreening, chlorophyll degrades rapidly, photosynthetic organs pro-senescenc, and the grain filling duration and life cycle of wheat crops are shortened [29,30]. As a result, the amount of assimilate accumulated in leaves transferred to the grain decreased, and the grain weight and yield decreased. At the same time, temperatures exceeding a certain threshold level will lead to oxidative stress, excessive accumulation of reactive oxygen species, and membrane damage [31]. The peak of endosperm development is 10 to 15 days after flowering, which is also known as the rapid filling period of wheat. The Tmax > 33 °C during this period can also inhibit photosynthetic capacity, metabolic activity, and dry matter accumulation in wheat crops [5]. More importantly, heat stress suppresses assimilate deposition in endosperm and reduces starch accumulation in grain, resulting in poor grain filling [32]. Additionally, heat stress later during grain filling shortens filling duration [33] and inhibits protein accumulation [15], thereby reducing grain quality.
In addition to increases in daily mean and maximum temperatures, increases in minimum temperatures have a significant impact on wheat yield. It was reported that the increase in global daily minimum temperature was more than twice the daily maximum temperature [34], with a relatively stronger negative correlation of daily minimum temperature with grain yield than daily maximum temperature [35]. In Mexico, wheat grain yield decreases by 10% for every 1 °C increase in nighttime temperature, but the same increase in daytime temperature has no significant effect [35]. When the night temperature is above 20 °C, spikelet fertility decreases, reducing grain number and size. If this temperature occurs after flowering, it shortens the grain-filling period by 3–7 days [36]. In this study, the probability that the daily minimum temperature was 50% higher than the optimum, while the probability that Tmin > 20 °C was 11% to 14%. The extreme temperature during grain development can impair grain set through ultrastructural modifications in the endosperm cells, seed shrinkage, and poor grain filling.
Although in this study we primarily analyzed the possible effects of post-flowering high temperatures on the grain yield of wheat, the effect of high temperatures on grain yield during the vegetative period should not be overlooked [24], because the effects of heat were superimposed on the vegetative period and reproductive stage. According to previous studies, when the diurnal temperature difference is 30 °C/25 °C, the vegetative period is prolonged, sharply reducing the green leaf area and effective tiller number in wheat [37]. During the early stages of wheat development, heat stress inhibits seed germination and seedling establishment [38]. The high temperature also inhibits leaf photosynthesis, which decreases source activity, resulting in different morphological changes in vegetative and reproductive organs.

4.2. Countermeasures against Thermal Risks

With the increasing frequency and intensity of extreme heat events caused by climate change, wheat production is confronted with increasing risks. For example, it advances phenological stages, accelerates senescence, and shortens grain filling duration [39,40]. Therefore, breeding varieties with superior heat tolerance could be the most effective way to combat heat stress [41]. However, it takes years or decades to produce varieties with high heat tolerance, high overall resistance, and high grain yields. Early sowing or breeding cultivars with early heading will help wheat flower sooner and avoid heat stress. While this method may shorten the overall growth cycle of crops, it is not conducive to biomass accumulation or grain yield formation. Prolonging flowering to maturity duration could be beneficial to the grain filling, which reduces the adverse effects of temperature on wheat, yet there will be a probability of wheat experiencing heat risk during the late grain filling stage [24]. Liu et al. [24] found that selecting varieties with a long growing period (late heading but long grain filling period) could compensate to some extent for yield losses due to elevated temperatures. Studies show that adaptation to high temperatures can be achieved by regulating photosynthesis and respiration in wheat, for example, by identifying the biochemical mechanisms that confer heat tolerance and adaptation to chloroplasts and mitochondria [42]. In addition, exogenous application of plant growth regulator [43], improvement of irrigation system [44], adjustment of fertilization method [45], change of tillage system [46], and other measures may protect crops from post-flowering high temperatures. The above mitigation measures need to be tailored to the specific time and spatial area in which the heat occurs to achieve the maximum benefit of mitigating the effects of heat.
With the development of information technology, wheat growth models are available to incorporate different heat stress events and the effects of heat stress on wheat phenology, leaf senescence, biomass growth, biomass partitioning, and yield formation. These models provide guidelines and references for wheat management. Also, these models provide good technical support for wheat regions where thermal stresses occur [24,47,48].

5. Conclusions

High post-flowering temperatures are detrimental to wheat grain setting and development, causing significant grain yield losses. We analyzed sixty-six years of temperature data from 1955 to 2020. The multi-year post-flowering average temperature ranged from 17 °C to 24 °C, with the annual effective cumulative temperature ranging from 724.5 °C d to 956.0 °C d. The annual average temperature, annual effective cumulative temperature, daily maximum temperature, and daily minimum temperature all showed a fluctuating increasing trend over the years, and the probability of heat stress risk increased for the 1990–2020 period compared with 1957–1990. The heat stress indices, including AHSD, HSI, and HDD, in the Huaibei Plain decreased from the Northwest to the Southeast, with the highest in Dangshan. The frequency of high-temperature occurrence was higher for phases ii and iii than for other phases. Wheat yield increased with increasing effective accumulated temperature and Tmax. However, after a certain threshold temperature, high accumulated temperatures and Tmax significantly reduced wheat grain yield. Our study provides practical guidance for sustaining wheat production and food security under climate change.

Author Contributions

Conceptualization, M.L. and Y.S.; Software, M.L. and X.W.; Formal analysis, Y.Z.; Data curation, M.L., X.W., Y.Z. and Y.S.; Writing—original draft preparation, M.L., X.W. and N.U.; Writing—review and editing, M.L., Y.Z. and Y.S.; Supervision, Y.S.; Funding acquisition, Y.S. All authors have read and agreed to the published version of the manuscript.

Funding

This study was funded by the National Key Research and Development Program of China (2017YFD0300204-3).

Data Availability Statement

The data presented in this study are available upon request from the corresponding authors.

Conflicts of Interest

The authors declare no conflict of interest.

References

  1. National Statistical Yearbook. Agriculture: Production of Major Crops. 2022. Available online: http://www.stats.gov.cn/ (accessed on 1 May 2022).
  2. Liu, B.; Zhang, D.; Zhang, H.; Asseng, S.; Yin, T.; Qiu, X.; Ye, Z.; Liu, L.; Tang, L.; Cao, W.; et al. Separating the impacts of heat stress events from rising mean temperatures on winter wheat yield of china. Environ. Res. Lett. 2021, 16, 124035. [Google Scholar] [CrossRef]
  3. IPCC. Climate Change 2022: Mitigation of Climate Change. Contribution of Working Group iii to the Sixth Assessment Report of the Intergovernmental Panel on Climate Change; Cambridge University Press: Cambridge, UK, 2022. [Google Scholar]
  4. Akter, N.; Islam, M.R. Heat stress effects and management in wheat. A review. Agron. Sustain. Dev. 2017, 37, 37. [Google Scholar] [CrossRef]
  5. Farooq, M.; Bramley, H.; Palta, J.A.; Siddique, K.H.M. Heat stress in wheat during reproductive and grain-filling phases. Crit. Rev. Plant Sci. 2011, 30, 491–507. [Google Scholar] [CrossRef]
  6. Senapati, N.; Stratonovitch, P.; Paul, M.J.; Semenov, M.A. Drought tolerance during reproductive development is important for increasing wheat yield potential under climate change in Europe. J. Exp. Bot. 2019, 70, 2549–2560. [Google Scholar] [CrossRef] [PubMed]
  7. Kumar, R.R.; Goswami, S.; Gadpayle, K.A.; Singh, K.; Sharma, S.K.; Singh, G.P.; Pathak, H.; Rai, R.D. Ascorbic acid at pre-anthesis modulate the thermotolerance level of wheat (Triticum aestivum) pollen under heat stress. J. Plant Biochem. Biotechnol. 2013, 23, 293–306. [Google Scholar] [CrossRef]
  8. Giorno, F.; Wolters-Arts, M.; Mariani, C.; Rieu, I. Ensuring reproduction at high temperatures: The heat stress response during anther and pollen development. Plants 2013, 2, 489–506. [Google Scholar] [CrossRef]
  9. Zenda, T.; Wang, N.; Dong, A.; Zhou, Y.; Duan, H. Reproductive-stage heat stress in cereals: Impact, plant responses and strategies for tolerance improvement. Int. J. Mol. Sci. 2022, 23, 6929. [Google Scholar] [CrossRef]
  10. Tiwari, C.; Wallwork, H.; Dhari, R.; Arun, B.; Mishra, V.K.; Joshi, A.K. Exploring the possibility of obtaining terminal heat tolerance in a doubled haploid population of spring wheat (Triticum aestivum L.) in the eastern gangetic plains of India. Field Crops Res. 2012, 135, 1–9. [Google Scholar] [CrossRef]
  11. Li, C.Y.; Zhang, R.Q.; Fu, K.Y.; Li, C.; Li, C. Effects of high temperature on starch morphology and the expression of genes related to starch biosynthesis and degradation. J. Cereal Sci. 2017, 73, 25–32. [Google Scholar] [CrossRef]
  12. Ahmed, N.; Tetlow, I.J.; Nawaz, S.; Iqbal, A.; Mubin, M.; ul Rehman, M.S.N.; Butt, A.; Lightfoot, D.A.; Maekawa, M. Effect of high temperature on grain filling period, yield, amylose content and activity of starch biosynthesis enzymes in endosperm of basmati rice. J. Sci. Food Agric. 2015, 95, 2237–2243. [Google Scholar] [CrossRef]
  13. Yang, H.; Gu, X.; Ding, M.; Lu, W.; Lue, D. Heat stress during grain filling affects activities of enzymes involved in grain protein and starch synthesis in waxy maize. Sci. Rep. 2018, 8, 15665. [Google Scholar] [CrossRef]
  14. Asthir, B.; Kaur, S.; Mann, S.K. Effect of salicylic and abscisic acid administered through detached tillers on antioxidant system in developing wheat grains under heat stress. Acta Physiol. Plant. 2009, 31, 1091–1096. [Google Scholar] [CrossRef]
  15. Iqbal, M.; Raja, N.; Yasmeen, F.; Hussain, M.; Ejaz, M.; Shah, M.A. Impacts of heat stress on wheat a critical review. Adv. Crop Sci. Technol. 2017, 5, 251–259. [Google Scholar] [CrossRef]
  16. Dias, A.S.; Bagulho, A.S.; Lidon, F.C. Ultrastructure and biochemical traits of bread and durum wheat grains under heat stress. Braz. J. Plant Physiol. 2008, 20, 323–333. [Google Scholar] [CrossRef]
  17. Shi, X.; Shi, W. Impacts of extreme high temperature on winter wheat yield in the Huang-Huai-Hai Plain. J. Ecol. Rural. Environ. 2016, 32, 259–269. [Google Scholar]
  18. Zhao, J.; Xu, J.; Li, X.; Zhong, Y.; Han, D.; Qiu, H. Characteristics analysis of spatial and temporal variation on extreme weather events in anhui province for recent 50 years. Nat. Hazards 2017, 89, 817–842. [Google Scholar] [CrossRef]
  19. Zheng, B.; Chenu, K.; Dreccer, M.F.; Chapman, S.C. Breeding for the future: What are the potential impacts of future frost and heat events on sowing and flowering time requirements for australian bread wheat (Triticum aestivium) varieties? Glob. Chang. Biol. 2012, 18, 2899–2914. [Google Scholar] [CrossRef]
  20. Teixeira, E.I.; Fischer, G.; van Velthuizen, H.; Walter, C.; Ewert, F. Global hot-spots of heat stress on agricultural crops due to climate change. Agric. For. Meteorol. 2013, 170, 206–215. [Google Scholar] [CrossRef]
  21. Mirosavljevic, M.; Mikic, S.; Spika, A.K.; Zupunski, V.; Zhou, R.; Abdelhakim, L.; Ottosen, C.O. The effect of heat stress on some main spike traits in 12 wheat cultivars at anthesis and mid-grain filling stage. Plant Soil Environ. 2021, 67, 71–76. [Google Scholar] [CrossRef]
  22. Ko, C.S.; Oh, M.K.; Hyun, J.N.; Kim, K.H.; Kim, J.B.; Hong, M.J.; Seo, Y.W. Effect of high temperature on early stage of grain filling period in wheat (Triticum aestivum L.). Korean J. Breed. Sci. 2017, 49, 200–212. [Google Scholar] [CrossRef]
  23. Fuhg, J.N.; Fau, A.; Nackenhorst, U. State-of-the-art and comparative review of adaptive sampling methods for kriging. Arch. Comput. Methods Eng. 2021, 28, 2689–2747. [Google Scholar] [CrossRef]
  24. Liu, B.; Liu, L.; Tian, L.; Cao, W.; Zhu, Y.; Asseng, S. Post-heading heat stress and yield impact in winter wheat of China. Glob. Chang. Biol. 2014, 20, 372–381. [Google Scholar] [CrossRef] [PubMed]
  25. Anastasiu, A.E.; Chira, N.A.; Banu, I.; Ionescu, N.; Stan, R.; Rosca, S.I. Oil productivity of seven Romanian linseed varieties as affected by weather conditions. Ind. Crops Prod. 2016, 86, 219–230. [Google Scholar] [CrossRef]
  26. Li, M.; Feng, J.; Zhou, H.; Najeeb, U.; Li, J.; Song, Y.; Zhu, Y. Overcoming reproductive compromise under heat stress in wheat: Physiological and genetic regulation, and breeding strategy. Front Plant Sci. 2022, 13, 881813. [Google Scholar] [CrossRef]
  27. Flohr, B.M.; Hunt, J.R.; Kirkegaard, J.A.; Evans, J.R. Water and temperature stress define the optimal flowering period for wheat in south-eastern Australia. Field Crops Res. 2017, 209, 108–119. [Google Scholar] [CrossRef]
  28. Lollato, R.P.; Bavia, G.P.; Perin, V.; Knapp, M.; Santos, E.A.; Patrignani, A.; DeWolf, E.D. Climate-risk assessment for winter wheat using long-term weather data. Agron. J. 2020, 112, 2132–2151. [Google Scholar] [CrossRef]
  29. Talukder, A.S.M.H.M.; McDonald, G.K.; Gill, G.S. Effect of short-term heat stress prior to flowering and early grain set on the grain yield of wheat. Field Crops Res. 2014, 160, 54–63. [Google Scholar] [CrossRef]
  30. Feng, B.; Li, S.D.; Li, H.W.; Wang, Z.S.; Zhang, B.; Wang, F.H.; Kong, L.A. Effect of high temperature stress at early grain-filling stage on plant morphology and grain yield of different heat-resistant varieties of wheat. Chin. J. Eco-Agric. 2019, 27, 451–461. [Google Scholar]
  31. Bita, C.E.; Gerats, T. Plant tolerance to high temperature in a changing environment: Scientific fundamentals and production of heat stress-tolerant crops. Front Plant Sci. 2013, 4, 273. [Google Scholar] [CrossRef]
  32. Prasad, P.V.V.; Djanaguiraman, M. Response of floret fertility and individual grain weight of wheat to high temperature stress: Sensitive stages and thresholds for temperature and duration. Funct. Plant Biol. 2014, 41, 1261–1269. [Google Scholar] [CrossRef]
  33. Jing, J.G.; Guo, S.Y.; Li, Y.F.; Li, W.H. The alleviating effect of exogenous polyamines on heat stress susceptibility of different heat resistant wheat (Triticum aestivum L.) varieties. Sci. Rep. 2020, 10, 7467. [Google Scholar] [CrossRef] [PubMed]
  34. Vose, R.S.; Easterling, D.R.; Gleason, B. Maximum and minimum temperature trends for the globe: An update through 2004. Geophys. Res. Lett. 2005, 32, L23822. [Google Scholar] [CrossRef]
  35. Lobell, D.B.; Ortiz-Monasterio, J.I.; Asner, G.P.; Matson, P.A.; Naylor, R.L.; Falcon, W.P. Analysis of wheat yield and climatic trends in Mexico. Field Crops Res. 2005, 94, 250–256. [Google Scholar] [CrossRef]
  36. Prasad, P.V.V.; Pisipati, S.R.; Ristic, Z.; Bukovnik, U.; Fritz, A.K. Impact of nighttime temperature on physiology and growth of spring wheat. Crop Sci. 2008, 48, 2372–2380. [Google Scholar] [CrossRef]
  37. Lal, M.K.; Tiwari, R.K.; Gahlaut, V.; Mangal, V.; Kumar, A.; Singh, M.P.; Paul, V.; Kumar, S.; Singh, B.; Zinta, G. Physiological and molecular insights on wheat responses to heat stress. Plant Cell Rep. 2022, 41, 501–518. [Google Scholar] [CrossRef] [PubMed]
  38. Bheemanahalli, R.; Sunoj, V.S.J.; Saripalli, G.; Prasad, P.V.V.; Balyan, H.S.; Gupta, P.K.; Grant, N.; Gill, K.S.; Jagadish, S.V.K. Quantifying the impact of heat stress on pollen germination, seed set, and grain filling in spring wheat. Crop Sci. 2019, 59, 684–696. [Google Scholar] [CrossRef]
  39. Zhao, H.; Dai, T.; Jing, Q.; Jiang, D.; Cao, W. Leaf senescence and grain filling affected by post-anthesis high temperatures in two different wheat cultivars. Plant Growth Regul. 2007, 51, 149–158. [Google Scholar] [CrossRef]
  40. Zhang, Z.; Zhou, N.; Xing, Z.; Liu, B.; Tian, J.; Wei, H.; Gao, H.; Zhang, H. Effects of temperature and radiation on yield of spring wheat at different latitudes. Agriculture 2022, 12, 627. [Google Scholar] [CrossRef]
  41. Li, M.; Su, H.; Li, Y.; Li, J.P.; Li, J.C.; Zhu, Y.L.; Song, Y.H. Analysis of heat tolerance of wheat with different genotypes and screening of identification indexes in Huang-Huai-Hai Region. Sci. Agric. Sin. 2021, 54, 3381–3393. [Google Scholar]
  42. Posch, B.C.; Kariyawasam, B.C.; Bramley, H.; Coast, O.; Richards, R.A.; Reynolds, M.P.; Trethowan, R.; Atkin, O.K. Exploring high temperature responses of photosynthesis and respiration to improve heat tolerance in wheat. J. Exp. Bot. 2019, 70, 5051–5069. [Google Scholar] [CrossRef]
  43. Li, M.; Wei, Q.; Zhu, Y.; Li, J.; Ullah, N.; Song, Y. 24-epicastasterone and KH2PO4 protect grain production of wheat crops from terminal heat impacts by modulating leaf physiology. Arch. Agron. Soil Sci. 2022, 69, 2006–2019. [Google Scholar] [CrossRef]
  44. Tack, J.; Barkley, A.; Hendricks, N. Irrigation offsets wheat yield reductions from warming temperatures. Environ. Res. Lett. 2011, 12, 114027. [Google Scholar] [CrossRef]
  45. Elía, M.; Slafer, G.A.; Savin, R. Yield and grain weight responses to post-anthesis increases in maximum temperature under field grown wheat as modified by nitrogen supply. Field Crops Res. 2018, 221, 228–237. [Google Scholar] [CrossRef]
  46. Wang, H.; Lemke, R.; Goddard, T.; Sprout, C. Tillage and root heat stress in wheat in central alberta. Can. J. Soil Sci. 2007, 87, 3–10. [Google Scholar] [CrossRef]
  47. Liu, B.; Asseng, S.; Wang, A.; Wang, S.; Tang, L.; Cao, W.; Zhu, Y.; Liu, L. Modelling the effects of post-heading heat stress on biomass growth of winter wheat. Agric. For. Meteorol. 2017, 247, 476–490. [Google Scholar] [CrossRef]
  48. Liu, B.; Liu, L.; Asseng, S.; Zou, X.; Li, J.; Cao, W.; Zhu, Y. Modelling the effects of heat stress on post-heading durations in wheat: A comparison of temperature response routines. Agric. For. Meteorol. 2016, 222, 45–58. [Google Scholar] [CrossRef]
Figure 1. Map and location of weather stations in this study. Note: Red dots denote the location of weather stations.
Agronomy 13 02149 g001
Figure 2. Variation of the annual average temperature between flowering and maturity of wheat from 1955 to 2020. Note: Red lines represent fitting of the annual average temperature and time. Black dots represent annual average temperature, respectively.
Agronomy 13 02149 g002
Figure 3. Variation of the average temperature of the daily maximum between flowering and maturity of wheat from 1955 to 2020. Note: Red lines represent fitting of the average temperature of the daily maximum and time. Black dots represent average temperature of the daily maximum, respectively.
Agronomy 13 02149 g003
Figure 4. Variation of the average temperature of the daily minimum between flowering and maturity of wheat from 1955 to 2020. Note: Red lines represent fitting of the average temperature of the daily minimum and time. Black dots represent average temperature of the daily minimum, respectively.
Agronomy 13 02149 g004
Figure 5. Variation of annual effective accumulated temperature between flowering and maturity in wheat from 1955 to 2020. Note: Red lines represent fitting of the annual effective accumulated temperature and time. Black dots represent annual effective accumulated temperature, respectively.
Agronomy 13 02149 g005
Figure 6. Spatial distribution of maximum values of heat stress indices between flowering and maturity from 1955 to 2020 in the winter wheat-growing region of Huaibei Plain. Note: AHSD—accumulated heat stress days; HSI—heat stress intensity; HDD—heat degree-days between anthesis and maturity.
Agronomy 13 02149 g006
Figure 7. Distribution of the average temperature of the daily maximum in six phases from 1955 to 2020. Note: Going from green to red denotes increasing temperature; green color denotes minimum temperature; reseda color indicates mild heat stress; yellow-green color denotes maximum medium temperature; orange color indicates severe heat stress; and red color denotes maximum temperature. A, B, C, D, E, and F denote the six developmental phases of the wheat crop (A, phase i; B, phase ii; C, phase iii; D, phase iv; E, Phase v; F, Phase vi) across six sites, i.e., Shouxian, Bengbu, Fuyang, Suzhou, Bozhou, and Dangshan, on Huaibei.
Agronomy 13 02149 g007
Figure 8. The occurrence probability of high temperatures across different developmental stages of the wheat crop from 1955 to 2020.
Agronomy 13 02149 g008
Figure 9. The relationship and linear fitting between wheat grain yield and Tmax between flowering and maturity, including six phases, i~v. Note: Black dots denote wheat grain yield, and red lines denote the fitting of the relationship between wheat grain yield and Tmax ≥ 30 °C.
Agronomy 13 02149 g009
Table 1. Classification criteria and duration from flowering to maturity in wheat.
PhasesGrowth PeriodTime
Phase iDay after anthesis 1st to 7th20–26 April
Phase iiDay after anthesis 8th to 14th27 April–3 May
Phase iiiDay after anthesis 15th to 21st4–10 May
Phase ivDay after anthesis 22nd to 28th11–17 May
Phase vDay after anthesis 29th to 35th18–24 May
Phase viDay after anthesis 36th to 42nd25–31 May
Table 2. Probability of average value of the daily maximum temperature (Tmax) occurrence between flowering and maturity from 1955 to 2020.
PhasesTmax (°C)≥Tmax Percentage (%)≥Tmax 3 °C Percentage (%)≥Tmax 5 °C Percentage (%)
Phase i22.5048.5625.4713.92
Phase ii24.1149.2828.1413.49
Phase iii24.8349.8225.8313.85
Phase iv25.7451.5524.3911.87
Phase v27.7952.2424.2810.79
Phase vi29.0653.2824.249.42
Note: Tmax denotes the average value of the daily maximum temperature for this period; ≥Tmax 3 °C means greater than 3 °C than the average. ≥Tmax 5 °C indicates that the value is greater than 5 °C than the average value.
Table 3. Probability of average daily minimum temperature (Tmin) occurrence between flowering and maturity from 1955 to 2020.
PhasesTmin
(°C)
≥Tmin
Percentage (%)
≥Tmin 3 °C Percentage (%)≥Tmin 5 °C Percentage (%)
Phase i22.5048.5625.4713.92
Phase ii24.1149.2828.1413.49
Phase iii24.8349.8225.8313.85
Phase iv25.7451.5524.3911.87
Phase v27.7952.2424.2810.79
Phase vi29.0653.2824.249.42
Note: Tmin denotes the average value of the daily minimum temperature for this period; ≥Tmin 3 °C means greater than 3 °C than the average. ≥Tmin 5 °C indicates that the value is greater than 5 °C than the average value.
Disclaimer/Publisher’s Note: The statements, opinions and data contained in all publications are solely those of the individual author(s) and contributor(s) and not of MDPI and/or the editor(s). MDPI and/or the editor(s) disclaim responsibility for any injury to people or property resulting from any ideas, methods, instructions or products referred to in the content.

